Article

An Integrated Spatial Clustering Analysis Method for Identifying Urban Fire Risk Locations in a Network-Constrained Environment: A Case Study in Nanjing, China

1
School of Earth Sciences and Engineering, Hohai University, Nanjing 210098, China
2
Institute of Remote Sensing and Spatial information, Hohai University, Nanjing 211100, China
*
Author to whom correspondence should be addressed.
ISPRS Int. J. Geo-Inf. 2017, 6(11), 370; https://doi.org/10.3390/ijgi6110370
Submission received: 23 September 2017 / Revised: 10 November 2017 / Accepted: 15 November 2017 / Published: 17 November 2017
(This article belongs to the Special Issue Urban Environment Mapping Using GIS)

Abstract

:
The spatial distribution of urban geographical events is largely constrained by the road network, and research on spatial clusters of fire accidents at the city level plays a crucial role in emergency rescue and urban planning. For example, by knowing where and when fire accidents usually occur, fire enforcement can conduct more efficient aid measures and planning department can work out more reasonable layout optimization of fire stations. This article proposed an integrated method by combining weighted network-constrained kernel density estimation (NKDE) and network-constrained local Moran’s I (ILINCS) to detect spatial cluster pattern and identify higher-risk locations of fire accidents. The proposed NKDE-ILINCS weighted a set of crucial non-spatial attributes of point events and links, and considered the impact factors of road traffic states, intersection roads and fire severity in NKDE to reflect real urban environment. This method was tested using the fire data in 2015 in Nanjing, China. The results demonstrated that the method was appropriate to detect network-constrained fire cluster patterns and identify high–high road segments. Besides, the first 14 higher-risk road segments in Nanjing are listed. These findings of this case study enhance our knowledge to more accurately observe where fire accidents usually occur and provide a reference for fire departments to improve emergency rescue effectiveness.

1. Introduction

Along with the accelerating process of urbanization as well as the expanding of cities, the frequency of urban fire accidents keeps increasing, which may result in heavy losses. Facing such a dangerous fire situation, fire departments should shorten the response time to arrive at the scene as soon as possible and carry out emergency rescues to control the fire disaster and reduce losses effectively. To reduce urban fire accidents and improve rescue speed, it is crucial to understand how, where and when fire accidents occurred and their spatial patterns [1]. Spatial pattern analysis has been examined widely to explore global or local spatial distribution patterns of geographical events [2], similar to how many other geographical phenomena, including settlements, tourist attractions, epidemic outbreak sites and crime scenes, can be abstracted as points for potential “hot spots” analysis [3,4]. Spatial pattern analysis methods can be classified into the first-order and second-order effects of a spatial process [5]. The first-order effects examine the intensity trend of events across the space, and the absolute location of events is determinant [6], such as Quadrat analysis, Voronoi-based density estimation and Kernel Density Estimation (KDE) [7]. The second-order effects mainly examine the spatial interaction (dependence) structure of point events for spatial patterns, such as Nearest neighbor statistics, Ripley’s K-function, Getis-Ord G statistic and local Moran’s I statistic [8,9]. Among these methods, KDE is one of the most popular non-parameter methods for analyzing the underlying properties of point events, whereas the local Moran’s I statistic is widely used to assess the spatial autocorrelation between a unit and its neighbors [10].
Note that most methods of point pattern analysis work under the Euclidean (or 2D-planar) space. It is based on the assumption that geographic phenomenon occurs in an infinitely homogeneous and isotropic space. However, many spatial point events associated with human activities in real life are constrained by road network. For instance, fire accidents usually occur on roadways or inside a network [11]. Attempts to investigate the spatial relationship between urban events and road network have made a great progress. For example, Shiode (2008) proposed a network-based quadrat method for a more accurate aggregation of point events, because using square grid may distort the representation of the distribution on a network. Borruso proposed a modified KDE, which calculates the density estimation based on the shortest path trees on the road network. Xie and Yan (2008, 2013) developed a network-based kernel density estimation (NKDE) to estimate the density distribution of traffic accidents in network space. Yamada and Thill (2007) proposed an exploratory spatial data analysis method, named local indicators of network-constrained clusters (LINCS), for detecting the local-scale clustering in a spatial phenomenon. The GLINCS, based on the local Getis-Ord G statistics, and ILINCS, based on the local Moran’s I statistics, are the most used LINCS in network space [12,13,14]. SANET is an ArcGIS-based spatial analysis software tool for event points along/on networks (Okabe and Sugihara 2012). SANET has been widely used in different applications. In addition, Wang et al. found a high correlation between population density distribution and road network [15,16]. Rui and Ban further explored the relationship between different street centralities and land-use types in Stockholm [17]. At present, network KDE and local Moran’s I statistic based on a road network have already been used in various practical applications. However, there are fewer studies focusing on weighted point events and network links in a network-constraint KDE analysis.
Hence, in this paper, we proposed a weighted network KDE method based on a set of crucial non-spatial attributes of point events and links. It considers the impacts on density calculation from three factors: road traffic states, intersection roads and fire severity. As we all know, urban fires occur mostly in the central areas of population aggregation and building density, where traffic congestion usually occurs. To better reflect real-world urban road traffic, using fire-engine historical trajectory data, we choose the average speed of road sections as a measure of road traffic states. Then, based on fuzzy evaluation theory and maximum membership function, the congestion levels of corresponding road sections are confirmed. Urban road network can be regarded as a complex linear network structure composed of basic links and intersections. The road at the intersection, whether in road geometry or traffic flow characteristics, can produce dramatic changes [18]. Accordingly, when exploring the spatial distribution patterns of fire patterns in the entire urban road network, we should combine the actual situation at the intersections to estimate the kernel density value. Besides, it is generally agreed that different fire accidents may cause varying degrees of casualties and property losses. For each fire, different severity will produce different extent of damage to the society [4,19]. The above three factors were therefore considered in the study of hot-spot detection for more comprehensive and detailed results.
Aiming to detect local-scale cluster pattern and identify fire higher-risk road segments constrained by network space, in this paper, a NKDE-ILINCS method combining density estimation and spatial autocorrelation is employed [20]. Firstly, the NKDE method generates a smooth density surface of fire events. Secondly, considering the statistical significance of NKDE, ILINCS method is used to identify high–high road segments by using the density value as input attributes. Finally, the results of NKDE-ILINCS is to detect the fire higher-risk locations in city level [21,22,23].
The rest of this article is organized as follows. Section 2 introduces the data and processing. Section 3 describes the detailed methodology of the proposed weighted Network KDE method and Network-constrained Local Moran’s I method. Section 4 discusses the algorithm implementation. Section 5 provides the summary and conclusions.

2. Data Description and Processing
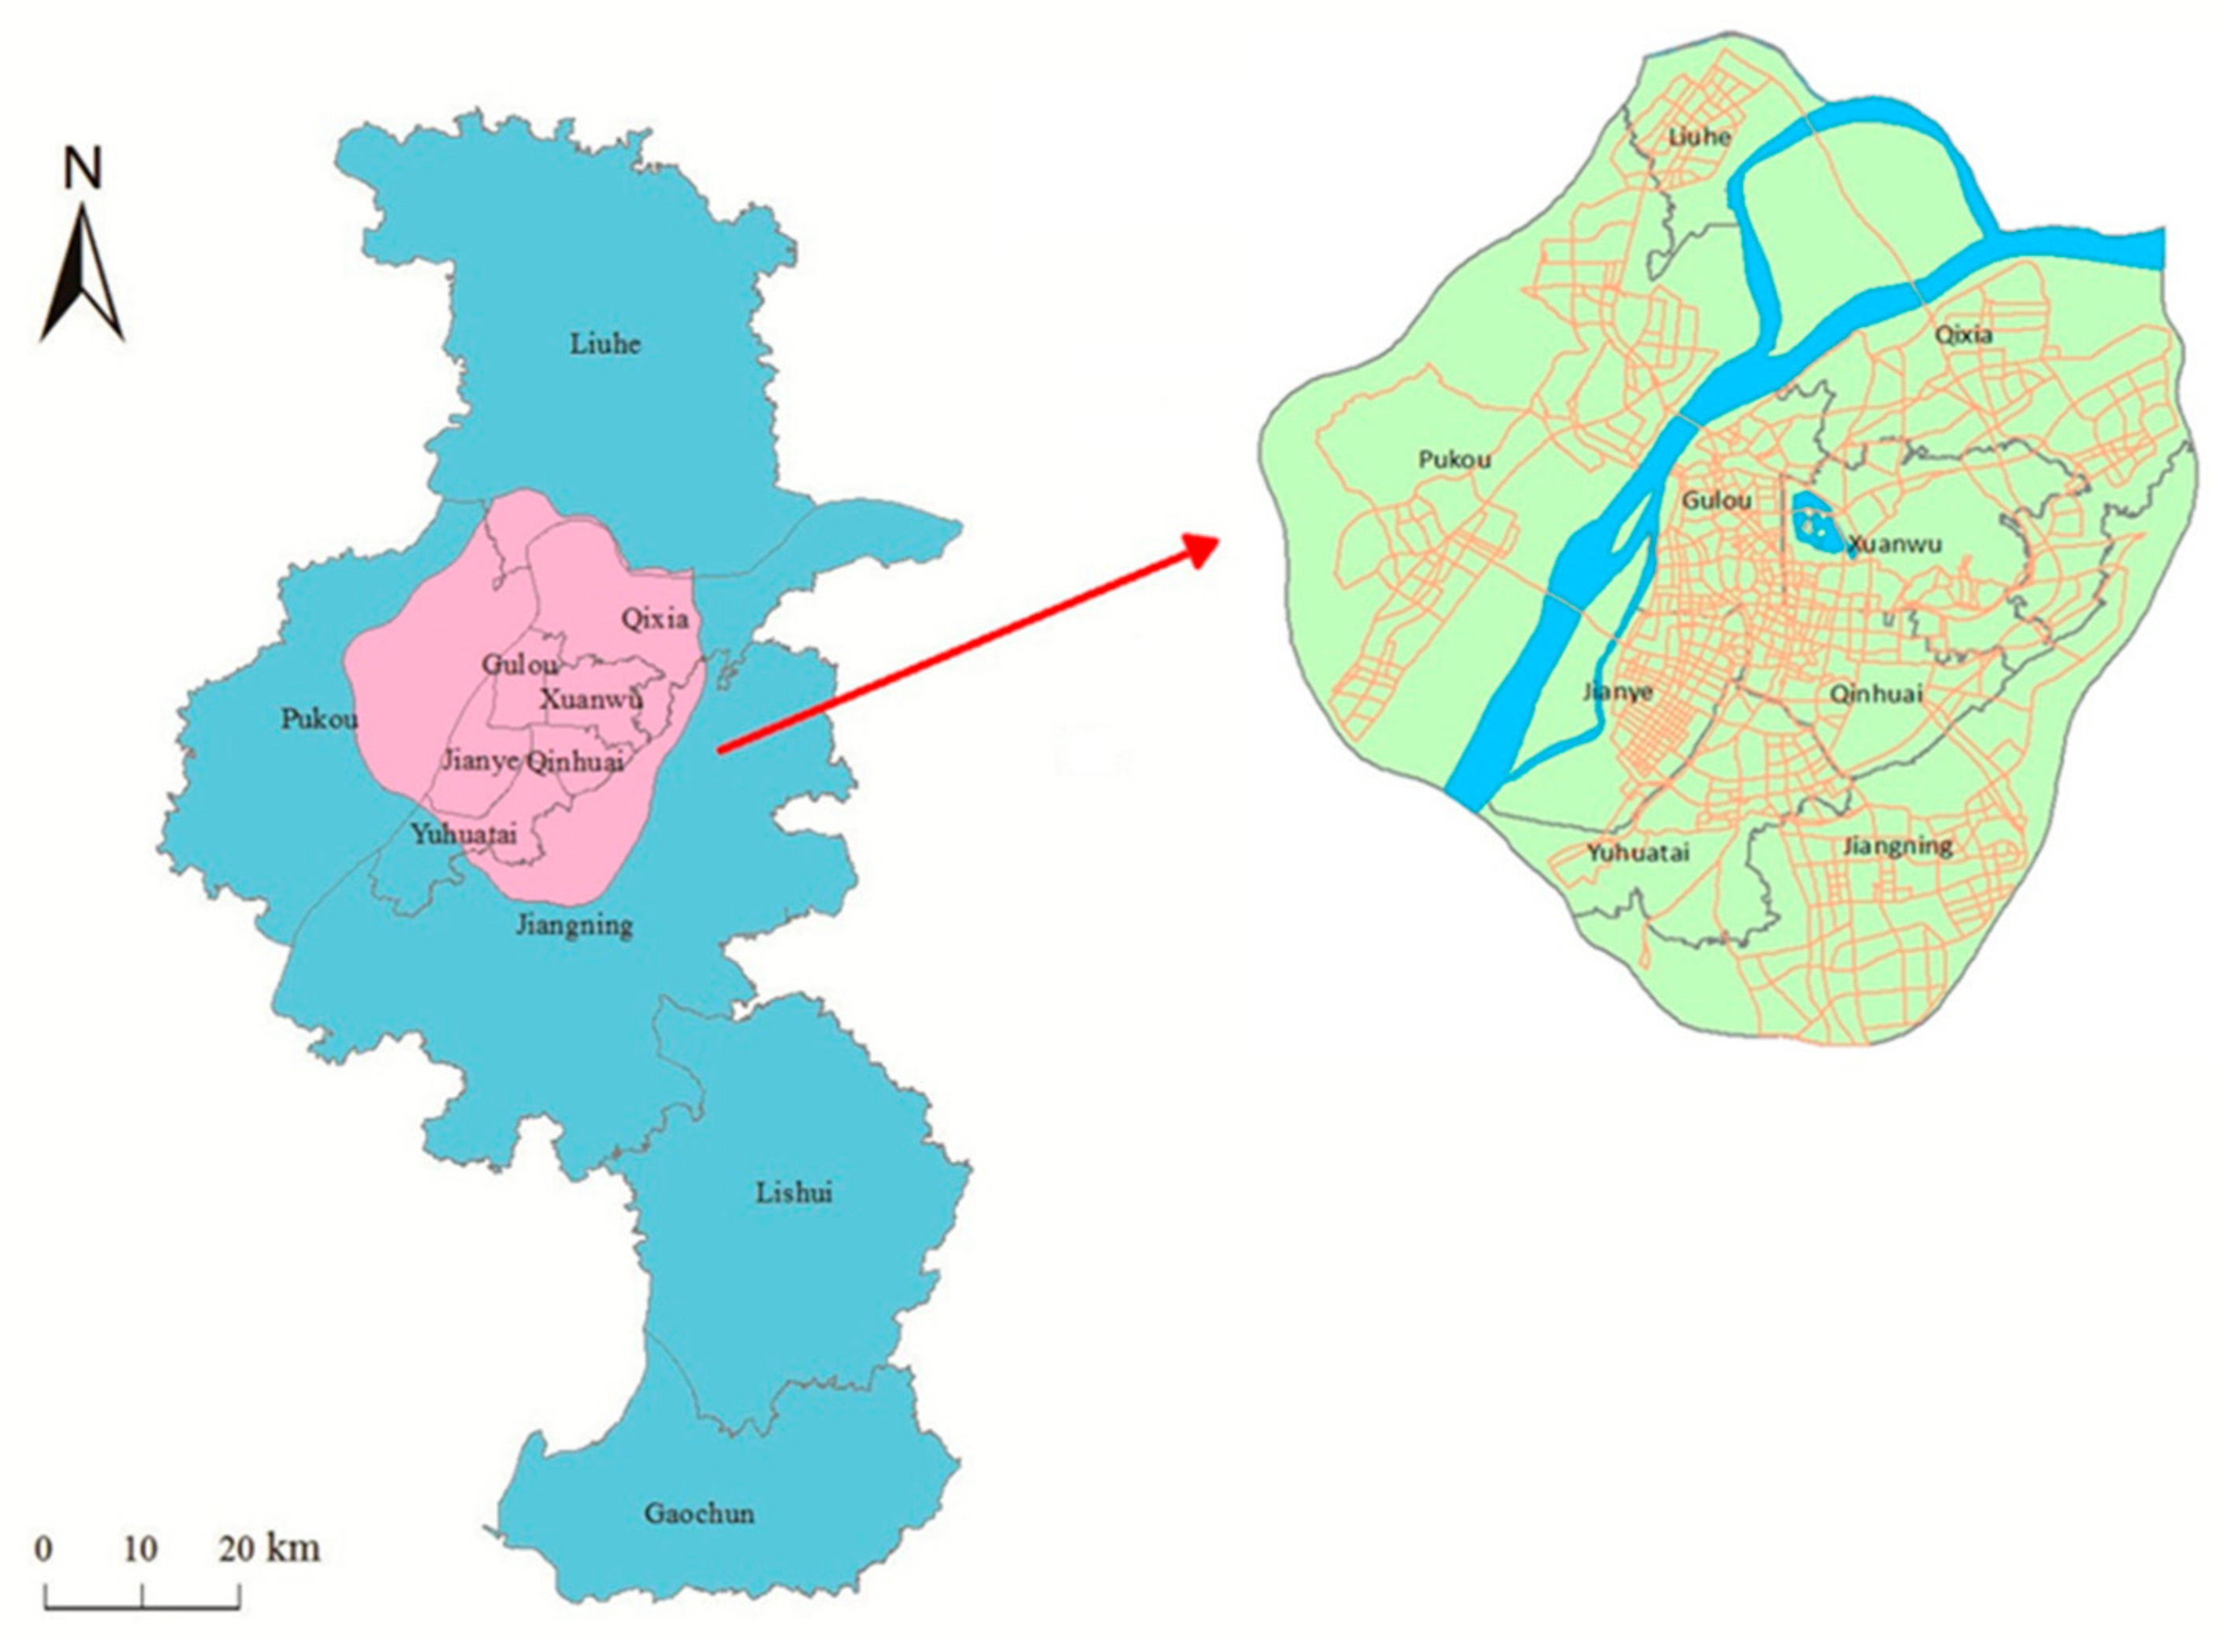
2.1. Study Area

As the second biggest city in Eastern China, Nanjing has 11 districts, since 2015, with a total population of 8.27 million and the urban population of 6.73 million in 2016. Nanjing is a representative city of the rapidly growing and globalizing in the Yangtze Delta. The study area (light green color in Figure 1) locates in the central urban area of Nanjing, which is surrounded by the Yangtze River and the belt highway. There are 5.23 million residents in the study area, which covers 10% of the total area of Nanjing.

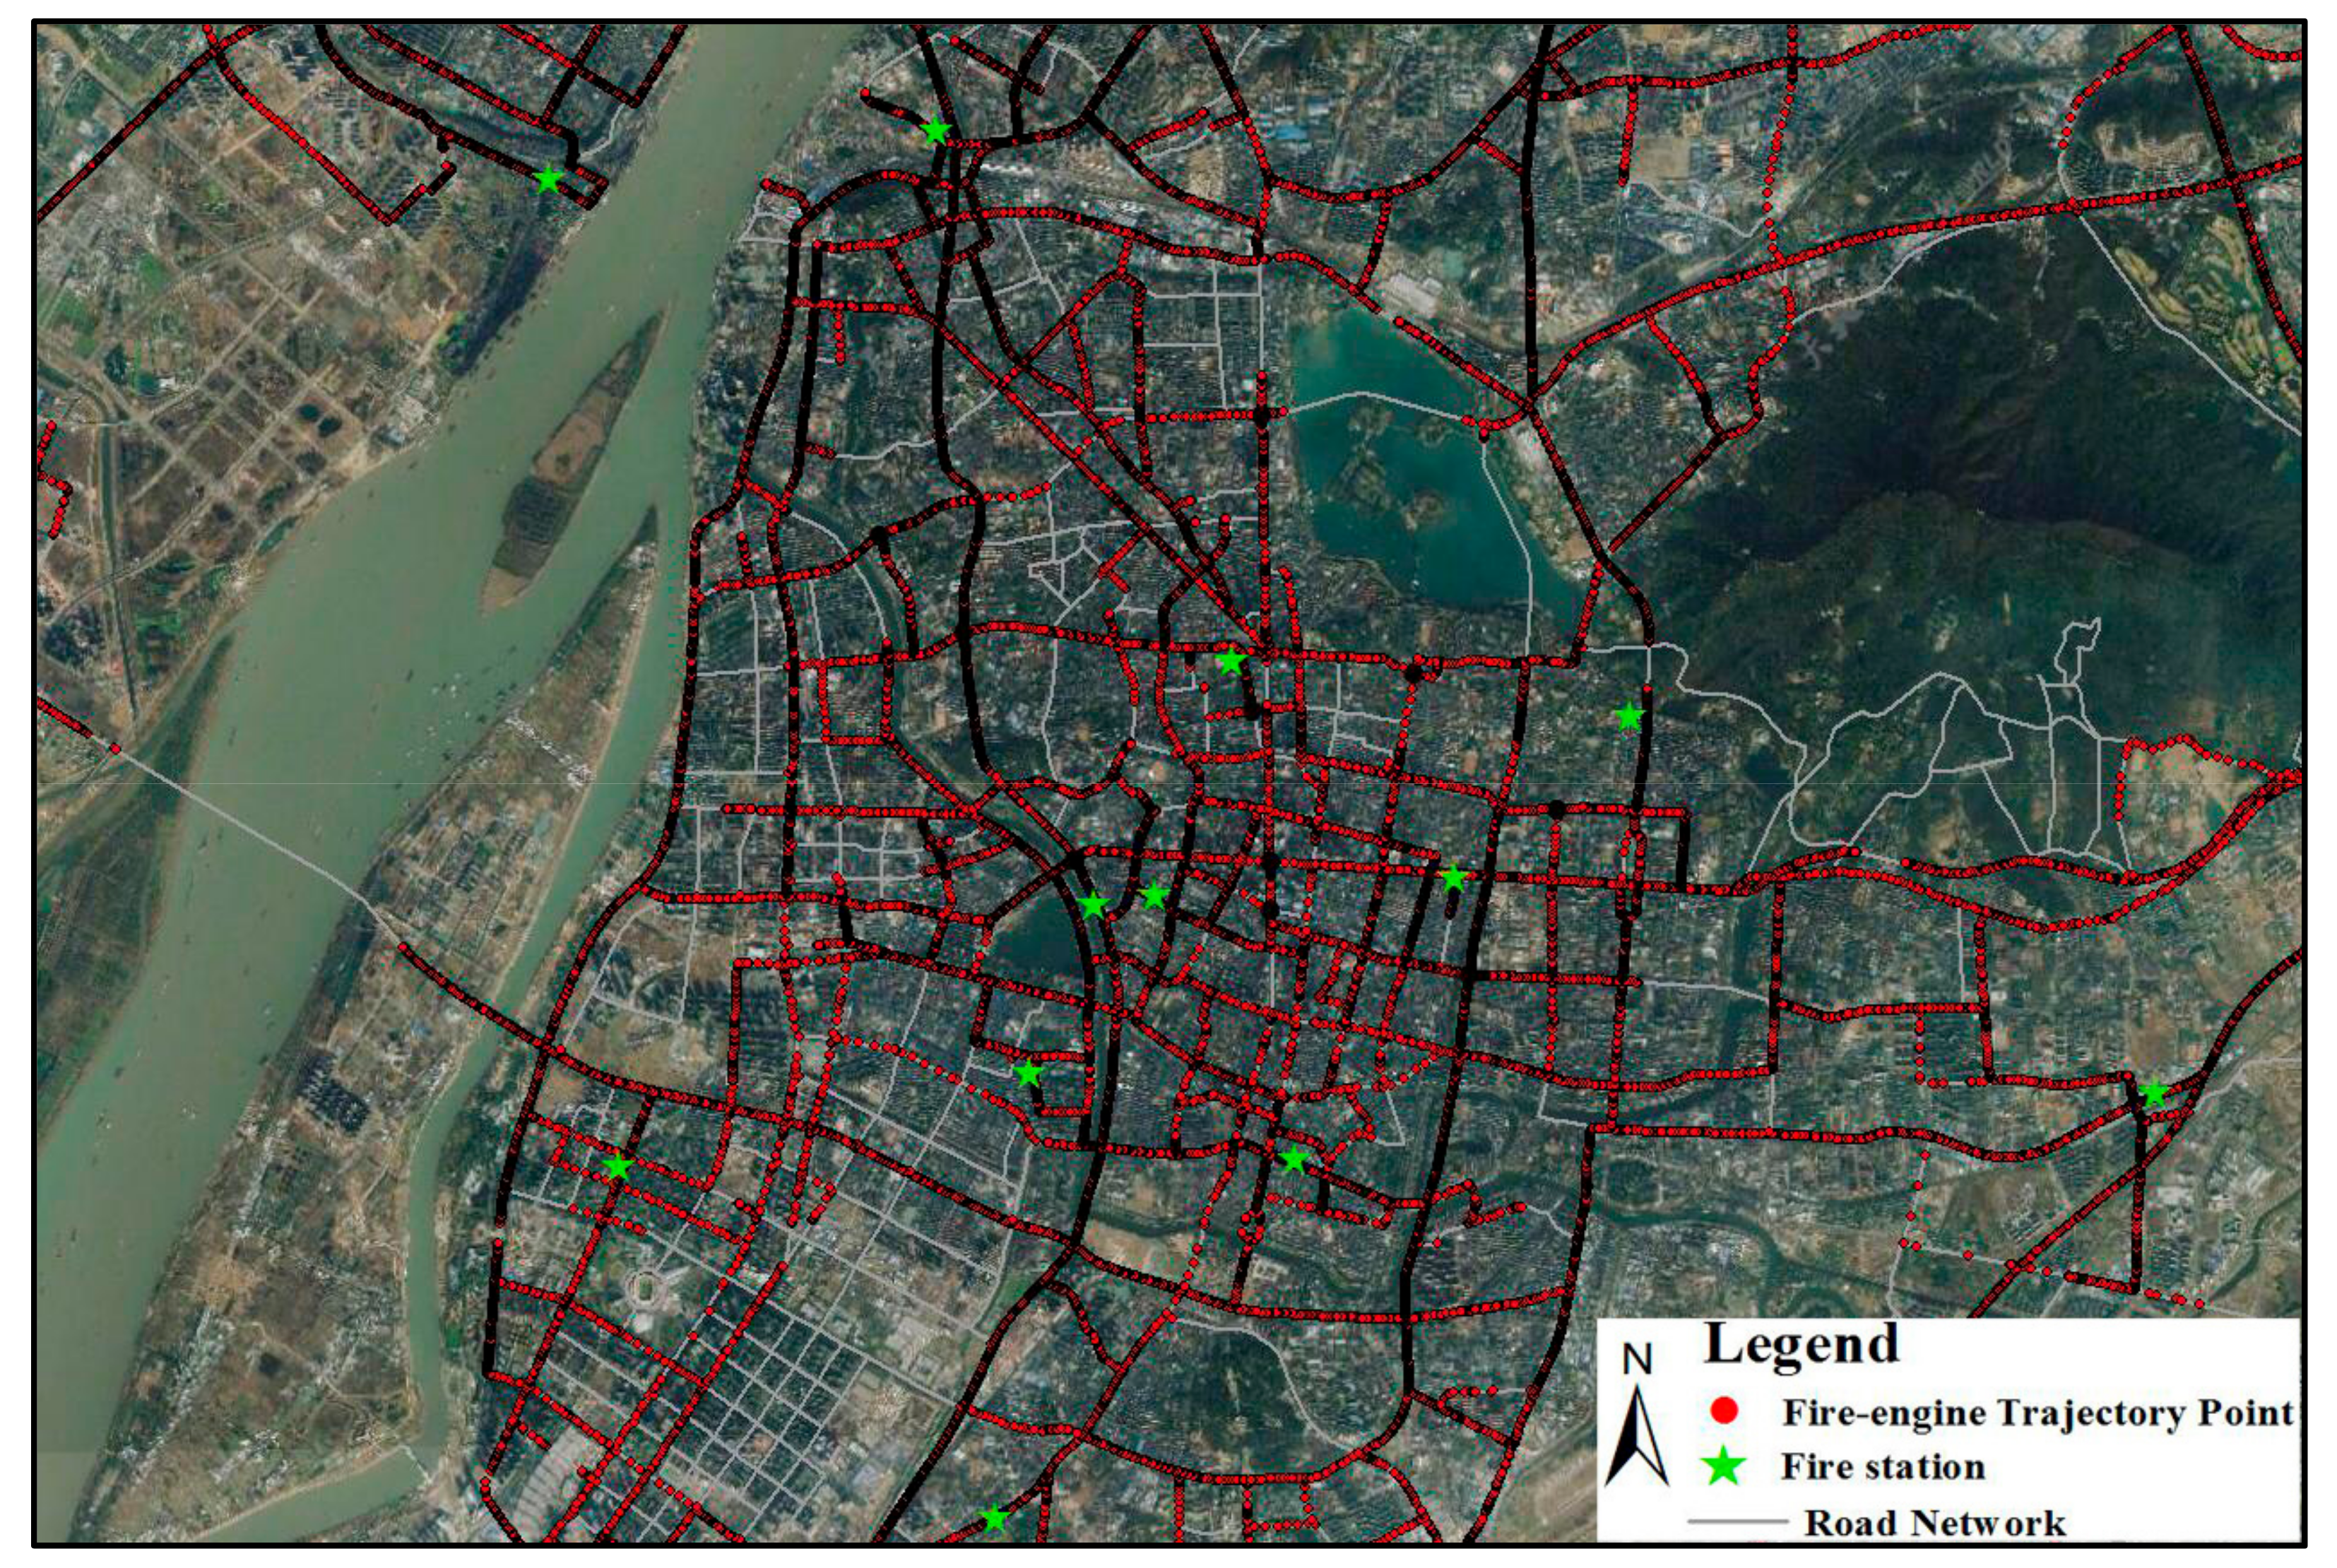
2.2. Road Network and Fire-Engine GPS Data

The road network data are extracted and abstracted from the Traffic Map of Nanjing (2015); each road is shown as a polyline with its attributes of name and grade. The road network includes expressways, main roads, secondary roads and branch roads and excludes metro-ways, highways, railways and ferry-ways [24].
Nanjing is one of the cities with high incidence of fire in China. All fire squadrons have their vehicles equipped with GPS receivers to monitor the running status of real-time traffic. With the help of GPS devices, historical trajectories of fire engines can be recorded as a series of locations sampled at small periodic intervals [25,26,27]. In this research, the dataset includes more than 109 fire engines records for six consecutive months, from January to June 2015. For each fire engine, its ID, license plate, longitude, latitude, time stamp, instantaneous velocity, and azimuth angle is automatically collected approximately every 30 s.
A fire-engine trajectory is constituted by a series of GPS points. Each GPS point recorded the instantaneous position, time, velocity and driving direction of the fire engine as p < x, y, t, v, a >. x, y, t, v, and a denote longitude, latitude, time, velocity and driving direction, respectively. Table 1 shows the records of GPS information on fire-engine trajectory. Figure 2 shows a sample of fire-engines trajectory points from 1 to 3 January 2015.
GPS information of the fire engine not only reflects the running state of each fire engine, but also can be used to investigate fire accidents temporal distribution. Figure 3 illustrates the trips of fire engine taken during different periods. As depicted in Figure 3, fire squadrons travel time mainly concentrated in four periods: 9:00–12:00, 12:00–15:00, 15:00–18:00, and 18:00–21:00.

2.3. Fire Accidents Data and Processing

In this paper, a fire is defined as a fire accident when death or property loss occurs, which are all indicated by a point pattern in a geographic information system (GIS) environment. There are 790 fire points in the study area, according to the 2015 Jiangsu Province Nanjing Fire Department. The fire data are stored in a geo-database along with basic information (such as date, longitude, latitude, alarm time, response time, address, fire hazard rating, arrival time, travel distance, burned area, attendance fire squadron, return time, fatality or serious injury, fire condition description, etc.).
In terms of fire locations, residential fires take the largest proportion in all kinds of fire accidents types, accounting for nearly 70% of the total number. Due to the rapid expansion of urban automobile traffic, the contradiction among the increasing number of private cars year by year, urban limited road network and parking space has reached an unbearable limit. Private cars bring convenience to residential life and also cause many impacts for urban management. In particular, the road congestion phenomenon caused by chaotically parked and misplaced vehicles is increasingly serious, which greatly influences the normal traffic of fire-fighting (see Figure 4a,b). Besides, restricted by fire-engine size, fire passages are needed to meet traffic requirements (see Figure 4c). In many cases, the fire squadron arrives on the main road within 5 min of alarm, but the residential roads and fire engine access areas are clogged with parked vehicles, so the fire engines cannot get to the fire to implement rescue. Firefighters can only use the nearest fire hydrants or lay hundred meters of fire-hose. As a result, the rescue speed was affected and the best time for fire-fighting was delayed. Statistical studies indicate that, in 80% urban fire accidents, fire engines are unable to reach the optimal range of 50 m from the fire scene. In fact, in most urban fires, fire engines can only be parked on the nearest main road from the fire scenes.
In this paper, to identify the interaction between road network and the fire accidents locations, we adopt the map-matching method based on geometric analysis to solve the problem. The point to line map-matching method not only regards the geometric distance between two points as a constraint, but also considers the geometric shape characteristics of possible matching points and surrounding roads [28,29,30]. In addition, restricted by fire engine size, the fire lane width must be more than 3 m. For this reason, the research mainly considers four kinds of urban roads: expressway (>5 m), main road (>3.75 m), secondary road (3.5–3.75 m) and branch road (3–3.5 m). To ensure the matching accuracy, we need to define a distance threshold. If the threshold is too large, the matching position will deviate greatly from the original position resulting in inaccurate analysis. The change of distances from the fire location to the nearest road is shown in Figure 5. The percentage of fire accidents first decreases sharply and then remains stable, so a 240–280 m threshold was used because it is a reachable man-controlled rescue distance, and an empirical study found that the fire-hose of maximum laying distance between fire-locations and fire-vehicles is less than 300 m. The distribution of the processed fire points in network space is shown in Figure 6.

3. Methodology

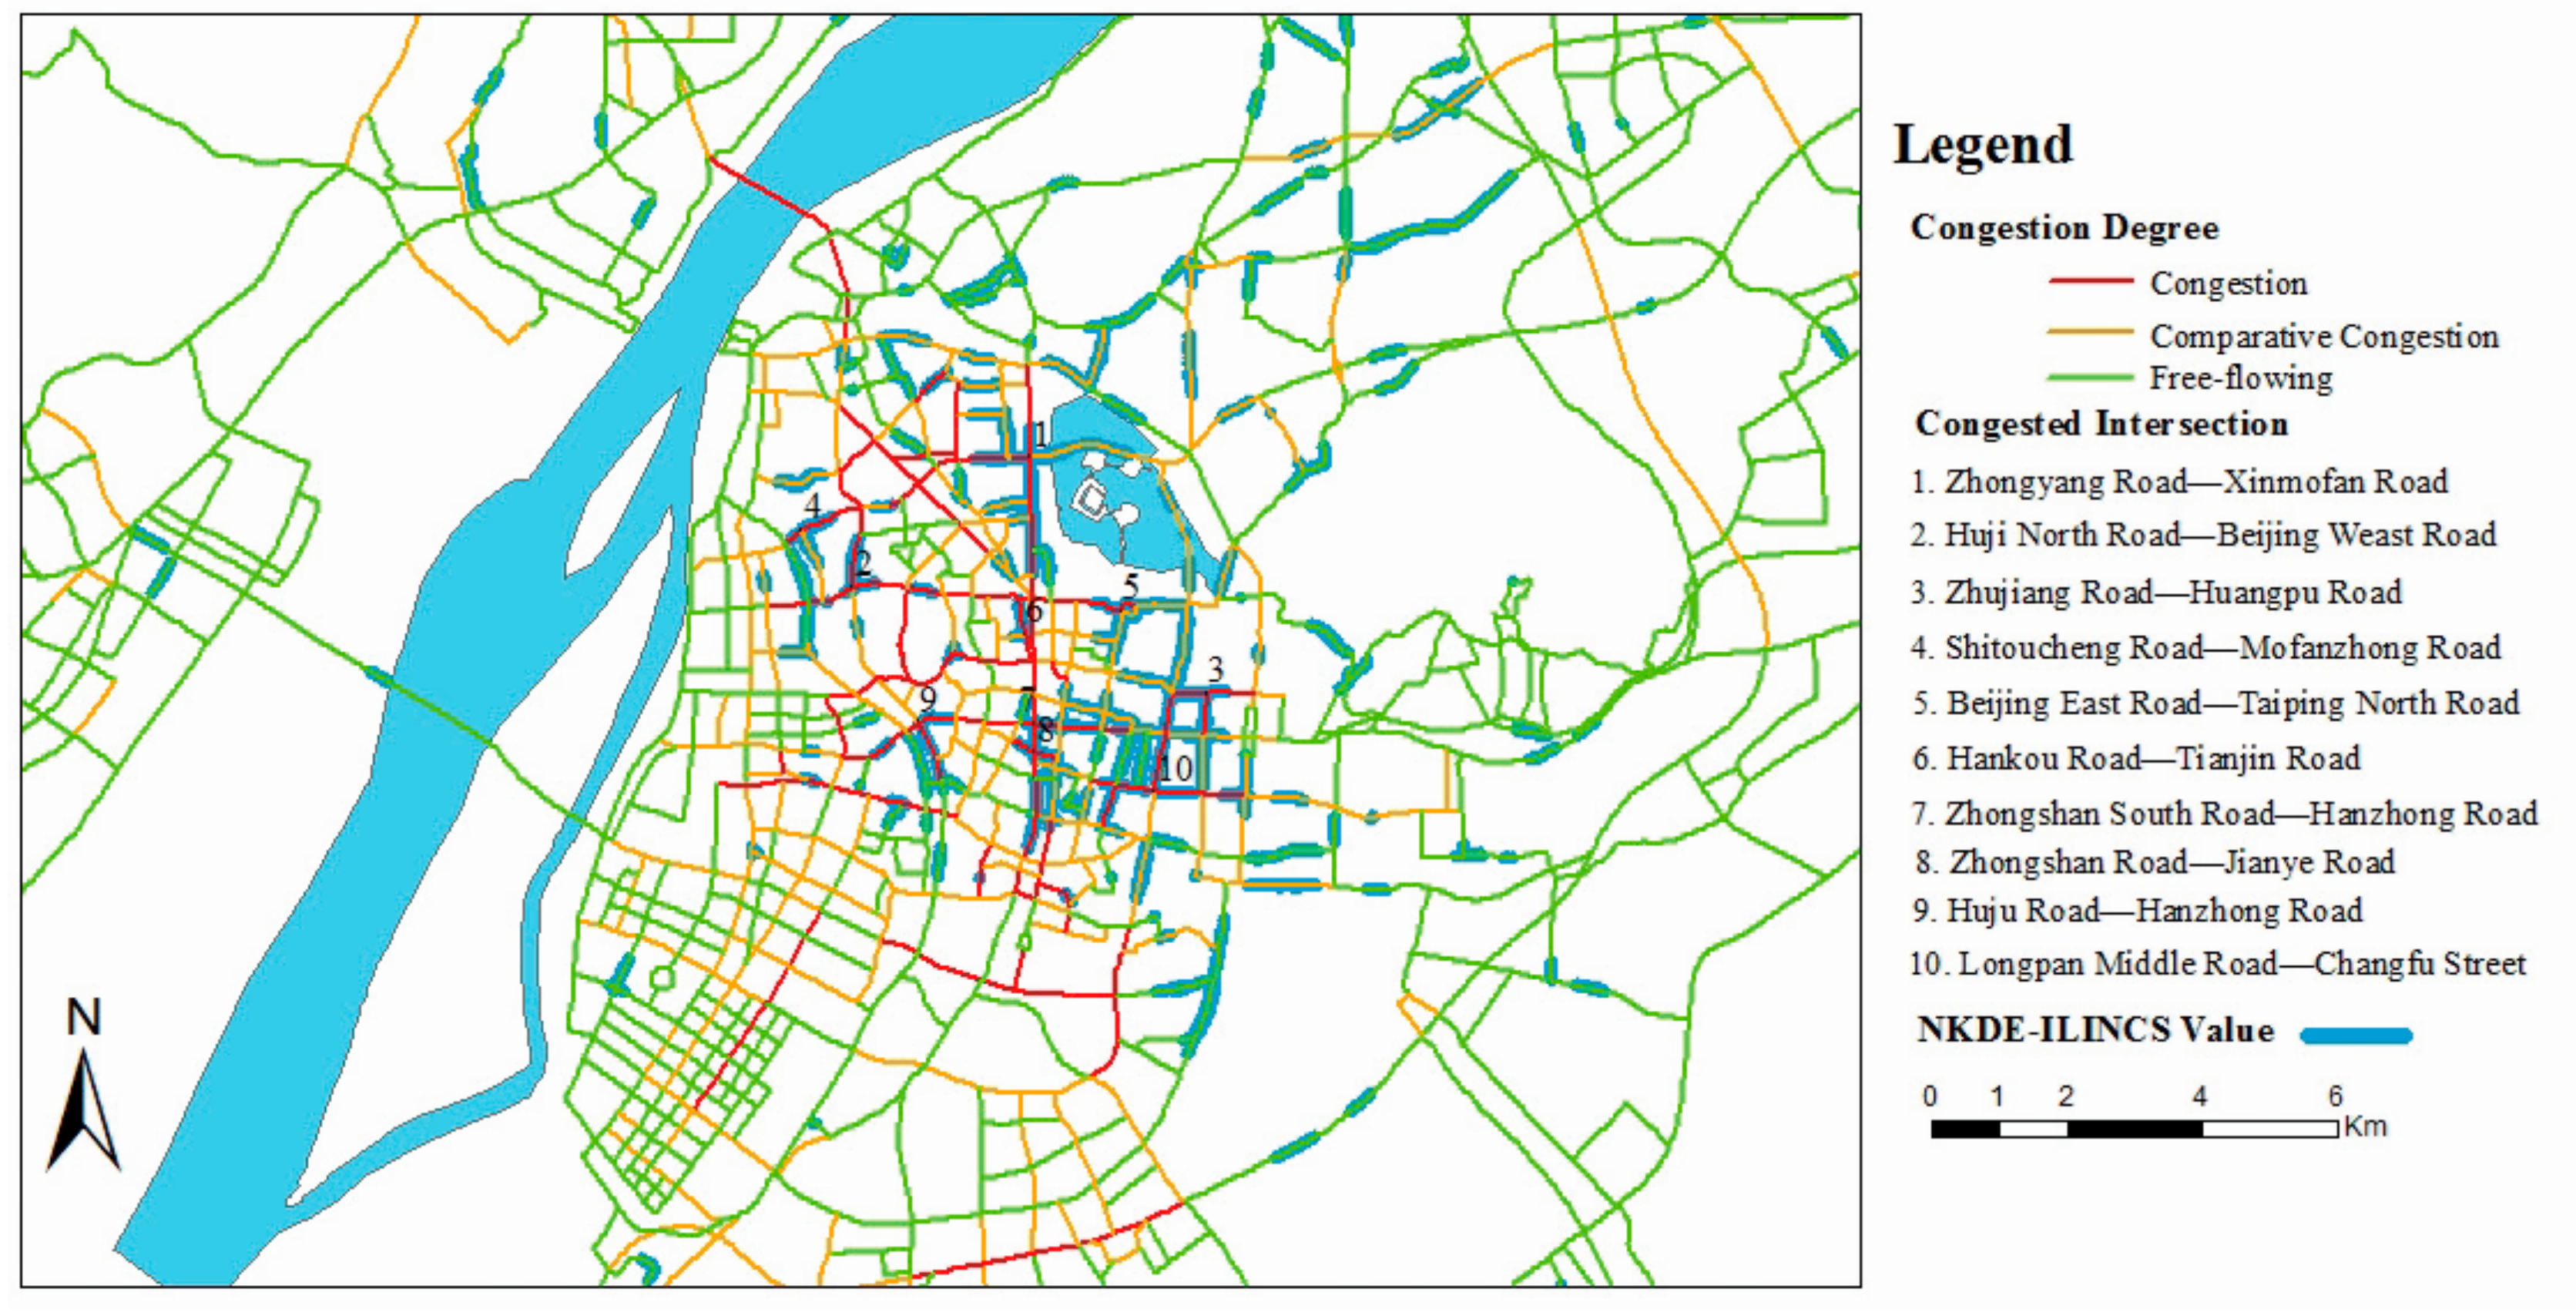
3.1. Road Congestion Identification Based on Fire-Engine GPS Data

As we all know, fire departments need to arrive at the scene in the shortest possible time to reduce losses. The distance between two locations in a road network is usually defined by the distance of their shortest path. However, this kind of distance measure would ignore the reality that some fire accidents may take longer time to reach the fire locations due to the urban traffic conditions. In fact, travel speed is a more meaningful and reliable traffic condition measure for network KDE in constrained networks. In this research, we use the changes of the fire-engines travel speed to reflect the characteristics of road traffic conditions, and reveal the actual state of traffic congestion effectively based on the membership function of the road. The critical step in data processing is to exactly match GPS positioning points to the path due to the errors of GPS positioning and electronic map. For this paper, we use an algorithm based on road buffer analysis to realize map matching; the main steps include creating road buffers, eliminating invalid GPS data, traversing buffer layers, and identifying the matching road-sections in ArcGIS platform.
According to the distribution characteristics of traffic flow, the traffic congestion degree of urban road network is divided into three grades: congestion, comparative congestion and free-flowing. Assume that U is the traffic congestion degree of the road section, according to the size of its membership function requirements: U i > 0.75 indicates “congestion”; 0.35 < U i < 0.75 denotes “comparative congestion”; and U i < 0.35 represents “free-flowing”. Calculate the membership function U based on the average speed of the vehicle on the road-section, and identify the congestion state of the road-section in a certain period. The average speed V i ¯ and membership U are calculated by
V i ¯ = 1 1 n j = 1 n t j
U i = v i j ¯ max v i ¯ v i j ¯ max v i j ¯ min
where v max is the maximum average speed of all fire engines passing through the road-section i within six months, and v min is the minimum average speed of all fire engines passing through the road-section i within six months. It can be seen that the greater the average travel speed V i ¯ , the smaller the membership U , the smoother the road. On the contrary, the smaller the average travel speed V i ¯ , the greater the membership U , the more congested the road.

3.2. Network Kernel Density Estimation

Given a homogeneous space, the traditional planar KDE superimposes a bell-shaped weighted function over any location with isotropic property. This function is easy to implement but difficult to reflect the actual distribution of geographical events, because urban activities within urban areas are usually constrained under road network in planar space. When KDE method expended from 2D planar space to network space, the network KDE still preserves the principle of near events more related than distant events, but the distance concept changes [31]. To illustrate the restrictiveness of network structure, Figure 7 shows the comparison between the planar KDE and network KDE. It can be noted that the distance in planar KDE is measured in terms of Euclidean distance, while in network KDE it is replaced by route distance.
The Network Kernel Density Estimation (NKDE) principle is shown in Figure 8. The corresponding research subject is not the area covered by the entire road network, but more precisely to each road segment of the network. The distance between points is not measured by the Euclidean distance in 2-D planar space, but is measured by network distance under network-constrained structures. NKDE method mainly discusses the first-order properties of spatial data in a nonparametric way to reveal cluster pattern of point events [32]. A symmetric and continuous surface is placed on each of the center points of the spatial units to calculate the density of the entire area considering the distances between the center point and the locations of observations within the surface [33]. The estimator of NKDE is
D ( s ) = i = 1 n 1 h k ( d ( s , c i ) h )
where D ( s ) is the density value measured at location s , h is the search bandwidth of the NKDE (only events within h are used to estimate D ( s ) ), c i represents the observed event point, d ( s , c i ) is the distance from the estimation point to the observation point, and k ( ) is a kernel function of the ratio of d ( s , c i ) to h with the “distance decay effect”. The choice of the two parameters, h and k , is extremely critical. When h increases, the surface of the density becomes smoother, ignoring some details of the density. When h decreases, the surface of the density becomes uneven, enhancing the cost of the calculation. Besides, it turns out that the effect of the choice of kernel function is less than the effect of the choice of the search width. A number of forms of kernel functions can be used to measure the “distance decay effect” in the spatial weights k , such as Gaussian, Conic, Quartic, and negative exponential [34]. Although there is a range of kernel functions, empirical studies indicate very little difference in the results between different weighting functions. In the research, we use the most commonly used Gaussian function [35,36].

3.3. Constrained Network and Traffic Conditions KDE

(1) Intersection Roads
A junction is part of the intersection of two roads; drastic changes will occur in the cross-section of the road. Similarly, Network topology changes at nodes. For example, the number of links often increases at nodes, causing the extending of search ranges around nodes. The extension of search range makes it difficult to ensure the correctness of density estimation at nodes. This study calculates density around nodes unbiasedly based on equal-split kernel functions, proposed by Okabe et al. (2009). The network kernel density after crossing will produce decay effect; the decay coefficient is related to the number of nodes at the intersection. In this paper, the decay coefficient is defined as 1 / ( n s 1 ) , and n s represents the number of nodes at the intersection [15,16]. For example, if the intersection is a three-way intersection, the number of nodes at the intersection is 3. When the network kernel density on the basic segment road travels along the three-way intersection, the decay coefficient is equal to 1/2. In other words, at the node, the network kernel density is equally divided into two values, each of which is assigned to each edge. The network kernel density function at intersection is illustrated in Figure 9.
The form of kernel function at intersection (Okabe et al., 2009) is given in Equation (4) as
D ( s ) = { i = 1 n 1 h k ( d ( s , c i ) h ) ( n 1 1 ) ( n 2 1 ) ( n s 1 ) d ( s , c i ) h   0   d ( s , c i ) > h
(2) Road Traffic States
In a dynamic GIS network environment, the effect of daily congestion is uniformly distributed over the road network and affects all spatial processes equally at all times. Urban traffic States can be affected by many factors such as road restriction and traffic congestion in business time. The road traffic constraint in network analysis is mainly reflected in the change of travel speed. Thus, we use travel speed as the conditional factor to establish a road congestion discrimination model, and the congestion level of each road section is set as congestion, comparative congestion and free-flowing, respectively.
The smoother the road is, the faster travel speed fire vehicles can get to the fire scene with less travel time, the smaller impact of road congestion on fire accidents along the local roadways is. In this study, the fire locations on the congested road weighted stronger than that on smooth road for calculating the overall density. According to the traffic statistics, we take the travel speed as 25 km/h, 35 km/h, and 45 km/h for three levels of road congestion, and corresponding the weight of basic linear unit (BLU) length of the road is set as 2.0, 1.6, and 1.0, respectively.
(3) Severity of fire Accidents
Besides the fires locations, the non-spatial characteristics of fire points have impacts on the specific geographical distribution pattern. The severity of fire accidents is considered the most crucial factor for fire rescue in many research studies. For example, a region where serious fires often occur more urgently needs to implement fire protection. Hence, to identify more details about the kernel density of fire accident locations, fire points were weighted by their severity.
Here, we introduce accident hazard index G to reflect the impact of the severity of the accident on the kernel density. The indicator of an accident hazard mainly includes two aspects: casualty and property loss. The more serious is the accident, the greater is the loss, and the greater is the G value. The accident hazard index G is calculated by
G i ( x ) = D i x 1 + W i x 2
where G i ( x ) is the severity of the accident at fire location i , x 1 indicates the number of deaths, x 2 indicates the number of casualties, D represents the death weight coefficient and its value is set to 2, and W represents the casualty weight coefficient and its value is set to 1.25.
The weighted kernel function is defined as:
D ( s ) =   i = 1 n 1 h k ( d ( s , c i ) h ) G ( x ) G ( x ) 1 , d ( s , c i ) h

3.4. Network-Constrained Local Moran’s I Method

Spatial autocorrelation is characterized by a correlation that occurs among samples that are geographically close. Moran’s I, one of the most used methods for measuring spatial autocorrelation, can define the actual locations where hotspots are clustered together based on a formal assessment of statistical significance. Anselin (1995) developed a local Moran’s I statistic [37]. The network-constrained local Moran’s I (ILINCS) is a straightforward extension to the planar method. The formula and the simulation methods remain the same as mentioned. However, the definition of weight matrix W is quite different. In ILINCS, the spatial weight matrix can be constructed using either the network topology (node-based) or the distances along links in the network (distance-based) [12,14]. The node-based matrix designates two links share a common node. The distanced-based matrix measures the distance between the midpoints of links according to a threshold value.

4. Network Kernel Density Estimation Algorithm

In this research, the basic computational algorithm and implementation process of the NKDE is divided into four parts; the basic algorithm is presented as follows.
(1)
Divide road segments into basic linear units. The urban road network is abstracted into a linear network system consisting of point features and linear features. First, the road network is broken into road segments at nodes. The road segments are the parts of roads between two neighboring road intersections. Then, a defined network length is used to divide each road segment into a set of basic linear units (BLUs). If there is a residual when dividing the road segments into BLUs, we take the residual as a BLU. Finally, create a BLU-based network topological relationship between BLUs, and stored as a relational table in a database.
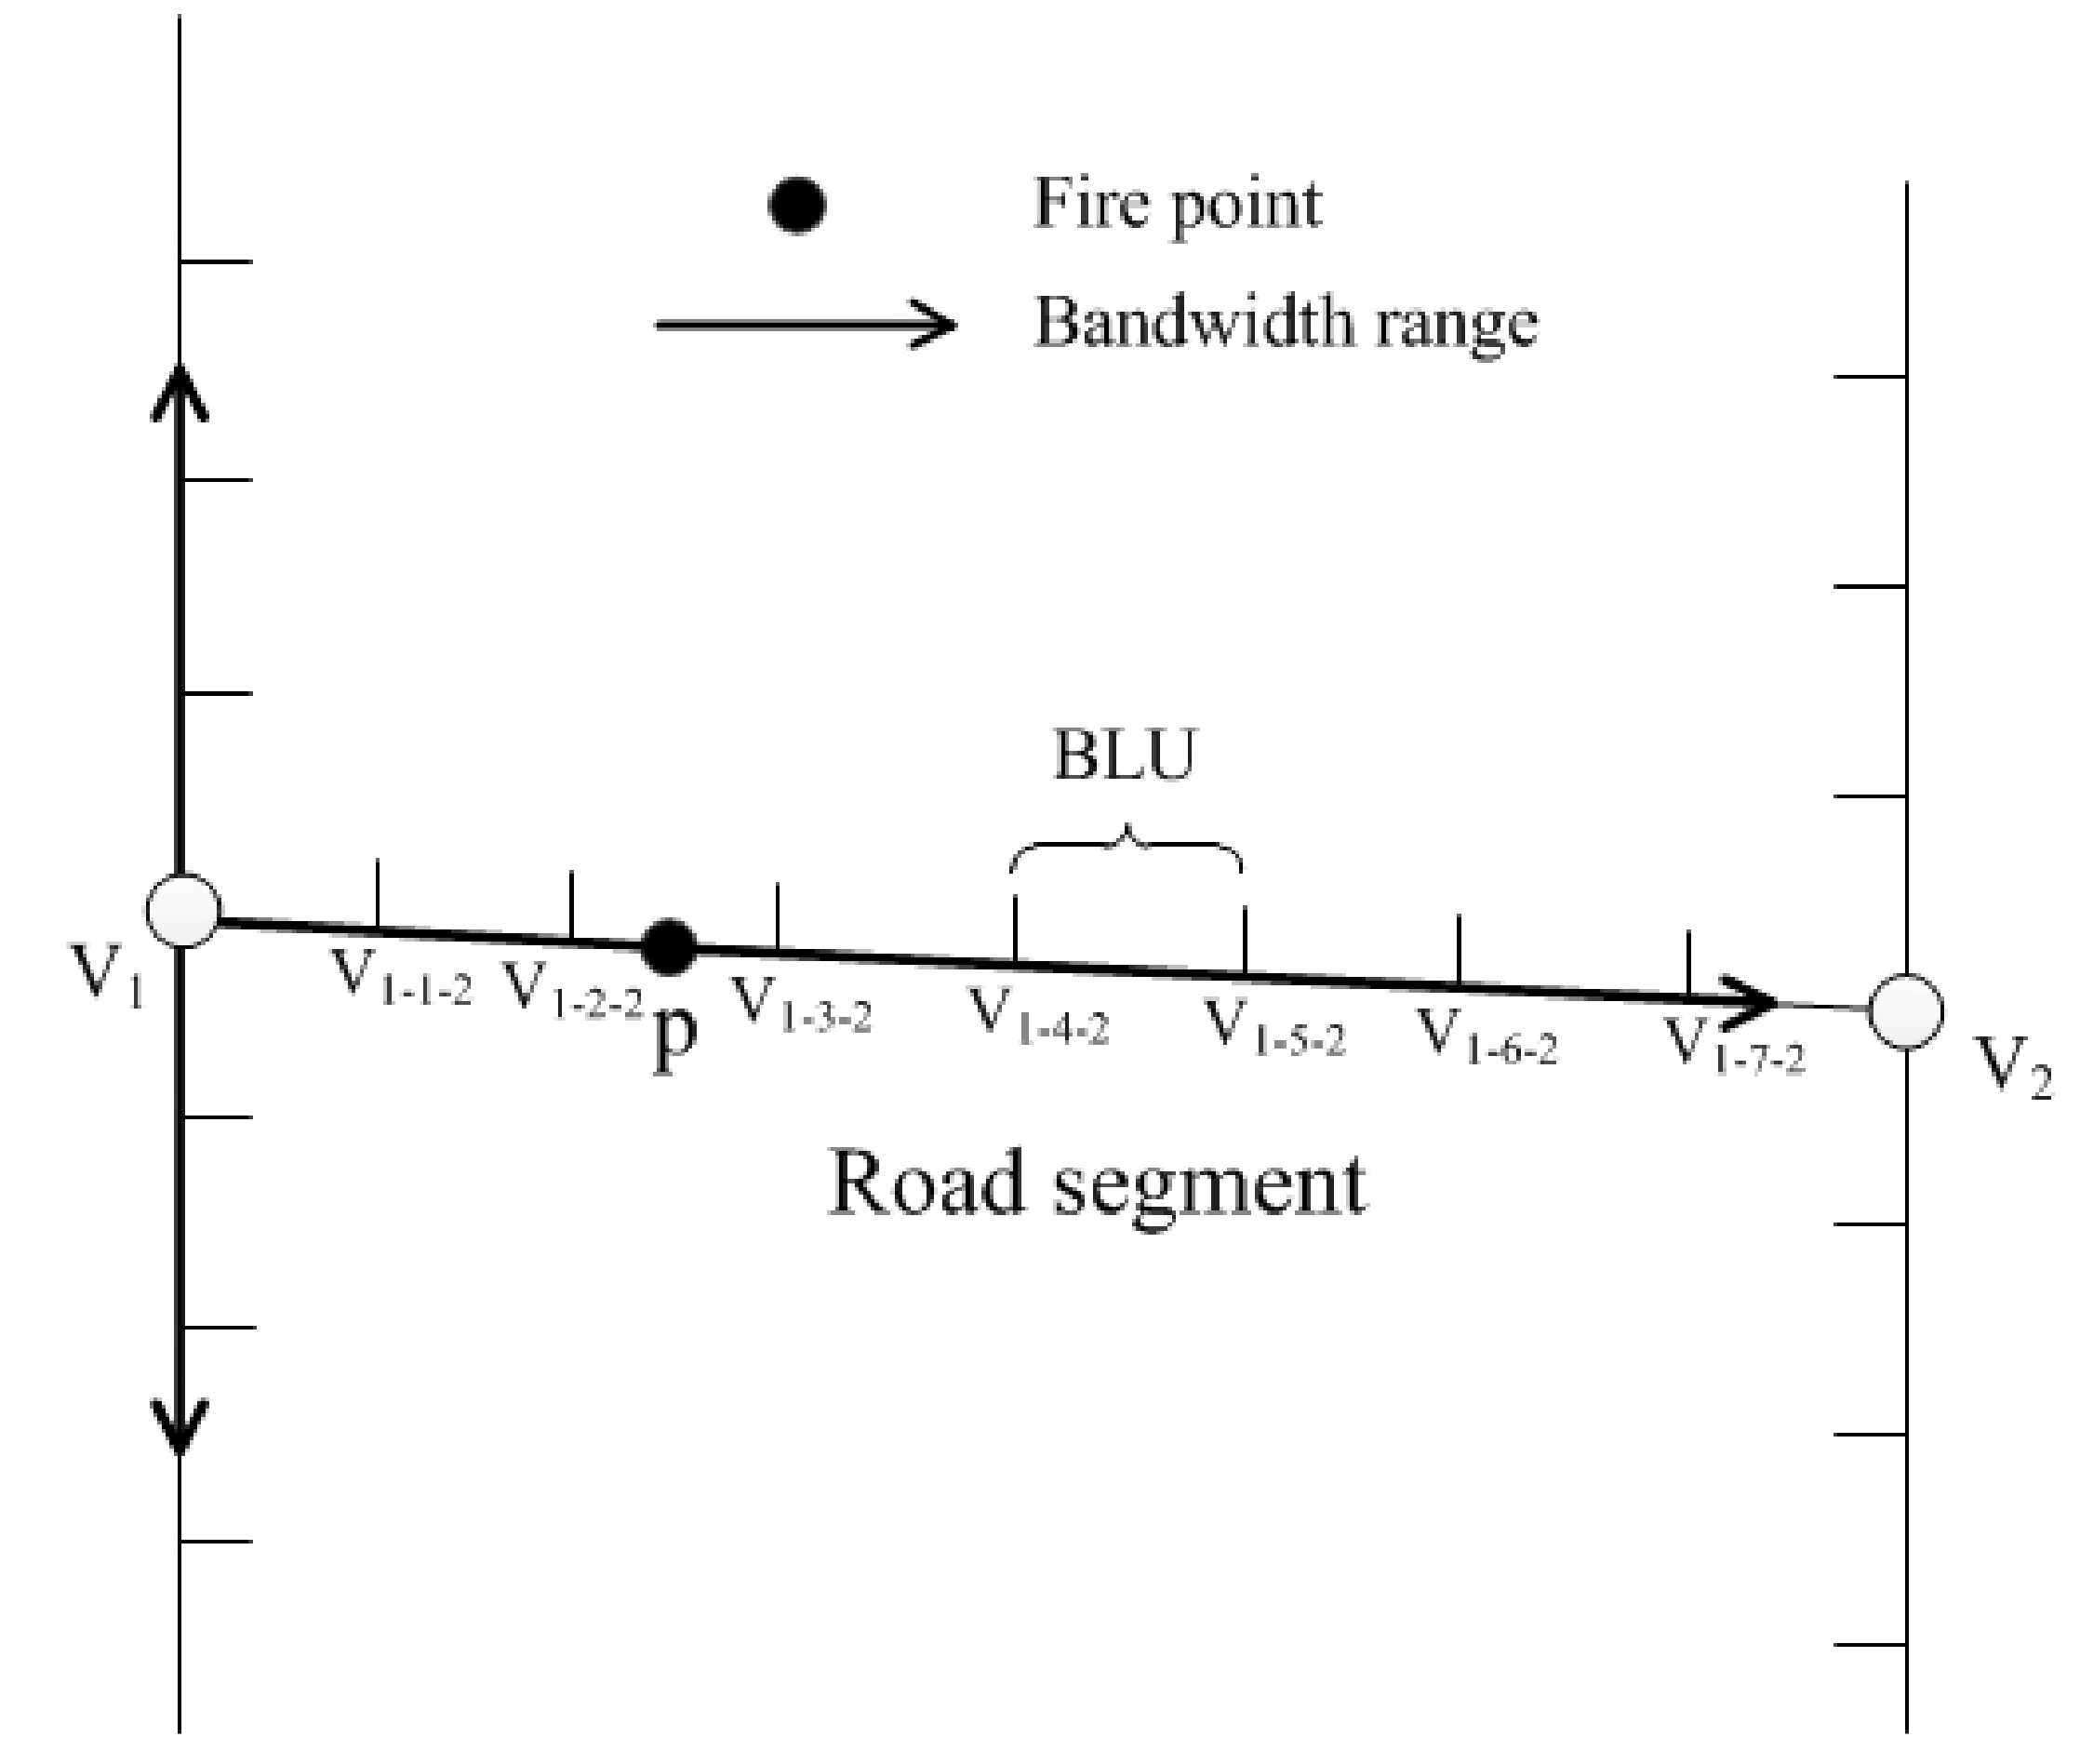
(2)
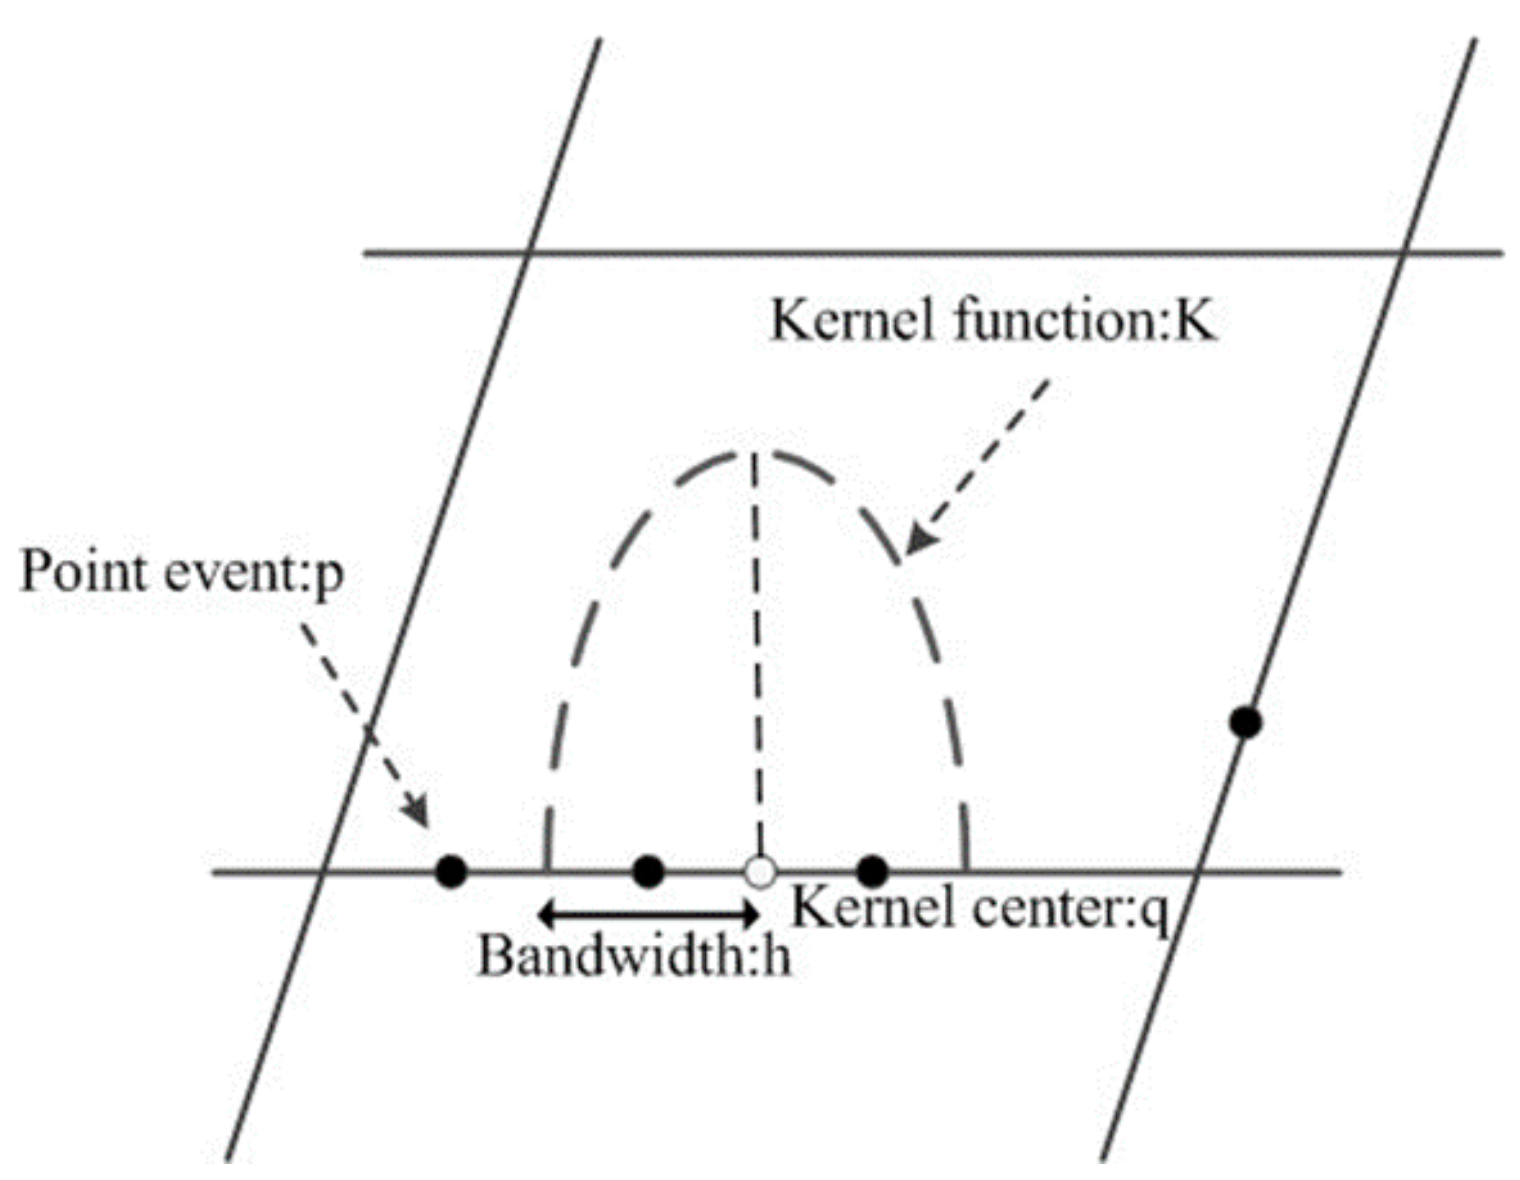
Find the all nodes around each fire point within the search bandwidth. Define a search bandwidth h, measured with the shortest path network distance. That is, regard each fire point as the kernel center, and find the shortest path based on Dijkstra algorithm within the search bandwidth h [38]. For example, as shown in Figure 10, V1 and V2 indicate the road intersection position, and the fire point p locates 80 m from the intersection V1. Assuming that the bandwidth is set to 100 m, the corresponding length of BLU is 20 m. Starting from the intersection node, a new node is generated every 20 m along the basic linear unit. Thus, we can find all the nodes and their attributes of each fire point within the bandwidth range. The attribute table is shown in Table 2.
(3)
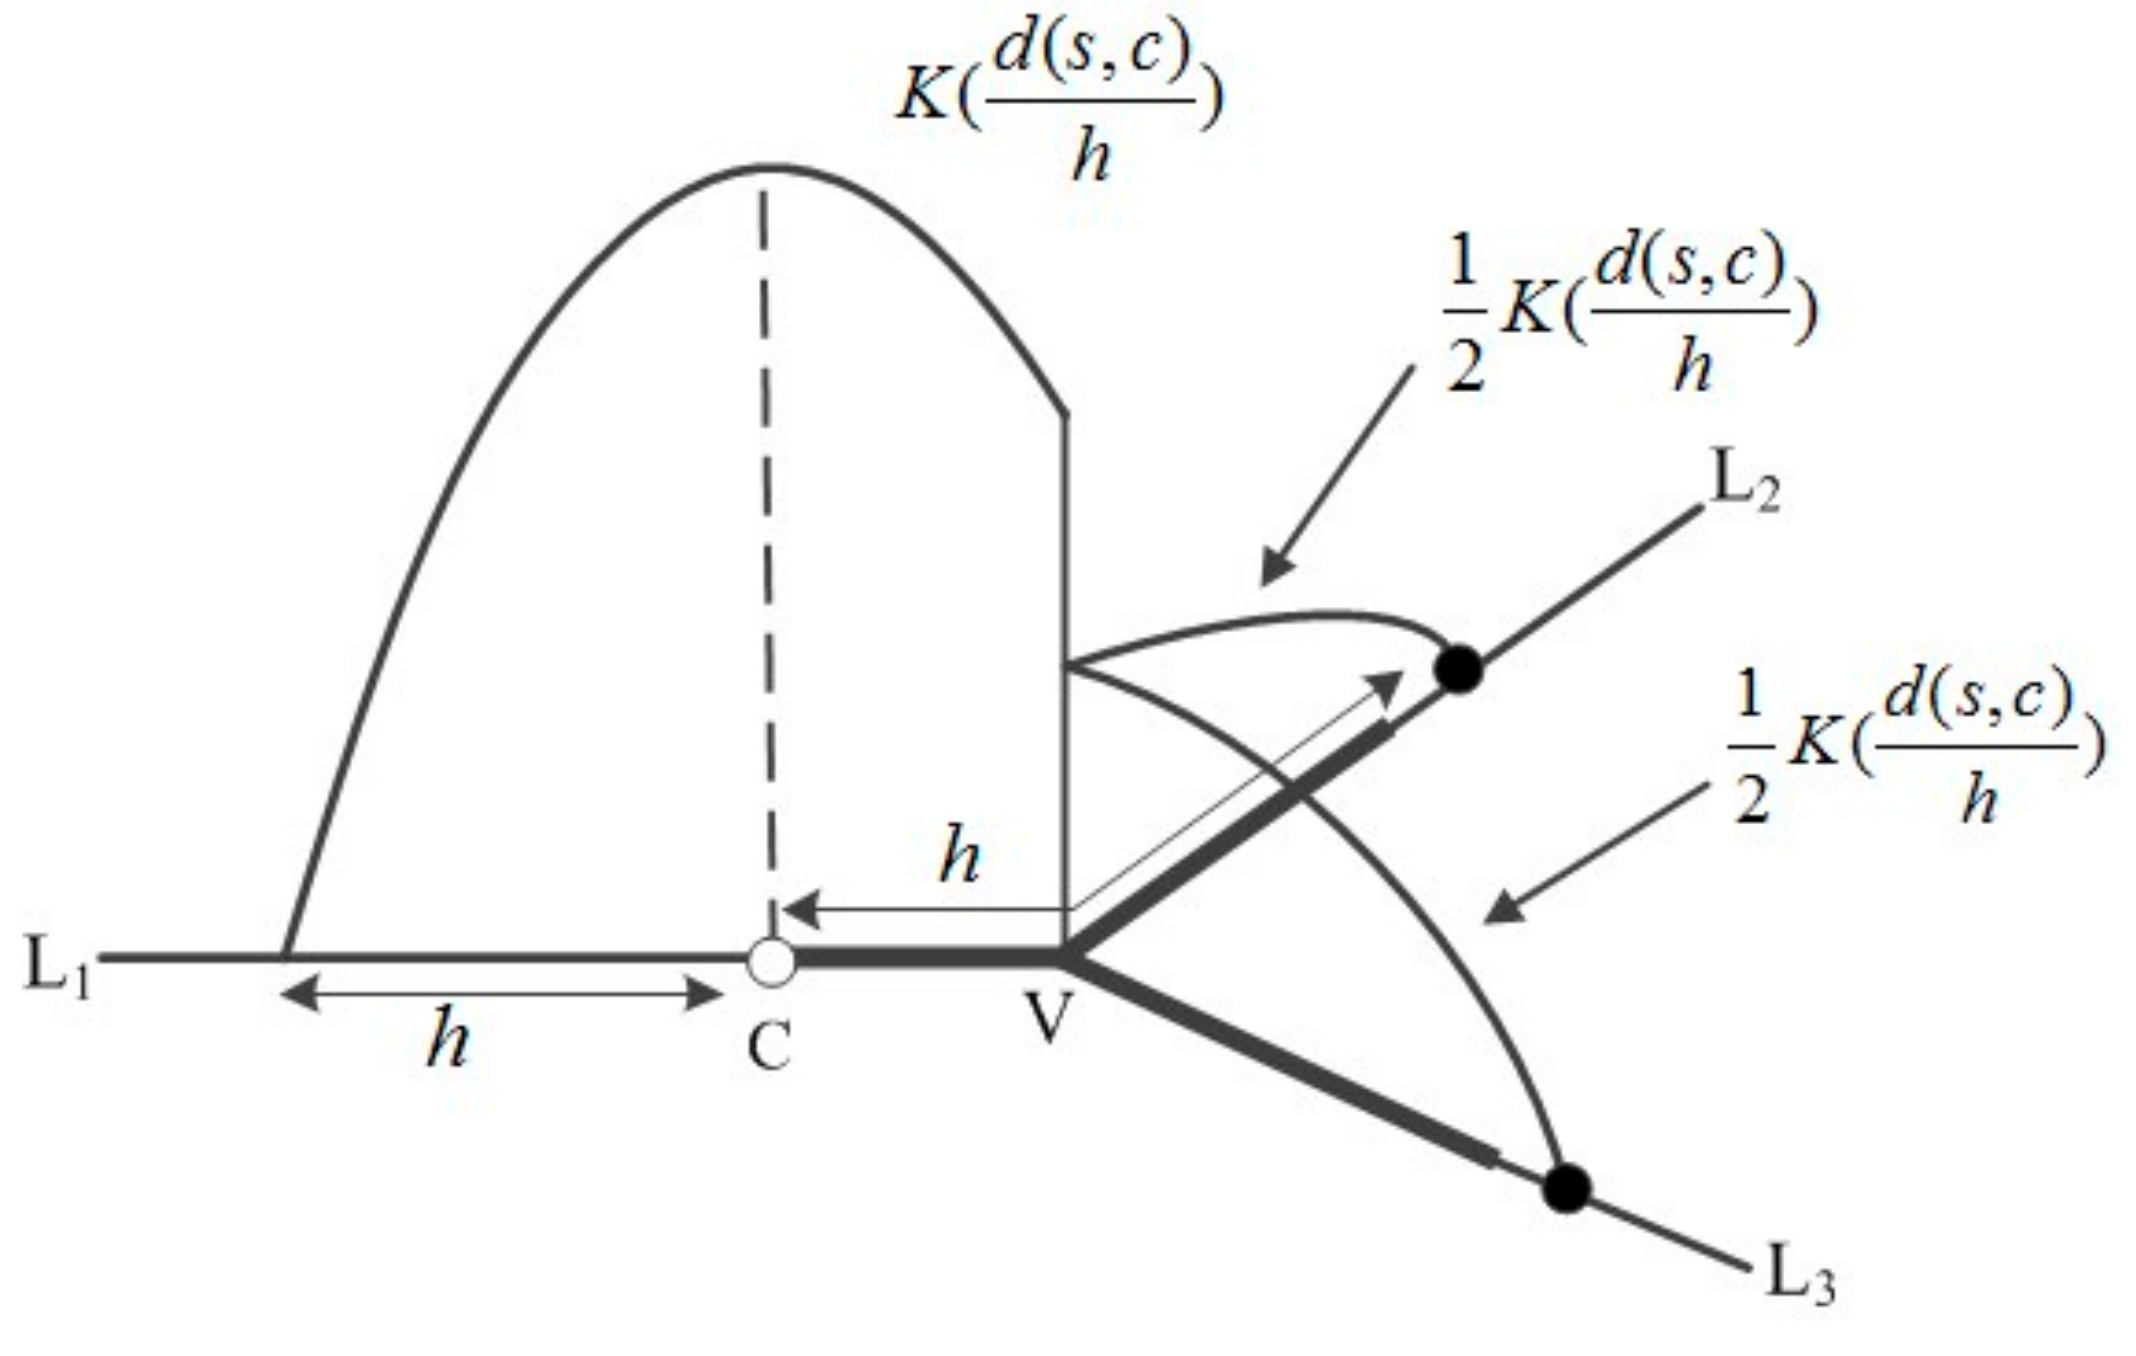
Calculate the kernel density of each fire point event within the bandwidth range. The kernel density value is calculated using a search process that spreads from center to surroundings, and then computes the kernel density value at each node.
(4)
Calculate the kernel density of each basic linear unit. For each fire point, calculate the kernel density value of each node within a given search bandwidth h. The BLU kernel density value is replaced by the average value of the kernel density for the first and last nodes.
The proposed algorithm is implemented in the ESRI ArcGIS environment, using Microsoft Visual C# programming language.

5. Results and Discussion

Utilizing the proposed methods, a case study from a real transportation network system with a set of fire accidents points in part of the city of Nanjing, China is performed.

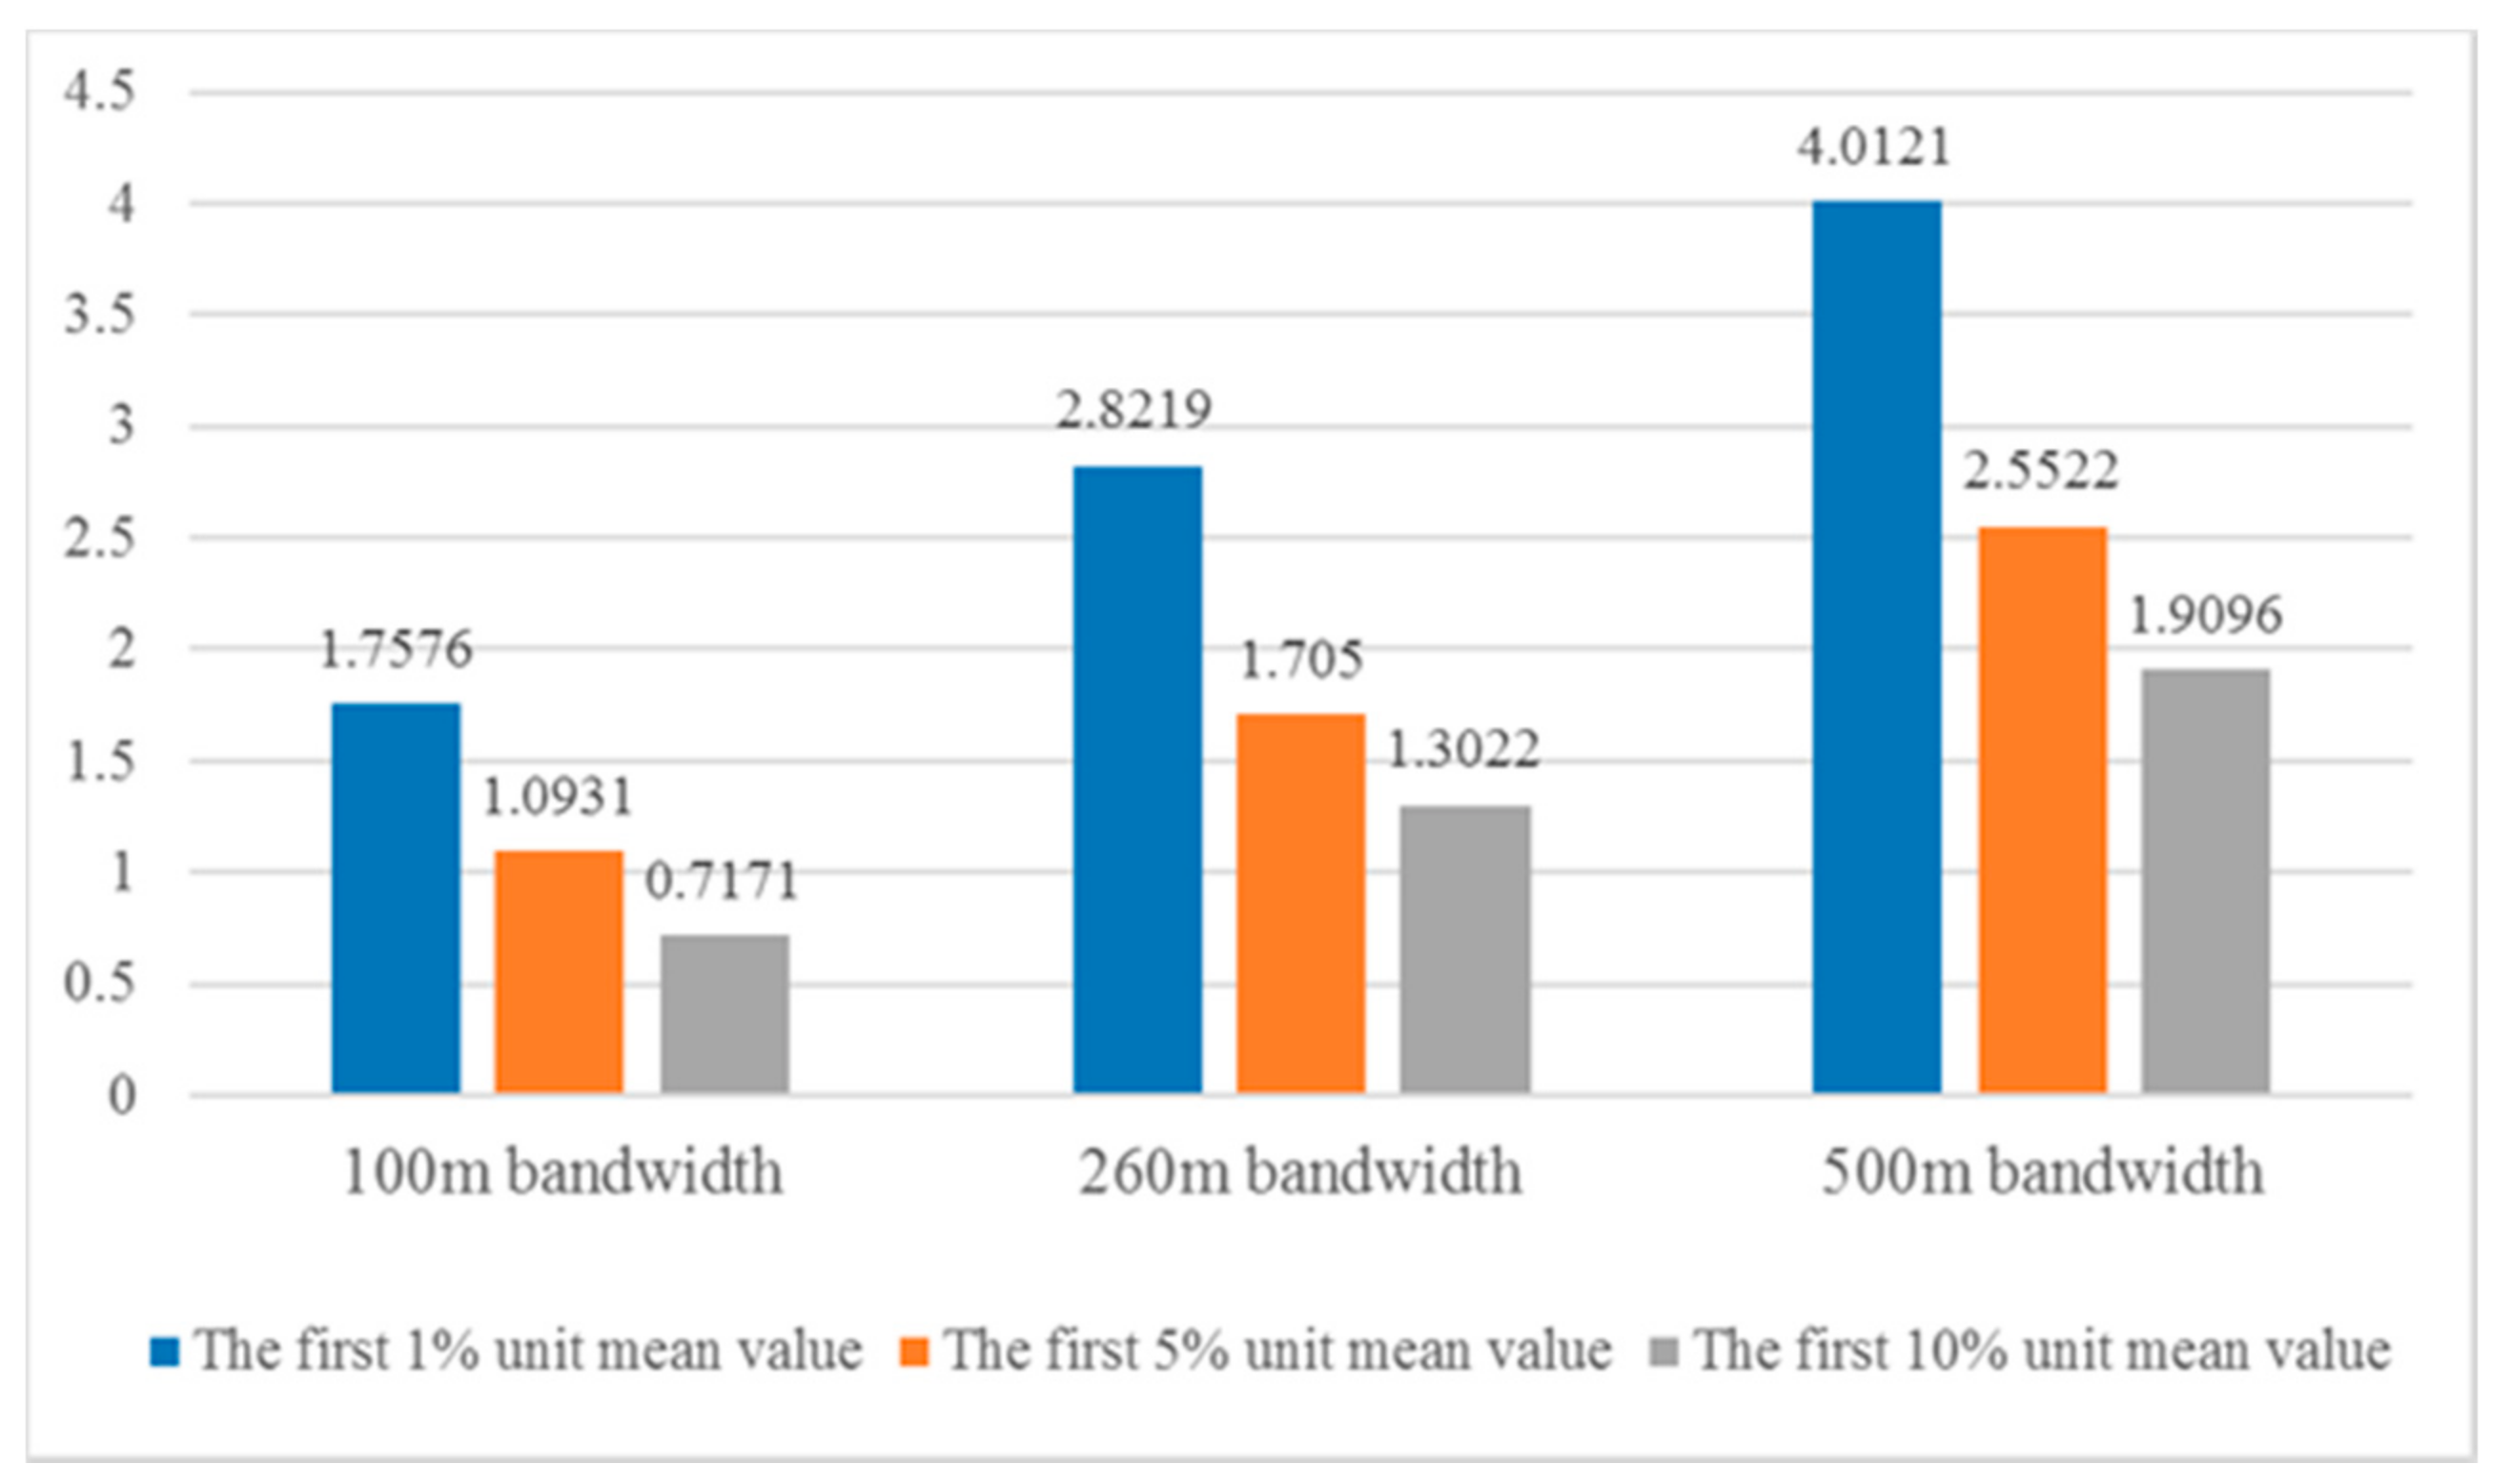
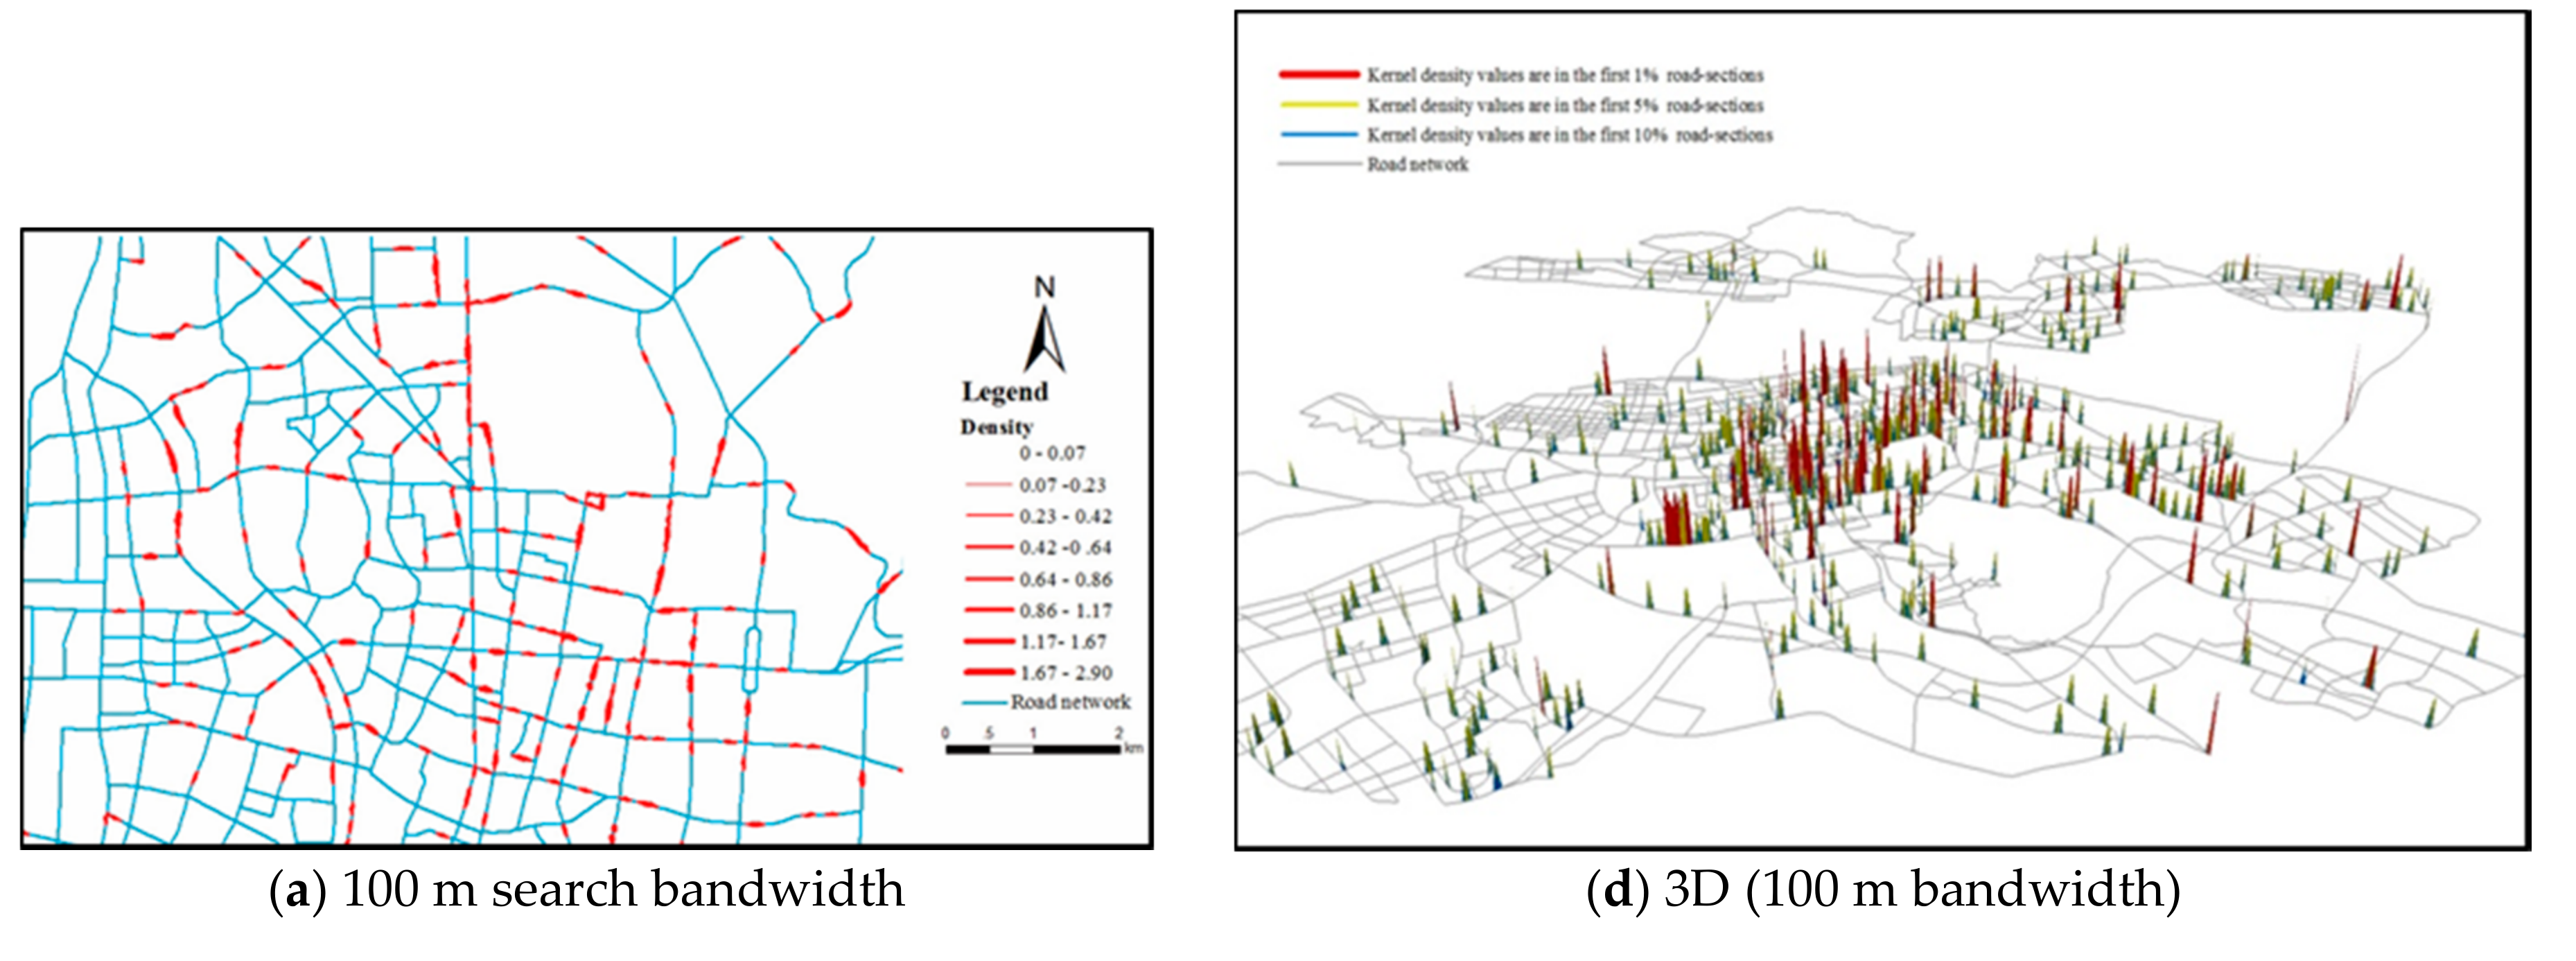
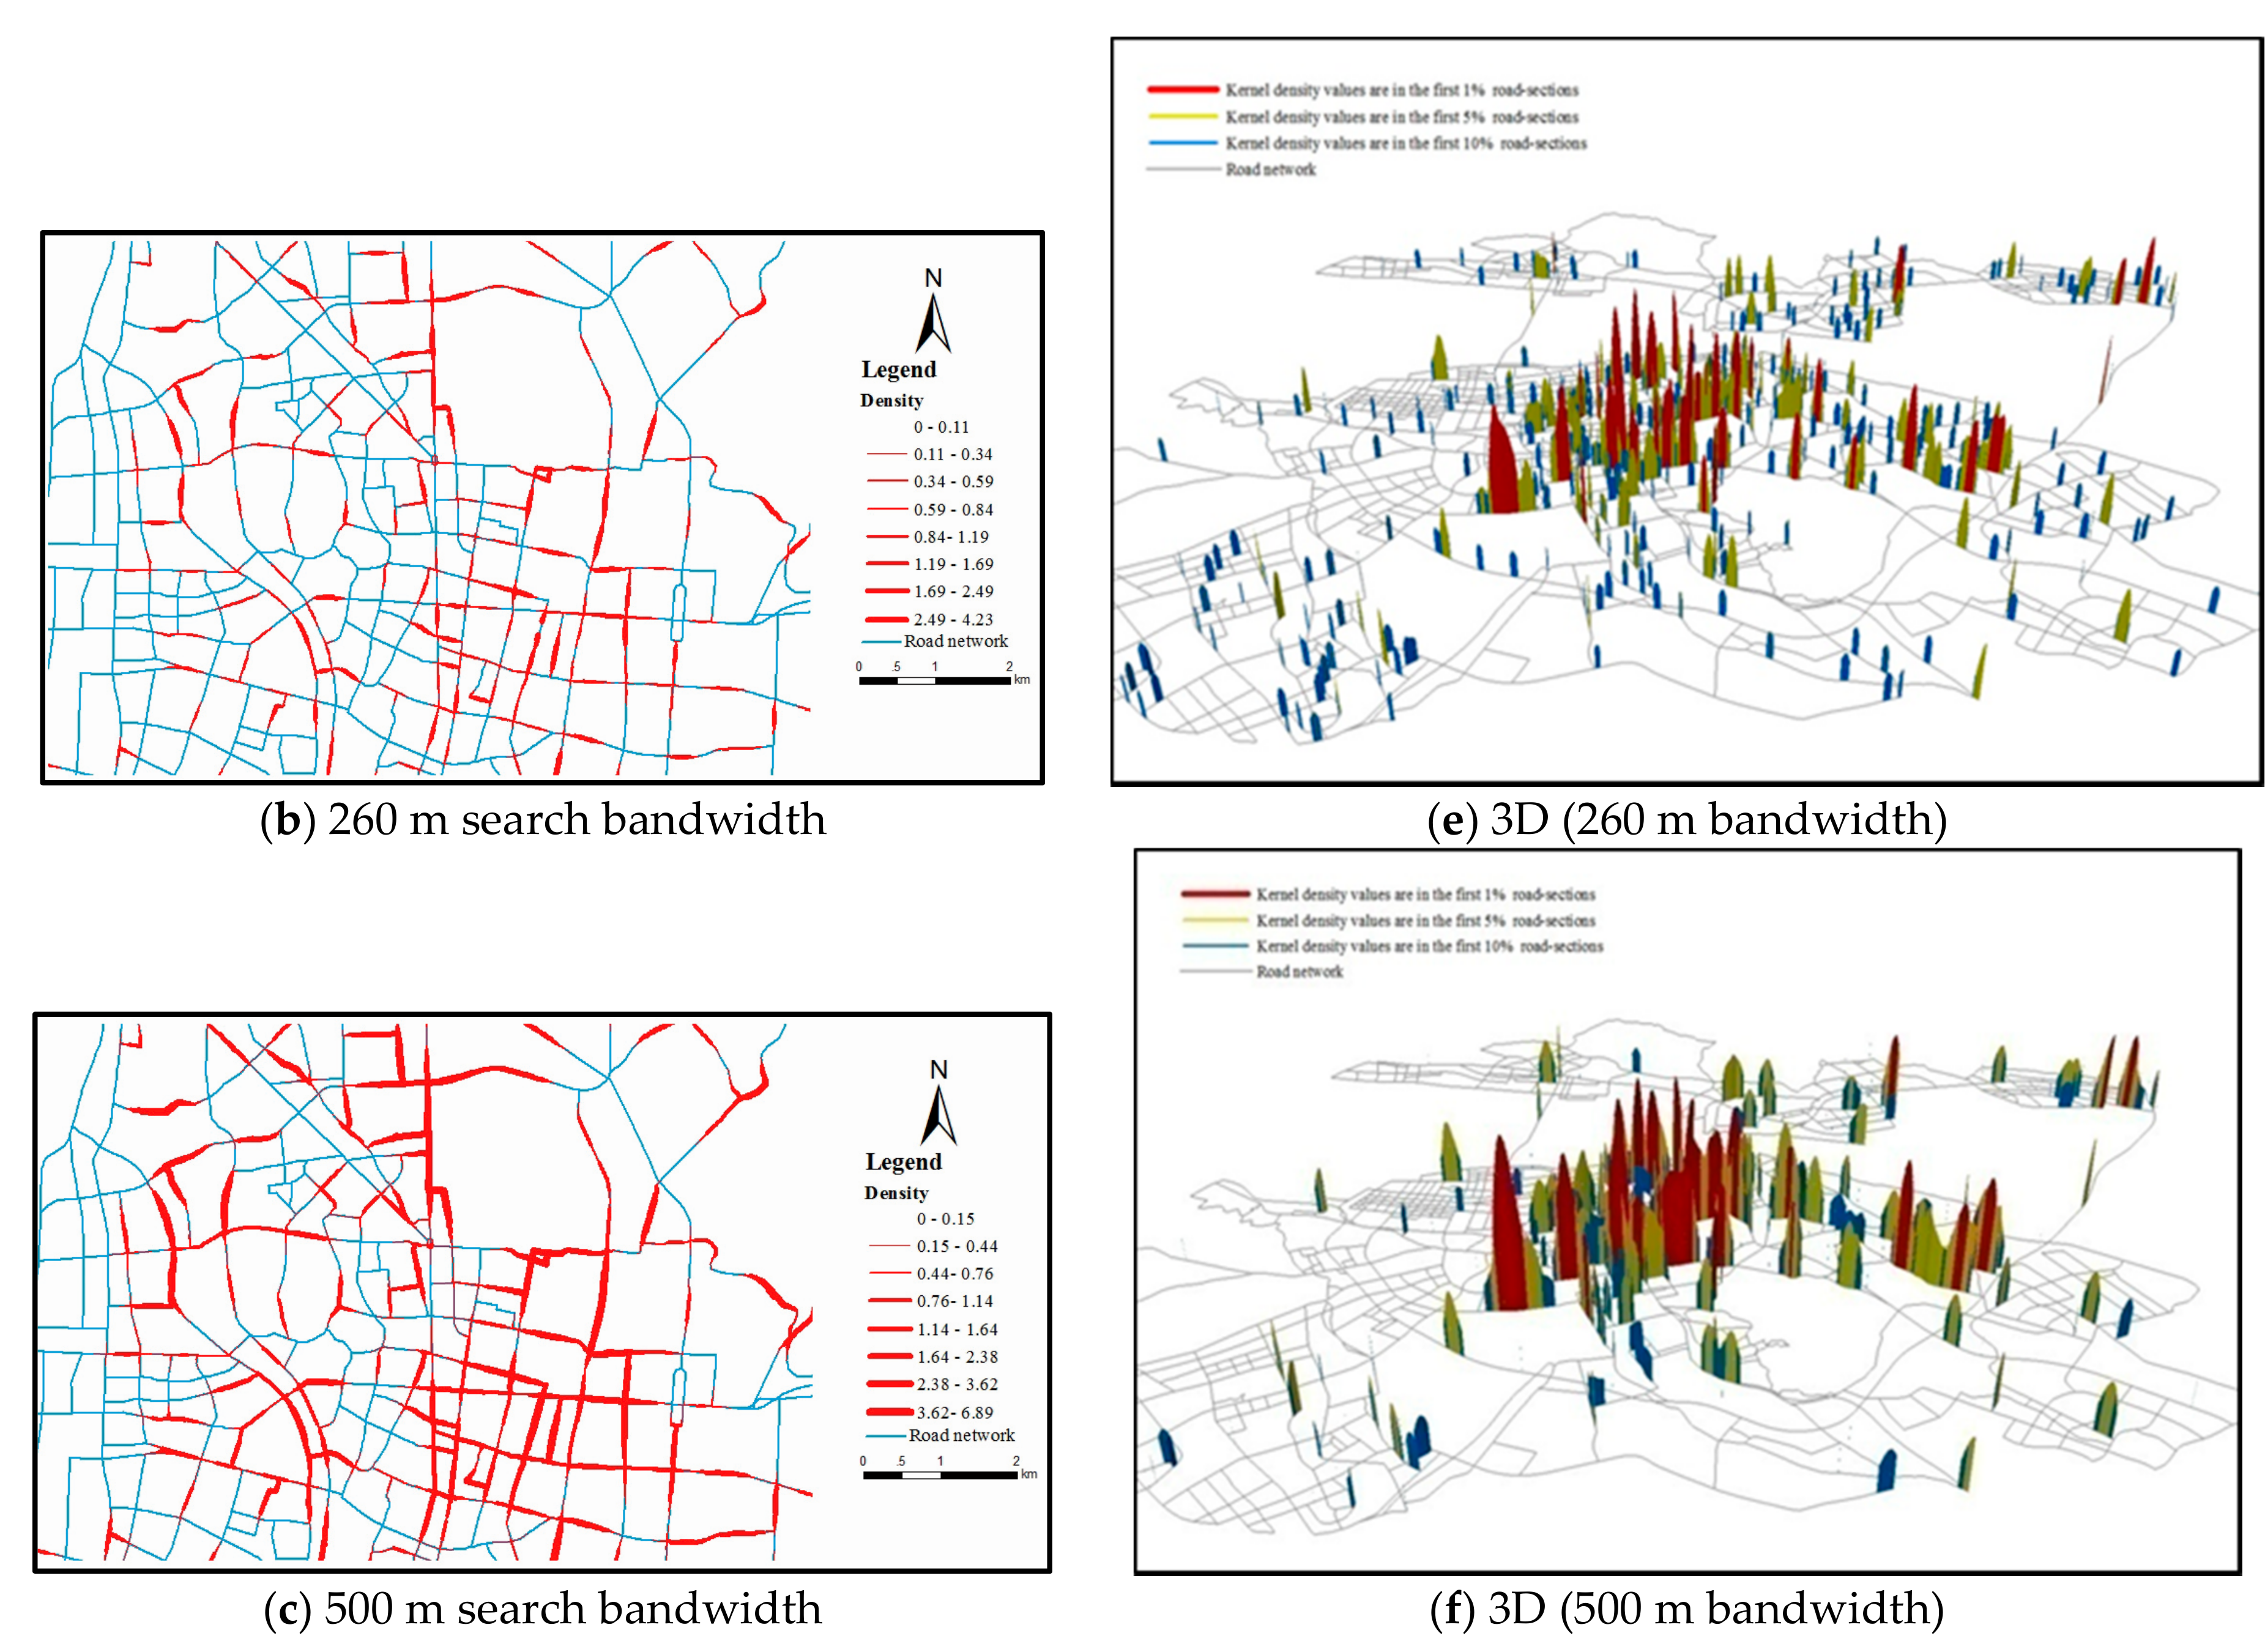
5.1. Impacts of Search Bandwidth on Density Pattern

The search bandwidth plays the most significant role in structuring the network density pattern. It determines the smoothness of the density result, which could reveal hotspots in different spatial scale. In view of the literatures, methods for selecting optimal bandwidths in 2-D homogeneous context have been proposed. They suggested that a 100–300 m bandwidth was suitable for urban analysis. However, they may not be suitable for density estimating in a network space [13,14,39]. In this study, Gaussian function is chosen as the kernel function. To detect the fire accident hotspots at a relatively finer scale, the length of the basic linear unit is set as 20 m. Fire accident point datasets are tested at fixed search bandwidths of 100 m, 260 m, and 500 m, respectively. With the increase of the kernel density bandwidth, the density results are changed obviously. The results of network kernel density in different intervals are shown in Figure 11. Density results of a local part of the study area and the entire study area under the three bandwidths are shown in Figure 11 and Figure 12. Figure 12 shows the density distribution throughout the study area, which is displayed by 3-D visualization of density surface. In the cases, each basic linear unit is stretched into a “wall” character, which is achieved from the unit’s density estimation. When the kernel density bandwidth is 100 m, the maximum kernel density of the basic linear unit is 3.828, the kernel density values distribution in the top 1% are between 1.1702 and 3.828, the mean kernel density in the interval reached 1.7576. When the sorting threshold is increased from 1% to 5%, the mean kernel density in the distribution interval is decreased from 1.7576 to 1.0931, a decline of close to 40%.
Similarly, when the sorting threshold is extended to the top 10%, the mean kernel density in the distribution interval is also reduced to 0.7171. As illustrated in Figure 11 and Figure 12, when the bandwidth is set to 100 m, as the sorting threshold expands, the mean kernel density decreases greatly. When the kernel density bandwidth is 200 m, the average kernel density values under different thresholds decreased slowly. When the density bandwidth increases to 500 m, the pattern in Figure 12 shows that the peaks and valleys of the kernel density curves in the different color intervals falling more smoothly, and the change of “small hilltop” in Figure 12 is more obvious and continuous. In summary, in this experiment, 500 m bandwidth is considered optimal; this setting enables the kernel density result to retain enough details, as well as to reflect the overall trend of spatial distribution of fire accidents locations.

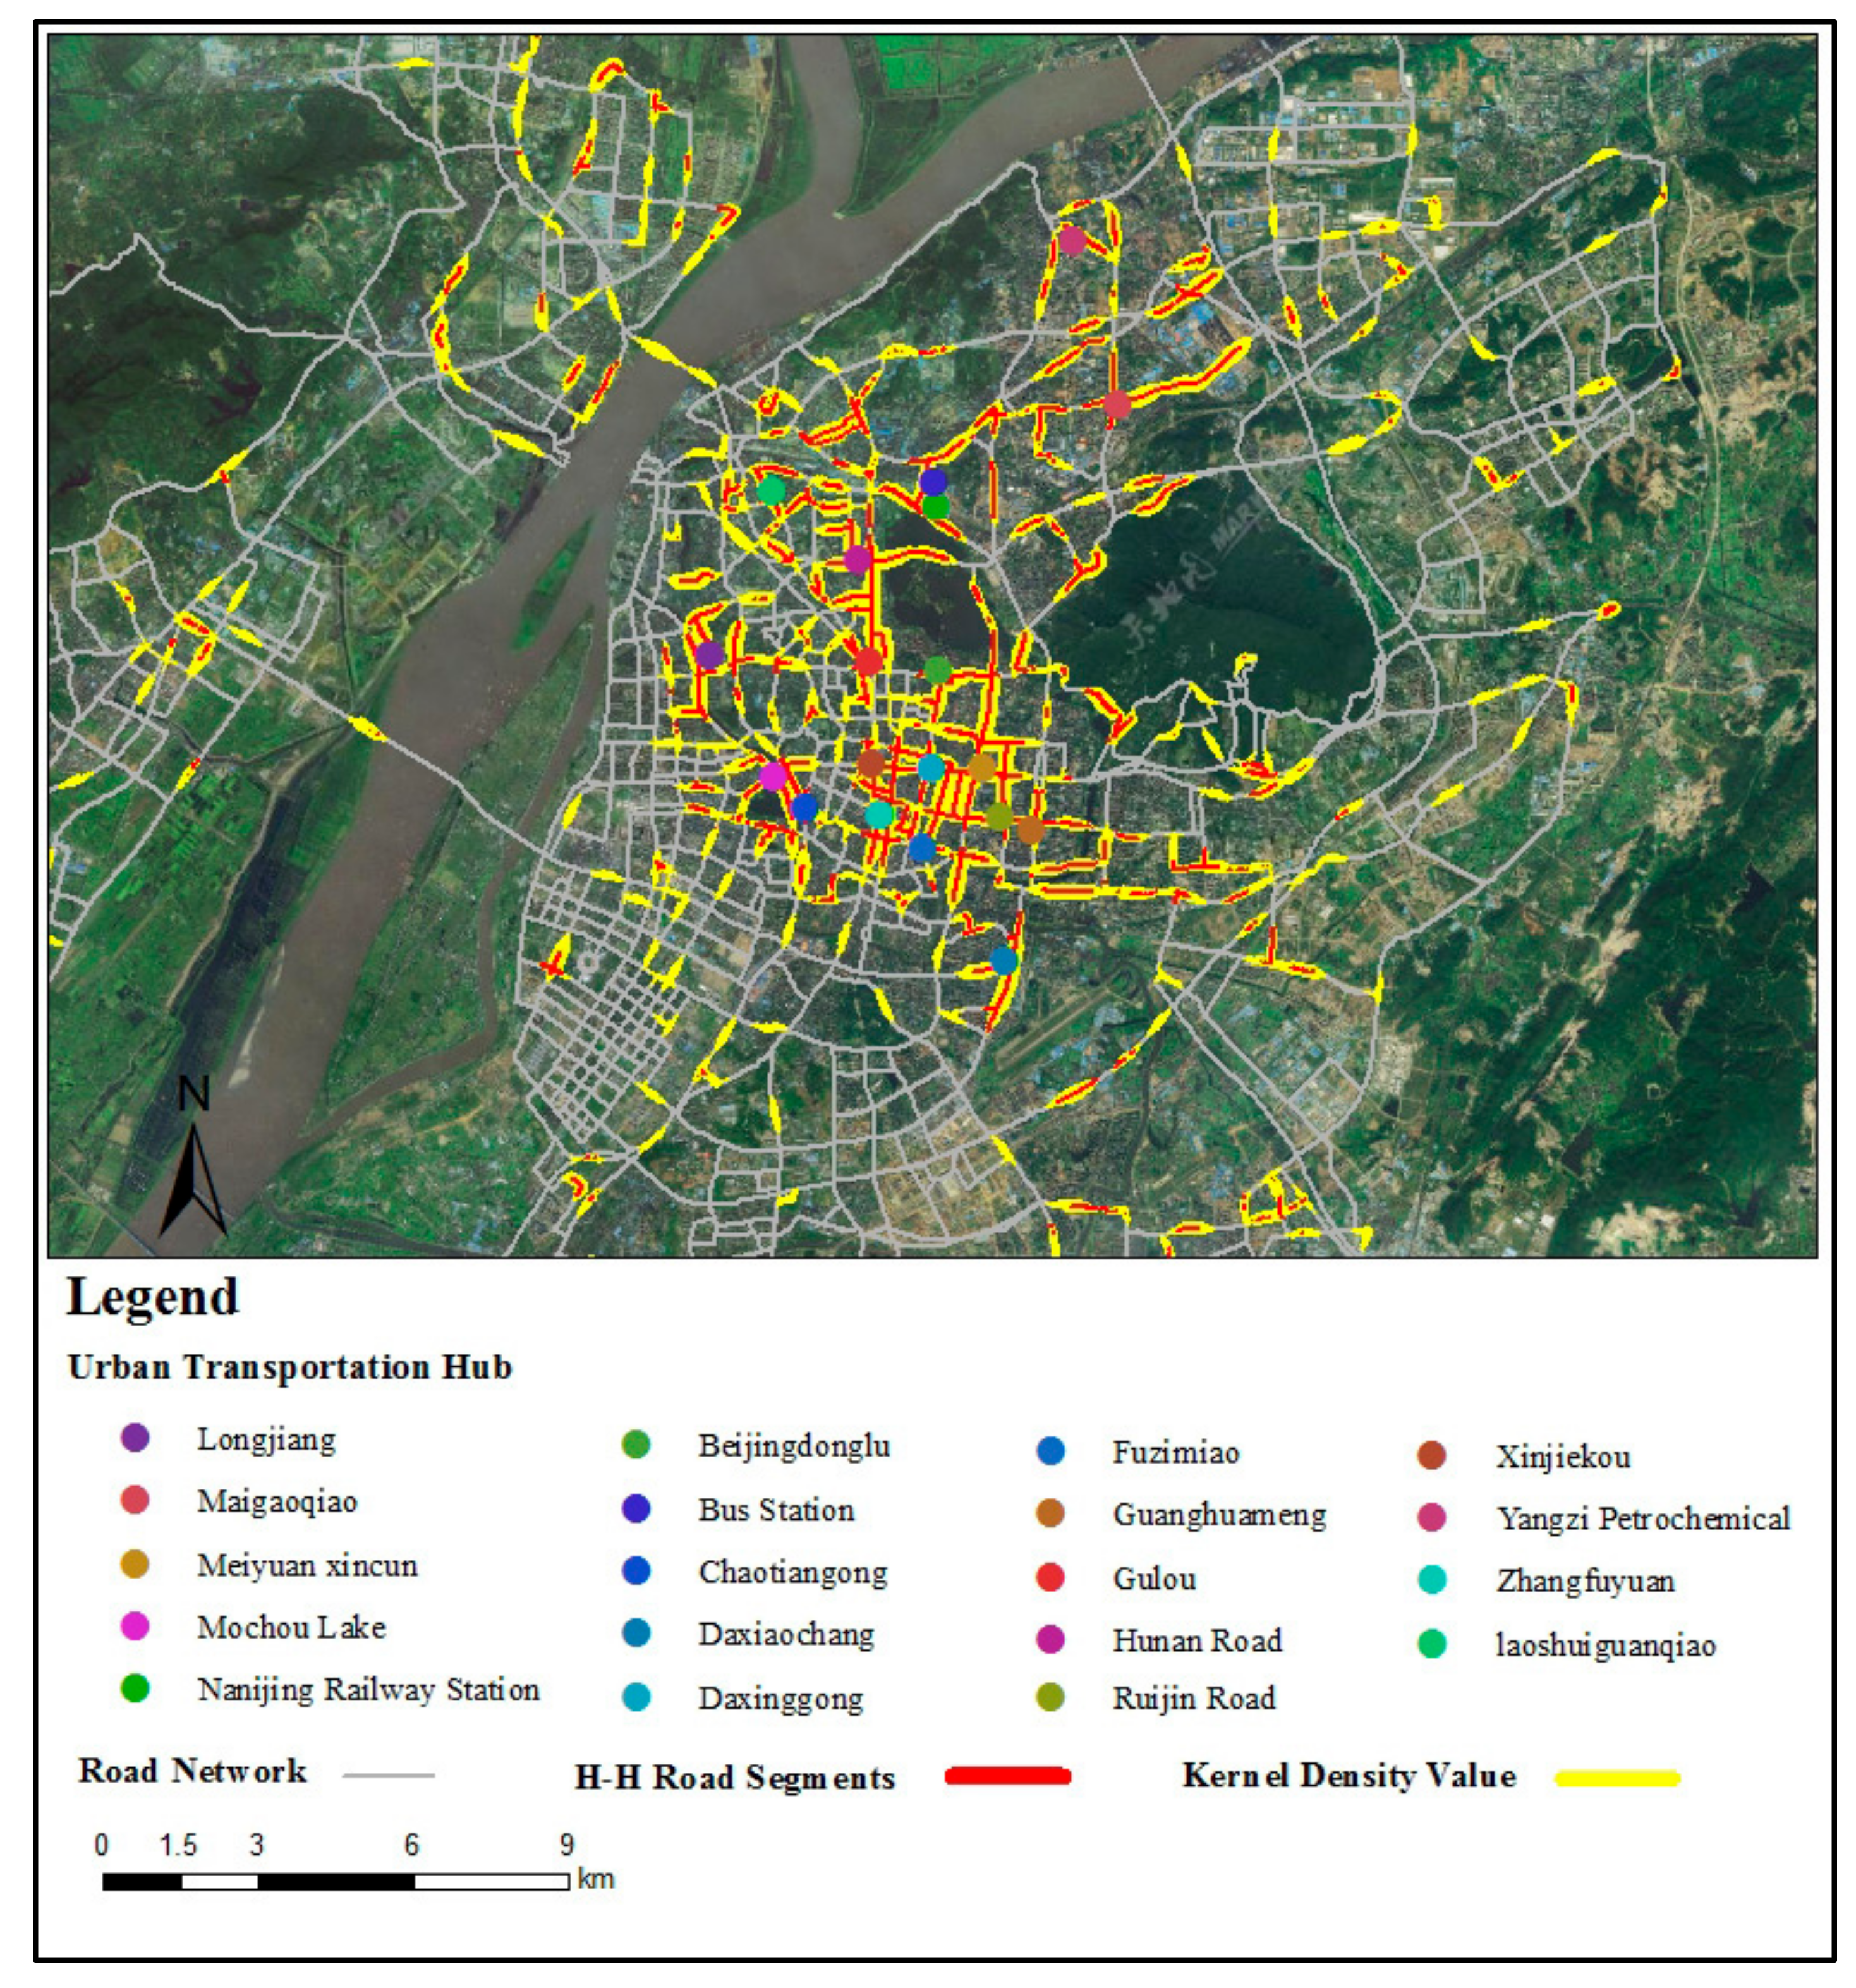
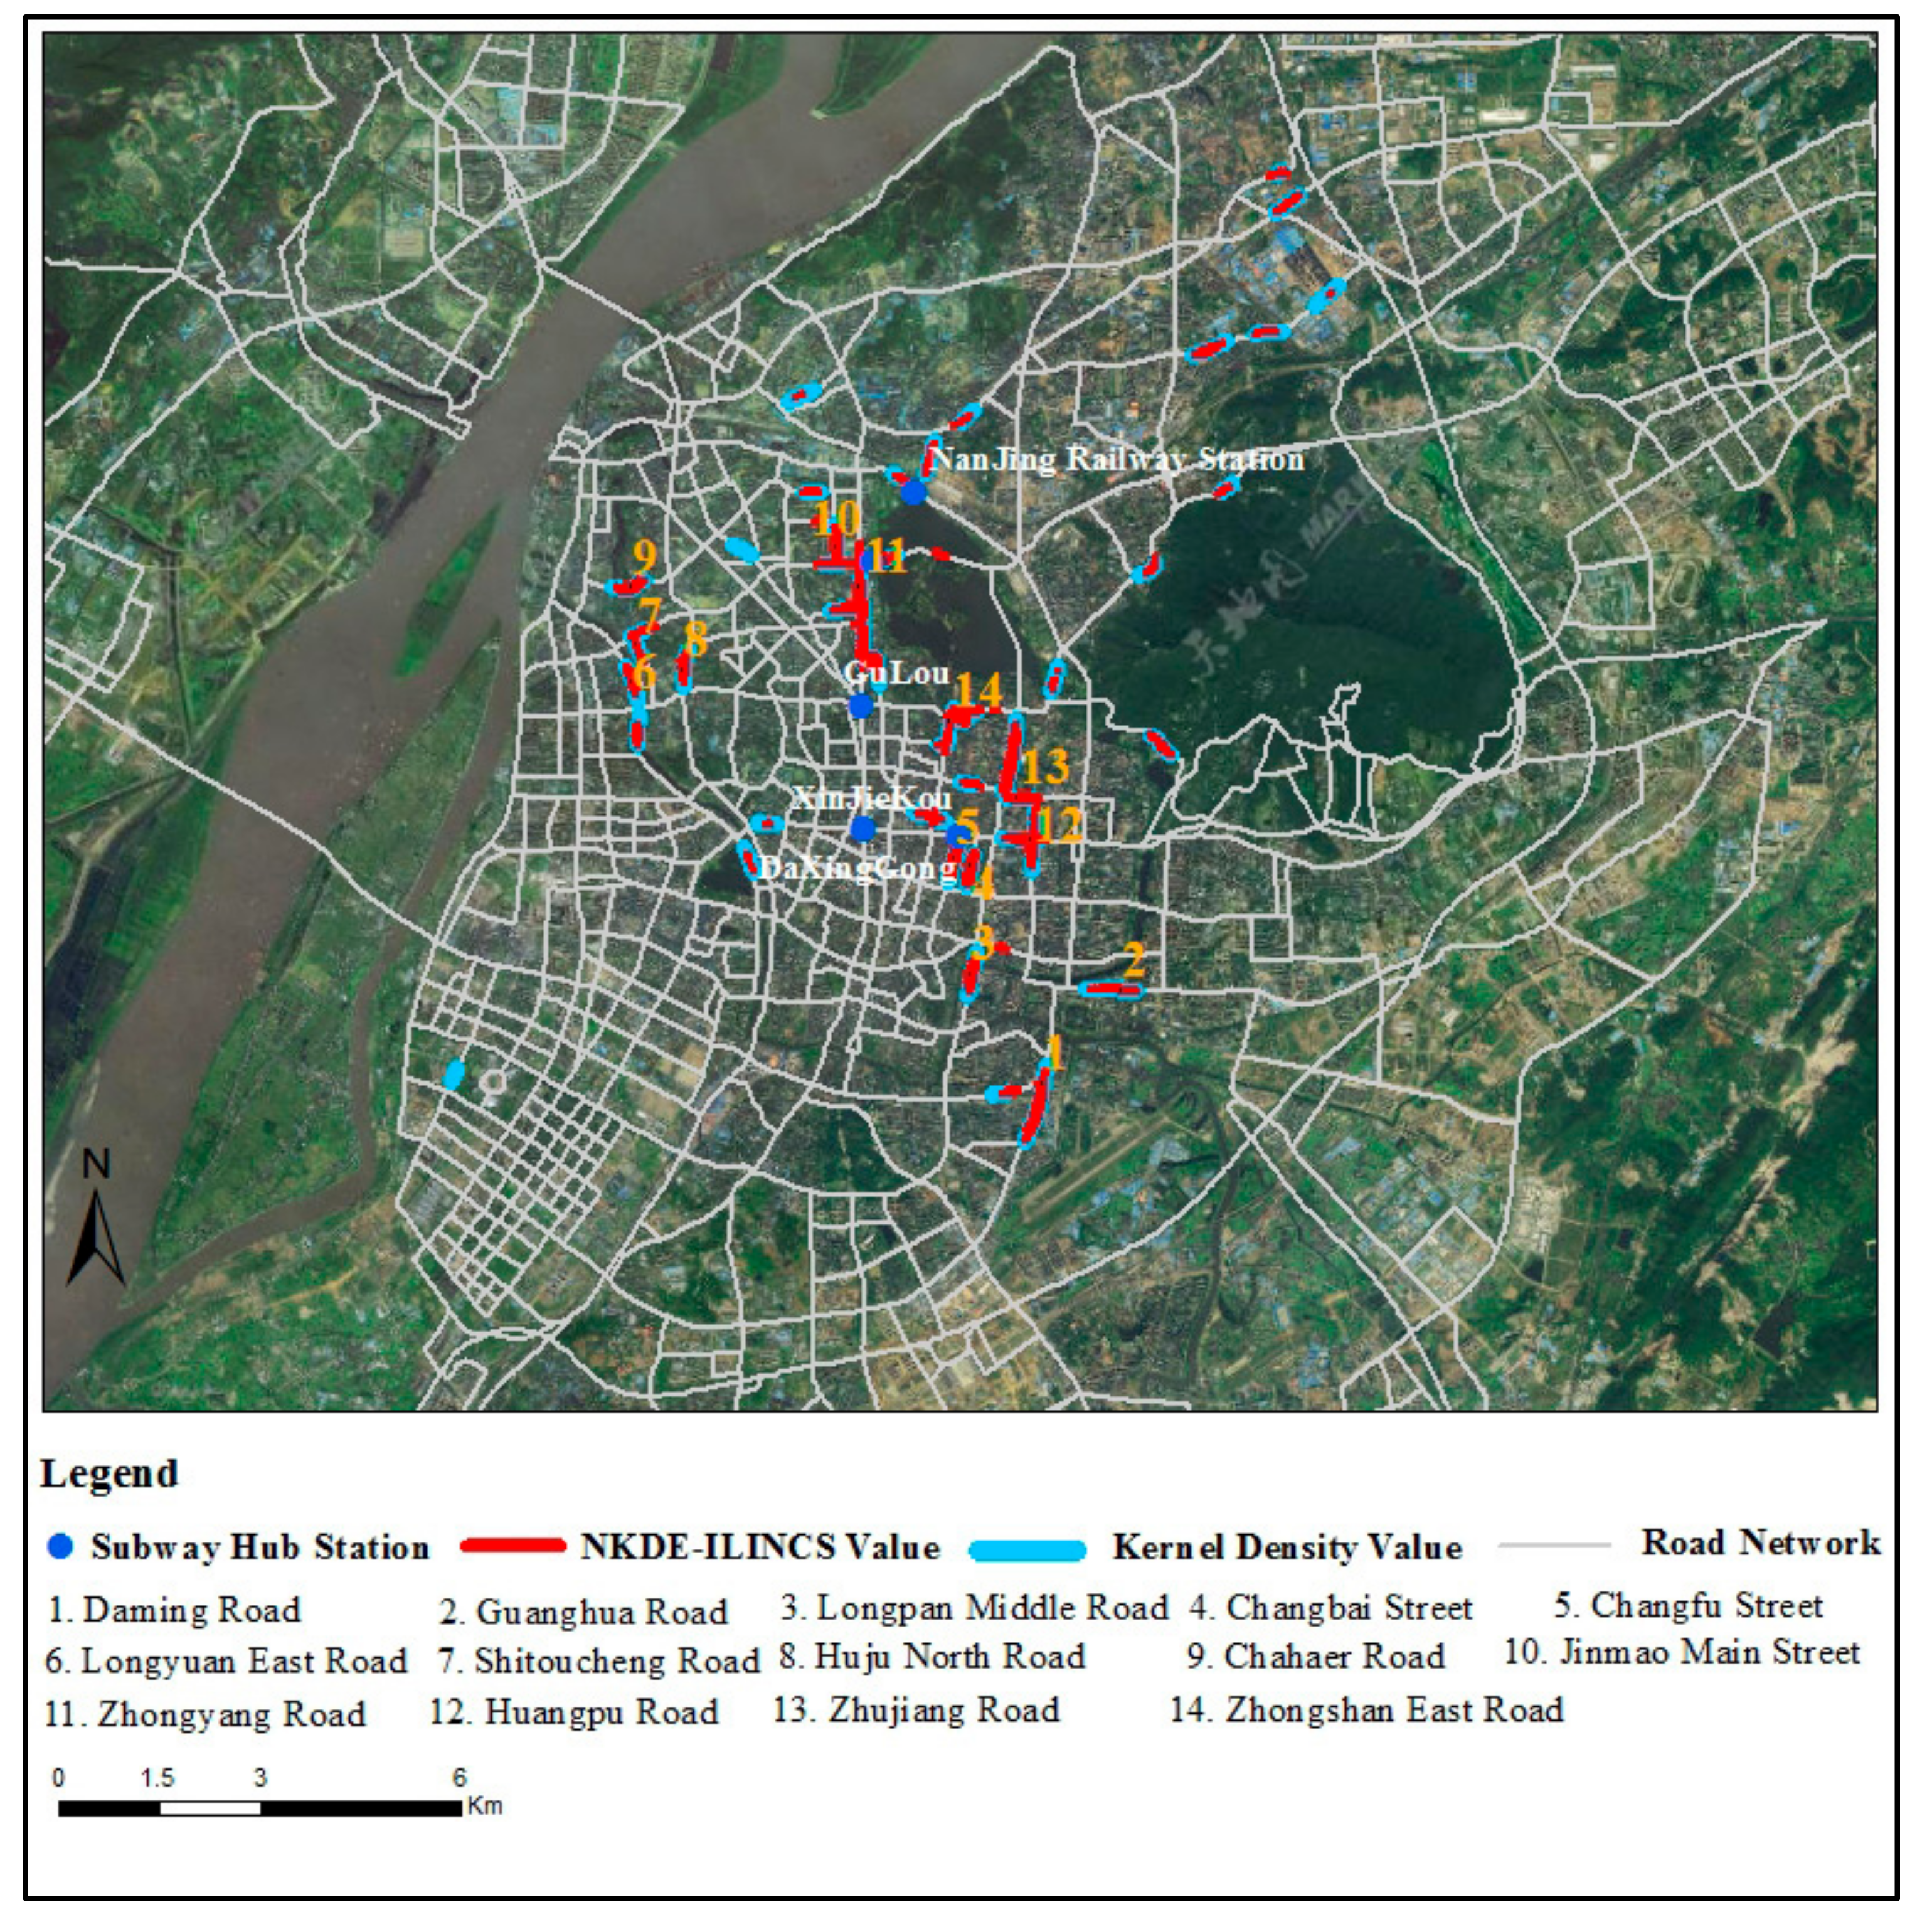
5.2. ILINCS Based on NKDE

In this paper, two types of local-scale spatial analysis methods were incorporated: the network-constrained kernel density estimation and the local Moran’s I method. After the density value is calculated for each basic linear unit using NKDE, it is then used as an attribute for computing the ILINCS to explain the method of NKDE in a quantitative way. The spatial weight matrix was chosen to be node-based in the local Moran’s I calculation. The significance level is set as 0.05, and the simulation count is set to 99 times.
The results of the local Moran’s I calculation is shown Figure 13. In this research, it has been proven that spatial cluster of fire accident points exists in the road network. The results indicated that the aggregation of 61.6% road segments is not significant, and the other patterns are distributed from low to high probability. Overall, 26.3% road segments belong to low–low aggregation model, 1.2% presents low–high aggregation, 10.7% exhibits high–high aggregation and 0.2% is high–low aggregation. The z values calculated by the Moran’s I were in the interval [−1.168, 22.464] [40]. To detect the urban fire centers, the NKDE-ILINCS method using kernel density as input disclose and identify high–high road segments successfully compared with in planar space, which is more reasonable and approximate to the reality.

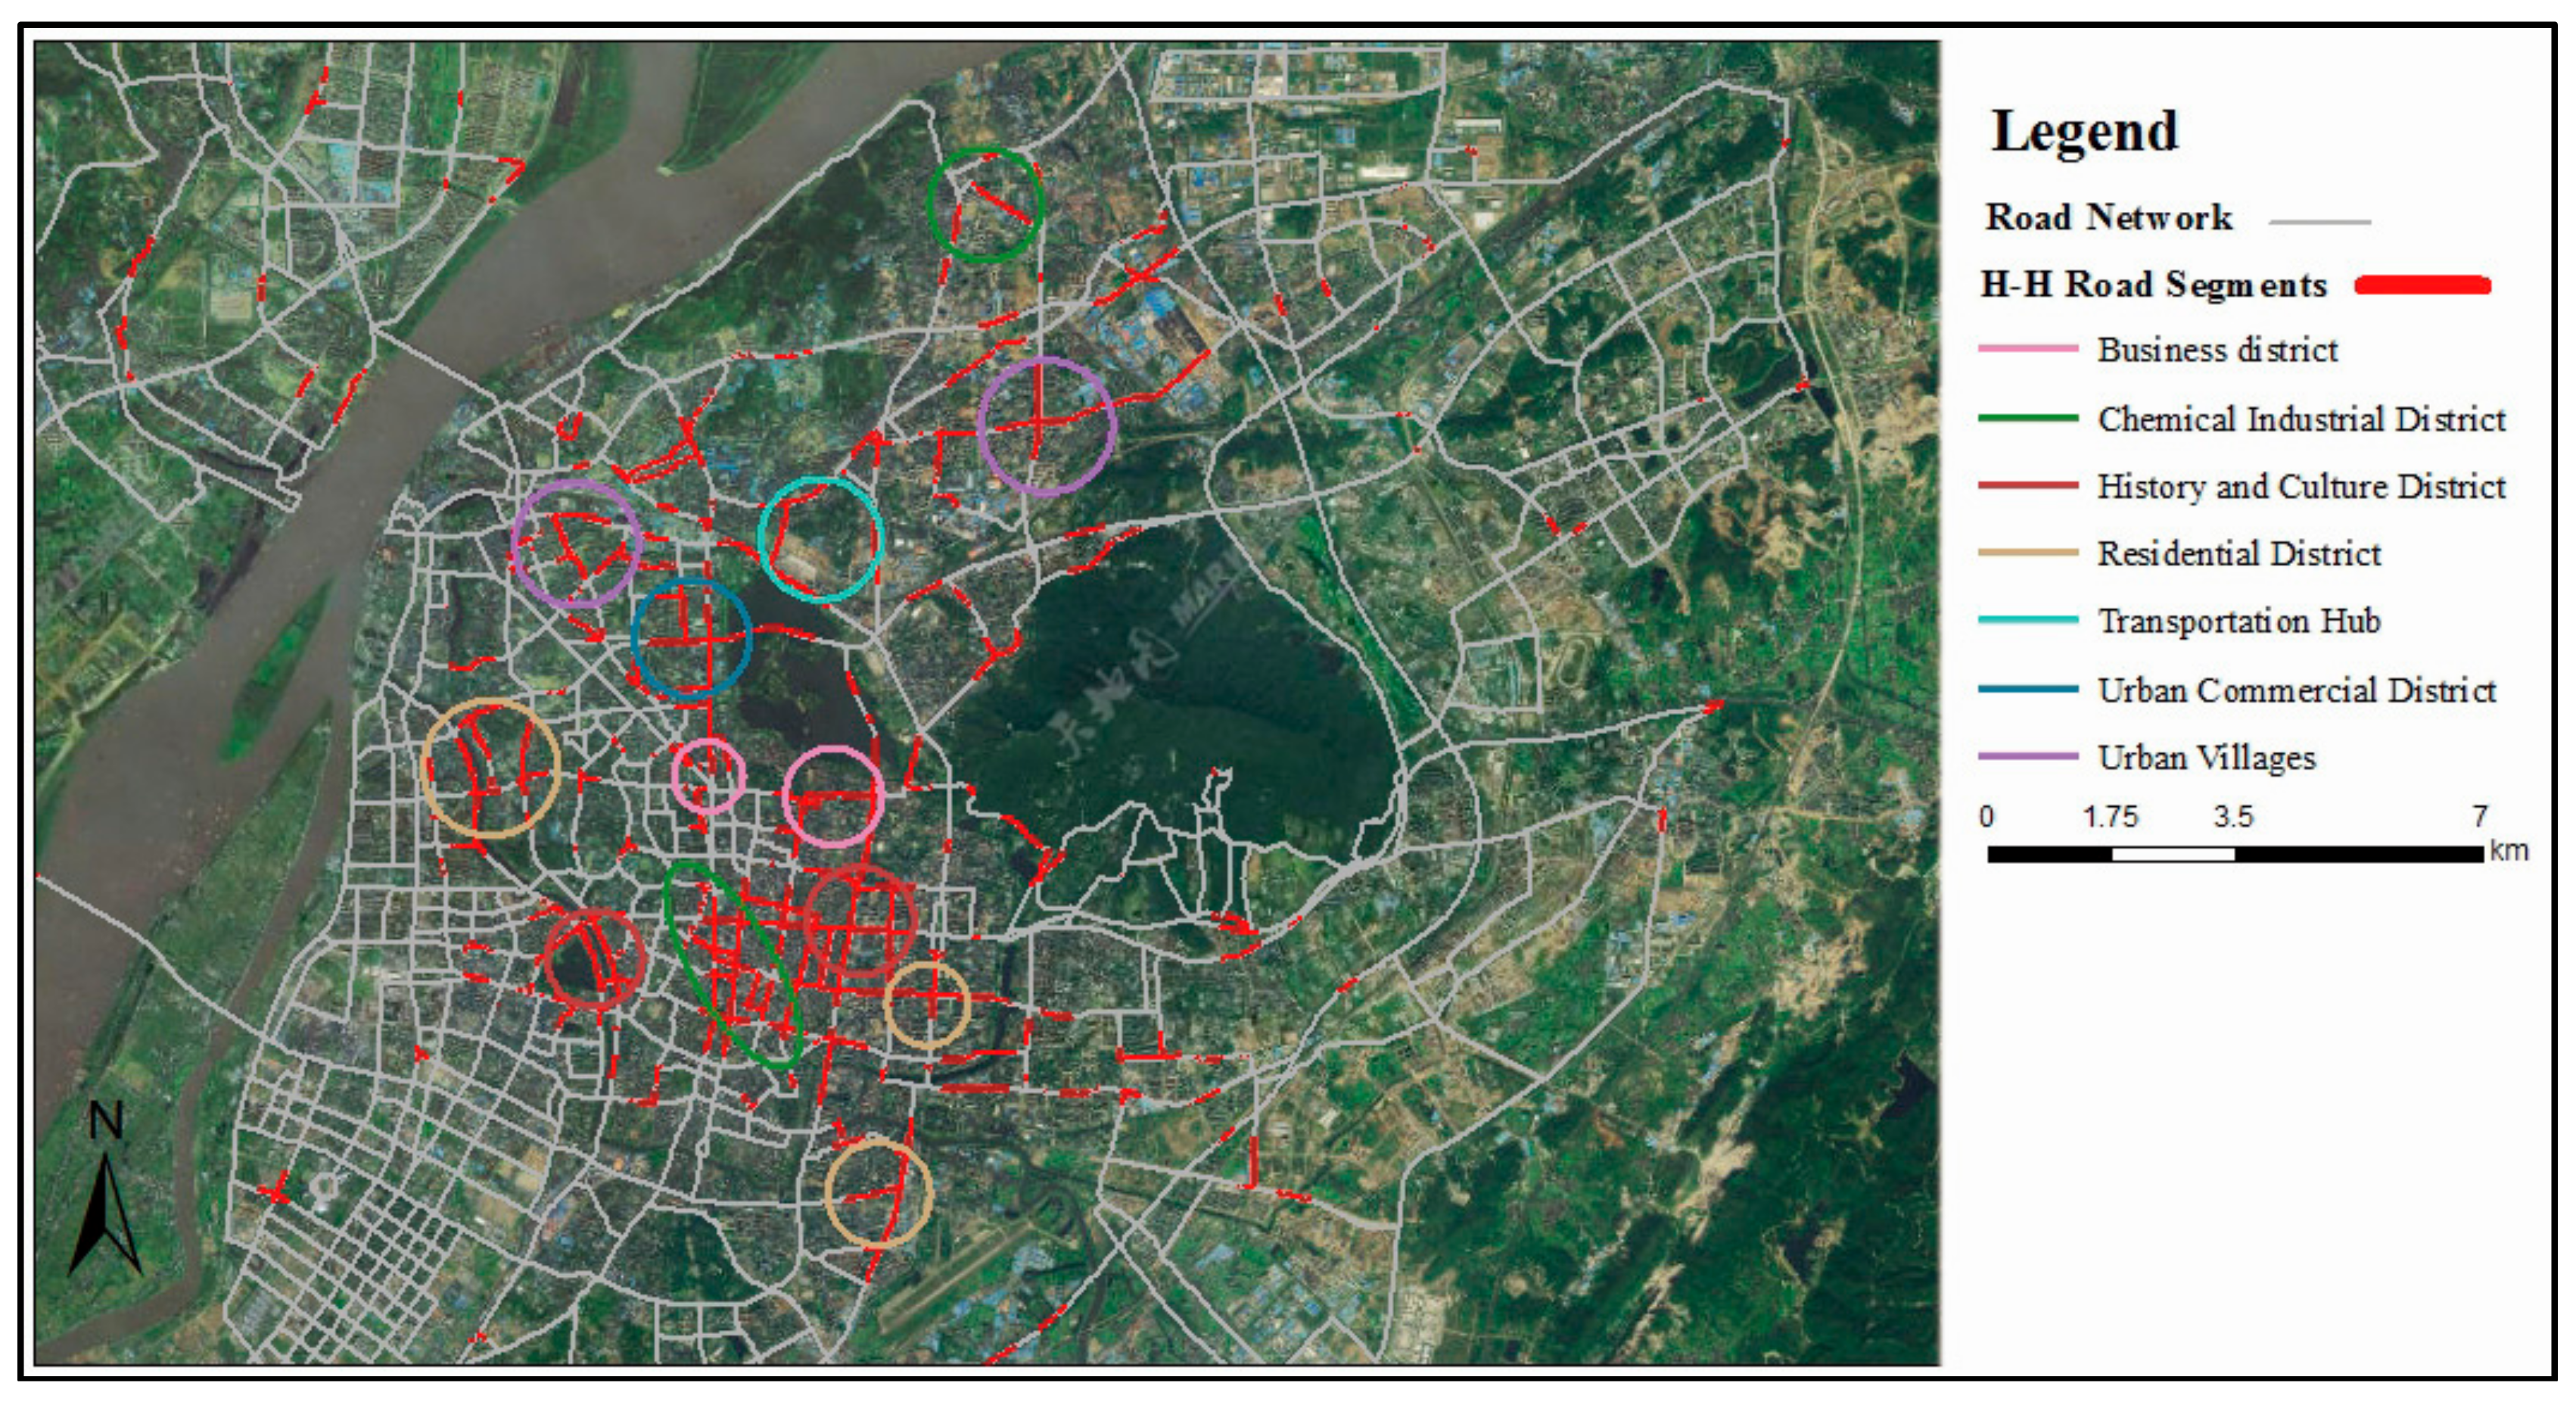
5.3. Detection of Fire Higher-Risk Locations Based on Network-Constrained

To verify the most appropriate methods to detect cluster pattern, four contrast experiments were conducted. As can be seen in Table 3, input attributes in the first two experiments were the kernel density value, while, in the last two experiments, they were fire events with a counting method. To detect High-High (H-H) road segments in different levels of statistical significance, Monte Carlo simulation was repeated 99 times via a conditional permutation process. Results in Experiments 3 and 4 denoted that the ILINCS method failed to identify the H-H road segments, while the NKDE-ILINCS method using kernel density as input in Experiments 1 and 2 could disclose and identify H-H road segments successfully. Moreover, Experiment 1 can identify the H-H road segments without considering more details to keep segments in a coherent and valid length [41]. In this paper, we recommend using the combination of H-H road segments and z-score to detect fire higher-risk locations. When the z-score is greater than 4 (see Figure 13b), the road segments are significantly risky under the significance level of 0.05. Here, the distribution of H-H segments under significance level of 0.05 is shown in Figure 14.
Aiming at network spatial phenomena, we use local spatial-autocorrelation method to identify the event intensity at a finer scale; the analysis results show that the fire higher-risk locations of Nanjing are mainly concentrated in six areas. (1) Urban Business District: This area is densely built with many tall buildings; the fire risk is reflected in the complex structure and function of the buildings, which makes it difficult to carry out fire-fighting. The representative regions shown in Figure 15 are located at Gulou and Beijingdonglu. (2) Urban Commercial District: The commercial center is a hub of the city of all kinds of commercial activities including shopping, dining, entertainment, etc. Fire risk is manifested in the concentration of combustible materials and centralized people, which make the analysis of the fire risk and personal evacuation more difficult. The typical regions in Figure 15 are located at Xinjiekou, Fuzimiao and Zhangfuyuan. Xinjiekou is the biggest commercial center in Nanjing, as well as an important leisure and tourist center, attracting an immense number of passenger flows. (3) Historical and Cultural Reserve District: These areas in Nanjing are mostly located at Chaotianmeng, Daxinggong, and Mochouhu, where narrow streets and lack of public fire facilities, and they are also sensitive and vulnerable places for the fire in the city. (4) Residential District: Residential area, as the most frequent contact point with human lives in the daily life, ranks first in terms of the population scale in urban areas of Nanjing. Among all types of fire, residential fires account for the largest proportion and are primarily caused by careless use of electricity and fire. At present, the biggest difficulty of fire rescue is the blockage of the fire passage; as a result, fire trucks cannot get close to fire locations, thus delaying the golden time of fire-fighting. The most concentrated residential regions in Figure 15 are located at Longjiang, Guanghuameng and Dajiaochang. (5) Urban Village: Village in the city is free from urban management, mainly embodied in the building density, illegal construction and inadequate public fire facilities. These problems have brought tremendous hidden danger to the fire safety of urban villages. The most typical urban village in Figure 15 is distributed in Maigaoqiao. Maigaoqiao locates in the north of the main urban areas of Nanjing, with a large number of local residents and foreign population. (6) Chemical Industry Park: Chemical enterprise belongs to dangerous place, in terms of hazard degree, once it breaks out of the fire, and will cause major property damage and casualties.
The advent of trajectory data offers an unprecedented chance to gain road traffic conditions, which can be used to study the spatial relationship between road network and fire accidents from the dynamic traffic perspective. In this section, we combined NKDE-ILINCS and road congestion degree to assess the impact of congestion on fire-fighting. According to “city fire station construction standards”, fire engines must reach the responsibility area within 5 min. The fact is that fire vehicles in Nanjing generally require more than 10 min, the main reason being road congestion causes fire trucks to be unable to do anything, especially during rush hour. Therefore, road congestion must be taken into account when exploring higher-risk road sections. As depicted in Figure 16, the congested road segments are concentrated in the city center, which have higher ILINCS values than the suburbs of the city. The causes of these problems are that the layout of the fire station locations in the central city is unreasonable, the number of stations is insufficient, and the existing fire stations are responsible for an excessively large area.
Here, the fire higher-risk road segments were ranked according to the ILINCS value and network kernel density value from low to high; the top 14 higher-risk road segments are shown in Table 4.
According to Table 4 and Figure 17, the top fire-risky road in Nanjing is Zhongshan East Road, with a considerably high-density and the largest z value. There are three major reasons. First, these road sections are located in the old city area of Nanjing, where many old and historic buildings exist. These houses have low fire resistance and the potential safety hazard is outstanding. Second, with the growing of electrical equipment service life, the risk of fire accidents as result of aging will be higher. Especially in the recent several years, along with the increasing of electrical load, the fire accidents caused by electrical circuits are becoming more and more serious. Third, the roads in the old city are narrow and the fire passages are not smooth. In the event of a fire, the fire-engine cannot approach the building. The most concentrated fire-risky places are located near Zhongyang Road and Jinmao Main Street, where various institutions, business enterprises and a large number of government headquarters are clustered. The high concentration of population and economic activity results in the emergence and spread of urban fire in these areas.
In addition, underground space is also high hazard areas of urban fire. For example, Xinjiekou is situated at the intersections of four important avenues, having seven bus stops with 26 bus lines crossing, and is the interchange station of subway lines 1 and 2. However, due to the unique characteristic of relative narrow, economic loss and traffic injuries will be bigger than surface structure once subway fire accidents happen. As shown in Figure 17, subway stations such as Gulou and Xinjiekou, and Nanjing Railway Station belong to the high-risk locations of urban fire.

6. Summary and Conclusions

In fire rescue work, the spatial distribution pattern of fire accidents is important reference information. It not only relates to the determination of urban fire hazardous area, but also affects the formulation and implementation of fire safety regulation work. For instance, by knowing where and when fire accidents usually occur, local government departments can create more efficient laws and regulations, and fire departments can strengthen the construction of fire stations to achieve the optimal allocation of fire facilities. Compared with 2D planar space, network space has provided a new method for local-scale spatial analysis. It presents a new perspective to more accurately observe how human activities shape the structure and patterns of fires in urbanized areas. Most importantly, many kinds of geographical events associated with urban activities are constrained by road networks in the real world. With the widespread adoption of satellite positioning technology, trajectory data of floating cars, one of the most widely used inner-city travel modes, contains rich information about both road network traffic and travel behavior. Such data can be used to study the microscopic activity patterns as well as the macro system of urban spatial structures.
The case study was conducted in Nanjing; we first proposed the weighted NKDE method to describe the fire events, with real road network and fire-engine trace data in Nanjing. The event density acts as a refined analysis to examine their spatial distribution in the urban space and their spatial association with road network. The computational intensity in NKDE is greatly influenced by the bandwidth parameter, which determines the search radius. Then, we compared the appearances of different bandwidths on the density results to determine the 500 m optimal bandwidth. The NKDE-ILINCS method was applied to analyze local spatial patterns of fire accidents in network space. The results showed that there is significant high–high network autocorrelation in the study region, which is useful in determining higher-risk locations, as well as in the fire risk assessment of Nanjing. Finally, based on the location and characteristics of the high–high road segments, six types of fire higher-risk areas were identified: urban business district, urban commercial district, historical and cultural reserve district, residential district, urban village and chemical industry park. Furthermore, the top 14 higher-risk road segments in Nanjing were listed. The findings of this case study enhance our knowledge to more accurately observe where fire accidents usually occur and provide a reference for fire departments to improve emergency rescue effectiveness. Compared with traditional point events analysis methods, NKDE can be used not only for analyzing the resultant intensity patterns of point events and identifying potential “hotspot” clusters along networks, but also as visualization tools to shape 3-D density surface. Meanwhile, our weighted NKDE method considers the influence of non-spatial factors of fire accidents, which can examine significant differences of different fires along the network [1,11]. Besides, we introduce local indicators of network-constrained clusters (LINCS) to detect the local-scale clustering of network events. In this paper, NKDE result was input as attribute for LINCS to use the density indictor for assessing the significant locations with high-density values, and the results prove that NKDE-LINCS perform better than conventional LINCS in identifying the clusters.
However, there are two issues in this study needed to be addressed in further research. First, fire accidents always occur in a certain range of time and space, so the temporal character is also a basic property of geographical events. Future studies are focused on analyzing spatiotemporal patterns of fire accidents on roadways over a network space. Second, the urban environment is universally considered as an enormous and comprehensive complex system; it is not reasonable to examine only the spatial characteristics of fire events, while the factors associated with urban events may be diverse and complicated. Therefore, further research is needed to take into account other factors, such as population density, transport accessibility, road density and land use of the study area [42,43].

Acknowledgments

This study was supported in part by the National Natural Science Foundation of China under Grant 41701376, in part by the Natural Science Foundation of Jiangsu province under Grant BK20170866, in part by the Key Program of Chinese Academy of Sciences under Grant ZDRW-ZS-2016-6-3-4, in part by the Fundamental Research Funds for the Central Universities under Grant 2017B11714, and in part by the China Postdoctoral Science Foundation under Grant 2016M600356.

Author Contributions

All authors contributed to the development of proposed registration method and this manuscript. Zelong Xia and Hao Li proposed the methodology. Zelong Xia and Yuehong Chen performed the experiments and analyzed the results. Zelong Xia wrote the draft of the manuscript. Hao Li guided the research and revised the manuscript.

Conflicts of Interest

The authors declare no conflict of interest.

References

  1. Xie, Z.; Yan, J. Kernel density estimation of traffic accidents in a network space. Comput. Environ. Urban Syst. 2008, 32, 396–406. [Google Scholar] [CrossRef]
  2. Delmelle, E.; Thill, J.-C. Urban bicyclists: Spatial analysis of adult and youth traffic hazard intensity. Transp. Res. Rec. 2008, 2074, 31–39. [Google Scholar] [CrossRef]
  3. Erdogan, S.; Yilmaz, I.; Baybura, T.; Gullu, M. Geographical information systems aided traffic accident analysis system case study: City of Afyonkarahisar. Accid. Anal. Prev. 2008, 40, 174–181. [Google Scholar] [CrossRef] [PubMed]
  4. Anderson, T.K. Kernel density estimation and K-means clustering to profile road accident hotspots. Accid. Anal. Prev. 2009, 41, 359–364. [Google Scholar] [CrossRef] [PubMed]
  5. O’Sullivan, D.; Unwin, D. Geographic Information Analysis, 2nd ed.; John Wiley & Sons: Hoboken, NJ, USA, 2014. [Google Scholar]
  6. Dai, D.; Taquechel, E.; Steward, J.; Strasser, S. The impact of built environment on pedestrian crashes and the identification of crash clusters on an urban university campus. West. J. Emerg. Med. 2010, 11, 294–301. [Google Scholar] [PubMed]
  7. Steenberghen, T.; Dufays, T.; Thomas, I.; Flahaut, B. Intra-urban location and clustering of road accidents using GIS: A Belgian example. Int. J. Geogr. Inf. Sci. 2004, 18, 169–181. [Google Scholar] [CrossRef]
  8. Elgammal, A.; Duraiswami, R.; Harwood, D.; Davis, L.S. Background and foreground modeling using nonparametric kernel density estimation for visual surveillance. Proc. IEEE 2002, 90, 1151–1163. [Google Scholar] [CrossRef]
  9. Flahaut, B.; Mouchart, M.; Martin, E.S.; Thomas, I. The local spatial autocorrelation and the kernel method for identifying black zones: A comparative approach. Accid. Anal. Prev. 2003, 35, 991–1004. [Google Scholar] [CrossRef]
  10. Borruso, G. Network density estimation: Analysis of point patterns over a network. In Computational Science and Its Applications–ICCSA; Gervasi, O., Murgante, B., Misra, S., Borruso, G., Torre, C.M., Rocha, A.M.A.C., Taniar, D., Apduhan, B.O., Stankova, E., Cuzzocrea, A., Eds.; Lecture Notes in Computer Science 3482; Springer: Berlin, Germany, 2005; pp. 126–132. [Google Scholar]
  11. Xie, Z.; Yan, J. Detecting traffic accident clusters with network kernel density estimation and local spatialstatistics: An integrated approach. J. Transp. Geogr. 2013, 31, 64–71. [Google Scholar] [CrossRef]
  12. Yamada, I.; Thill, J.-C. Local indicators of network-constrained clusters in spatial point patterns. Geogr. Anal. 2007, 39, 268–292. [Google Scholar] [CrossRef]
  13. Borruso, G. Network density estimation: Analysis of point patterns over a network. In Proceedings of the International Conference on Computational Science and Its Applications—ICCSA 2005, Singapore, 9–12 May 2005; Gervasi, O., Gavrilova, M.L., Kumar, V., Lagana, A., Lee, H.P., Mun, Y., Taniar, D., Tan, C.J.K., Eds.; Springer: Heidelberg, Germany, 2005. [Google Scholar]
  14. Borruso, G. Network density estimation: A GIS approach for analysing point patterns in a network space. Trans. GIS 2008, 12, 377–402. [Google Scholar] [CrossRef]
  15. Okabe, A.; Satoh, T.; Sugihara, K. A kernel density estimation method for networks, its computational method and a GIS-based tool. Int. J. Geogr. Inf. Sci. 2009, 23, 7–32. [Google Scholar] [CrossRef]
  16. Okabe, A.; Yamada, I. The K-function method on a network and its computational implementation. Geogr. Anal. 2001, 33, 271–290. [Google Scholar] [CrossRef]
  17. Rui, Y.; Ban, Y. Exploring the relationship between street centrality and land use in Stockholm. Int. J. Geogr. Inf. Sci. 2014, 28, 1425–1438. [Google Scholar] [CrossRef]
  18. Li, L.; Zhu, L.; Sui, D.Z. A GIS-based Bayesian approach for analyzing spatial-temporal patterns of intra-city motor vehicle crashes. J. Transp. Geogr. 2007, 15, 274–285. [Google Scholar] [CrossRef]
  19. Wang, J.; Wang, X. An Ontology-Based Traffic Accident Risk Mapping Framework. Lect. Notes Computer Sci. 2011, 6849, 21–38. [Google Scholar]
  20. Chaikaew, N.; Tripathi, N.K.; Souris, M. Exploring spatial patterns and hotspots of diarrhea in Chiang Mai, Thailand. Int. J. Health Geogr. 2009, 8, 36. [Google Scholar] [CrossRef] [PubMed]
  21. Carlos, H.A.; Shi, X.; Sargent, J.; Tanski, S.; Berke, E.M. Density estimation and adaptive bandwidths: A primer for public health practitioners. Int. J. Health Geogr. 2010, 9, 39. [Google Scholar] [CrossRef] [PubMed]
  22. Pulugurtha, S.S.; Krishnakumar, V.K.; Nambisan, S.S. New methods to identify and rank high pedestrian crash zones: An illustration. Accid. Anal. Prev. 2007, 39, 800–811. [Google Scholar] [CrossRef] [PubMed]
  23. Chainey, S.; Tompson, L.; Uhligm, S. The utility of hotspot mapping for predicting spatial patterns of crime. Secur. J. 2008, 21, 4–28. [Google Scholar] [CrossRef]
  24. Ciscal-Terry, W.; Dell’Amico, M.; Hadjidimitriou, N.S.; Iori, M. An analysis of drivers route choice behavior using GPS data and optimal alternatives. J. Trans. Geogr. 2016, 51, 119–129. [Google Scholar] [CrossRef]
  25. Gonzalez, M.C.; Hidalgo, C.A.; Barabasi, A.L. Understanding individual human mobility patterns. Nature 2008, 453, 779–782. [Google Scholar] [CrossRef] [PubMed]
  26. Ratti, C.; Frenchman, D.; Pulselli, R.M.; Williams, S. Mobile landscapes: Using location data from cell phones for urban analysis. Environ. Plan. B Plan. Des. 2006, 33, 727–748. [Google Scholar] [CrossRef]
  27. Kwan, M.P. Interactive geovisualization of activity-travel patterns using three-dimensional geographical information systems: A methodological exploration with a large data set. Transp. Res. Part C Emerg. Technol. 2000, 8, 185–203. [Google Scholar] [CrossRef]
  28. Quddus, M.A.; Ochieng, W.Y.; Zhao, L.; Noland, R.B. A general map matching algorithm for transport telematics applications. GPS Solut. 2003, 7, 157–167. [Google Scholar] [CrossRef] [Green Version]
  29. White, C.E.; Bernstein, D.; Kornhauser, A.L. Some map matching algorithms for personal navigation assistants. Transp. Res. Part C 2000, 8, 91–108. [Google Scholar] [CrossRef]
  30. Quddus, M.A.; Ochieng, W.Y.; Noland, R.B. Current map-matching algorithms for transport applications: State-of-the art and future research directions. Transp. Res. Part C Emerg. Technol. 2007, 15, 312–328. [Google Scholar] [CrossRef] [Green Version]
  31. O’Sullivan, D.; Unwin, D.J. Geographic Information Analysis; John Wiley and Sons: Hoboken, NJ, USA, 2003. [Google Scholar]
  32. Bíl, M.; Andrášik, R.; Janoška, Z. Identification of hazardous road locations of traffic accidents by means of kernel density estimation and cluster significance evaluation. Accid. Anal. Prev. 2013, 55, 265–273. [Google Scholar] [CrossRef] [PubMed]
  33. Plug, C.; Xia, J.C.; Caulfield, C. Spatial and temporal visualization techniques for crash analysis. Accid. Anal. Prev. 2011, 43, 1937–1946. [Google Scholar] [CrossRef] [PubMed]
  34. Nakaya, T.; Yano, K. Visualising Crime Clusters in a Space-time Cube: An Exploratory Data-analysis Approach Using Space-time Kernel Density Estimation and Scan Statistics. Trans. GIS 2010, 14, 223–239. [Google Scholar] [CrossRef]
  35. Levine, N. CrimeStat III: A Spatial Statistics Program for the Analysis of Crime Incident Locations, version 3.0; Ned Levine & Associates: Houston, TX, USA, 2004. [Google Scholar]
  36. Gibin, M.; Longley, P.; Atkinson, P. Kernel Density Estimation and Percent Volume Contours in General Practice Catchment Area Analysis in Urban Areas. In Proceedings of the GIScience Research UK Conference GISRUK, Maynooth, Ireland, 11–13 April 2007; Citeseer: Princeton, NJ, USA, 2007. [Google Scholar]
  37. Anselin, L. Local Indicators of Spatial Association—LISA. Geogr. Anal. 1995, 27, 93–115. [Google Scholar] [CrossRef]
  38. Dijkstra, E.W. A note on two problems in connexion with graphs. Numer. Math. 1959, 1, 269–271. [Google Scholar] [CrossRef]
  39. Thurstain-goodwin, M.; Unwin, D. Defining and delineating the central areas of towns for statistical monitoring using continuous surface representations. Trans. GIS 2000, 4, 305–317. [Google Scholar] [CrossRef]
  40. She, B.; Zhu, X.; Ye, X.; Lee, J. Weighted network Voronoi Diagrams for local spatial analysis. Comput. Environ. Urban Syst. 2015, 52, 70–80. [Google Scholar] [CrossRef]
  41. Nie, K.; Wang, Z.; Du, Q.; Ren, F.; Tian, Q. A Network-Constrained Integrated Method for Detecting Spatial Cluster and Risk Location of Traffic Crash: A Case Study from Wuhan, China. Sustainability 2015, 7, 2662–2677. [Google Scholar] [CrossRef]
  42. Jones, A.P.; Haynes, R.; Kennedy, V.; Harvey, I.M.; Jewell, T.; Lea, D. Geographical variations in mortality and morbidity from road traffic accidents in England and Wales. Health Place 2008, 14, 519–535. [Google Scholar] [CrossRef] [PubMed]
  43. Wier, M.; Weintraub, J.; Humphreys, E.H.; Seto, E.; Bhatia, R. An area-level model of vehicle-pedestrian injury collisions with implications for land use and transportation planning. Accid. Anal. Prev. 2009, 41, 137–145. [Google Scholar] [CrossRef] [PubMed]
Figure 1. The study area with road network in Nanjing.
Ijgi 06 00370 g001
Figure 2. A sample of fire-engines trajectory points from 1 to 3 January 2015.
Ijgi 06 00370 g002
Figure 3. Travel time distribution of fire engines within 24 h.
Ijgi 06 00370 g003
Figure 4. Road congestion caused by private cars: (a,b) private cars parking chaotically in a residential area; and (c) fire-engine traffic requirements.
Ijgi 06 00370 g004
Figure 5. The distance from the fire location to the nearest road.
Ijgi 06 00370 g005
Figure 6. Distribution of fire points after matching under network space in the study area.
Ijgi 06 00370 g006
Figure 7. Illustration of the differences between the planar KDE and network KDE for the same point event dataset.
Ijgi 06 00370 g007
Figure 8. Network kernel density estimation schematic diagram.
Ijgi 06 00370 g008
Figure 9. The network kernel density function at intersection.
Ijgi 06 00370 g009
Figure 10. The bandwidth range of fire point p.
Ijgi 06 00370 g010
Figure 11. The results of network kernel density in different intervals.
Ijgi 06 00370 g011
Figure 12. Illustration of the impacts of different search bandwidths on the density pattern: (ac) the results for the search bandwidth of 100 m, 260 m, and 500 m at a local scale, respectively; and (ef) 3D visualization of the spatial pattern of density estimated by the proposed network KDE in the overall space.
Ijgi 06 00370 g012aIjgi 06 00370 g012b
Figure 13. Result of NKDE-ILINCS method: (a) local clustering patterns; and (b) z value distribution.
Ijgi 06 00370 g013
Figure 14. Network KDE results distribution and high–high road segments in Nanjing.
Ijgi 06 00370 g014
Figure 15. Six fire higher-risk regions of Nanjing in a network space.
Ijgi 06 00370 g015
Figure 16. Road congestion degree in urban fire higher-risk segments.
Ijgi 06 00370 g016
Figure 17. The higher-risk locations under road network space in urban districts.
Ijgi 06 00370 g017
Table 1. The records of GPS information on fire-engine trajectory.
HOSTIDHOSTNOTimeLatitudeLongitudeVelocityAngle
6309WJSU6081X13 April 2015 08:59:5832.052352118.8506623251
6309WJSU6081X13 April 2015 09:00:1832.052587118.8596055263
6309WJSU6081X13 April 2015 09:00:3532.052623118.8599358265
6309WJSU6081X13 April 2015 09:00:5232.054320118.86016728277
6309WJSU6081X13 April 2015 09:01:2032.055433118.86117230271
Table 2. All nodes attributes of fire point p within the bandwidth range.
Node NameBandwidthWhether Contains Node *Distance **
V1-2-2100No10 m
........................
V1-7-2100No90 m
Note: *: refers to whether it contains node along the shortest-path. **: refers to the shortest-path between the corresponding node and the fire point.
Table 3. Parameters and H-H segment numbers in experiments of ILINCS.
Experiments1234
ParametersInput attributeKernel density valueKernel density valueFire numberFire number
BLU length20 m40 m20 m40 m
Simulation times99999999
p-value0.015374210000
0.0518761747500
Table 4. The top 14 fire higher-risk location under road network.
IDNameDensity Value (Mean)Z (Mean)LengthCongestion Degree
1Zhongshan East Road5.029012.3001589 mfree-flowing
2Daming Road4.82469.5572900 mfree-flowing
3Longyuan East Road4.48697.3708226 mcongestion
4Longpan Middle Road4.35316.8773569 mcomparative-congestion
5Huju North Road4.34947.3135233 mcongestion
6Jinmao Main Street4.22008.3280340 mcongestion
7Chahaer Road4.171210.1488320 mcomparative-congestion
8Changbai Street3.971510.0531460 mfree-flowing
9Zhujiang Road 3.90937.5572849 mcomparative-congestion
10Shitoucheng Road3.75037.9518223 mcongestion
11Zhongyang Road 3.60028.8611536 mcongestion
12Changfu Street3.37417.4618547 mcongestion
13Huangpu Road3.29777.4664 284 mcomparative-congestion
14Guanghua Road3.20894.1780546 mcomparative-congestion

