1. Motivation and Related Works
Emerging concepts, such as augmented reality (AR), crowd-mapping (CM), social networks (i.e., Twitter, Instagram, Facebook), the Internet of Things (IoT) and wireless sensor networks (WSN), have captured the interest of companies and researchers to develop new and user-oriented applications. Due to their novelty, not much consideration has been given to the performance enhancement that would result through tighter integration of these various subsystems.
Many social networks today contribute to the emergent geospatial web [
1] by implementing the geo-tagging of content (text, audio, images/videos) in their application program interfaces (APIs) for mobile applications. The geolocation of published content on social networks allows the development of systems able to detect real-time trends of any type. The spatio-temporal analysis of social media trends for abnormal event detection [
2,
3] allows the identification of short time events of interest in a given region, in particular involving people and the civil protection authorities.
In October 2014, the Italian city of Genoa experienced a flood disaster event. The OpenGenova (
http://www.opengenova.org/maps/angelidelfango/, last access: 7 February 2017) system was developed to map out the crisis area by using (geo)photos and hashtags on the Instagram social network. Similarly, the Haiti earthquake of January 2010 prompted the crisis mappers to respond through a new model of cooperation that incorporated satellite/aerial maps and city models, as well as road graphs [
4] to increase the information density available to the management teams dealing with the aftermath of the crisis. Because CM [
5,
6,
7,
8] is sourced from cryptic geo-data (satellite/aerial imagery) the advantage of considering both CM and AR feeds together suggests a key enhancement for the management and control of natural disasters.
AR is a promising technology that is being applied in many contexts as diverse as cultural heritage [
9,
10], education [
11], geographic visualization [
12], environmental monitoring [
13], as well as disaster management [
14,
15]. The ability to abstract through real-time visualization the objective information that overlies images captured from cameras augments the experience of a user in that he or she can view and explore better contextualized content, often sourced from the web (i.e., multimedia-related content or georeferenced information) [
16].
The combination of socially-triggered information and automatically-acquired raw sensor data could be disruptive to the users of civil protection and emergency management systems. Over the last few years, the IoT phenomenon has induced much interest from industry and research groups, in various fields of application. Recent work has exploited the use of WSN for disaster management [
17,
18], enhancing context awareness with pervasive and continuous streaming of raw information. Our research group has a background in sensor networks [
19,
20,
21] and has already reported on the advantages of updating knowledge bases through user-driven data collection [
22].
Starting from this crowd-mapping experience, we have prototyped the Whistland system with the aim of exploiting social media platforms and sensor networks as real-time data sources (a novelty) with the objective of providing users with an enhanced interactive system of data management built on the concept of AR.
The Whistland system integrates AR, crowd-mapping, social networks, IoT and WSN for the management of a crisis caused by natural events. Its innovative feature is the social network integration through a novel pointer-like mechanism. The pointer mechanism is designed to keep the storage requirement to a minimum, allowing quick retrieval of the original content. The proposed system is a cooperative networking solution that allows spatio-temporal analysis from an extensive and highly accessible knowledge base. Moreover, the fusion of all of these technologies is a step forward and opens new and as yet uncharted ways for future development, as outlined in
Section 7.
The user of this system is intended to be a common citizen or a civil protection expert. A rich mobile application [
23] makes available a real-time pipeline and provides information obtained through its AR engine about what is happening in the surrounding area. This networking aspect that is naturally present as an element of the design permits other users to contribute effectively, as well as retrieve data from the sensor networks at large. The contribution generated by the user is purely information based at this stage. It includes multimedia, such as texts, images, audio/videos and 3D models.
The hashtag mechanism is used to establish a logical connection between a user contribution and a critical event. We also consider various different use-cases like the loss of data-connection during a critical emergency scenario (e.g., earthquakes, flooding), by implementing a local cache system that improves the continuity of the use-case dynamic model.
This paper is organized as follows:
Section 2 presents meaningful scenarios to target the application over a wide field of possible applications for civil protection and emergency management. In
Section 3, the overall system architecture is presented, delineating the main components with their principal characteristics.
Section 4 describes the server-side component that stores and manages information. In
Section 5, the details of the mobile application are shown with particular reference to the AR technology inside, while
Section 6 presents the light web-GIS platform implemented for data analysis.
Section 7 outlines conclusions and planned future work.
2. Scenarios
Civil protection aims to save and preserve life, prevent and alleviate human suffering and safeguard the integrity and dignity of populations affected by natural disasters and human-made crises. A monitoring system and a series of interventions designed to repair damage are required to achieve these objectives. Such systems are expensive, and therefore, efficiency is a key factor in any design.
Together with sensor networks that permit continuous measurement and data feeds, any monitoring phase has to also provide for periodic in situ checks. Systematic reduction of such surveys, while preserving an adequate monitoring level, increases the operational efficiency of the system.
Exploiting this, let us underline how a smart system might select qualified user reports as an additional source of in situ information that would help reach this objective. For example, many georeferenced tweets concerning a dangerous road segment could be used to plan alternative routes or, in the case of a main road, to ensure that it will be repaired as quickly as possible. A broken wall or unsafe building would be useful information that might be of use in an earthquake disaster. The list goes on, and a database constructed to specifically address territorial state obviously enhances the ability of civil authorities to respond particularly before disaster strikes a region.
Extending this to territory management professionals, the same principle would apply. Civil protection operators in charge of collecting data about a specific area under their control would assess danger potentials in greater detail. Clearly, the data gathered by professionals should clearly identify differences or changes in the danger potential of a territorial system of facility [
24].
With the proposed availability of such a system that collects for example geo-tagged pictures and shows them in AR views, the operator’s workload of data gathering with the same orientation reduces, which in turn develops greater reliability. This same concept is also meaningful in the post-event activities, i.e., for the reports of damage compiled by the authorities. This has an advantage over something like the EU Copernicus project (
http://www.copernicus.eu, last access: 7 February 2017), in that a crowd-mapping approach to map out the context before and after a particular event can integrate that information in a more effective way than one that uses a global and pervasive methodology to retrieve contextual information about the environment.
During a disaster (e.g., earthquake, flooding), civil protection authorities require promptness and quick decision making processes to focus scarce resources effectively. Often, the number of people involved is not enough, and any form of help can be crucial in saving lives and structure. To improve the efficiency and alacrity of civil protection intervention, the use of AR can reduce the amount of time required to check a map and to identify the target area. Here, the social network aspect of Whistland would be well deployed to help civil protection in carrying out its mission. One prominent such application of citizen reporting on the application is integration with more authoritative sources, such as sensor data and civil protection asset locations. In such a use-case, AR deployment can bring about an improvement of the response time and, hence, efficiency of the overall effort. Information technology and human organizational resources are amalgamated through data collection policies in a fundamental way. Including the user as a source of geo-tagged data this way makes it necessary to re-engineer the workflow of event management, so that the new information source is exploited within the processing structure. Whistland encapsulates this policy and sets the tempo for further development of the idea.
To explore this, we can outline a sample scenario, particularly interesting for decision support system (DSS) that develops an interaction between citizens and civil protection during a flood event.
A civil protection operator in proximity to a river for which is used a prevention system using a river model and information retrieved from the sensor on a bridge, forecasts the beginning of flooding within minutes. At the same instant, georeferenced tweets identify a damaged bus transporting people on the river side that according to a flooding model would remain isolated should flooding actually occur. A civil protection amphibious vehicle is meanwhile behind a hill on the safe side of the river.
Integrating together the knowledge of these sources of information (sensor data, flood forecasting, georeferenced tweets and vehicle GPS position), an AR-enriched mobile application allows the rescue operator to immediately visualize information. That step promotes understanding of the problem. Together with incoming feeds from a “central control” authority, the operator is now in a theoretically-feasible position to make a decision on how best to deploy his or her available options in just a few seconds.
Considered this way, Whistland is effectively an early warning system extended to resource management. Note here that the design is not necessarily dictated by planning, but rather through casual or area state and readiness on the ground of resources. This vital step passes control of the situation out of the rigid formalisms of planning and control to a more fluid type of localized command and control in close touch with what is actually happening.
It could be successfully argued that the same result may well be achieved through using traditional system layouts, such as a telephone report of the bus, asset management through civil protection centers, and so on. However, the difference here is one of the collation of information that leads to effectively shorter response times (reduction from minutes to seconds) and less organizational overhead, very probably changing the result from failure to success in a large number of scenarios.
3. System Architecture
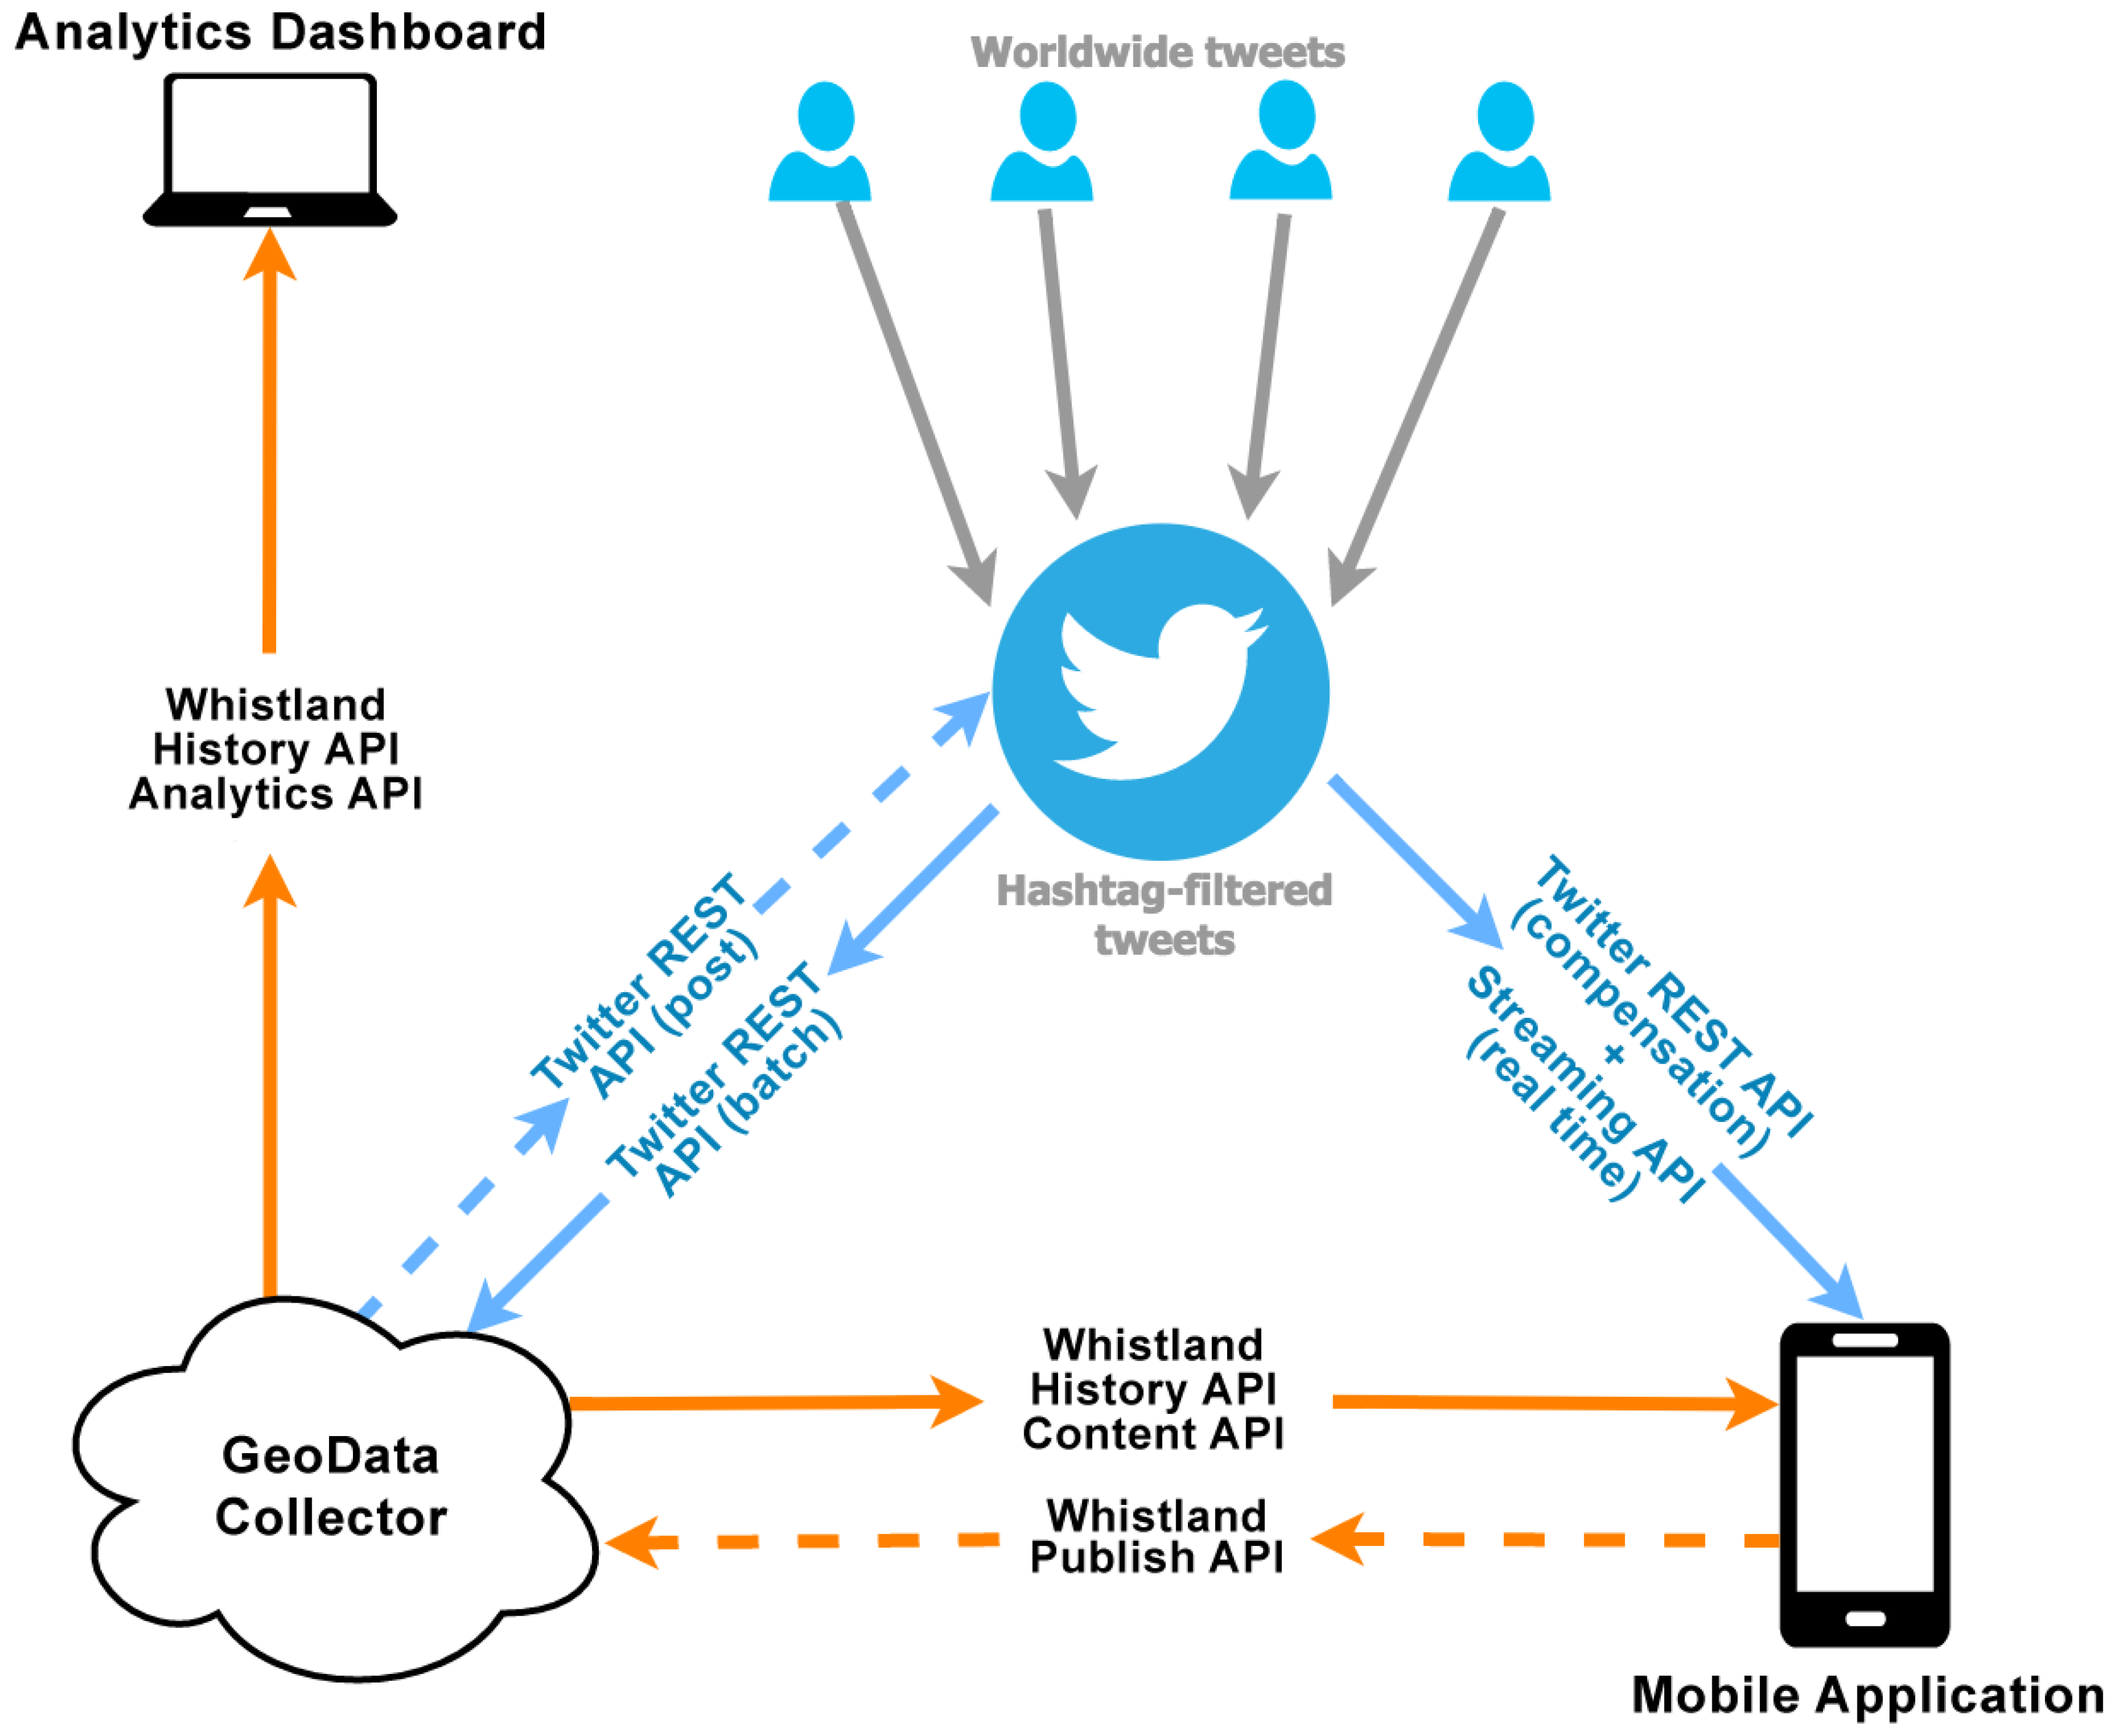
The Whistland architecture (see
Figure 1) is built on three main components:
The GeoData Collector is a server responsible for data collection from social networks and data analysis. It can improve the quality of the information by exploiting other geo-data sources, as well. These in particular can be geo-databases (e.g., PostGIS, Oracle, Esri Spatial Database Engine ArcSDEand SpatiaLite), geo-files (e.g., GeoJSON, Geography Markup Language GMLand Shapefile) or web mapping services (e.g., Web Map Service WMS, Web Feature Service WFS, Web Coverage Service WCS and Web Processing Service WPS).
The Mobile Application is able to show AR-relevant information about the environment or event.
The Analytics Dashboard enables the analysis of the events using both plain text and custom visualizations on (heat) maps.
The system is implemented using various technologies, selected according to the requirements and functionalities. We have developed a light server to collect and provide the minimum amount of information, ensuring low bandwidth consumption. We have developed a thin and modular client keeping complex functionalities in separated modules, ensuring low computational effort. Although we developed the Mobile Application only for Android systems, we have chosen cross-platform SDKs for AR interaction and 3D visualization to ensure portability.
The current prototype system accesses the Twitter social network through its API as a principle source of information. The rational used to select Twitter is its native architecture based on short messages that contain links to external content expressed as URIs also supported by the concept of the hashtag for a “keyword” clustering of tweets. This aspect enables the concept of linked (open) data (LOD) also for civil protection purposes [
25]. That is by no means a limiting factor, since Whistland uses data structures and software modules that are extensible and will connect to other social providers. The interactions between components of the systems use the Whistland API and are transparent from the connection with social networks. It is easy to plug other interfaces in each component to include other social networks (e.g., Facebook) or sources of information through the REST API. The internal data model is also quite general so that the structure of the information that is extracted from external APIs can be readily changed, as well. Twitter is a responsive and fast network with low overhead and extensive data coverage specifically targeted to individuals at every level of society. This topology fits the Whistland philosophy rather nicely, and we have deployed the Twitter API in this phase with some success. In particular, to enable data collection and analysis, the Twitter Search API allows the search of tweets on the basis of customized filters.
There is however an important restriction incurred when using Twitter for this purpose. The API will not permit searches for content that is older than 6–9 days. This in turn does not allow one to use Twitter in direct mode, i.e., as a content provider. To compensate for this limitation, a scheduled feeding approach has been designed in the system.
In the following subsections, we will give an overview of the designed architecture with the main components and interactions. Each component will be described in detail in a dedicated section.
3.1. GeoData Collector
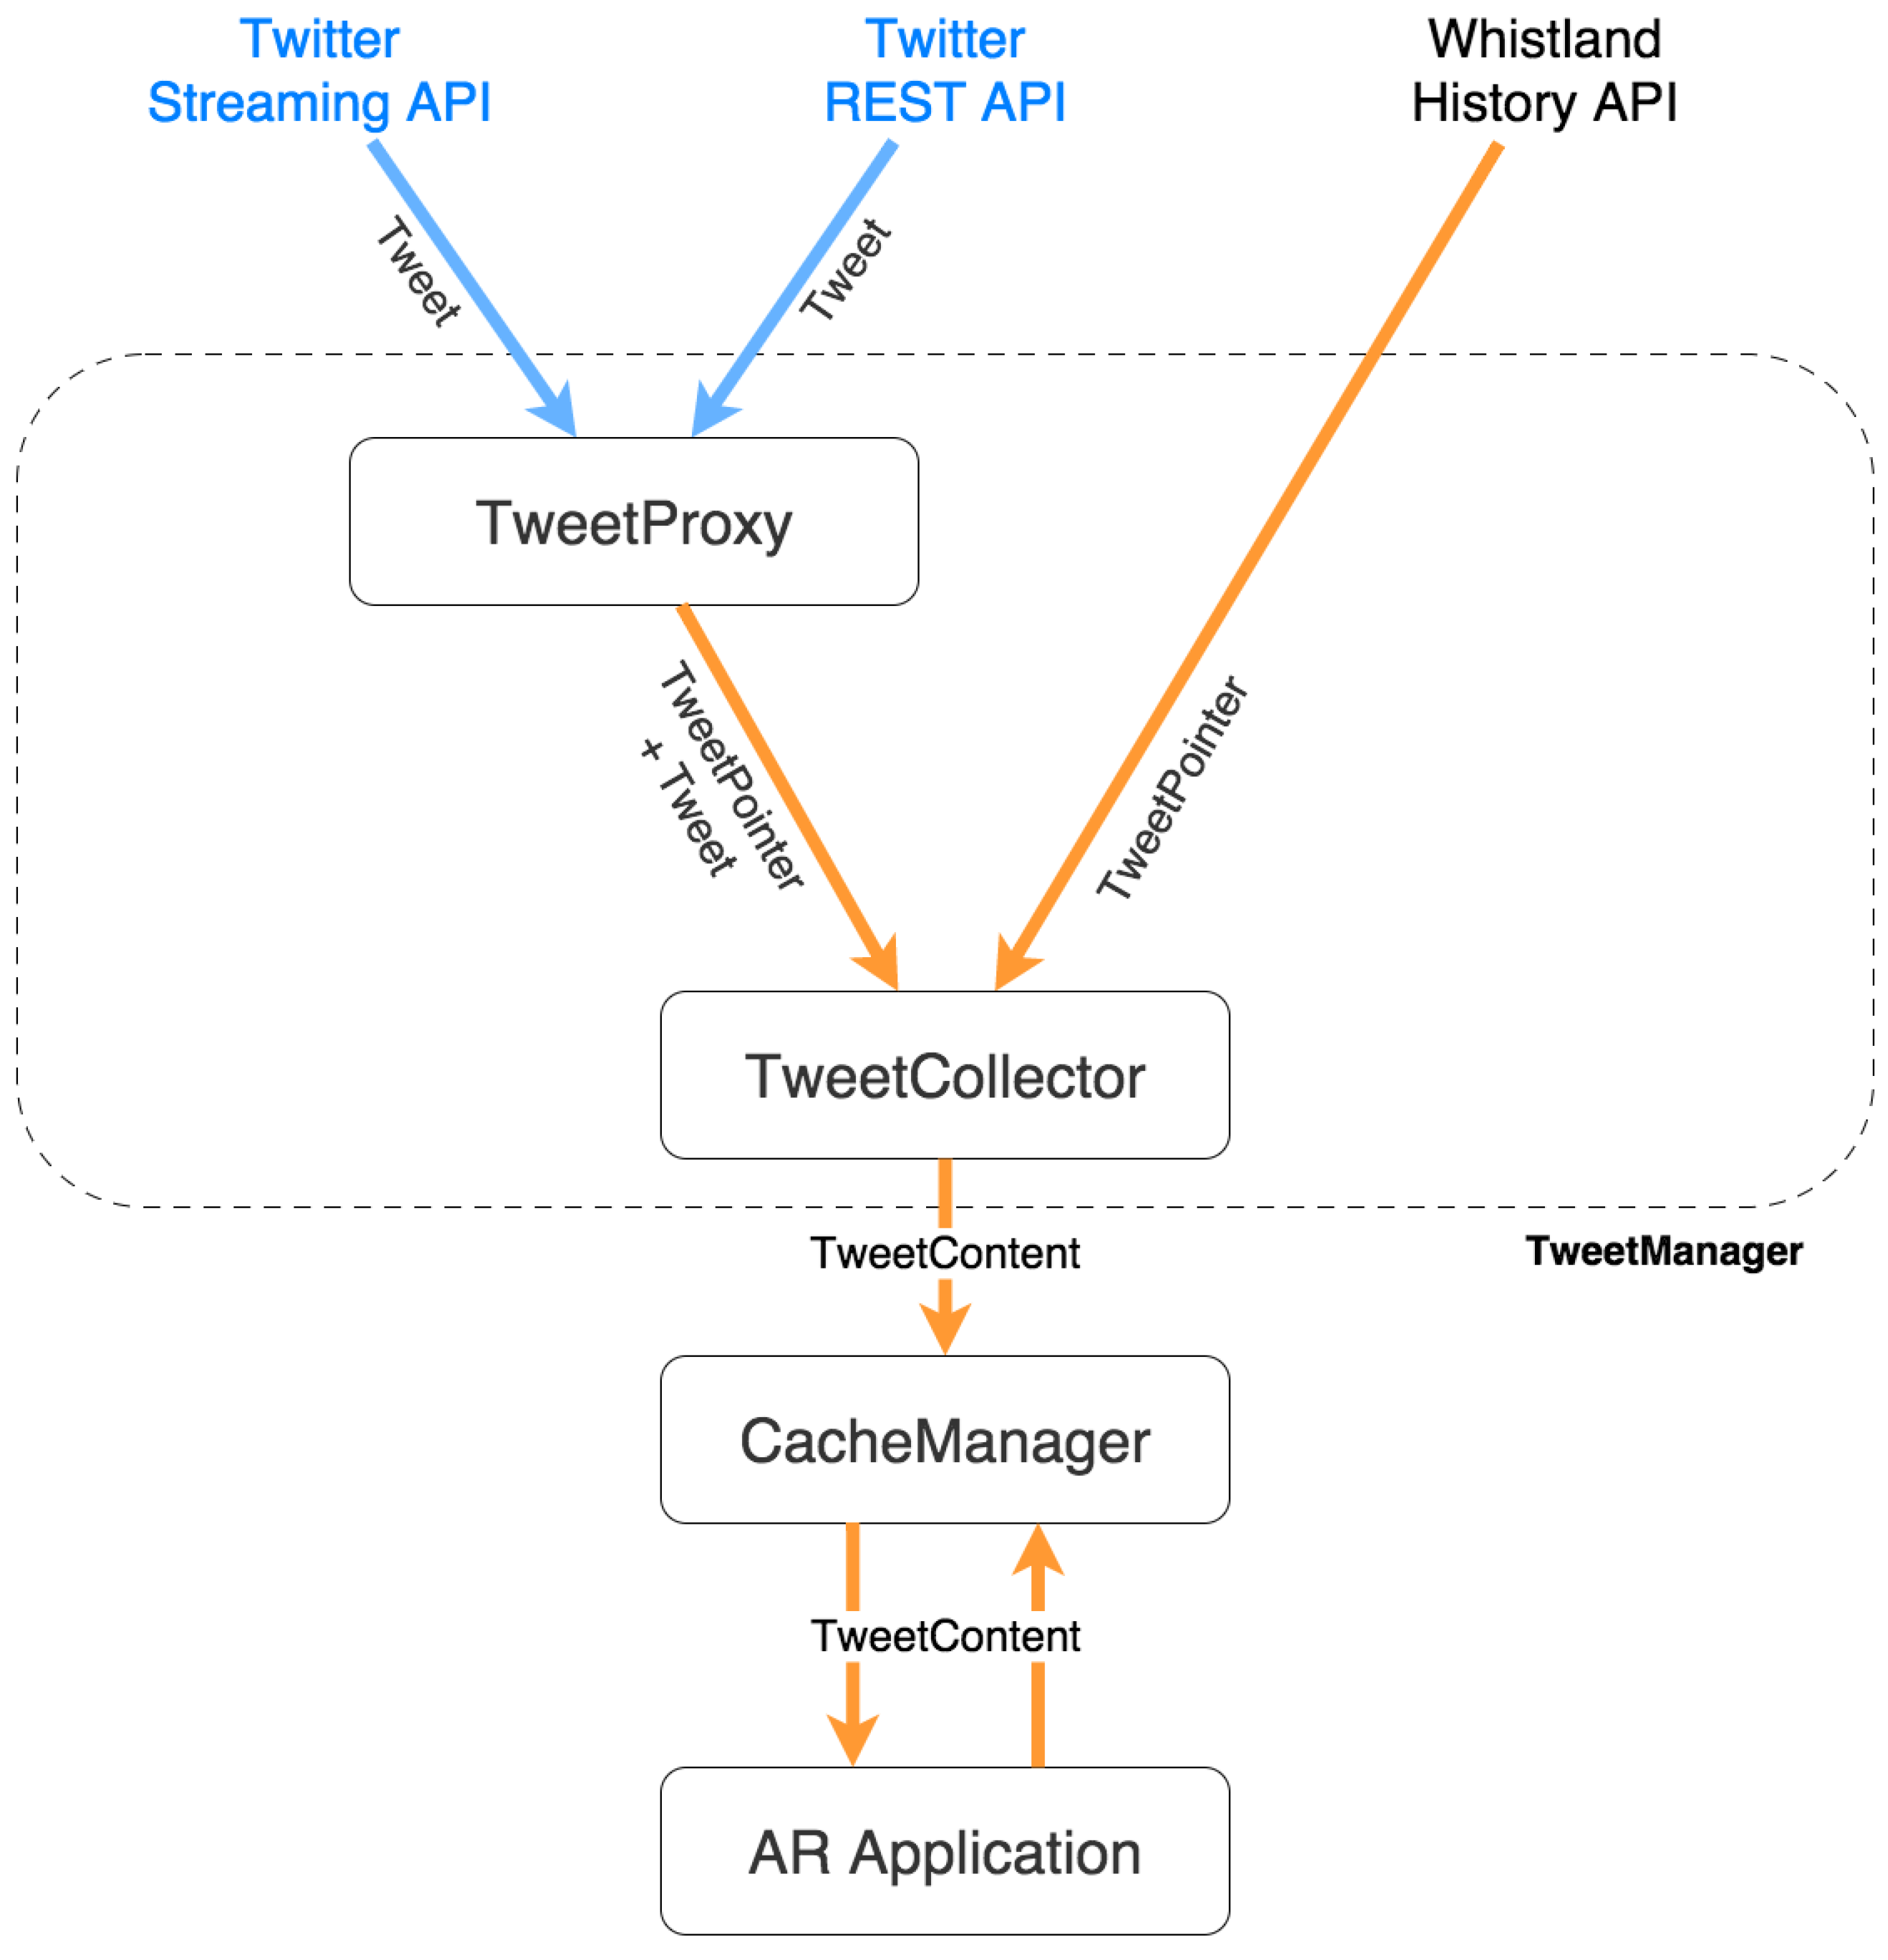
The GeoData Collector periodically fetches Twitter’s content through the Twitter Search API in batch mode. The content retrieved could be stored on the server, but saving each raw tweet would tend to mirror the Twitter database. Therefore, to reduce the waste of storage and computational resources (required for big data analysis), the approach we adopted stores only a pointer to the tweet analyzed. With this pointer workaround, any client application can integrate the original information of a tweet through the Twitter REST API, which, unlike the Twitter Search API, does not present one with time limits for searches.
In addition to the pointer, the
GeoData Collector can store complementary metadata, such as the geo-location, timestamp and identifier of the user that generated the content. All of the information retrieved by the server during its feeding procedures is available to clients through a RESTful web service (
Whistland History API). The motivation for the choice of a RESTful web service is two-fold: first, using a web service, the coupling between server and clients remains weak, and the RESTful properties permit a great deal of scalability on the server-side, as well as the development of thin clients; secondly, compared to SOAP (Simple Object Access Protocol) web services [
26], RESTful web services consume fewer server resources.
3.2. Mobile Application
At the next level, the express aim of the Mobile Application is to augment reality both for recent (and real-time) information currently present (“twitted”) on Twitter and for historical information not retrievable any further through the official APIs. The Whistland History API manages any old information, while the Twitter REST API and the Twitter Streaming API are used, respectively, to manage current information and to enable real-time notification about new content feeds. The disadvantage of using multiple APIs for the Mobile Application derives from the requirement to keep the GeoData Collector as thin as possible by transferring complexity to the client side.
Therefore, the role of the GeoData Collector is deliberately isolated to a historical data source, and this isolation allows it to scale up better, because each Mobile Application keeps an open connection with the Twitter API, while the Whistland History API is used only once to fetch the historical information. In this way, pruned of the need of directly and continuously fetching tweets from Twitter, the GeoData Collector can provide a faster download of content. The result is of course a more responsive AR interaction, which leads to greater efficiency in terms of software operation.
To allow users to explore contents (multimedia, 3D models and sensor information) in an integrated approach, the Mobile Application uses the specific Whistland Content API provided by the GeoData Collector. Finally, the users, through with their own Twitter profiles, can publish tweets through the Whistland Publish API of the server. This solution of locally-caching generated tweets on the server results in the capability to create an independent messaging circuit.
3.3. Analytics Dashboard
In the Analytics Dashboard component, multiple analytics views have been made available for every logged event owing to the Whistland Analytics API exposed by the GeoData Collector. For each event, synthetic indicators appearing in the form of tabular data and heat-maps are available: all of the information layers are created on-demand and can be split by date interval in real-time, owing to the optimization applied to the server data structures. Once applied at the data structure and procurement levels, such powerful feeds are almost inevitable. In particular, they exploit the Whistland design to a near maximum and pave the way for future development.
4. GeoData Collector
The main features of the
GeoData Collector are:
Fetch tweets from Twitter;
Efficiently store tweets;
Perform geo-queries with temporal filter;
Expose API for external applications (i.e., the Mobile Application, the Analytics Dashboard or third party software/application).
The GeoData Collector is developed over an open-source platform, based on a Linux distribution with a 64-bit kernel. The object-relational database PostegreSQL has been chosen as the main storage relational database management system RDBMSdue to its PostGIS compatibility, which adds support for geographic objects allowing spatial queries in SQL. The server provides all of the information through a RESTful web service, developed in PHP and served by a reliable Apache HTTP server.
Whistland APIs, exposed by the RESTful web service, have been developed on top of the Slim Framework (
http://www.slimframework.com, last access: 7 February 2017) for PHP, while authentication, authorization and business-logic are shared among endpoints and realized through a custom implementation.
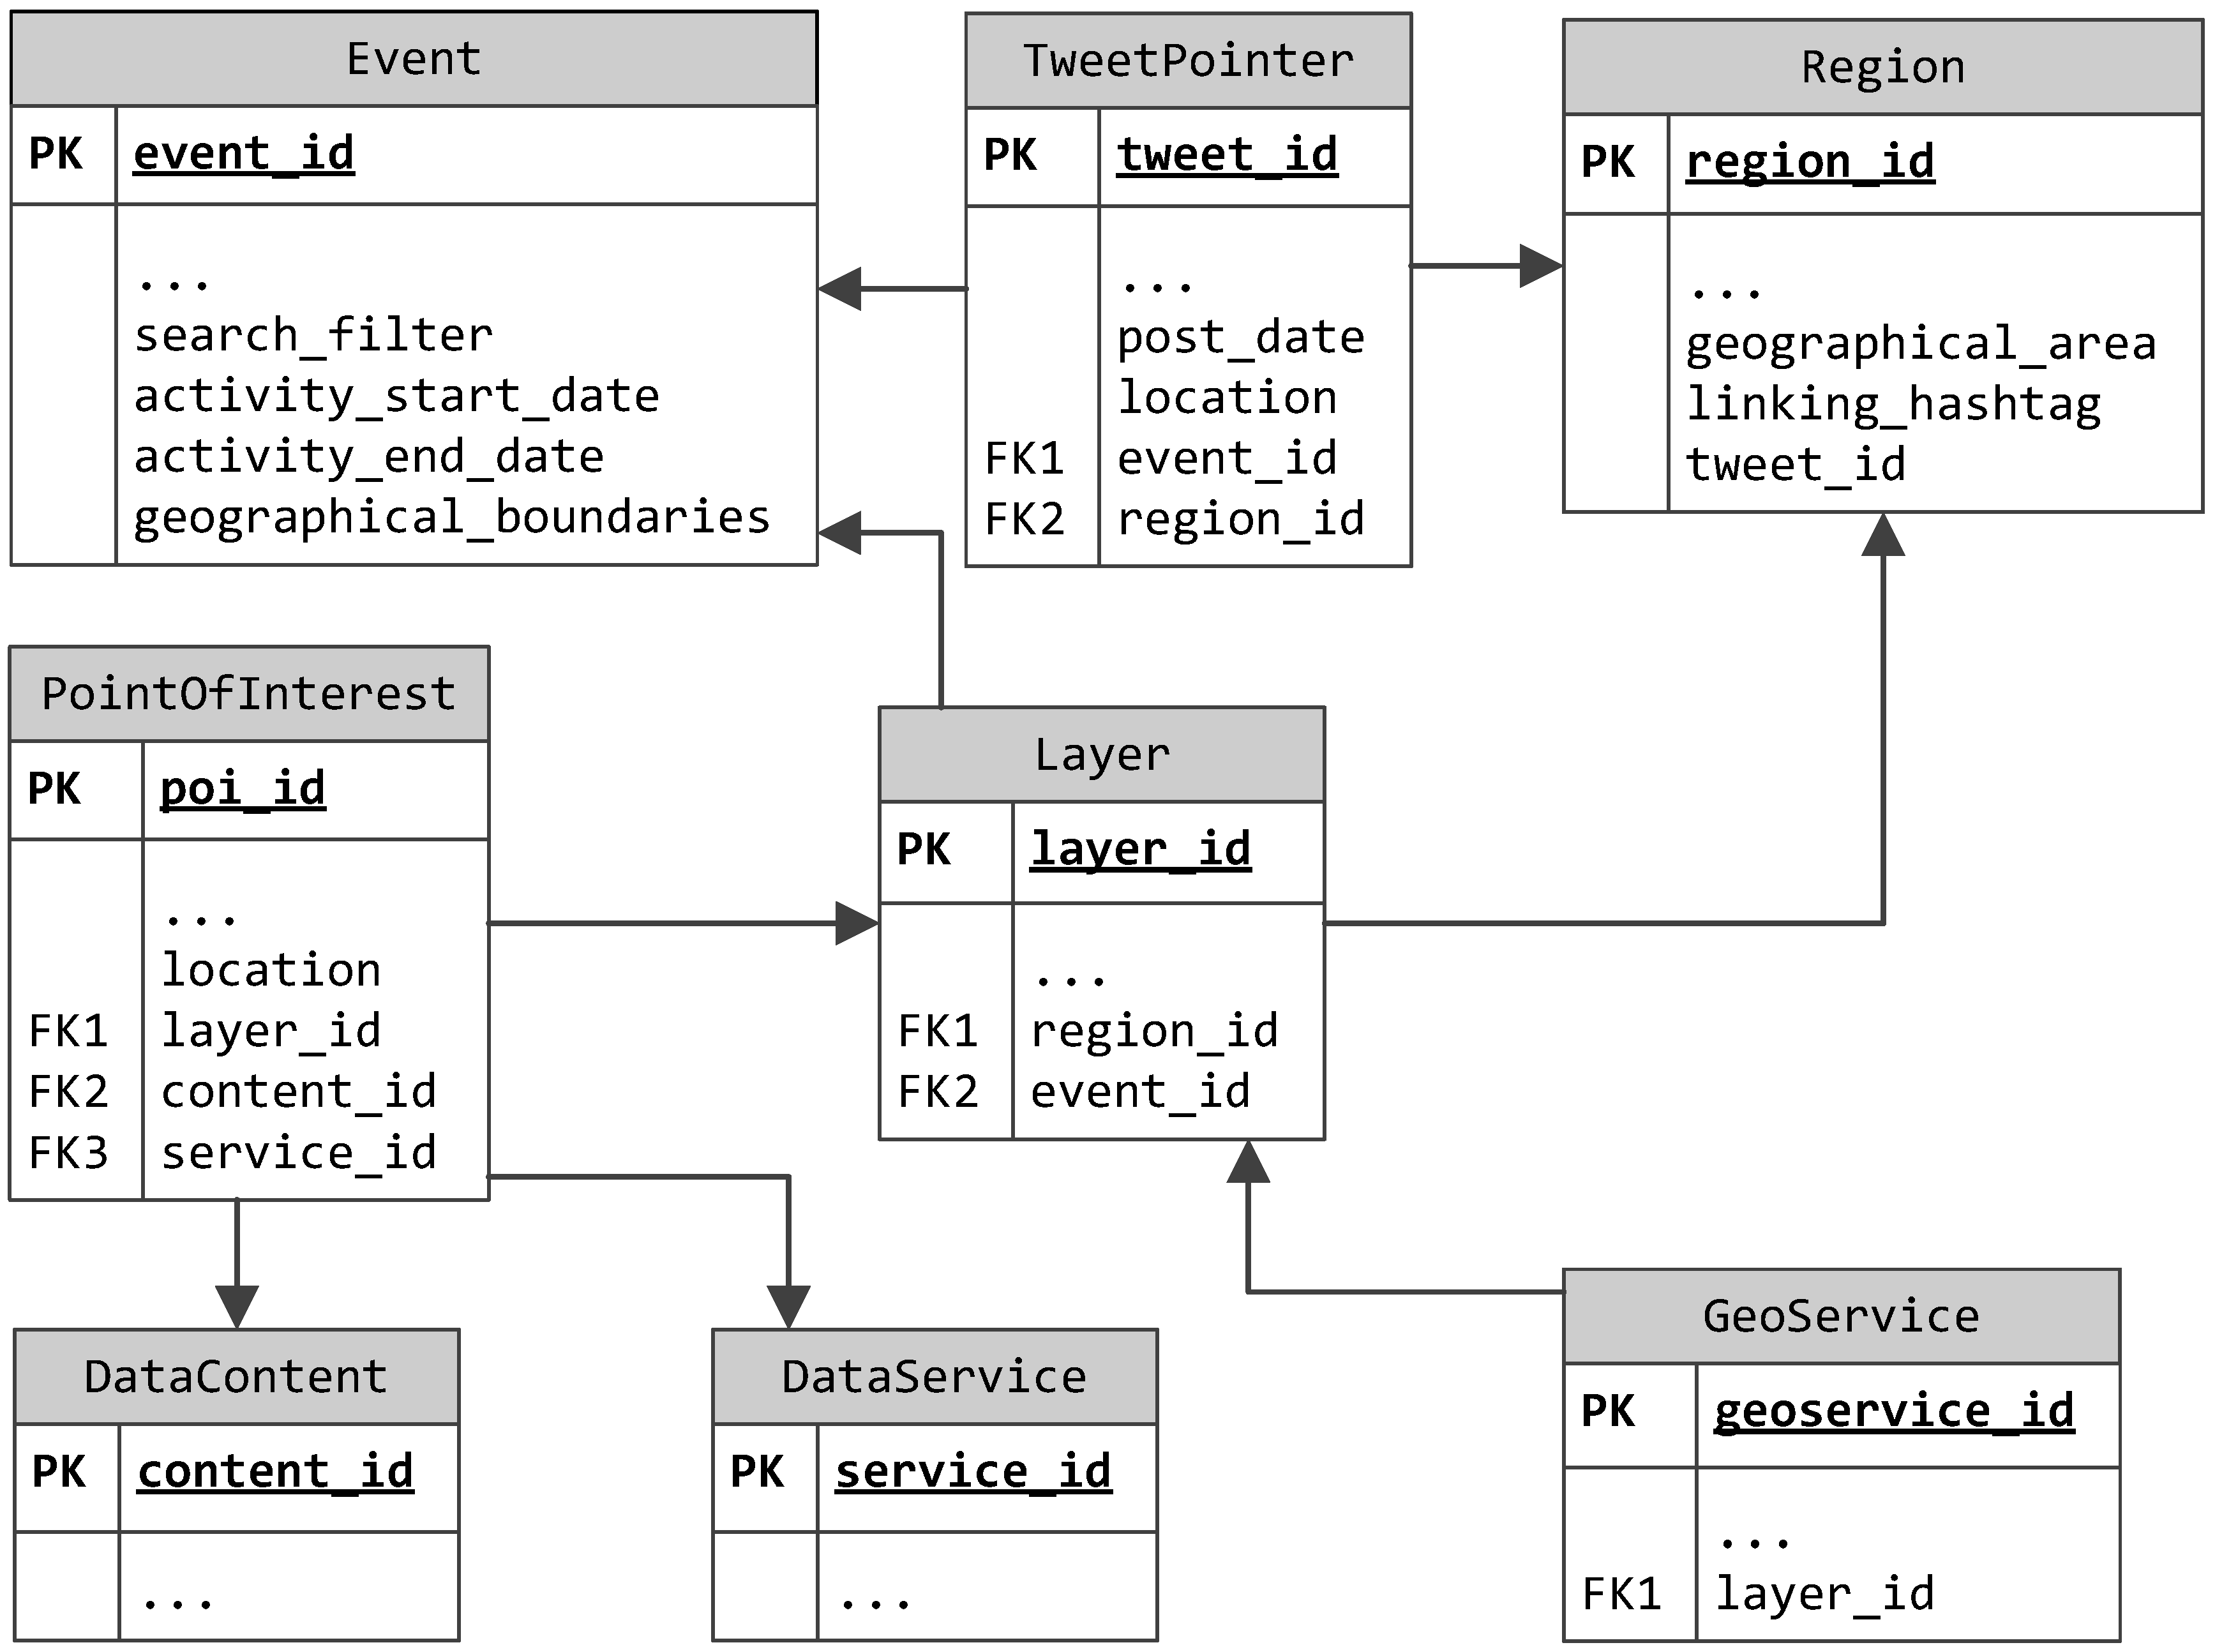
We designed a database model, summarized in
Figure 2, so that it is able to store pointers to the retrieved tweets (
TweetPointer), connecting them to events and regions, since users would mostly be interested in events (
Event) affecting some certain region (
Region).
The
TweetPointer is hybridized through attributes (
Table 1) derived from the original tweet and others computed from the local system to associate it with an event (
event_id) and to identify it with a region (
region_id). Every tweet pointer uses at least 84 bytes, where this minimum may increase up to 224 (84 bytes for synthetic information and 140 bytes for the text) if text is also stored.
Note here that the ratio between pointer size and raw data size is 0.375, showing that this approach can manage almost three times more data than the approach whereby data are stored locally on the server. Besides, the benefits of the pointer approach would be greater if linked data (such as images, user mentions, and so on) are factored into the assessment. In particular, there may be a significant benefit due to the communications overhead dropped by shelving a raw data storage philosophy.
The location field (from the PostGIS extension) and the post_date field are indexed to provide on-demand spatial and temporal analysis through the Whistland Analytics API. The GeoData Collector is also able to archive the analyses performed to allow a faster read operations. The flags field stores information about the tweet metadata, such as its retweet status, the availability of images or URL in the body. This field is useful to enrich the UI provided to the users without the overhead of network calls for all the visible tweets.
The Event has been modeled as an entity with attributes (i.e., name, description, image, …). To execute the feeding procedure, retrieving and collecting information from Twitter, the Event requires a search filter about the activity period and the geographical boundaries. The search filter specifies the expression that should be used to query the social provider. Typically, it is a hashtag that allows users to identify the Event and reuse it on their posts. The activity period is a pair of start/end dates and indicates the time window in which the GeoData Collector retrieves the information from the social provider. The geographical boundaries in the spatial filter are used to filter tweets outside of the territory involved in the considered Event.
The Region entity, in addition to the name and description, has its geographical area and a linking hashtag as attributes. These can be used to refer to it on tweets. When a tweet contains a linking hashtag, for example, it can be considered referring to the associated region.
The
GeoData Collector, using a feeding procedure, systematically and quickly collects pointers to tweets. Technically implemented within a PHP script, to maximize code reuse, this phase consists of a batch process scheduled to run at a predefined interval. For each active
Event, it carries out the following set of operations:
Check the id of the last tweet (lt_id) retrieved in previous feeds;
If lt_id is available (after an execution that retrieved at least one tweet for the current Event), set it as a lower bound in the Twitter Search API to avoid re-analyzing the bulk of content that has already been analyzed;
Set the query using the search filter specified for current Event;
Execute the search on Twitter, fetching each page of contents (since Twitter Search API results are paginated) up to the lower bound;
For each tweet returned successfully, elaborate the information (using the TweetProxy class) and create a TweetPointer object (invoking the buildTweetPointer method);
Update the lt_id of current Event, to have a lower bound set in the next execution.
In the general interrogation of a tweet structure, the procedure checks for attached GPS coordinates. If these are specified, it uses them to set the location, and it searches for a matching Region (the smallest one according to the hierarchical organization of regions) on the basis of this GPS position. Otherwise, it analyses the text inside the tweet to find hashtags corresponding to a Region. For each hashtag contained in the tweet, the mechanism searches for matching Regions.
In this way, if a tweet does not contain GPS coordinates, the server tries at least to mark it as referring to a Region: the localization is coarse, but useful for macro-area analysis later on. If the procedure cannot associate any Region, the tweet is classed as being without localization, and it will be ignored in spatial analysis. These manipulations are easily programmed and extended using an object-oriented programming (OOP) approach. Developed this way, the code is maintainable and adaptable to future event processing and feature extraction requirements.
Indeed, an administrator of the system might decide to specify a custom class (extending for example the TweetProxy classes and overriding the buildTweetPointer base method) for each event. This effective overloading would then specialize the methods and analysis to other than default behavior.
Since the information feeding process is a periodic task, not all of the tweets published can be directly managed by the GeoData Collector. For example, if the task was scheduled each day at midnight, an application running at midday would end up missing the last twelve hours of tweets, if it loads only information managed by the GeoData Collector.
Therefore, in an attempt to address this issue, client applications need to integrate information retrieved from the GeoData Collector (through its Whistland History API) with those tweets retrievable with the Twitter Search API. Furthermore, the feeding process can be forced, by users with privileges of administrator, to mine information of an Event as soon as possible. This opportunity may be useful to an operator who needs to perform an analysis on updated data.
To enable a client application to load special assets with Whistland Content API, the contents are organized in Layers, eventually connected to an Event and/or to a Region. A Layer can be a GeoService, exposing web mapping services (WMS, WFS, WCS), or instead, it can group georeferenced data in a series of PointOfInterests.
These georeferenced data are a stored or linked resource, via the DataContent used typically for texts, tables, images, audios/videos and 3D models, but also for multi-temporal image series. These data could be explored by using the Mobile Application with AR engine filter out tweets not related to a given geographic region and/or time limit.
At present, for sensor data, we used
DataContent with a queryable data table. Differently, we modeled
DataService to develop a support for standard OGC-SWE (“Open Geospatial Consortium-Sensor Web Enablement”) [
27]. Because of this standard, authorized clients can connect to the sensor, querying and obtaining information directly from it, thus unloading the server effort further for the data-retrieving phase. Owing to the flexibility of the developed platform, sensors, represented as
PointOfInterests with related queryable data flow, will be available as an additional source of information along with texts, images, audio/videos, 3D models and other stored/linked resources. Based on the versatile set of
Whistland APIs, this approach ensures a broad flexibility to address different scenarios and to allow modularity in the development of client applications.
5. Mobile Application
The main features of the
Mobile Application are:
Geo-tag an area also linking multi-media content (crowd mapper);
See point of interest (POI) close to the current user’s area;
Fetch historical data;
View real-time data from sensors;
Cache content to work also in absence of an Internet connection.
The vision of users at large as pervasive “sensors” enabled through their smart devices places particular demands on the design of the mobile application. In the current development cycle, the mobile application is hosted on the Android ecosystem, but the same results could be reached on other platforms, such as iOS or Windows Phone, with a little more effort, owing to SDK cross-platforms used for AR interaction and 3D visualization. The main objective pursued by this application is to provide users with auxiliary tools for event management. In particular, through means of the AR interface, users can access georeferenced stored information to gain awareness of the event content of their local environment(s). The AR engine enables the visualization of POI on a given region filtering out non-relevant data. This is an easy way to explore contents that are “linked” to the actual user’s area. The Mobile Application delivers this functionality by taking advantage of the information exposed by the server through a RESTful client.
5.1. Architecture
Since the analysis is event-oriented, the first step is retrieving all of the potential events required by an end-user. Choosing the event from a grid-based view (initially filtered with only active events), the user can enter directly into AR mode. Meanwhile, the application loads asynchronously, in a paginated way, the selected tweets to quickly display them on the console. The selected tweets are temporally ordered and spatially filtered exploiting the optimized
TweetPointer data-structure, as described in
Section 4.
The
Mobile Application gets the event snapshot (JSON format) from
GeoData Collector through its
Whistland History API and integrates it with information of current tweets retrievable with the Twitter REST API, as described in
Section 4. Finally, to let the client react in real-time to the publishing of new tweets, the Twitter Streaming API has also been used. As such, these three APIs (
Whistland History API, Twitter REST API, Twitter Streaming API) have been merged into a unique component to enable a uniform management on the UI side.
Specifically, TweetPointer is a unique subset of a general tweet. Therefore, each tweet retrieved using the Twitter API is converted to its corresponding TweetPointer. In this way, all such TweetPointers are first wrapped in TweetContent objects. These are then cached and sent to the AR handler, just like the DataContents.
5.2. Augmented Reality
The AR activity is built via the Metaio SDK (
http://www.metaio.com/sdk, last access: 1 October 2015): due to the recent acquisition of Metaio company by Apple Inc., work is in progress to adopt other AR-SDKs implementing the newest Augmented Reality Markup Language (ARML) 2.0 standard [
28]. The Metaio SDK was chosen because it provides a cross-platform AR-SDK with a great stability of tracking (location based, marker based and image based) and easy management of multimedia content (audio/video and 3D models).
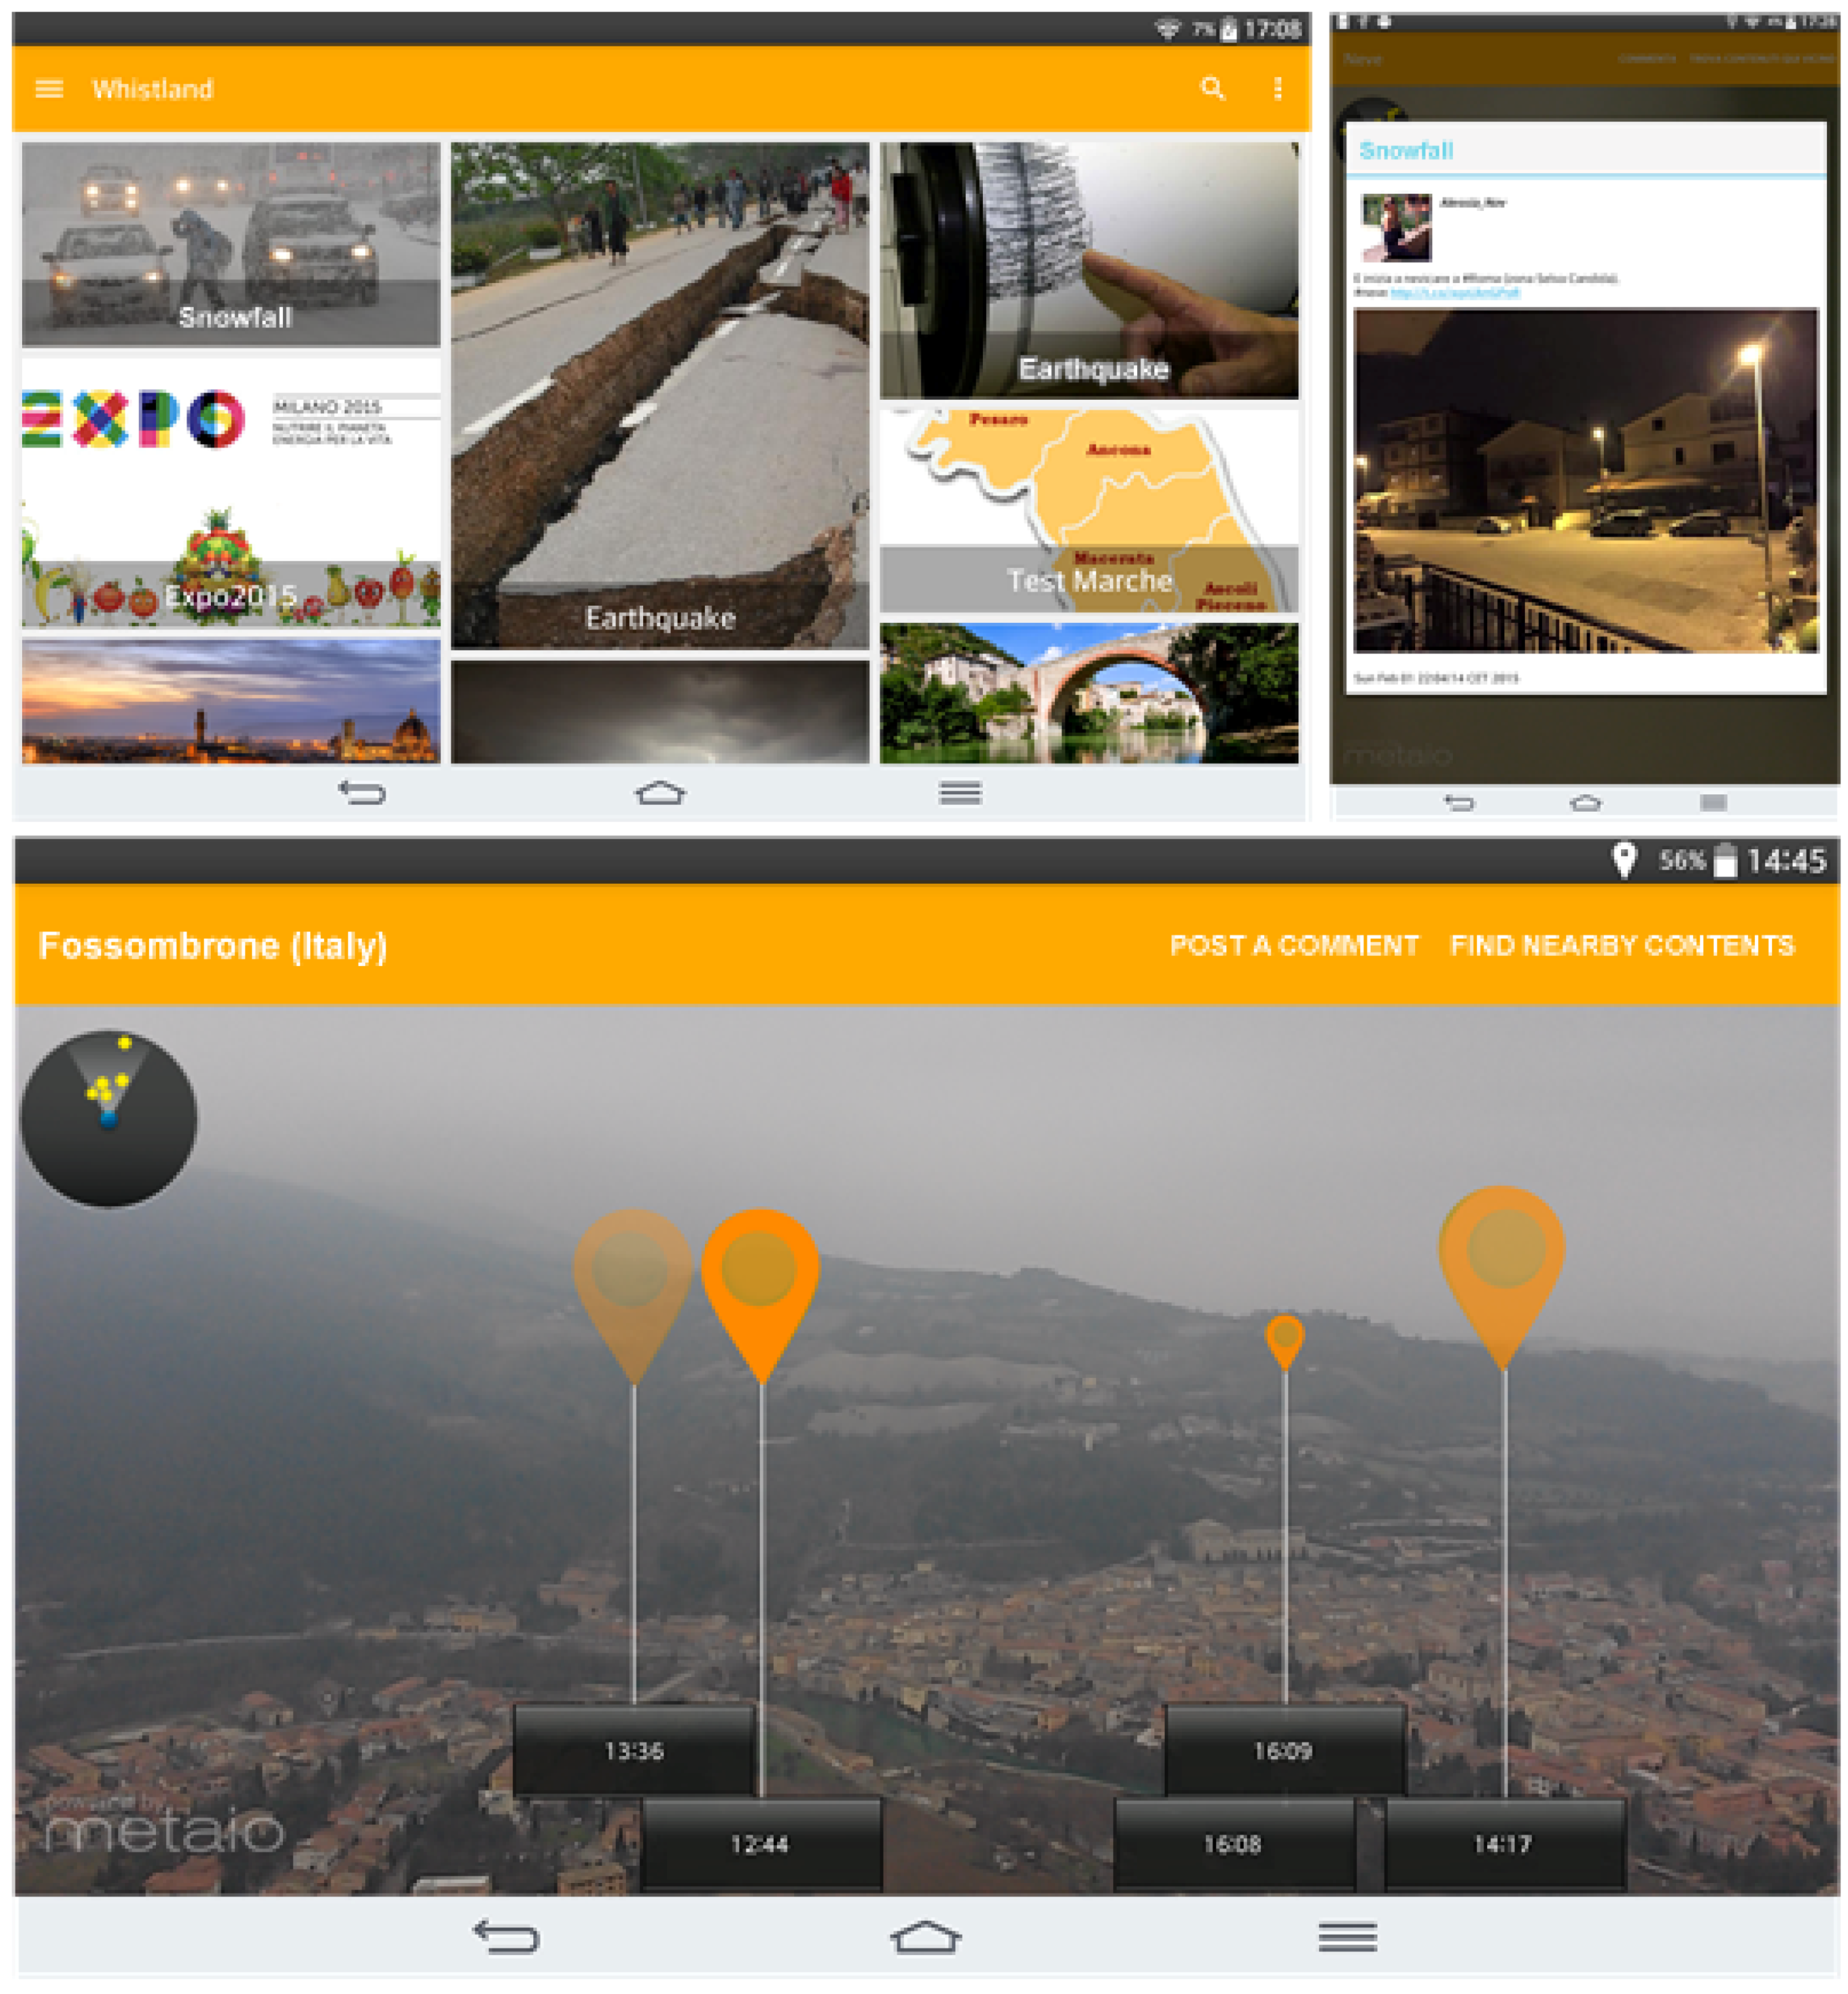
For each
TweetContent provided (the
Feature, in the ARML standard), a 3D marker (the
VisualAsset, in the ARML standard) is drawn on top of the images captured by the device camera. This marker is placed and rotated on the basis of its coordinates (the
Anchor, in the ARML standard) and the current GPS and compass status on the device. The marker represents a POI and is placed at a specific geolocation as AR content using location-based tracking, as shown in
Figure 3.
Moreover, the distance between the current device position and the 3D marker in the real world is responsible for the size of the screen marker or graphic itself: a nearer screen marker has a bigger size than a further one. If the user touches a screen marker, the application tries to retrieve original information about the underlying tweet using the Twitter REST API.
Once the original tweet has been retrieved, its content is cached and wrapped by the TweetContent object as usual, so future actions do not require another network call. This wrapping mechanism has been implemented on the component that linearizes the three API streams, as well. To speed up the retrieval process, all of the TweetContent from the Twitter APIs have a ready reference to the original tweet. When this is available, an overlying panel displays the main information, such as user (avatar, name and surname), text and date of the tweet and the eventually attached image.
Furthermore, for each event, a panel collecting all of the special assets that are of possible interest for the analysis has been made available: the mobile application supports common formats for images, audios/videos and 3D models.
The 3D capability is an interesting and a useful feature in its own right, as an example, consider the needs of an operator who needs information about a particular building or the previous status of a river basin. According to the extension of the special asset selected, the application opens the built-in viewer for images and audio/videos and exploits the ad hoc plug-in for the visualization of 3D models. There is much important information instantly available to the worker on demand, and as has been said earlier, this makes a difference to the quality of response that an agency can offer to any unforeseen situation.
The 3D plug-in is built on top of the VES/VTK libraries (
http://www.vtk.org, last access: 7 February 2017), and it allows advanced exploration and use of the models managed. It was developed as an external plug-in to keep the main application as thin as possible and to make it suitable for legacy device operation. Moreover, the choice of using an external plug-in gives a greater modularity to the mobile application, completely in line with the philosophy and software engineering requirements of the Whistland project.
5.3. Cache System
Consumer mobile devices typically work on public cellular networks without specific guarantees for reliability and availability. The lack of a stable connection is a significant problem that needs to be addressed in situations of civil emergency. For this reason,
TweetContents and other data structures are modeled to make their storage in a cache subsystem possible. Since Android (and other) platforms include an SQLite database in the OS, the caching subsystem exploits this to take advantage of the object-relational mapping (ORM) tool. When a data connection is available, the application retrieves contents from Twitter and from
GeoData Collector, storing it in the cache subsystem, eventually updating existing ones. When a data connection is not available, the application uses the contents stored in the cache subsystem as an alternative source for Android loaders, permitting the AR exploration without Internet access if need be. The AR application module always loads
TweetContents from the cache subsystem in a transparent way, delegating retrieval operations (see
Figure 4).
5.4. Data Management
The opportunity for the user, acting as a crowd-mapper, to write a post about the event they are currently “exploring” is another essential feature implemented in the client side. The same ORM tool has been used to locally cache pending tweets written by the user of the application. This choice has been made to once again tackle the issue of a lack of server connectivity. If the user writes a post while the device is off-line, the system saves all of the information in the local flash storage, marking it as pending, which is standard procedure for usable cloud services. When a proper data connection becomes available, the application is notified by the Android system through a broadcast intent: at this time, an Android service is started, and it will send all pending tweets stored in the cache. All of the contributions are sent by the Whistland Publish API to the GeoData Collector, which actually posts them on Twitter on behalf of the users logged in.
It is also possible to overlay other layers on the AR view quite apart from the social source of information. To deal with some of the requirements in the scenarios illustrated in
Section 2, we are currently developing a new version of the Whistland system able to manage sensors enabled for the OGC-SWE standard. In particular, the
GeoData Collector acts as a registry of georeferenced sensors and provides their metadata to client applications. Such information is typical of what can augment the AR view along with the social feed. This capability extends the usefulness and specialization of the application to different environments promoting its overall customizability and performance metrics in line with what a given organization might expect.
The sensor capability permits the client to localize sensors on the AR view and retrieve their information by means of the Sensor Observations Service standard (
http://www.opengeospatial.org/standards/sos, last access: 7 February 2017). According to the type of sensor involved, the AR view can render this information properly: for example, a sensor on the bridge with an alarm status can be rendered as a red blinking asset to attract the operator’s attention. It is also possible to consider vehicles as moving sensors (a
PointOfInterest with dynamic location) and easily integrate them on the AR view to provide all of the elements required by the explained scenarios. The visual enrichment of the resulting handheld application is clear.
Finally, the
Mobile Application allows the user to access the
Analytics Dashboard, as described in
Section 6, which is designed to be easily consulted on mobile devices.
6. Analytics Dashboard
The main features of the
Analytics Dashboard are:
Generate report of events/regions/their combinations (geo-query);
Generate heat-maps to view the result of the geo-query;
Apply a temporal filter to focus on a given time-frame.
To better understand the geographical area involved in an event or to know and analyze all of the events that have affected a specific region, a web dashboard is a more flexible and usable tool. The
Analytics Dashboard is designed exactly on these lines and is built with a responsive template engine called Bootstrap (
http://www.getbootstrap.com, last access: 7 February 2017).
A thin JavaScript client has been implemented exploiting the RESTful Whistland History API and Whistland Analytics API exposed by the GeoData Collector: the server returns only textual information (JSON format), so that the client is responsible for further processing and for rendering. In this way, the server is not overloaded by unnecessary operations (i.e., processing and rendering), and the load is distributed among all of the clients, effectively implementing a distributed computing framework as a natural part of the design.
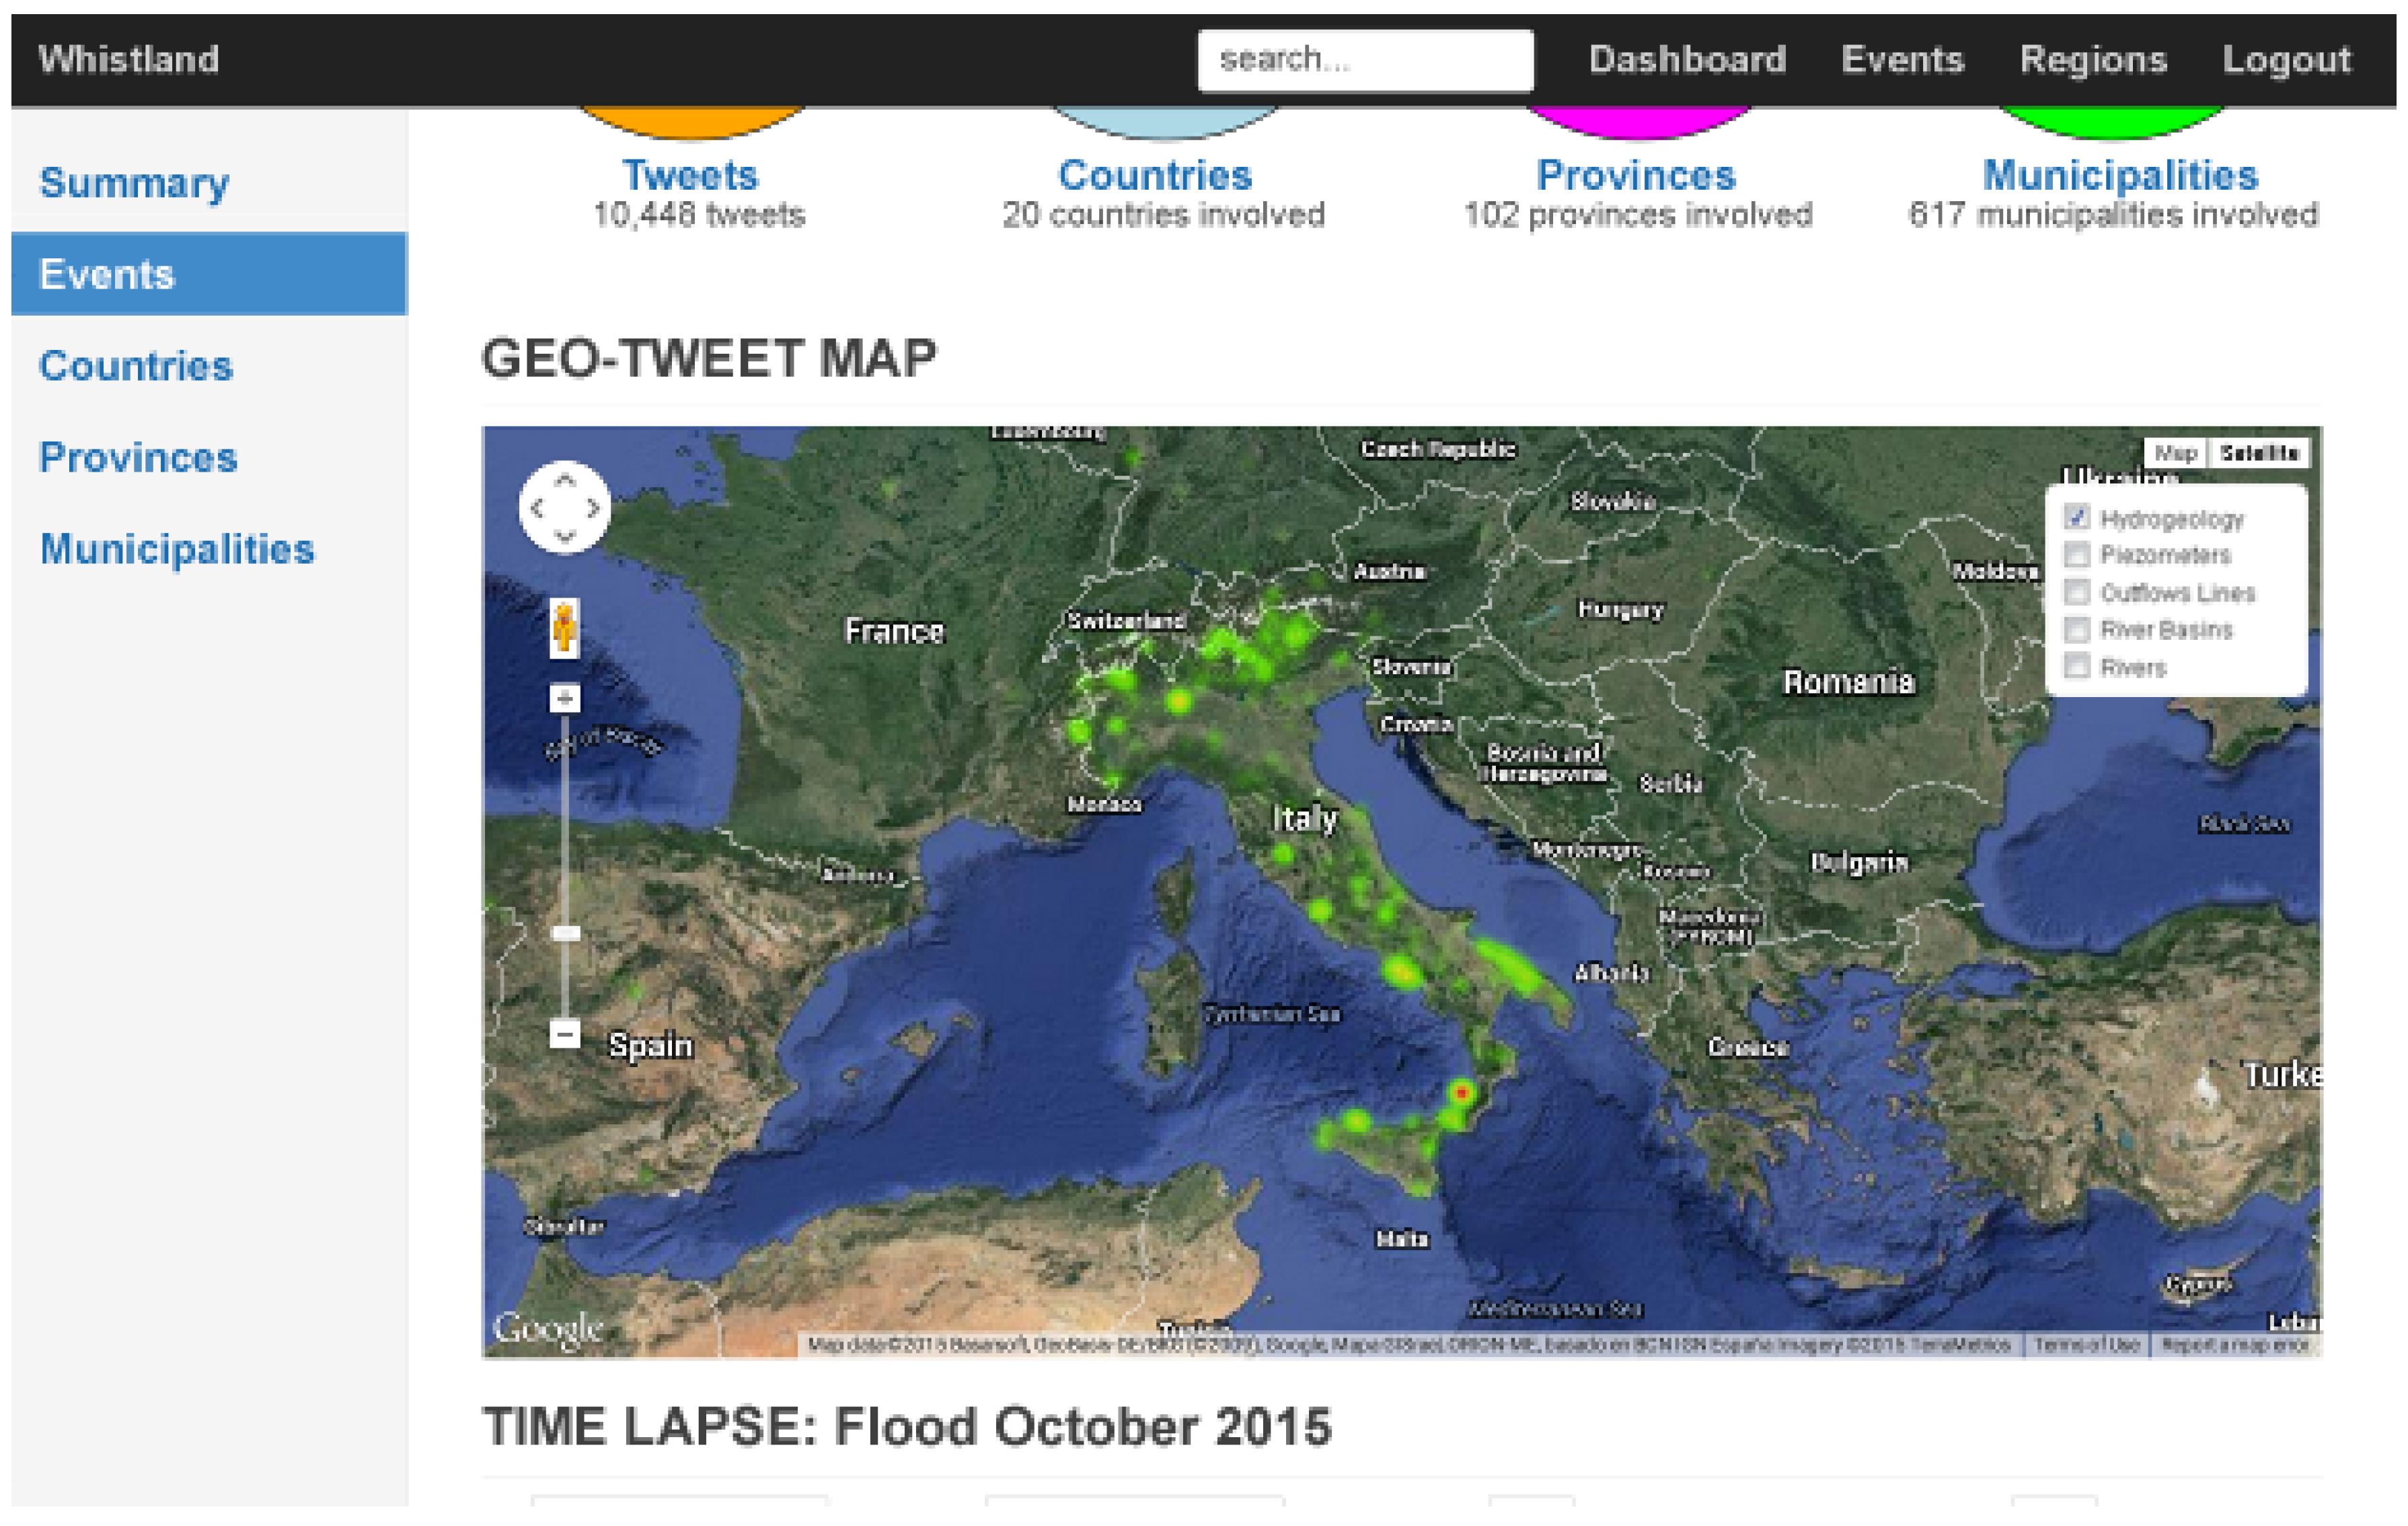
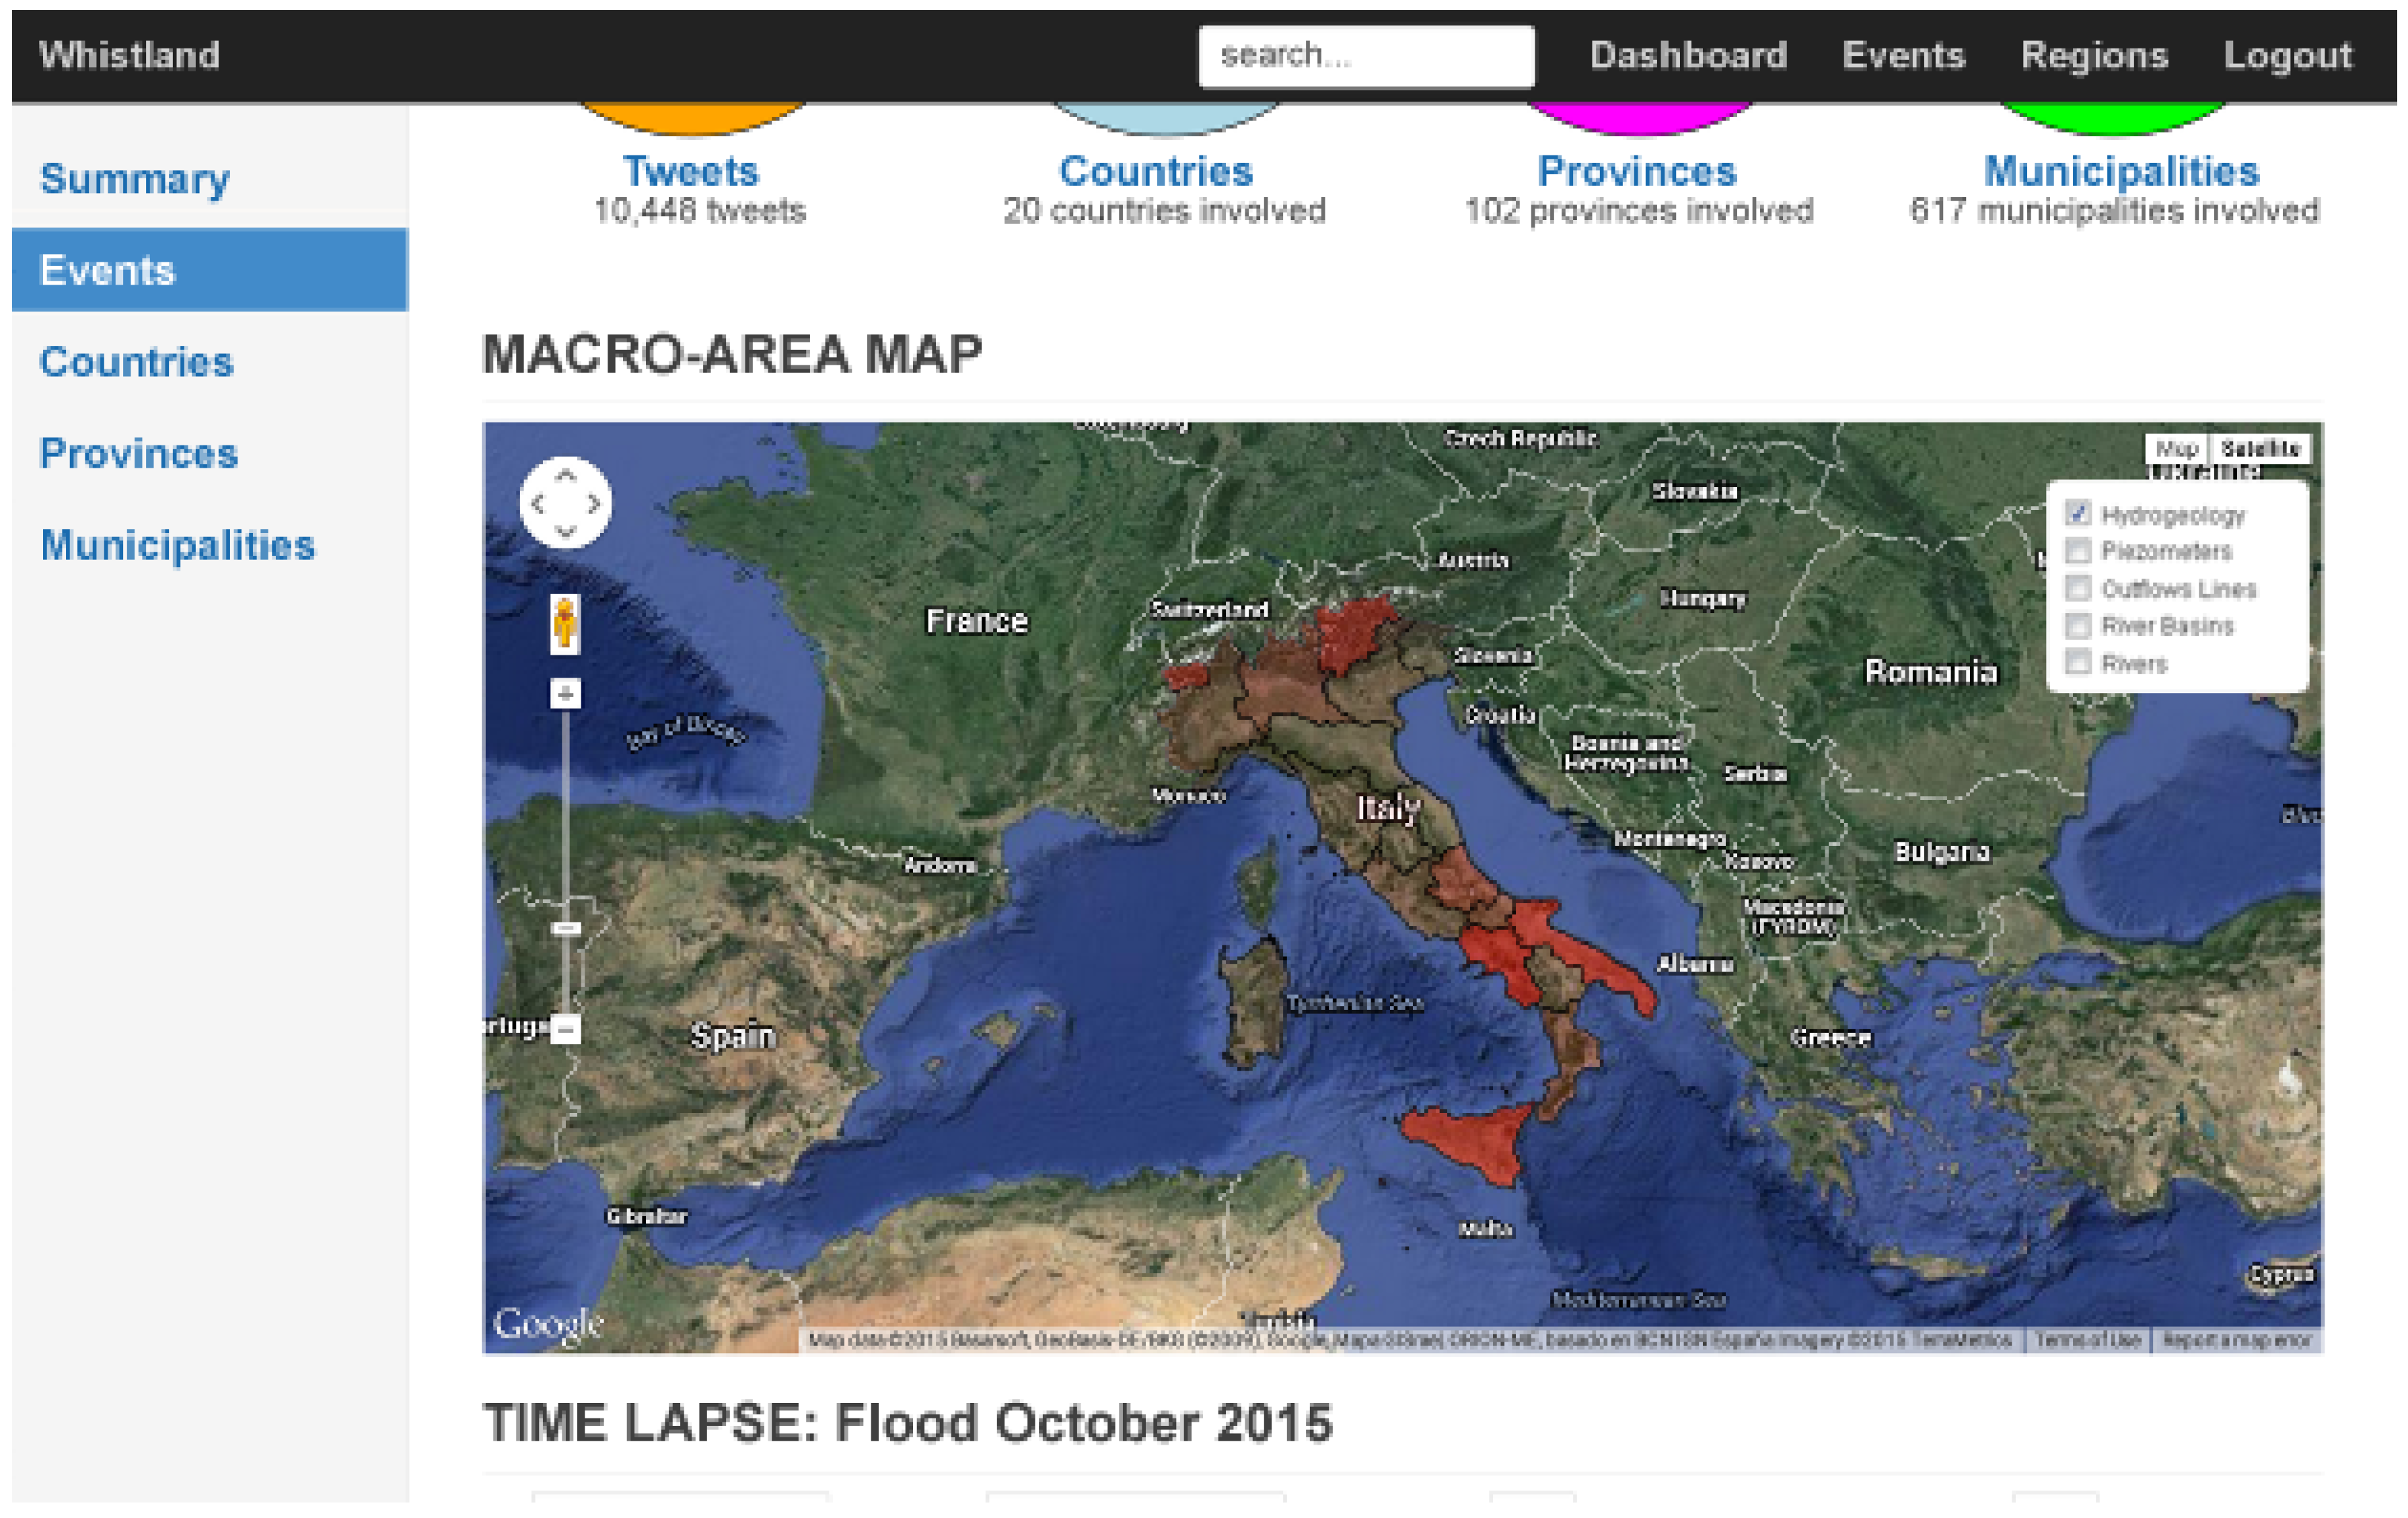
The Analytics Dashboard generates reports for events, regions or their combinations. In particular, there are synthetic indicators like the number of tweets for the event in the selected region, the number of regions involved, tabular reports and two types (geo-tweet and macro-area) of heat-maps. The heat-maps are dynamically rendered on the basis of the tweets retrieved by the temporal slice specified by the user through the interface.
The geo-tweet heat-map takes into account only the tweets with assigned GPS coordinates, ignoring tweets that have no explicit coordinates. See
Figure 5 for an example. The macro-area heat-map refers to the concept, illustrated in
Section 4, of the region associated with a tweet filtering tweets without associated regions.
The hashtag tweet is not annotated with a precise geographical reference, but the system knows the geometry of the general region involved, so the dashboard can render instead a macro-area analysis, as shown in
Figure 6. The regions permit reorganization in a hierarchy to allow analysis with different levels of spatial aggregation.
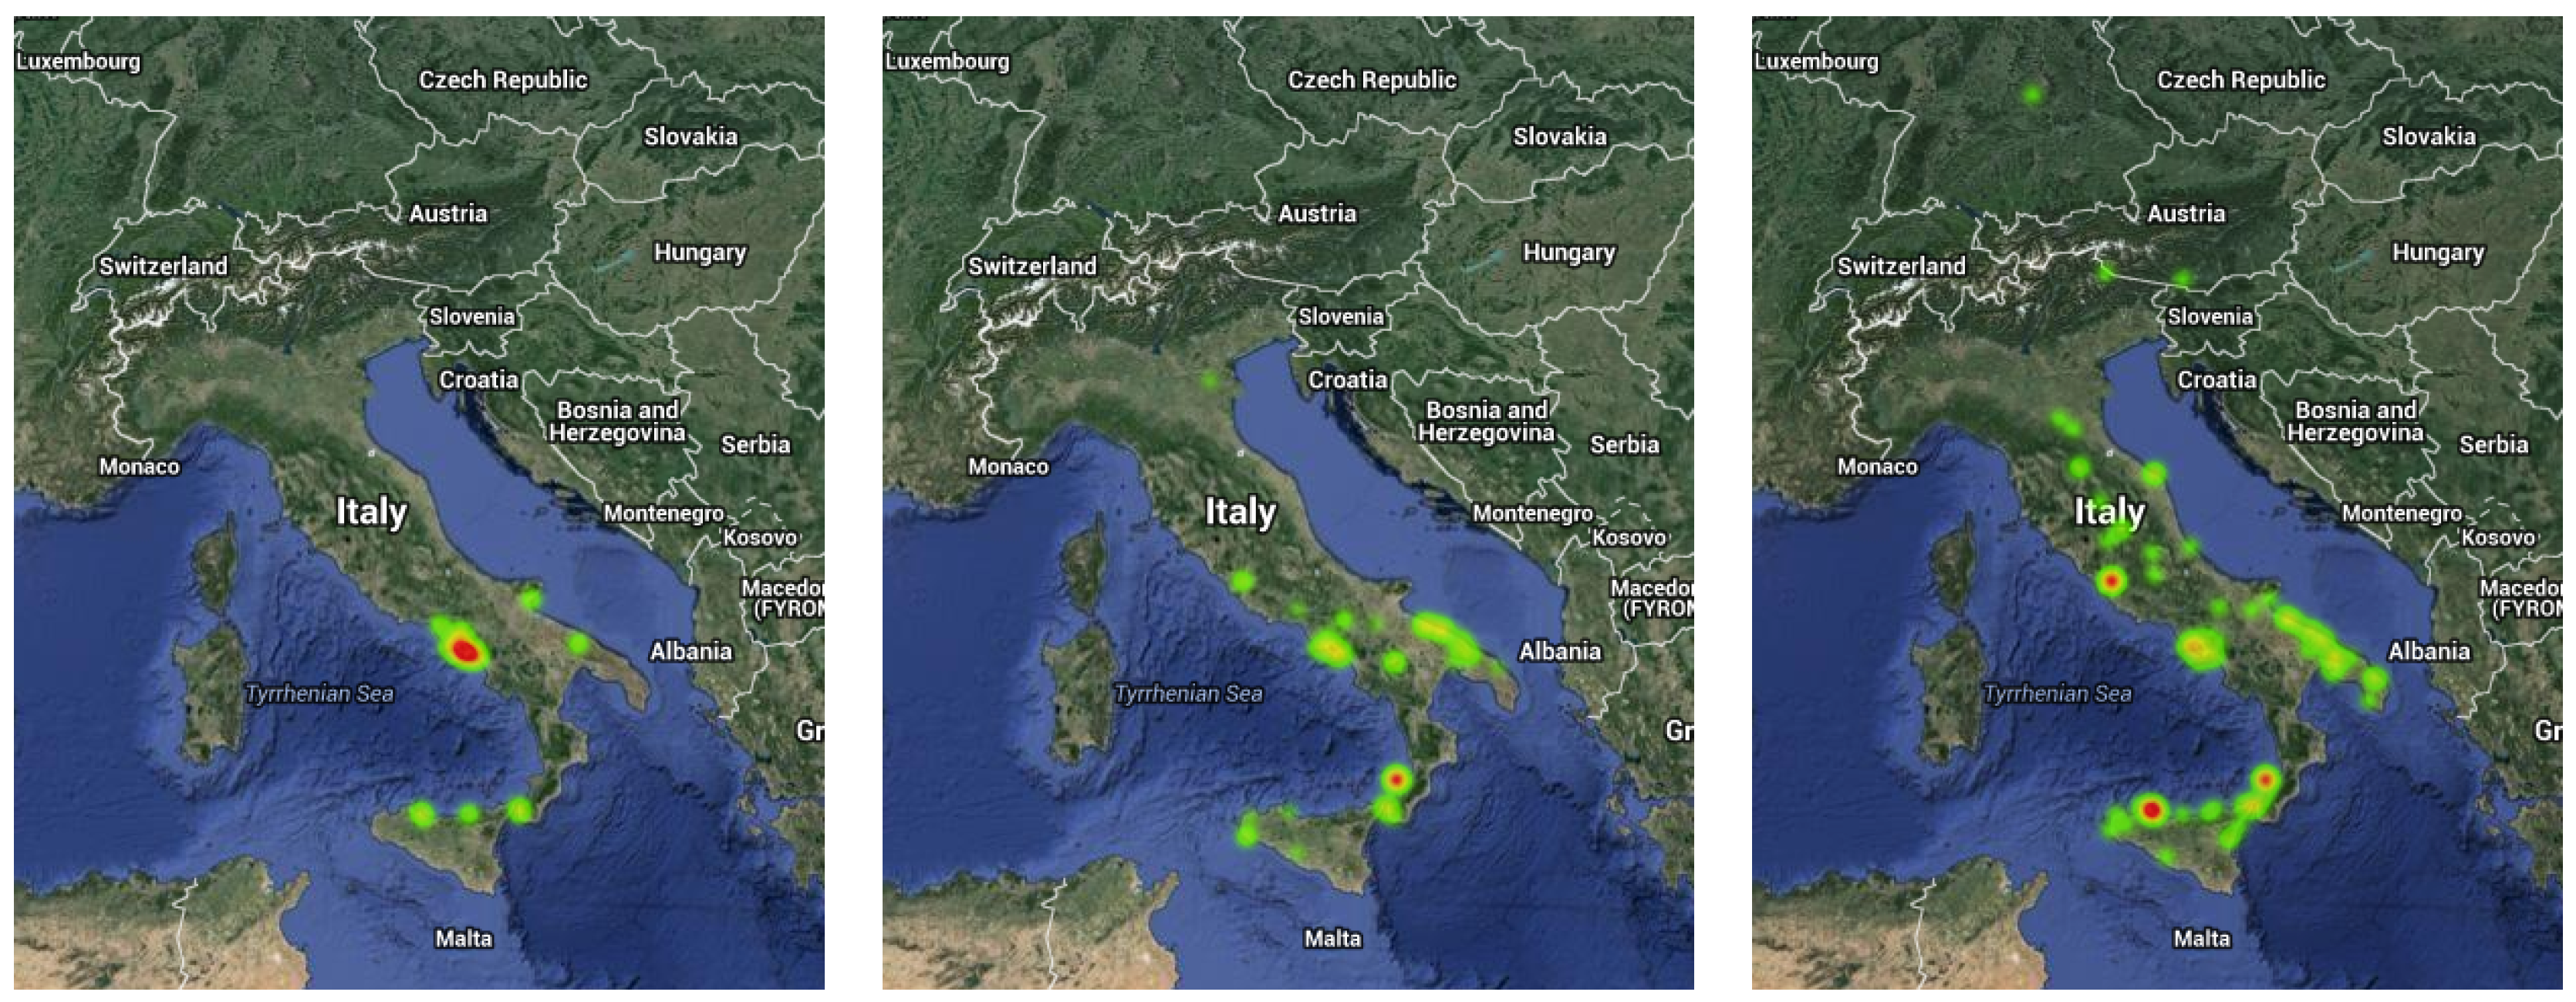
Both heat-maps can be animated slicing all of the event tweets into time windows, adopting the technique described in [
29].
Each window has a start and an end date and contains all of the tweets published within this interval. The timing engine acts as a player for the heat-maps, retrieving all of the tweets inside each window. This process is comparable to a media player, each window corresponding to a video “frame”. The operator can specify the temporal bounds of the analysis and the length of the window. The
Analytics Dashboard loads all of the event tweets inside the specified temporal bounds and slices the tweets, according to the window’s length. Furthermore, once this is done, the frame granularity and the rate of playback is adjustable. This mechanism allows the user to understand the dynamics of an event, taking into account also the temporal dimension alongside the capability to perform spatial queries, as shown in
Figure 7. The addition of the temporal dimension to the analysis in this way completes the analysis step in a fundamental and important way. In particular, referring to the point made above about derived analyses from a powerful set of base data classes, the temporal facility holds much potential for future development of the Whistland system.
To increase user analysis capabilities, the Analytics Dashboard allows overlaying on the maps all georeferenced data stored in the GeoData Collector as Layer. The web-GIS viewer can also visualize other sources of geo-data published on Internet that are supported by the Google Maps library used to develop it. This feature is very important for integration of the Analytics Dashboard as a tool for territory management, whenever there is a necessity to visualize ancillary data trusted by a government source. On the other hand, by exposing data in a GeoJSON format, the Whistland Analytics API permits Whistland to be easily integrated into an existing management platform.
7. Conclusions and Future Works
In this paper, we presented a prototype of the Whistland system, a crowd-mapping application for civil protection and emergency management.
The Whistland system integrates crowd-mapping, sensor and social networks, IoT and AR. Its main feature is the provision of a cooperative networking solution feeding to and analyzing the data from an extensive and highly accessible knowledge base that categorizes in real time the spatio-temporal state of a territory. The comprehensive and large-scale information retrieval and storage capability delivers an IT layer that closely knits the operations management of civil protection authorities with information available on the Internet at large for events related to disaster management.
The AR technology plays a key role in making the information from social and sensor networks accessible for quick interpretation of geo-data to professionals and common users working on the scene of an emergency. The AR capability on mobile applications allows users to confidently localize content and produce georeferenced information. Furthermore, a 3D viewer plug-in permits the advanced visualization of special assets useful for civil protection scenarios.
The social network integration through an innovative pointer-like mechanism provides qualitative information that sensors are unable to capture. The pointer mechanism keeps the storage requirement to a minimum, but it allows quick retrieval of the original contents for further analysis. Sensor networks and IoT, by collecting quantitative data dynamically, support the process in a complementary way to the information retrieved through the social networks.
Thus considered, the Whistland system is designed and developed to be a flexible decision support system for civil protection and emergency management, providing a complete spatio-temporal system for further application development:
The natural language analysis of tweet text will increase the accuracy of geolocalization, inferencing flows as described in [
30].
The full support of the ARML 2.0 and OGC-SWE standards will ensure a better and more extensive integration of external data sources in the developed mobile application.
The generation of 3D models from the images captured by the device’s camera will increase the usefulness and attractiveness of the application.
Finally, we are investigating a way to support a “two-channel” mode for the mobile application: the current channel will remain unchanged as the public channel for citizens, while a protected emergency channel will be developed for “advanced scenarios”. Dividing the interface model in this fashion increases the efficiency and quality of interaction for each class of user within the application space. This channel-based division of service allows in particular a tackling of the connectivity issues that can occur in a private network setup by the civil protection authority during an emergency.


