1. Introduction
In terms of creating a better future of smart cities, it becomes crucial when considering what information is accessible to whom at a fine spatio-temporal scale where individuals can be identified [
1]. Smart city, as a new pattern of urban governance and social development in the information era, can merge, coordinate and integrate the information and communications technology with traditional infrastructures, which are characterized by owning massive heterogeneous information sources resulted from the enormous data growth both in size and complexity [
2,
3,
4]. From the perspective of information and geographical space, the core of smart city information construction is the integration and sharing for various types of data resources.
With the acceleration of the urbanization process in China, city emergencies, such as natural disasters and accidental disasters, occur more and more frequently, thus causing much serious harm to our lives and property safety. In reality, because of the lack of instant and reliable data, the “smart” aspects of the emergency response have been severely hampered. It is particularly important to know how to monitor and address disaster response scenarios to minimize casualties [
5]. By providing heterogeneous emergency response data and access to appropriate emergency rescue services, decision makers will be supported with more rapid and proper emergency responses [
6]. Besides, in order to achieve the goal of data-sharing for emergency responses, interdisciplinarity as an interactive process to solve a complex problem [
7,
8,
9] can be applied. Focusing on the different bodies of knowledge or research practice, interdisciplinarity is a synthesis of ideas, data and information, methods, tools, concepts, or theories from two or more disciplines to produce new knowledge or products [
10,
11]. Thus, despite various different definitions of interdisciplinarity focused on specific aspects [
12], the term of “interdisciplinary” in this paper is presented from the different fields’ perspective. That is to say, each emergency response related department involved in various fields, such as environmental science, earth sciences and medicine, is required to realize a unified instant interoperability of interdisciplinary data and provide the needed emergency resource scheduling scheme for decision-making.
For the point observations, that is, the measurements made at a point in space, e.g., in-situ monitoring station and mobile monitoring site, it is noteworthy that spatial information can make the information integrated from interdisciplinary various usages and users [
13,
14], and a consistent representation of temporal information should also be contained in a proper temporal dimension for observation modeling [
15]. However, due to the diversity of application and distribution of sensors, point observation data are decentralized in terms of location with different levels of detail description, for example, various descriptions of coordinate reference system. In fact, because of the differences both in sensors and observation principles, it is hard to discover and access the consistent and instant interdisciplinary point observation data, the problem of the effective sharing for multi-source, decentralized and heterogeneous data has not been solved. Therefore, the sharing for multi-source, decentralized and heterogeneous interdisciplinary instant point observation data is faced with two major problems. One problem is the lack of available metadata content descriptions which could effectively represent the characteristics of point observation data, especially the comprehensive and consistent description of spatial and temporal information. It is a great challenge to share the point observation data in a unified framework to satisfy the user demands. The other problem is the software support of large-scale and heterogeneous point observation data-sharing for the improvement of the available information applications and services.
As a key part of information resource sharing, metadata are the descriptive data for the right discovery of needed data at the right time and location with the right quality [
16]. However, the existing various representations of metadata information results in information silos among different systems [
17]. To meet the specific application needs of different fields, some geospatial related metadata standards concentrate on information sharing and interoperability, but differences between them still exist [
18]. As shown in
Table 1, six geospatial or observation-related metadata standards are considered with descriptions of metadata content, encoding schema and application. International Organization for Standardization (ISO) 19115 [
19] provides the elementary metadata to describe and discover geographical information. ISO 19130 [
20] defines the metadata for the geolocation of remote-sensing data in the aspect of concept, and the National Geospatial-Intelligence Agency (NGA), the Community Sensor Model (CSM) [
21] further provides the metadata in the aspect of implementation. Open Geospatial Consortium (OGC)’s Sensor Model Language (SensorML) [
22] is the metadata representation of sensor modeling, sharing and interoperability. Observations and Measurements Schema (O&M) [
23] and Earth Observation Metadata profile of O&M [
24,
25] provide the metadata for the sensor observation data interoperability from the perspectives of concept and implementation, respectively. The six metadata standards listed above have distinct description features for different applications, which are relatively perfect for specific data interoperability, however, it is still hard to cover the metadata content satisfying the characteristics of various interdisciplinary instant point observation data.
Previous works on data-sharing technologies, to a certain degree, have generally promoted users who are using different computers and software in different places to read, operate, and analyze various data of others. Kiryakov et al. [
26] indicated that semantic annotation can access new information or extend the existing information with several pre-conditions needed for the representation to define and link to the semantic descriptions of the entities. However, the pre-conditions lead to several requirements, such as human intervention in information extraction, dependence on the pre-established ontology and limits on the content description, and the full support of semantic annotation usage have not been solved. Gunay et al. [
27] developed a transportation ontology domain to achieve more effective and accurate access and retrieval for domain-specific interactions, and a public transportation geoportal was established to implement INSPIRE as a SDI standard for the sharing of different spatial data between users and applications. However, the transportation domain ontology is semi-automatic which needs a heuristic strategy and domain expertise, and the development of a distributed web server architecture could be required, when it comes to considering a large dataset and a better application’s performance. Wang and Stewart [
28] constructed a hazard ontology to automatically extract spatiotemporal and semantic information from Web news reports. However, it is difficult to apply completely and directly the method to the integration between different stages, and generalized or vague locations or temporal references still exist. Disz et al. [
29] indicated that Web Application Programming Interface can provide access to common methods and data services for data retrieve, especially the access to constantly updated data from the underlying database, but there are still some problems in the organization and interconnection of the related data. Berners-Lee et al. outlined Linked Data for the publishing and connecting structured data in the network, which can provide guides on how to use standardized web technologies to realize the links of data from different sources [
30,
31], while the problems in the application interface, data authenticity and security still exists [
32]. Xiong et al. noted that Data Vitalization, adapted for the analysis and applications for large-scale and heterogeneous data, is data-centric, thus driving developers to think from the angle of data. However, it has deficiencies in realizing the efficient user interface of complex and heterogeneous data sources [
33]. Fan et al. [
4] indicated that Internet of Data holds the view that isolated data instead of interconnecting entities have little meaning for interconnecting all the digital data entities, but due to a lack of user-defined language to describe various data, it can adapt only minimally to the changes in data types and the scenarios in which the data are generated or utilized. All the methods mentioned above promise to provide some effective ways of data-sharing; however, there are still some problems in data content descriptions, data interconnection, software support, and application development for large-scale and heterogeneous data-sharing. Therefore, new methods of data-sharing need to be investigated.
To solve the above problems related to the sharing of diverse instant point observation data from different urban departments, this paper proposes both a new spatio-temporal enhanced Data Meta-Model (DMM) and a prototype system based on DMM. The contributions of our study can be summarized from three aspects as follows.
(1) A new spatio-temporal enhanced metadata model for interdisciplinary instant point observation data sharing is proposed, which can provide a unified and spatio-temporal enhanced description of the point observations by focusing on spatio-temporal characteristics and formulating a ten-tuple information description structure of the proposed DMM.
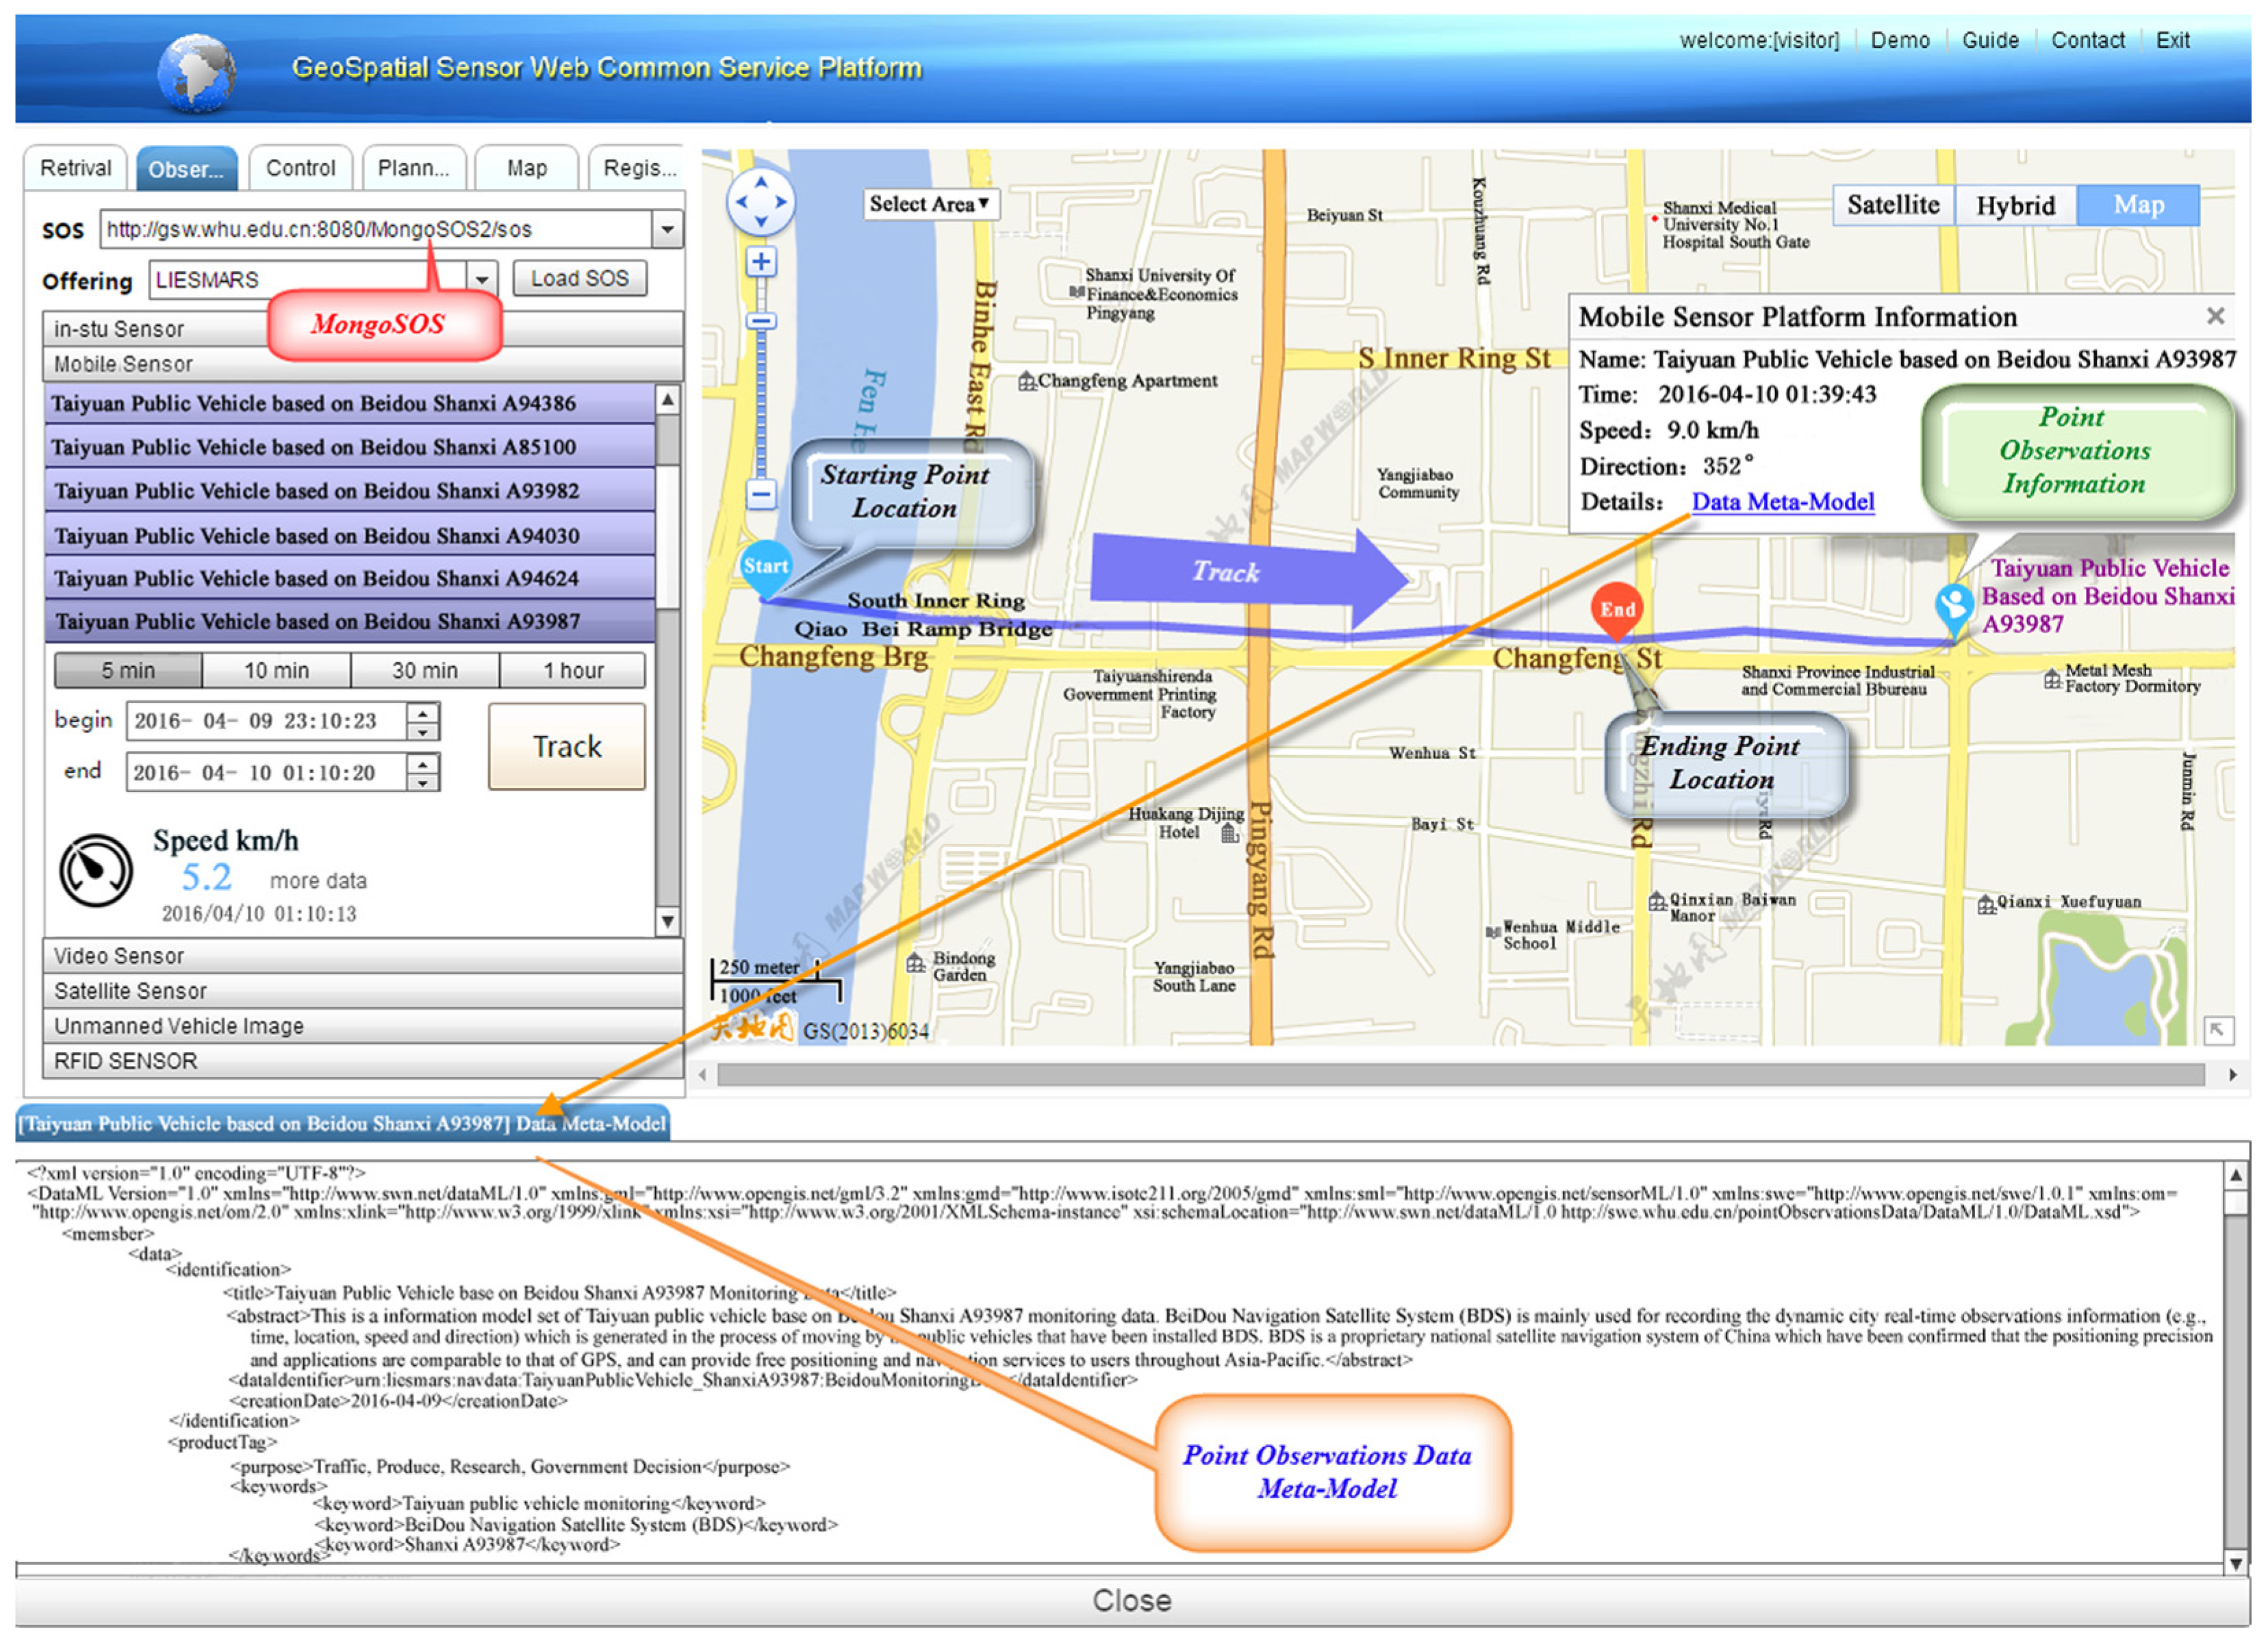
(2) A sharing system is designed and implemented for the instant sharing of point observation data. Especially the response time of the access and insertion for navigation and positioning data can be realized at the millisecond level through the proposed MongoSOS, which is a Not Only SQL (NoSQL) Sensor Observation Service (SOS) based on the MongoDB database and has the capability of distributed storage.
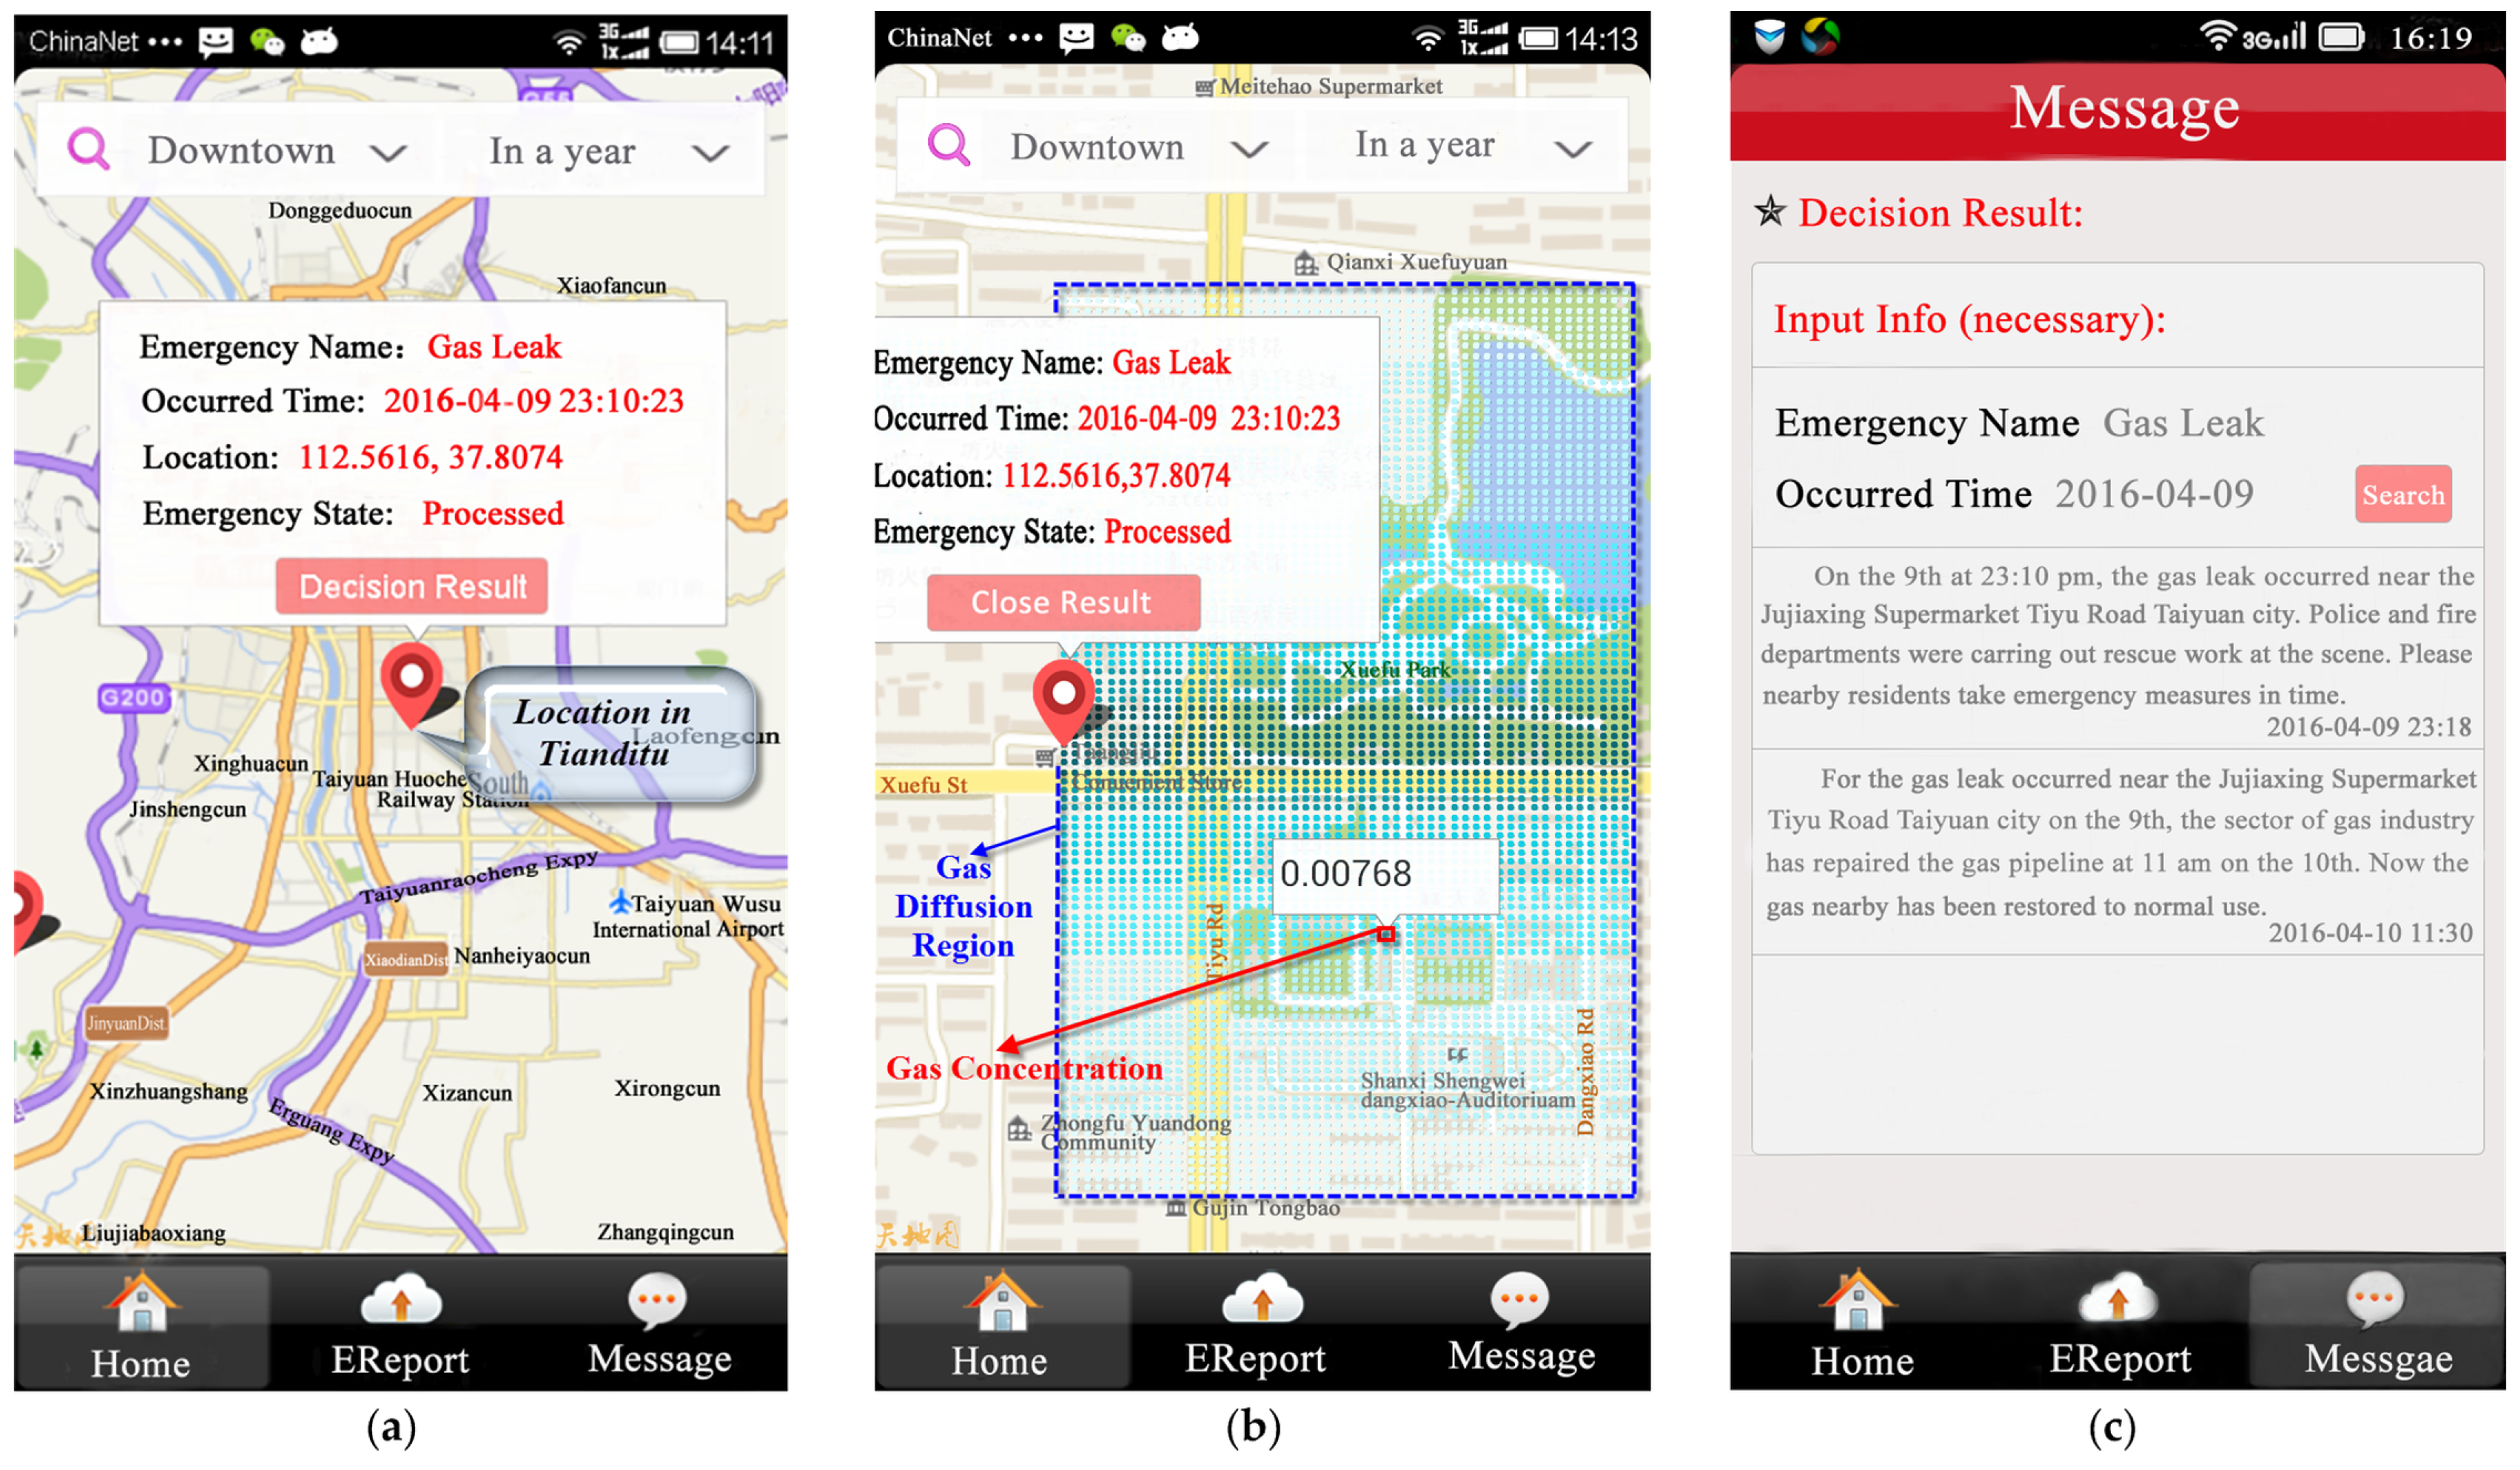
(3) Case studies are conducted, including the gas concentrations monitoring and the smart city public vehicle monitoring based on BeiDou Navigation Satellite System (BDS). The results demonstrate the versatility and extensibility of the DMM, and the spatio-temporal enhanced sharing for interdisciplinary instant point observations in smart cities.
2. Spatio-Temporal Enhanced Metadata Model for Interdisciplinary Instant Point Observations
For addressing diverse and incompatible sharing methods, Sensor Web Enablement (SWE) standards discover and interact Web-accessible sensor data by using open standard protocols and interfaces [
34]. In addition, in order to effectively monitor the environmental information resources, it is essential to obtain the available spatio-temporal data and reliable models [
35], and modeling can provide both a communicative tool and a method to combine the structures and processes involved in interdisciplinary research [
36]. Therefore, considering Extensible Markup Language (XML) as the technology of choice for exchanging information on the Web, it is necessary to propose a suitable point observation data meta-model combined with existing interoperability standards through XML and XML Schema for the improvement of the spatio-temporal enhanced sharing. This section is mainly to propose and construct the DMM for interdisciplinary instant point observations sharing in smart cities.
2.1. Data Classification and Association
To better model the numerous interdisciplinary instant point observations, a classification of the point observation data is developed. According to O&M 2.0 specification [
24], except the seven types of observations result as constants (e.g., Measurement, Category, Count, Truth, Temporal, Geometry, Complex), there are three types of observation results varying over time or space, including the DiscretePointCoverage, the DiscreteTimeInstantCoverage, and DiscreteCoverage. The observation results of DiscretePointCoverage and DiscreteTimeInstantCoverage represent the discrete points and one-dimensional temporal coverage, and are compliant with the spatio-temporal characteristics of the point observations. However, the observation results of the DiscreteCoverage can be two-dimensional or multi-dimensional coverage, such as the remote sensing image data and the LIDAR point cloud data, which cannot be solved by discrete point observations or interpolation trajectory, and are not the focus of this study.
Therefore, according to the different spatio-temporal characteristics of the point observations by fixed or mobile sensors, in particular the observation results are a series of discrete points that vary over time or space, point observation data are classified into two types: the in-situ monitoring data and the navigation and positioning data, which can be viewed as the two feature types of O&M, namely, the DiscretePointCoverage and the DiscreteTimeInstantCoverage, respectively. In-situ monitoring data are generated by fixed point observations in the ground stations; specifically, they are observed by sensors deployed in a fixed position to periodically collect information, which can reflect the continuous changes in the temporal dimension of particular phenomenon in a specific position, and can also form the continuous coverage through interpolation in the spatial dimension of a unified observation phenomenon in multiple spatial positions. Navigation and positioning data are the mobile point observations positioning data of spatio-temporal point sequences with the characteristics of continuity, instant and high precision, which can form a spatial continuous moving track as time-varying.
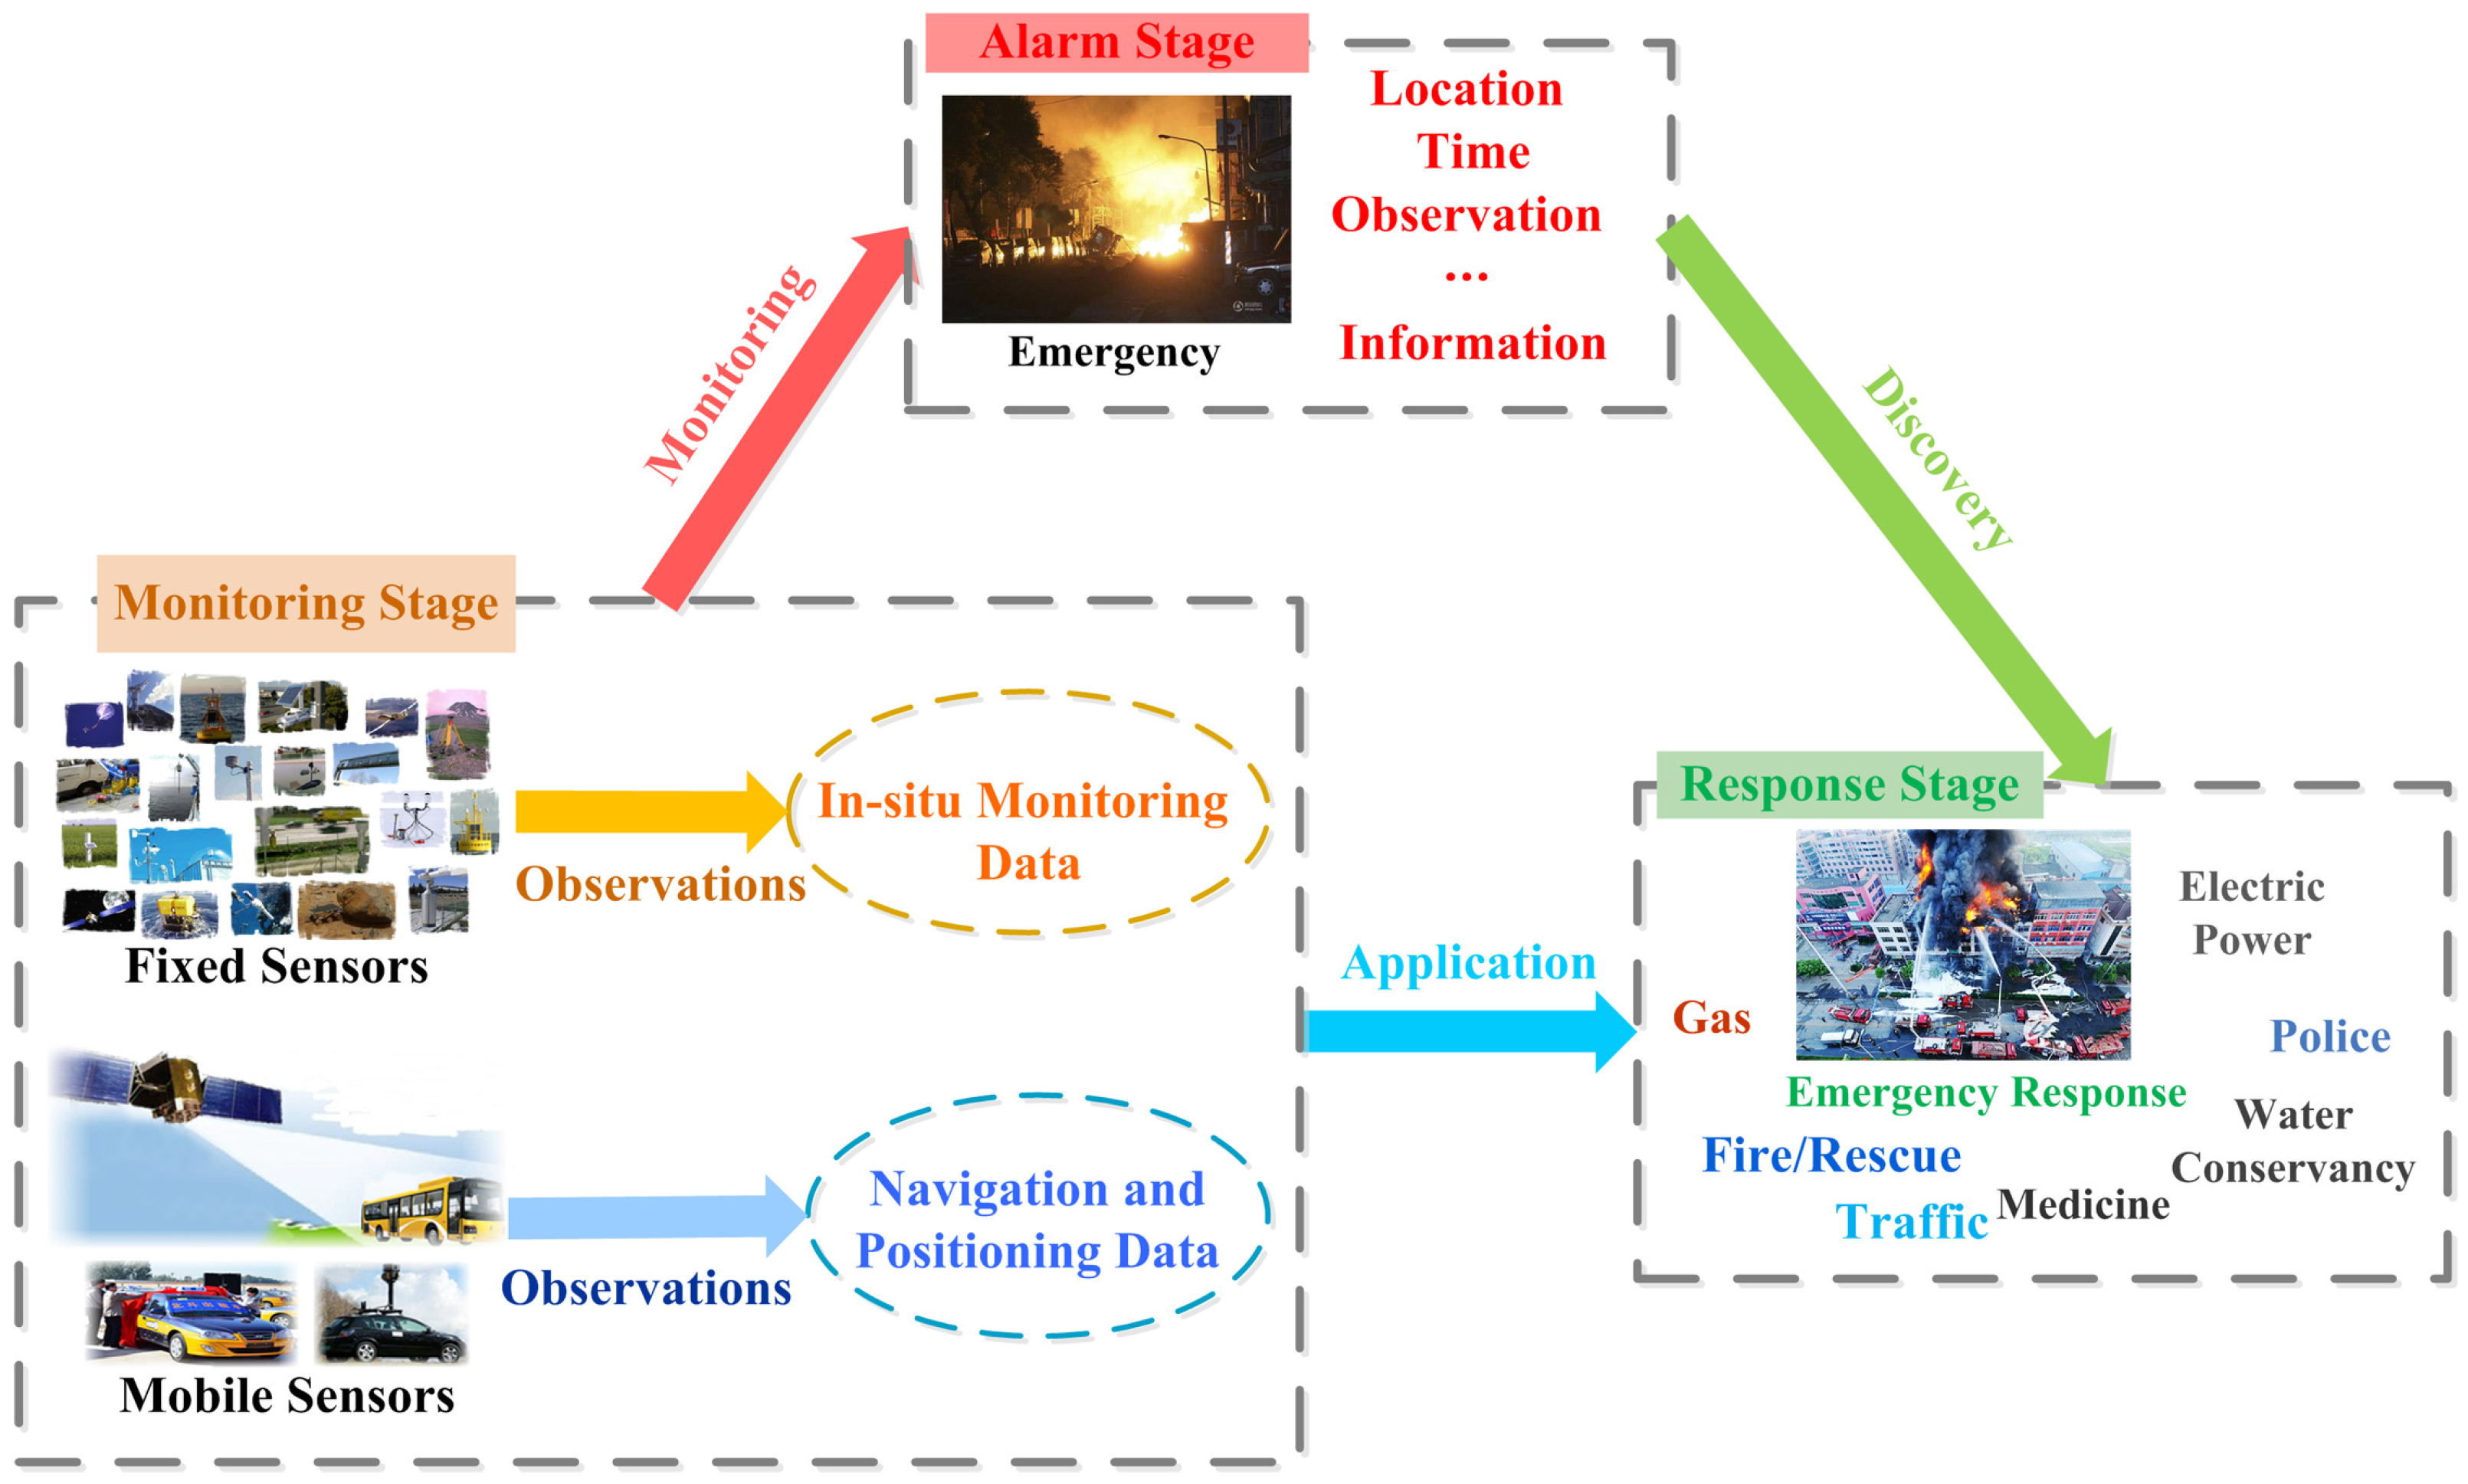
Additionally, as shown in
Figure 1, smart city instant point observation data from various fields are involved in different stages of emergency responses, which should be quickly distributed to the relevant departments. For example, the monitoring stage is mainly to observe and record different types of point observation data isolated in various departments, namely the in-situ monitoring data and the navigation and positioning data; the alarm stage is to discover the location, time and other observation information for the emergency reported by sensors or witnesses; and the response stage is to make interdisciplinary point observation data work cooperatively through the spatio-temporal enhanced sharing for emergency response tasks. Different point observation data can record the spatio-temporal information of city emergencies, thus helping coordinate the sharing application of emergency response tasks in smart cities.
2.2. Data Meta-Modeling
Meta-model is mainly to provide a framework which refers to the abstract concept collection in a particular domain and formulates the constraints and rules for modeling to finish a certain special software process [
37,
38]. It is a good solution to the problem of model generation and integration. To better apply the meta-model to practical modeling, the Object Management Group has proposed the Meta Object Facility (MOF) based on a four-layer architecture, which has been developed into an international standard for meta-models [
39,
40,
41] for a wider range of sharing and interoperability applications.
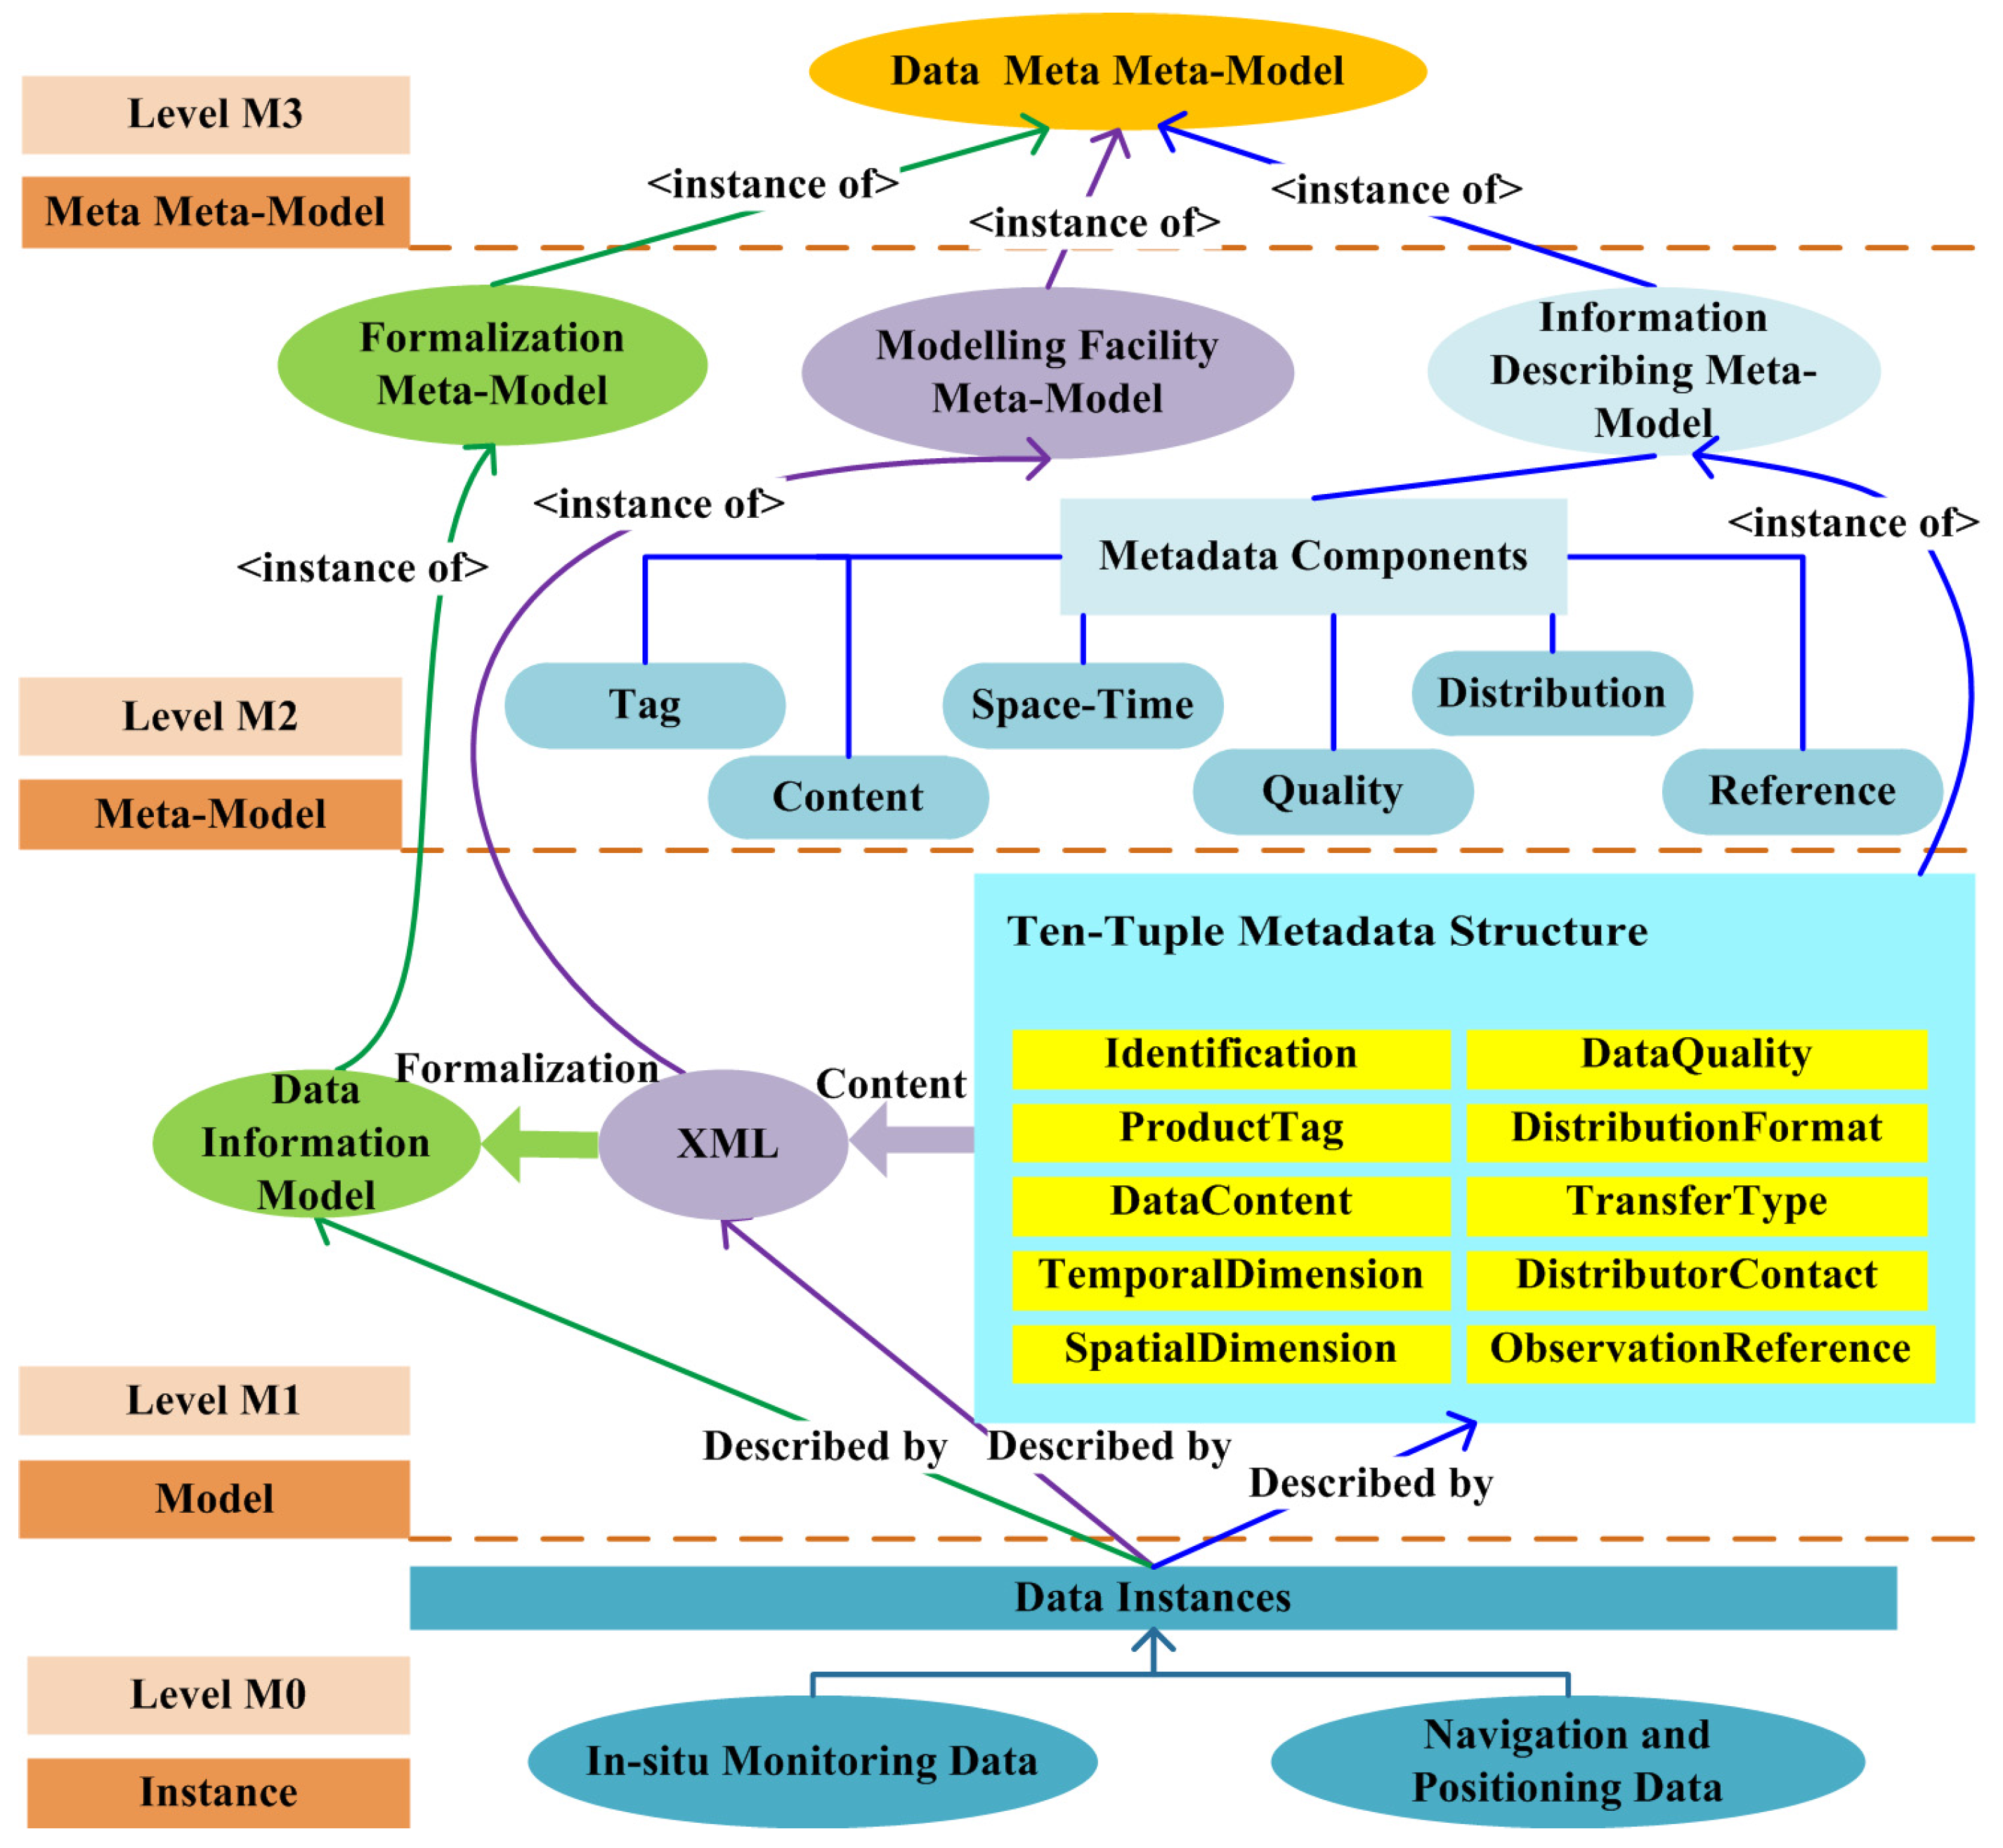
A general framework is able to provide a broader and more flexible group of characteristics to facilitate dealing with larger amounts and more heterogeneous data sources [
42]. To standardize the definition of the point observation description model, a spatio-temporal enhanced point observation data description meta-model framework based on the MOF level is proposed, as shown in
Figure 2. By focusing on the spatio-temporal characteristics, for example, adding the space-time references for each point observation data, and standardizing the hierarchical meta-level structure that includes the Meta Meta-Model Layer, Meta-Model Layer, Model Layer and Instance Layer, the data description meta-model framework can realize the modeling concepts, elements and structures, as well as the relationship description among them in the spatio-temporal dimension.
The Meta Meta-Model Layer, i.e., the highest level M3, is the abstraction of the whole framework, which defines the concepts involved in the modeling of point observations, such as the metadata components, data information model and data instances. The relationships among the concepts are refined, and different levels represent the different abstraction levels of the meta-model; specifically, the data information model is the instance of metadata components, and data instances are the instances of the data information model.
The Meta-Model Layer, i.e., level M2, is the instance of the Meta Meta-model Layer. This layer contains three meta-models, formalization meta-model, modeling facility meta-model and information describing meta-model. Formalization meta-model is used for the formal expression of the meta-model. Modeling facility meta-model illustrates the modeling facility of the data information model. Information describing meta-model contains metadata components aggregated by six different types of metadata class, including Tag, Content, Space-Time, Quality, Distribution, and Reference, which is the core of level M2.
The Model Layer, i.e., level M1, is the instance of the Meta-Model Layer. This layer determines a ten-tuple metadata structure based on the general framework defined by the information describing meta-model in level M2. To formalize the ten-tuple metadata structure, it is essential to use the modeling facilities and the formal expression, which are defined by the formalization meta-model and the modeling facility meta-model in level M2, as well as the modeling facility based on the XML standard coding, thus establishing the point observations description meta-model.
The Instance Layer, i.e., level M0 at the bottom, also includes the instances of point observations that contain the in-situ monitoring data and the navigation and positioning data. Each instance has its own data information, which is formalized by modeling facilities and certain rules of formal expression, for finally establishing the point observation data description model that can be identified by computers and shared within the environment of the World Wide Web.
2.3. Basic Metadata Components of the DMM
Metadata components as mentioned in the Meta-Model Layer, including six parts, Tag, Content, Space-Time, Quality, Distribution and Reference, which are used for the basic information description of the DMM, thus helping discover DMM instances that meet the demands of emergency responses tasks.
Tag: Tag information includes the identification and product information, such as dataset and observation properties, which can provide the basis descriptive metadata information for data discovery and determine whether the data itself can be quickly found for emergency responses.
Content: Content information covers the data type of point observations. Because of the different observation mechanism, the point observation data produced by different sensors have essential differences in data content, thus helping select the DMM within a certain scope.
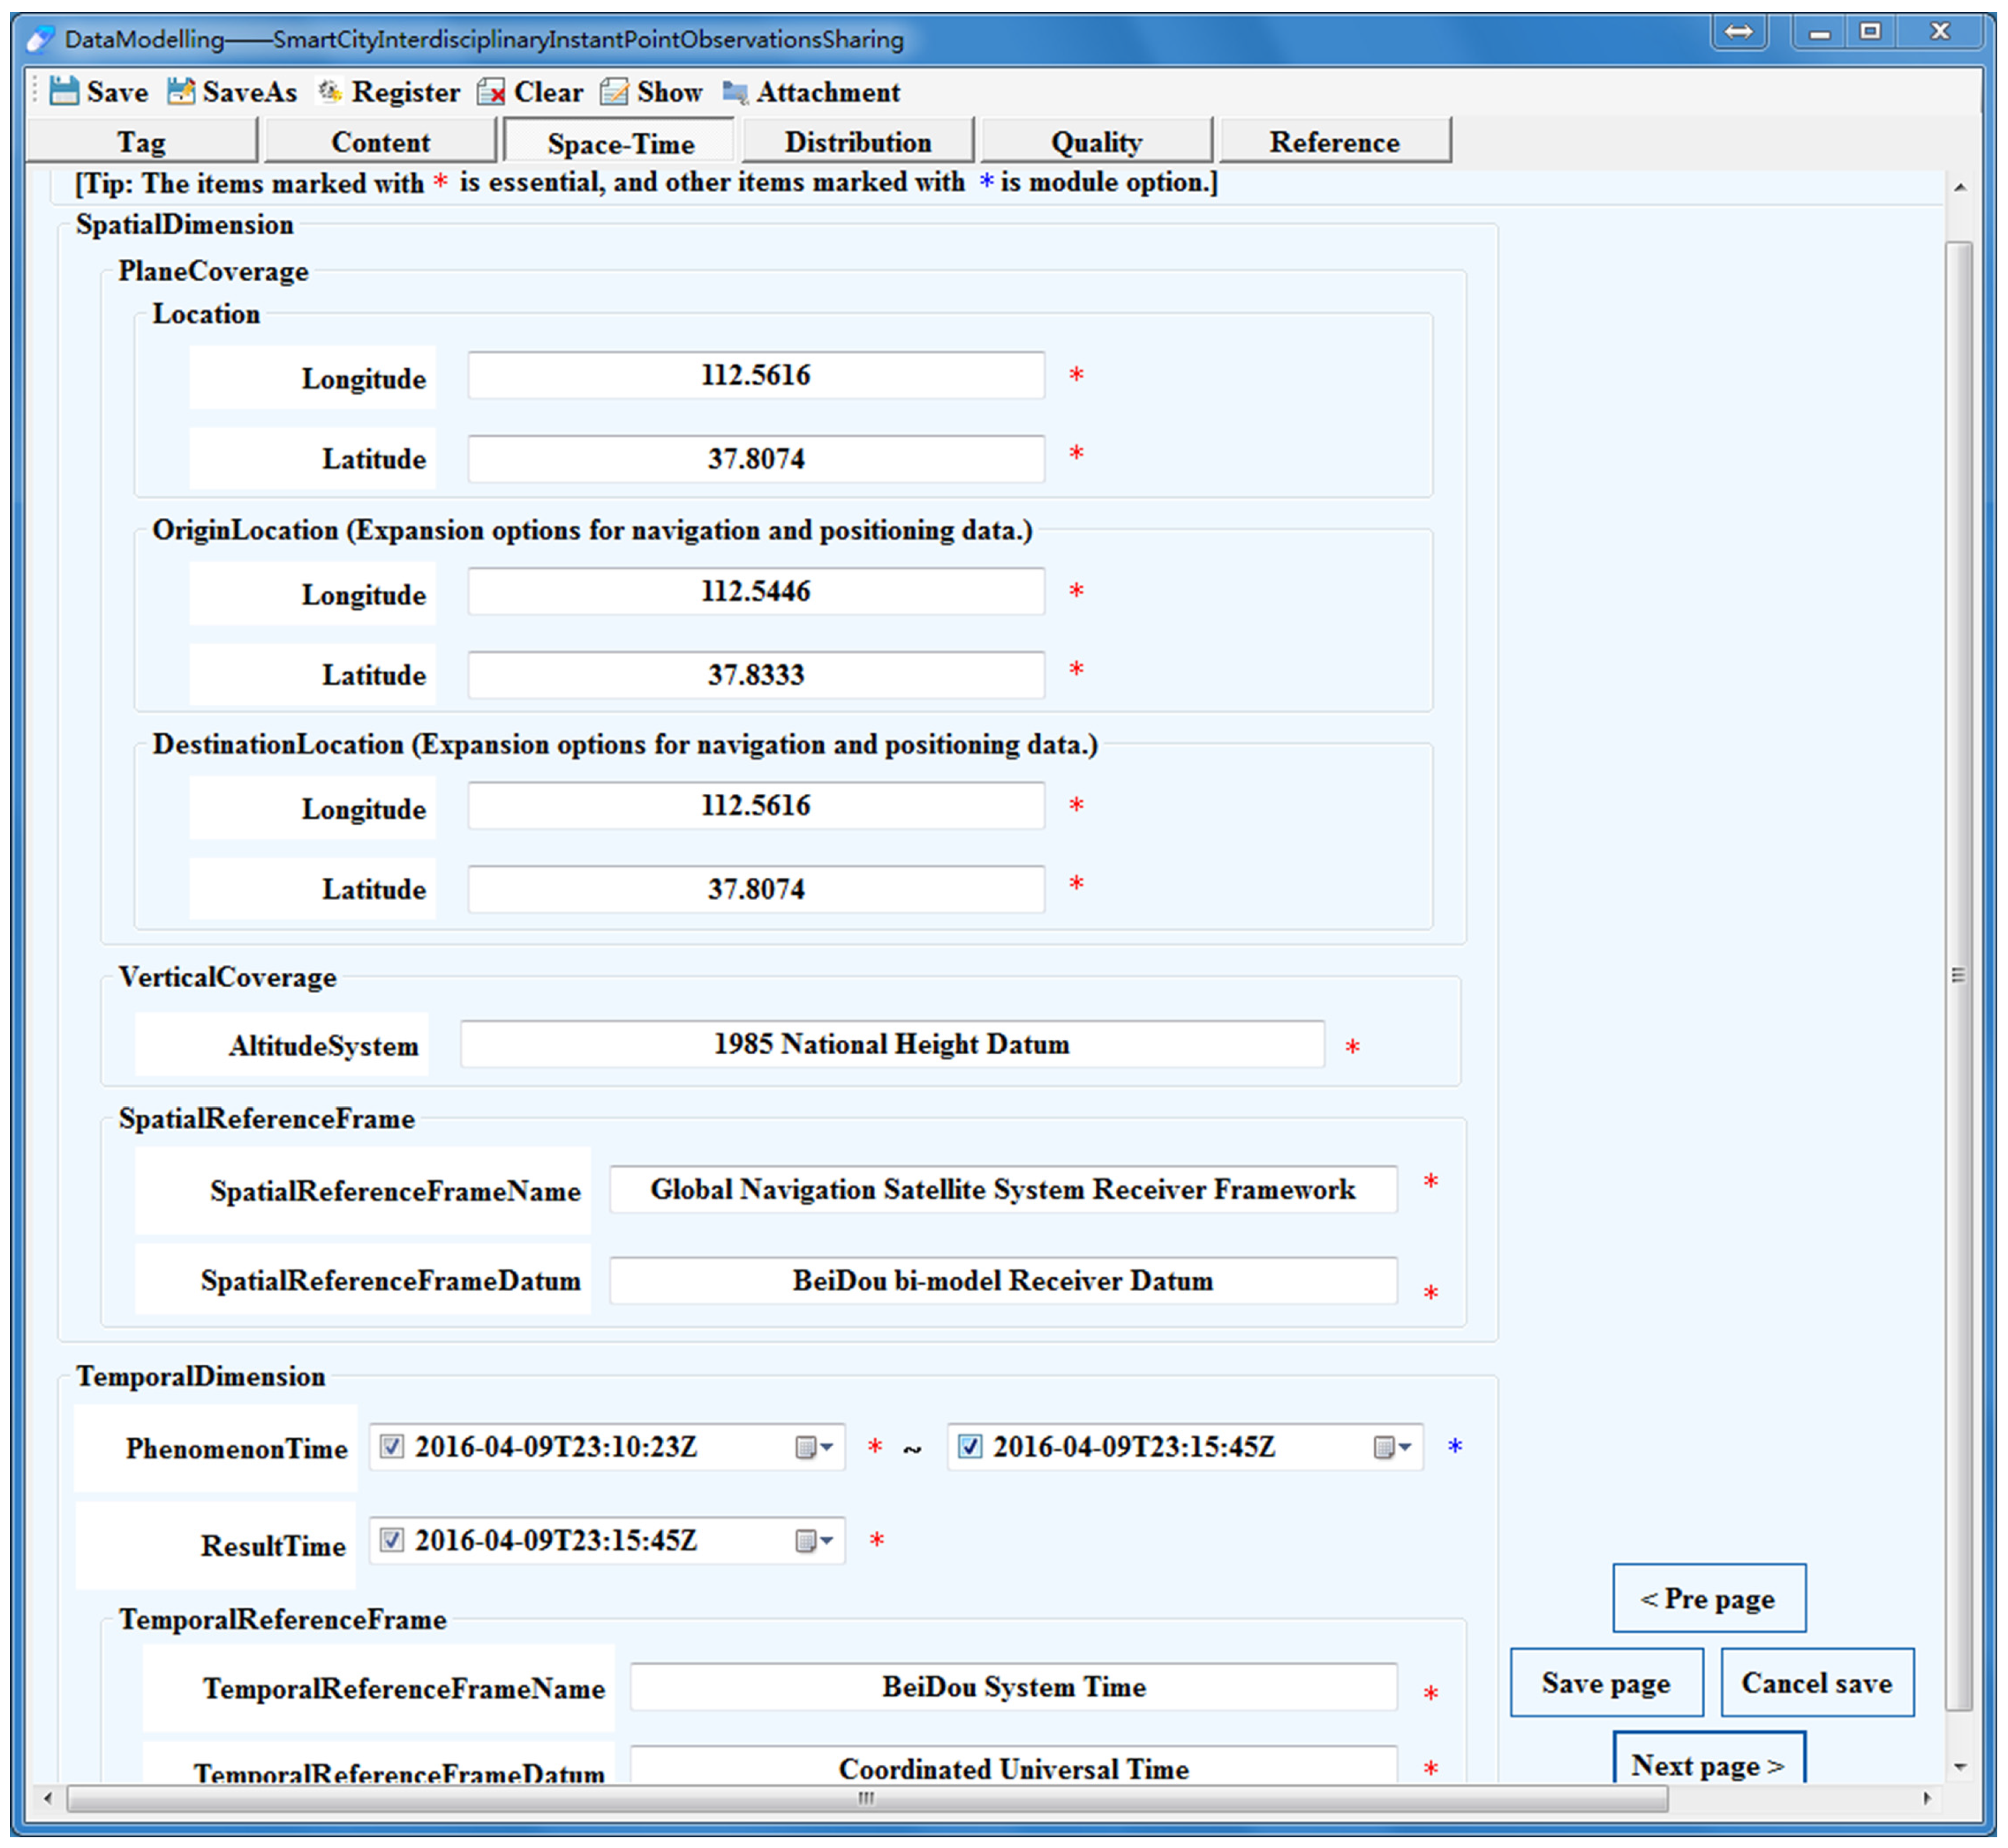
Space-Time: Space-Time information records the spatial and temporal properties of emergency in detail, such as the information of location, time, and the space and time referencing framework, which can enhance the spatio-temporal information description, and is crucial for data interconnection and collaborative applications for emergency responses data resources.
Quality: Quality information is mainly about the observation results and sampling method, and plays an important role in the application of point observation data, especially, in the field of ability or suitability.
Distribution: Distribution information mainly includes the distribution format, distribution contact, and transfer type, and reflects the information of data ownership. Besides, the way of data distribution is affected by regulators, access level and the influence of legal and security constraint conditions, which is essential to data availability.
Reference: Reference information covers the related information of metadata and observation elements, which is important for the discovery of point observation data, and can also be used as the basic information of data query. In addition, the relevant observation information allows users to enhance the perception of related data resources for specific tasks.
2.4. Ten-Tuple Information Description Structure
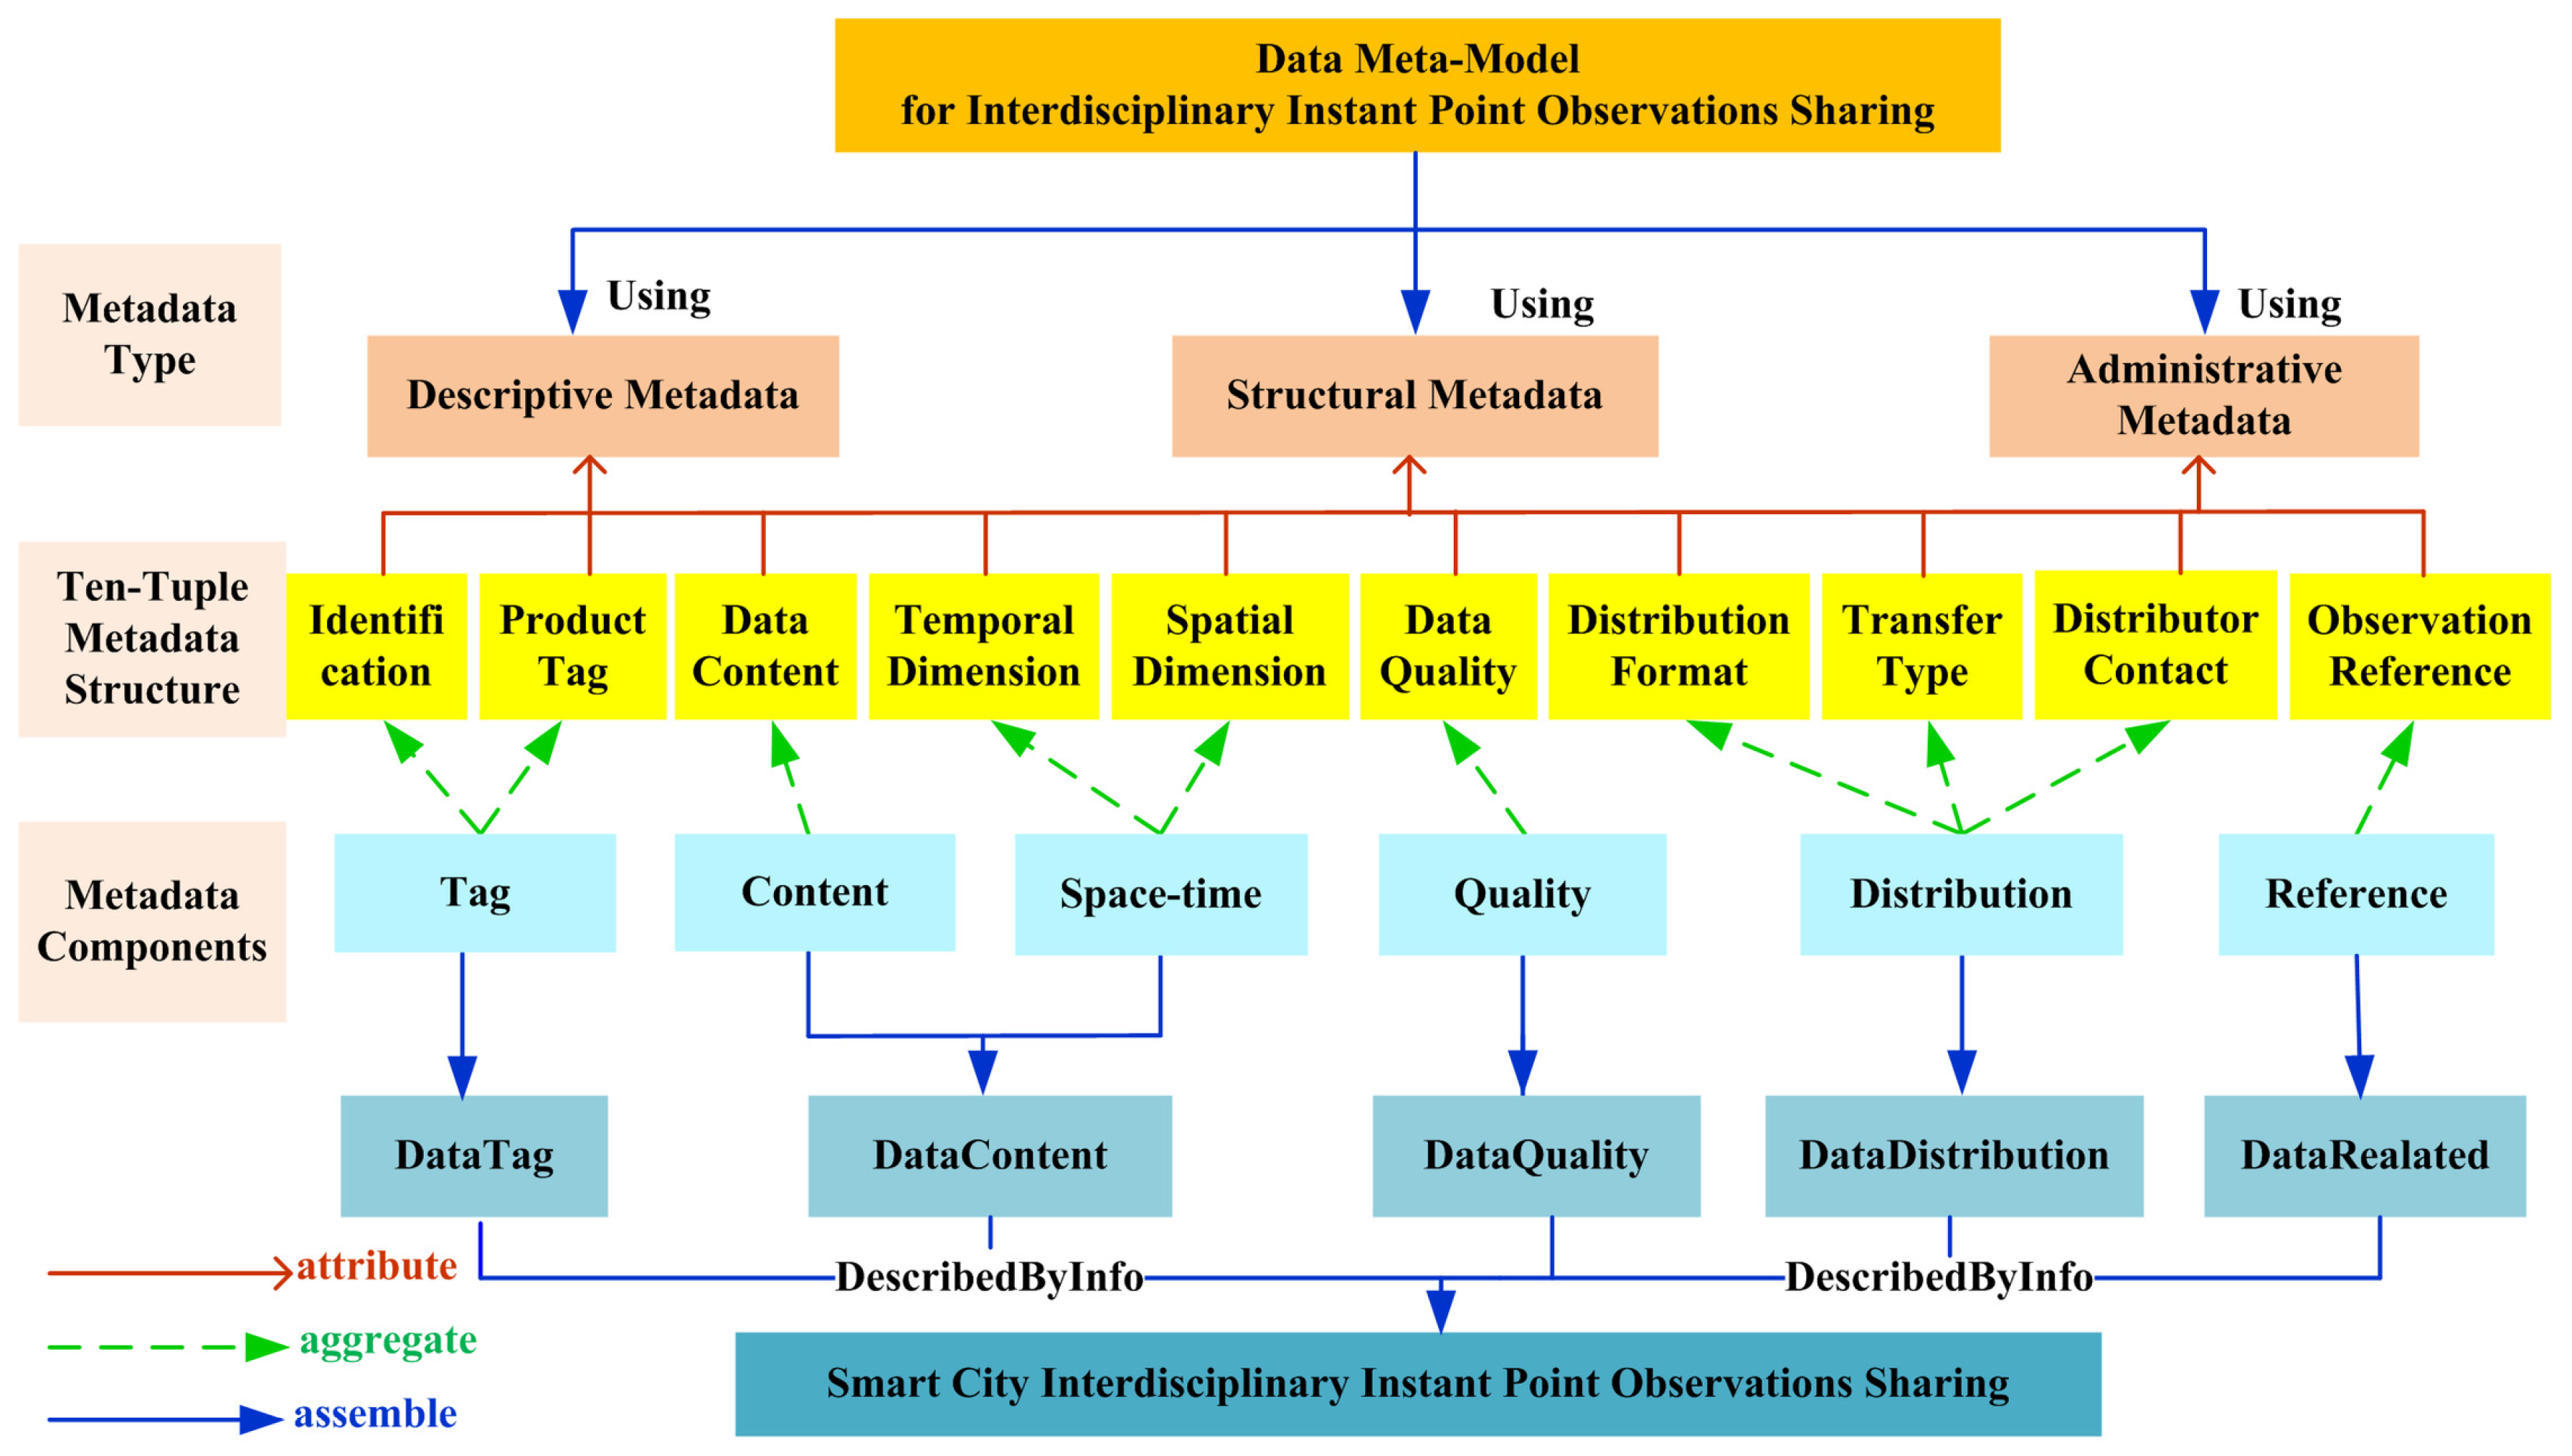
Specific to the generality of point observation data, which includes massive, multi-source heterogeneous and spatio-temporal correlation, as well as based on the framework of the point observation data description meta-model, the DMM for interdisciplinary instant point observations sharing is organized as shown in
Figure 3. In addition, the arrows in
Figure 3 represent three different expression relationships. The brown solid arrows mean the relationship of attribution, which indicate that ten-tuple metadata structure is the detailed attribute elements of the metadata type; the green dotted arrows refer to the relationship of aggregation, which indicate that the six basic metadata components which can be further divided into the ten-tuple metadata structure; and the blue solid arrows mean the relationship of assembly, which represent that the DMM can be expressed by using the specific metadata type, and the point observations sharing can be described by the detailed information of the metadata components.
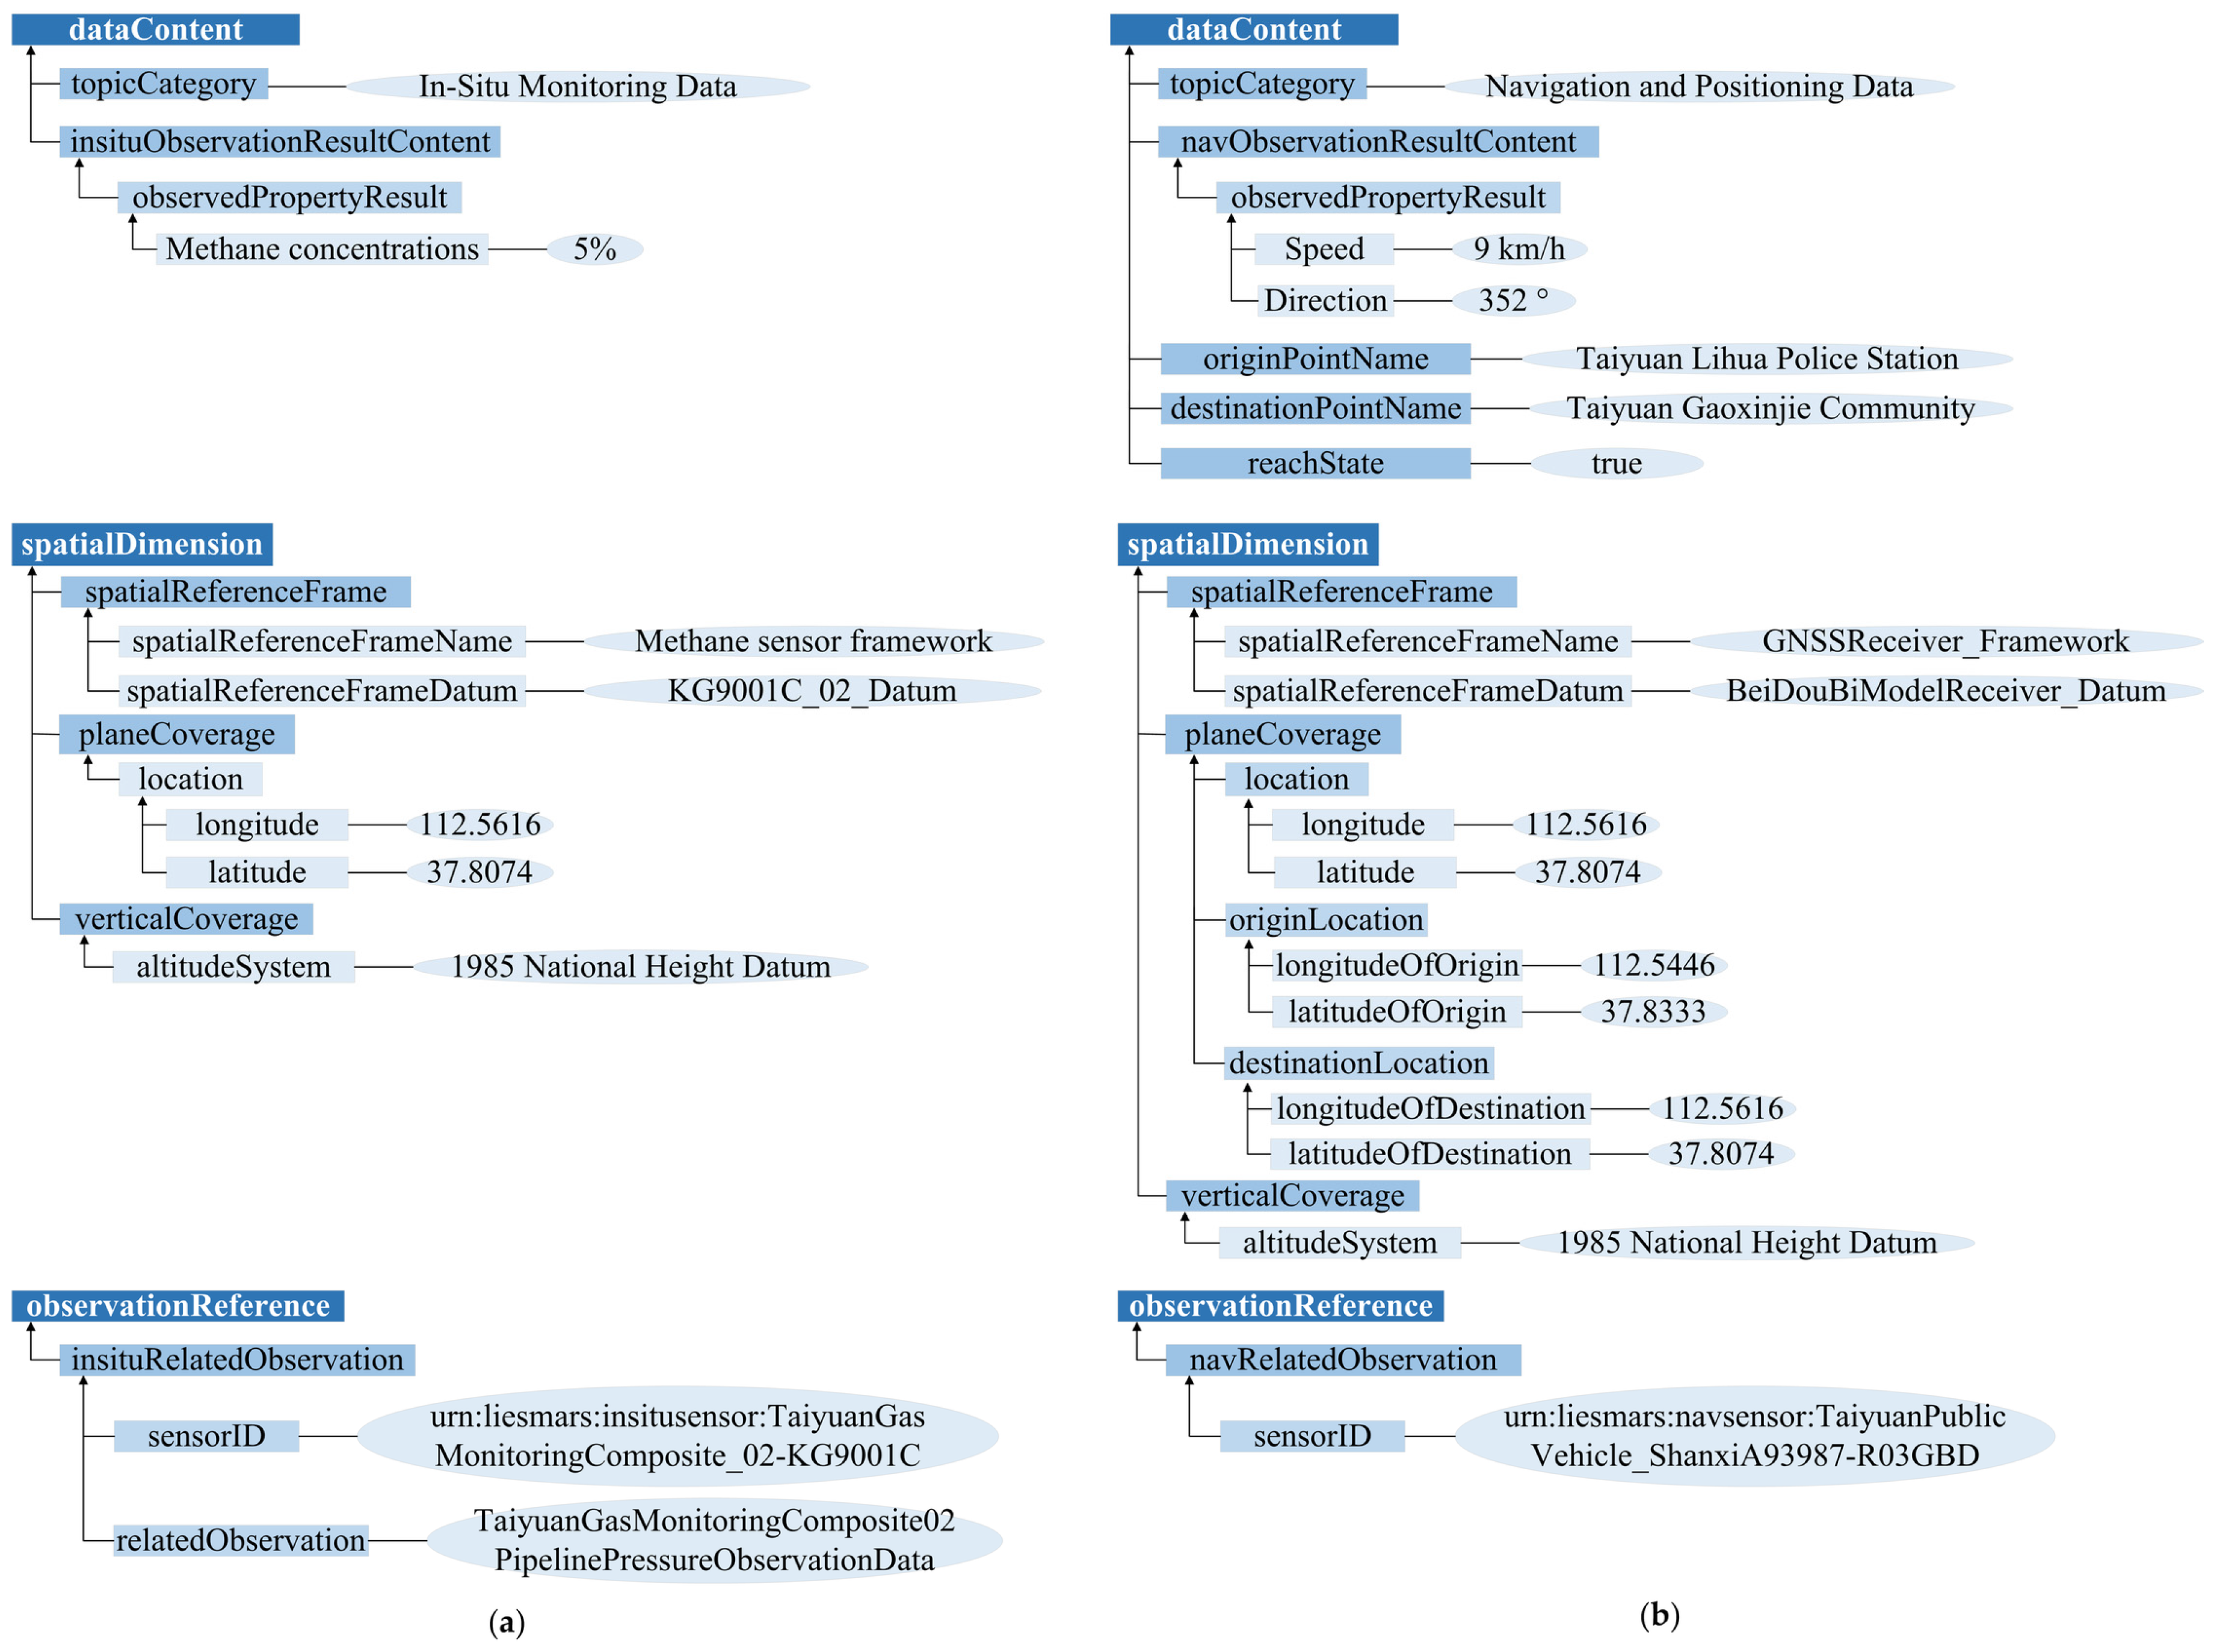
Referring to the related metadata standards, the organization structure of the six metadata components, as shown in
Figure 3, can be further decomposed and refined into a ten-tuple metadata structure of point observations. As the core of the whole meta-model, the ten-tuple metadata structure includes identification, product tag, data content, temporal dimension, spatial dimension, data quality, distribution format, transfer type, distributor contact and observation reference. In addition, DMM for interdisciplinary instant point observations sharing is mainly expressed by using the descriptive metadata type, the structural metadata type, and the administrate metadata type. Descriptive metadata is the element that directly describes the inherent properties of point observation data, such as the identification, product tag, and data content. Structural metadata is used to describe the space-time structure of point observations for navigation, information retrieval and display, such as the temporal dimension and spatial dimension. Administrate metadata is the attribute element for the management of point observations resources, such as data Quality, distribution format, transfer type, distributor contact, and observation reference. Thus, the ten-tuple metadata structure can further form a general point observation data-sharing model, which contains the unified, comprehensive and spatio-temporal enhanced meta-model information.
Identification: It includes title, abstract, data identifier and creation date, which can describe the basic data information of point observations resources, as well as identify data uniquely for data discovery.
Product tag: It includes purpose, keywords and data responsible party information to describe the characteristic product information of point observation data.
Data content: It includes topic category and observation result content. The information can describe different application fields and observed property result of point observation data.
Temporal dimension: It includes the phenomenon time, result time and temporal reference frame to uniformly describe the temporal information of observation data, which can determine whether the DMM is available for a specific time of emergency response.
Spatial dimension: It includes the plane coverage, vertical coverage and spatial reference frame to uniformly describe the location information for point observation data which can determine whether the DMM is available for a specific location of emergency response.
Data quality: It refers to the data quality, sampling interval and sample method, namely, the general instructions that made by data producers for the evaluation of method and process of relevant data sets quality.
Distribution format: It includes the distribution format name of dataset, which affect the accessibility of point observation data.
Transfer type: It includes transfer options, such as linkage of point observation data, which can provide the way of data acquisition.
Distributor contact: It includes the contact information of data distributor, such as name, organization, phone and address, thus providing support for further contact between users and distributors.
Observation reference: It refers to the related observation, for example, sensorID, which can also distribute to the quick discovery of related DMM instances.
According to the ten-tuple information description structure, the DMM for point observations sharing is defined in the UML (Unified Modeling Language) diagram shown in
Figure 4, which indicates the common attributes for the general description of various point observation data resources. The corresponding schema of the DMM can be found in
Supplementary File S1. In
File S1, the XML schema of the DMM includes three parts, TenTupleGroup.xsd, SixComponents.xsd, and DataML.xsd, which can be used for the verification and extension by users.
3. Software Implementation
3.1. System Architecture
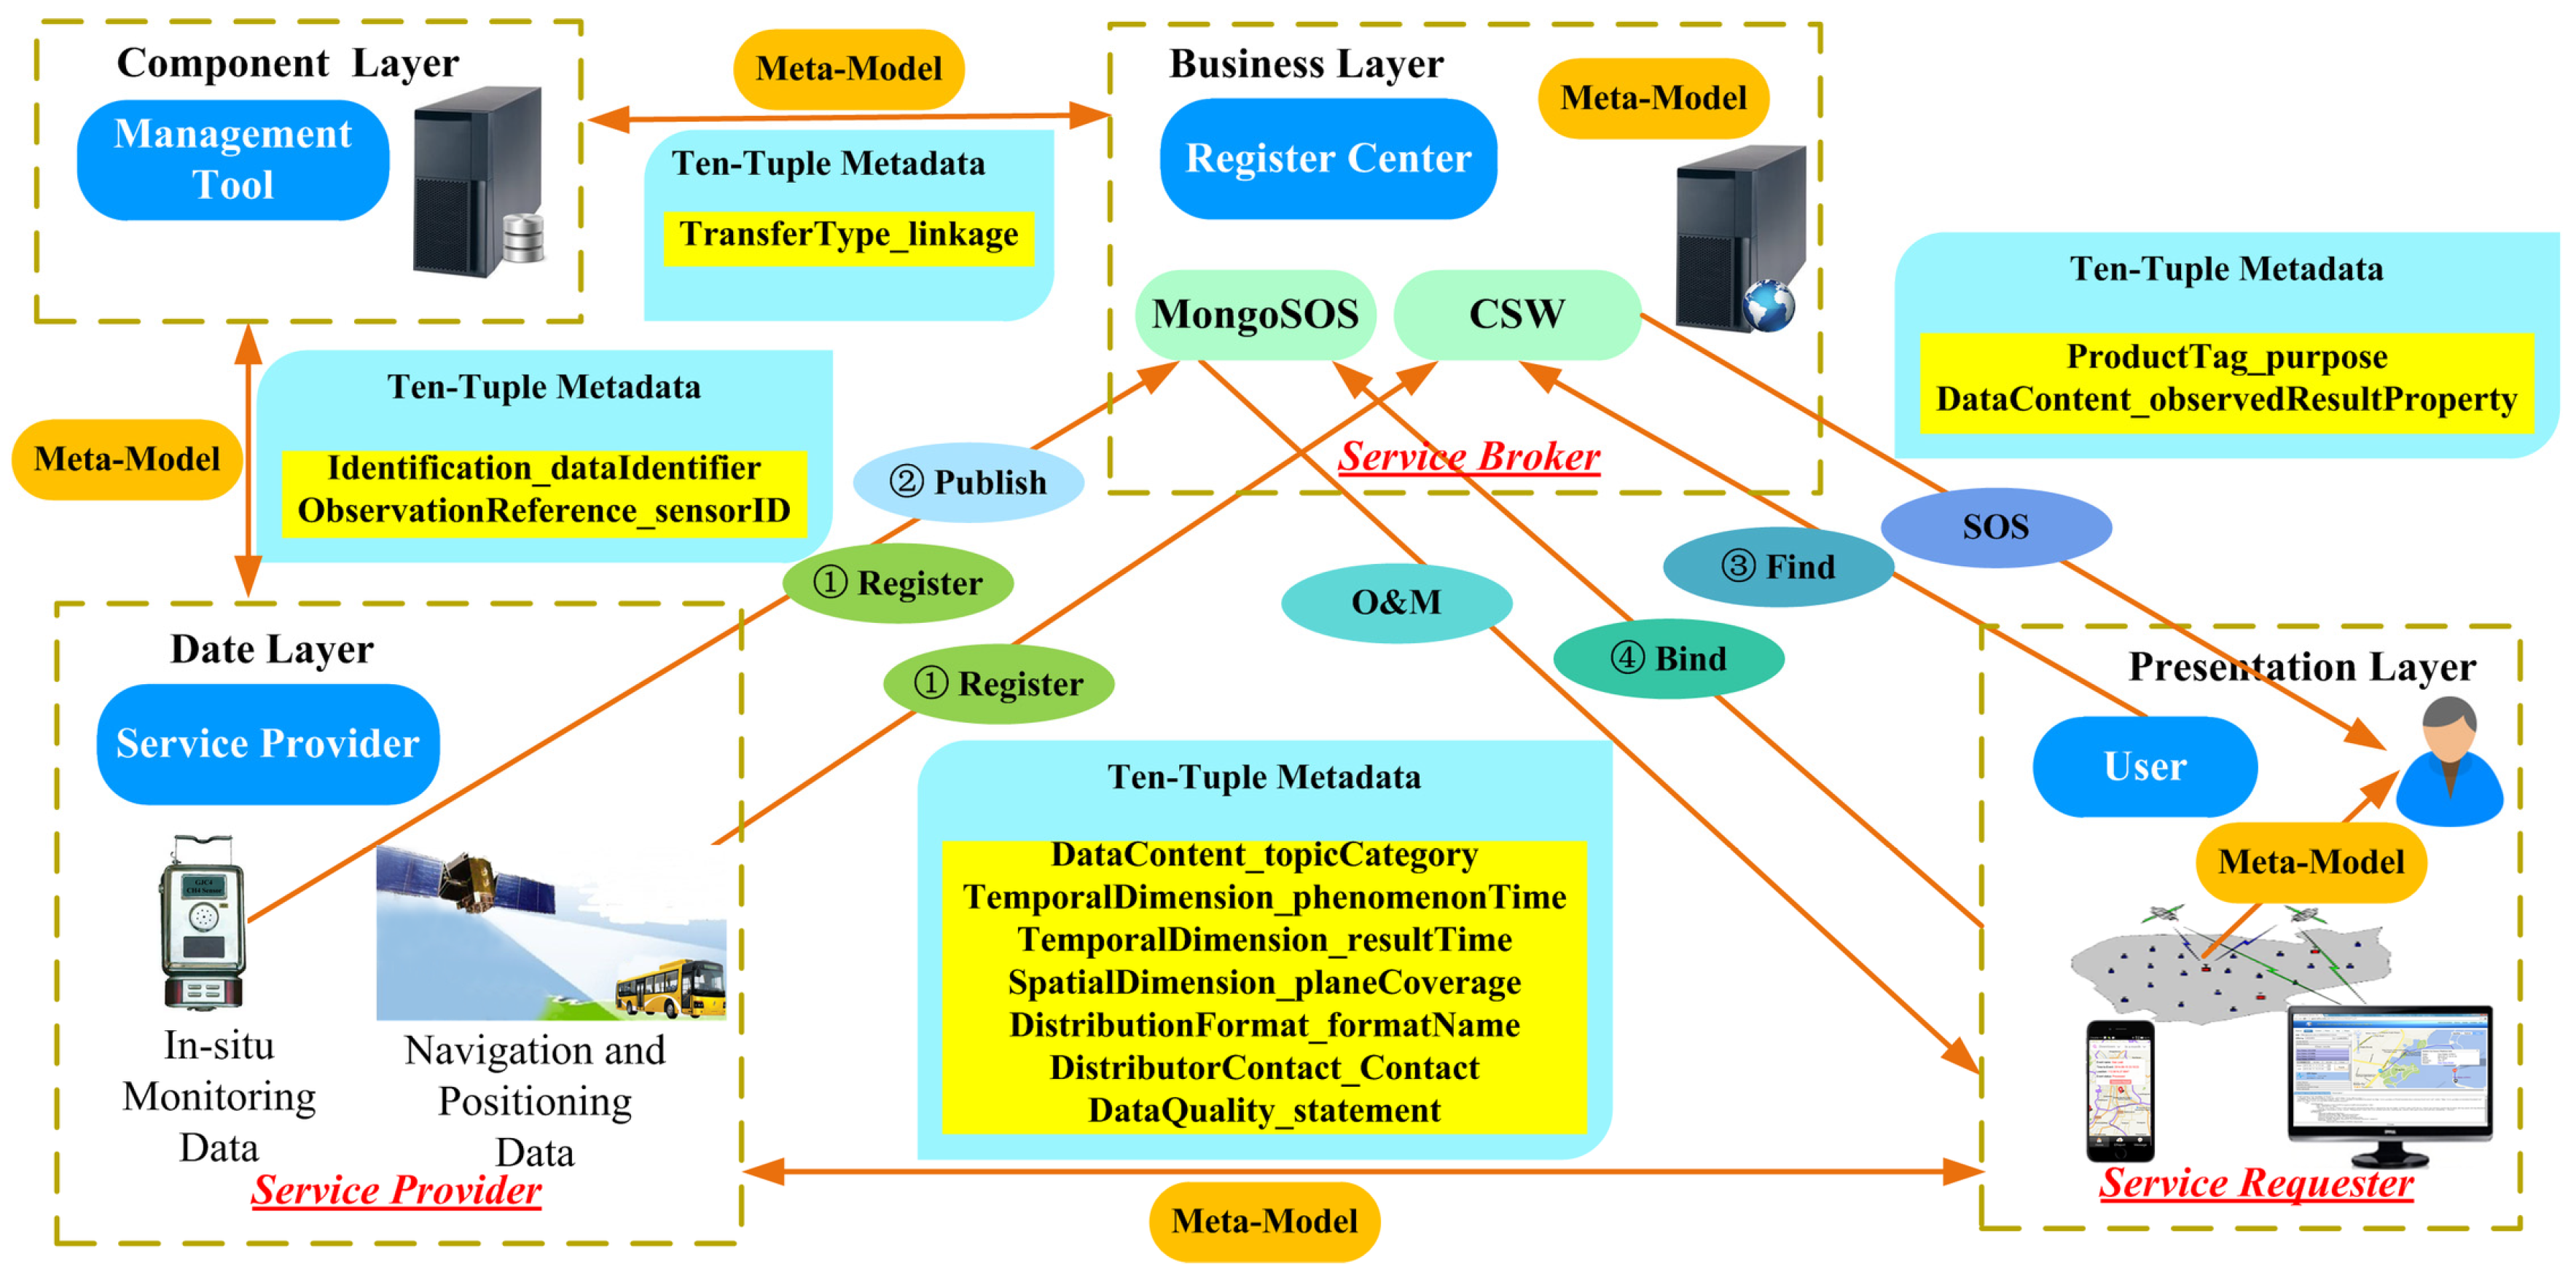
To test the feasibility of spatio-temporal enhanced sharing based on DMM, a prototype system, i.e., Smart City Interdisciplinary Instant Point Observations Sharing System, is designed and implemented based on the DMM under the Service Oriented Architecture [
43] environment. Data web services, such as the Catalog Service for Web (CSW) and SOS, are used to dynamically access, integrate, discover and share the point observation data resources for different users on the web. CSW can define the interfaces between Web-based clients and servers to find the required data or services from registries [
44]. SOS can access and query observation metadata, as well as publish the observation data to various user applications through standard web service interfaces [
45,
46]. The service-oriented architecture of the prototype system is proposed as shown in
Figure 5, which has four main layers, i.e., Presentation Layer, Business Layer, Component Layer and Data Layer.
The Presentation Layer is to help users to use related ten-tuple metadata information of the DMM, for example, the topicCategory element of data content information, to discover and visualize the required data instances provided by the Data Layer. The service requester in this layer is to present user requirements and find services provided by the Business Layer. Then results can be presented as meta-model instances through desktop web visualization and Android mobile visualization.
The Business Layer consists of a register center, which is mainly about registering the pre-established meta-model instances through the data web services, such as CSW and SOS. The service broker is able to take charge of service requests, as well as register and publish the point observation data provided by the service provider in the Data Layer. In addition, it can help users in the Presentation Layer to find the DMM and obtain corresponding results through SOS, for example, the observedResultProperty element of data content information.
The Component Layer is a fine-grained service, and it provides the management components and service components, which are used in the Business Layer. Meanwhile, through the ten-tuple metadata information, for example, the linkage of transfer type information, it can support the reading, storing and management of various meta-model instances registered in the register center of the Business Layer.
The Data Layer, as the service provider, is the foundation of the entire system. It provides various point observation data in smart cities, including the in-situ monitoring data and the navigation and positioning data, which can be unified integration management in the Component Layer through the ten-tuple metadata information of the DMM, for example, the dataIdentifier of identification information. Point observation data provided in this layer are used in the form of meta-model instances for the Component Layer, Business Layer and Presentation Layer.
3.2. System Performance Evaluation on SOS
SOS provides a standard way to manage metadata and observation data of heterogeneous sensors. It is suitable for use in the service-oriented architecture, which has relatively high interoperability and reusability and low coupling characteristics, and can discover access and be invoked by different clients with a Web service method [
43,
47]. It is one of the core services of OGC SWE, and its service performance is of great significance to our whole system application.
For the instant of point observation data, two main operations of SOS are considered, respectively, the GetObservation and the InsertObservation, which indicate the abilities to access and insert the observed data. As the performance evaluation result of SOS that we have made before, the response time of GetObservation in the single-user can maintain about 115 ms, but in the case of 200 concurrent, it nearly 10 s; relatively, InsertObservation shows a little bit better performance, its response time of a single user is not more than 15 ms, and 1000 concurrent with no more than 10 s [
48]. Thus, it does not very strict in real-time and its applications should be carefully considered when in a large number of concurrent cases.
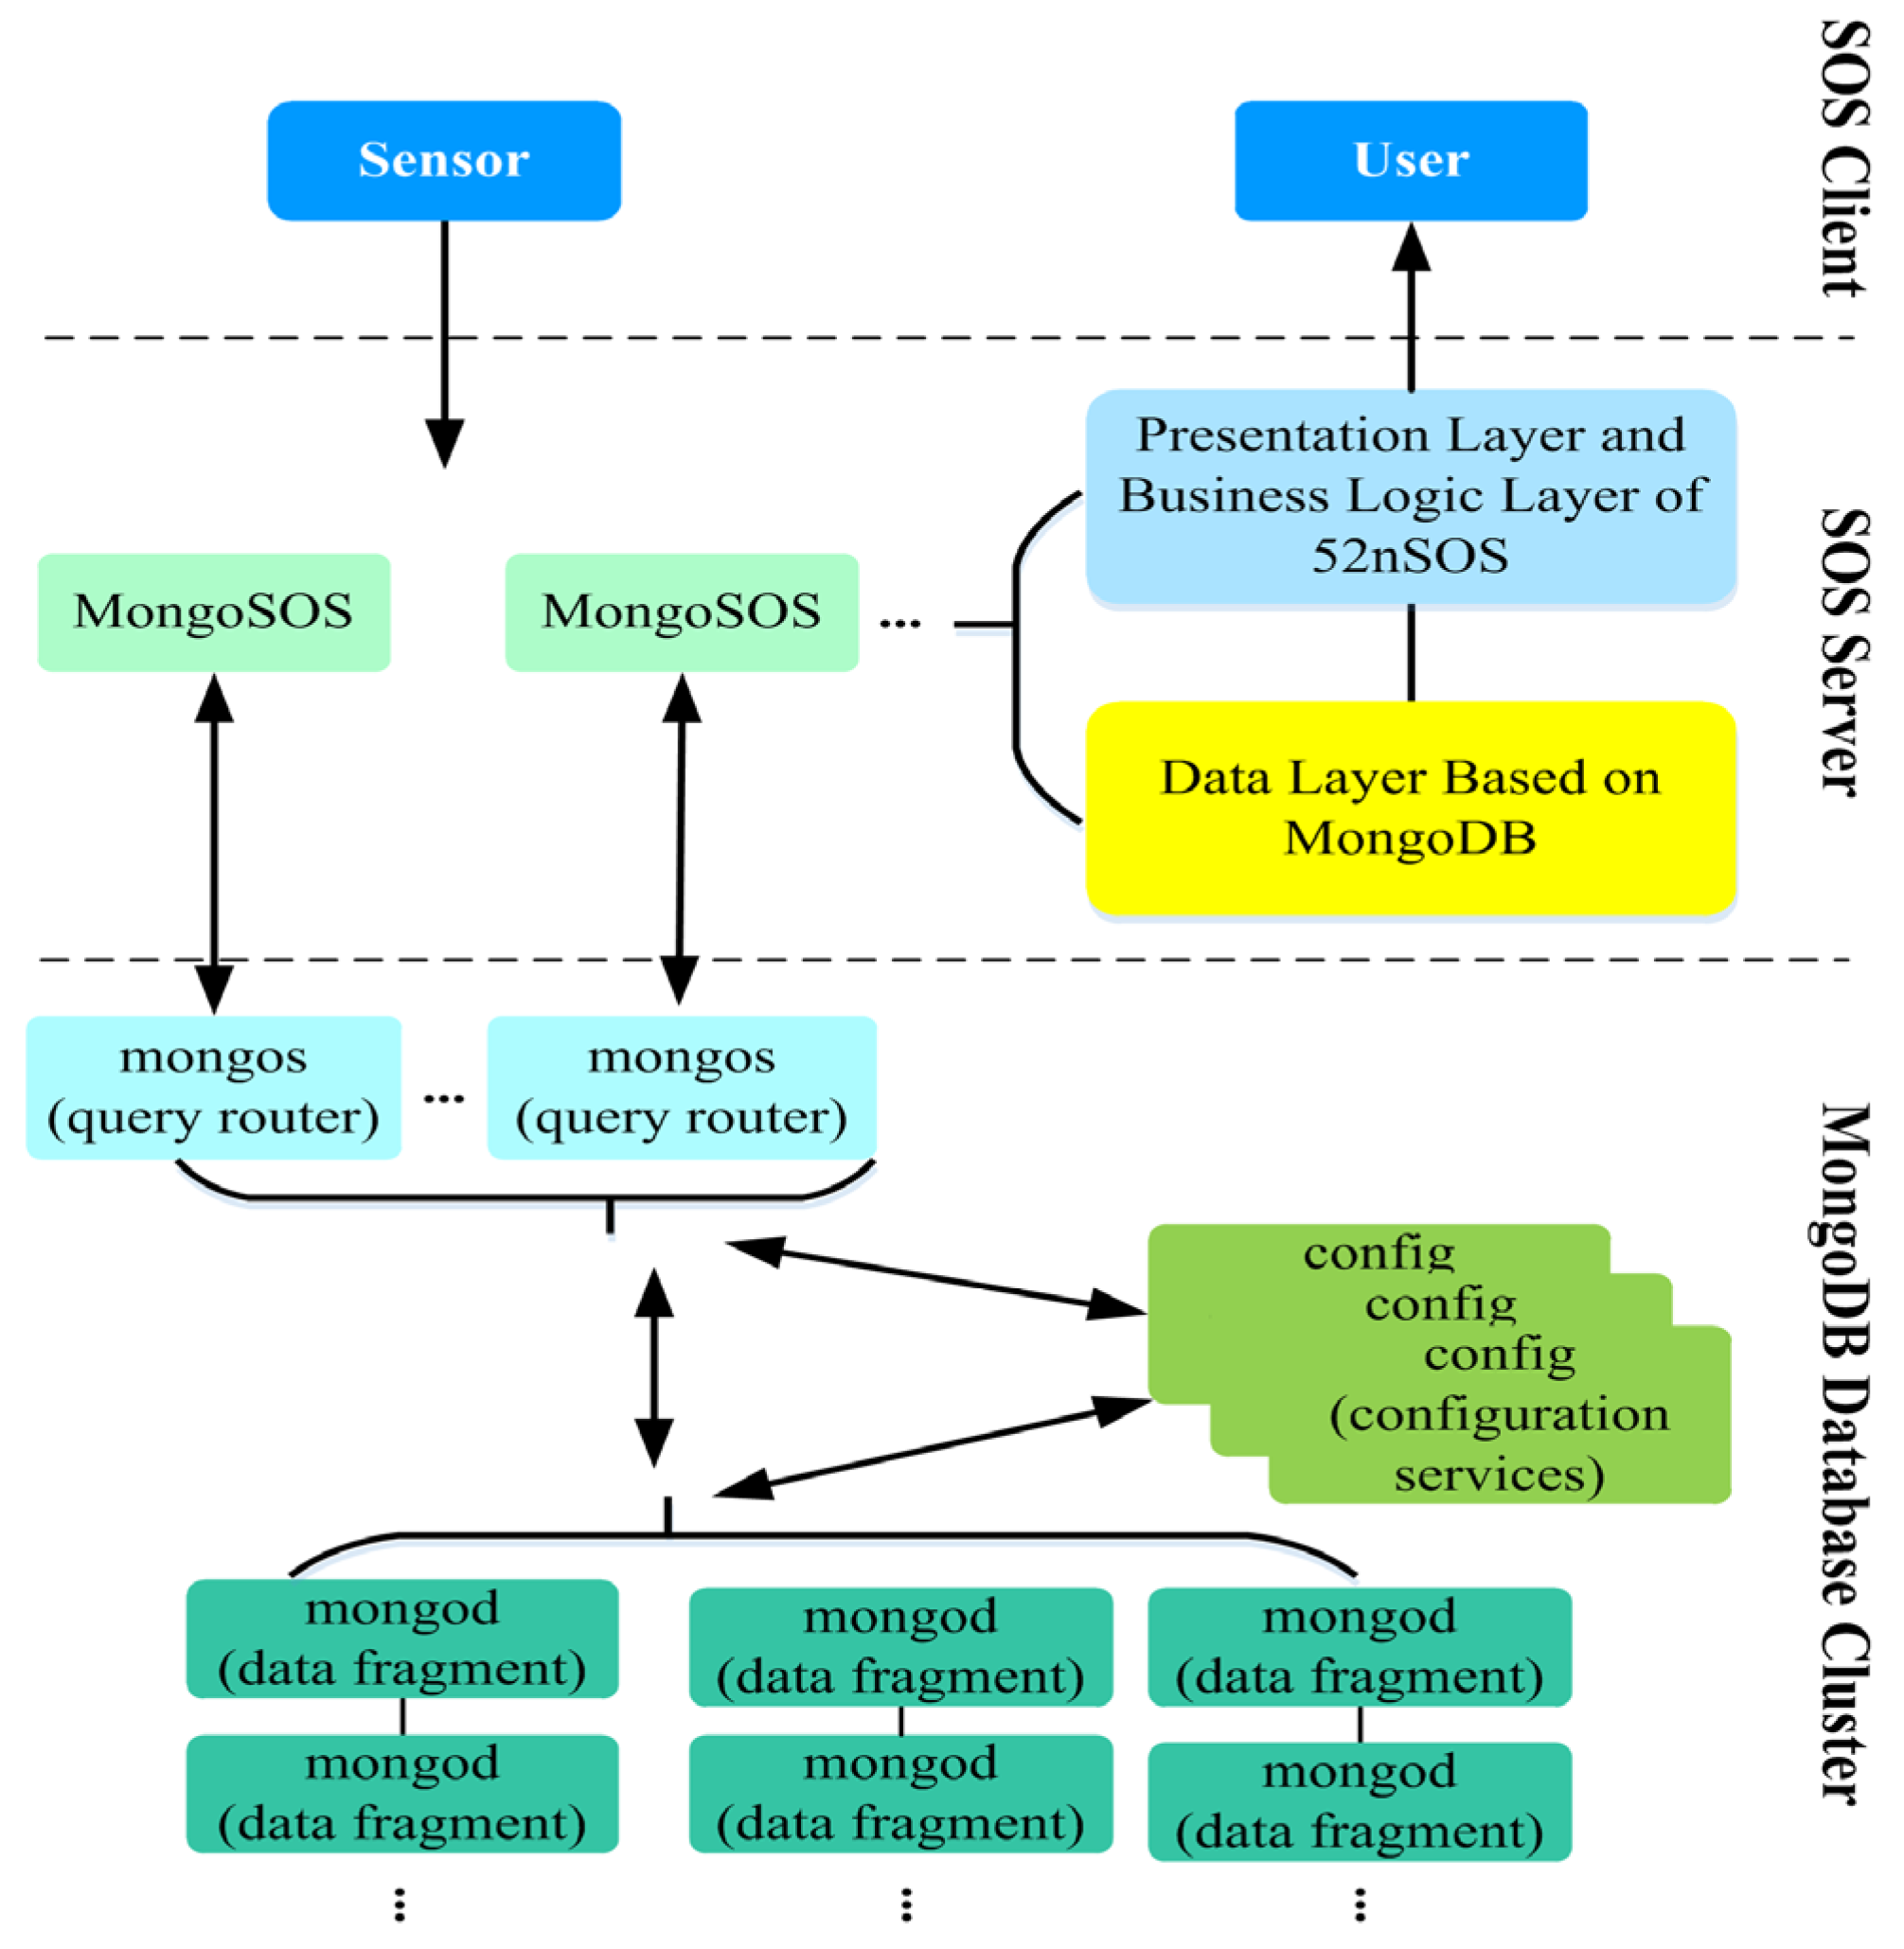
In order to solve the performance problems in instant sharing of mass point observation data, we have designed and implemented a NoSQL distributed storage SOS, which is named MongoSOS by focusing on the performance of SOS and based on MongoDB database. The architecture of MongoSOS is shown in
Figure 6, which contains a MongoDB data cluster, multiple instances of MongoSOS (point to the same database), user, and sensor. MongoSOS is a web service that runs in Tomcat and can deploy multiple MongoSOS service instances on multiple machines, and each instance is connected to the same MongoDB database cluster with the same service functions. Sensor and user can insert observation data from any MongoSOS service instance to obtain the observed data. MongoDB cluster consists of three components, namely, mongod, mongos, and config, and a cluster can configure multiple components. Mongod is fragmented storage nodes, and responsible for the real deposit storage data. Mongos, that is, query routing, as the entire cluster of the entrance, is responsible for scheduling the operation of the database. Config, that is, configuration service started by the mongod program, is responsible for maintaining the metadata for the entire cluster, such as slicing the state of slices.
3.3. System Implementation
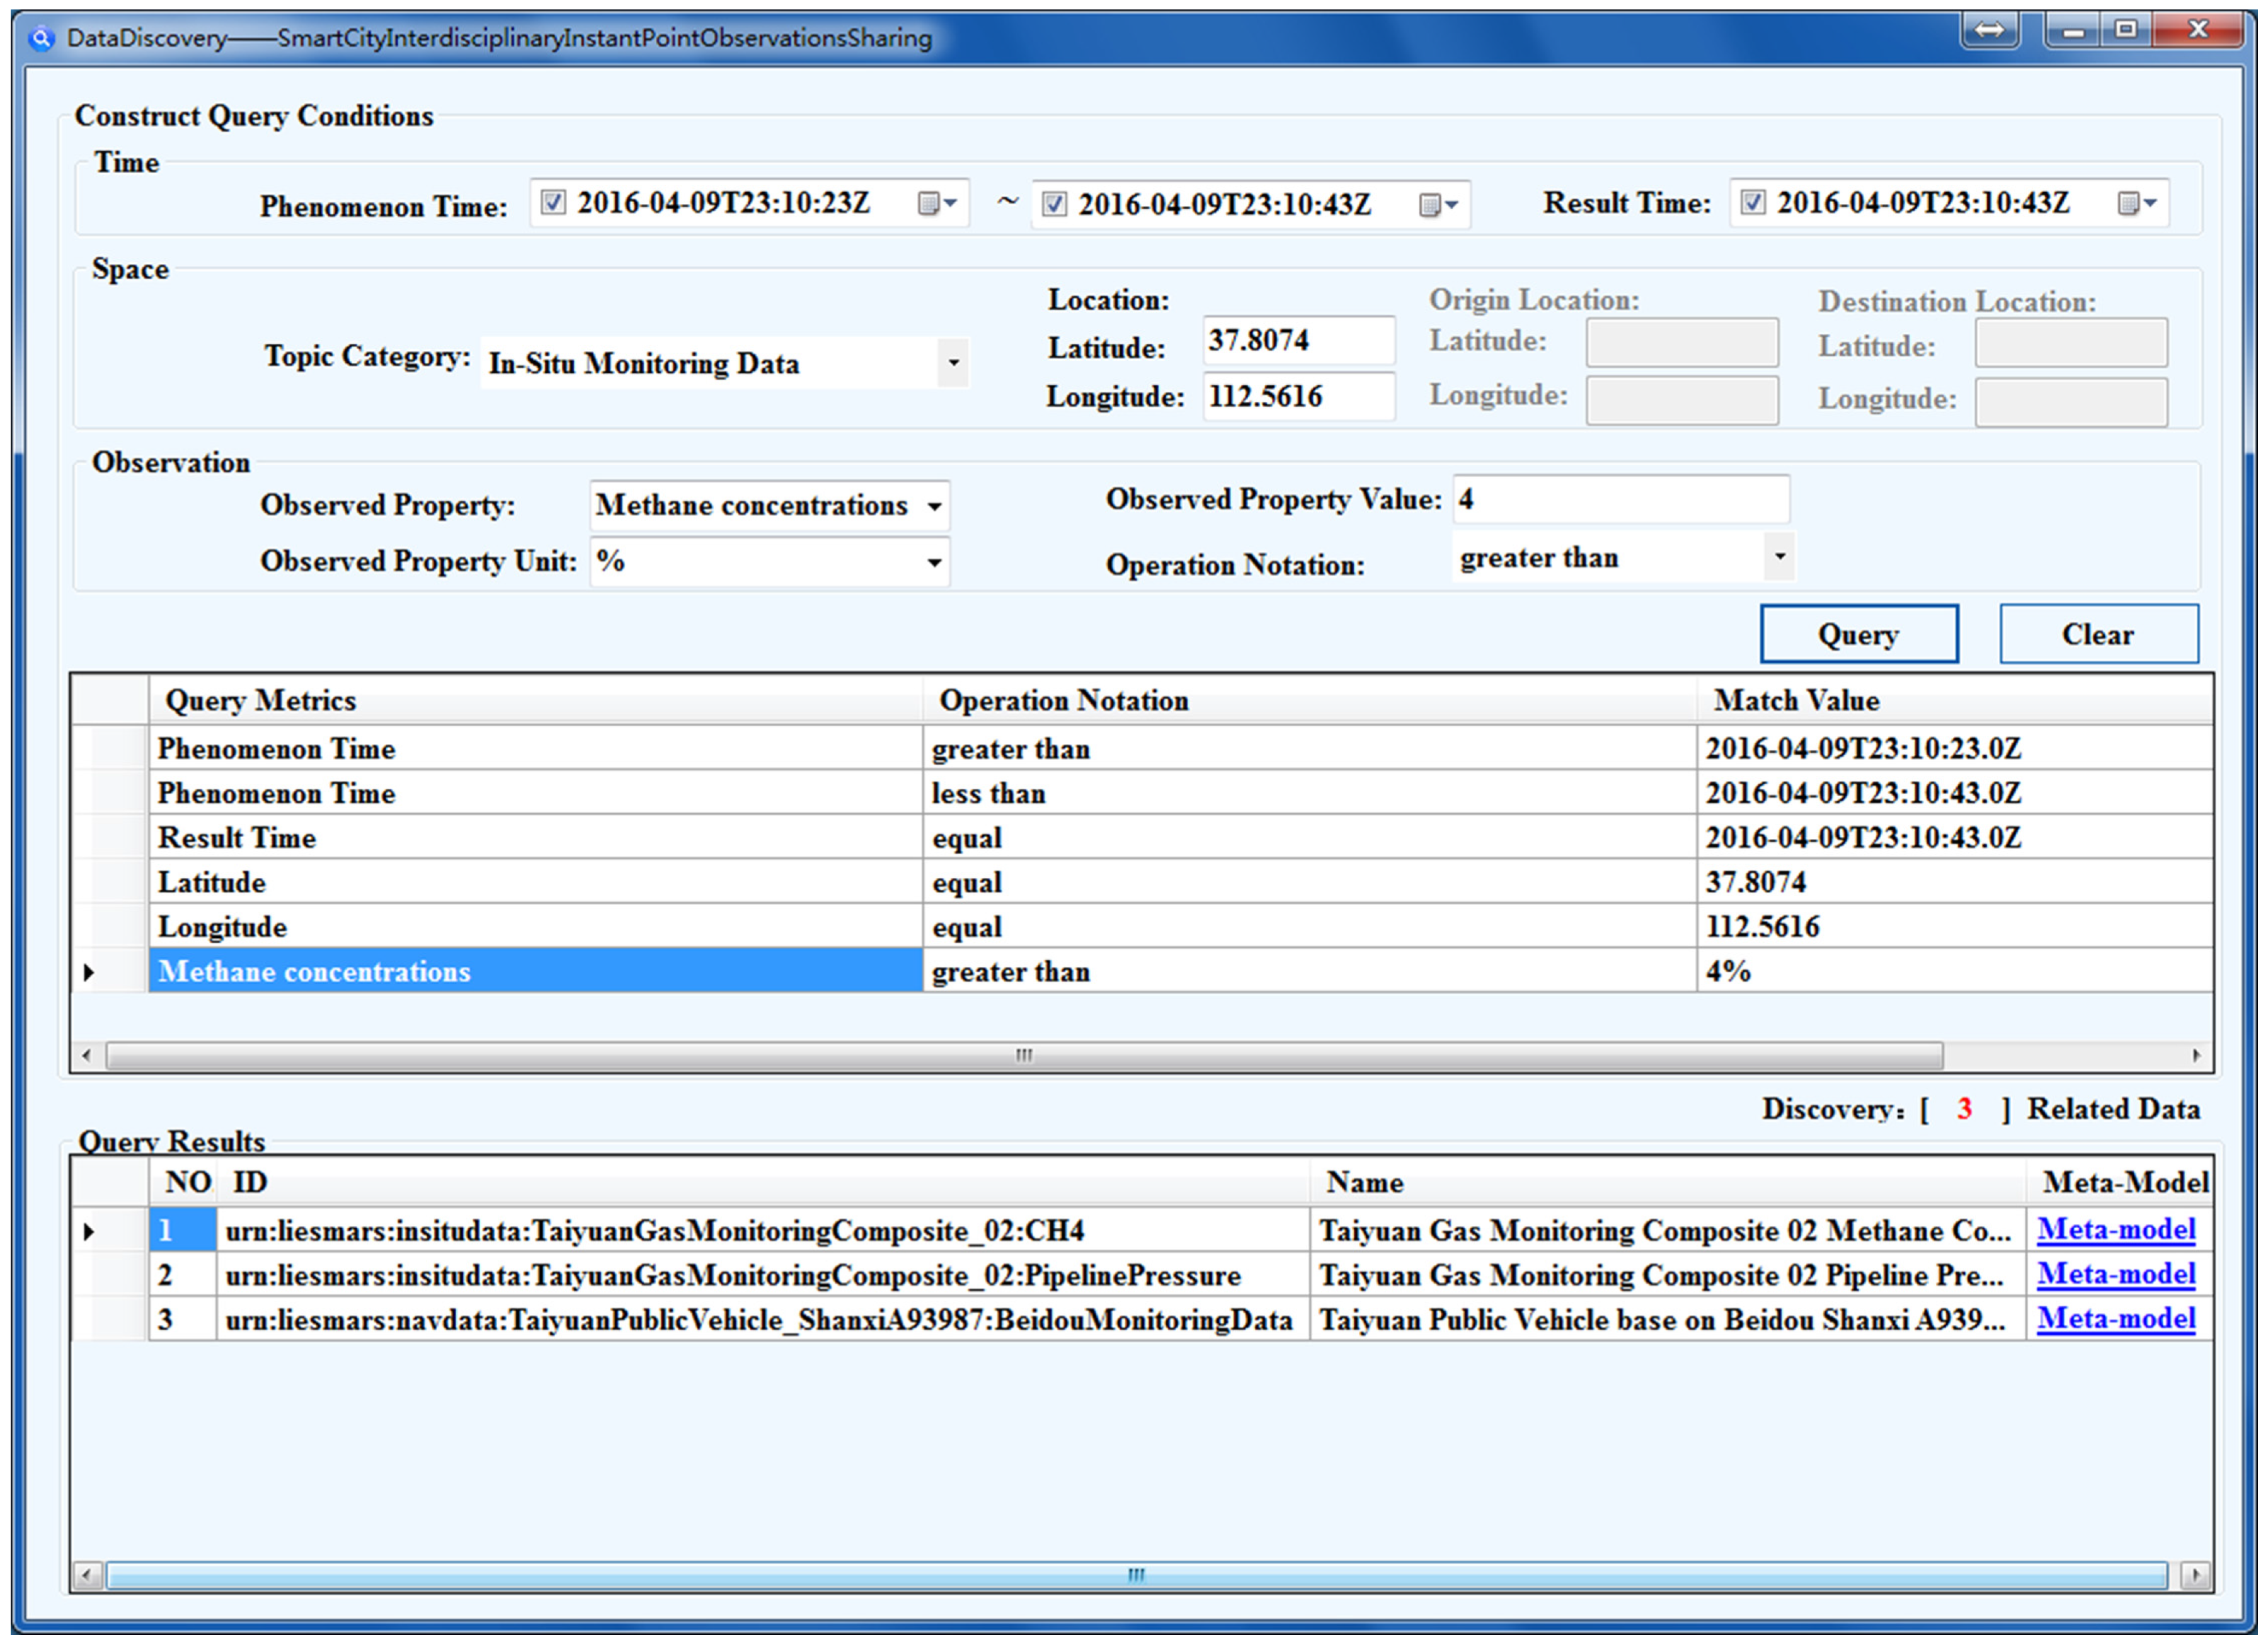
Smart City Interdisciplinary Instant Point Observations Sharing System consists of five modules, including modeling, access and release, query, management, and visualization. It can implement a series of functions, such as guide-fast data modeling, model editing, data query, as well as data and decision information visualization.
The modeling function is to quickly establish the DMM instances of various point observation data through the modeling guides provided for modeling on the DMM templates. For modelers, prior knowledge is unnecessary, and they simply need to choose the point observation data to be modeled and then further key in or choose the metadata values by using the modeling guide to finish the modeling.
The access and release function is to complete a series of operations, such as model register, access configuration, service encapsulation and service register for the pre-established meta-models through the application of CSW and SOS. CSW is to register the pre-established meta-models to the register center. Access is to store the point observation data to the SOS database. Release is to associate the service with the DMM and publish the related point observation data service as SOS.
The query function, that is, according to the information on existing observation data meta-models, such as basic information, subject information and spatio-temporal information to perform the basic query containing a single condition or the combined query with multiple conditions. Then, the specific meta-model and corresponding services are returned to facilitate rapid instant retrieval for users.
The management function includes a series of operations for the existing meta-models, such as load, edit, modification, saving, addition and deletion, and can be implemented by loading as well as refreshing the data meta-models list provided by the register center. Because the system is synchronized to the register center, it can realize the unified integration management of point observation data resources in smart cities.
The visualization function is to display point observation data and decision-making information through different terminals, e.g., desktop web and Android mobile, thus dynamically providing instant information on scheduling and collaborative applications for decision-makers. Desktop web and Android mobile can provide different terminals to make it more convenient for users to access and share the point observation data.
3.4. Performance Tests of MongoSOS
Performance tests are made on each SOS operation of MongoSOS and 52nSOS [
49] by JMeter [
50] that an open source performance testing tool.
(1) Test data: The test data selected are the GPS (Global Positioning System) data of floating vehicles in Wuhan, China, and 1000 of them are randomly selected from 13,000 vehicles as concurrency test data. The original observation frequency of the floating vehicles is about 30 seconds to one minute, and the raw data time range is three days. Based on this data, JMeter is used to simulate and modify the observation time of each observation data as the current system time of the system where the simulator is located and to insert a large number of observation data concurrently.
(2)
Test environment: The test environment consists of both software and hardware, as detailed in
Table 2 and
Table 3 below.
(3)
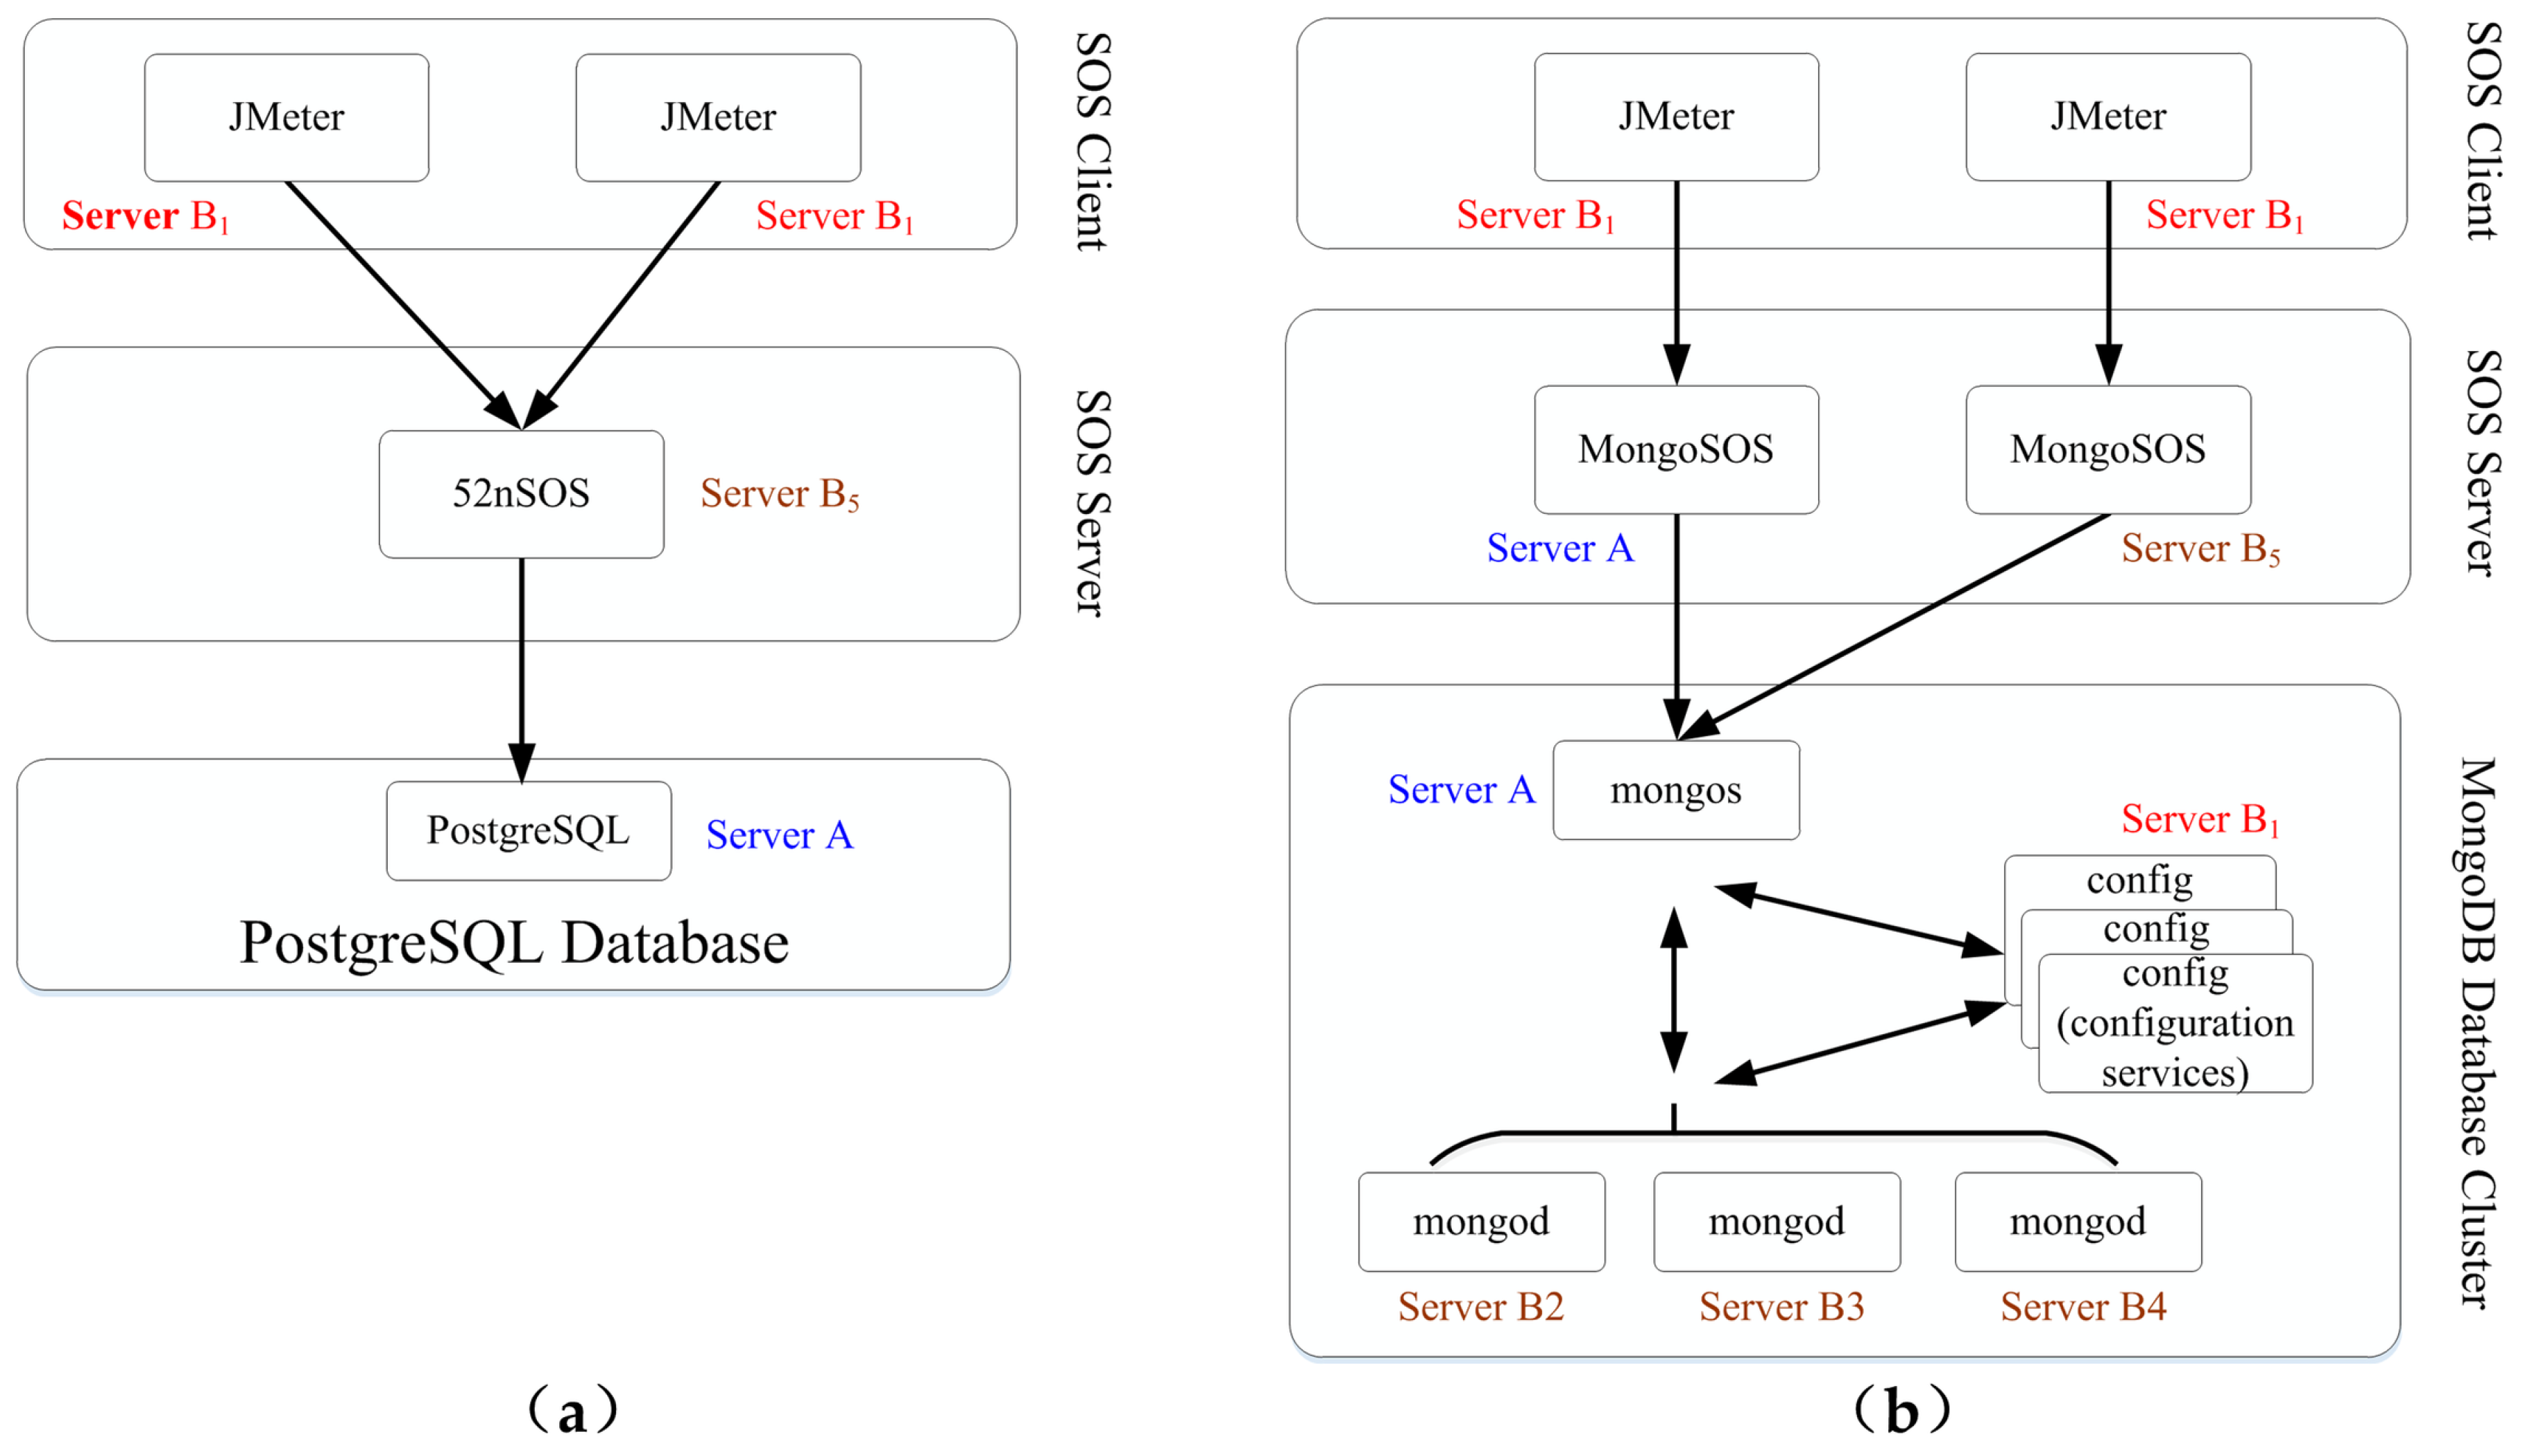
Performance Test Cases Design: SOS instance deployment includes the 52nSOS deployment instance and the MongoSOS deployment instance.
Figure 7a shows the deployment of 52nSOS using a SOS instance, a single instance of PostgreSQL, and two JMeter test examples. As
Figure 7b shows the deployment of MongoSOS using two SOS instances, a MongoDB cluster instance, two JMeter instances, and, among them, MongoDB cluster deployment using a mongos example, three mongod instances, and three config instances; and two SOS instances point to the same database in the MongoDB cluster, where MongoDB uses WiredTiger storage engine.
(4) Testing process: Use JMeter to build SOS operations test plan, such as GetObservation and InsertObservation, by reading the locally stored CSV (Comma-Separated Values) text raw data files to build corresponding XML for each SOS operation, and sent to the SOS instances through the HTTP (Hyper Text Transfer Protocol), POST, or UTF-8 (8-bit Unicode Transformation Format) encoding, then to receive the SOS response information and determine whether the operation is successful.
(5)
Test results and analysis: The result of performance tests about GetObservation and InsertObservation with specific conditions; for example, setting the GPS positions of the floating vehicles in the minimum bounding box of Wuhan as the space condition of the GetObservation is shown in
Table 4.
The test result verified that the MongoSOS has better performance than 52nSOS, and a better distributed storage method for SOS specification. The operations of access and insertion for navigation and positioning data can be realized at the millisecond level. Moreover, MongoSOS is a key part of the service-oriented-architecture in our proposed prototype system, and it can be to improve the performances of spatial-temporal enhanced sharing of diverse point observation data. As the GetObservation and the InsertObservation are two important and complicated operations of MongoSOS, the performance improvement on the response time of them are significantly reduced compared with 52nSOS.
6. Conclusions
Aiming at realizing interdisciplinary integration management and sharing applications in the spatio-temporal dimension for instant point observation data in smart cities, a sharing based on a proposed DMM that focuses on spatio-temporal characteristics and formulates a ten-tuple information description structure to provide a unified and spatio-temporal enhanced description of the point observation data is demonstrated in this paper. In addition, through the construction of the prototype system and conducting a gas leak emergency response experiment, the feasibility, versatility and extensibility of the DMM are verified, and the results demonstrate the spatio-temporal enhanced sharing for city interdisciplinary instant point observation data. In particular, the response time of the access and insertion for navigation and positioning data can be realized at the millisecond level through the proposed MongoSOS. Thus, by the spatio-temporal enhanced sharing based on DMM to optimize the scheduling and management of point observation data resources, the intelligence level of administrative decision-making and emergency transactions is improved. Due to the city instant point observation data involved in various fields, the sharing of point observations have many application scenarios in smart cities, such as the gas concentrations monitoring and the smart city public vehicle monitoring based on BDS, as well as other emergency responses containing the in-situ monitoring and the navigation and positioning monitoring.
In this paper, the interdisciplinary instant sharing based on DMM is mainly focused on the point observations, and it is especially suitable for the two data types (e.g., the in-situ monitoring data and the navigation and positioning data). Thus, in the future, for interdisciplinary instant observation sharing of the coverage observations, more and more data types, such as the video audio data and the social network data, more automatic extension mechanisms with the data provenance, as well as more real-time applications, for example, Internet of Things frameworks with real-time ecosystems will be further studied for the spatio-temporal enhanced sharing to satisfy the increasingly complex urban application requirements in smart cities.


