Next Issue
Volume 6, May
Previous Issue
Volume 6, March


ISPRS Int. J. Geo-Inf., Volume 6, Issue 4 (April 2017) – 34 articles

Cover Story (view full-size image): 
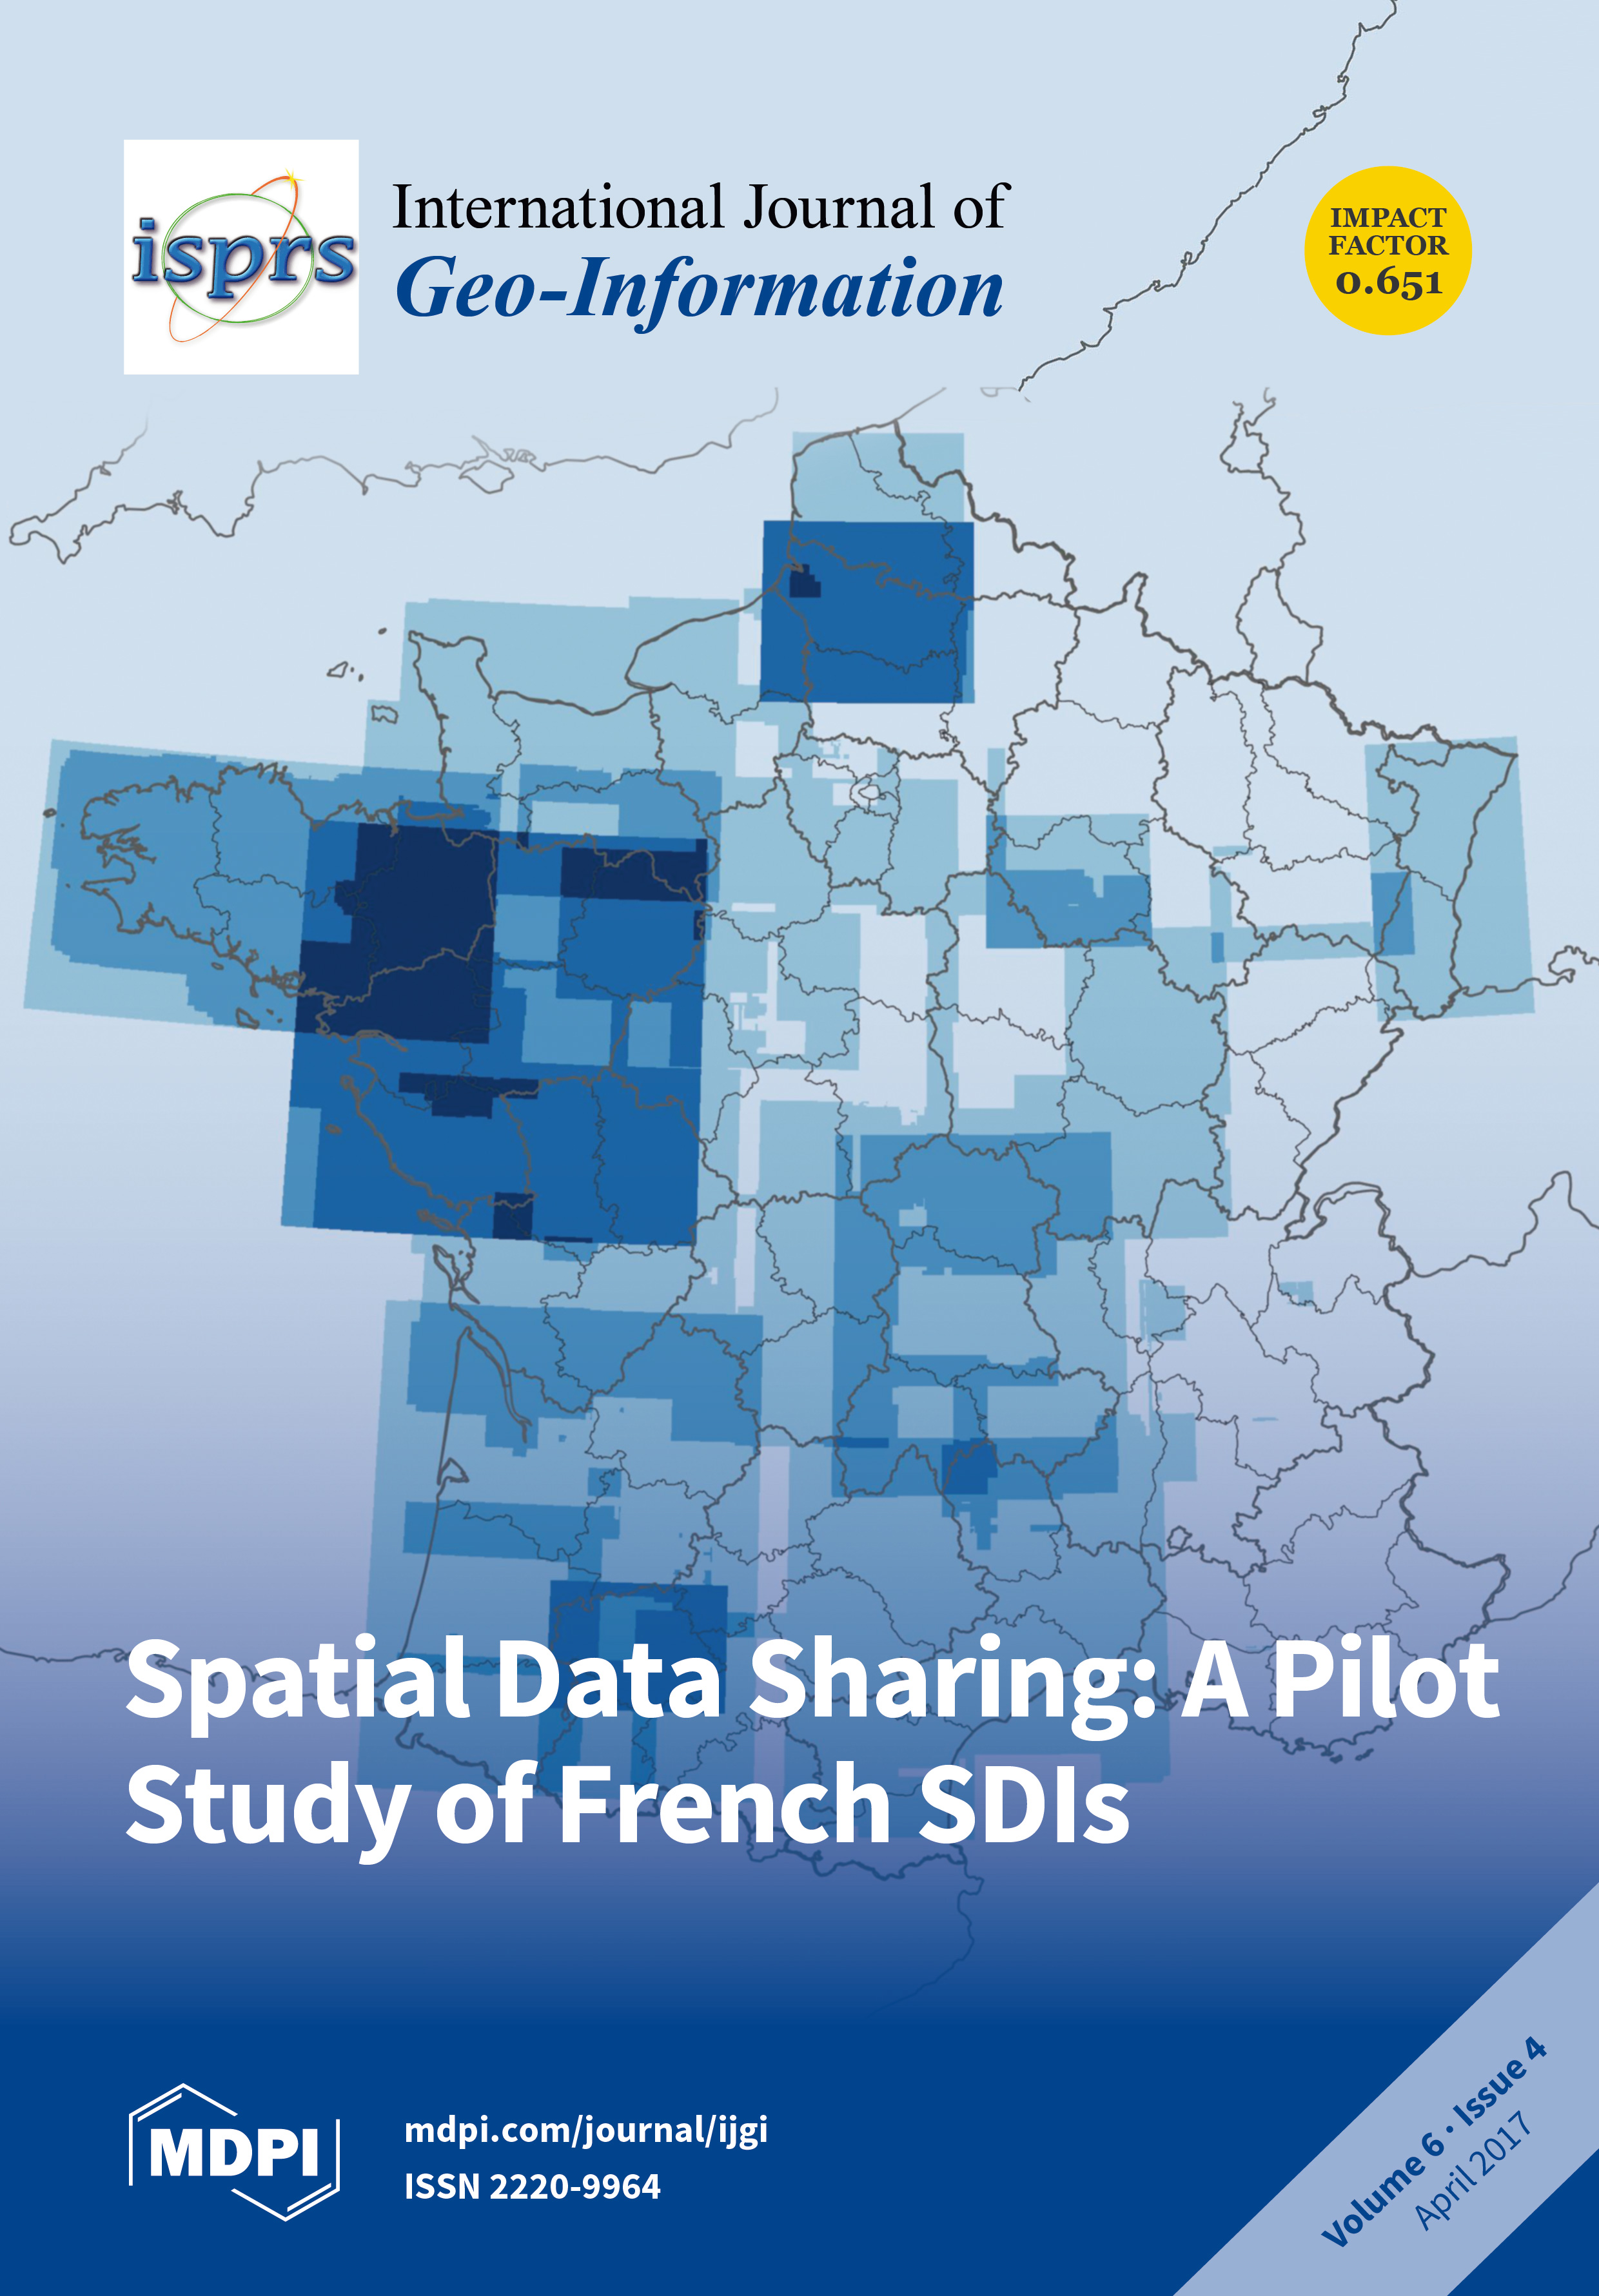
Since the appearance of Spatial Data Infrastructure (SDI), there has been an increase in spatial data available on the web. This situation raises research issues, in terms of identifying the content actually accessible and its impact on local governance. Our study proposes a mixed methodology applied to 45 French infrastructures, to compare the objectives stated by their promoters and their actual content. The methodology, based on an analysis of interviews with SDI coordinators, as well as an exploration of over 160,000 metadata in their catalogues, produced results concerning data accessibility, stakeholder networks, the interoperability of tools, and informational equality. Despite the proactive stance of SDI promoters, only 16% of data are open-access. Their interoperability remains restricted to specific types of actors. Although geocollaboration organised by SDIs is very active, it only concerns [...] Read more.
  • Issues are regarded as officially published after their release is announced to the table of contents alert mailing list.
  • You may sign up for e-mail alerts to receive table of contents of newly released issues.
  • PDF is the official format for papers published in both, html and pdf forms. To view the papers in pdf format, click on the "PDF Full-text" link, and use the free Adobe Reader to open them.
Order results
Result details
Select all
Export citation of selected articles as:
4662 KiB  
Article
Generating Up-to-Date and Detailed Land Use and Land Cover Maps Using OpenStreetMap and GlobeLand30
by Cidália Costa Fonte, Marco Minghini, Joaquim Patriarca, Vyron Antoniou, Linda See and Andriani Skopeliti
ISPRS Int. J. Geo-Inf. 2017, 6(4), 125; https://doi.org/10.3390/ijgi6040125 - 22 Apr 2017
Cited by 60 | Viewed by 10874
Abstract
With the opening up of the Landsat archive, global high resolution land cover maps have begun to appear. However, they often have only a small number of high level land cover classes and they are static products, corresponding to a particular period of [...] Read more.
With the opening up of the Landsat archive, global high resolution land cover maps have begun to appear. However, they often have only a small number of high level land cover classes and they are static products, corresponding to a particular period of time, e.g., the GlobeLand30 (GL30) map for 2010. The OpenStreetMap (OSM), in contrast, consists of a very detailed, dynamically updated, spatial database of mapped features from around the world, but it suffers from incomplete coverage, and layers of overlapping features that are tagged in a variety of ways. However, it clearly has potential for land use and land cover (LULC) mapping. Thus the aim of this paper is to demonstrate how the OSM can be converted into a LULC map and how this OSM-derived LULC map can then be used to first update the GL30 with more recent information and secondly, enhance the information content of the classes. The technique is demonstrated on two study areas where there is availability of OSM data but in locations where authoritative data are lacking, i.e., Kathmandu, Nepal and Dar es Salaam, Tanzania. The GL30 and its updated and enhanced versions are independently validated using a stratified random sample so that the three maps can be compared. The results show that the updated version of GL30 improves in terms of overall accuracy since certain classes were not captured well in the original GL30 (e.g., water in Kathmandu and water/wetlands in Dar es Salaam). In contrast, the enhanced GL30, which contains more detailed urban classes, results in a drop in the overall accuracy, possibly due to the increased number of classes, but the advantages include the appearance of more detailed features, such as the road network, that becomes clearly visible. Full article
(This article belongs to the Special Issue Volunteered Geographic Information)
Show Figures

Figure 1

2891 KiB  
Article
Forecasting Urban Vacancy Dynamics in a Shrinking City: A Land Transformation Model
by Jaekyung Lee and Galen Newman
ISPRS Int. J. Geo-Inf. 2017, 6(4), 124; https://doi.org/10.3390/ijgi6040124 - 20 Apr 2017
Cited by 32 | Viewed by 7413
Abstract
In the past two centuries, many American urban areas have experienced significant expansion in both populating and depopulating cities. The pursuit of bigger, faster, and more growth-oriented planning parallels a situation where municipal decline has also been recognized as a global epidemic. In [...] Read more.
In the past two centuries, many American urban areas have experienced significant expansion in both populating and depopulating cities. The pursuit of bigger, faster, and more growth-oriented planning parallels a situation where municipal decline has also been recognized as a global epidemic. In recent decades many older industrial cities have experienced significant depopulation, job loss, economic decline, and massive increases in vacant and abandoned properties due primarily to losses in industry and relocating populations. Despite continuous economic decline and depopulation, many of these so-called ‘shrinking cities’ still chase growth-oriented planning policies, due partially to inabilities to accurately predict future urban growth/decline patterns. This capability is critical to understanding land use alternation patterns and predicting future possible scenarios for the development of more proactive land use policies dealing with urban decline and regeneration. In this research, the city of Chicago, Illinois, USA is used as a case site to test an urban land use change model that predicts urban decline in a shrinking city, using vacant land as a proxy. Our approach employs the Land Transformation Model (LTM), which combines Geographic Information Systems and artificial neural networks to forecast land use change. Results indicate that the LTM is a good resource to simulate urban vacant land changes. Mobility and housing market conditions seem to be the primary variables contributing to decline. Full article
Show Figures

Graphical abstract

1468 KiB  
Article
Optimizing Multi-Way Spatial Joins of Web Feature Services
by Guiwen Lan, Qiang Zhang, Zhao Yang and Tong Li
ISPRS Int. J. Geo-Inf. 2017, 6(4), 123; https://doi.org/10.3390/ijgi6040123 - 20 Apr 2017
Cited by 4 | Viewed by 3898
Abstract
Web Feature Service (WFS) is a widely used spatial web service standard issued by the Open Geospatial Consortium (OGC). In a heterogeneous GIS application, a user can issue a query that relates two or more spatial datasets at different WFS servers. Multi-way spatial [...] Read more.
Web Feature Service (WFS) is a widely used spatial web service standard issued by the Open Geospatial Consortium (OGC). In a heterogeneous GIS application, a user can issue a query that relates two or more spatial datasets at different WFS servers. Multi-way spatial joins of WFSs are very expensive in terms of computation and transmission because of the time-consuming interactions between the servers and the client. In this paper, we examine the problems of multi-way spatial joins of WFSs, and we present a client-side optimization approach to generate good execution plans for such queries. The spatial semi-join and area partitioning-based methods are combined to prune away non-candidate objects in processing binary spatial joins, and the filtering rate is used as an index to determine the execution strategy for each sub-area. Two partitioning methods were tested, and the experimental results showed that both are effective if a proper threshold to stop the partitioning is chosen. In processing multi-way spatial joins of WFSs, the filtering rate is used as an indicator to determine the ordering of the binary joins. The optimization method is obviously superior to the other two methods when there are adequate spatial objects involved in the join query, or when more datasets are involved in the join query. Full article
(This article belongs to the Special Issue Recent Advances in Geodesy & Its Applications)
Show Figures

Figure 1

6432 KiB  
Article
Building an Urban Spatial Structure from Urban Land Use Data: An Example Using Automated Recognition of the City Centre
by Jie Zhu and Yizhong Sun
ISPRS Int. J. Geo-Inf. 2017, 6(4), 122; https://doi.org/10.3390/ijgi6040122 - 19 Apr 2017
Cited by 21 | Viewed by 6071
Abstract
It has been suggested that the method of constructing an urban spatial structure typically follows a forward process from planning and design up to expression, as reflected in both graphic and text descriptions of urban planning. Although unorthodox, the original status structures can [...] Read more.
It has been suggested that the method of constructing an urban spatial structure typically follows a forward process from planning and design up to expression, as reflected in both graphic and text descriptions of urban planning. Although unorthodox, the original status structures can be extracted and constructed from an existing urban land-use map. This approach not only provides the methodological foundation for urban spatial structure evolution and allows for a comparative and quantitative analysis between the existing and planned conditions, but also lays a theoretical basis for failure in scientific decision making during the planning phase. This study attempts to achieve this by identifying the city centre (a typical element of the urban spatial structure) from urban land use data. The city centre is a special region consisting of several units with particular spatial information, including geometric attributes, topological attributes, and thematic attributes. In this paper, we develop a methodology to support the delineation of the city centre, considering these factors. First, using commercial land data, we characterise the city centre as units based on a series of indicators, including geometric and thematic attributes, and integrate them into a composite index of “urban centrality”; Second, a graph-based spatial clustering method that considers both topological proximity and attribute similarity is designed and used to identify the city centre. The precise boundary of the city centre is subsequently delimited using a shape reconstruction method based on the cluster results. Finally, we present a case study to demonstrate the effectiveness and practicability of the methodology. Full article
Show Figures

Figure 1

8582 KiB  
Article
Spatial and Temporal Analysis of the Mitigating Effects of Industrial Relocation on the Surface Urban Heat Island over China
by Linlin Zhang, Qingyan Meng, Zhenhui Sun and Yunxiao Sun
ISPRS Int. J. Geo-Inf. 2017, 6(4), 121; https://doi.org/10.3390/ijgi6040121 - 19 Apr 2017
Cited by 25 | Viewed by 4960
Abstract
Urbanization is typically accompanied by the relocation and reconstruction of industrial areas due to limited space and environmental requirements, particularly in the case of a capital city. Shougang Group, one of the largest steel mill operators in China, was relocated from Beijing to [...] Read more.
Urbanization is typically accompanied by the relocation and reconstruction of industrial areas due to limited space and environmental requirements, particularly in the case of a capital city. Shougang Group, one of the largest steel mill operators in China, was relocated from Beijing to Hebei Province. To study the thermal environmental changes at the Shougang industrial site before and after relocation, four Landsat images (from 2000, 2005, 2010 and 2016) were used to calculate the land surface temperature (LST). Using the urban heat island ratio index (URI), we compared the LST values for the four images of the investigated area. Following the relocation of Shougang Group, the URI values decreased from 0.55 in 2005 to 0.21 in 2016, indicating that the surface urban heat island effect in the area was greatly mitigated; we infer that this effect was related to steel production. This study shows that the use of Landsat images to assess industrial thermal pollution is feasible. Accurate and rapid extraction of thermal pollution data by remote sensing offers great potential for the management of industrial pollution sources and distribution, and for technical support in urban planning departments. Full article
Show Figures

Figure 1

13325 KiB  
Article
Identifying Witness Accounts from Social Media Using Imagery
by Marie Truelove, Kourosh Khoshelham, Simon McLean, Stephan Winter and Maria Vasardani
ISPRS Int. J. Geo-Inf. 2017, 6(4), 120; https://doi.org/10.3390/ijgi6040120 - 18 Apr 2017
Cited by 8 | Viewed by 3999
Abstract
This research investigates the use of image category classification to distinguish images posted to social media that are Witness Accounts of an event. Only images depicting observations of the event, captured by micro-bloggers at the event, are considered Witness Accounts. Identifying Witness Accounts [...] Read more.
This research investigates the use of image category classification to distinguish images posted to social media that are Witness Accounts of an event. Only images depicting observations of the event, captured by micro-bloggers at the event, are considered Witness Accounts. Identifying Witness Accounts from social media is important for services such as news, marketing and emergency response. Automated image category classification is essential due to the large number of images on social media and interest in identifying witnesses in near real time. This paper begins research of this emerging problem with an established procedure, using a bag-of-words method to create a vocabulary of visual words and classifier trained to categorize the encoded images. In order to test the procedure, a set of images were collected for case study events, Australian Football League matches, from Twitter. Evaluation shows an overall accuracy of 90% and precision and recall for both classes exceeding 83%. Full article
Show Figures

Figure 1

5942 KiB  
Article
A GIS-Based Fuzzy Decision Making Model for Seismic Vulnerability Assessment in Areas with Incomplete Data
by Mansoureh Sadrykia, Mahmoud Reza Delavar and Mehdi Zare
ISPRS Int. J. Geo-Inf. 2017, 6(4), 119; https://doi.org/10.3390/ijgi6040119 - 14 Apr 2017
Cited by 22 | Viewed by 5625
Abstract
Earthquakes are one of the natural disasters that threaten many lives every year. It is important to estimate seismic damages in advance to be able to reduce future losses. However, seismic vulnerability assessment is a complicated problem, especially in areas with incomplete data, [...] Read more.
Earthquakes are one of the natural disasters that threaten many lives every year. It is important to estimate seismic damages in advance to be able to reduce future losses. However, seismic vulnerability assessment is a complicated problem, especially in areas with incomplete data, due to incorporated uncertainties. Therefore, it is important to use adequate methods that take into account and handle the associated uncertainties. Although different seismic vulnerability assessment methods at the urban scale have been proposed, the purpose of this research is to introduce a new Geospatial Information System GIS-based model using a modified integration of Analytical Hierarchy Process (AHP), fuzzy sets theory, and Technique for Order Preference by Similarity to an Ideal Solution (TOPSIS) in a vector-based environment. The proposed method emphasizes handling one of the important uncertainties in areas with incomplete data, namely the ‘vagueness’ of the existing knowledge about influences of the criteria on seismic vulnerability, which is handled using fuzzy sets theory in this research. The applicability of the proposed method is tested in a municipality district of Tabriz, which is in a near vicinity to the fault system. It can be concluded that the proposed method contributes to a pragmatic and efficient assessment of physical seismic vulnerability under uncertainty, which provides useful information for assisting planners in mitigation and preparation stages in less-studied areas. Full article
Show Figures

Figure 1

6352 KiB  
Article
An Improved Density-Based Time Series Clustering Method Based on Image Resampling: A Case Study of Surface Deformation Pattern Analysis
by Yaolin Liu, Xiaomi Wang, Qiliang Liu, Yiyun Chen and Leilei Liu
ISPRS Int. J. Geo-Inf. 2017, 6(4), 118; https://doi.org/10.3390/ijgi6040118 - 13 Apr 2017
Cited by 1 | Viewed by 3573
Abstract
Time series clustering algorithms have been widely used to mine the clustering distribution characteristics of real phenomena. However, these algorithms have several limitations. First, they depend heavily on prior knowledge. Second, the algorithms do not simultaneously consider the similarity of spatial locations, spatial-temporal [...] Read more.
Time series clustering algorithms have been widely used to mine the clustering distribution characteristics of real phenomena. However, these algorithms have several limitations. First, they depend heavily on prior knowledge. Second, the algorithms do not simultaneously consider the similarity of spatial locations, spatial-temporal attribute values, and spatial-temporal attribute trends (trends in terms of the change direction and ranges in addition and deletion over time), which are all important similarity measurements. Finally, the calculation cost based on these methods for clustering analysis is becoming increasingly computationally demanding, because the data volume of the image time series data is increasing. In view of these shortcomings, an improved density-based time series clustering method based on image resampling (DBTSC-IR) has been proposed in this paper. The proposed DBTSC-IR has two major parts. In the first part, an optimal resampling scale of the image time series data is first determined to reduce the data volume by using a new scale optimization function. In the second part, the traditional density-based time series clustering algorithm is improved by introducing a density indicator to control the clustering sequences by considering the spatial locations, spatial-temporal attribute values, and spatial-temporal attribute trends. The final clustering analysis is then performed directly on the resampled image time series data by using the improved algorithm. Finally, the effectiveness of the proposed DBTSC-IR is illustrated by experiments on both the simulated datasets and in real applications. The proposed method can effectively and adaptively recognize the spatial patterns with arbitrary shapes of image time series data with consideration of the effects of noise. Full article
Show Figures

Figure 1

1032 KiB  
Article
Marine Spatial Data Infrastructure Development Framework: Croatia Case Study
by Marina Tavra, Niksa Jajac and Vlado Cetl
ISPRS Int. J. Geo-Inf. 2017, 6(4), 117; https://doi.org/10.3390/ijgi6040117 - 13 Apr 2017
Cited by 11 | Viewed by 6086
Abstract
Spatial data infrastructure (SDI) related to marine spatial data is known as marine SDI (MSDI). In this paper, we determine data themes under the MSDI in the order of usefulness and efficiency. The purpose is to streamline and support the prioritisation of data [...] Read more.
Spatial data infrastructure (SDI) related to marine spatial data is known as marine SDI (MSDI). In this paper, we determine data themes under the MSDI in the order of usefulness and efficiency. The purpose is to streamline and support the prioritisation of data to be further implemented in the MSDI. This is conceptualised using the logic of decision support systems and a multi-criteria analysis approach that integrates components such as data, stakeholders, and users through multi-criteria methods for priority ranking. This research proposes an MSDI development concept and is validated using the Croatian MSDI case. Full article
Show Figures

Graphical abstract

2570 KiB  
Article
A Standard Indoor Spatial Data Model—OGC IndoorGML and Implementation Approaches
by Hae-Kyong Kang and Ki-Joune Li
ISPRS Int. J. Geo-Inf. 2017, 6(4), 116; https://doi.org/10.3390/ijgi6040116 - 12 Apr 2017
Cited by 90 | Viewed by 10443
Abstract
With the recent progress in indoor spatial data modeling, indoor mapping and indoor positioning technologies, several spatial information services for indoor spaces have been provided like for outdoor spaces. In order to support interoperability between indoor spatial information services, IndoorGML was published by [...] Read more.
With the recent progress in indoor spatial data modeling, indoor mapping and indoor positioning technologies, several spatial information services for indoor spaces have been provided like for outdoor spaces. In order to support interoperability between indoor spatial information services, IndoorGML was published by OGC (Open Geospatial Consortium) as a standard data model and XML-based exchange format. While the previous standards, such as IFC (Industrial Foundation Classes) and CityGML covering also indoor space, aim at feature modeling, the goal of IndoorGML is to establish a standard basis for the indoor space model. As IndoorGML defines a minimum data model for indoor space, more efforts are required to discover its potential aspects, which are not explicitly explained in the standard document. In this paper, we investigate the implications and potential aspects of IndoorGML and its basic concept of the cellular space model and discuss the implementation issues of IndoorGML for several purposes. In particular, we discuss the issues on cell determination, subspacing and the hierarchical structure of indoor space from the IndoorGML viewpoint. Additionally, we also focus on two important issues: computation of indoor distance and the implementation of indoor context-awareness services based on IndoorGML. We expect that this paper will serve as a technical document for better understanding of IndoorGML throughout these discussions. Full article
(This article belongs to the Special Issue 3D Indoor Modelling and Navigation)
Show Figures

Figure 1

4448 KiB  
Article
Spatial Dynamic Modelling of Future Scenarios of Land Use Change in Vaud and Valais, Western Switzerland
by Ana Gago-Silva, Nicolas Ray and Anthony Lehmann
ISPRS Int. J. Geo-Inf. 2017, 6(4), 115; https://doi.org/10.3390/ijgi6040115 - 11 Apr 2017
Cited by 14 | Viewed by 6639
Abstract
We use Bayesian methods with a weights of evidence approach to model the probability of land use change over the Western part of Switzerland. This first model is followed by a cellular automata model for spatial allocation of land use classes. Our results [...] Read more.
We use Bayesian methods with a weights of evidence approach to model the probability of land use change over the Western part of Switzerland. This first model is followed by a cellular automata model for spatial allocation of land use classes. Our results extend and enhance current land use scenarios studies by applying Dinamica Environment for Geoprocessing Objects (Dinamica EG) to a study area comprising of the upper Rhone river basin in the Cantons of Vaud and Valais. In order to take into account the topography, we divide the study area into four regions, based on their altitude and administrative region. We show that the different regions are affected in differing ways by the same driving forces. We analyse possible outcomes in land use change in 2050 for three different scenarios: “business as usual”, “liberalisation” and a “lowered agriculture production”. The “business-as-usual” scenario results indicate a decrease in agriculture, mostly in extensive agriculture, with a share in the total area of 12.3% in 2009 decreasing by 3.3% in 2050. Losses expected under a “business-as-usual” scenario in agriculture, are mostly due to the conversion to shrubland and forest. Further losses in extensive agriculture are expected under the “liberalisation” scenario, decreasing by 10.3 % in 2050. Along with a marked increase in the closed and open forest area, increasing from 27.1% in 2009 to 42.3% by 2050. Gains in open land habitat with the increase of the share of extensive agriculture area under the “lowered agricultural production” scenario are expected to increase by 3.2% in 2050, while the share of intensive agriculture area is expected to decrease by 5.6%. Full article
Show Figures

Figure 1

2079 KiB  
Article
A Spatio-Temporal Building Exposure Database and Information Life-Cycle Management Solution
by Marc Wieland and Massimiliano Pittore
ISPRS Int. J. Geo-Inf. 2017, 6(4), 114; https://doi.org/10.3390/ijgi6040114 - 08 Apr 2017
Cited by 17 | Viewed by 6669
Abstract
With an ever-increasing volume and complexity of data collected from a variety of sources, the efficient management of geospatial information becomes a key topic in disaster risk management. For example, the representation of assets exposed to natural disasters is subjected to changes throughout [...] Read more.
With an ever-increasing volume and complexity of data collected from a variety of sources, the efficient management of geospatial information becomes a key topic in disaster risk management. For example, the representation of assets exposed to natural disasters is subjected to changes throughout the different phases of risk management reaching from pre-disaster mitigation to the response after an event and the long-term recovery of affected assets. Spatio-temporal changes need to be integrated into a sound conceptual and technological framework able to deal with data coming from different sources, at varying scales, and changing in space and time. Especially managing the information life-cycle, the integration of heterogeneous information and the distributed versioning and release of geospatial information are important topics that need to become essential parts of modern exposure modelling solutions. The main purpose of this study is to provide a conceptual and technological framework to tackle the requirements implied by disaster risk management for describing exposed assets in space and time. An information life-cycle management solution is proposed, based on a relational spatio-temporal database model coupled with Git and GeoGig repositories for distributed versioning. Two application scenarios focusing on the modelling of residential building stocks are presented to show the capabilities of the implemented solution. A prototype database model is shared on GitHub along with the necessary scenario data. Full article
Show Figures

Figure 1

1848 KiB  
Article
Interpolation and Prediction of Spatiotemporal Data Based on XML Integrated with Grey Dynamic Model
by Luyi Bai, Li Yan and Zongmin Ma
ISPRS Int. J. Geo-Inf. 2017, 6(4), 113; https://doi.org/10.3390/ijgi6040113 - 07 Apr 2017
Cited by 6 | Viewed by 3345
Abstract
Interpolation and prediction of spatiotemporal data are integral components of many real-world applications. Thus, approaches of interpolating and predicting spatiotemporal data have been extensively investigated. Currently, the grey dynamic model has been used to enhance the performance of interpolating and predicting spatiotemporal data. [...] Read more.
Interpolation and prediction of spatiotemporal data are integral components of many real-world applications. Thus, approaches of interpolating and predicting spatiotemporal data have been extensively investigated. Currently, the grey dynamic model has been used to enhance the performance of interpolating and predicting spatiotemporal data. Meanwhile, the Extensible Markup Language (XML) has unique characteristics of information representation and exchange. In this paper, we first couple the grey dynamic model with the spatiotemporal XML model. Based on a definition of the position part of the spatiotemporal XML model, we extract the corresponding position information of each time interval and propose an algorithm for constructing an AVL tree to store them. Then, we present the architecture of an interpolating and predicting process and investigate change operations in positions. On this basis, we present an algorithm for interpolation and prediction of spatiotemporal data based on XML integrated with the grey dynamic model. Experimental results demonstrate the performance advantages of the proposed approach. Full article
Show Figures

Figure 1

2923 KiB  
Article
Uncertainties in Classification System Conversion and an Analysis of Inconsistencies in Global Land Cover Products
by Miao Zhang, Mingguo Ma, Philippe De Maeyer and Alishir Kurban
ISPRS Int. J. Geo-Inf. 2017, 6(4), 112; https://doi.org/10.3390/ijgi6040112 - 07 Apr 2017
Cited by 10 | Viewed by 4236
Abstract
In this study, using the common classification systems of IGBP-17, IGBP-9, IPCC-5 and TC (vegetation, wetlands and others only), we studied spatial and areal inconsistencies in the three most recent multi-resource land cover products in a complex mountain-oasis-desert system and quantitatively discussed the [...] Read more.
In this study, using the common classification systems of IGBP-17, IGBP-9, IPCC-5 and TC (vegetation, wetlands and others only), we studied spatial and areal inconsistencies in the three most recent multi-resource land cover products in a complex mountain-oasis-desert system and quantitatively discussed the uncertainties in classification system conversion. This is the first study to compare these products based on terrain and to quantitatively study the uncertainties in classification system conversion. The inconsistencies and uncertainties decreased from high to low levels of aggregation (IGBP-17 to TC) and from mountain to desert areas, indicating that the inconsistencies are not only influenced by the level of thematic detail and landscape complexity but also related to the conversion uncertainties. The overall areal inconsistency in the comparison of the FROM-GLC and GlobCover 2009 datasets is the smallest among the three pairs, but the smallest overall spatial inconsistency was observed between the FROM-GLC and MODISLC. The GlobCover 2009 had the largest conversion uncertainties due to mosaic land cover definition, with values up to 23.9%, 9.68% and 0.11% in mountainous, oasis and desert areas, respectively. The FROM-GLC had the smallest inconsistency, with values less than 4.58%, 1.89% and 1.2% in corresponding areas. Because the FROM-GLC dataset uses a hierarchical classification scheme with explicit attribution from the second level to the first, this system is suggested for producers of map land cover products in the future. Full article
Show Figures

Figure 1

2159 KiB  
Article
Attribute Learning for SAR Image Classification
by Chu He, Xinlong Liu, Chenyao Kang, Dong Chen and Mingsheng Liao
ISPRS Int. J. Geo-Inf. 2017, 6(4), 111; https://doi.org/10.3390/ijgi6040111 - 05 Apr 2017
Cited by 7 | Viewed by 4417
Abstract
This paper presents a classification approach based on attribute learning for high spatial resolution Synthetic Aperture Radar (SAR) images. To explore the representative and discriminative attributes of SAR images, first, an iterative unsupervised algorithm is designed to cluster in the low-level feature space, [...] Read more.
This paper presents a classification approach based on attribute learning for high spatial resolution Synthetic Aperture Radar (SAR) images. To explore the representative and discriminative attributes of SAR images, first, an iterative unsupervised algorithm is designed to cluster in the low-level feature space, where the maximum edge response and the ratio of mean-to-variance are included; a cross-validation step is applied to prevent overfitting. Second, the most discriminative clustering centers are sorted out to construct an attribute dictionary. By resorting to the attribute dictionary, a representation vector describing certain categories in the SAR image can be generated, which in turn is used to perform the classifying task. The experiments conducted on TerraSAR-X images indicate that those learned attributes have strong visual semantics, which are characterized by bright and dark spots, stripes, or their combinations. The classification method based on these learned attributes achieves better results. Full article
Show Figures

Figure 1

9335 KiB  
Article
Camera Coverage Estimation Based on Multistage Grid Subdivision
by Meizhen Wang, Xuejun Liu, Yanan Zhang and Ziran Wang
ISPRS Int. J. Geo-Inf. 2017, 6(4), 110; https://doi.org/10.3390/ijgi6040110 - 05 Apr 2017
Cited by 12 | Viewed by 5659
Abstract
Visual coverage is one of the most important quality indexes for depicting the usability of an individual camera or camera network. It is the basis for camera network deployment, placement, coverage-enhancement, planning, etc. Precision and efficiency are critical influences on applications, especially those [...] Read more.
Visual coverage is one of the most important quality indexes for depicting the usability of an individual camera or camera network. It is the basis for camera network deployment, placement, coverage-enhancement, planning, etc. Precision and efficiency are critical influences on applications, especially those involving several cameras. This paper proposes a new method to efficiently estimate superior camera coverage. First, the geographic area that is covered by the camera and its minimum bounding rectangle (MBR) without considering obstacles is computed using the camera parameters. Second, the MBR is divided into grids using the initial grid size. The status of the four corners of each grid is estimated by a line of sight (LOS) algorithm. If the camera, considering obstacles, covers a corner, the status is represented by 1, otherwise by 0. Consequently, the status of a grid can be represented by a code that is a combination of 0s or 1s. If the code is not homogeneous (not four 0s or four 1s), the grid will be divided into four sub-grids until the sub-grids are divided into a specific maximum level or their codes are homogeneous. Finally, after performing the process above, total camera coverage is estimated according to the size and status of all grids. Experimental results illustrate that the proposed method’s accuracy is determined by the method that divided the coverage area into the smallest grids at the maximum level, while its efficacy is closer to the method that divided the coverage area into the initial grids. It considers both efficiency and accuracy. The initial grid size and maximum level are two critical influences on the proposed method, which can be determined by weighing efficiency and accuracy. Full article
(This article belongs to the Special Issue Applications of Internet of Things)
Show Figures

Figure 1

1197 KiB  
Article
Towards Understanding Location Privacy Awareness on Geo-Social Networks
by Alia I. Abdelmoty and Fatma Alrayes
ISPRS Int. J. Geo-Inf. 2017, 6(4), 109; https://doi.org/10.3390/ijgi6040109 - 05 Apr 2017
Cited by 9 | Viewed by 4101
Abstract
Users' awareness of the extent of information implicit in their geo-profiles on social networks is limited. This questions the validity of their consent to the collection, storage and use of their data. Tools for location privacy awareness are needed that provide users with [...] Read more.
Users' awareness of the extent of information implicit in their geo-profiles on social networks is limited. This questions the validity of their consent to the collection, storage and use of their data. Tools for location privacy awareness are needed that provide users with accessible means for understanding the implicit content in their location information as well as a view of the level of risk to their privacy as a consequence of disclosing this information. Towards this goal, an abstract model of location privacy threat levels is first derived from a user study involving 186 users. This is then used to inform the design of a prototype privacy feedback tool for a location-based social network. Another user study involving 338 users of this network is carried out to test the effectiveness of the proposed design. Findings confirm the strong need of users for more transparent access to and control over their location profiles and guide the proposal of recommendations to the design of more privacy-sensitive geo-social networks. Full article
Show Figures

Figure 1

3368 KiB  
Article
Adaptive and Optimized RDF Query Interface for Distributed WFS Data
by Tian Zhao, Chuanrong Zhang and Weidong Li
ISPRS Int. J. Geo-Inf. 2017, 6(4), 108; https://doi.org/10.3390/ijgi6040108 - 05 Apr 2017
Cited by 4 | Viewed by 4333
Abstract
Web Feature Service (WFS) is a protocol for accessing geospatial data stores such as databases and Shapefiles over the Web. However, WFS does not provide direct access to data distributed in multiple servers. In addition, WFS features extracted from their original sources are [...] Read more.
Web Feature Service (WFS) is a protocol for accessing geospatial data stores such as databases and Shapefiles over the Web. However, WFS does not provide direct access to data distributed in multiple servers. In addition, WFS features extracted from their original sources are not convenient for user access due to the lack of connection to high-level concepts. Users are facing the choices of either querying each WFS server first and then integrating the results, or converting the data from all WFS servers to a more expressive format such as RDF (Resource Description Framework) and then querying the integrated data. The first choice requires additional programming while the second choice is not practical for large or frequently updated datasets. The new contribution of this paper is that we propose a novel adaptive and optimized RDF query interface to overcome the aforementioned limitation. Specifically, in this paper, we propose a novel algorithm to query and synthesize distributed WFS data through an RDF query interface, where users can specify data requests to multiple WFS servers using a single RDF query. Users can also define a simple configuration to associate WFS feature types, attributes, and values with RDF classes, properties, and values so that user queries can be written using a more uniform and informative vocabulary. The algorithm translates each RDF query written in SPARQL-like syntax to multiple WFS GetFeature requests, and then converts and integrates the multiple WFS results to get the answers to the original query. The generated GetFeature requests are sent asynchronously and simultaneously to WFS servers to take advantage of the server parallelism. The results of each GetFeature request are cached to improve query response time for subsequent queries that involve one or more of the cached requests. A JavaScript-based prototype is implemented and experimental results show that the query response time can be greatly reduced through fine-grained caching. Full article
Show Figures

Figure 1

15313 KiB  
Article
Spatial-Temporal Patterns of Bean Crop in Brazil over the Period 1990–2013
by Augusto Monso Clemente, Osmar Abílio de Carvalho Júnior, Renato Fontes Guimarães, Concepta McManus, Caroline Machado Vasconcelos Turazi and Potira Meirelles Hermuche
ISPRS Int. J. Geo-Inf. 2017, 6(4), 107; https://doi.org/10.3390/ijgi6040107 - 03 Apr 2017
Cited by 11 | Viewed by 4894
Abstract
The understanding of spatial dependence and distribution of agricultural production factors is a key issue for the territorial planning and regional development. This study evaluates the spatial-temporal dynamics of bean crops in Brazil over the period 1990–2013. Common bean (Phaseolus vulgaris L.) [...] Read more.
The understanding of spatial dependence and distribution of agricultural production factors is a key issue for the territorial planning and regional development. This study evaluates the spatial-temporal dynamics of bean crops in Brazil over the period 1990–2013. Common bean (Phaseolus vulgaris L.) is one of the staple foods for the Brazilian population, with nationwide production and cultivated mostly by family farmers. The analyzed variables of this crop included harvested area, produced quantity, and average crop yield. We investigated spatial autocorrelations using the Global and Local Moran Index. The global spatial autocorrelation statistics demonstrated a general spatial dependence of bean production over Brazil, while the local spatial autocorrelation statistics detect statistically significant zones of high and low bean-production attributes. Maps of growth and acceleration rate of the variables were constructed, showing the areas that increased, decreased, or stagnated during the time series. The results showed a considerable reduction of the bean harvested area, but there were significant increases in produced quantity and average crop yield. Results showed distinct and significant patterns of bean-production variables in Brazilian territory over the different years. Regional differences and peculiarities are evident, emphasizing the need for directing investments to agricultural research and public policy. Full article
Show Figures

Figure 1

5386 KiB  
Article
A Sparse Voxel Octree-Based Framework for Computing Solar Radiation Using 3D City Models
by Jianming Liang and Jianhua Gong
ISPRS Int. J. Geo-Inf. 2017, 6(4), 106; https://doi.org/10.3390/ijgi6040106 - 31 Mar 2017
Cited by 13 | Viewed by 8140
Abstract
An effective three-dimensional (3D) data representation is required to assess the spatial distribution of the photovoltaic potential over urban building roofs and facades using 3D city models. Voxels have long been used as a spatial data representation, but practical applications of the voxel [...] Read more.
An effective three-dimensional (3D) data representation is required to assess the spatial distribution of the photovoltaic potential over urban building roofs and facades using 3D city models. Voxels have long been used as a spatial data representation, but practical applications of the voxel representation have been limited compared with rasters in traditional two-dimensional (2D) geographic information systems (GIS). We propose to use sparse voxel octree (SVO) as a data representation to extend the GRASS GIS r.sun solar radiation model from 2D to 3D. The GRASS GIS r.sun model is nested in an SVO-based computing framework. The presented 3D solar radiation computing framework was applied to 3D building groups of different geometric complexities to demonstrate its efficiency and scalability. We presented a method to explicitly compute diffuse shading losses in r.sun, and found that diffuse shading losses can reduce up to 10% of the annual global radiation under clear sky conditions. Hence, diffuse shading losses are of significant importance especially in complex urban environments. Full article
Show Figures

Figure 1

9161 KiB  
Article
Ontology-Guided Image Interpretation for GEOBIA of High Spatial Resolution Remote Sense Imagery: A Coastal Area Case Study
by Helingjie Huang, Jianyu Chen, Zhu Li, Fang Gong and Ninghua Chen
ISPRS Int. J. Geo-Inf. 2017, 6(4), 105; https://doi.org/10.3390/ijgi6040105 - 31 Mar 2017
Cited by 10 | Viewed by 4679
Abstract
Image interpretation is a major topic in the remote sensing community. With the increasing acquisition of high spatial resolution (HSR) remotely sensed images, incorporating geographic object-based image analysis (GEOBIA) is becoming an important sub-discipline for improving remote sensing applications. The idea of integrating [...] Read more.
Image interpretation is a major topic in the remote sensing community. With the increasing acquisition of high spatial resolution (HSR) remotely sensed images, incorporating geographic object-based image analysis (GEOBIA) is becoming an important sub-discipline for improving remote sensing applications. The idea of integrating the human ability to understand images inspires research related to introducing expert knowledge into image object–based interpretation. The relevant work involved three parts: (1) identification and formalization of domain knowledge; (2) image segmentation and feature extraction; and (3) matching image objects with geographic concepts. This paper presents a novel way that combines multi-scaled segmented image objects with geographic concepts to express context in an ontology-guided image interpretation. Spectral features and geometric features of a single object are extracted after segmentation and topological relationships are also used in the interpretation. Web ontology language–query language (OWL-QL) formalize domain knowledge. Then the interpretation matching procedure is implemented by the OWL-QL query-answering. Compared with a supervised classification, which does not consider context, the proposed method validates two HSR images of coastal areas in China. Both the number of interpreted classes increased (19 classes over 10 classes in Case 1 and 12 classes over seven in Case 2), and the overall accuracy improved (0.77 over 0.55 in Case 1 and 0.86 over 0.65 in Case 2). The additional context of the image objects improved accuracy during image classification. The proposed approach shows the pivotal role of ontology for knowledge-guided interpretation. Full article
Show Figures

Figure 1

4486 KiB  
Article
A Dynamic Indoor Field Model for Emergency Evacuation Simulation
by Qing Xiong, Qing Zhu, Zhiqiang Du, Xinyan Zhu, Yeting Zhang, Lei Niu, Yun Li and Yan Zhou
ISPRS Int. J. Geo-Inf. 2017, 6(4), 104; https://doi.org/10.3390/ijgi6040104 - 30 Mar 2017
Cited by 39 | Viewed by 6645
Abstract
Indoor emergency response plays a critically important role in disaster management for cities, which must consider the evacuation of people in a dynamic indoor environment. The spatial model is the foundation for the specific analysis of indoor emergency responses, such as evacuations. The [...] Read more.
Indoor emergency response plays a critically important role in disaster management for cities, which must consider the evacuation of people in a dynamic indoor environment. The spatial model is the foundation for the specific analysis of indoor emergency responses, such as evacuations. The current spatial model for evacuation has three primary pitfalls: (1) it primarily focuses on static spatial information, such as rooms, doors, and windows, and lacks dynamic information, such as events and sensors; (2) it mainly focuses on the horizontal space and the static scene and lacks a multi-story component that considers the different properties of stairs compared to planar areas; and (3) it places emphasis on the indoor navigation calculation with a 2D/3D network, which lacks individual properties that can support more complicated analysis, such as congestion and stagnation. In this paper, we propose a dynamic indoor field model with three typical characteristics. (1) It includes not only static information but also dynamic information, such as outdoor and indoor building geometry, sensors, fire spread, and personnel behavior. (2) It supports multi-story buildings from the macro level (building level and floor level) to the micro level (room level and individual level) based on horizontal and vertical indoor space. (3) It supports spatial calculations based on a three-dimensional space grid and can analyze potential congestion and stagnation during evacuation. We design a corresponding evacuation method that supports individual evacuation route finding and evacuation assessment. We perform a series of analyses of the applicability of the proposed model and the efficiency of the designed evacuation method based on multi-story evacuation studies. The simulation includes a total evacuation population exceeding 7000 individuals, and the analysis suggests that the new model and algorithm are effective in planning indoor emergency routes that avoid potential congestion or stagnation. Full article
Show Figures

Figure 1

2276 KiB  
Article
Validation of Spatial Prediction Models for Landslide Susceptibility Mapping by Considering Structural Similarity
by Xiaolong Deng, Lihui Li and Yufang Tan
ISPRS Int. J. Geo-Inf. 2017, 6(4), 103; https://doi.org/10.3390/ijgi6040103 - 30 Mar 2017
Cited by 38 | Viewed by 5481
Abstract
In this paper, we propose a methodology for validating landslide susceptibility results in the Pinggu district (Beijing, China). A landslide inventory including 169 landslides was prepared, and eight factors correlated to landslides (lithology, tectonic faults, topographic elevation, slope gradient, aspect, slope curvature, land [...] Read more.
In this paper, we propose a methodology for validating landslide susceptibility results in the Pinggu district (Beijing, China). A landslide inventory including 169 landslides was prepared, and eight factors correlated to landslides (lithology, tectonic faults, topographic elevation, slope gradient, aspect, slope curvature, land use, and road network) were processed, integrating two techniques, namely the frequency ratio (FR) and the certainty factor (CF), in a geographic information system (GIS) environment. The area under the curve (success rate curve and prediction curve) analysis was used to evaluate model compatibility and predictability. Validation results indicated that the values of the area under the curve for the FR model and the CF model were 0.769 and 0.768, respectively. Considering spatial correlation, an alternative complementary method for validating landslide susceptibility maps was introduced. The spatially approximate maps could be discriminated from their matrices which carry structural information, and the structural similarity index (SSI) was then proposed to quantify the similarity. As a specific example, the SSI value of the FR (74.15%) scored higher than that of the CF model (69.36%), demonstrating its promise in validating different landslide susceptibility maps. These results show that the FR model outperforms the CF model in producing a landslide susceptibility map in the study area. Full article
Show Figures

Figure 1

2810 KiB  
Article
Integrating Geospatial Techniques for Urban Land Use Classification in the Developing Sub-Saharan African City of Lusaka, Zambia
by Matamyo Simwanda and Yuji Murayama
ISPRS Int. J. Geo-Inf. 2017, 6(4), 102; https://doi.org/10.3390/ijgi6040102 - 30 Mar 2017
Cited by 29 | Viewed by 6380
Abstract
For most sub-Saharan African (SSA) cities, in order to control the historically unplanned urban growth and stimulate sustainable future urban development, there is a need for accurate identification of the past and present urban land use (ULU). However, studies addressing ULU classification in [...] Read more.
For most sub-Saharan African (SSA) cities, in order to control the historically unplanned urban growth and stimulate sustainable future urban development, there is a need for accurate identification of the past and present urban land use (ULU). However, studies addressing ULU classification in SSA cities are lacking. In this study, we developed an integrated approach of remote sensing and Geographical Information System (GIS) techniques to classify ULU in the developing SSA city of Lusaka. First, we defined six ULU classes (i.e., unplanned high density residential; unplanned low density residential; planned medium-high density residential; planned low density residential; commercial and industrial; public institutions and service areas). ULU parcels, created using road networks as homogenous units separating ULU classes, were used to classify ULU. We utilised the combined detail of cadastral and land use data plus high-resolution Google Earth imagery to infer ULU and classify the parcels. For residential ULU, we also created density thresholds for accurate separation of the classes. We then used the classified ULU parcels for post-classification sorting of built-up pixels extracted from three Landsat TM/ETM+ imageries (1990, 2000, and 2010) into respective ULU classes. Three ULU maps were produced with overall accuracy values of 84.09% to 85.86%. The maps provide information that is relevant to urban planners and policy makers for sustainable future urban planning of Lusaka City. The study also provides an insight for ULU classification in SSA cities with complex urban landscapes similar to Lusaka. Full article
Show Figures

Figure 1

26526 KiB  
Article
The Legibility and Permeability of Cities: Examining the Role of Spatial Data and Metrics
by Tolue Silavi, Farshad Hakimpour, Christophe Claramunt and Farshad Nourian
ISPRS Int. J. Geo-Inf. 2017, 6(4), 101; https://doi.org/10.3390/ijgi6040101 - 30 Mar 2017
Cited by 13 | Viewed by 11155
Abstract
It has been long recognised that the underlying spatial structure plays an important role when navigating in urban environments. However, the modelling of the forms and properties that emerge from the city is still a difficult issue to address. The objective of the [...] Read more.
It has been long recognised that the underlying spatial structure plays an important role when navigating in urban environments. However, the modelling of the forms and properties that emerge from the city is still a difficult issue to address. The objective of the research developed in this paper is to study and represent two important qualities of urban environments as identified by Lynch and Bentley in their respective seminal works, that is, legibility and permeability. Our objective is to identify and implement a series of metrics applied to the layout of a given city that reflects these concepts of legibility, and then to evaluate to which degree these measures are correlated to different human perceptions of the city, particularly differences between humans who have or have not had an experience of a given urban environment. The whole approach is applied to the context of a neighbourhood of the city of Tehran in Iran. The findings show that permeability match relatively well with residents’ evaluations while legibility rather complies with newcomers’ evaluations. Full article
Show Figures

Figure 1

4222 KiB  
Article
A Sparse Manifold Classification Method Based on a Multi-Dimensional Descriptive Primitive of Polarimetric SAR Image Time Series
by Chu He, Gong Han, Di Feng, Juan Du and Mingsheng Liao
ISPRS Int. J. Geo-Inf. 2017, 6(4), 97; https://doi.org/10.3390/ijgi6040097 - 29 Mar 2017
Cited by 2 | Viewed by 3913
Abstract
Classification using the rich information provided by time-series and polarimetric Synthetic Aperture Radar (SAR) images has attracted much attention. The key point is to effectively reveal the correlation between different dimensions of information and form a joint feature. In this paper, a multi-dimensional [...] Read more.
Classification using the rich information provided by time-series and polarimetric Synthetic Aperture Radar (SAR) images has attracted much attention. The key point is to effectively reveal the correlation between different dimensions of information and form a joint feature. In this paper, a multi-dimensional SAR descriptive primitive for each single pixel is firstly constructed, which in the polarimetric scale obtains incoherent information through target decompositions while in the time scale obtains coherent information through stochastic walk. Secondly, for the purpose of feature extraction and dimension reduction, a special feature space mapping for the descriptive primitive of the whole image is proposed based on sparse manifold expression and compressed sensing. Finally, the above feature is inputted into a support vector machine (SVM) classifier. This proposed method can inherently integrate the features of polarimetric SAR times series. Experiment results on three real time-series polarimetric SAR data sets show the effectiveness of our presented approach. The idea of a multi-dimensional descriptive primitive as a convenient tool also opens a new spectrum of potential for further processing of polarimetric SAR image time series. Full article
Show Figures

Figure 1

5760 KiB  
Article
Spatial Data Sharing: A Pilot Study of French SDIs
by Matthieu Noucher, Françoise Gourmelon, Pierre Gautreau, Jade Georis-Creuseveau, Adeline Maulpoix, Julie Pierson, Nathalie Pinède, Olivier Pissoat and Mathias Rouan
ISPRS Int. J. Geo-Inf. 2017, 6(4), 99; https://doi.org/10.3390/ijgi6040099 - 28 Mar 2017
Cited by 9 | Viewed by 8607
Abstract
Since the appearance of Spatial Data Infrastructure several years ago, there has been a tremendous increase in spatial data available on the Internet. This situation raises several research issues, in terms of identifying the content actually accessible via this medium and its impact [...] Read more.
Since the appearance of Spatial Data Infrastructure several years ago, there has been a tremendous increase in spatial data available on the Internet. This situation raises several research issues, in terms of identifying the content actually accessible via this medium and its impact on governance and local authority management. Our study proposes a mixed methodology applied to 45 French institutional infrastructures, to compare the objectives stated by their promoters, their content, and the actual services provided. The methodology, based on an analysis of interviews with Spatial Data Infrastructure (SDI) coordinators and their answers to questionnaires, as well as a study of their websites and an exploration of over 160,000 metadata in their metadata catalogues, produced varied results concerning data accessibility, stakeholder networks, the interoperability of tools, and informational equality in different regions. Despite the proactive stance of SDI promoters, only 15.7% of data are open-access. Their interoperability remains restricted to specific types of actors and themes. Although geocollaboration organised by SDIs is very active, it only concerns the public sector. These disparities also concern their informational dimension, as some regions have considerable resources at their disposal, but others do not. Full article
Show Figures

Figure 1

1300 KiB  
Article
ASTROLABE: A Rigorous, Geodetic-Oriented Data Model for Trajectory Determination Systems
by José A. Navarro, M. Eulàlia Parés, Ismael Colomina and Marta Blázquez
ISPRS Int. J. Geo-Inf. 2017, 6(4), 98; https://doi.org/10.3390/ijgi6040098 - 28 Mar 2017
Viewed by 3652
Abstract
The constant irruption of new sensors is a challenge for software systems that do not rely on generic data models able to manage change or innovation. Several data modeling standards exist. Some of these address the problem from a generic perspective but are [...] Read more.
The constant irruption of new sensors is a challenge for software systems that do not rely on generic data models able to manage change or innovation. Several data modeling standards exist. Some of these address the problem from a generic perspective but are far too complex for the kind of applications targeted by this work, while others focus strictly on specific kinds of sensors. These approaches pose a problem for the maintainability of software systems dealing with sensor data. This work presents ASTROLABE, a generic and extensible data model specifically devised for trajectory determination systems working with sensors whose error distributions may be fully modeled using means and covariance matrices. A data model relying on four fundamental entities (observation, state, instrument, mathematical model) and related metadata is described; two compliant specifications (for file storage and network communications) are presented; a portable C++ library implementing these specifications is also briefly introduced. STROLABE, integrated in CTTC’s trajectory determination system NAVEGA, has been extensively used since 2009 in research and production (real-life) projects, coping successfully with a significant variety of sensors. Such experience helped to improve the data model and validate its suitability for the target problem. The authors are considering putting ASTROLABE in the public domain. Full article
Show Figures

Figure 1

1541 KiB  
Article
Affine-Invariant Triangulation of Spatio-Temporal Data with an Application to Image Retrieval
by Sofie Haesevoets, Bart Kuijpers and Peter Z. Revesz
ISPRS Int. J. Geo-Inf. 2017, 6(4), 100; https://doi.org/10.3390/ijgi6040100 - 28 Mar 2017
Cited by 5 | Viewed by 3510
Abstract
In the geometric data model for spatio-temporal data, introduced by Chomicki and Revesz [1], spatio-temporal data are modelled as a finite collection of triangles that are transformed by time-dependent affinities of the plane. To facilitate querying and animation of spatio-temporal data, we present [...] Read more.
In the geometric data model for spatio-temporal data, introduced by Chomicki and Revesz [1], spatio-temporal data are modelled as a finite collection of triangles that are transformed by time-dependent affinities of the plane. To facilitate querying and animation of spatio-temporal data, we present a normal form for data in the geometric data model. We propose an algorithm for constructing this normal form via a spatio-temporal triangulation of geometric data objects. This triangulation algorithm generates new geometric data objects that partition the given objects both in space and in time. A particular property of the proposed partition is that it is invariant under time-dependent affine transformations, and hence independent of the particular choice of coordinate system used to describe the spatio-temporal data in. We can show that our algorithm works correctly and has a polynomial time complexity (of reasonably low degree in the number of input triangles and the maximal degree of the polynomial functions that describe the transformation functions). We also discuss several possible applications of this spatio-temporal triangulation. The application of our affine-invariant spatial triangulation method to image indexing and retrieval is discussed and an experimental evaluation is given in the context of bird images. Full article
Show Figures

Figure 1

1911 KiB  
Article
An Effective High-Performance Multiway Spatial Join Algorithm with Spark
by Zhenhong Du, Xianwei Zhao, Xinyue Ye, Jingwei Zhou, Feng Zhang and Renyi Liu
ISPRS Int. J. Geo-Inf. 2017, 6(4), 96; https://doi.org/10.3390/ijgi6040096 - 26 Mar 2017
Cited by 16 | Viewed by 4966
Abstract
Multiway spatial join plays an important role in GIS (Geographic Information Systems) and their applications. With the increase in spatial data volumes, the performance of multiway spatial join has encountered a computation bottleneck in the context of big data. Parallel or distributed computing [...] Read more.
Multiway spatial join plays an important role in GIS (Geographic Information Systems) and their applications. With the increase in spatial data volumes, the performance of multiway spatial join has encountered a computation bottleneck in the context of big data. Parallel or distributed computing platforms, such as MapReduce and Spark, are promising for resolving the intensive computing issue. Previous approaches have focused on developing single-threaded join algorithms as an optimizing and partition strategy for parallel computing. In this paper, we present an effective high-performance multiway spatial join algorithm with Spark (MSJS) to overcome the multiway spatial join bottleneck. MSJS handles the problem through cascaded pairwise join. Using the power of Spark, the formerly inefficient cascaded pairwise spatial join is transformed into a high-performance approach. Experiments using massive real-world data sets prove that MSJS outperforms existing parallel approaches of multiway spatial join that have been described in the literature. Full article
Show Figures

Figure 1

Previous Issue
Next Issue
Back to TopTop