
The Legibility and Permeability of Cities: Examining the Role of Spatial Data and Metrics


1
School of Surveying and Geospatial Engineering, College of Engineering, University of Tehran, North Kargar Ave., Jalal Al. Ahmad Crossing, Tehran 14395515, Iran
2
Naval Academy Research Institute, Lanvéoc-Poulmic, BP 600, Brest Naval, Brest 29240, France
3
Department of Urbanism, College of Fine Arts, University of Tehran, 16th Azar St., Enghelab Sq., Tehran 14155645, Iran
*
Author to whom correspondence should be addressed.
ISPRS Int. J. Geo-Inf. 2017, 6(4), 101; https://doi.org/10.3390/ijgi6040101
Submission received: 20 December 2016
/
Revised: 12 March 2017
/
Accepted: 25 March 2017
/
Published: 30 March 2017
Abstract
:It has been long recognised that the underlying spatial structure plays an important role when navigating in urban environments. However, the modelling of the forms and properties that emerge from the city is still a difficult issue to address. The objective of the research developed in this paper is to study and represent two important qualities of urban environments as identified by Lynch and Bentley in their respective seminal works, that is, legibility and permeability. Our objective is to identify and implement a series of metrics applied to the layout of a given city that reflects these concepts of legibility, and then to evaluate to which degree these measures are correlated to different human perceptions of the city, particularly differences between humans who have or have not had an experience of a given urban environment. The whole approach is applied to the context of a neighbourhood of the city of Tehran in Iran. The findings show that permeability match relatively well with residents’ evaluations while legibility rather complies with newcomers’ evaluations.
1. Introduction
The act of navigation in an urban environment is one of the subjects that are closely influenced by the spatial configuration of the environment [1,2,3,4]. In particular, it was observed that people’s initial exploration of an urban environment is partly shaped by local spatial properties [5]. On the other hand, humans that have a previous knowledge or have experienced a given environment are more likely to rely on global spatial properties rather than local ones [5]. Penn suggests that in familiar environments, way finding tasks are relatively independent of local properties and are instead largely driven by global properties of the spatial structure of an urban space [6]. Overall, further evidence for the role of spatial configurations in navigation processes has been largely studied particularly by space syntax research [7].
Legibility has been considered to be one of the main desirable qualities of navigation in urban environments [8,9]. The notion of legibility has been introduced by Lynch in a seminal work as the ease with which the parts of the city can be recognized and organized into a coherent pattern [8]. Bentley et al. categorizes the concept of a responsive urban environment via seven levels amongst them legibility and permeability [10]. Permeability is the property that denotes the ability to sense or move through a given environment [11]. It is largely influenced by the available paths and forms that emerge from a given urban space [12]. Overall, legibility and permeability provide key indices for evaluating urban navigation capabilities in the city [13,14,15,16,17]. However, and despite the fact that these two concepts can be intuitively understood, their computational evaluation is far from being a straightforward task and has been hardly addressed in recent work.
The objective of the research presented in this paper is to explore and develop a computational approach that can provide an assessment of the legibility and permeability of the urban layout, as well as their respective roles in the evaluation of navigation capabilities in an urban system. We model an urban layout as a sort of bird’s eye view on an urban space, where buildings, paths and open spaces are the main spatial components considered. An important property of an urban layout is that it can be abstracted and represented within a computational GIS representation upon which different spatial measures are computed and derived. The first challenge is to identify and compute a set of spatial metrics from the layout of a given city, while the second one is to find to which degree the developed measures match people’s perceptions and own evaluations. The latter follows a hypothesis discussed by Hillier and that states “the organic as well as the geometric, are pervasively ordered by geometric intuitions” [18]. In particular, we will make a different between human beings that have or have not previous knowledge of a given urban environment (denoted in the rest of the paper as residents and newcomers, respectively).
The metrics developed are partly derived from geometric properties also applied elsewhere in landscape ecology [19] and that have shown potential for analysing urban morphology [20,21,22,23,24]. We complement these geometric-based metrics by a series of alignment, continuity and symmetry indices that reveal some additional properties of the urban layout. The whole approach is applied to a neighbourhood of district 12 in the city of Tehran in Iran. The emerging results are compared to people’s perception and opinions coming from either residents familiar with a given urban environment or newcomers with no prior knowledge of that urban environment. The preliminary experiments and findings show that the introduced measures of permeability comply relatively well with inhabitant’s perception, while the measures of legibility rather match newcomers’ perception.
The remainder of the paper is organized as follows. Section 2 briefly surveys related work while Section 3 develops the notions of legibility and permeability and the main spatial and geometrical properties developed for the representation an urban layout. Section 4 develops an application of the modelling concepts developed to a case study and a series of experimental evaluations. The findings are evaluated and discussed in Section 5. Finally, Section 6 summarizes the paper and outlines future works.
2. Related Work
Over the past few years, the influence of the urban layout on navigation tasks has been studied by several researchers. In particular, the impact of different urban designs on walkability have been explored [25]. Similarly, different building structures have been considered as a discriminant factor when planning navigation tasks [26]. From a different perspective, the role of salient features have been also identified as important properties in the execution of navigation and way-finding processes [27]. Overall, it clearly appears that the underlying local and global structural properties of a given urban environment shape cognitive representations [28]. In particular, recent agent-based computational approaches that replicate navigation tasks demonstrate that modelling performances improve when considering the scenic layout [29], visual properties play indeed a significant role in shaping the perception of a given urban environment and then navigation opportunities [30]. At the local level, differences and commonalities between expert-based and resident-based perceptions of a given built environment have been also investigated [31]. A few attempts have been also oriented to comparison between humans perception of a given urban environment and quantitative representations of a built environment [31,32].
Our research has a specific focus on the concepts of legibility and permeability as introduced and characterized by Bentley et al. [10] and Lynch [8], respectively. In fact, a search for a better understanding of humans’ learning processes in built environments is still a non-straightforward task. This is partly due to the fact that legibility is closer to a subjective category rather than an objective spatial property [33]. In particular, the notion of legibility has been modelled by Long et al. [32], while permeability, considered as a measure of movement opportunity is more related to a sense of enclosure in a given environment [13,15]. The findings suggest that space syntax can provide computational measures to quantitatively represent the concept of legibility using a measure of intelligibility. Our research will go further by first providing a set of quantitative measures that compute and evaluate the notion of legibility and permeability at different degrees using topological and directional primitives, as well as visual properties of the urban layout as suggested in [34]. A second objective of our research is oriented to the study of how these measures reflect humans’ own perception. Overall, this paper introduces and provides a set of computational and flexible measures of legibility and permeability as introduced by Lynch and Bentley, and reviews how they map and to which degrees humans’ perceptions.
3. Modelling Approach
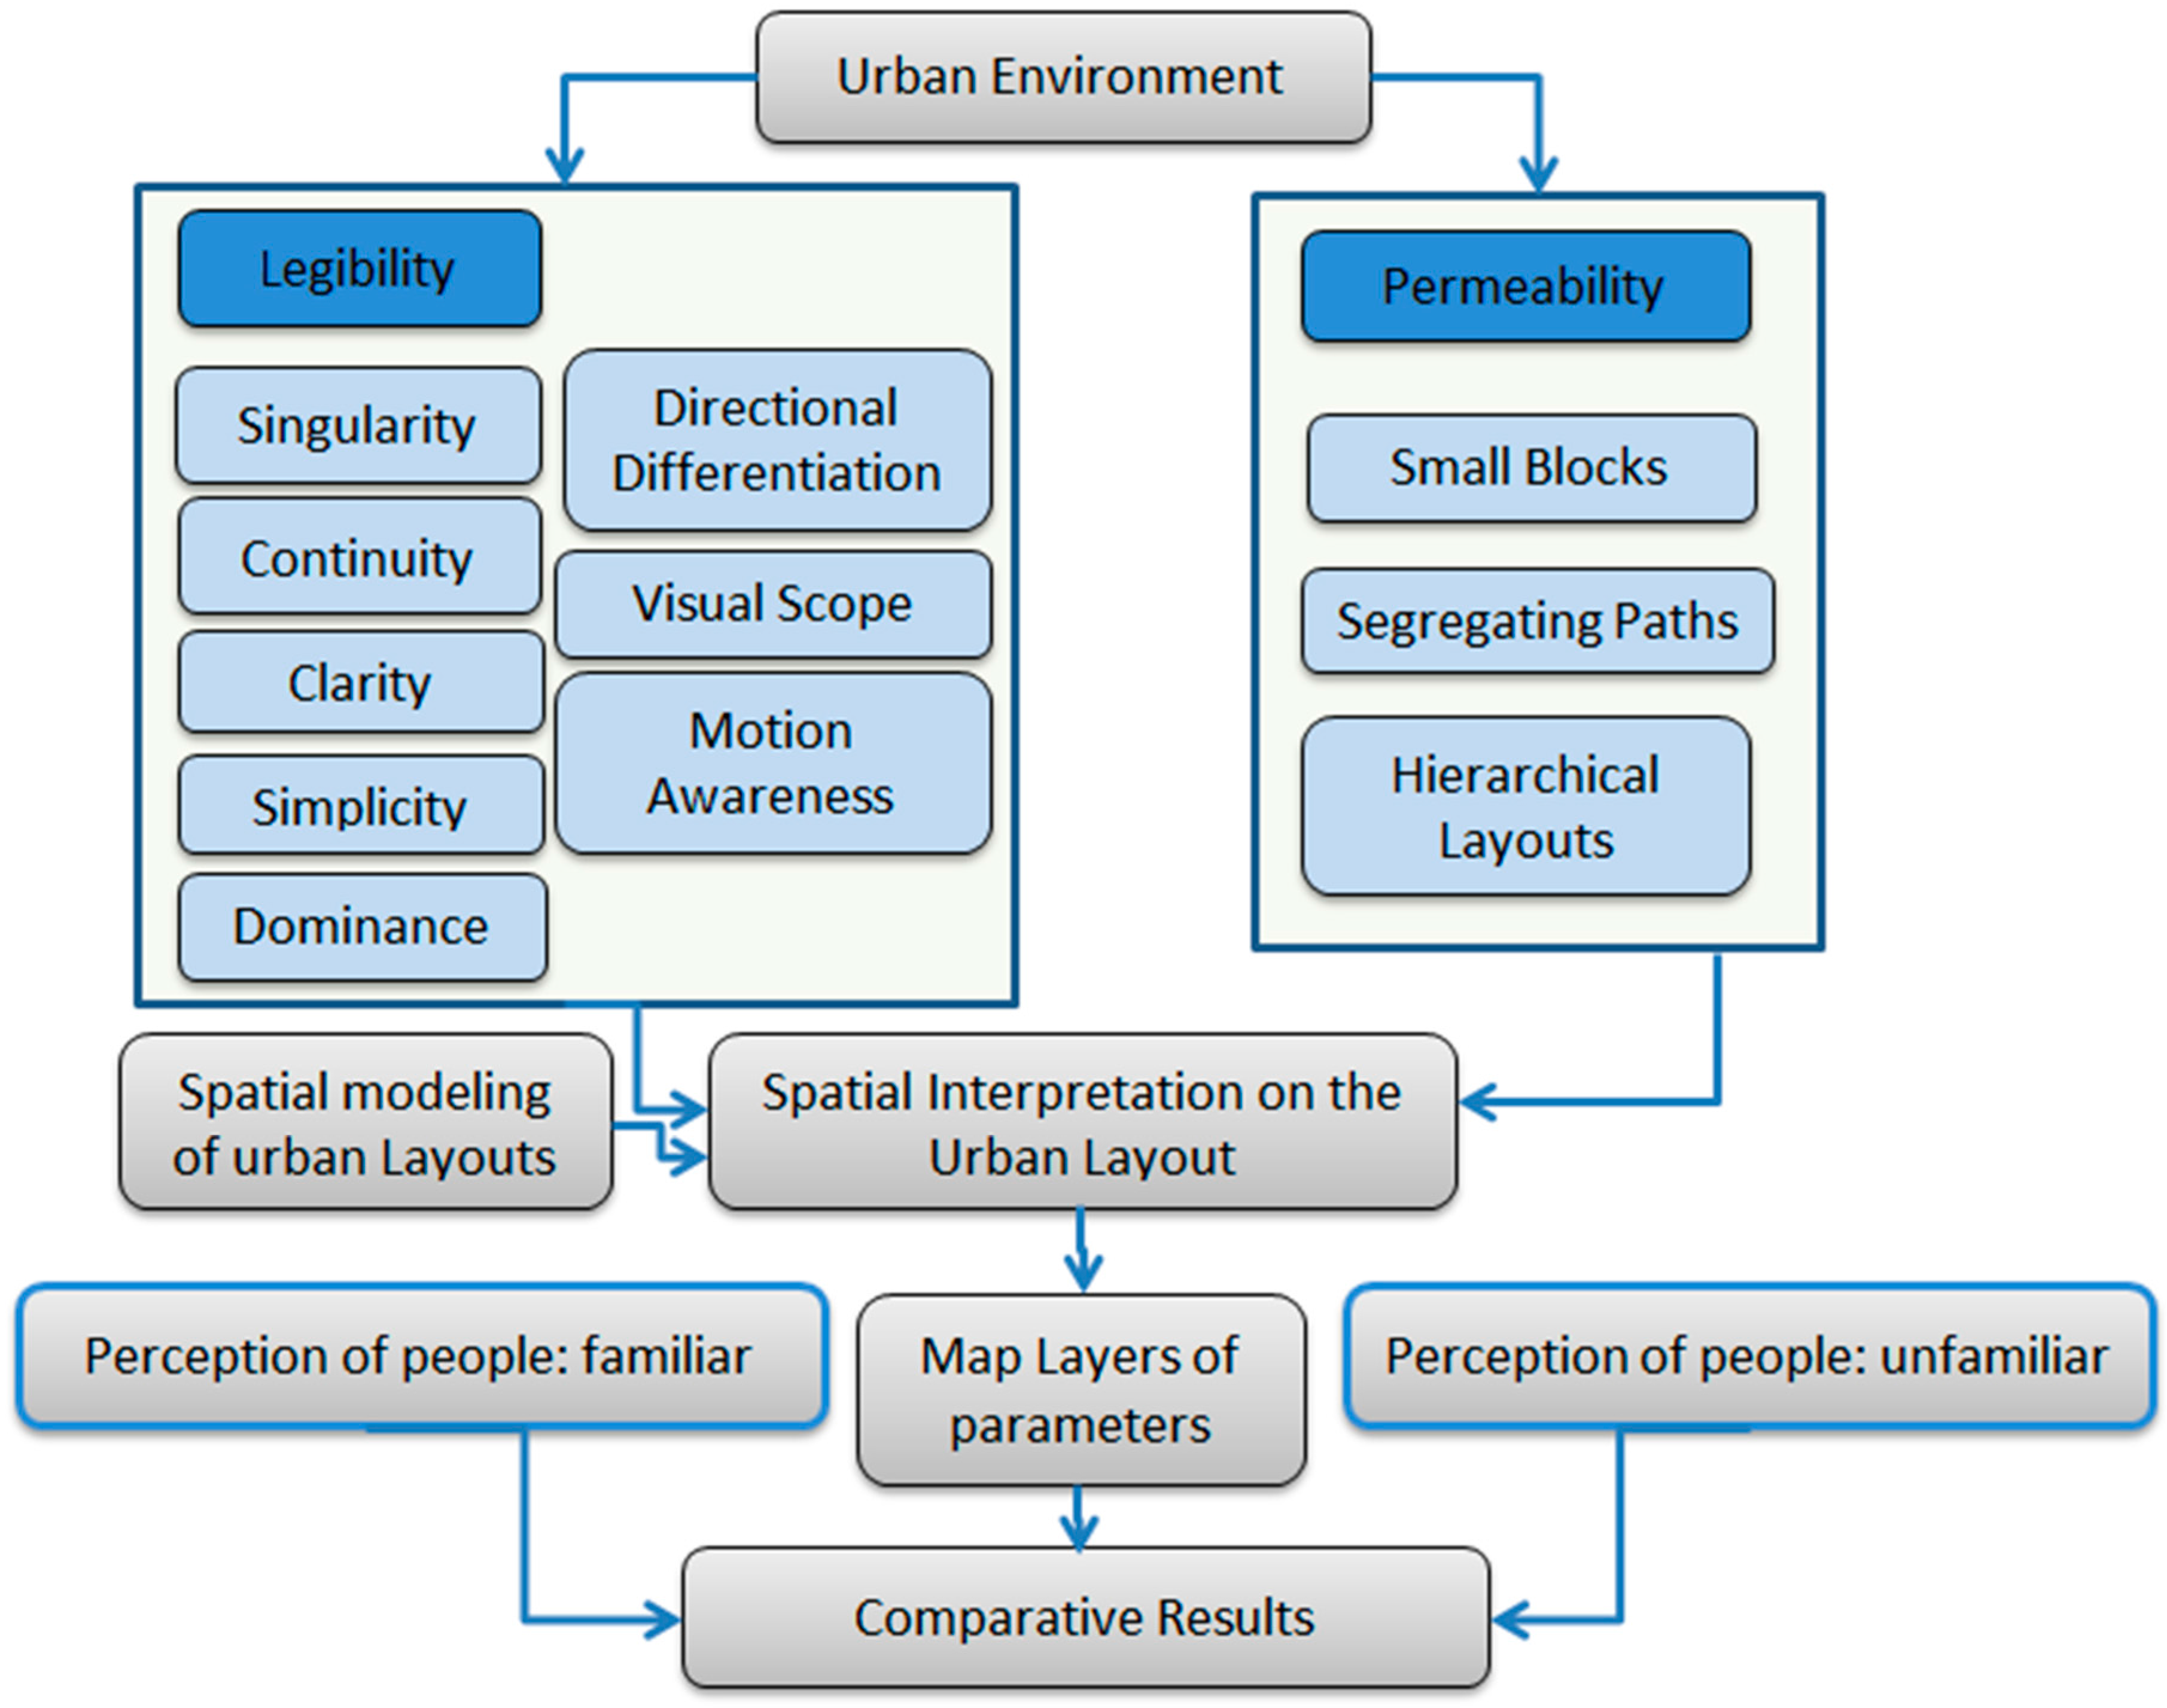
This section studies and discusses the spatial structure of an urban layout using the notions of legibility and permeability. The parameters developed are formally presented and have been computationally implemented. Figure 1 summarizes the spatial metrics used for the modelling of the legibility and permeability parameters introduced in the next sub-sections, and the interpretation process as reflected by human beings familiar or unfamiliar with a given urban environment.
3.1. Legibility
Legibility can be defined as the ease with which the parts of the city can be recognized and organized into a coherent pattern. A legible city would be one in which districts or landmarks or pathways are easily identifiable and structured [8,10]. In his seminal work, Lynch identified the main forms and qualities that emerge from an urban layout. Such categories contribute to the visibility, coherence, clarity and then the legibility of an urban environment [8] (Table 1).
Two additional qualities have been suggested to complement the above mentioned eight qualities, that is, “time series” and “names and meanings” [8]. A time series reflects a melodic sequence of image elements or a formed succession of space, texture, light or silhouette. Names and meanings are non-physical characteristics that enhance the imageability of a given urban element. Both of these parameters are relatively subjective and are not closely related to geometric interpretation in urban environments and hence have not been considered in this work.
3.2. Permeability
Permeability is defined as a visual and behavioural quality that reflect both seeing and moving opportunities in a given urban environment [34]. A given network area is considered very permeable to cycling if it allows to connect any two of its nodes, back and forth [35]. Bentley et al. (1985) studied the notion of permeability in an urban environment and suggested three design trends that should positively influence the layout of cities and then physical and visual permeability [10]. These include the search for small blocks, avoiding segregated paths and hierarchical layouts as introduced in Table 2.
3.3. Urban Layout
The main objectives of our research are first to identify the main urban structural components, and secondly to specify a series of spatial parameters that quantitatively evaluate urban forms. Practically, the approach is developed on top of an urban and spatial database that intrinsically models and supports the representation of urban features and the spatial relations (i.e., topological and directional) and metrics that emerge from the layout. The spatial structure of an urban layout is modelled as a sort of bird’s eye view where buildings, paths and open spaces are the main spatial components considered. Nodes, landmarks, districts, paths and edges, as introduced by Lynch [8], are the main components that influence the individual’s perception of an urban environment. Figure 2 illustrates the spatial layout of the studied area in the district 12 of the city of Tehran. In particular, parcels and paths are generated from cadastral maps at the scale of 1:2000. When considering the usual physical layout of a city represented by a spatial database, paths and parcels are almost all explicitly represented, while in this research we complement them by three additional abstractions: edges, blocks and districts. Paths are the streets and all channels in which people travel in the city, and usually perceive the city while moving through and along them [8] (Figure 2b). When moving in the city, people perceive edges, that is, boundaries such as wall, buildings and shorelines, that appear as lateral references and barriers (Figure 2d) [8]. Edges are generated from block boundaries materialised as vertices and connected as straight line segments, and then mapped towards straight line segments when aligned to unit edges [36]. A parcel is one of the structural well-defined abstractions that have separate land use or ownership title and are explicit in an urban layout (Figure 2a). A block is a set of adherent parcels that is isolated by the paths surrounding it (Figure 2c). Unlike blocks that are typically materialised on one side of a surrounded path only, the notion of district as identified by Lynch has been also considered. Lynch’s districts are defined as two-dimensional features materialised by some identity or character not directly perceivable and not always directly perceivable from the spatial layout. The notion of district is in this work directly mapped to administrative units that emerge from the case study in the district 12 of the city of Tehran.
The experimental evaluation of our research has been conducted with a study area related to a neighbourhood, located in the central part of Tehran, and that covers an area of about 3 km2 (Figure 3) [35]. This neighbourhood is well known locally as it is a crowded area of Tehran’s bazaar and contains a relative diversity of human activities and land uses.
3.4. Evaluating an Urban Layout
All the components of an urban layout can be characterized by different spatial and non-spatial measures, whether the objective is to study the spatial or semantic properties of the layout. For instance, parcels can be described by some geometrical and qualitative spatial properties (e.g., area, perimeter, area/perimeter ratio, adjacency relationships) as well as by some non-spatial attributes (e.g., land use, type and age of building if any in the parcel). Since our research is oriented to the spatial analysis of an urban layout, non-spatial semantic properties will be omitted at this stage.
An objective of our research is to identify the spatial and mereology (i.e., part-whole relationships) measures that characterize the geometry and configuration of the different elements of an urban layout. The developed geometric measures evaluate the shape, size and relative position of the main components of an urban layout. Some of the identified measures are derived from landscape metrics [19]. They reflect the main spatial characteristics of the landscape layout represented as parcels, blocks and districts. These measures have been widely used in urban studies [20,21,37,38]. The metrics considered hereafter are those that quantify the spatial configuration of some urban components using different metrics and statistics [39,40]. A useful metric that measures the complexity of a parcel compared to a standard shape is SHAPE [40]. According to this metric, SHAPE_SD gives the standard deviation of parcels’ SHAPE in a considered extent such as a block or a district. The statistical measures identified for the different metrics identified are mean (MN), range (RA), standard deviation (SD) and coefficient of variation (CV). Table 3 mathematically and geometrically introduces the landscape metrics introduced as spatial measures of the components of an urban layout.
The metrics above are applied to parcels and then areal features, they can be used to characterise parcels and even blocks and districts. They have been all implemented in the ArcGIS software either directly using existing functions or using a combination of such functions. In order to complement these measures, we introduce and apply a few additional geometric measures that characterise paths in a layout (Table 4).
Next, we introduce a series of configuration-based measures that essentially denote the arrangement, connectedness and continuity of urban components along paths (Table 5).
A few other spatial measures have been suggested by space syntax theory to computationally investigate the shape and configuration of the environment [7,41]. However, space syntax measures do not directly evaluate urban forms, but instead provide some quantitative evaluations of the overall and local configurations of an urban structure based on network spatial analysis. For these reasons, they are not integrated as background measures of this research. Since the aim of this research is to consider the potential of spatial data and metrics when evaluating the legible and permeable properties of urban environments, the following sections refine and extend the computational measures identified in this section towards the qualities that play a relevant role in doing so.
3.5. City Legibility Computation and Interpretation
This section first revisits city legibility qualities as introduced in Section 3.2 and interprets them using the spatial measures introduced in Section 3.4. Such interpretations are computationally implemented as shown in Table 6. Overall, these measures should contribute to the exploration of the relationship between the forms, legibility and permeability of the city.
- Singularity: The contrast that appears from parcels’ shapes give a sense of singularity to a given layout. For instance, when the coefficient of variation (CV) derived from parcels’ shape and as given by the measure SHAPE (cf. Table 3) is high enough in a given layout, one might expect to have a few singular parcels in the considered layout. Form Simplicity: The SHAPE parameter denotes the complexity of a shape and can be used to evaluate the simplicity of a set of parcels in a given area.
- Continuity: The continuance CONT parameter (cf. Table 5) gives the degree of continuity of an edge in its urban layout.
- Dominance: The concept of Dominance can be revealed by different spatial measures. First, in an urban layout a low coefficient of variation (CV) derived from parcels’ area (AREA_CV) is likely to exhibit a high degree of similarity and thus a lack of dominant parcels. In contrast, a significant difference between the maximum and minimum of the parcels’ area (AREA_RA) in a given urban layout can rather denote the existence of some conspicuous parcels’ size.
- Clarity of intersection: paths in a layout with low directional discrepancy (cf. angle of intersection in Table 4) are likely to exhibit a low clarity of perception. Instead, and for example, intersections with angles (ANG) between 70 and 110 degrees are likely to reveal a relative clarity of intersection [42].
- Directional differentiation: The Symmetry parameter SYM (cf. Table 5) directly measures this quality.
- Motion Awareness: The bendiness of paths as given by the parameter PB is the parameter that gives a sense of possible motion.
In fact, and most often, the mean values of the spatial measures exhibited in the extent of the study area can be considered as thresholds to determine the relative lowness and highness of the identified measures for deriving both legibility and permeability trends. In order to qualify the values that appear from the application of measures, fuzzy adverbs can be used to outline the different categories of values that appear.
3.6. City Permeability Computation and Interpretation
The parameters of permeability as introduced in Section 3.3 are further explored and associated to a series of geometric interpretations. Table 7 shows the computational expressions of the parameters given below:
- Small blocks: blocks can be visually perceived and extracted from an urban layout, and by making a difference between connected and isolated parcels. The concept of permeability is also related to the areas of the blocks identified (i.e., the smaller these areas the higher the permeability is likely to be).
- Segregated paths: segregated paths denote to which degree these paths are specific in the road network. However, such trends limit Path width (PW) and then reduce permeability.
- Hierarchical layouts: as already mentioned, hierarchical layouts are likely to generate cul-de-sacs and little route choices [10]. Indeed, the spatial structure that emerges from a streets layout affects the spatial configuration of blocks. Therefore, the shape of the blocks in a given layout can help to evaluate the local and global properties of an urban hierarchy. Figure 4a presents an urban layout whose network structure reveals a hierarchical pattern. In contrast, Figure 4b denotes a similar extent but the hierarchical pattern does not appear anymore. In fact, the paths that appear in the hierarchical network structure presented in Figure 4a are most often longer as compared to the non-hierarchical one illustrated by Figure 4b. It can be also observed that the hierarchical structure of a given layouts generates bigger blocks with notches in their contours (cf. Figure 4c). Blocks with relative low perimeter to area are likely to decrease this trend. (i.e., revealed by low values of the PARA as mentioned in Table 3). It also appears that for a specified edge depth, the number of resulting cores (NCA) for blocks with many notches is higher than the one of the NCA for a block ones with fewer notches (cf. Figure 4c–f). Indeed the number of cores depends on the edge depth and should be preferably determined according to the mean size of the shapes that emerge from a given layout.
4. Implementation
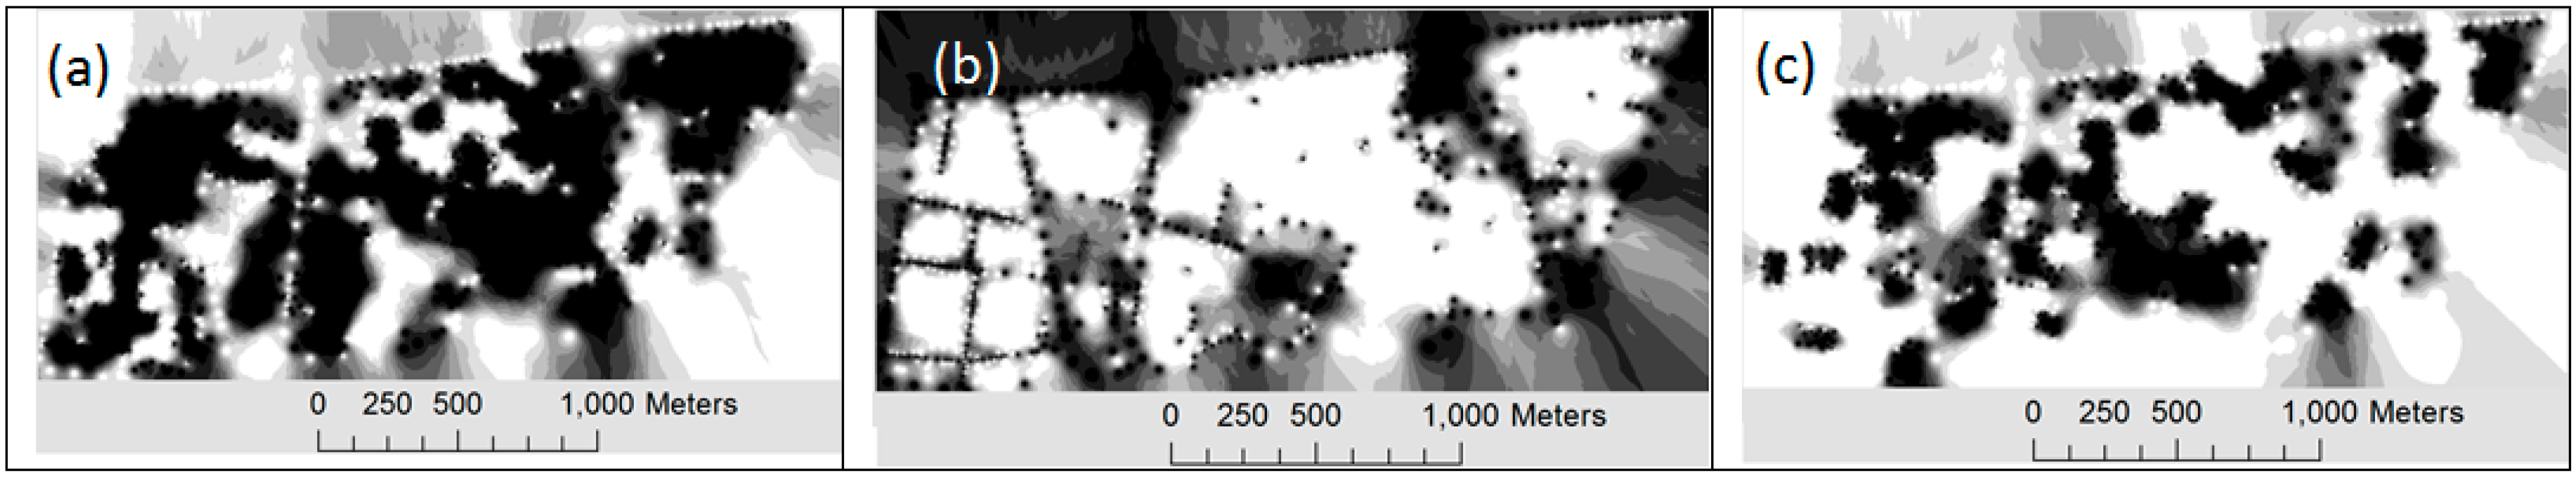
The computational interpretations of legibility and permeability have been fully implemented on top of a spatial database and the identified urban components. Since both legibility and permeability are mainly perceived and studied along streets, the different parameters have been assigned at the street level. In other words, the different measures defined for parcels, blocks, edges or districts for all the components that are along a path are averaged and assigned to that path. For example, the average value of continuance for all the edges on both sides of a street are allocated to that street. This is done by a generation of buffer zones delimited by a distance higher than half of the streets’ width around these streets, and then finding the edges that intersect such zones in order to compute the average continuance of each street. The streets’ values are finally assigned to their vertices; this allows interpolating a raster map of the spatial distribution of these indices. In order to considering the border effects of study area, all the blocks and constituent parcels which are situated on the opposite edge of the border streets (Molavi Street, Shush Street, Vahdat Eslami Street and Rey Street) are considered too. Figure 5 and Figure 6 present a series map results that exhibit the different parameter values computed for legibility and permeability. In the layers presented below, and for each raster map, pixel values are normalized by the unit interval and present low to high values via light to dark greys patches, respectively.
In order to favor a comprehensive and global evaluation, the different raster map layers illustrated by Figure 5 and Figure 6 are spatially overlaid so as the values of the pixels in the different layers are averaged and assigned as a final value of legibility and permeability, respectively. Figure 7 presents the resulting raster map layers of legibility and permeability.
The second objective of our research is to confront the patterns that emerge to people’s perceptions for the ones either familiar or unfamiliar with the selected environment. In order to take into account people’s opinions regarding the legibility notion, the study area has been divided into nine main neighbourhoods whose centres are dotted from “a” to “i” in Figure 8. 29 critical points have been selected in the urban extent to study people’s opinions regarding the concept of permeability (Figure 8).
4.1. Experiment 1: Panel of Inhabitants
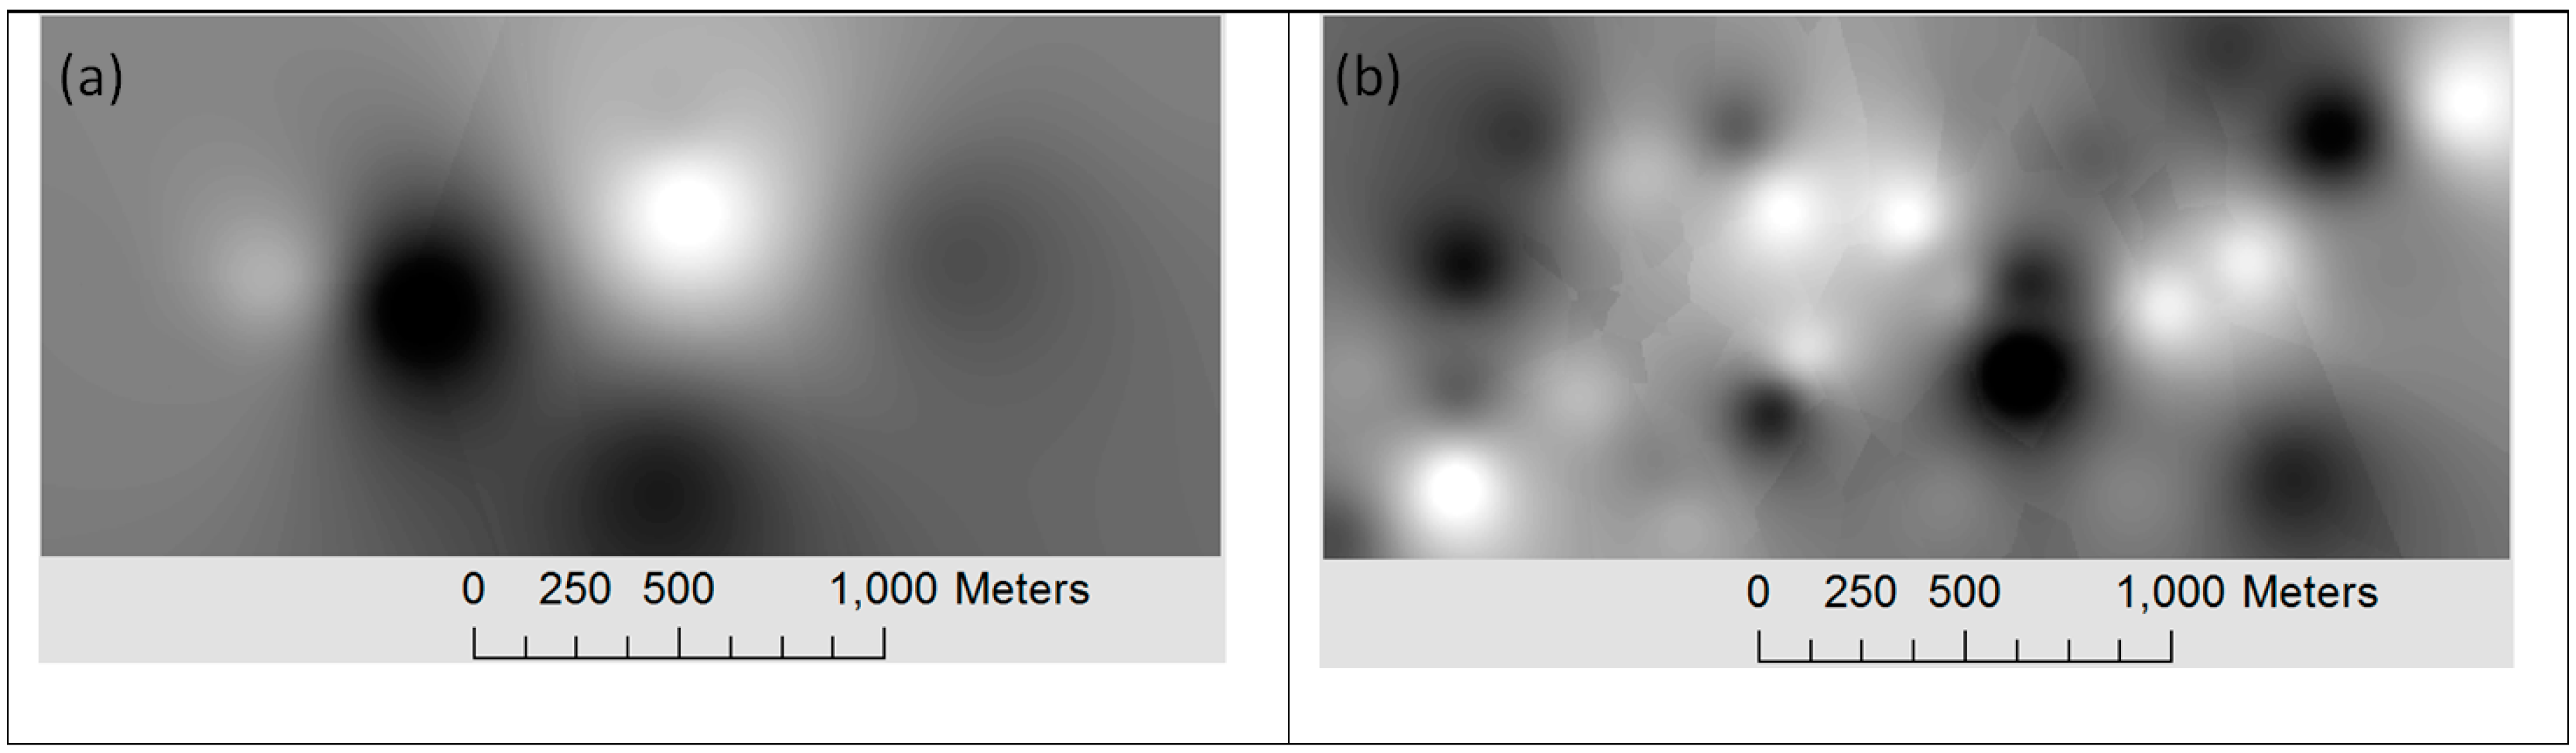
In the first experiment, a questionnaire complemented by instructions and definitions of the notions of legibility and permeability were distributed to a panel of 50 inhabitants who work, live or study in the selected area. The average age of the sample was 26 years with a sample deviation of 0.7. The panellists were familiar enough with the neighbourhoods and the selected points. A map of the studied area with the 9 neighbourhoods and 29 marked places accompanied by descriptions about their precise locations, and a table to fill the level of legibility and permeability, were given to the panellists (Appendix A). The questionnaires were answered by 50 panellists and the legibility and permeability notions have to be expressed in a range between 1 and 3 for high, moderate and less, respectively. The resulting opinions have been averaged in each neighbourhood and point and were used to derive a raster distribution of legibility and permeability for the extent as can be seen in Figure 9. The pixel values in Figure 9a,b are normalized by the unit interval, where darker pixels represent the more legible and permeable values, respectively.
4.2. Experiment 2: The Panel of Newcomers
Experiment 2 reflects the participants who have not seen the studied area before or only occasionally before the experiment. Fifty undergraduate students attending the University of Tehran compose the panel. The average age of the sample was 25 years with a sample deviation of 0.48. Before the experiment, all participants were introduced to the concepts of legibility and permeability as for the first experiment. At first they were presented a series of 270° panoramas showing urban scenes at the 29 points to assess their permeability (e.g., Figure 10). The idea behind is to take into account participants’ opinions about the level of permeability, this being based on their own perceptions of the environment, as well as on their experienced mental maps [43].
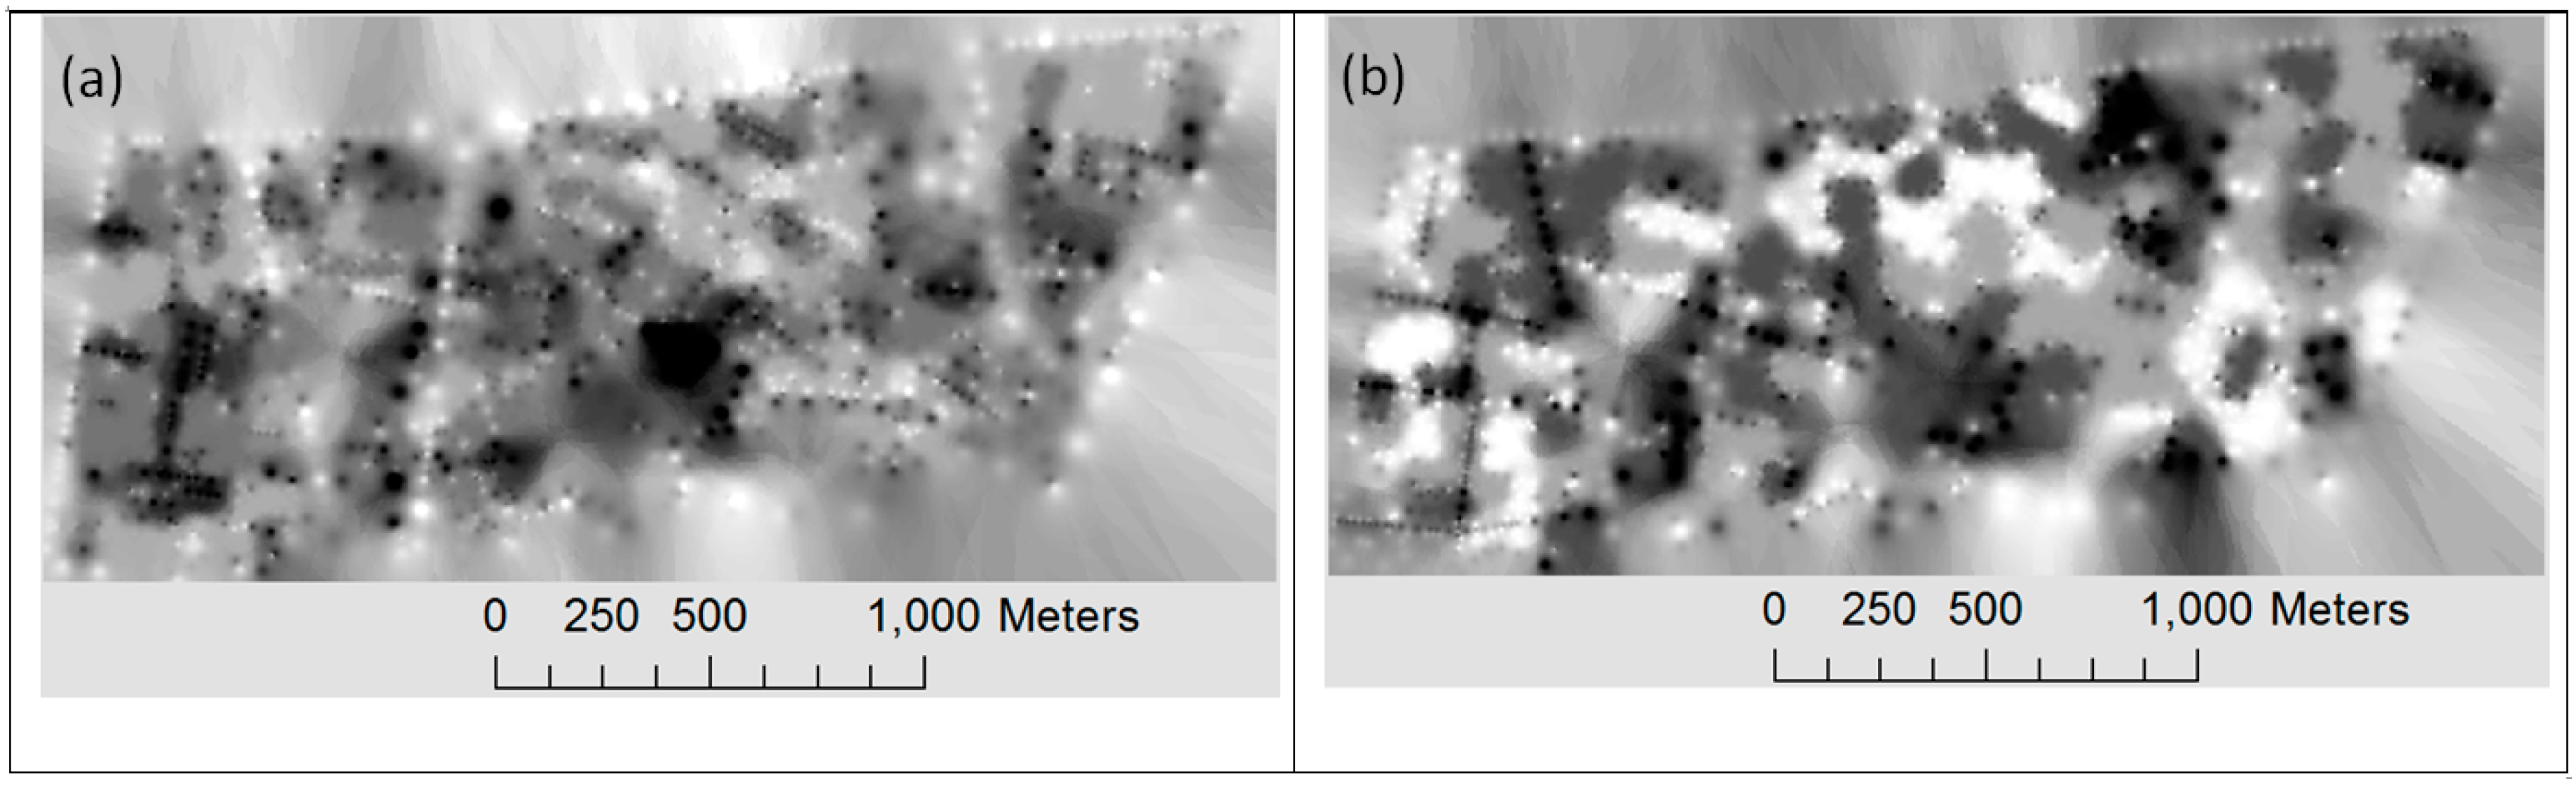
Next, first via the maps given, participants were exposed to the limits of the extent and its main streets, and then were taken to the studied area. They strolled through the streets as pedestrians and observed and scrutinized all areas and the selected neighbourhoods to judge their legibility. They delineated their own sketches and took pictures from the critical landmarks and scenes in the neighbourhoods. They were left for one day to fill the questionnaires. Figure 11a,b present the raster interpolation of the results. The pixel values are normalized between 0 and 1 and darker pixels represent the more legible and permeable values, respectively.
5. Evaluation
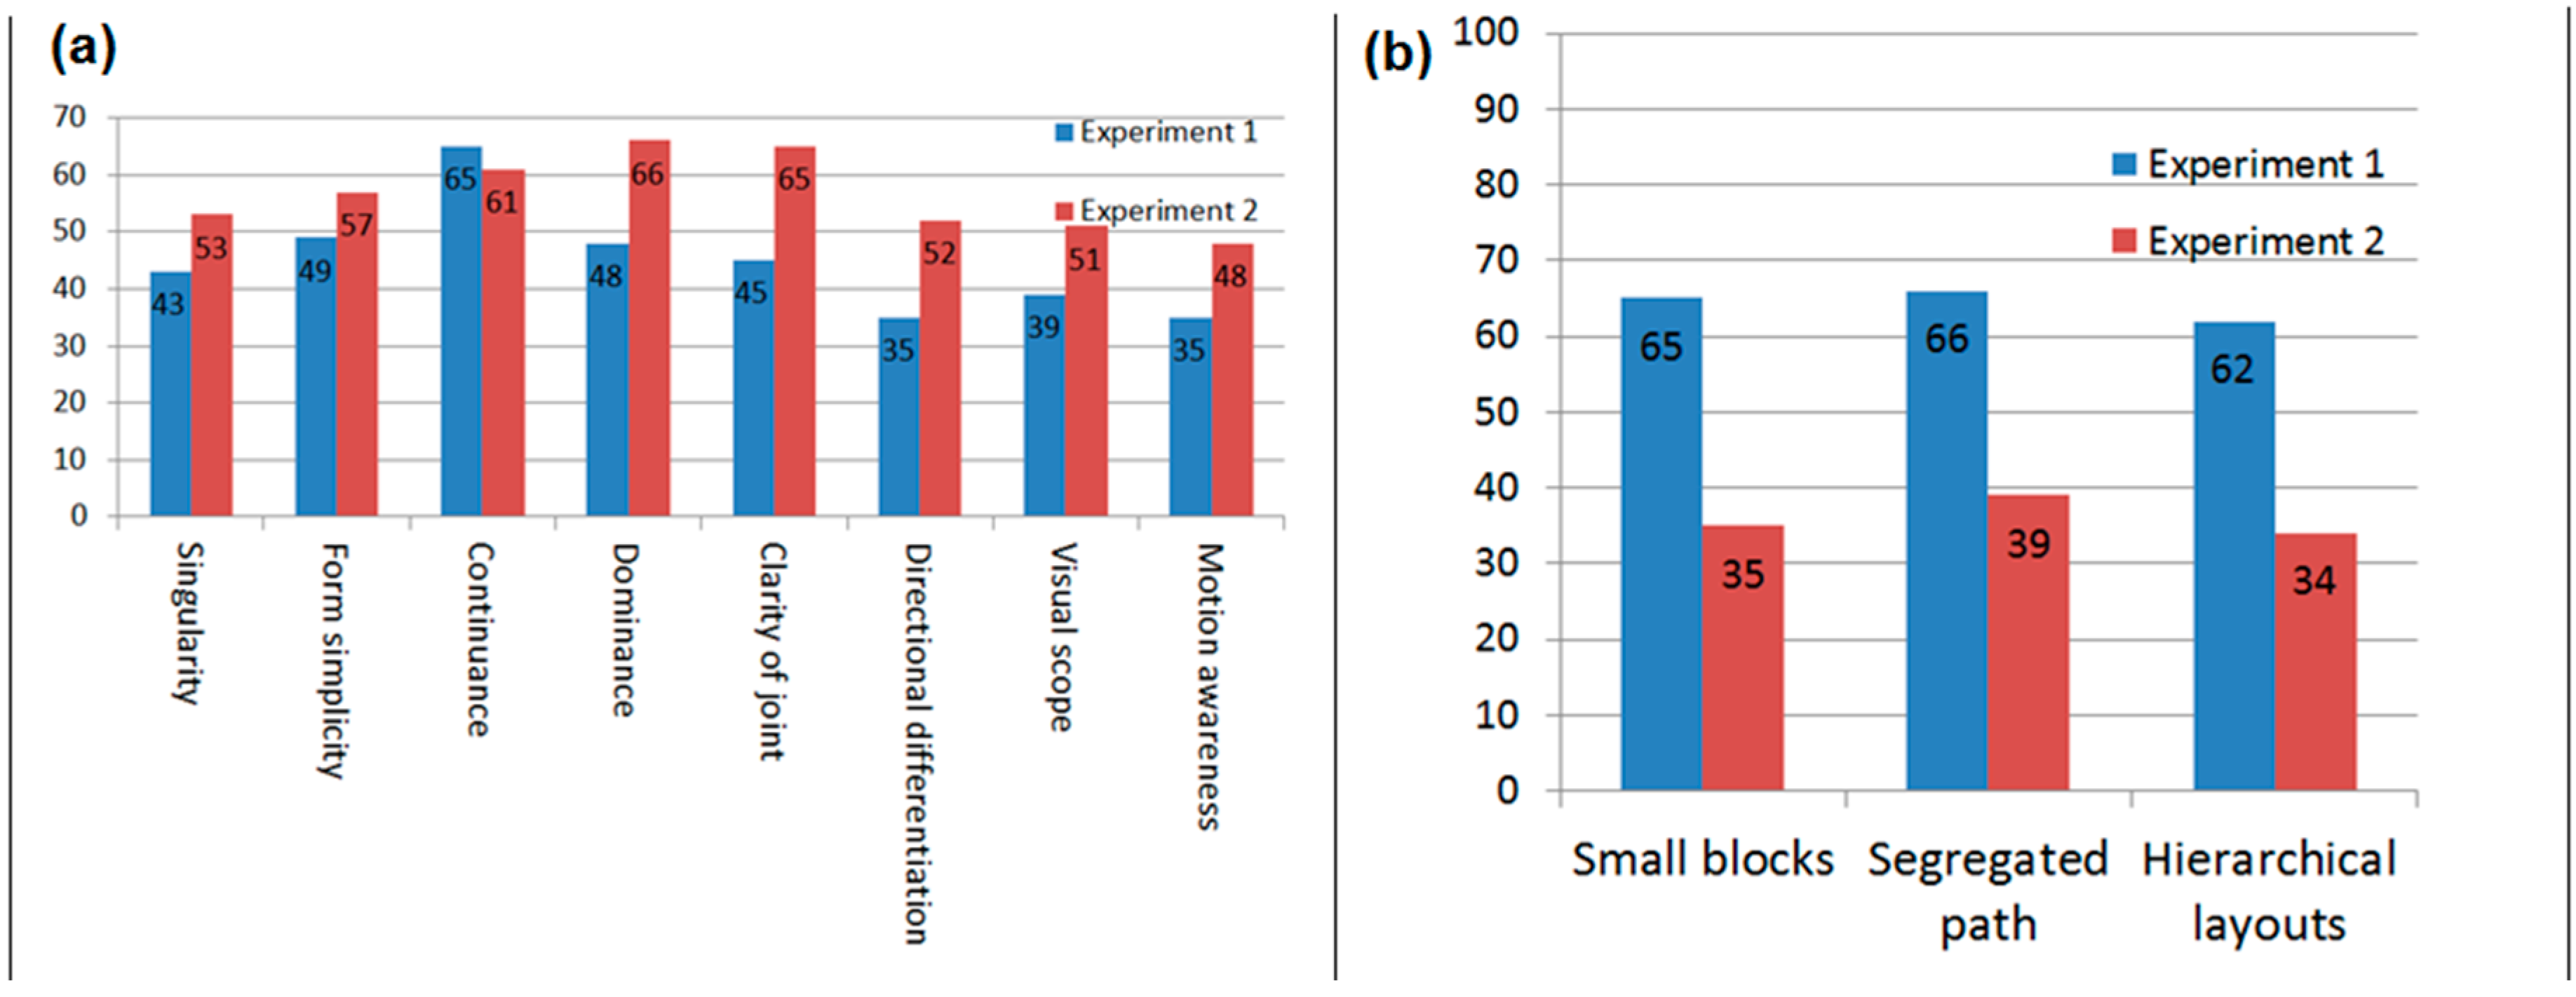
In order to compare the resulting map layers to the computational findings, the raster maps exhibited by Figure 5, Figure 6 and Figure 7 are differentiated by the raster layers derived from people’s opinions as reflected in Figure 9 and Figure 11. As done before, the raster maps were all normalized. Differences between the computationally generated maps and the ones derived from the two panels were summarized by a series of differential maps for both legibility and permeability parameters. Figure 12 outlines the main similarities (i.e., considered as similar for pixels with less than 10% difference). For example, the resulting graph presented by Figure 12a shows that 43% of pixels have a specific singularity and also high legibility as determined in or have improper singularity and also low legibility in experiment 1. The graph in Figure 12b reveals that opinions of both inhabitants and newcomers for a permeable environment are more compatible with the environments that have wider paths. Regarding legibility, inhabitants’ opinions are much more compatible with the high continuance of an environment while newcomers’ opinions are much more compatible with high dominance, clarity of joins and continuance of an environment.
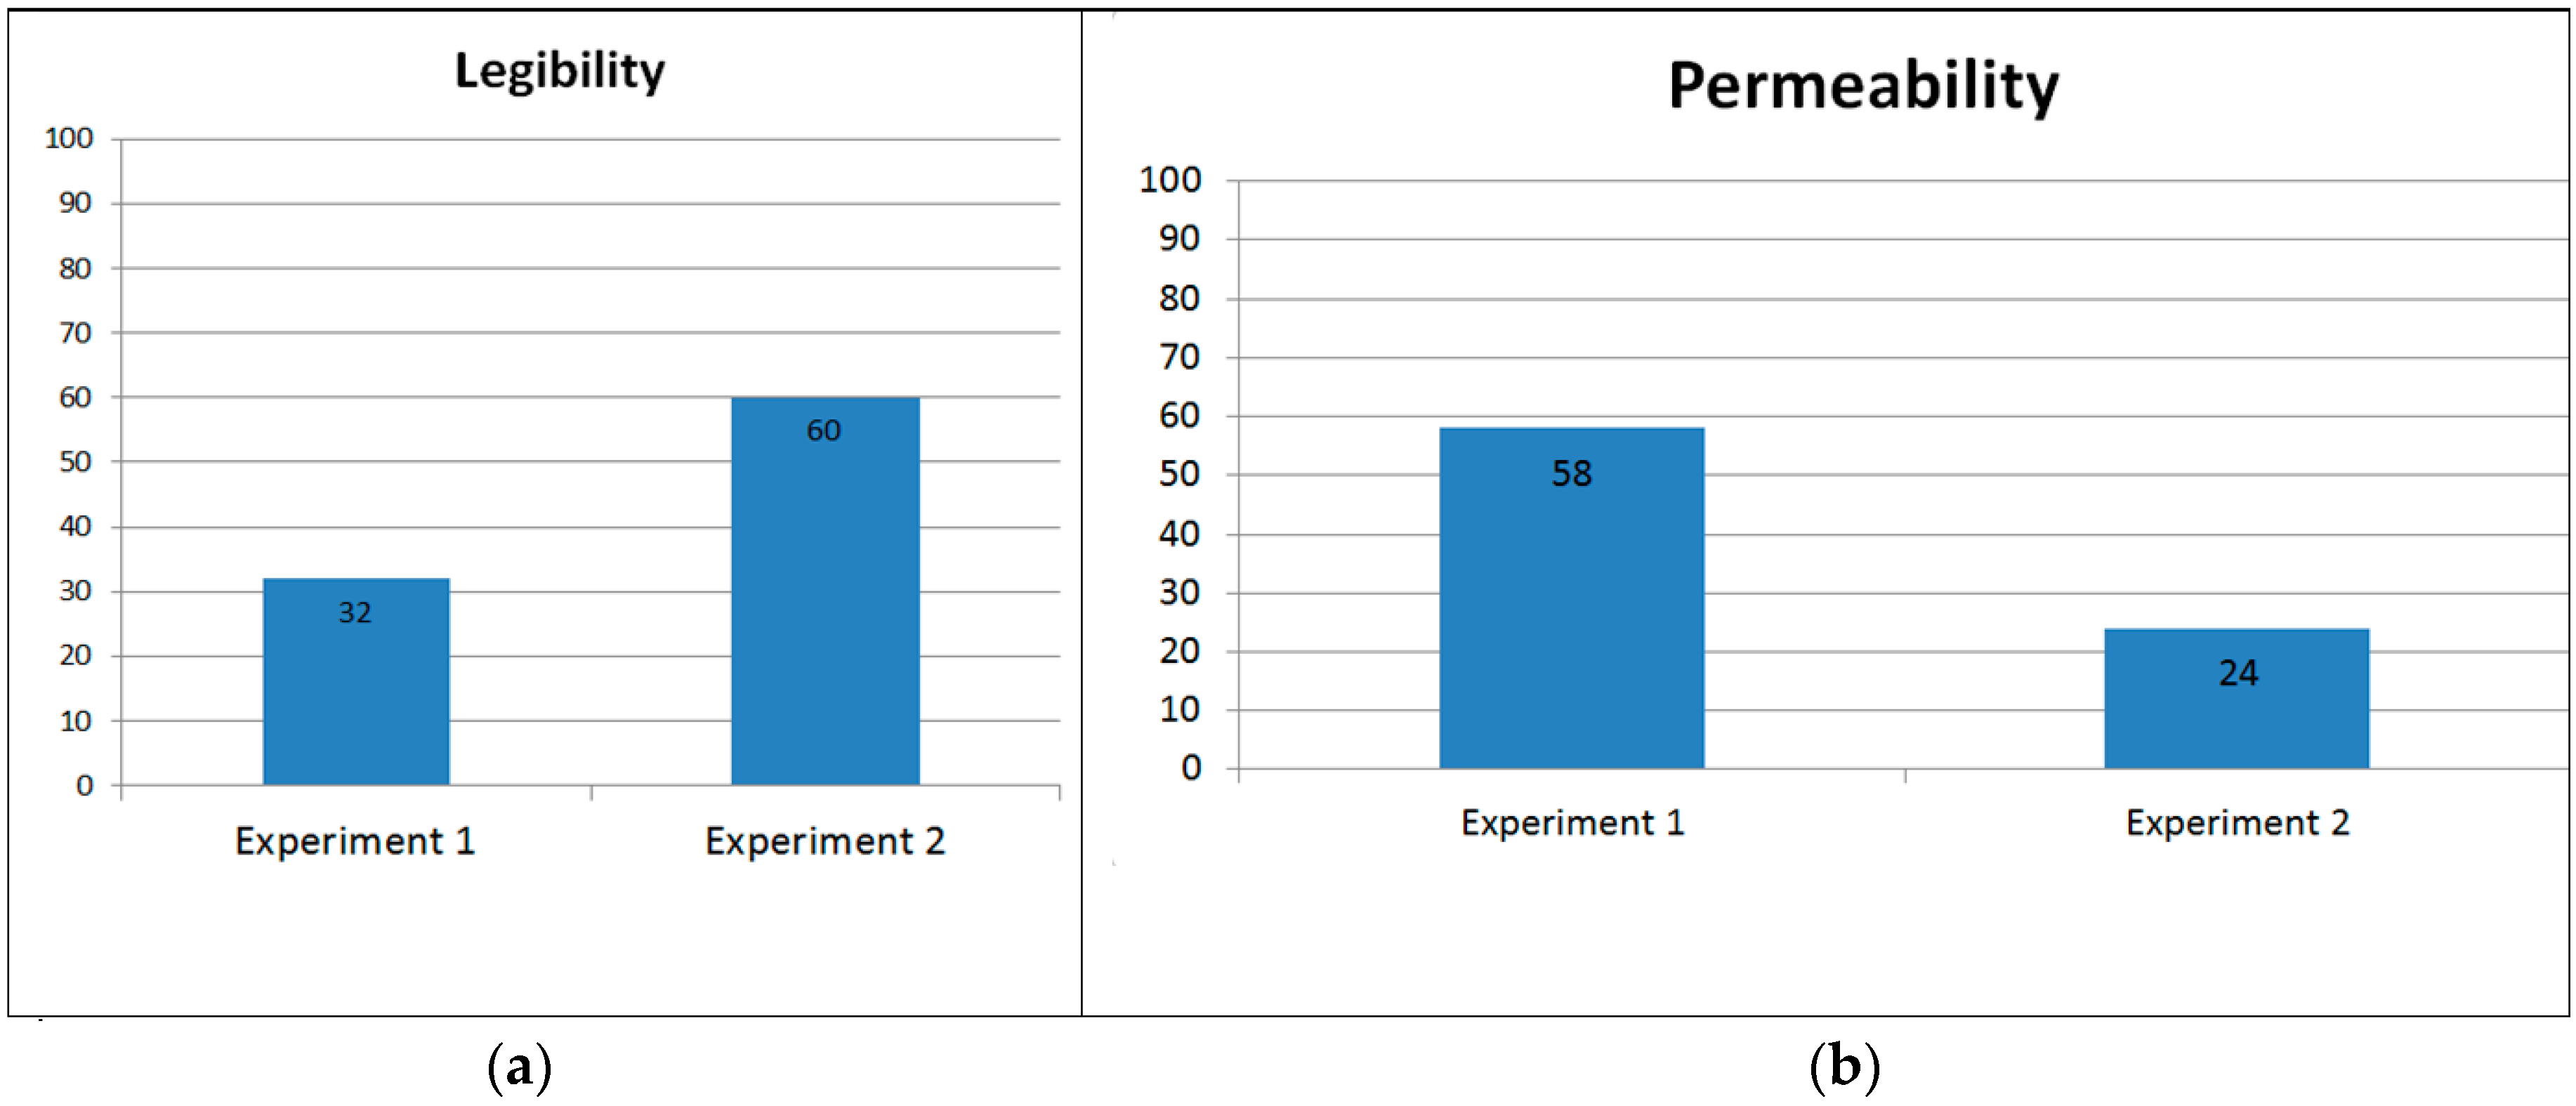
Another important finding is that the results of experiment 1 match relatively well the permeability’s parameters, while the results of experiment 2 match much more legibility’s parameters. Figure 13 shows that for example around 60% of the pixel values of legibility as outlined by experiment 2 match with less than 10% of maximum difference to the pixels as exhibited by the computational spatial analysis. On the other hand, this trend is satisfied for only 32% of the pixels in experiment 1. Regarding permeability, the result is slightly different since the experiment 1 is much more confirmed by the spatial analysis of permeability as compared to experiment 2.
Overall, the experiments show that inhabitants’ perceptions of permeability are compatible to an extent of 58% to the spatial analysis of the urban layouts. This result is much significant than the 32% of compatibility between inhabitant’s perception of legibility and the figures derived from the spatial analysis. On the other hand, the opinions of the second group of people unfamiliar with the environment show a 60% compatibility with the spatial analysis of legibility. This second group judged the permeability of a series of selected points by scenic panoramas from a pedestrian’s point of view. Their judgment shows a 24% compatibility with the permeability determined by the spatial analysis.
The study of the notion of legibility as shown by Figure 13 also revealed that newcomers to an urban environment are likely to explore possible routes preferably based on the spatial and morphological characteristics (60% in Figure 13a). Regarding permeability, it can be observed that people, who are familiar enough with the area, generally know the streets, avenues, intersections and their spatial structures. Therefore, their opinions are more dependent to geometrical characteristics (58% in Figure 13b).
Overall the figures that emerge require further analysis. An important one is to consider additional semantics associated to the urban layout and urban scenes that have significant impacts on urban navigation. For instance, architectural differences, parcel landuses, path categories should be taken into account and qualified to a certain degree as those should have an impact on several measures introduced in this paper (for example singularities and symmetries are amongst the many qualities that are likely to be impacted). Additional experiments on larger and different urban environments should be also conducted and are currently planned as further experimental works.
6. Conclusions
The research presented in this paper develops a modelling approach and computational framework to study the concepts of permeability and legibility of an urban layout. These notions are considered as two important properties when evaluating the structure of an urban layout as well as navigation capabilities in the city. The novelty of the approach is that the computational framework is formally developed, and built on the notions of legibility and permeability as introduced by Lynch and Bentley, respectively. Another peculiarity of our research is that all the parameters identified have been successfully implemented in a GIS software and spatial database. The metrics used to characterize legibility and permeability have been mainly derived from a series of geometric properties also applied elsewhere in landscape ecology primarily, and applied to the main parcels that appear in an urban layout. These measures are complemented by another series of metrics that characterize the spatial configuration of the paths and edges in the urban layouts.
The legibility and permeability have been computationally defined and implemented in a neighbourhood of the city of Tehran. The results of the computational experiments are compared to people’s opinions, either inhabitants that are familiar with the environment or newcomers to the environment via two independent experiments.
The experiment findings reveal different degrees of matching between the computational analysis of an urban layout and how legibility and permeability is perceived by people’s opinions depending on their initial knowledge of the considered urban layout. In particular, the detailed results show that newcomers to an urban place are likely to perceive the sense of legibility based on spatial and morphological characteristics rather than inhabitants. As for the permeability of urban environments, people who are familiar enough with the environment have overall recognized the permeability of environment with a close dependency to spatial structural properties.
Furthermore, this research shows that a spatial structural analysis of an urban layout might have an interest for urban navigation. As stated by [18] ‘The city is the creation of economic and social processes that operate within an envelope of geometric possibility defined by human minds’. Indeed, our experiments might contribute to show how structural properties play a role in the comprehension of an urban layout, as well as it also provides a framework for further analysis of navigation opportunities in the city. In order to refine the way legibility and permeability are derived, future research might for instance assign different weights, for example using regression techniques, to the factors identified in order to reflect the relative importance of the different structural trends identified. Last but not least we also plan to study how legibility and permeability might be closely related and/or interdependent.
Author Contributions
The corresponding author, Tolue Silavi, developed the methodological framework as well as the computational implementation and is the main writer of the paper; Farshad Hakimpour and Christophe Claramunt were acting as supervisors and provided feedbacks on the design and on the writings; Farshad Nourian contributed to urban design analysis, data analysis and gave suggestion during the manuscript revision.
Conflicts of Interest
The authors declare no conflict of interest.
Appendix A. Questionnaire Given to the Panellists
Permeability
This questionnaire is designed to explore the permeability of a neighbourhood, located in the central part of Tehran which is well known as it is a crowded area of Tehran’s bazaar. As you can see from the map in first page the neighbourhood is surrounded by Vahdat Eslami, Molavi, Shoush and Rey streets.
The Permeability in each point and its surrounding environment can be defined as:
- The ability to sense or move through a given environment.
- How far and how easily one can sense or move through an environment.
- How the physical properties of environments mitigate either perceptual or locomotive permeability.
There are 29 critical points on the map of study area to give your opinions on the concept of permeability. Please fill the table for each point with one of the low, moderate or high degree of permeability.
| No. | The Title of Point | The Degree of Permeability | ||
| High | Moderate | Low | ||
| 1 | Shush Street-Harandi Square | |||
| 2 | Shush Street-Khayyam Intersection | |||
| 3 | Shush Street-Shahid Borbor Intersection | |||
| 4 | Shush Square | |||
| 5 | Rey Street-Shush Park (Anbar Gandom) | |||
| 6 | Rey Street-Shahid Shams Intersection | |||
| 7 | Molavi Crossroads (Molavi Street-Aminolsoltan Intersection) | |||
| 8 | Molavi Street-Zokaei intersection | |||
| 9 | Molavi Street-Mohammadieh Square | |||
| 10 | Molavi Street-Takhti Square | |||
| 11 | Vahdat Eslami Street-Mokhtari Intersection | |||
| 12 | Vahdat Eslami Street-Shoush Intersection | |||
| 13 | Takhti Street-Mokhtari Intersection | |||
| 14 | Fallah nafari street-Abdolhoseini Intersection | |||
| 15 | Ba Atafe Pour Street (between Vahdat Eslami and Takhti) | |||
| 16 | Mokhtari Street-Yahyavi Intersection | |||
| 17 | Ghaem Street (between Khayam and Takhti) | |||
| 18 | Harandi Street-Zali Ghomi Intersection | |||
| 19 | Maleki Street-Shahid Haqqani Park | |||
| 20 | Almasian Street (Khorsand) | |||
| 21 | Azimi Street-Moghaddasi Intersection (Saboon paz khane) | |||
| 22 | Nasiri Street-Maroofkhani Intersection | |||
| 23 | Borbor Street-Jazmani Intersection | |||
| 24 | Ardestani Street-Pirmoradi Intersection | |||
| 25 | Hatami Brothers Street-Abbas Azadi Intersection | |||
| 26 | Shush Park-Aminolsoltan Street | |||
| 27 | Khayyam Street-Bagh Angoori Intersection | |||
| 28 | Khajooye Kermani Park-Moradi Street | |||
| 29 | Hamdollahi Street-Khosrojerdi Intersection | |||
Legibility
This questionnaire is designed to explore the legibility of a neighbourhood, located in the central part of Tehran which is well known as it is a crowded area of Tehran’s bazaar. As you can see from the map in first page the neighborhood is surrounded by Vahdat Eslami, Molavi, Shoush and Rey streets.
The legibility of each environment can be defined as:
- The ease with which people understand the layout of a place.
- The capacity of a space to give clues to the understanding of the system as a whole.
- The capacity of a space to facilitate one’s orientation in a city.
There are 9 sub neighbourhoods on the map of study area to give your opinions on the concept of legibility. Please fill the table for each neighbourhood with one of the low, moderate or high degree of legibility.
| No. | The Extent of Neighborhood | The Degree of Legibility | ||
| High | Moderate | Low | ||
| 1 | Vahdat Eslami Street-Below the Molavi Street and above the Shoush Street | |||
| 2 | Takhti Street- Below the Molavi Street and above the Shoush Street | |||
| 3 | Mokhtari Street- Between Takhti and Vahdat Eslami Streets | |||
| 4 | Khayyam Street- Above the Shush Street | |||
| 5 | Molavi Street- Between Saboon Paz Khoone and Haj Gholamali Bazaar | |||
| 6 | Shush Street- Between Shush Square and Khayyam Street | |||
| 7 | Saheb Jame Street- Near Shush Park | |||
| 8 | Rey Street- Around Molavi street | |||
| 9 | Molavi Street- Between Mohammadieh Square and Molavi Crossroads | |||
References
- Kaplan, R.; Kaplan, S. The Experience of Nature: A Psychological Perspective; CUP Archive: Cambridge, UK, 1989. [Google Scholar]
- Meilinger, T.; Knauff, M. Ask for directions or use a map: A field experiment on spatial orientation and wayfinding in an urban environment. J. Spat. Sci. 2008, 53, 13–23. [Google Scholar] [CrossRef]
- Zhao, P. Sustainable urban expansion and transportation in a growing megacity: Consequences of urban sprawl for mobility on the urban fringe of beijing. Habitat Int. 2010, 34, 236–243. [Google Scholar] [CrossRef]
- Baran, P.K.; Smith, W.R.; Moore, R.C.; Floyd, M.F.; Bocarro, J.N.; Cosco, N.G.; Danninger, T.M. Park use among youth and adults examination of individual, social, and urban form factors. Environ. Behav. 2014, 46, 768–800. [Google Scholar]
- Haq, S.; Zimring, C. Just down the road a piece: The development of topological knowledge of building layouts. Environ. Behav. 2003, 35, 132–160. [Google Scholar]
- Penn, A. Space syntax and spatial cognition: Or why the axial line? Environ. Behav. 2003, 35, 30–65. [Google Scholar] [CrossRef]
- Hillier, B.; Hanson, J. The Social Logic of Space; Cambridge University Press: Cambridge, UK, 1984. [Google Scholar]
- Lynch, K. The Image of the City; The MIT Press: Cambridge, MA, USA, 1960. [Google Scholar]
- Cross, L.T. Evaluation of swedish outdoor living environments: Cultural influence on environmental perceptions. J. Archit. Plan. Res. 2007, 23, 338–349. [Google Scholar]
- Bentley, I.; Alcock, A.; Murrain, P.; McGlynn, S.; Smith, G. Responsive Environments: A Manual for Designers; The Architectural Press: London, UK, 1985. [Google Scholar]
- Stamps, A.E. Effects of multiple boundaries on perceived spaciousness and enclosure. Environ. Behav. 2012, 45, 851–875. [Google Scholar] [CrossRef]
- McCall, R.; O’Neill, S.; Carroll, F.; Benyon, D.; Smyth, M. Responsive environments, place and presence. PsychNol. J. 2005, 3, 35–73. [Google Scholar]
- Carmona, M.; Heath, T.; Oc, T.; Tiesdell, S. Public Places, Urban Spaces; Architectural Press: Oxford, UK, 2003. [Google Scholar]
- Herzog, T.R.; Leverich, O.L. Searching for legibility. Environ. Behav. 2003, 35, 459–477. [Google Scholar] [CrossRef]
- Stamps, A.E. Isovists, enclosure, and permeability theory. Environ. Plan. B Plan. Des. 2005, 32, 735–762. [Google Scholar] [CrossRef]
- Lopes, A.S.; Cavalcante, A.P.d.H. Wayfinding measurement through path choice opportunity. In Eighth International Space Syntax Symposium; Greene, M., Reyes, J., Castro, A., Eds.; Pontifical Catholic University of Chile (PUC): Santiago, Chile, 2012. [Google Scholar]
- Mohamed, A.A. Evaluating way-finding ability within urban environment. In Eighth International Space Syntax Symposium; Greene, M., Reyes, J., Castro, A., Eds.; Pontifical Catholic University of Chile (PUC): Santiago, Chile, 2012. [Google Scholar]
- Hillier, B. Studying cities to learn about minds: Some possible implications of space syntax for spatial cognition. Environ. Plan. B Plan. Des. 2012, 39, 12–32. [Google Scholar] [CrossRef]
- Gustafson, E.J. Quantifying landscape spatial pattern: What is the state of the art. Ecosystems 1998, 1, 143–156. [Google Scholar] [CrossRef]
- Aguilera, F.; Valenzuelaa, L.M.; Botequilha-Leitãob, A. Landscape metrics in the analysis of urban land use patterns: A case study in a spanish metropolitan area. Landsc. Urban Plan. 2011, 99, 226–238. [Google Scholar] [CrossRef]
- Voordea, T.V.D.; Jacquet, W.; Cantersa, F. Mapping form and function in urban areas: An approach based on urban metrics and continuous impervious surface data. Landsc. Urban Plan. 2011, 102, 143–155. [Google Scholar]
- Fan, C.; Myint, S. A comparison of spatial autocorrelation indices and landscape metrics in measuring urban landscape fragmentation. Landsc. Urban Plan. 2014, 121, 117–128. [Google Scholar] [CrossRef]
- Kowe, P.; Pedzisai, E.; Gumindoga, W.; Rwasoka, D.T. An analysis of changes in the urban landscape composition and configuration in the sancaktepe district of istanbul metropolitan city, turkey. Geocarto Int. 2015, 30, 506–519. [Google Scholar] [CrossRef]
- Triantakonstantis, D.; Stathakis, D. Examining urban sprawl in europe using spatial metrics. Geocarto Int. 2015, 30, 1092–1112. [Google Scholar] [CrossRef]
- Bahrainy, H.; Khosravi, H. The impact of urban design features and qualities on walkability and health in under-construction environments: The case of hashtgerd new town in iran. Cities 2013, 31, 17–28. [Google Scholar] [CrossRef]
- Steiniger, S.; Lange, T.; Burghardt, D.; Weibel, R. An approach for the classification of urban building structures based on discriminant analysis techniques. Trans. GIS 2008, 12, 31–59. [Google Scholar]
- Schroder, C.J.; Mackaness, W.A.; Gittings, B.M. Giving the ‘right’ route directions: The requirements for pedestrian navigation systems. Trans. GIS 2011, 15, 419–438. [Google Scholar] [CrossRef]
- Freundschuh, S.M.; Egenhofer, M.J. Human conceptions of spaces: Implications for GIS. Trans. GIS 1997, 2, 361–375. [Google Scholar] [CrossRef]
- Crooks, A.; Croitoru, A.; Lu, X.; Wise, S.; Irvine, J.M.; Stefanidis, A. Walk this way: Improving pedestrian agent-based models through scene activity analysis. ISPRS Int. J. Geo-Inf. 2015, 4, 1627–1656. [Google Scholar] [CrossRef]
- Li, X.; Hijazi, I.; Koenig, R.; Lv, Z.; Zhong, C.; Schmitt, G. Assessing essential qualities of urban space with emotional and visual data based on gis technique. ISPRS Int. J. Geo-Inf. 2016, 5, 218. [Google Scholar]
- Gjerde, M. Visual evaluation of urban streetscapes: How do public preferences reconcile with those held by experts? Urban Des. Int. 2011, 16, 153–161. [Google Scholar] [CrossRef]
- Long, Y.; Baran, P.K. Does intelligibility affect place legibility? Understanding the relationship between objective and subjective evaluations of the urban environment. Environ. Behav. 2012, 44, 616–640. [Google Scholar] [CrossRef]
- Zmudzinska-Nowak, M. Searching for legible city form: Kevin lynch’s theory in contemporary perspective. J. Urban Technol. 2003, 10, 19–39. [Google Scholar] [CrossRef]
- Stamps, A.E. Effects of permeability on perceived enclosure and spaciousness. Environ. Behav. 2010, 42, 864–886. [Google Scholar]
- Tralhao, L.; Sousa, N.; Ribeiro, N.; Coutinho-Rodrigues, J. Design of bicycling suitability maps for hilly cities. Munic. Eng. 2015, 168, 96–105. [Google Scholar]
- Silavi, T.; Hakimpour, F.; Claramunt, C.; Nourian, F. Design of a spatial database to analyze the forms and responsiveness of an urban environment using an ontological approach. Cities 2016, 52, 8–19. [Google Scholar] [CrossRef]
- Herold, M.; Couclelis, H.; Clarke, K.C. The role of spatial metrics in the analysis and modeling of urban land use change. Comput. Environ. Urban Syst. 2005, 29, 369–399. [Google Scholar] [CrossRef]
- Wang, F.; Marceau, D.J. A patch-based cellular automaton for simulating land-use changes at fine spatial resolution. Trans. GIS 2013, 17, 828–846. [Google Scholar] [CrossRef]
- McGarigal, K.; Marks, B.J. Fragstats: Spatial Pattern Analysis Program for Quantifying Landscape Structure; General Technical Report, PNW-GTR-351; U.S. Department of Agriculture, Forest Service, Pacific Northwest Research Station: Portland, OR, USA, 1995.
- McGarigal, K.; Cushman, S.A.; Neel, M.C.; Ene, E. Fragstats: Spatial Pattern Analysis Program for Categorical Maps. Available online: http://www.umass.edu/landeco/research/fragstats/fragstats.html (acessed on 25 February 2016).
- Jiang, B.; Claramunt, C.; Klarqvist, B. Integration of space syntax into gis for modelling urban spaces. Int. J. Appl. Earth Obs. Geoinform. 2000, 2, 161–171. [Google Scholar]
- TAC. Geometric Design Guide for Canadian Roads Canada; Transportation Association of Canada: Ottawa, ON, Canada, 1999. [Google Scholar]
- Silva, K.D. Mapping meaning in the city image: A case study of kandy, sri lanka. J. Archit. Plan. Res. 2011, 28, 229–251. [Google Scholar]
Figure 1.
Modelling and computational approach principles.

Figure 2.
Urban layout of Tehran district 12: (a) parcels that have separate land use or ownership title; (b) paths; (c) blocks that are isolated by the paths surrounding them; and (d) edges.
Figure 2.
Urban layout of Tehran district 12: (a) parcels that have separate land use or ownership title; (b) paths; (c) blocks that are isolated by the paths surrounding them; and (d) edges.
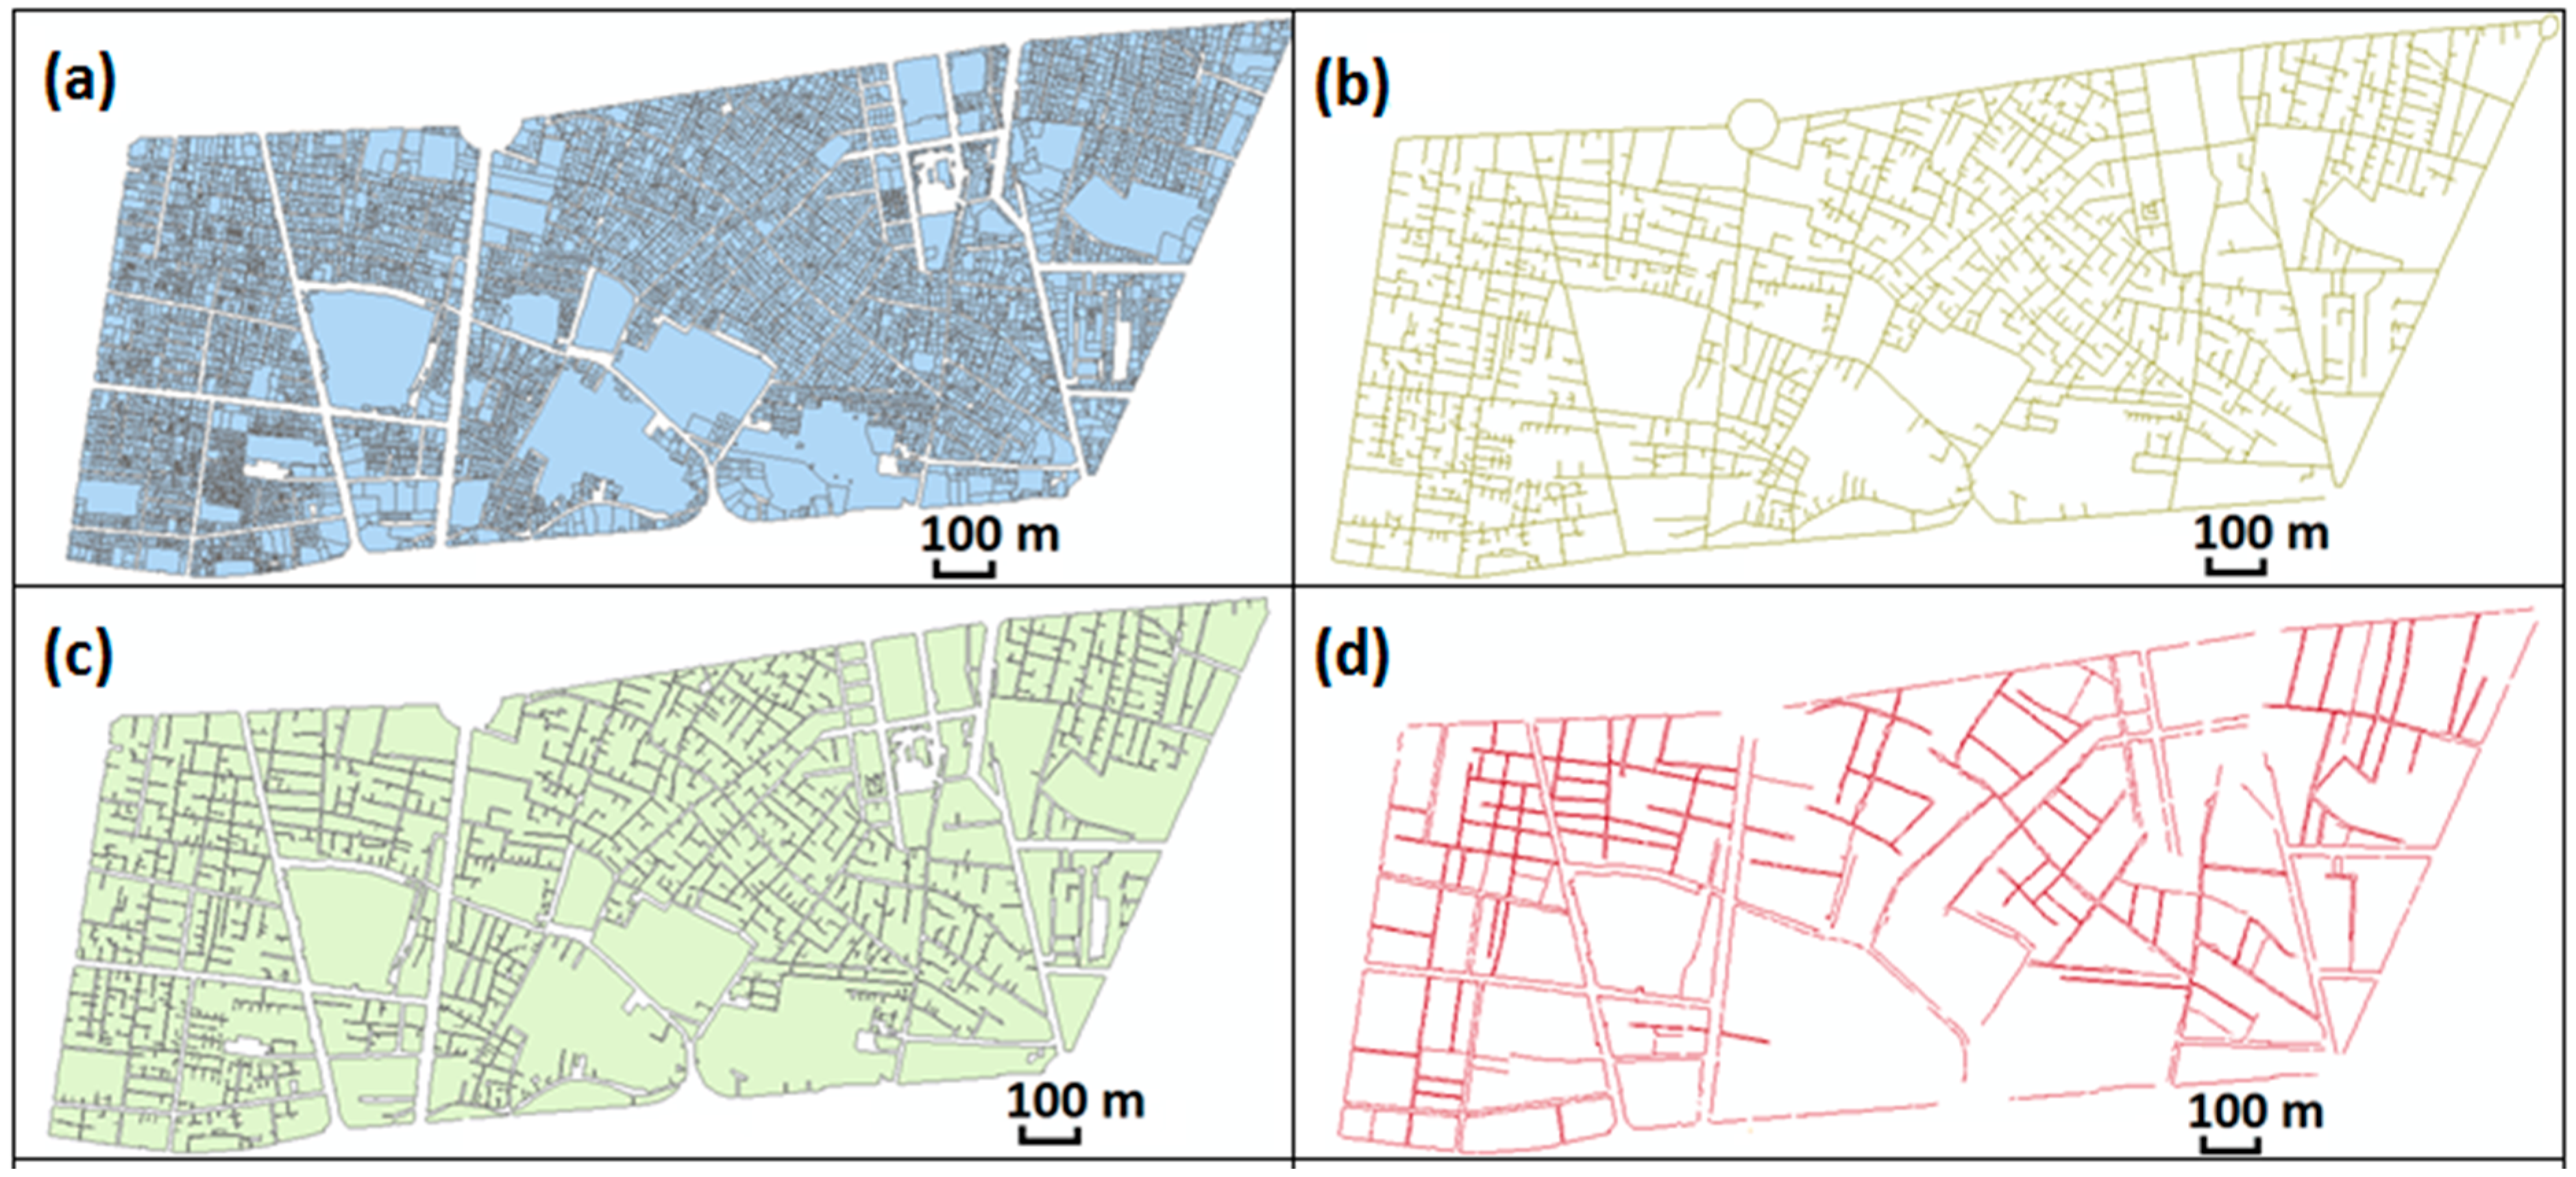
Figure 3.
District 12 of the city of Tehran.
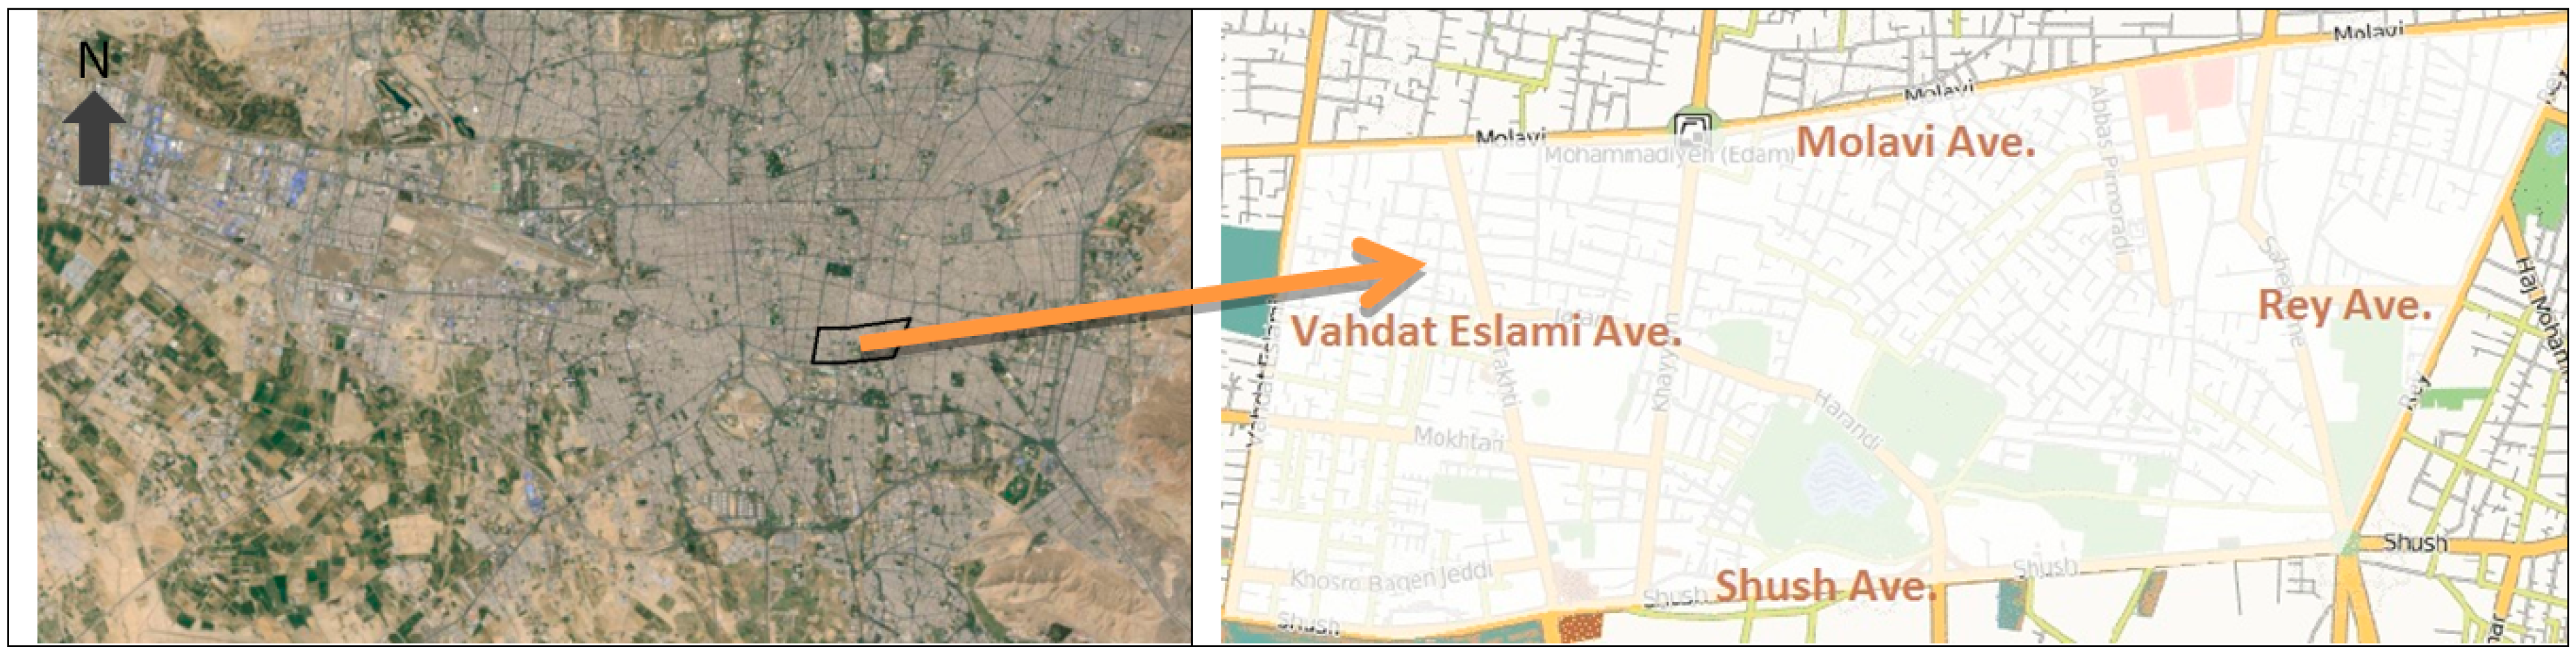
Figure 4.
(a) Paths between two points a and b for (a) a hierarchical layout; (b) non-hierarchical layout; (c) a block in a hierarchical layout; (d) core areas of the same block; (e) same block when its notches are removed and has straight edges; and (f) the NCA of the block is reduced to one when all notches are removed.

Figure 5.
Parameters that denote legibility along the streets, that is, (a) singularity; (b) form simplicity; (c) continuity; (d) dominance; (e) clarity of joints; (f) directional differentiation; (g) visual scopes (determined by edges); (h) visual scopes (determined by paths); and (i) motion awareness.
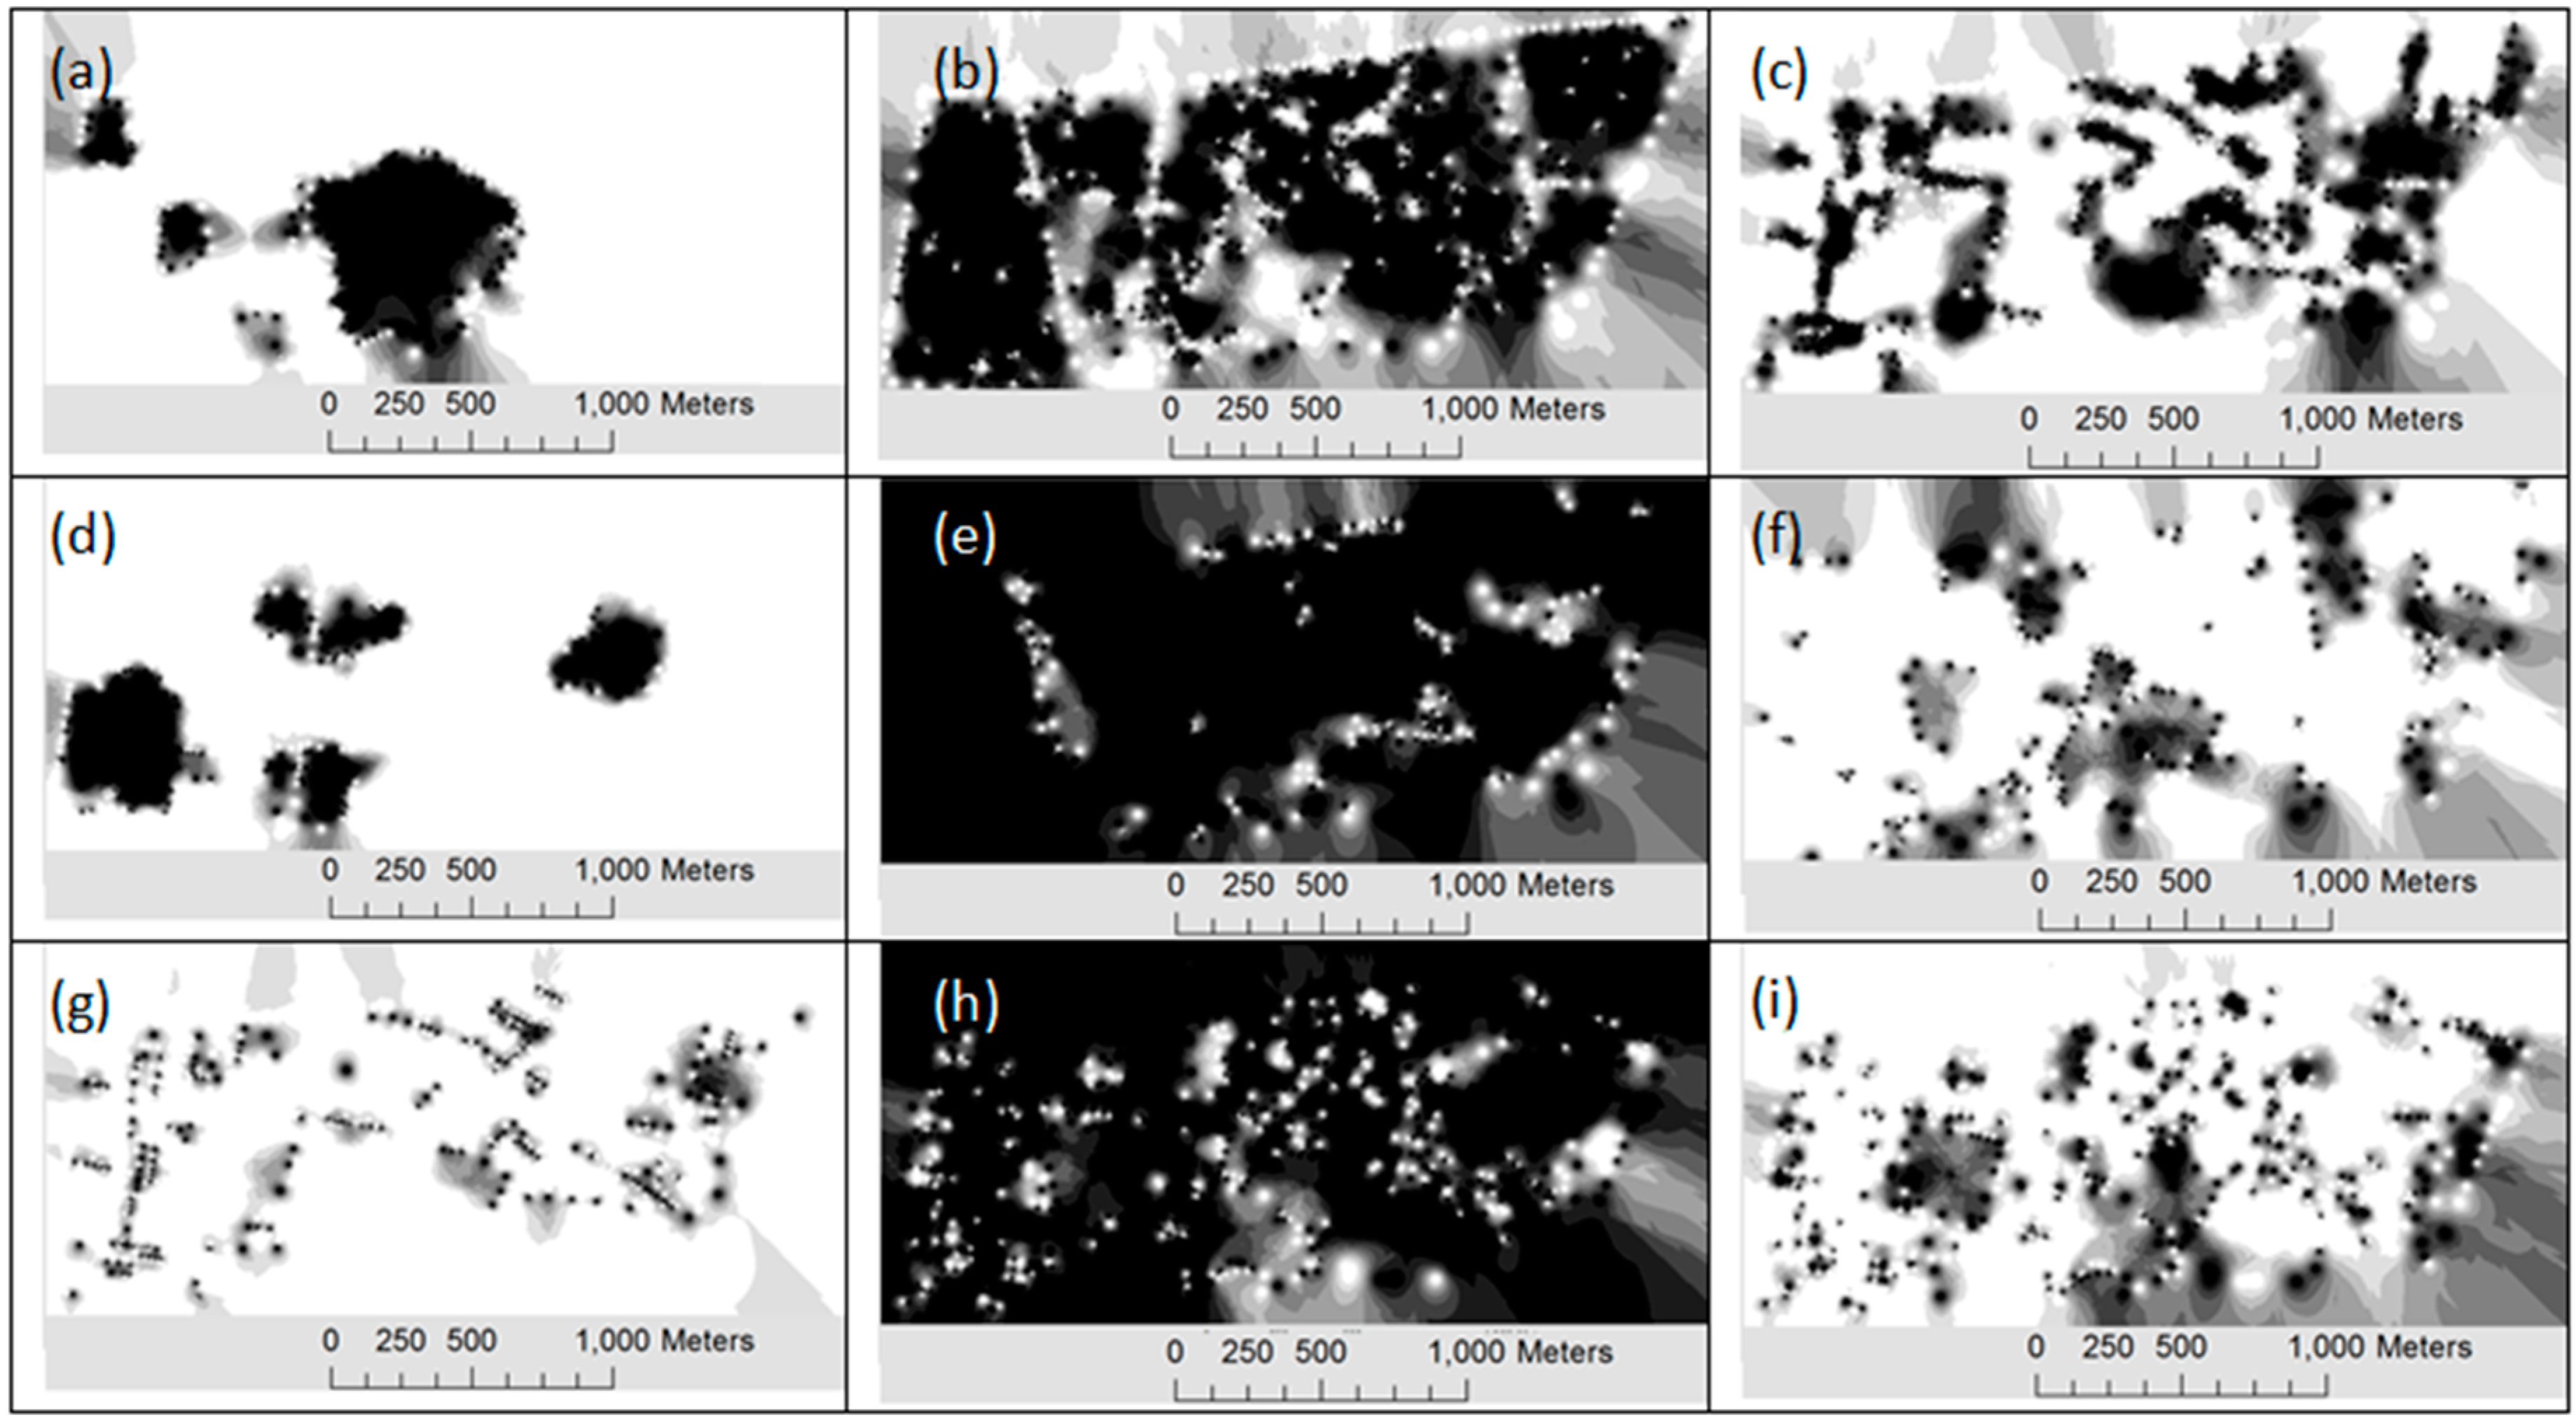
Figure 6.
Parameters that contribute to permeability along the streets, that is, (a) small blocks; (b) segregated path; and (c) hierarchical layouts.
Figure 6.
Parameters that contribute to permeability along the streets, that is, (a) small blocks; (b) segregated path; and (c) hierarchical layouts.

Figure 7.
(a) Final legibility exhibited by an aggregation of the raster maps as shown in Figure 5; (b) final permeability generated by an aggregation of the raster maps as shown in Figure 6.

Figure 8.
Study area with numbered points presented to the panellists to assess permeability and legibility.
Figure 8.
Study area with numbered points presented to the panellists to assess permeability and legibility.
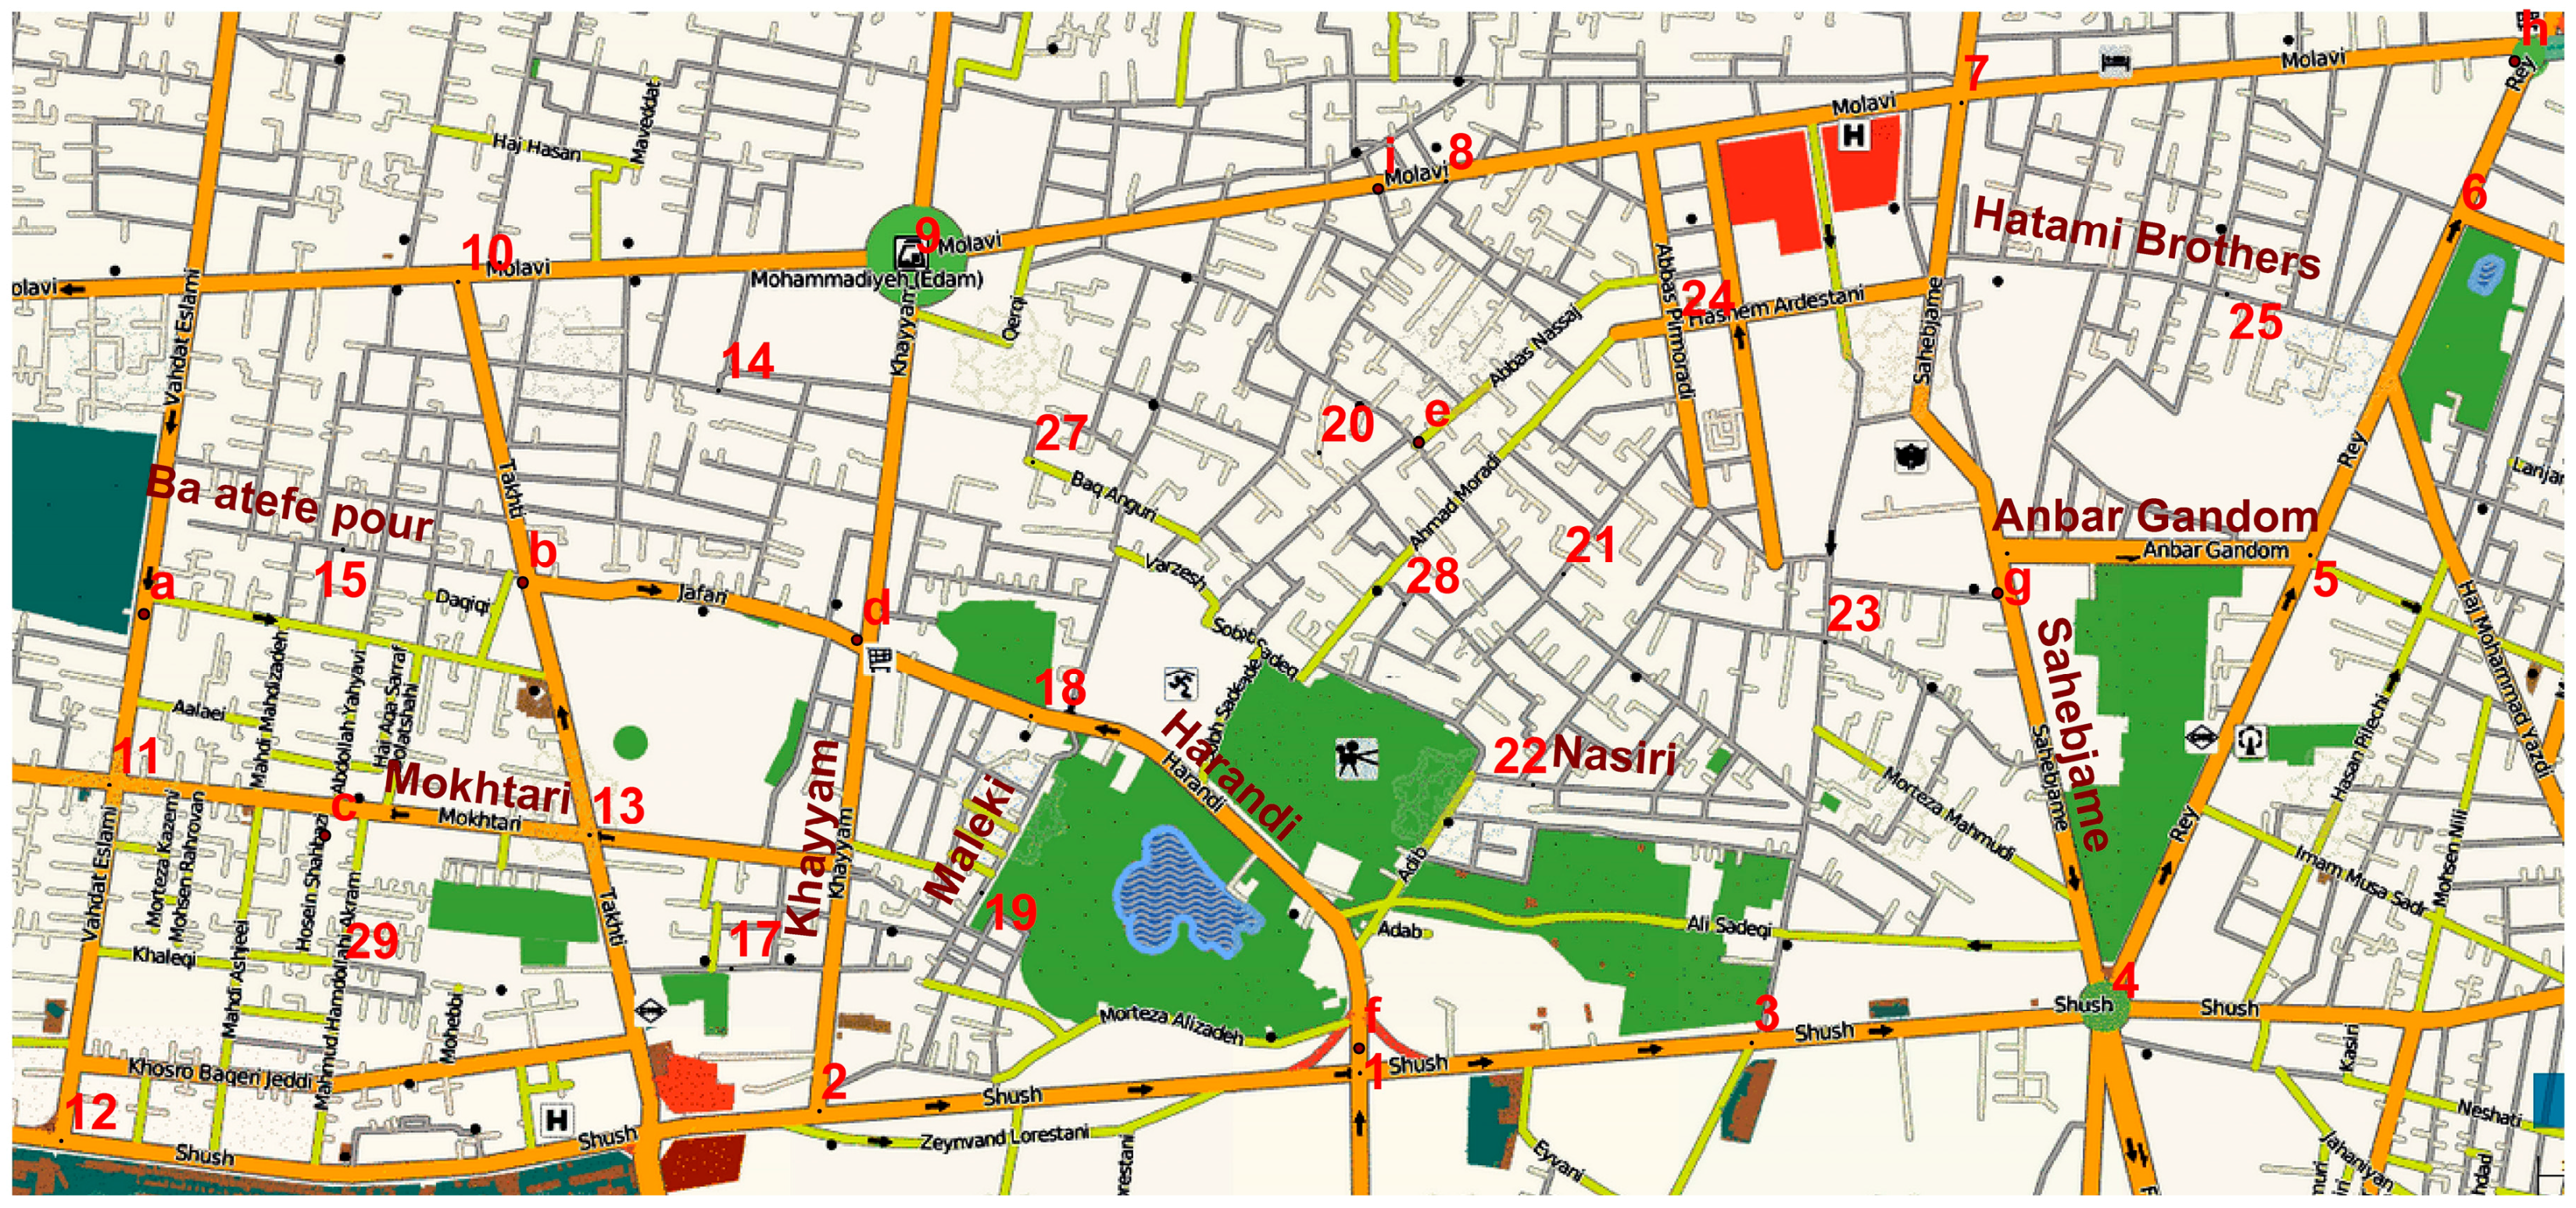
Figure 9.
Raster layers from people’s opinions in experiment 1 for (a) legibility; and (b) permeability.
Figure 9.
Raster layers from people’s opinions in experiment 1 for (a) legibility; and (b) permeability.

Figure 10.
Panorama taken at the intersection of Harandi Street and Shush Street (point No. 1).
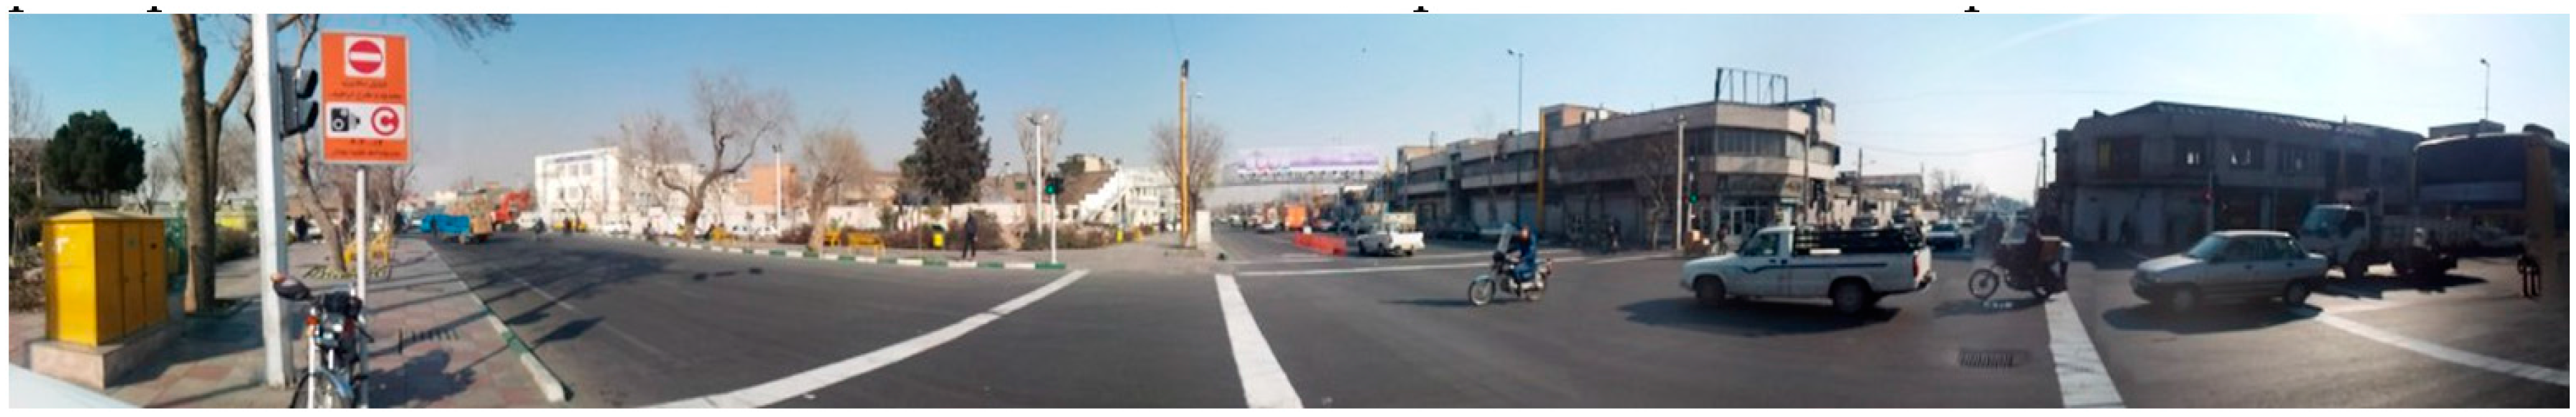
Figure 11.
Raster layers that reflect people’s opinions in experiment 2 for (a) legibility; and (b) permeability. Both experiments are summarized by the parameter values derived (Figure 5 and Figure 6) and the final values of legibility and permeability (Figure 7).
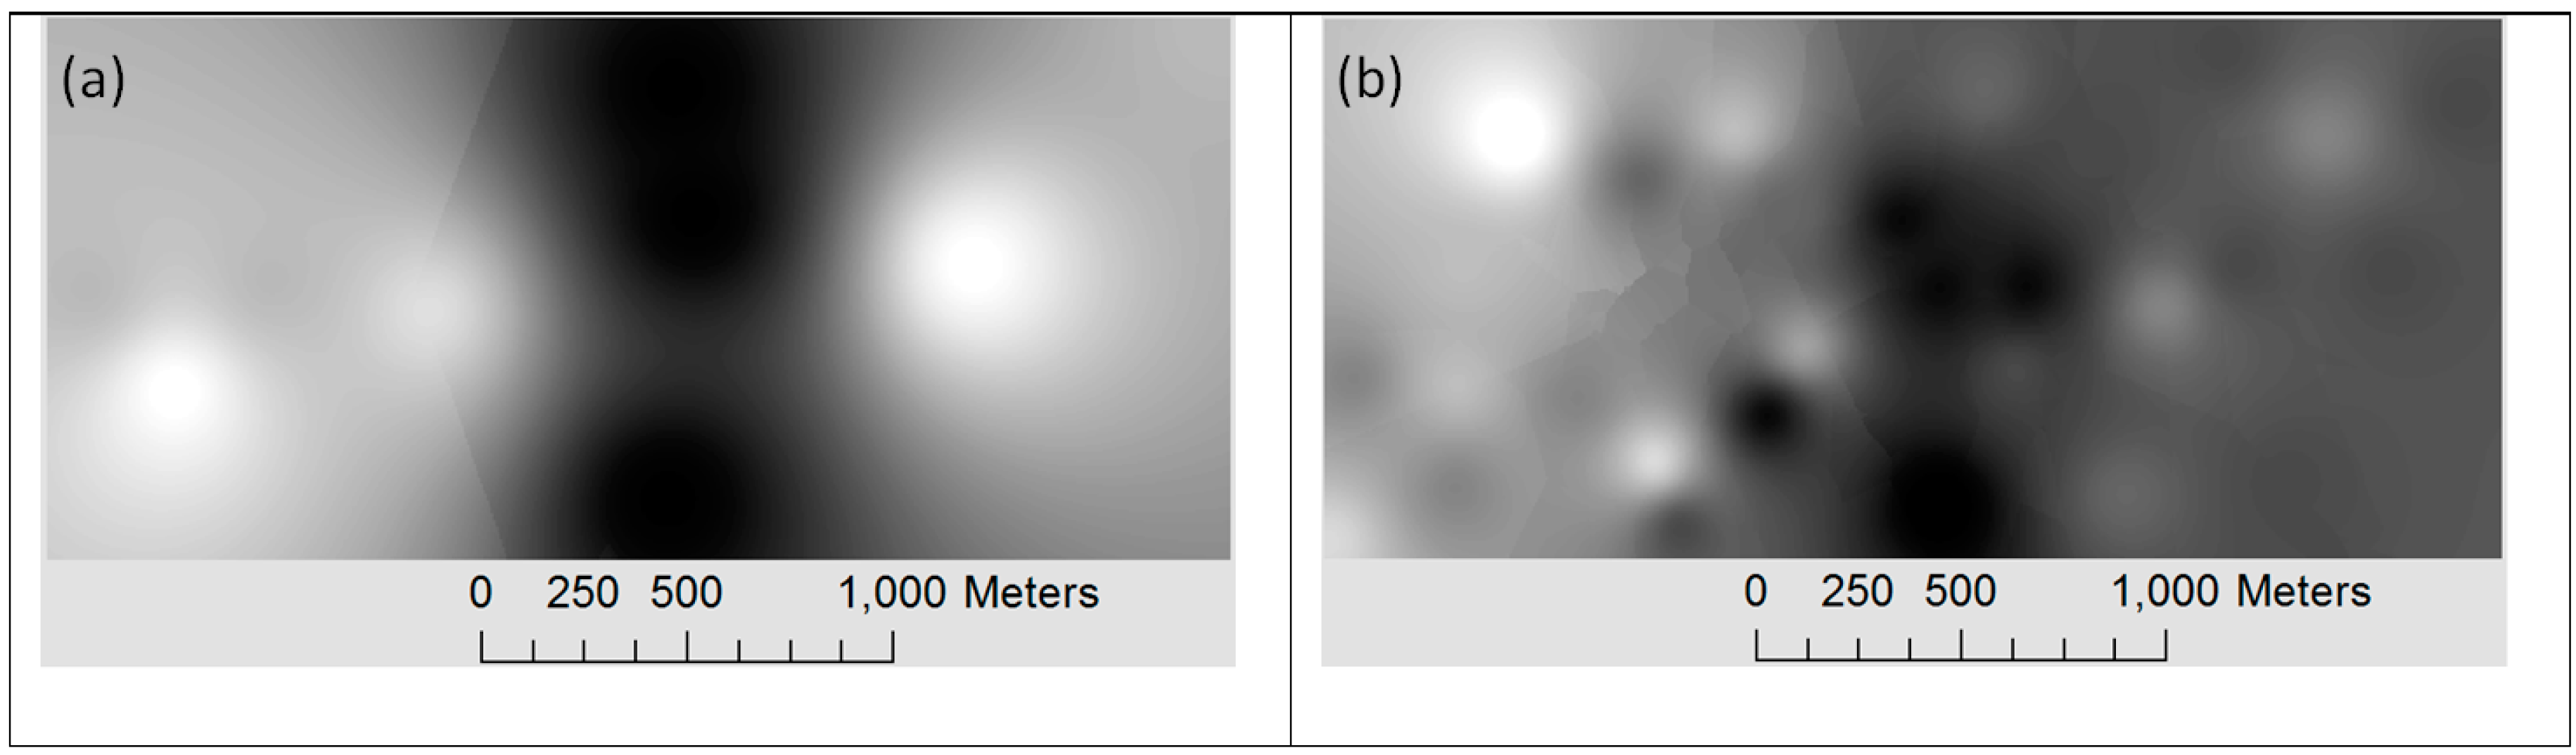
Figure 12.
Experiments 1 and 2 outputs compared to the spatial analyses of parameters of (a) legibility; and (b) permeability (numbers refer to percentages of pixels with less than 10% difference).
Figure 12.
Experiments 1 and 2 outputs compared to the spatial analyses of parameters of (a) legibility; and (b) permeability (numbers refer to percentages of pixels with less than 10% difference).

Figure 13.
Experiments 1 and 2 outputs compared to spatial analyses of (a) legibility; and (b) permeability (numbers refer to percentages of street lengths).
Figure 13.
Experiments 1 and 2 outputs compared to spatial analyses of (a) legibility; and (b) permeability (numbers refer to percentages of street lengths).


Table 1.
Lynch’s legibility qualities.
| Qualities | Examples |
|---|---|
| Singularity: Singularity denotes the contrast and distinguishability of urban objects in a given scene [8]. This is illustrated by the relative high singularity of the parcels that appear in the Khayyam neighbourhood in Tehran. |  |
| Simplicity: Simplicity characterises the geometrical forms of an urban layout. Simple forms in an urban layout are likely to favour a better perception and understanding of the environment [8]. The figure to the right presents an area that exhibits regular and simple forms of the parcels (Kashanak neighbourhood). |  |
| Continuity: Continuance characterises the edges of an urban layout. A continuous edge should visually extent the potential perception of an urban space [8]. The figure to the right presents an example of continuity edge to the North, while there is a breakdown of continuity close to a street intersection to the South. |  |
| Dominance: Dominance denotes the property of a given urban feature with respect to the others in its neighbourhood [8]. The figure to the right shows a parcel very much different from the others in the neighbourhood. |  |
| Clarity of intersections: Street intersections are strategic places of an urban layout and should be highly perceptible [8]. Paths in a layout with low directional discrepancy are likely to exhibit a low clarity of perception. The figure to the right exhibits an example of such low clarity. |  |
| Directional differentiation: Directional differentiation denotes asymmetries of urban streets. For instance, asymmetries revealed by radial differences of urban streets can obscure the sense of direction [8]. The example shown in the figure to the right by the Navvab highway exhibits a case whose symmetric sides obscure the sense of direction. |  |
| Visual scope: The visual scope reflects the range and penetration of the vision in a given street [8]. The example illustrated by the figure to the right shows the Sattarkhan and Takestan Streets in Tehran whose bends limit the perspective offered. |  |
| Motion awareness: Motion awareness denotes the qualities sensible to the observer, through visual and the kinaesthetic senses, and that constrains motion. Motion awareness is for instance impacted by curves and direction changes that constrain the visual scope [8]. The example to the right presents the bendiness of Allameh Jafari street in the Tehran that constrains motion. |  |
Table 2.
Design trends that favour a permeable layout.
| Design Trends | Examples |
|---|---|
| Small blocks: Small blocks offer a higher sense of permeability by offering additional and generally short route alternatives to choose from as. As it can be seen in the example to the right, the Euclidean distance between locations A and B are equal to the distance between points B and C. However, the path between A and B is shorter than the path between B and C. This is due to an important difference in the size of the blocks that are situated between these pairs of locations. |  |
| Segregating paths: Segregating paths can be achieved by segregating transportation opportunities in the urban network, for example by specialising different network categories such as private vehicle, public transportation and motorcycle users [10]. Segregated paths have limited potential in passing through and consequently have less permeability. The figure shows the Vali-e-Asr Street in the Tehran that is segregated to a path for buses and a one way path for vehicles. This leads to heavy traffic in the middle of Tehran as shown in the picture but better traffic performance for public transportation. |  |
| Hierarchical layouts: A hierarchy layout denotes an urban network designed at different levels of granularity. As illustrated in the figure to the right, hierarchical layouts generate cul-de-sacs and less route opportunities and then less permeability [10], but a probable sense of security to the inhabitants. |  |
Table 3.
Selected landscape metrics used to evaluate urban layout components [40].
Table 3.
Selected landscape metrics used to evaluate urban layout components [40].
| Landscape Metric | Definition | Illustration |
|---|---|---|
| Parcel Area: AREA | AREA(p) denotes the area of a parcel p. |  |
| Parcel Perimeter: PERIM | PERIM(p) denotes the perimeter of a parcel p. |  |
| Perimeter/Area: PARA | PARA(p) denotes the Perimeter-Area ratio, it is given as follows: PARA(p) = PERIM(p)/AREA(p) | |
| Shape Index: SHAPE | SHAPE(p) denotes the complexity of the shape of a parcel p. Shape complexity characterises the geometry of a given parcel, whether a parcel tends to be simple and compact, or irregular and convoluted. SHAPE(p) = 0.25PERIM(p)/√AREA(p) | |
| Number of Core Areas: NCA | NCA(p) denotes the number of disjoint core areas of a parcel p based on specified edge depths. It is given by the number of internal zones generated by the application of a buffer function with a negative depth. |  |
Table 4.
Geometric measures applied to urban paths.
| Geometric Measures | Definition | Illustration |
|---|---|---|
| Path-Length: PL | PL(pa) denotes the length of a path pa. |  |
| Path-Width: PW | PW(pa) denotes the width of a path pa. | |
| Path-Bendiness: PB | PB(pa) denotes the bendiness of a path pa. It is derived by the difference between the length of a path (i.e., black line) and the Euclidean distance between the first and end points of the path (i.e., red line) as illustrated by the Figure to the right. | |
| Angle of the intersection of two paths pa1 and pa2: ANG | ANG(pa1, pa2) denotes the angle in the intersection between two given paths pa1 and pa2. |
Table 5.
Configuration-based measures used to measure urban layout components.
| Topologic Measure | Description | Illustration |
|---|---|---|
| Alignment: ALT | ALT(edg, p1, p2,…, pn) denotes the alignment of a set of parcels (p1, p2,…, pn) along an edge edg. It is given by the ratio of the length of that edge (e.g., the red polyline) to the distance between the endpoints of the edge (e.g., the blue line). |  |
| Continuance: CONT | CONT(edg, pa1, pa2,…, pan) denotes the relative continuity of the blocks along an edge edg (an outer boundary of the aligned blocks). It is given by the inverse of the number of intersecting paths pa1 to pan (e.g., the ellipses in the figure to the right) along that edge. | |
| Symmetry: SYM | SYM(pa) denotes the symmetry given by analysing the parcel boundaries along each side of a given path pa. This measure of symmetry is given by the ratio of the difference between the highest to the lowest (range) and mean of parcels boundaries (e.g., black and gray lines on each side of the path), to the right by the similar value to the ones to the left of a path pa. In the example given to the right, the number of parcels to the right is equal to the number of parcels to the left, but different parcel boundary ranges and means slightly alter the sense of symmetry of that path. |  |
Table 6.
Qualities forms and computational rules.
| Form Qualities | Computation Rules |
|---|---|
| Singularity | An urban layout, is considered to be a singular one if ∀ District d ∈ Environment ⟹ SHAPE_CV(d) gives a relative high value |
| Form Simplicity | An urban layout, is considered has reflecting Simplicity if ∀ Parcel p ∈ Environment ⟹ SHAPE(p) gives a relative low value |
| Continuity | An urban layout, is considered has reflecting a high degree of Continuance if ∀ Edge edg ∈ Environment ⟹ CONT(edg) gives a relative high value |
| Dominance | An urban layout, reflects some Dominance trends if ∀ District d ∈ Environment ⟹ AREA_CV(d) ∈ gives relatively a low value ⋀ AREA_RA(d) gives a relative high value |
| Clarity | An urban layout, is considered has reflecting clear intersections if ∀ path pa1, path pa2 ∈ Environment⟹ [~Intersection(pa1,pa2)] ⋁[70° < ANG(path1, path2) <110°] |
| Directional Differentiation | An urban layout, has clear Directional Differentiation if ∀ path pa ∈ Environment ⟹ SYM(pa) gives a relative low value |
| Visual Scope | An urban layout, has a clear Visual Scope if ∀ edge edg and parcels p1 p2, …, pn ∈ Environment ⟹ ALT(edg, p1, p2, …, pn) gives a relative high value |
| An urban layout, has a clear Visual Scope if ∀ path pa ∈ Environment ⟹ PB(pa) gives a relative low value | |
| Motion Awareness | An urban layout has a high value of Motion Awareness if ∀ path pa ∈ Environment ⟹ PB(pa) gives a relative high value |
Table 7.
Parameters and rules that qualify the city permeability.
| Parameters | Computational Rules |
|---|---|
| Small Blocks | An urban layout, has Small Blocks if ∀ block b ∈ Environment ⟹ AREA(b) gives most often a relative lower value |
| Segregated Paths | An urban layout, is less affected by Segregation if ∀ path Pa ∈ Environment ⟹ WIDTH(Pa) gives a relative high value |
| Hierarchical layouts | An urban layout is not Hierarchical if ∀ block b ∈ Environment ⟹ PARA(b) gives a relative low value ⋀ NCA(b) gives a relative low value |
© 2017 by the authors. Licensee MDPI, Basel, Switzerland. This article is an open access article distributed under the terms and conditions of the Creative Commons Attribution (CC BY) license (http://creativecommons.org/licenses/by/4.0/).
Share and Cite
MDPI and ACS Style
Silavi, T.; Hakimpour, F.; Claramunt, C.; Nourian, F. The Legibility and Permeability of Cities: Examining the Role of Spatial Data and Metrics. ISPRS Int. J. Geo-Inf. 2017, 6, 101. https://doi.org/10.3390/ijgi6040101
AMA Style
Silavi T, Hakimpour F, Claramunt C, Nourian F. The Legibility and Permeability of Cities: Examining the Role of Spatial Data and Metrics. ISPRS International Journal of Geo-Information. 2017; 6(4):101. https://doi.org/10.3390/ijgi6040101
Chicago/Turabian StyleSilavi, Tolue, Farshad Hakimpour, Christophe Claramunt, and Farshad Nourian. 2017. "The Legibility and Permeability of Cities: Examining the Role of Spatial Data and Metrics" ISPRS International Journal of Geo-Information 6, no. 4: 101. https://doi.org/10.3390/ijgi6040101
Note that from the first issue of 2016, this journal uses article numbers instead of page numbers. See further details here.