
Identifying Witness Accounts from Social Media Using Imagery

Department of Infrastructure Engineering, University of Melbourne, VIC 3010, Australia
*
Author to whom correspondence should be addressed.
ISPRS Int. J. Geo-Inf. 2017, 6(4), 120; https://doi.org/10.3390/ijgi6040120
Submission received: 21 February 2017
/
Revised: 31 March 2017
/
Accepted: 10 April 2017
/
Published: 18 April 2017
Abstract
:This research investigates the use of image category classification to distinguish images posted to social media that are Witness Accounts of an event. Only images depicting observations of the event, captured by micro-bloggers at the event, are considered Witness Accounts. Identifying Witness Accounts from social media is important for services such as news, marketing and emergency response. Automated image category classification is essential due to the large number of images on social media and interest in identifying witnesses in near real time. This paper begins research of this emerging problem with an established procedure, using a bag-of-words method to create a vocabulary of visual words and classifier trained to categorize the encoded images. In order to test the procedure, a set of images were collected for case study events, Australian Football League matches, from Twitter. Evaluation shows an overall accuracy of 90% and precision and recall for both classes exceeding 83%.
1. Introduction
Distinguishing Witness Accounts (WA) of events from social media is of significant interest for applications such as emergency services, marketing and journalism [1]. WA can provide relevant and timely information about an unfolding crisis contributing to improved situation awareness for organizations responsible for response and relief efforts [2]. They can be analyzed for feedback and sentiment related to consumer products or harvested to create event summaries [3]. With their widespread popularity, social networks are a valuable potential source for identifying witnesses [4]. For the purpose of this research, a WA is a micro-blog that contains a direct observation of the event, which may be expressed with text or linked image [5]. Once a WA is identified, the inference that the micro-blogger is a Witness posting from the event, that they are on-the-ground (OTG), is enabled [5]. For example, a micro-blogger at a football match linking to an image of the pre-game banner (see Figure 1) is considered to have posted a WA from OTG.
The human practice of recording events by photography long pre-dates social media. However, since their introduction social media platforms have been rapidly adopted as an information source For example, Journalists utilize social media such as Twitter and Instagram to identify potential witnesses to news-worthy stories [6], and seek permission to publish citizens posts [7]. Images have numerous advantages for communicating observations of events, including the information content of images are considered language independent [8] and images have been described as less subjective than text [9]. In the context of social media, linked images have been suggested as a feature for filtering relevant content for crisis events [10]. This relevance was further qualified for four case studies described by Truelove et al. [11], with more than 50% of WA linking to images containing observations of the event.
A primary motivation to identify features which can distinguish micro-blogs posted from an event, is that only a fraction contain geotags [13]. But even if present, geotags can be unreliable for interpreting the location of the linked image [14]. For example, if a micro-blogger posts an image of the event while journeying home on the train at its conclusion, the geotag will reflect this posting location. Recent research highlights the interest in distinguishing witnesses [6,15] or micro-blogs posted from a region impacted by an event [16]. These studies have focused on the text content of micro-blogs, whereas this paper is focused on the image content linked to micro-blogs. Identifying image-based evidence of witnessing in addition to text-based evidence can enable testing whether in combination they corroborate the categorization of a WA, or are they in conflict [1], and can significantly increase the number of witnesses identified from geotags or text alone [1].
Although a large number of micro-blogs are posted to social media such as Twitter, the number of WA related to an event will be a small fraction of the total posts, diluted even further for events with national or global reach [4,17]. Additionally, images crowdsourced from social media such as Twitter, are stripped of meta-data [18]. These factors indicate a need for an automated procedure for filtering relevant content that utilize visual features derived directly from the image.
In recent years, machine learning methods have shown great promise in scene understanding and image category classification. In particular, the bag-of-words method for image representation has shown interesting results in image category classification [19,20,21]. In this method the algorithm determines which visual features are valuable for the classification rather than human analyst, an expected strength because of the diversity of images that result from crowdsourcing efforts. Image diversity is predicted for many reasons including the subject of crowdsourced images will change as the event progresses, the distance and perspective from the subject will vary, and numerous lens types.
The primary goal motivating the selection of the case study events, Australian Football League (AFL) games, was the need to study events that were broadcast live. Such events test inferences made in previous case studies [5,11], that micro-bloggers are OTG when they post observations of an event. That micro-bloggers can be watching, arguably witnessing the event from some other place via a live broadcast, introduces complexity to the problem of distinguishing WA from OTG [1]. Further motivations are sporting events are a focus for a number of crowdsourcing applications such as the creation of event summaries [3,22,23], and identified as one of the most popular social search topics for regular citizens [24]. Additionally, unfortunately not all crisis events for which authorities need to prepare are of natural causes, for example scheduled mass gatherings have been the target of terrorism acts previously.
The contribution of this paper is to evaluate whether an established procedure for image categorization, the bag-of-words method, can categories images which are WA for the case study events, describing the advancements from preliminary results adopted by Truelove, Vasardani and Winter [1]. This paper questions whether the bag-of-words representation can be learned from a small set of manually labelled images to reliably categorize a larger set of images. Also, this paper questions whether a bag-of-words representation learned from images of one event can be transferred to another instance of the same event type, testing a potential weakness of the method being limitations on the transferability of training models to other event instances. Further contributions include analysis of micro-blogger posting behavior, enabling recommendations for collecting more relevant samples. Finally, a discussion of whether the method proposed for this event type could be generically adopted for other event types is considered. However, experimentation to test the applicability to dissimilar event types is left to future work.
2. Related Work
A picture is worth a thousand words is a proverb which has served as both motivation for early research into Flickr communities evolving during crisis events, and explanation of the enduring quality of images to communicate about events [7]. Research efforts since further articulate the advantages of images, and the challenges to their successful interpretation. The Cross Language Evaluation Forum in Europe (CLEF) benchmark highlighted the language independence of images [14]. Moreau, Servieres, Normand and Magnin [9] suggest people impacted by a crisis have their ability to communicate objectively impaired, and may not have the skills to describe the situation that an expert can derive from an image. In summary, images are less subjective than text [9]. A WA is a direct observation of an event that an image can achieve arguably less ambiguously than text, especially when considering the complexity of events which are broadcast live via television [1]. But as with text sourced from social media there are significant challenges, which have become the focus of numerous research domains to be explored following an introduction to the bag-of-words methodology.
2.1. Image Categorization
Many research efforts focused on multimedia of events have developed case studies from Flickr e.g., [7,25]. The methodologies make use of textual features, such as the Flickr tags and meta-data. More recently image content sourced from Twitter has been the focus e.g., [10,26]. It is important to note that many social media sites such as Twitter, Instagram and Facebook strip meta-data associated with images [18], bringing greater attention to methods which use visual features extracted from the images themselves. It is additionally important to differentiate the source of geotags for research using Flickr imagery, which if extracted from image meta-data will reflect the camera position when the image was captured. If the images are sourced from Twitter the geotags can represent a micro-blogger specified location or more precisely the location of where the micro-blog is posted [27], which will only reflect the camera position at image capture if the micro-blogger hasn’t moved.
The bag-of-words model has been first used for text categorization [28]. Sivic and Zisserman [29] and Csurka, Dance, Fan, Willamowski and Bray [19] applied the bag-of-words method to image retrieval and category classification. Yang, Jiang, Hauptmann and Ngo [21] performed an evaluation of the bag-of-visual-words method in scene classification. They discuss that to choose a suitable vocabulary size one has to trade-off between discriminativity and generalizability. Too small a vocabulary leads to dissimilar features being mapped to the same visual word, and too large a vocabulary leads to similar features being split into different visual words. The bag-of-words approach to image categorization involves a classification step. Different classifiers have been used for image category classification, including Naïve Bayes [19], Support Vector Machine [20] and Random Forest [30]. This research will test a range of vocabulary sizes with several classifiers as is generally recommended, to achieve a satisfactory level of performance for a given classification problem. This research will additionally test the utility of transfer learning to two scenarios which would be greatly beneficial in real-world applications. The first is to seek images which can be categorized as WA in the off-hash dataset, and the second and perhaps more challenging, is to a new event instance.
More recently, varying applications using social media have adopted the bag-of-words method to represent images. For example Cheng et al. [31] discuss classification of images by relevancy to keywords to facilitate social media search. Jing et al. [32] study social media text for prominent words associated with flooding to aid flood image retrieval. And Daly and Thom [33] objective is an image classification model to detect geotagged images for fire event detection and analysis. This research is distinguished primarily by specific focus on the subset of images related to an event topic that can be classified as Witness Accounts, and secondary factors include candidate images are assumed to be stripped of meta-data including geotags, a requirement for Twitter case studies.
2.2. The Needle in the Haystack
Volunteered Geographic Information (VGI) is one research discipline that seeks to identify and leverage the opportunities of regarding citizens as sensors [34]. Local knowledge is researched as a measure to assess the credibility of VGI contributions, with the handling of sparsely populated regions identified as a challenge [34]. Similarly, the number of citizen sensors OTG at events is constrained by the spatial and temporal boundary of the event and its effects. As a result the number of witnesses posting observations can be a fraction of those contributing to the topic on social media. For example, 4.5% of micro-bloggers posting about the Occupy Wall Street protest were defined as OTG [17]. This fraction can be further diluted for events that are broadcast via live television. Long before the internet, live television was recognized and described as a space-adjusting technology [35], in that it enabled people to witness an event without being physically present. This obviously has implications for events that are broadcast live to audiences orders of magnitude greater than the capacity of the venues in which they are held [36], for example sporting events, music concerts, awards and memorial ceremonies, and significant political speeches and debates.
This imbalance is reflected in data samples crowdsourced from these events, and must be handled by any machine learning technique adopted for automation. Unbalanced classes are a fundamental challenge for machine learning with techniques to mitigate their influence evolving [37]. For example Starbird, Grace and Leysia [17] adopt an algorithmic approach, but a sampling approach adopted by Morstatter, Lubold, Pon-Barry, Pfeffer and Liu [16] and Kumar et al. [38] is more common for Twitter case studies. An advantage of considering linked images in comparison to the text content of micro-blogs, is the degree of imbalance is significantly less [1]. Not all micro-blogs have linked content and the proportion of linked images which are then categorized as WA is significantly higher, for example more than 50% of WA for four case studies linked to images categorized as WA [11].
Another separate but related issue is that the dataset must contain an adequate sample for each class that the classifier needs to differentiate. Previous research identified that dominant topics emerged in micro-blog text for each event type, for example seeing or smelling smoke for a bushfire event [5]. For a music concert, a dominant visual topic was additionally identified in the linked image content, being the stage of performance [11]. The stage can be likened to a landmark due to its prominence within the event venue. It was concluded that images with this visual topic could be categorized as a WA, as they constituted observations of the event [11]. In preliminary experiments, the classifier failed to differentiate images categorized by human annotators as not OTG likely due to an inadequate sample number [1]. These were twenty six images that depicted television or computer screens broadcasting the event. This research will seek to establish the number of training samples required to automatically categorize the dominant visual topics through learning curve analysis.
The challenges of unbalanced classes and inadequate sample sizes provide great motivation to leverage all knowledge of Witness posting behavior when sampling social media sources. Previous research has provided clues to behavior, in particular for scheduled events. For a music concert, 70% of WA were categorized as delayed, posted after the event concluded [11]. It is expected that this behavior will be present for all events for which the schedule is known. This assumption will be tested in this research with spatial and temporal analysis of posting behavior.
Previous research has also stated that not all micro-blogs related to an event will contain the promoted hashtag [39]. Suggested reasons include micro-bloggers might not be aware of the hashtag, or in the case of an unscheduled event, only become aware of the hashtag as the event progresses [39]. Additionally, an initial post may contain the hashtag, but follow-up conversations between micro-bloggers typically will not [40]. From this background research, it is predicted that images of the dominant visual topic for events will also be linked to micro-blogs which are off-the-hashtag or off-hash. Motivated again by the challenges of unbalanced classes and inadequate samples already described, this research will additionally seek evidence in off-hash micro-blogs. Off-hash datasets will be created by searching the history of micro-bloggers who have already posted on the promoted hash-tag during the event.
2.3. Observation and Spatial Temporal Context
Key to the definition of a WA is that it contains a direct observation of the event [5]. From a direct observation, a relationship can be inferred between the micro-blogger and time and place of the event. Distinguishing images which are WA can be related to place recognition in images [14] because events can occur in prominent places or landmarks, however, the problem of identifying WA requires additional criteria be distinguished. For example, in addition to the place of the event being recognized, the method must distinguish sub-categories of images which qualify as a WA from those which do not. For example, images of the event originating from the mainstream broadcast media are often retweeted in significant numbers, and do not qualify as WA, neither do application screenshots and images of the event on television or computer screens [5]. Conversely, many event types do not occur in prominent landmarks or urban areas, which may diminish the applicability of place recognition techniques to the problem of identifying WA.
The complexity of locating places in images is recognized as a continuing challenge by communities such as the MediaEval Benchmark Placing Task [14]. Looking to future challenges and directions for the community it has been noted that the “…relationship between the visual content of an image and the location at which the images was taken is often a weak one” (p. 8). Motivations towards this statement include the generic and location independent nature of many features, images taken at the same location can differ dependent on the camera or type of photograph, and the question of what do geotags represent [14]. When landmarks are absent and these challenges are present, the approach is to assign a place label at a hierarchy to reflect this uncertainty, for example a city, country or continent. For example, recent research assigned street level hierarchies to 3.6% of images, 10.1% to city level, 28.4% to country level and 48.0% the hierarchy of continent [41]. These hierarchies largely exceed the scale which reflect human observation [42] and therefore cannot contribute towards differentiating WA, however, are complimentary if they enable filtering of micro-bloggers who cannot be witnesses due to their likely location.
In addition to direct observations of events, further communication topics of potential witnesses have been described [11]. Potential witnesses can turn their focus inwards on themselves during an event and describe how they are impacted or perhaps more fundamentally, explicitly describe their spatial and temporal proximity to an event, for example that they are at a concert [5]. Whether there is an equivalent visual representation, is still open to question. In a previous case study of a music concert, a significant number of WA with views of the stage, could also be categorized as self-portraits (selfies [43]) or group portraits [11]. This prompted the discussion of whether the micro-bloggers who posted them were effectively communicating I/we are at this event [11]. Foundation research does appear to suggest the possibility, with posting to social media described as purposeful, highly curative and performative [44]. Regardless, if selfies are found to be an enduring characteristic of WA for certain types of events, this may pose additional challenges for machine learning which this research will explore.
2.4. Filtering Copied, Faked and Misleading Images
A prerequisite for an WA is that it contains original content [5]. For Twitter, micro-blogs which have been forwarded or retweeted, can be distinguished by utilizing the convention to include the text RT [45]. However, a convention doesn’t exist for the linked content that may be included. It is common that images will be copied and linked from the micro-bloggers own account rather than using the source URL [5]. Therefore, methods may be required to distinguish unoriginal source from visual features of the image itself. Steiner et al. [46] and Layek et al. [47] describe methods for identifying unoriginal images, for example images which have been cropped, or include a brand overlay added by broadcast media.
Another fundamental prerequisite for an image to be classified as an observation is that it depicts a real-world scene. Filtering for this concept could eliminate the significant number of unoriginal images that can be forwarded related to events. For example, during crisis events such as cyclones individuals will copy and post maps showing the trajectory and satellite imagery for its size [11]. ImageCLEF is an image annotation and concept-based retrieval task with visual concepts provided in an ontology, including scene concepts [48]. Many of the concepts are aligned with observational characteristics of WA, and therefore, may support filtering of the dataset for images that meet the criteria. Or as in the scenarios described, eliminate those which cannot be WA.
A feared challenge of crowdsourced information is the potential for misinformation, a spectrum from unintentionally ambiguous content to the intentional posting of fake rumors [49]. Gupta, Lamba, Kumaraguru and Joshi [26] tracked the propagation of fake images on Twitter during Hurricane Sandy (2012), a crisis event that impacted large areas of the Eastern USA, identifying 10,350 unique tweets containing fake images of which 86% were retweets. Using a Decision Tree classifier to categorize the fake images, a 97% accuracy was achieved with features derived from the text content of the micro-blogs [26]. In essence, only a fraction of micro-blogs with fake images were original, and not able to be filtered using text content features. The Verifying Multimedia Use task at MediaEval continues the work focused on confirming the veracity of multimedia content [50].
This research will seek to establish whether the bag-of-words approach adopted for experiments will successfully classify non-original content. Or will additional filtering techniques, such as those proposed by Steiner, Verborgh, Gabarro, Mannens and Van de Walle [46] to identify overlays added by television networks, or those developed by the ImageCLEF community for the annotation of non-real life scenes be additionally beneficial.
3. Materials and Methods
The fundamental objective of this research is to evaluate the bag-of words method to automatically categorize images which are WA posted to social media. Another objective is to evaluate transfer learning from a model devised from a training dataset to automatically categorize WA in other datasets, both the off-hash dataset for the same event, and a new similar event. Two Twitter case studies, AFL matches played five months apart at the Melbourne Cricket Ground (MCG), were collected to provide the data for the experiments. The first event was used to evaluate the bag-of-words method and to investigate whether a satisfactory classification can be achieved by learning the classifier from a small subset of the samples. The second event was used to test whether a bag-of-words model learned from one event can be transferred to another similar event. Each image was manually analyzed and categorized by human annotators to create the training datasets, and support detailed characterization of the categories of images contributing to misclassification. Witness posting behavior was analyzed from those images identified as WA, and in comparison to others in the dataset. This section details the methodology implemented to complete each experiment, including details on the creation of the case study datasets.
3.1. Events Description
A summary description of the case study events is presented in Table 1. The ANZAC Day (an Australian national holiday [51]) match typically records the highest attendance outside the Final Series. The Grand Final is the culmination of the season, celebrated and viewed by fans regardless of which club they support.
3.2. Data Collection
A number of considerations motivated the data collection methodology, including Twitter API rate limiting [55] and the reduction in the completeness of search results over time [56]. Therefore, any prior knowledge is leveraged to target the most relevant samples in a short space of time, including the fundamental inferential prerequisites of WA which are that they contain original content, on the topic of the event, and are posted by individuals [5]. Image content meeting this criteria are typically posted to Twitter or other social media such as Instagram. Additionally, previous case studies suggest witnesses do not limit their posting about the event to during the event [11].
The method to collect the datasets for the two case studies was completed in stages. The first stage was collecting a sample of on-topic micro-blogs with hashtags promoted by the AFL. The Twitter Streaming API [57] and Twitter Data Analytics software tools [58] where utilized to complete this task in real-time. Within one-hour of the event finishing the sample of on-topic micro-blogs was then used to establish a sample of micro-bloggers who had likely posted original content. For the ANZAC Day match the filter for micro-bloggers was set at one original micro-blog posted between 7:00 and 18:30. More restrictive sampling was required for the Grand Final match, a much larger dataset. Micro-bloggers were sampled to those identified to have posted two original micro-blogs within a more constrained temporal period, from 11:00 until 18:00. A list of pre-determined non-individuals were additionally removed from the micro-blogger samples at this stage, including media outlets, gambling companies, the AFL clubs and administration, and the venue. All these non-individuals can be identified from their Twitter application user handles.
Using the micro-bloggers identified in the previous stage, the Twitter Search API [56] and Twitter Data Analytics software tools [58] were used to collect all posting history for the day of the event. All micro-blogs which are identifiable as copied content, including those using the retweet convention are removed from the sample, as they cannot support inferences as to the location of the micro-blogger. The remaining micro-blogs are separated, those containing the promoted hashtag became the on-hash datasets, and the remainder the off-hash datasets for each event. Differing temporal constraints where applied to these datasets, based on when the gates opened at the venue for the different matches. These datasets are summarized in Table 2.
The final stage is to collect images linked to micro-blogs posted from Twitter or Instagram. Eliminating retweets has the effect of removing a large number of the copied images, however, they will remain linked from micro-blogs with original text. If the micro-blogger maintains the link to the original image by posting the original URL, this can be identified in Twitter by testing the micro-blogs meta-data. However, if the micro-blogger copies the image and links from their own account, a copy cannot be identified. The reader is reminded that all meta-data for the image itself is stripped by many social networks. In summary, where it is possible to identify copied image content from the micro-blog content and meta-data this is completed.
3.3. Training Data Creation
Preliminary annotation of the visual topics in the ADon dataset was completed by a single expert user, a method previously tested with multiple annotators with acceptable agreement [5]. The purpose was to describe the visual topics, and their sample sizes, to identify those estimated in sufficient numbers for the bag of words method. The process was to manually inspect and document the dominant visual features in each image, including those that are observations of the event, and determine categories based on these features. Each visual topic category was then analyzed as to whether they provide evidence that supports the inference the micro-blogger was OTG at the event, or counter-evidence that supports the inference the micro-blogger was not OTG at the event, or alternatively the visual topic category provides no evidence (NE) [1]. Finally the visual topic categories that represent WA OTG are decided, and annotation is completed by two independent annotators to create the training data for the binary classification. Each image in the training datasets is categorized in two classes, WA OTG or other. Each annotator can be described as an expert in the domain, both having attended AFL matches at the MCG, and watched live television broadcasts. During this process, the annotators also check if any identical copies of images remained in the dataset following pre-processing.
3.4. Posting Behaviour: Temporal and Spatial Analysis
An analysis of posting behavior for the AFon and GFon datasets, includes a comparison of when micro-blogs were posted compared (using the timestamp) to the known schedule of the event. This enabled a temporal categorization of images labelled as WA relative to the progress of the event. Additionally, images linked to micro-blogs with geotags were visualized on a map. Though the number of micro-blogs with geotags was limited, in combination with the images visual topic and temporal category their meaning was explained.
3.5. Image Categorization by Bag-of-Words
The general workflow of the bag-of-words approach for categorizing WA presented in Figure 2 consists of the following steps (supported by Matlab software):
- Extracting local image features.
- Constructing a vocabulary of visual words.
- Training a classifier using the vocabulary and a set of training images.
- Evaluating the classifier on a set of test images.
3.5.1. Extracting Local Image Features
Local image features describe the characteristics of small image regions. A number of methods are available for detecting and describing local image features. We use Speeded Up Robust Features (SURF) [59] to detect image keypoints and compute their descriptors. An alternative is to define image patches on a regular grid, and compute the SURF descriptor for each patch. This latter approach is more suitable for images that do not have many distinct local features. Each SURF descriptor is a vector of length n describing the magnitude and orientation of gradients in a small neighborhood around the keypoint. For efficiency in all our experiments we choose n = 64. This empirically configured value is selected to balance between distinctiveness and computation time. Larger values of n may result in more distinctive descriptors but will also increase the computation time of feature extraction.
3.5.2. Vocabulary Construction
A vocabulary is defined by finding clusters in the 64-dimensional space formed by all local descriptors of all images. The clusters are found by a k-means clustering algorithm, with unsupervised seeding, with a predetermined number of clusters k. Each cluster center is the mean of a number of similar local descriptors, and can be interpreted as a visual word containing local information that may be found in many images.
The choice of the number of visual words k in the vocabulary has an influence on the outcome of the image category classification. As mentioned in Section 2, there is no rule for choosing the number of words, and an appropriate choice is often made by evaluating the classification performance against varying number of words.
3.5.3. Classifier Training and Evaluation
Once the vocabulary is constructed, each image can be represented by a histogram of word frequencies. This is simply done by counting for each cluster the number of member descriptors that are present in the image. The histogram representation results in a compact encoding of the image into a single feature vector of length k.
With every image represented by a feature vector, a classifier can be learned from a set of labelled images. For the identification of WA we consider two categories of images, either confirming or not confirming the poster being present at the event. With a set of training images for each category a binary classifier is trained, a linear SVM is selected as a baseline, and the classification performance is evaluated using a set of labelled test images. The evaluation is based on overall accuracy defined as the ratio of correctly classified images to the total number of images. Similarly, the classification error is defined as the ratio of misclassified images to the total number of images.
In addition to Matlab software, WEKA [60] is utilized for the classification tasks.
3.5.4. Practical Considerations
In essence, the bag-of-words method for identifying WA involves a supervised classification, requiring a human annotator to manually assign labels to a set of training images. In practice, we would like to eliminate or minimize the level of manual interaction. Two scenarios to minimize the manual labelling in the bag-of-words framework investigated are the following:
- Training a classifier with the labelled images of one event, and applying it to the images of other similar events. In machine learning this is usually referred to as transfer learning [63]. A representative approach to transfer learning is adopted in this research.
4. Results
This results section presents the outcomes for the experiments described, include a description of the datasets, followed by an analysis of posting behaviors and finally the classification results including an analysis of misclassified images.
4.1. Datasets
Table 3 presents a summary of the datasets used for the experiments. The number of micro-blogs is the result of the filtering process, that is the number of micro-blogs remaining after non-individuals and retweets are eliminated. The number of micro-blogs which contain URL links to Twitter and Instagram images are then identified. The number of URLs processed is higher than the number of micro-blogs, because a micro-blog may contain more than one URL link to images. And the number of images in the final dataset is less because when the micro-blogger has copied an image by linking to the original URL in Twitter, it can be identified and eliminated. These figures demonstrate that a significant number of micro-blogs can be eliminated prior to the machine learning phase because they can be identified as non-original content.
4.2. Training Data Categorization
Table 4 presents a summary description of the dominant visual topics identified in the ADon dataset. Each topic is further categorized as to whether they contain a direct observation of the event or place of the event, which can be interpreted as evidence supporting the inference the micro-blogger is OTG. The two other categories are No Evidence (NE) where no inference can be made, and not OTG, where the visual topic supports the inference the micro-blogger is not physically at the event [1]. The visual topic categories which are considered WA OTG are those which capture both the exterior of the MCG and the arena within. However, only those showing the MCG arena (see Figure 3a), are a sufficient sample size to support the bag-of-visual word approach adopted in this research, and therefore, are the visual topic category referred to as WA OTG in the training datasets for the remainder of this paper.
Figure 3b presents an example of an image which includes a screen with the broadcast of the event, which supports inference the micro-blogger is not OTG. However the same inference cannot be made for screenshots captured and posted from mobile devices, because these actions are possible at any location. Two additional categories with significant numbers which are considered to provide NE, are media photography, an example of which is provided in Figure 3c, and non real-life scenes. However unlike non real-life scenes, media photography shares visual characteristics with WA OTG, compare Figure 3c and Figure 3a.
Adopting the visual topic of the MCG arena as a representation of WA OTG, two annotators completed independent coding to label the training datasets. The training datasets categorize the images as either WA OTG or other, that is all other visual topic categories identified. A summary of the number of images categorized as WA OTG by the annotators are presented in Table 5. The Cohens Kappa for annotator agreement exceeded 0.95 for each dataset, suggesting validation of the approach by defining visual topics. An unexpected result is that the number of WA OTG for the GFon was significantly less than the number of WA OTG for the ADon, as the potential witnesses were in similar numbers (see Table 1). In fact, a greater number of WA OTG for the GFon would not surprise, due to the profile of the event in the community. The likely explanation is the more restrictive micro-blogger sampling procedure adopted during data collection. During the annotation process, no fake or intentionally misleading images, or identical images missed during pre-processing, were identified for either dataset.
4.3. Posting Behavior: Temporal and Spatial Analysis
Figure 4 and Figure 5 present a comparison of posting time for images categorized WA OTG for the ADon and GFon datasets respectively, and support a number of conclusions regarding temporal posting behavior. Firstly, a significantly different pattern of posting, comparing WA OTG with other categories for the ADon dataset, is not revealed in Figure 4. Therefore, temporal posting behavior is unlikely to be a feature contributing towards image category classification. Secondly, the pattern of posting for the other categories in Figure 4, appear similar when using the temporal milestones for the events. This suggests that the temporal patterns of posting identified in these case studies are likely to persist for other event instances of this type. Finally, the significantly lower number of WA OTG images for GFon compared to the ADon identified in Table 5, appear to be limited to during and post-match time, whereas, very similar total numbers are recorded pre-match.
Although present in limited numbers, micro-blogs posted with geotags were used to investigate both posting behavior and assumptions on what geotags represent. Figure 6 presents a comparison of the images categorized as WA OTG versus other categories, showing four images categorized as WA OTG at locations outside the MCG. One of these images can be explained by delayed posting (located on Wellington Parade at the top of the map). The other three images presented in Figure 7 are assumed to be due to GPS inaccuracy with (a) posted during the game and (b) and (c) posted during the pre-game entertainment. Although the MCG is an open-air stadium, some of the seating is positioned undercover and thus deprived of GPS signals. Another interesting observation supported by Figure 6 is that images that were not categorized as WA OTG are posted from the MCG prior and during the match. Closer analysis of these images reveals selfies zoomed in so the arena couldn’t be detected in the background and media photography. This highlights that only when evidence to support an inference is detected, can witnesses can be differentiated from image content.
4.4. Baseline Classifier Performance
For the ADon training set, a baseline classifier was designed. All images labelled WA OTG by the annotators were included, regardless of diversity due to subject variation, distance to subject, or perspective for example. All images were first resized to 500 × 500 pixels, and from each image SURF descriptors were extracted on a grid of eight pixel intervals. A vocabulary of 200 visual words was constructed from these local descriptors. A linear SVM classifier was trained and evaluated using a 5-fold cross validation, which means in each fold 228 images (80% of the total) were used for training and 57 images (20%) for testing. Table 6 presents the mean of the five tests.
4.5. Effect of Number of Words
The SVM classifier was evaluated with different vocabulary sizes, to study the impact of the number of words. The average result for five tests with each vocabulary size is presented in Figure 8. The analysis of variance (ANOVA) of the results with number of words ranging from 200 to 800 indicates that the differences in performance of the classifier are not statistically significant. In the following experiments the vocabulary size was set to 200 since differences in classification error between vocabulary sizes were not significant and to reduce computation time.
4.6. Comparison of Classifiers
Table 7 presents results comparing classifiers for the ADon dataset with a vocabulary of 200 words, using 5-fold cross validation, which suggests that the SVM classifier is the most suitable for categorizing the images. The Weka software with default classifier configurations was utilised for this experiment [60]. The Weka J48, a C4.5 decision tree learner, was selected for the Decision Tree algorithm, and SMO, a sequential minimal optimization algorithm was selected for the SVM algorithm [60].
4.7. Learning Curve Analysis
To investigate whether the linear SVM classifier can be sufficiently trained with a relatively small subset of the training images the learning curve of the classifier was analysed. Figure 9 presents the mean training and test errors (of 5 experiments) for the linear SVM trained with different numbers of training images. It can be seen that the training and test errors converge when approximately 50 training images are used, indicating that the classifier can be sufficiently trained with less than 20% of the images in the dataset. The important implication of this result is that for large datasets the bag-of-words method can provide a high level of automation as it requires manual interaction for labelling only a relatively small set of training images.
4.8. Transfer Learning
To investigate the utility of transfer learning, a linear SVM classifier was trained with all images from the ADon dataset, and tested on the ADoff, GFon and GFoff datasets. The summary overall accuracy results of the experiments are presented in Figure 10. The analysis of variance (ANOVA) of the accuracy results in Figure 10 with number of words ranging from 200 to 800 indicates that the differences in performance of the classifier are not statistically significant. The results in Figure 10 suggest that transfer learning from one event instance to another, and from on-hash datasets to off-hash datasets, has application for the event type. However, further statistics are required to qualify these results for the unbalanced datasets.
The recall and precision results for the target class WA OTG are presented in Figure 11 and Figure 12 respectively. The recall values are acceptable; however, the precisions are low for ADoff, GFon and GFoff significantly influenced by class imbalance. The category of WA OTG is the minority class in all the datasets developed for this research. However, the training ADon dataset is relatively balanced with 34% of images categorized as WA OTG compared to the ADoff, GFon and GFoff datasets (4%, 8% and 1% respectively). Therefore, in comparison to the ADon dataset, the influence of false positives on the results for ADoff, GFon and GFoff is greater. For the application of differentiating WA this needs to be reduced. Methods predicted to reduce class imbalance, such as removal of images that do not contain real life scenes are detailed further in the discussion section. Additionally, a misclassification analysis facilitates the assessment of the contribution of the bag-of-words method towards these transfer learning results.
4.9. Misclassification Analysis
An in-depth analysis of misclassification has been undertaken to identify potential improvements for future work. False positives indicate the classifier has assigned an image to the WA OTG category contrary to the assigned training label, and false negatives indicate the classifier has assigned an image to the other category contrary to the assigned training label. Before the transfer learning misclassifications are investigated, the training error for ADon will be described as this impacts all further tests. The results for experiments with a vocabulary of 400 words are chosen for comparison.
Ten false negatives resulted from the experiment with 400 words, for the ADon dataset (see Figure 13 for examples). Two visual topics, selfies or portraits and close-ups of the scoreboard, contributed to seven of these false negatives. The selfies share characteristics with selfies at other indeterminate places and the scoreboard images do not contain the green of the ground or the sky. For the remaining three images it is estimated the type of image contributes to its misclassification, they are panorama shots with significant distortion which results from being resized to 500 square pixels during pre-processing. The nine false positives for the ADon dataset are dominated by seven images of screens relaying a broadcast of the event (see Figure 14a for an example). In these images, the outline of the screen is not always in the frame.
False positives for the test ADoff dataset shared characteristics with those resulting from the training ADon dataset already described. However, two additional misclassification issues can be identified. The first issue is images containing statistics and close ups of inanimate objects were classified as WA OTG. It is estimated these have resulted because the diversity of visual topics in the off-hash dataset was not adequately represented in the training ADon dataset. The second issue is twelve images relating to different football events, at different venues, are classified as WA OTG. Although no other AFL games are scheduled to overlap with the ANZAC Day case study event, there were games preceding and following on the same day. The false negative errors for the GFon dataset indicate that the transfer learning to this similar event is less reliable. The visual topics of the misclassified images again reflect the training error of the ADon dataset, with selfies, close-ups of the scoreboard and panorama shots represented. However, additionally there are five images which cannot be classified into these topics. It is therefore estimated, that these misclassifications are due to issues with transfer learning to this new event instance. Visually, the events differ in a number of human identifiable ways, for example the weather conditions and team colors. Based on this assumption, the same unreliability would be expected for false negatives for GFoff, but significant conclusions are not supported by this dataset with only nine images categorized as WA OTG. Very similar topics emerged for GFon and GFoff false positives as already described for the ADoff dataset.
5. Discussion
This research confirms that only a fraction of micro-bloggers posting about an event can be described as witnesses OTG, and that imbalance is further compounded for events that are broadcast live through a variety of mediums. The ANZAC Day and Grand Final AFL matches had relatively similar size audiences OTG, but the Grand Final had a significantly greater broadcast audience (see Table 1). It was predicted that the number of WA OTG for the Grand Final would be similar or exceed that held on ANZAC Day, however, this was not the result with 54 images detected versus 97 images. It is concluded this result was unlikely due to varying audience characteristics but due to differences in sampling. For the Grand Final micro-bloggers were sampled to those who had posted two original micro-blogs rather than one which was the criteria for the ANZAC Day game. This result suggests that witnesses are situated in the long-tail, and a significant number will only post one original micro-blog about an event they are attending. This finding should be assumed generic to all events. A difference in temporal sampling criteria is also likely to have contributed, with confirmation that witnesses OTG are just as likely to post before the event during the pre-match entertainment, as during the main attraction. Therefore, it is recommended, the optimal temporal extents to sample for WA OTG is from the earliest time witnesses have access to the venue, including queuing outside, until they have travelled home. For the Grand Final, with extended access to the venue and extended pre and post-game entertainment, the sampling time did not encompass the full temporal extents now recommended.
Temporal posting behavior was additionally analyzed for varying patterns between WA OTG and other categories, which could be developed as features to assist machine learning. However, it was found that though the volume of micro-blogs categorized as WA OTG varied significantly from other image categories, their temporal posting pattern did not. As the temporal pattern of posting was comparable between both case studies, it is suggested that the posting behavior in these case studies can be assumed for other scheduled event types.
The mapped locations of images with geotags enabled analysis of the relationship between these content sources, despite limited numbers. The analysis demonstrated that not all images located at the MCG were categorized as WA OTG, and images categorized as WA OTG were posted from locations outside the venue. The implications of these findings for all event research, is that humans post about topics beyond their immediate spatial and temporal context, even while participating in events. The geotag, and what witnessing inferences it support need careful consideration, and will vary dependent on the spatial and temporal extents of the event and its effects. For example, a geotag at the dedicated venue posted during the event is strong evidence supporting the inference the micro-blogger is a Witness even if observations are absent. However, for an event affecting a large geographic area, the inference of witnessing from a geotag is less certain.
To support all experiments a definition of images which could be classified as WA OTG was described. For each image in the ADon dataset, the dominant visual topic was identified and categorized, and observations of the event included views of the venue, both of the arena and the exterior. However, only those inside the arena were estimated in sufficient numbers required to support the bag-of-words methodology, and adopted to represent the category WA OTG. This limitation is present for all machine learning approaches and the number of samples required depends on numerous factors, for example the number of classes, the number and proportion of samples in each class, and the number of features representing each sample. The implications of minimum sample requirements for classifying images which are WA, is that dominant visual observation topics must emerge for each event. A learning curve experiment was completed for the case study finding the training and test error converged at approximately 50 images. This number provides guidance as to sample sizes required for similar events and datasets. Additionally, it provides guidance as to the sample of manually annotated images that are required to create a training model to automate subsequent image categorization.
Another methodology to minimize manual human annotation is transfer learning, with the results indicating the potential of this method for the application. But further analysis of misclassified images indicates areas where improvements are required, in particular to reduce the number of false positives. Even a false positive error as low as 0.05 may not be sufficient, as a comparable number of true positives may result, due to the relative size of the classes in the datasets. Recommendations to reduce the impact of this scenario include increased filtering to improve the representation of the WA OTG class in unbalanced datasets, experimentation with classifiers developed specifically for unbalanced datasets, and improved representation of the categories in the training dataset. The misclassification analysis confirmed scenarios where additional filtering would be beneficial. Techniques that could identify non-real world scenes for removal [76] would contribute to reducing the unbalance in the datasets classes, and reduce false positive error. Such techniques are likely to contribute to a variety of event types, as evidenced by previous case studies [11]. Identification and removal of images with overlays placed by broadcasters and mobile applications [46], would contribute similarly to event types which are broadcast live. A particular issue identified in the ADoff dataset, was the misclassification of images posted about similar events, other football matches scheduled on the same day. A less sophisticated but equally effective way to identify these images for removal is to search for the promoted hashtag of these other games.
The misclassification analysis also identified sub-categories of WA OTG that were overrepresented in the false negatives. For the training datasets, all images which were identified by a human annotator as being of the arena at the MCG were included in the category WA OTG. But as the false negative results in Figure 13 indicate, sub-categories such as selfies and close-ups of the scoreboard are more likely to be misclassified. A simple solution would be to eliminate non-typical samples such as scoreboard close-ups. However, the implications of this action for each case should be considered. For example the topic of selfies or portraits is more complex. The results for the ADon dataset suggest a linked selfie or portrait does not provide strong evidence that the micro-blogger is a Witness to that event, with 40 selfies or portraits at indeterminate locations compared to eight identified as at the MCG. Additionally, the appearance of portraits and selfies in the off-hash datasets indicates they are an enduring characteristic well represented in social media in general. Therefore, an application may choose to eliminate them from training datasets representing WA, or ensure they are adequately represented and visually distinguishable from selfies generally.
Media photography was not represented in the false positives to the degree expected, suggesting that this category of images were both visually distinctive and adequately represented in the training datasets. In comparison, images of a screen relaying the broadcast did prove problematic. Previous research indicated that the sample for the single dataset ADon was not adequate to represent this class [1]. An approach that may provide improvements is to increase the number of samples by combining those collected for multiple event instances. Essentially, the recommendation to improve results is to move beyond the constraints of a particular event instance when collecting training samples to optimize category representation.
This approach may also improve results for transfer learning. The false negatives for the GFon dataset suggests misclassifications occurred which cannot be attributed to the training errors, but perhaps overfitting to the ANZAC Day event. To reduce the chance of overfitting to a particular event instance, the training dataset for a real-world application of the methodologies demonstrated in this research, might have images taken from a range of event instances. Additionally, this approach may contribute to an improved representation of the diversity of visual topics in off-hash datasets. Finally, the greatest benefit of this approach may be to support event types for which insufficient sample numbers of the dominant visual observation topics are likely to be present for a single event instance. This scenario may evolve due to the characteristics of the event itself, limited effects which humans can observe or limited human sensors in the place where the event is occurring.
6. Conclusions
Contributions of this research include a comprehensive evaluation of automatic image category classification using the bag-of-words method for case study events, demonstrating it is possible to identify images that are Witness Accounts posted from on-the-ground. A comparison of classifiers showed a linear SVM achieved an overall accuracy of 90% and precision and recall for both classes exceeding 83%. Further, results from learning curve experiments found that identifying Witness Accounts for the case study event was also possible by training the classifier using a relatively small subset of the images. This is a significant finding in the context of social media, as an automatic method is required due to the large number of images posted about events.
Transfer learning experiments identified the potential to identify Witness Accounts for different instances of the same event type with acceptable recall results, however, low precision results indicate a need to further address class imbalance and false positive error particularly for off-hash datasets. Numerous methods to achieve this goal were described for future research including additional pre-classification filtering to enable removal of images without real life scenes, and improving the representation of categories to be classified by combining samples from different event instances. This would also improve the applicability of the approach in this research to be extended from event types held in dedicated venues to those which are not. For many event types an adequate sample of training images capturing the dominant visual observation topics would only be possible by collating images from multiple event instances. Testing this enhancement towards generalization of the method to a range of dissimilar event types from the case study, is left to future research. Additionally, due to the relatively balanced ADon training dataset used for classifier comparison, algorithms designed or adapted for improved performance with unbalanced datasets were not explored. Such classifiers may have proved beneficial alternatives in the transfer learning experiments. Approaches to be considered are hybrid classifiers designed for the task for example RUSBoost [77] or the introduction of a misclassification cost with a SVM classifier an approach adopted by Starbird, Grace and Leysia [17].
The bag-of-words is a relatively simple method for extracting local image features and encoding them into global features for image category classification. In future, we will investigate models for incorporating spatial relationships between words, and the burstiness of word configurations. Another direction for future research is to investigate recent developments in image description by deep convolutional neural networks, which have recently achieved state of the art performance on a range of image categorization tasks.
Further contributions include an analysis of posting behavior that provides recommendations to maximize Witness Accounts in collected samples for scheduled event types held in dedicated venues. These include a significant number of witnesses will only post one original micro-blog about an event, and are just as likely to post before the scheduled start of the event as during the event. These recommendations are critical when Witness Accounts are typically only a fraction of micro-blogs posted particularly if the event is broadcast live through a variety of mediums.
Supplementary Materials
The image data was collected from publicly available social media platforms including Twitter and Instagram using software described in the materials and method section of this paper. The source micro-blogs and corresponding annotation are available [78].
Acknowledgments
This research was supported in part by an Australian Government Research Training Program Scholarship. The publishing costs are self-funded by the authors.
Author Contributions
M. Truelove conceived the experiment under the supervision of S. Winter and M. Vasardani. M. Truelove and K. Khoshelham designed the experiments. M. Truelove collected the data and M. Truelove, S. McLean and K. Khoshelham performed the experiments. M. Truelove wrote the paper with contributions from K. Khoshelham and S. McLean, and supervisory and editorial support from S. Winter, M. Vasardani.
Conflicts of Interest
The authors declare no conflict of interest.
References
- Truelove, M.; Vasardani, M.; Winter, S. Introducing a framework for automatically differentating witness accounts of events from social media. Procceedings of the 3rd Annual Conference of Research@Locate, Melbourne, Australia, 12–14 April 2016; pp. 13–18. [Google Scholar]
- Imran, M.; Castillo, C.; Diaz, F.; Vieweg, S. Processing social media messages in mass emergency: A survey. Comput. Surv. 2015, 47. [Google Scholar] [CrossRef]
- Nichols, J.; Mahmud, J.; Drews, C. Summarizing sporting events using twitter. Procceedings of the 2012 ACM International Conference on Intelligent User Interfaces, Lisbon, Portugal, 14–17 February 2012; pp. 189–198. [Google Scholar]
- Landwehr, P.M.; Carley, K.M. Social media in disaster relief usage patterns, data mining tools, and current research directions. In Data Mining and Knowledge Discovery for Big Data, Studies in Big Data 1; Chu, W.W., Ed.; Springer-Verlag: Berlin, Germany, 2014; pp. 225–257. [Google Scholar]
- Truelove, M.; Vasardani, M.; Winter, S. Towards credibility of micro-blogs: characterising witness accounts. GeoJournal 2015, 80, 339–359. [Google Scholar] [CrossRef]
- Diakopoulos, N.; De Choudhury, M.; Naaman, M. Finding and assessing social media information sources in the context of journalism. Procceedings of the SIGCHI Conference on Human Factors in Computing Systems, Austin, TX, USA, 5–10 May 2012; pp. 2451–2460. [Google Scholar]
- Liu, S.B.; Palen, L.; Sutton, J.; Hughs, A.L.; Vieweg, S. In search of the bigger picture: The emergent role of on-line photo sharing in times of disaster. Procceedings of the 5th International Conference on Information Systems for Crisis Response and Management, Washington, DC, USA, 4–7 May 2008; pp. 140–149. [Google Scholar]
- Nowak, S.; Nagel, K.; Liebetrau, J. MLKD’s participation at the CLEF 2011 photo annotation and concept-based retireval tasks. Procceedings of the CLEF 2011 labs and workshop, notebook papers, Amsterdam, The Netherlands, 19–22 September 2011. [Google Scholar]
- Moreau, G.; Servieres, M.; Normand, J.-M.; Magnin, M. Challenges of image-based crowd-sourcing for situation awareness in disaster management. In Improving Disaster Resilience and Mitigation - IT Means and Tools; Teodorescu, H.-N., Kirschenbaum, A., Cojocaru, S., Bruderlein, C., Eds.; Springer Netherlands: Dordrecht, The Netherlands, 2014; pp. 103–118. [Google Scholar]
- Peters, R.; Porto de Albuquerque, J. Investigating images as indicators for relevant social media messages in disaster management. Procceedings of 12th International Conference on Information Systems for Crisis Response and Management, Palen, Kristiansand, Norway, 24–27 May 2015. [Google Scholar]
- Truelove, M.; Vasardani, M.; Winter, S. Testing a model of witness accounts in social media. Procceedings of the 8th Workshop on Geographic Information Retrieval, Dallas, TX, USA, 4–7 November 2014. [Google Scholar]
- Twitter. Available online: http://t.co/AOZwqSAjhV (accessed on 27 April 2015).
- Cheng, Z.; Caverlee, J.; Lee, K. You are where you tweet: A content-based approach to geo-locating twitter users. Procceedings of the 19th International Conference on Information and Knowledge Management, Toronto, ON, Canada, 26–30 October 2010; pp. 759–768. [Google Scholar]
- Larson, M.; Kelm, P.; Rae, A.; Hauff, C.; Thomee, B.; Trevisiol, M.; Choi, J.; van Laere, O.; Schockaert, S.; Jones, G.J.F.; et al. The benchmark as a research catalyst: charting the progress of geo-prediction for social media. In Multimodel Location Estimation of Videos and Image; Choi, J., Friedland, G., Eds.; Springer International Publishing: Cham, Switzerland, 2015. [Google Scholar]
- Fang, R.; Nourbakhsh, A.; Liu, X.; Shah, S.; Li, Q. Witness identification in twitter. Procceedings of the Fourth International Workshop on Natural Language Processing for Social Media, Austin, TX, USA, 1 November 2016; pp. 65–73. [Google Scholar]
- Morstatter, F.; Lubold, N.; Pon-Barry, H.; Pfeffer, J.; Liu, H. Finding eyewitness tweets during crises. Procceedings of the Workshop on Language Technologies and Computational Social Science, Baltimore, MD, USA, 6 June 2014. [Google Scholar]
- Starbird, K.; Grace, M.; Leysia, P. Learning from the crowd: Collaborative filtering techniques for identifying on-the-ground twitterers during mass disruptions. Procceedings of the 9th International Conference on Information Systems for Crisis Response and Management, Vancouver, BC, Canada, 22–25 April 2012. [Google Scholar]
- Smith, M.; Szongott, C.; Henne, B.; von Voigt, G. Big data privacy issues in public social media. Procceedings of the 6th IEEE International Conference on Digital Ecosystems Technologies(DEST)-Complex Environment Engineering, Campione d’Italia, Italy, 18–20 June 2012; pp. 1–16. [Google Scholar]
- Csurka, G.; Dance, C.; Fan, L.; Willamowski, J.; Bray, C. Visual categorization with bags of keypoints. Procceedings of the Workshop on statistical learning in computer vision, ECCV, Prague, Czech Republic, 10–16 May 2004; pp. 1–22. [Google Scholar]
- Lazebnik, S.; Schmid, C.; Ponce, J. Beyond bags of features: Spatial pyramid matching for recognizing natural scene categories. Procceedings of the 2006 IEEE Computer Society Conference on Computer Vision and Pattern Recognition, New York, NY, USA, 17–22 June 2006; pp. 2169–2178. [Google Scholar]
- Yang, J.; Jiang, Y.-G.; Hauptmann, A.G.; Ngo, C.-W. Evaluating bag-of-visual-words representations in scene classification. In Proceedings of the International Workshop on Workshop on Multimedia Information Retrieval, Augsburg, Germany, 28–29 September 2007; pp. 197–206. [Google Scholar]
- Alonso, O.; Shiells, K. Timelines as Summaries of Popular Scheduled Events. In Proceedings of the 22nd International Conference on World Wide Web, Rio de Janeiro, Brazil, 13–17 May 2013; pp. 1037–1044. [Google Scholar]
- Zhao, S.; Zhong, L.; Wickramasuriya, J.; Vasudevan, V. Human as Real-Time Sensors of Social and Physical Events: A Case Study of Twitter and Sports Games; Technical Report TR0620-2011; Rice University and Motorola Labs: Houston, TX, USA, 2011. [Google Scholar]
- Teevan, J.; Ramage, D.; Morris, M.R. #TwitterSearch: A comparison of microblog search and web search. In Proceedings of the Fourth ACM Internation Conference on Web Search and Data Mining, Hong Kong, China, 9–19 February 2011; pp. 35–44. [Google Scholar]
- Fontugne, R.; Won, Y.; Cho, K.; Fukuda, K. Disasters seen through Flickr cameras. In Proceedings of the Special Workshop on Internet and Disasters, Tokyo, Japan, 6–9 December 2011. [Google Scholar]
- Gupta, A.; Lamba, H.; Kumaraguru, P.; Joshi, A. Faking sandy: Characterizing and identifying fake images on twitter during hurricane sandy. In Proceedings of the 22nd International Conference on World Wide Web, Rio de Janeiro, Brazil, 13–17 May 2013; pp. 729–736. [Google Scholar]
- FAQs about adding location to your Tweets. Available online: https://support.twitter.com/articles/78252# (accessed on 1 April 2015).
- Joachims, T. Text categorization with suport vector machines: Learning with many relevant geatures. In Proceedings of the 10th European Conference on Machine Learning, London, UK, 21–23 April 1998; pp. 137–142. [Google Scholar]
- Sivic, J.; Zisserman, A. Video Google: A text retrieval approach to object matching in videos. In Proceedings of the Ninth IEEE International Conference on Computer Vision, Washington, DC, USA, 13–16 October 2003. [Google Scholar]
- Bosch, A.; Zisserman, A.; Munoz, X. Image classification using random forests and ferns. In Proceedings of the IEEE 11th International Conference on Computer Vision, Rio de Janeiro, Brazil, 14–17 October 2007; pp. 1–8. [Google Scholar]
- Cheng, S.; Fang, J.; Hristidis, V.; Madhyastha, H.V.; Mithun, N.C.; Perkins, D.; Roy-Chowdhury, A.K.; Shahbazi, M.; Tsotras, V.J. OSNI: Searching for needles in a haystack of social network data. In Proceedings of the EDBT 2016: 19th International Conference on Extending Database Technology, Bordeaux, France, 15–16 March 2016; pp. 616–619. [Google Scholar]
- Jing, M.; Scotney, B.W.; Coleman, S.A.; McGinnity, M.T.; Zhang, X.; Kelly, S.; Ahmad, K.; Schlaf, A.; Gründer-Fahrer, S.; Heyer, G. Integration of text and image analysis for flood event image recognition. In Proceedings of the 27th Irish Signals and Systems Conference(ISSC), Derry, Ireland, 21–22 June 2016; pp. 1–6. [Google Scholar]
- Daly, S.; Thom, J.A. Mining and Classifying Image Posts on Social Media to Analyse Fires. In Proceedings of the 13th International Conference on Information Systems for Crisis Response and Management, Rio de Janeiro, Brazil, 22–25 May 2016; pp. 1–14. [Google Scholar]
- Goodchild, M.F. Citizens as sensors: the world of volunteered geography. GeoJournal 2007, 69, 211–221. [Google Scholar] [CrossRef]
- Spencer, J.E.; Thomas, W.L.J. Cultural Geography; John Wiley & Sons, Inc.: Hoboken, NJ, USA, 1969. [Google Scholar]
- Bryant, J.; Raney, A.A. Sports on the Screen. In Media Entertainment: The Psychology of its Appeal; Zillmann, D., Vorderer, P., Eds.; Lawrence Erlbaum Associates: Mahwah, NJ, USA, 2000; pp. 153–174. [Google Scholar]
- Provost, F. Machine learning from imbalanced data sets 101. In Proceedings of the Workshop on Learnig from Imbalanced Data Sets, Austin, TX, USA, 31 July 2000. [Google Scholar]
- Kumar, S.; Hu, X.; Liu, H. A behaviour analytics approach to identifying tweets from crisis regions. In Proceedings of the 25th ACM Conference on Hypertext and Social Media, Santiago, Chile, 1–4 September 2014; pp. 255–260. [Google Scholar]
- Bruns, A.; Burgess, J.; Crawford, K.; Shaw, F. Crisis communication on Twitter in the 2011 South. East. Queensland Floods; ARC Centre of Excellence for Creative Industries and Innovation, Queensland University of Technology: Brisbane City, QLD, Australia, 31 January 2012. [Google Scholar]
- Bruns, A. Social media and journalism during times of crisis. In The Social Media Handbook; Hunsinger, J., Senft, T., Eds.; Routledge: London, UK, 2014; pp. 159–175. [Google Scholar]
- Weyand, T.; Kostrikov, I.; James, P. Planet-Photo geolocation with convolutional neural networks. In Proceedings of the European Conference on Computer Vision, Amsterdam, The Netherlands, 8–16 October 2016; pp. 37–55. [Google Scholar]
- Montello, D.R. Scale and Multiple Psychologies of Space. In Spatial Information Theory a Theoretical Basis for GIS; Frank, A.U., Campari, I., Eds.; Springer: Berlin, Germany, 1993; pp. 312–321. [Google Scholar]
- The Oxford Dictionaries Word of the Year 2013 is ‘selfie’. Available online: http://blog.oxforddictionaries.com/press-release/oxford-dictionaries-word-of-the-year-2013/ (accessed on 20 June 2015).
- Schwartz, R.; Halegoua, G.R. The spatial self: Location-based identity performance on social media. New Media Soc. 2015, 17, 1643–1660. [Google Scholar] [CrossRef]
- Boyd, D.; Golder, S.; Lotan, G. Tweet, tweet, retweet: Conversational aspects of retweeting on twitter. In Proceedings of the 2010 43rd Hawaii International Conference on System Sciences(HICSS), Koloa, HI, USA, 5–8 January 2010; pp. 1–10. [Google Scholar]
- Steiner, T.; Verborgh, R.; Gabarro, J.; Mannens, E.; Van de Walle, R. Clustering media items stemming from multiple social networks. Comput. J. 2015, 58, 1861–1875. [Google Scholar] [CrossRef]
- Layek, A.K.; Gupta, A.; Ghosh, S.; Mandal, S. Fast near-duplicate detection from image streams on online social media during disaster events. In Proceedings of the 2016 IEEE Annual India Conference(INDICON), Bangalore, India, 16–18 December 2016; pp. 1–6. [Google Scholar]
- Nowak, S.; Dunker, P. A consumer photo tagging ontology: concepts and annotations. In Proceedings of the THESEUS/ ImageCLEF Pre-Workshop, Corfu, Greece, 29 Seprember 2009. [Google Scholar]
- Coleman, D.J.; Georgiadou, Y.; Labonte, J. Volunteered Geographic Information: The nature and motivation of produsers. IJSDIR 2009, 4, 332–358. [Google Scholar]
- Boididou, C.; Andreadou, K.; Papadopoulos, S.; Dang-Nguyen, D.-T.; Boato, G.; Riegler, M.; Kompatsiaris, Y. Verifying Multimedia Use at MediaEval 2015. In Proceedings of the Working Notes Procceedings of the MediaEval 2015 Workshop, Wurzen, Germany, 14–15 September 2015. [Google Scholar]
- The Anzac Day Tradition. Available online: https://www.awm.gov.au/commemoration/anzac/anzac-tradition/ (accessed on 12 April 2017).
- Official MCG Attendance Today 26 April 2015. Available online: https://twitter.com/MCG/status/591859347891748865 (accessed on 26 April 2015).
- Official MCG Attendance Today 3 October 2015. Available online: https://twitter.com/MCG/status/650202766330097664 (accessed on 3 October 2015).
- 2015 AFL Ratings. Available online: http://footyindustry.com/files/afl/media/tvratings/2015/2015AFLRatings.png (accessed on 3 April 2016).
- Twitter Developer Documentation API Rate Limits. Available online: https://dev.twitter.com/rest/public/rate-limiting (accessed on 10 January 2015).
- Twitter Developer Documentation The Search API. Available online: https://dev.twitter.com/rest/public/search (accessed on 10 January 2015).
- Twitter Developer Documentation Streaming APIs. Available online: https://dev.twitter.com/streaming/overview (accessed on 10 January 2015).
- Kumar, S.; Morstatter, F.; Liu, H. Twitter Data Analytics; Springer: Berlin, Germany, 2014. [Google Scholar]
- Bay, H.; Ess, A.; Tuytelaars, T.; Gool, L.V. SURF: Speeded up robust features. Comput. Vis. Image Underst. 2008, 110, 346–359. [Google Scholar] [CrossRef]
- Witten, I.H.; Frank, E.; Hall, M.A. Data Mining: Practical Machine Learning Tools and Techniques; Morgan Kaufmann: Burlington, MA, USA, 2011. [Google Scholar]
- Khoshelham, K.; Elberink, O. Role of dimensionality reduction in segment-based classification of damaged building roofs in airborne Laser scanning data. In Proceedings of the International Conference on Geographic Object Based Image Analysis, Rio de Janeiro, Brazil, 7–9 May 2012; pp. 372–377. [Google Scholar]
- Khoshelham, K.; Elberink, O. Segment-Based classification of damaged building roofs in aerial laser scanning data. Geosci. Remote Sens. Lett. 2013, 10, 1258–1262. [Google Scholar] [CrossRef]
- Pan, S.J.; Yang, Q. A survey on transfer learning. IEEE Trans. Knowl. Data Eng. 2010, 22, 1345–1359. [Google Scholar] [CrossRef]
- Twitter. Available online: http://t.co/VO99f3ouqe (accessed on 27 April 2015).
- Twitter. Available online: http://t.co/8Teuwg6PjG (accessed on 27 April 2015).
- Twitter. Available online: http://t.co/NV400G2cte (accessed on 27 April 2015).
- Twitter. Available online: http://t.co/K13r0YhmW1 (accessed on 27 April 2015).
- Twitter. Available online: http://t.co/omt8wVfMNv (accessed on 5 October 2015).
- Twitter. Available online: http://t.co/YyDaPfJACt (accessed on 5 October 2015).
- Twitter. Available online: http://t.co/2o63tGs02L (accessed on 27 April 2015).
- Instagram. Available online: https://www.instagram.com/p/14p8xCKa0-/ (accessed on 27 April 2015).
- Twitter. Available online: http://t.co/aHd2LyBGNF (accessed on 27 April 2015).
- Twitter. Available online: http://t.co/6UgWd8coZB (accessed on 27 April 2015).
- Twitter. Available online: http://t.co/DTlPmSdFYJ (accessed on 27 April 2015).
- Twitter. Available online: http://t.co/QMba44Hu4W (accessed on 27 April 2015).
- Nowak, S.; Dunker, P. Overview of the CLEF 2009 large-Scale visual concept detection and annotation task. In Lecture Notes in Computer Science (LNCS); Springer-Verlag: Berlin, Germany, 2009; pp. 94–109. [Google Scholar]
- Seiffert, C.; Khoshgoftaar, T.M.; Hulse, J.V.; Napolitano, A. RUSBoost: A hybrid approach to alleviating class imbalance. IEEE Trans. Syst. Man Cybern. 2010, 40, 185–197. [Google Scholar] [CrossRef]
- Image WA Data Package. Available online: http://people.eng.unimelb.edu.au/winter/ImageWA_DataPackage_12April2017.zip (accessed on 12 April 2017).
Figure 1.
Example micro-blog with linked image categorized as a (WA) [12].
Figure 1.
Example micro-blog with linked image categorized as a (WA) [12].
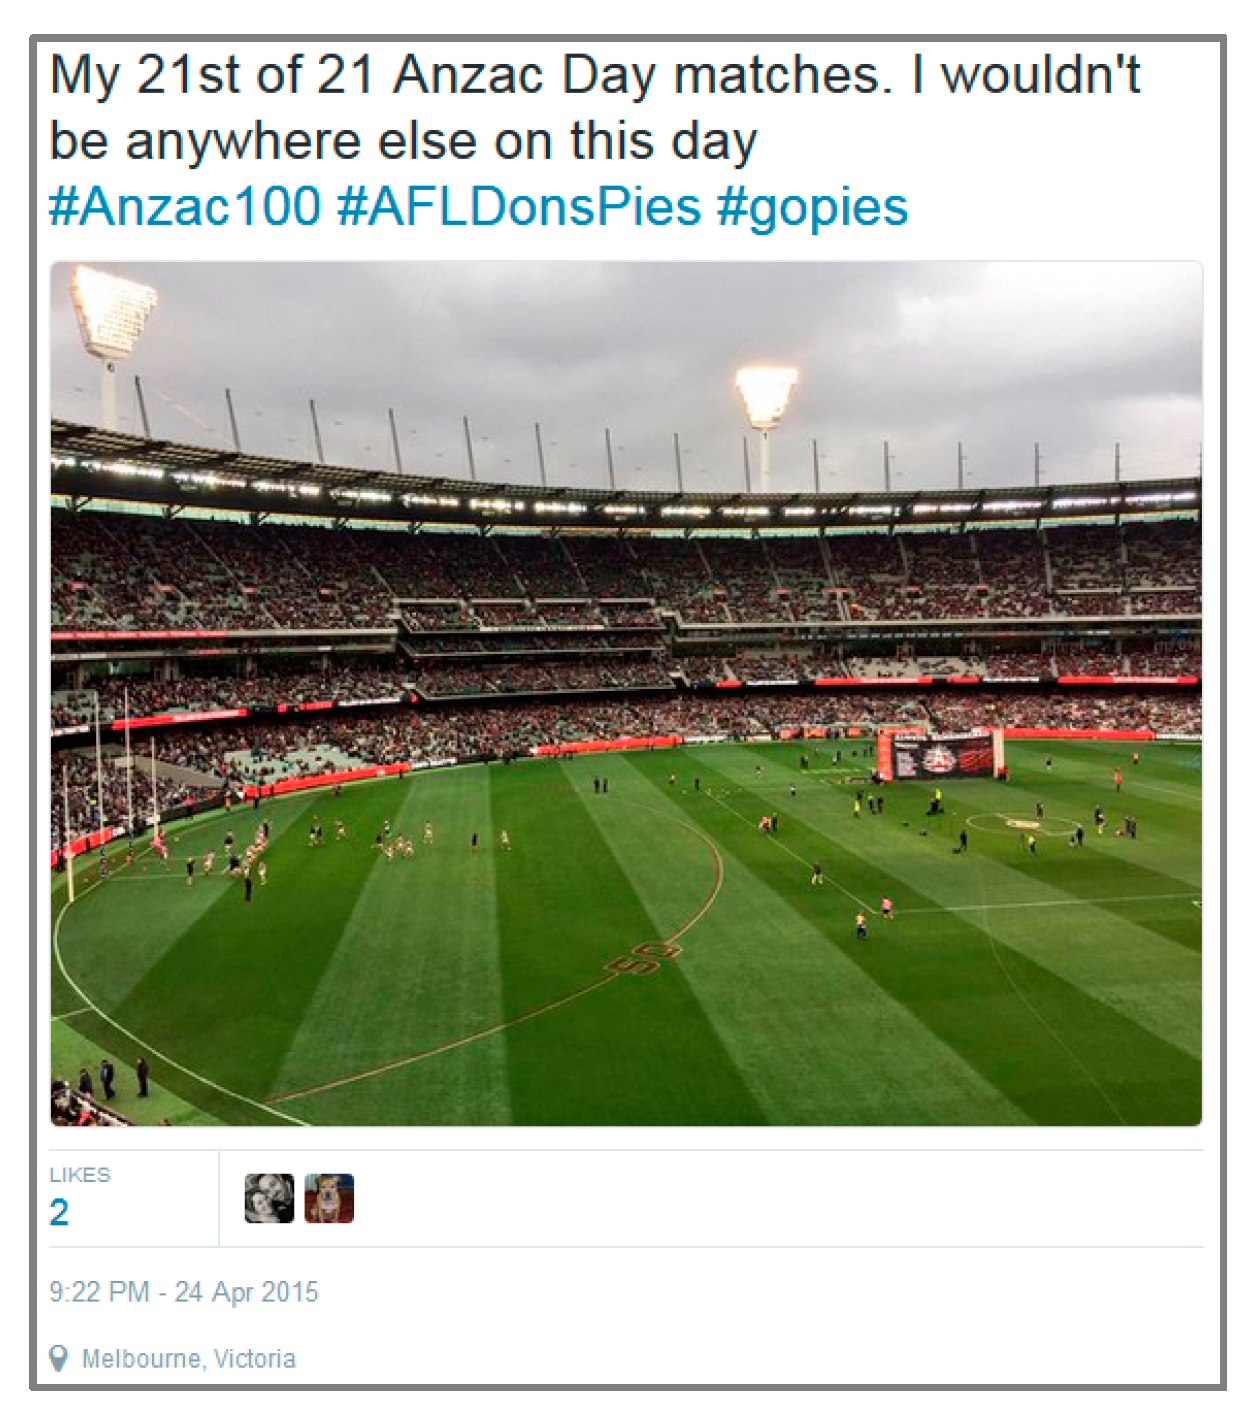
Figure 2.
Workflow for the bag-of-words approach for categorizing WA.

Figure 3.
Examples of images categorized as (a) the MCG arena or WA OTG [64] (b) a screen relaying broadcast [65] and (c) media photography [66].
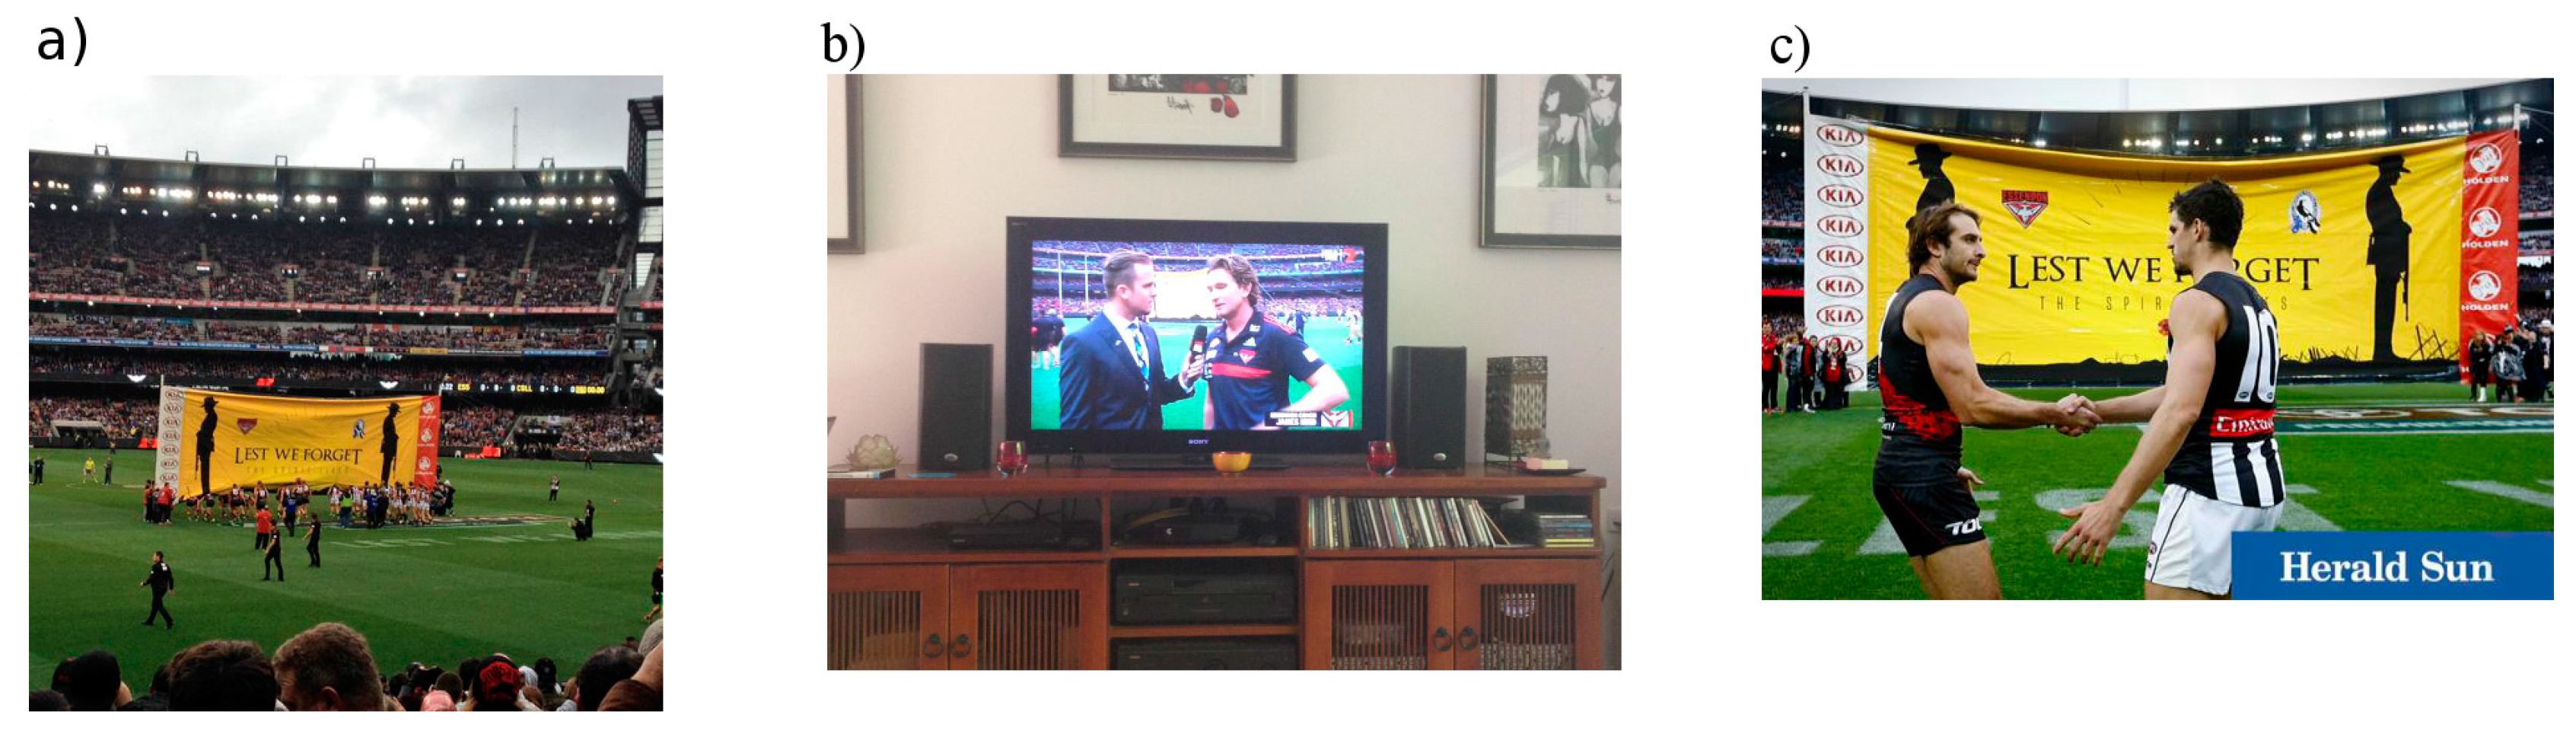
Figure 4.
A comparison of posting time for images categorized as WA OTG vs. all other categories for the ADon dataset.
Figure 4.
A comparison of posting time for images categorized as WA OTG vs. all other categories for the ADon dataset.

Figure 5.
A comparison of posting time for images categorized as WA OTG vs. all other categories for the GFon dataset.
Figure 5.
A comparison of posting time for images categorized as WA OTG vs. all other categories for the GFon dataset.

Figure 6.
Map depicting the location of images with geotags categorized as WA OTG vs. other categories for the ADon and GFon dataset.
Figure 6.
Map depicting the location of images with geotags categorized as WA OTG vs. other categories for the ADon and GFon dataset.
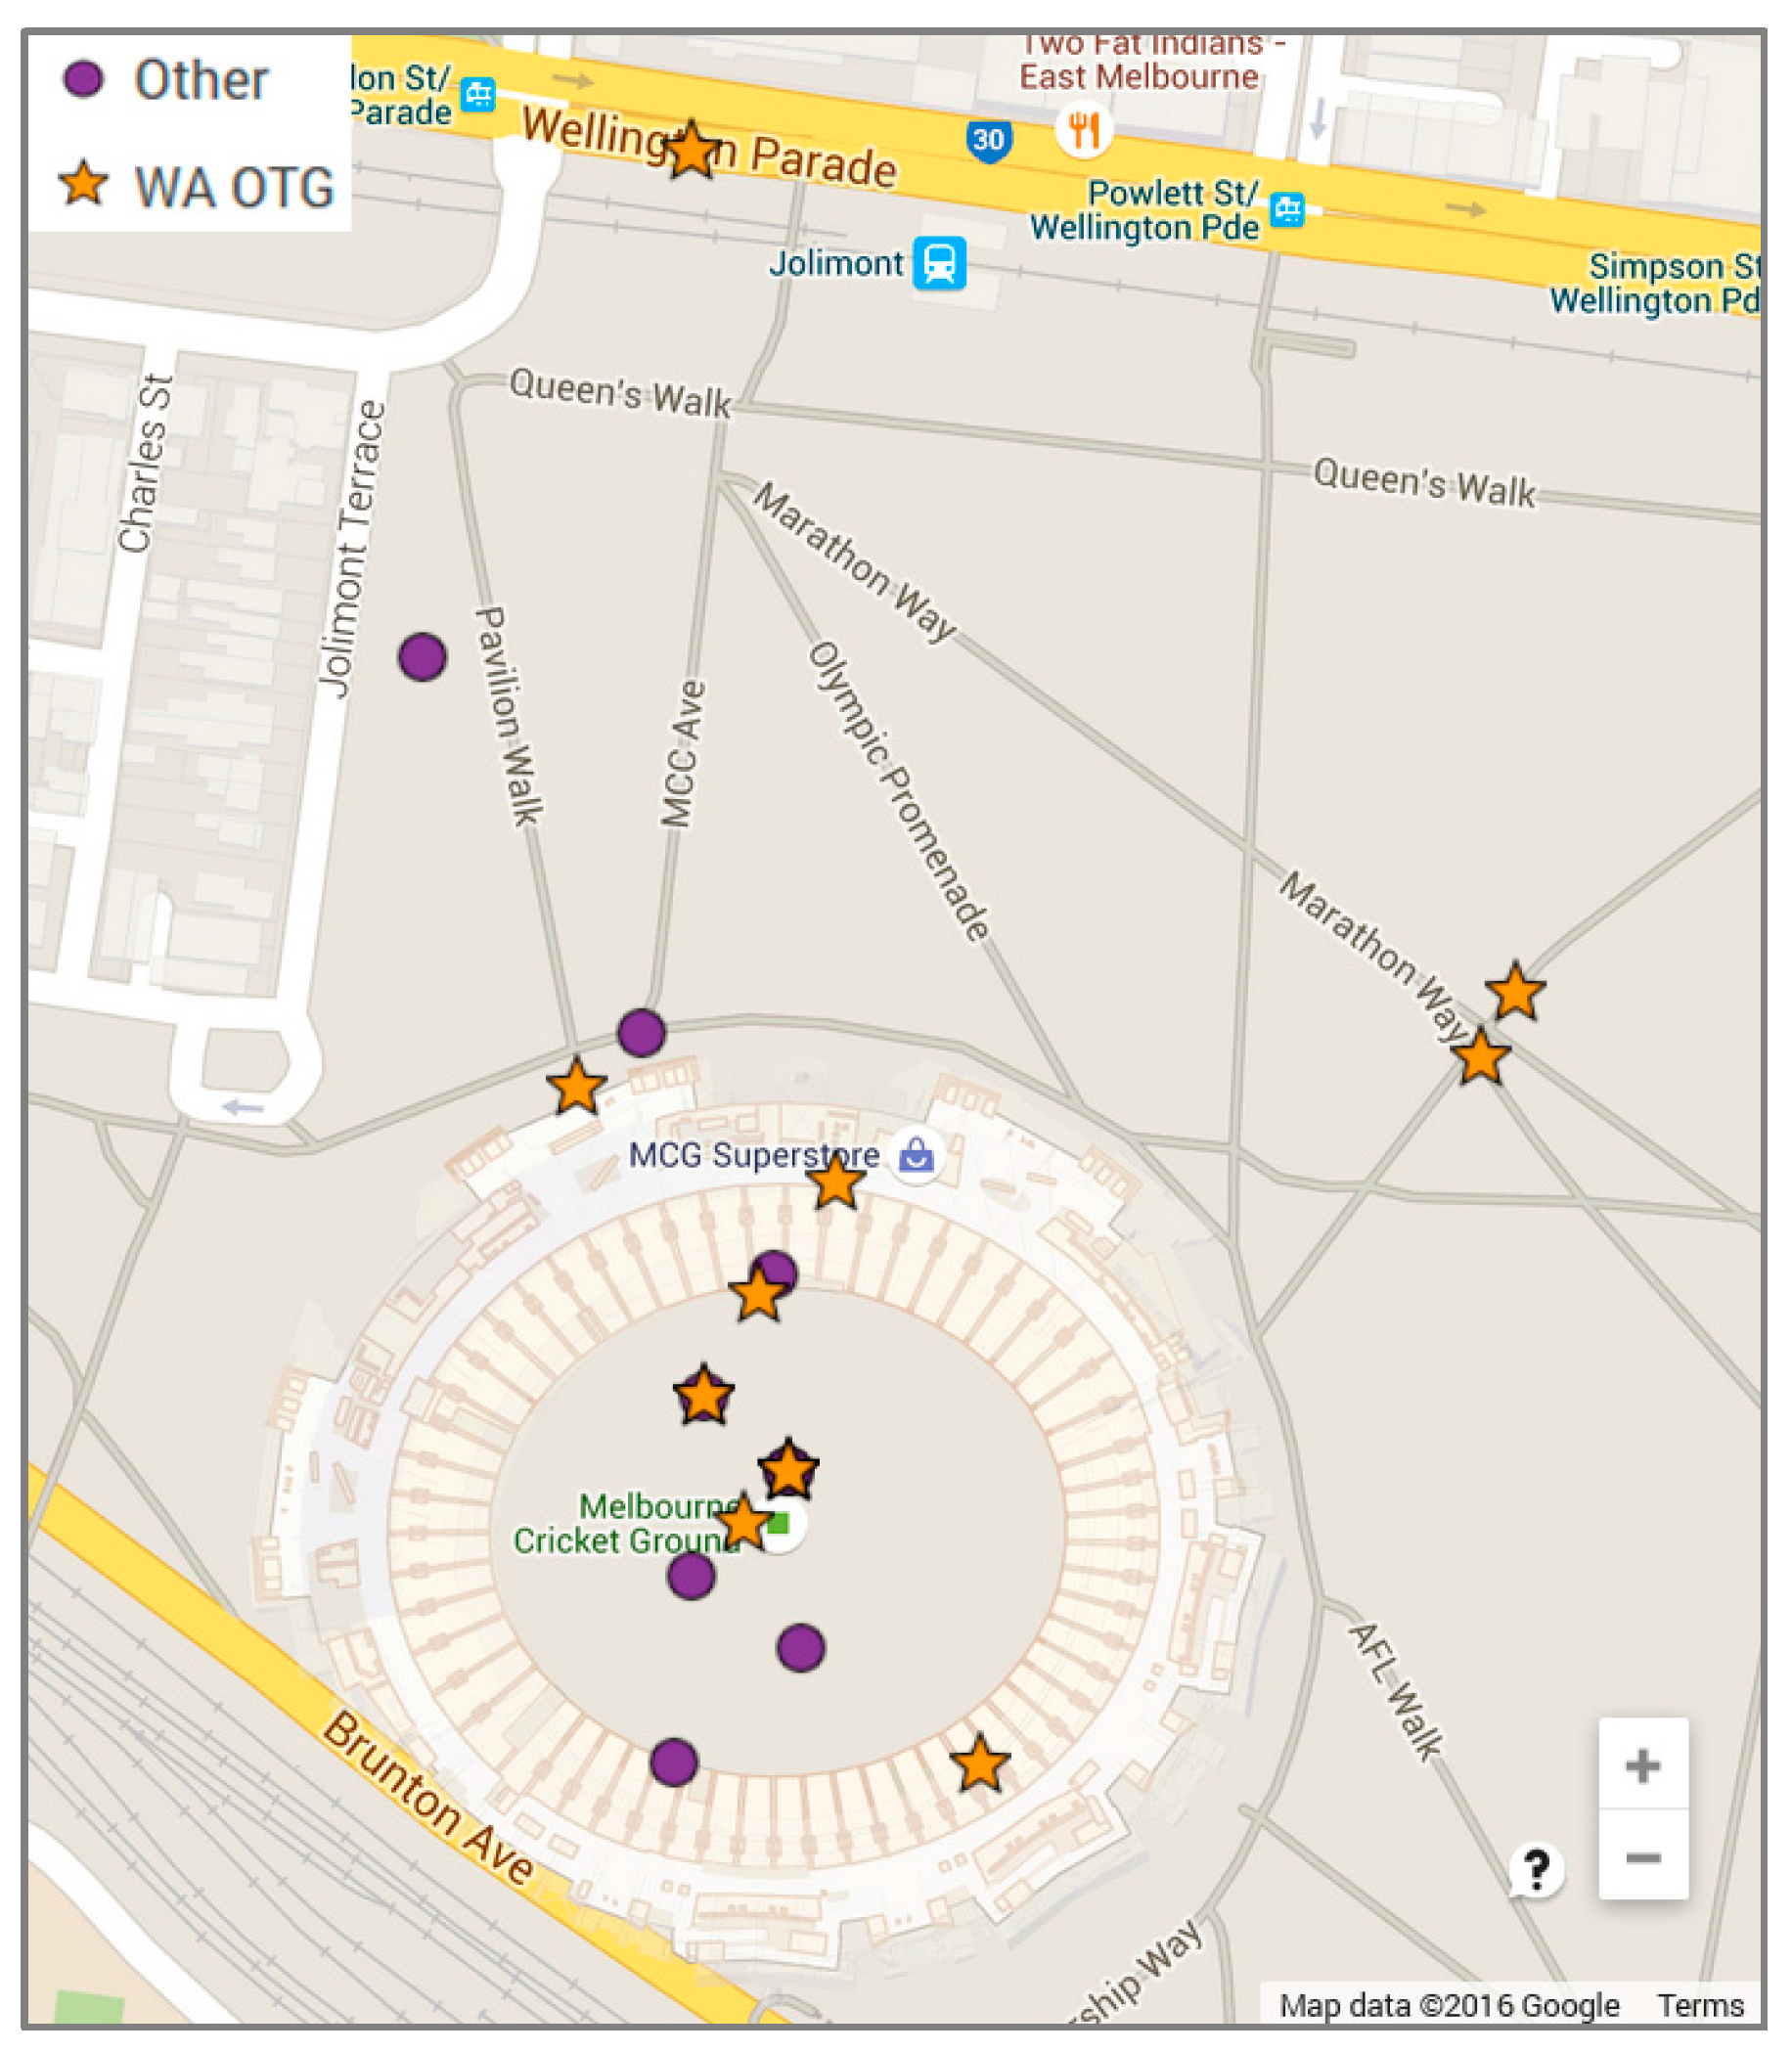
Figure 7.
Images (a) [67] (b) [68] and (c) [69] are examples of images categorized as WA OTG with geotag locations outside the event venue.

Figure 8.
Comparison of different visual vocabulary sizes using SVM classifier for the ADon dataset.
Figure 8.
Comparison of different visual vocabulary sizes using SVM classifier for the ADon dataset.
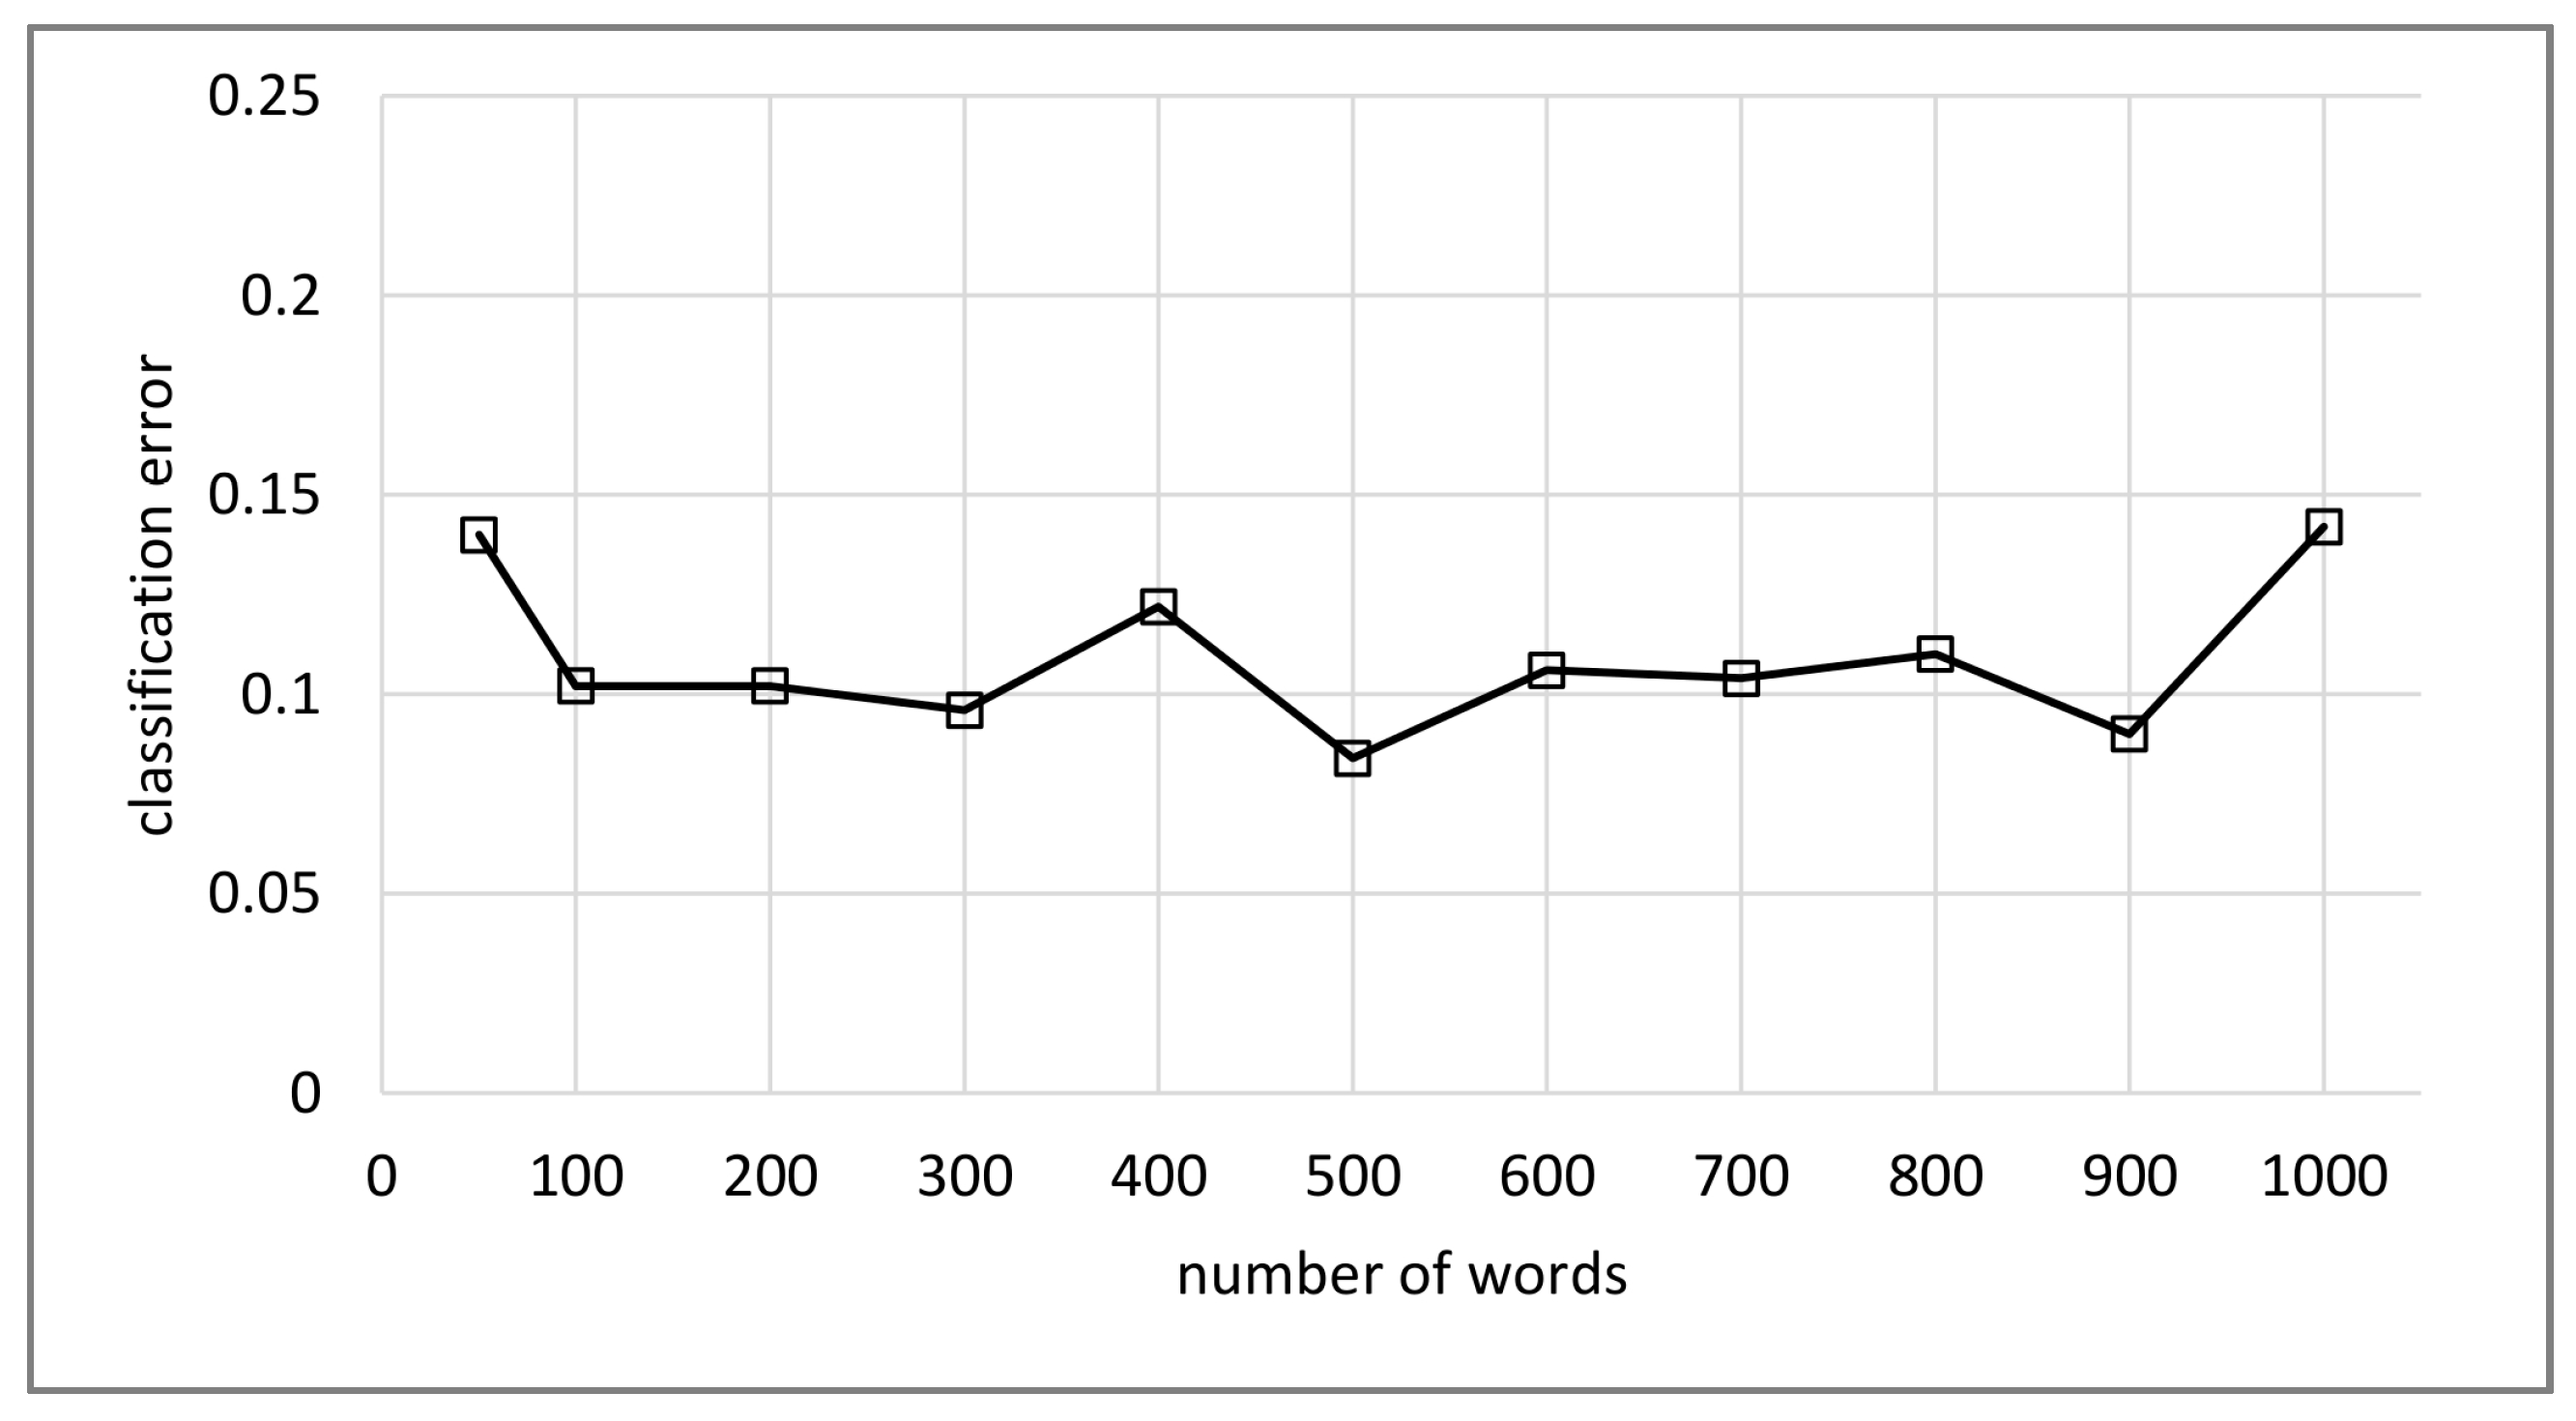
Figure 9.
Learning curves for the SVM classifier showing the classifier is sufficiently trained with approximately 50 training images.
Figure 9.
Learning curves for the SVM classifier showing the classifier is sufficiently trained with approximately 50 training images.
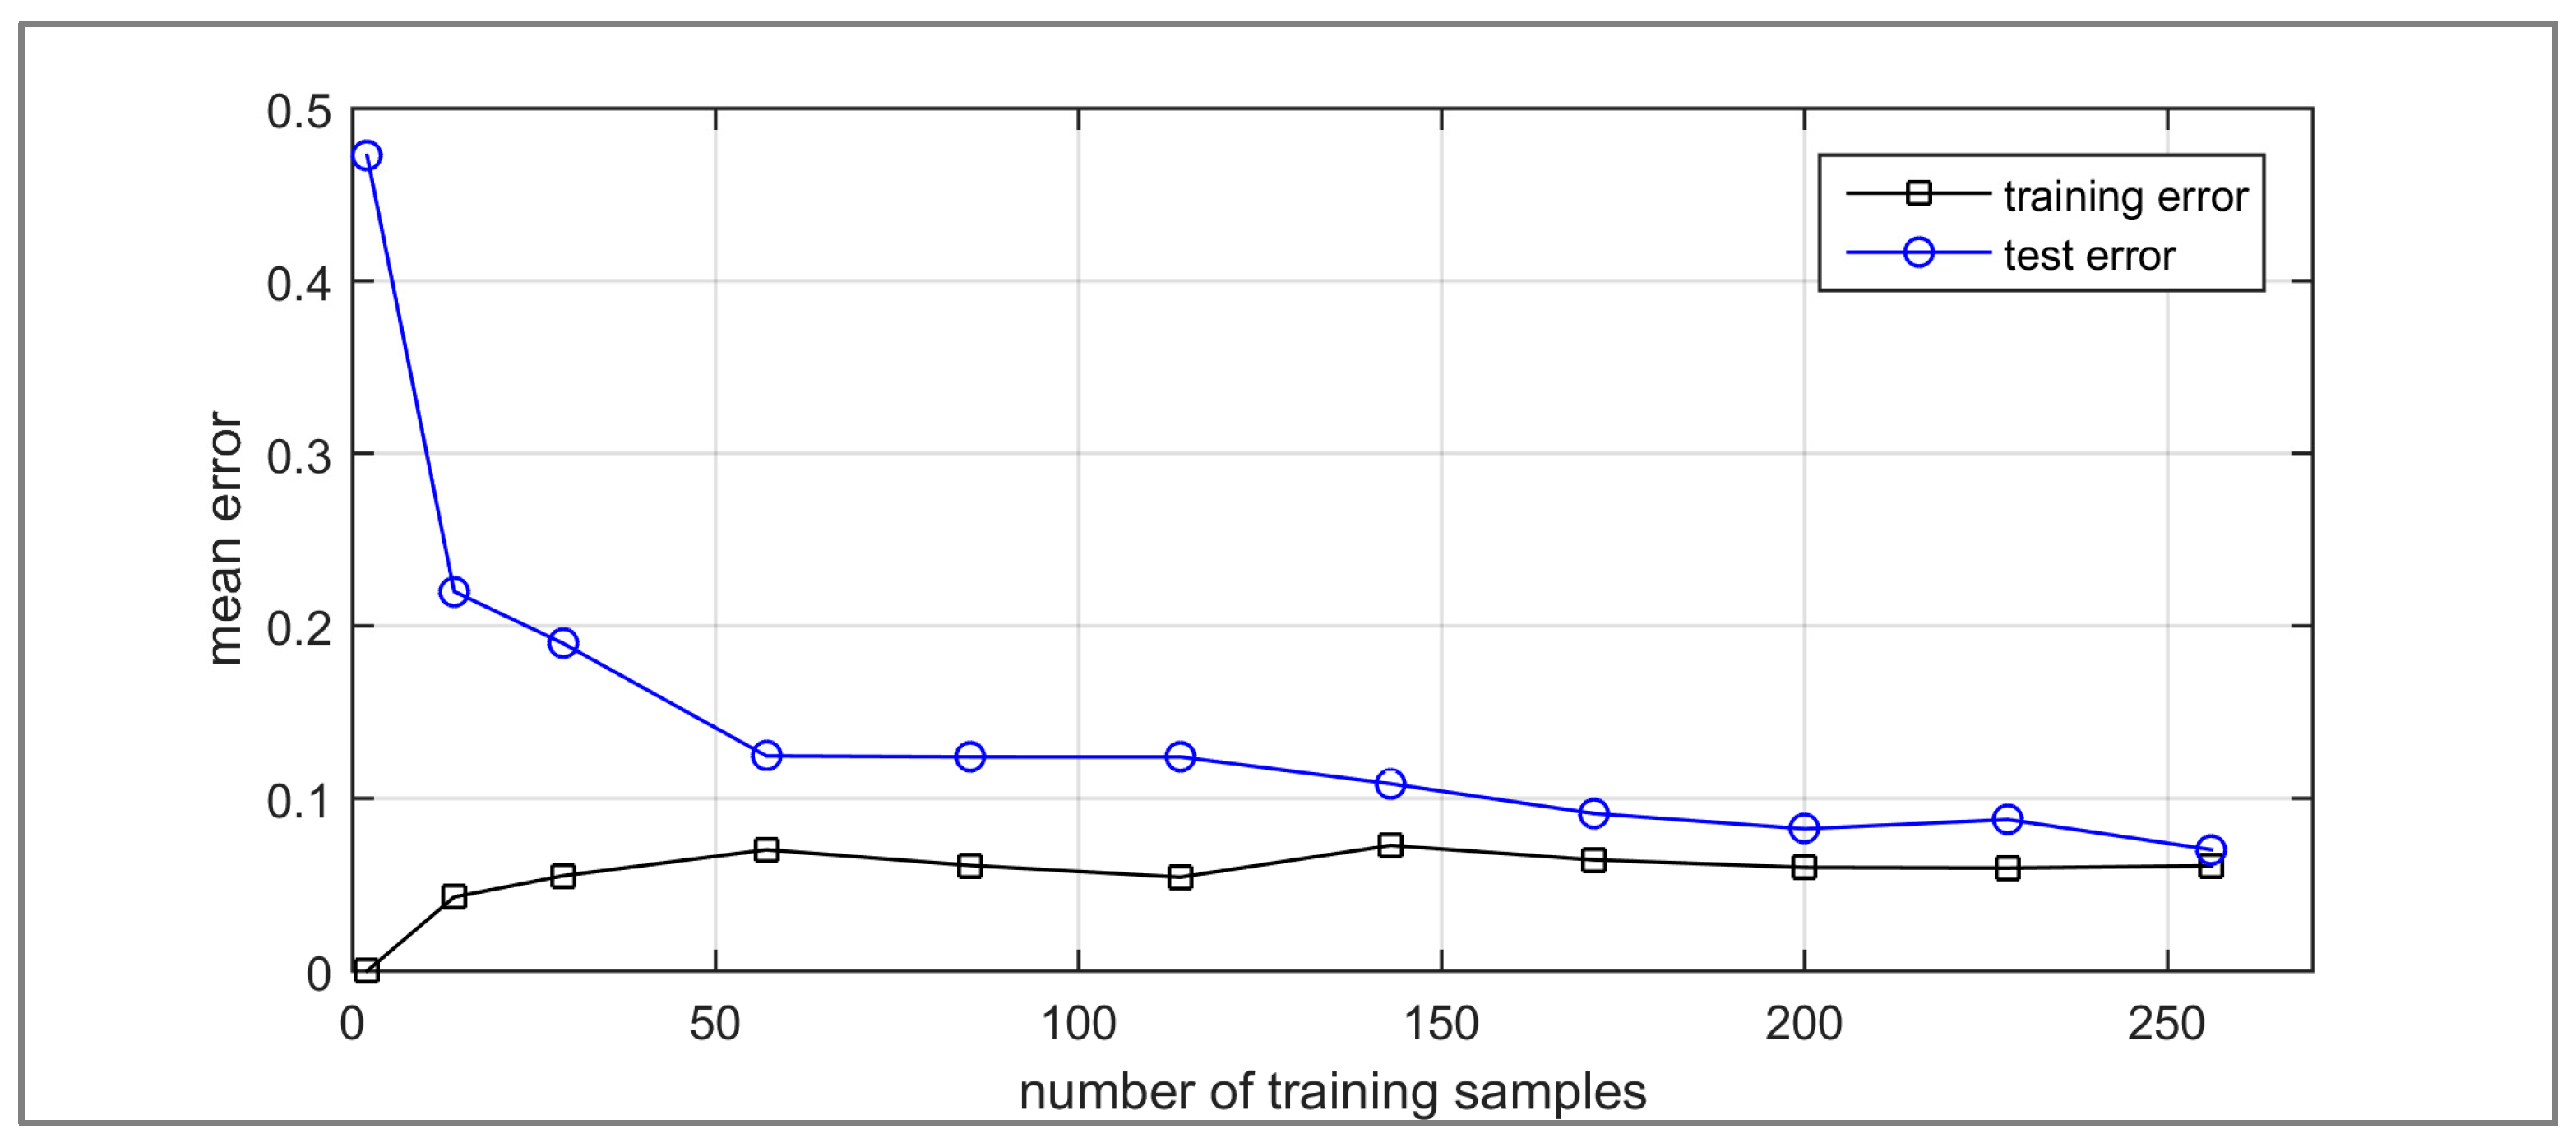
Figure 10.
Accuracy of the SVM classifier when trained with images of the ADon dataset and tested on images of the ADoff, GFon and GFoff datasets against vocabulary size.
Figure 10.
Accuracy of the SVM classifier when trained with images of the ADon dataset and tested on images of the ADoff, GFon and GFoff datasets against vocabulary size.
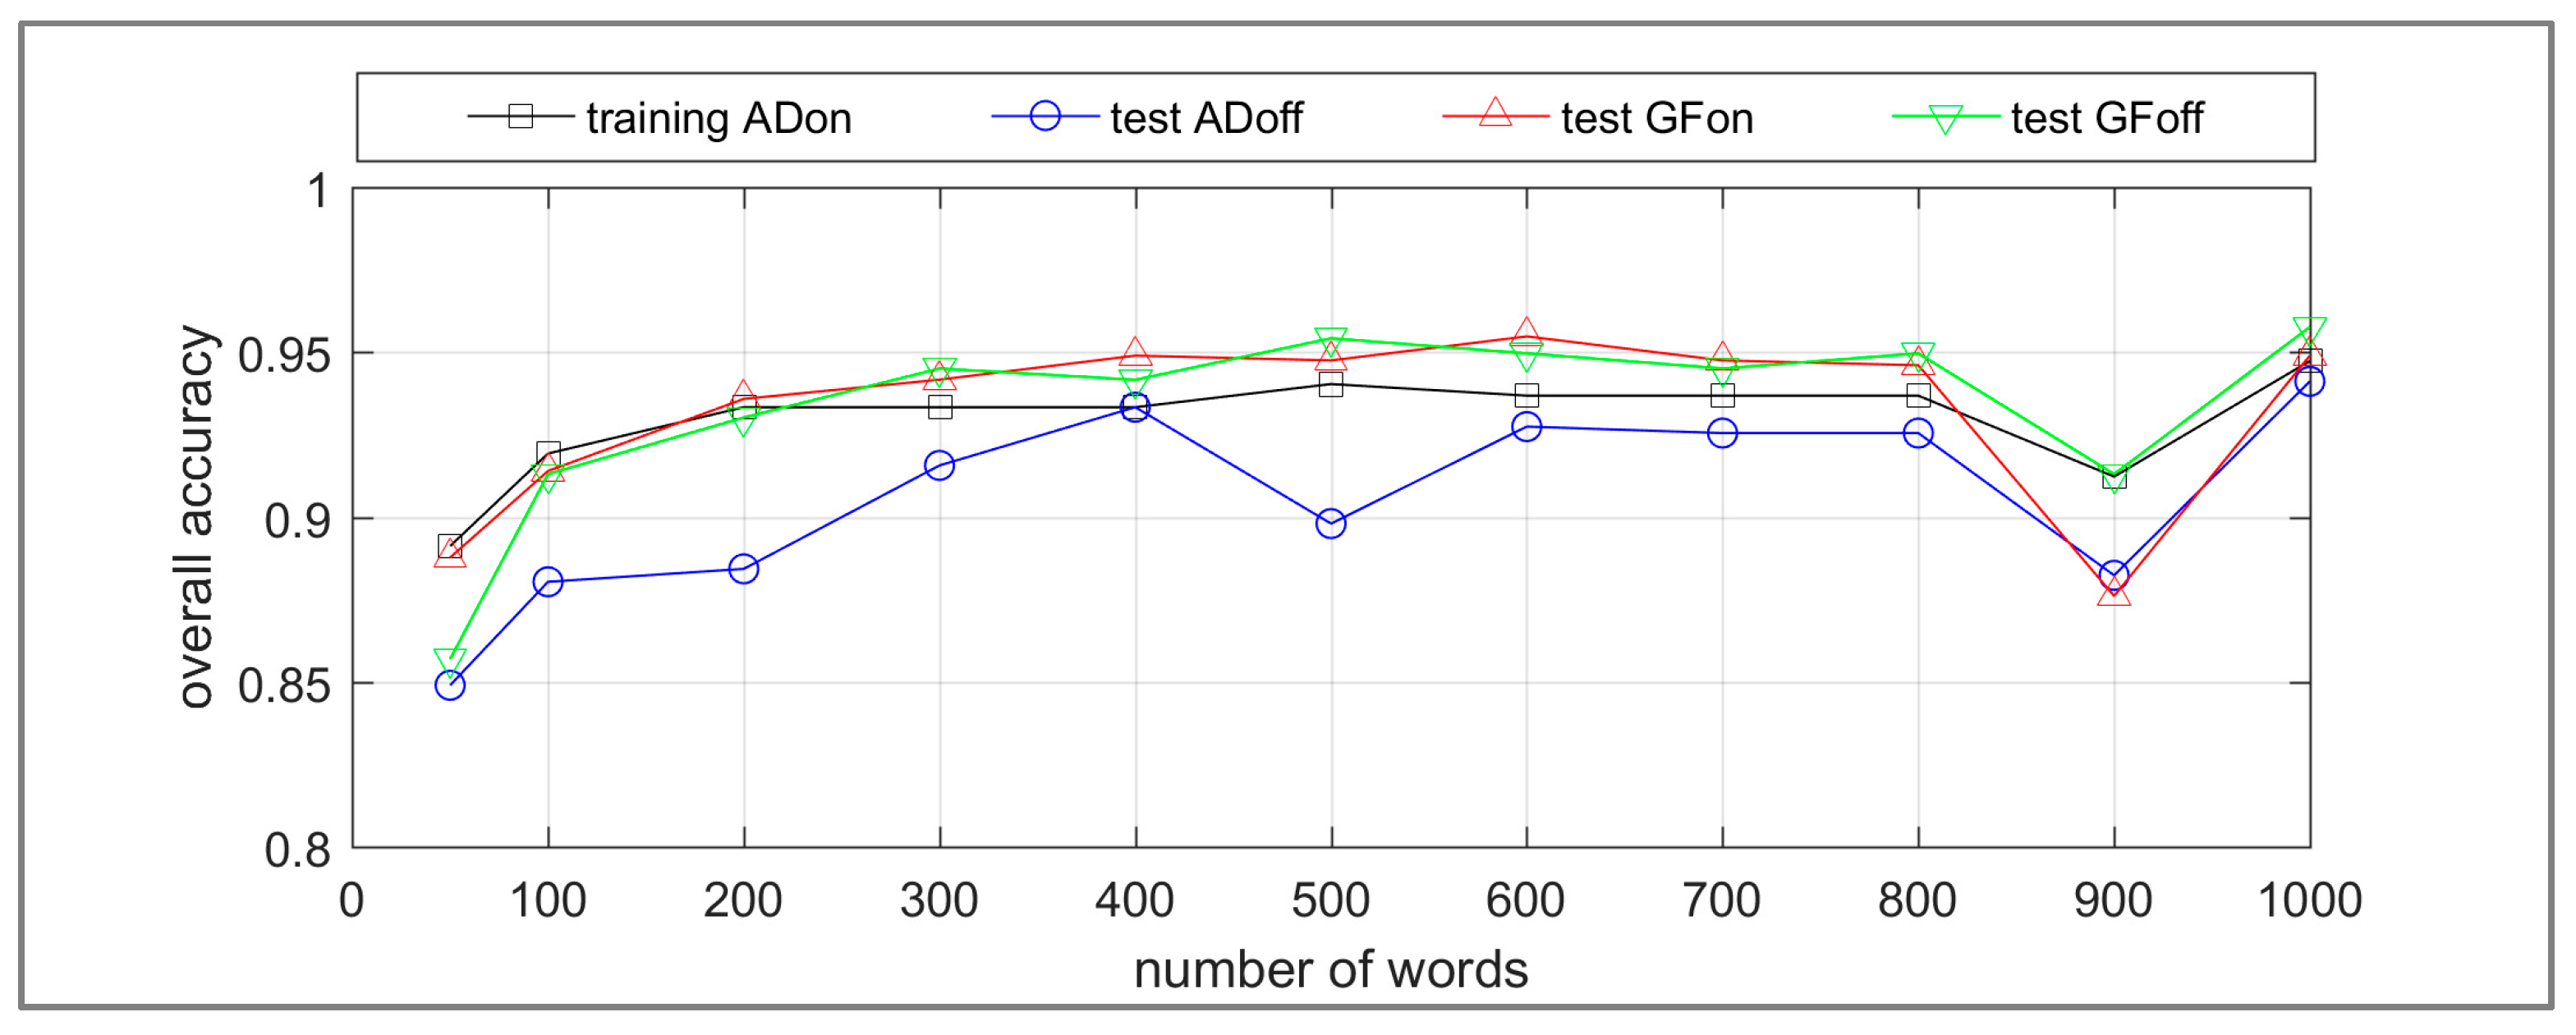
Figure 11.
Recall of the SVM classifier for the WA OTG class when trained with images of the ADon dataset and tested on images of the ADoff, GFon, and GFoff datasets against vocabulary size.
Figure 11.
Recall of the SVM classifier for the WA OTG class when trained with images of the ADon dataset and tested on images of the ADoff, GFon, and GFoff datasets against vocabulary size.

Figure 12.
Precision of the SVM classifier for the WA OTG class when trained with images of the ADon dataset and tested on images of the ADoff, GFon and GFoff datasets against vocabulary size.
Figure 12.
Precision of the SVM classifier for the WA OTG class when trained with images of the ADon dataset and tested on images of the ADoff, GFon and GFoff datasets against vocabulary size.
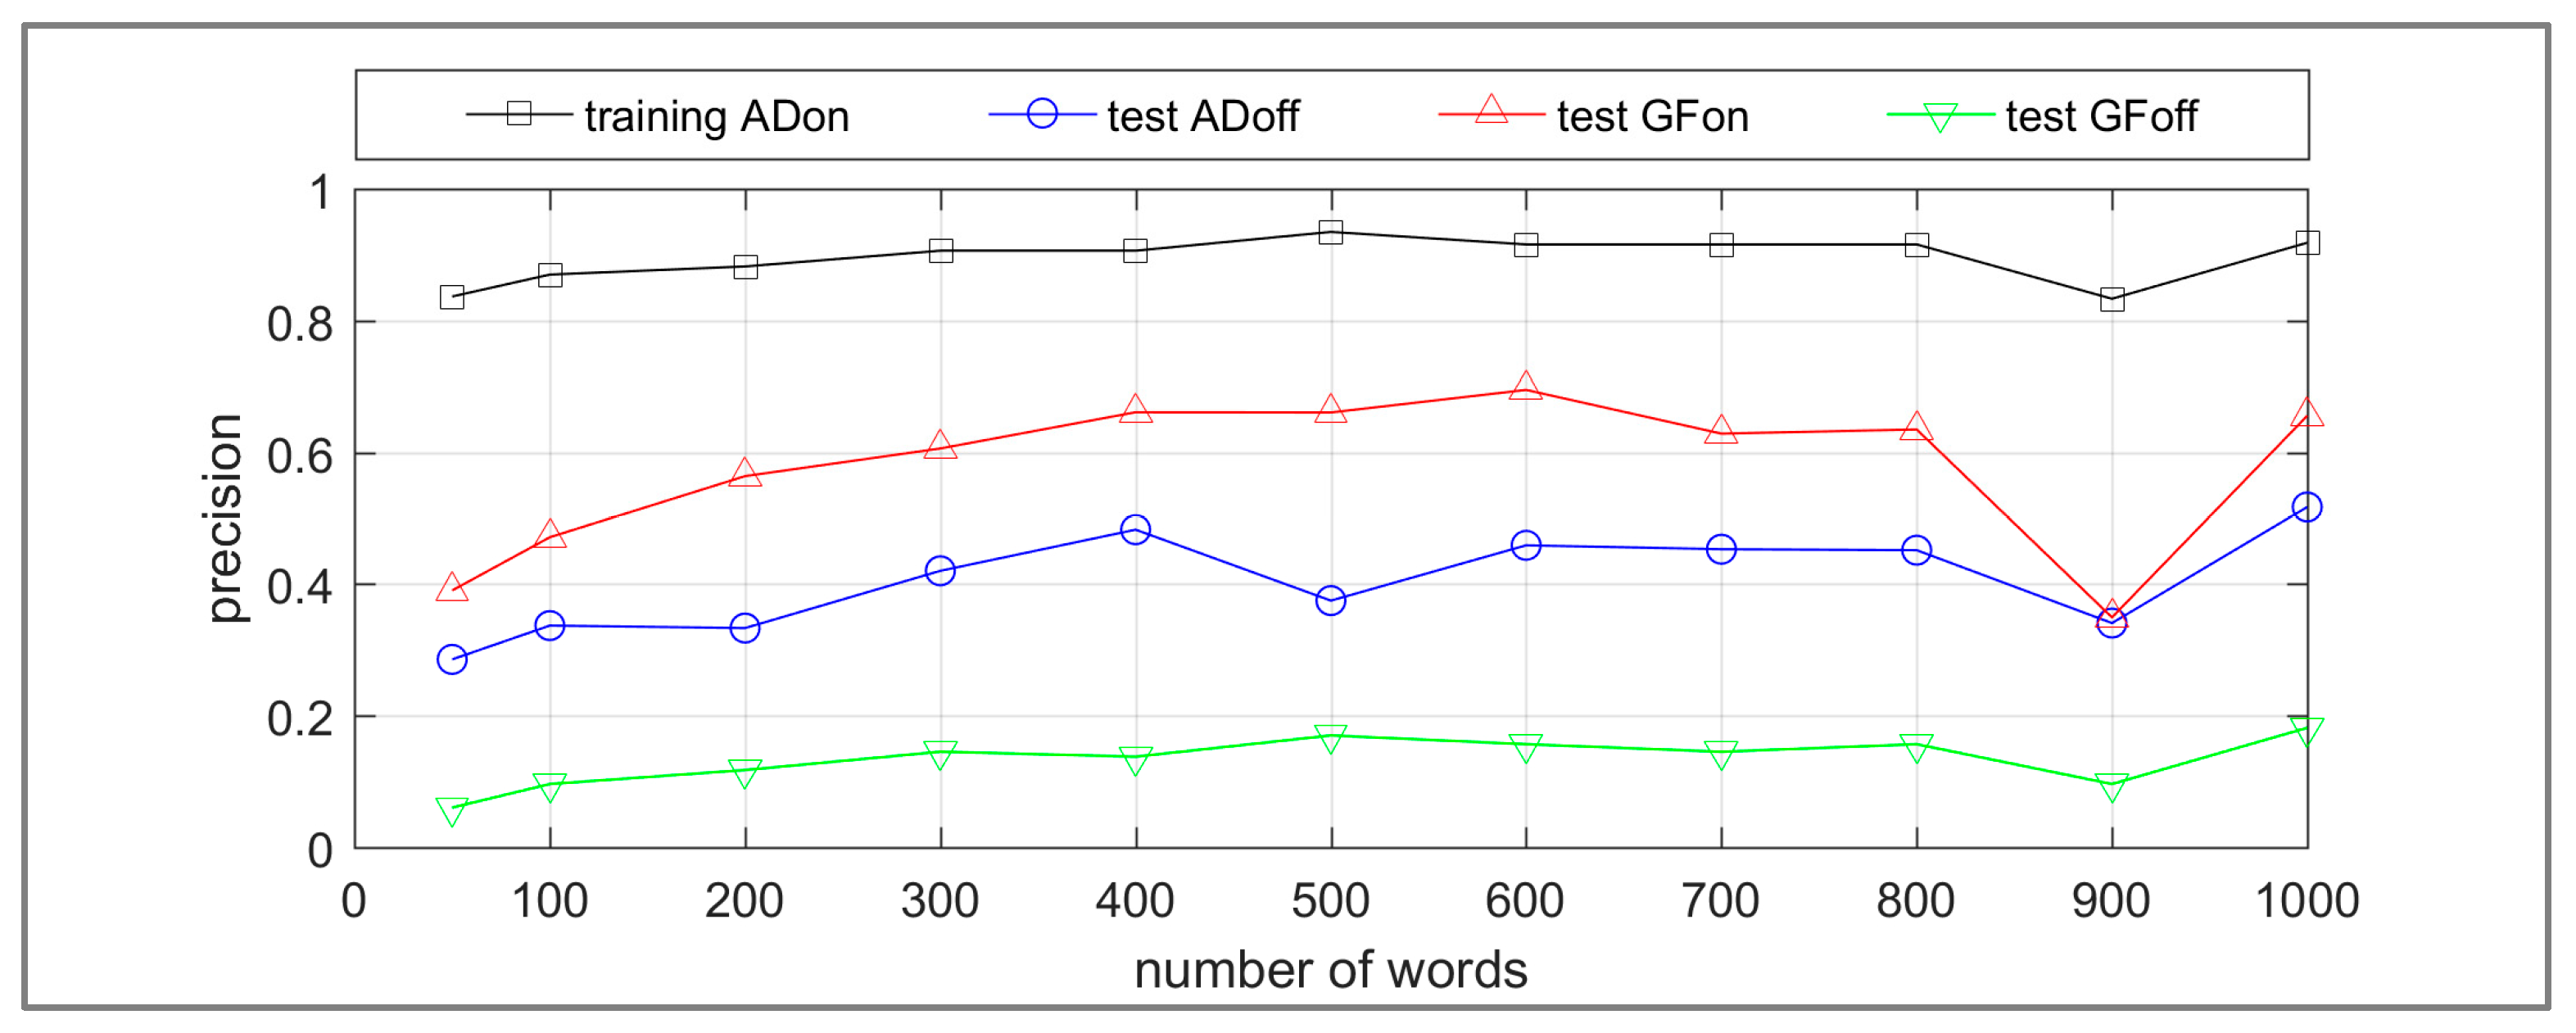
Figure 13.
Example of false negative images for the training dataset ADon (a) a selfie [70] (b) close-up of the scoreboard [71] and (c) a panorama [72]. These versions of the images are those which have undergone resizing.

Figure 14.
Example of false positive images for the training dataset ADon (a) screen relaying the broadcast [73] (b) a media image [74] and (c) a place of indeterminate location [75]. These versions of the images are those which have undergone resizing.


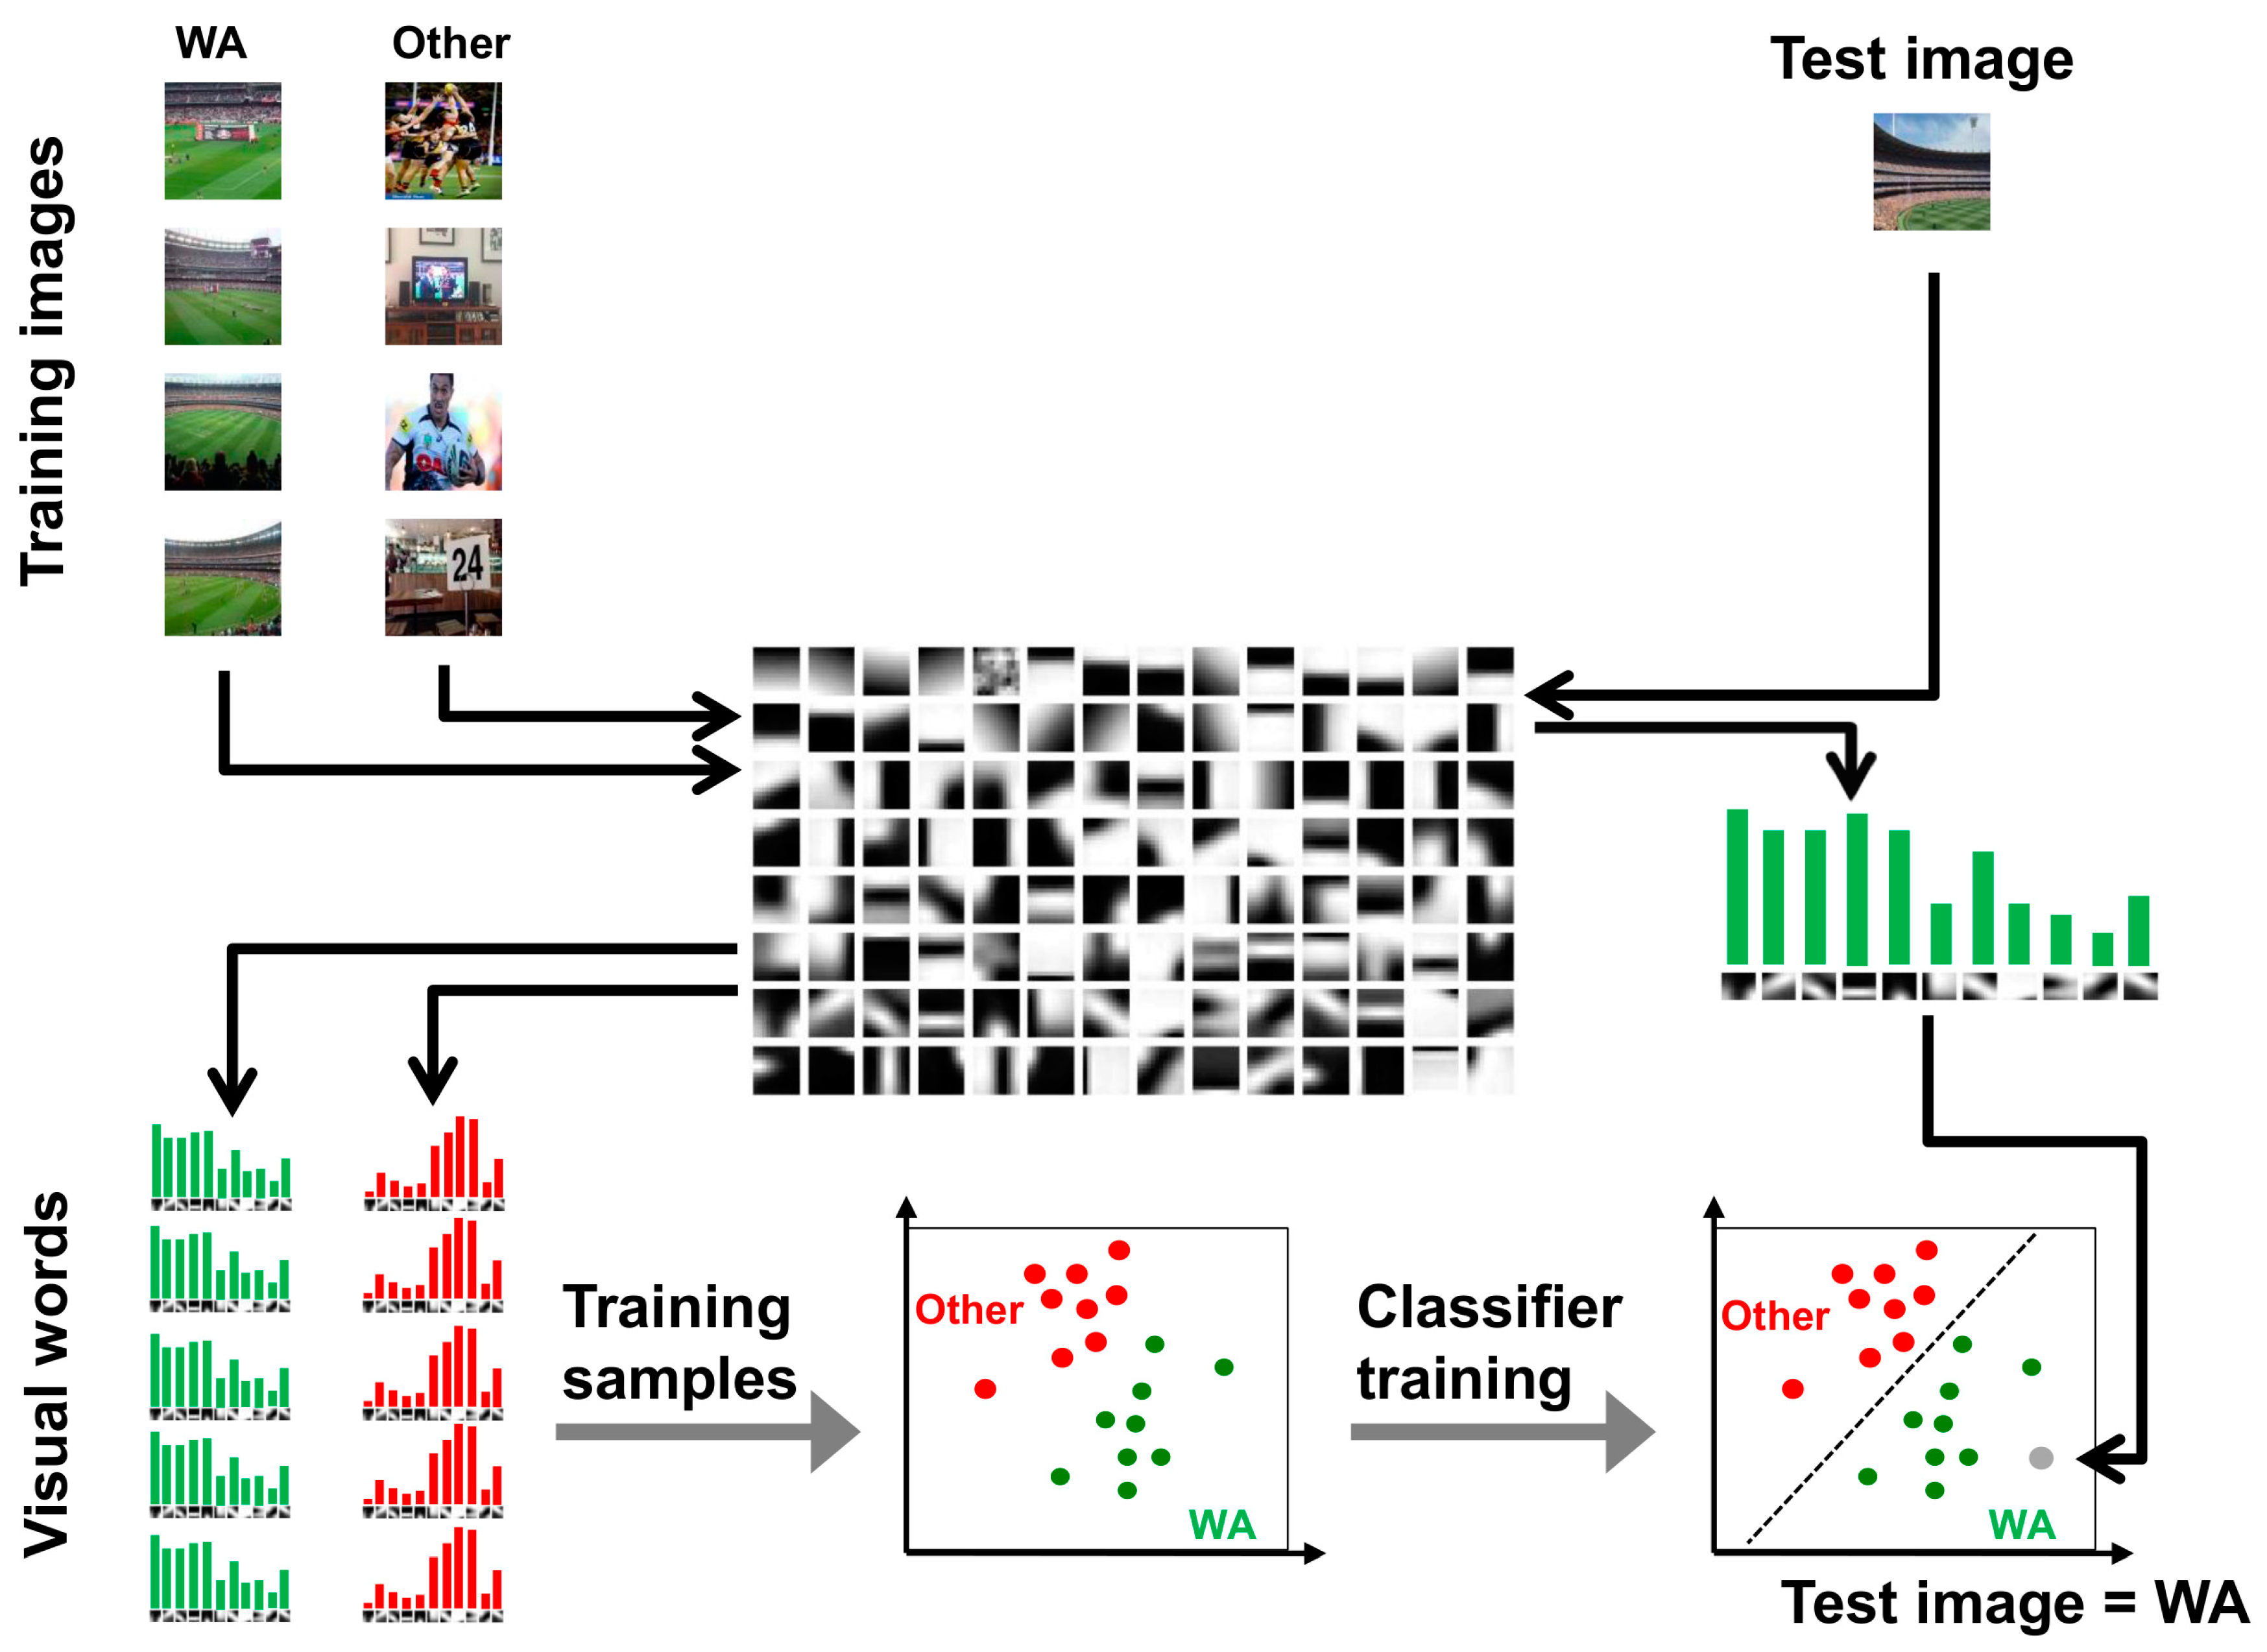
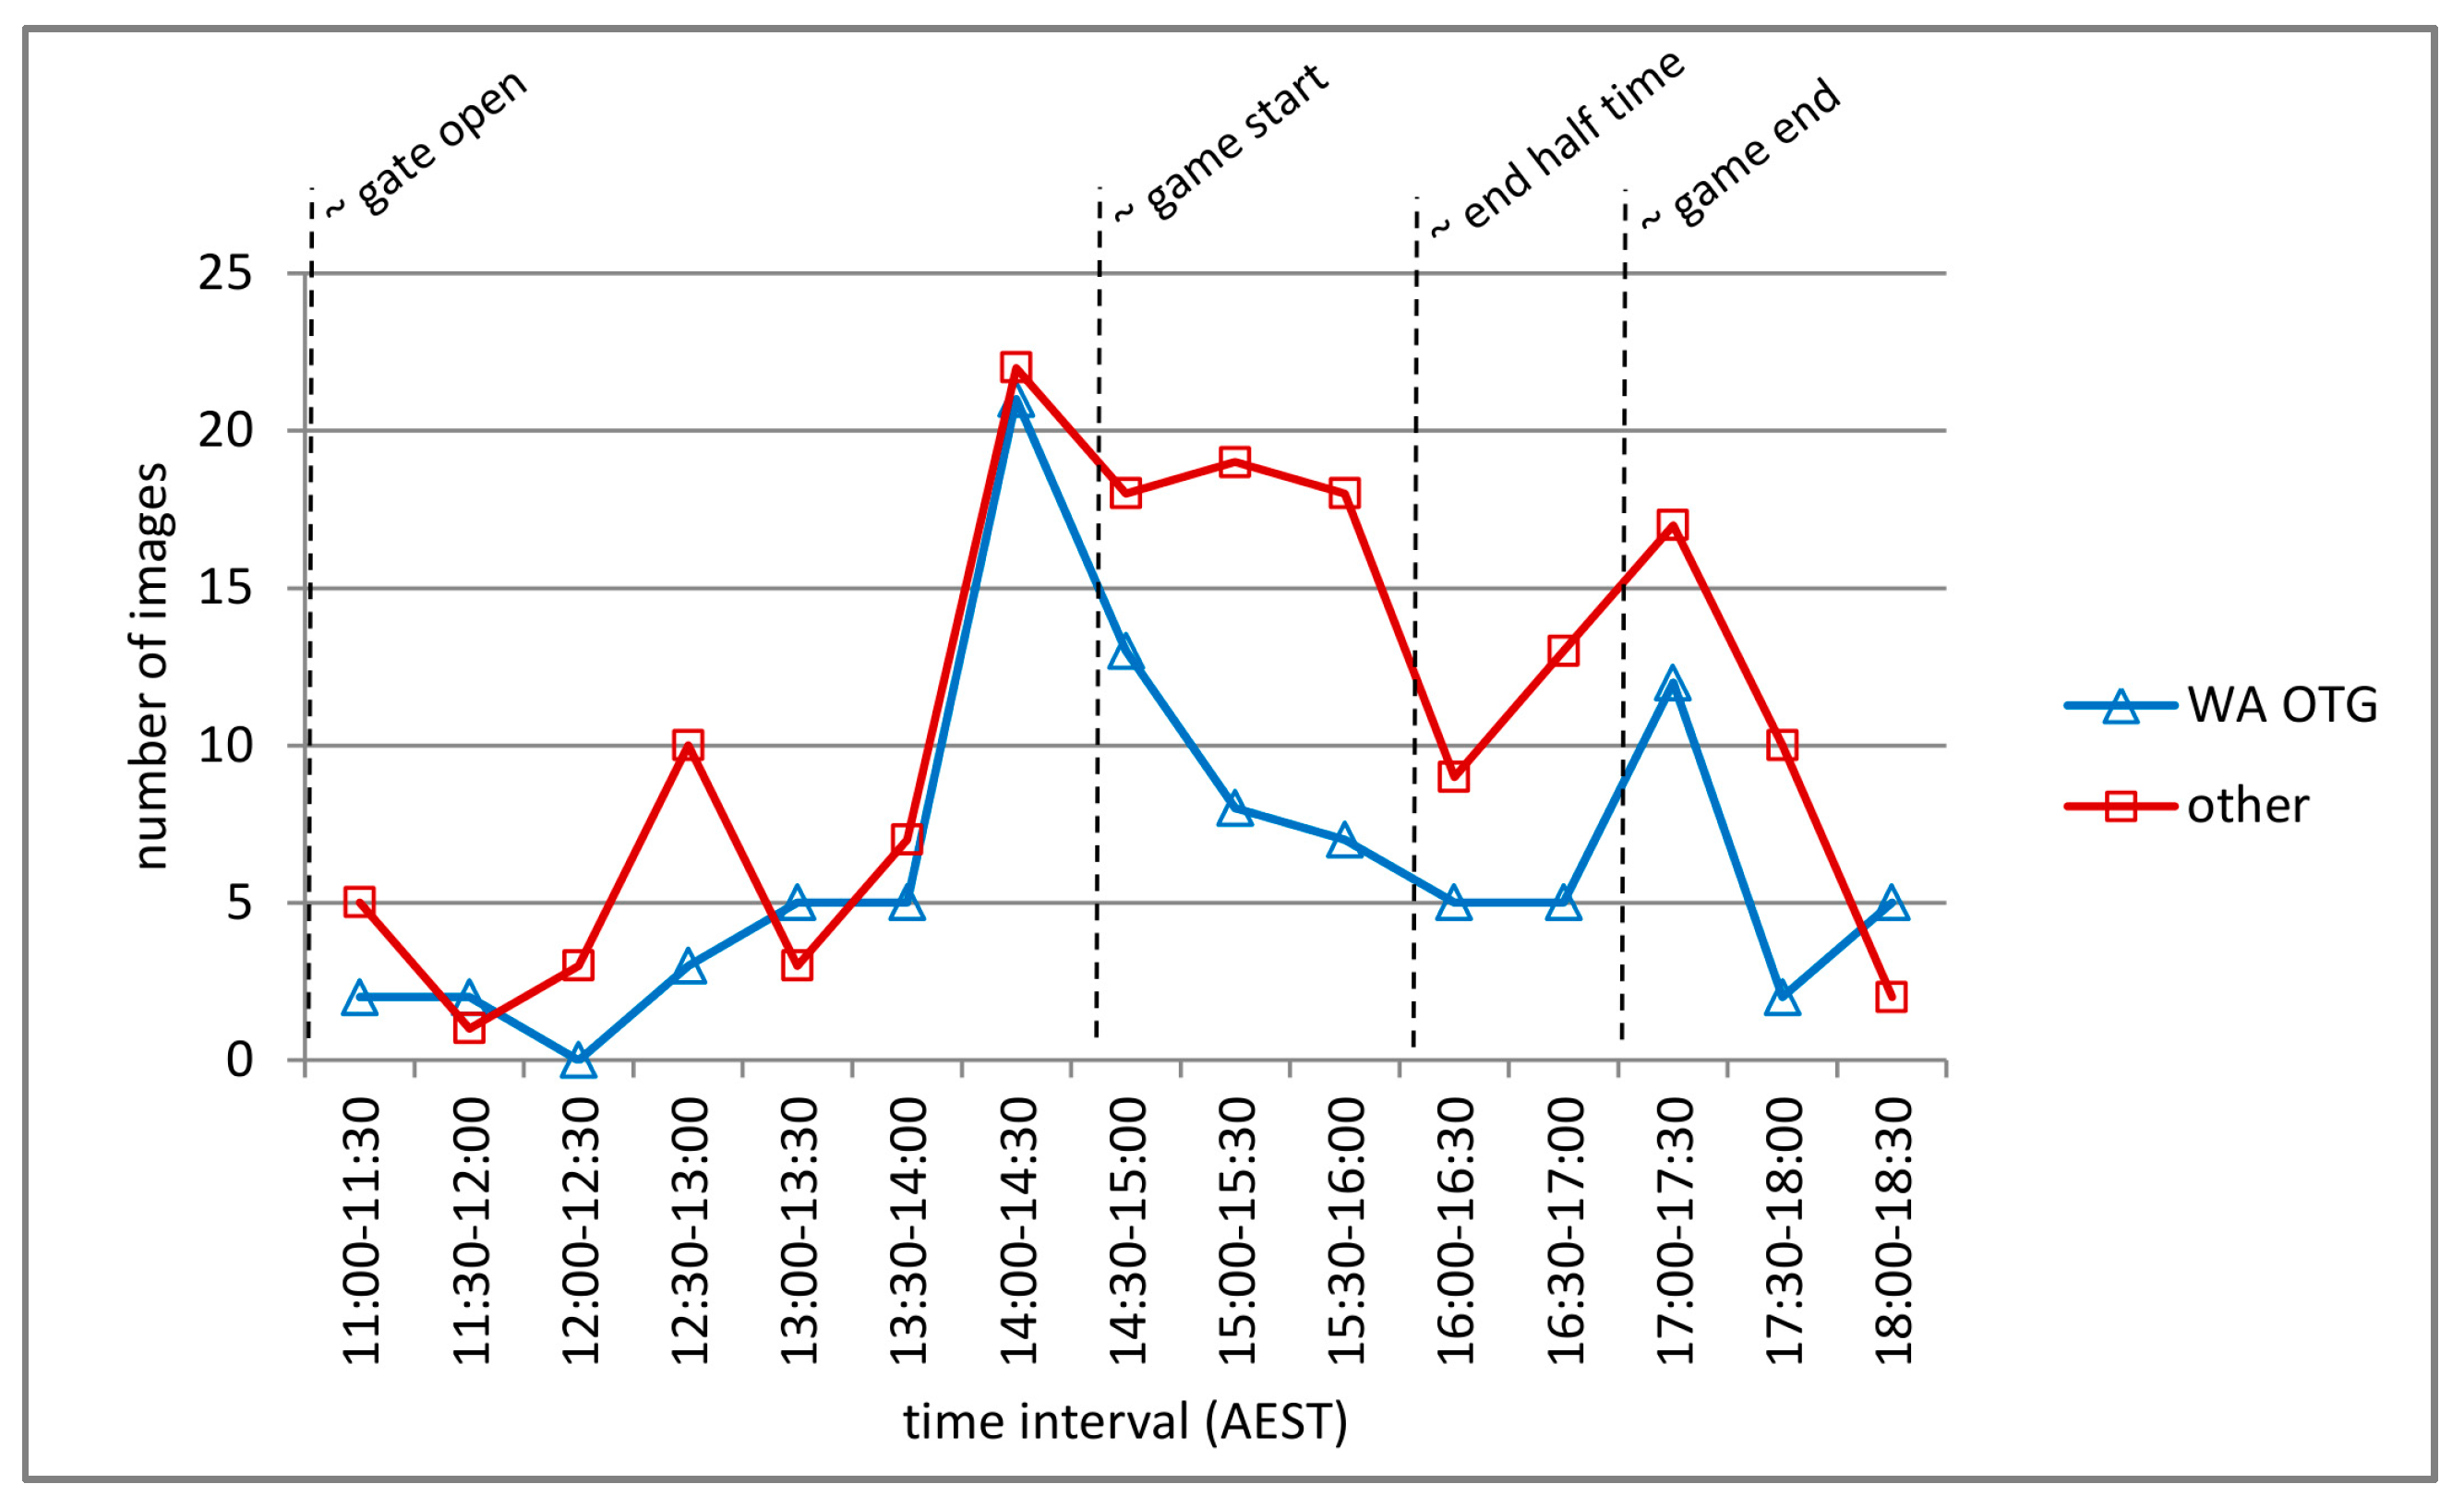
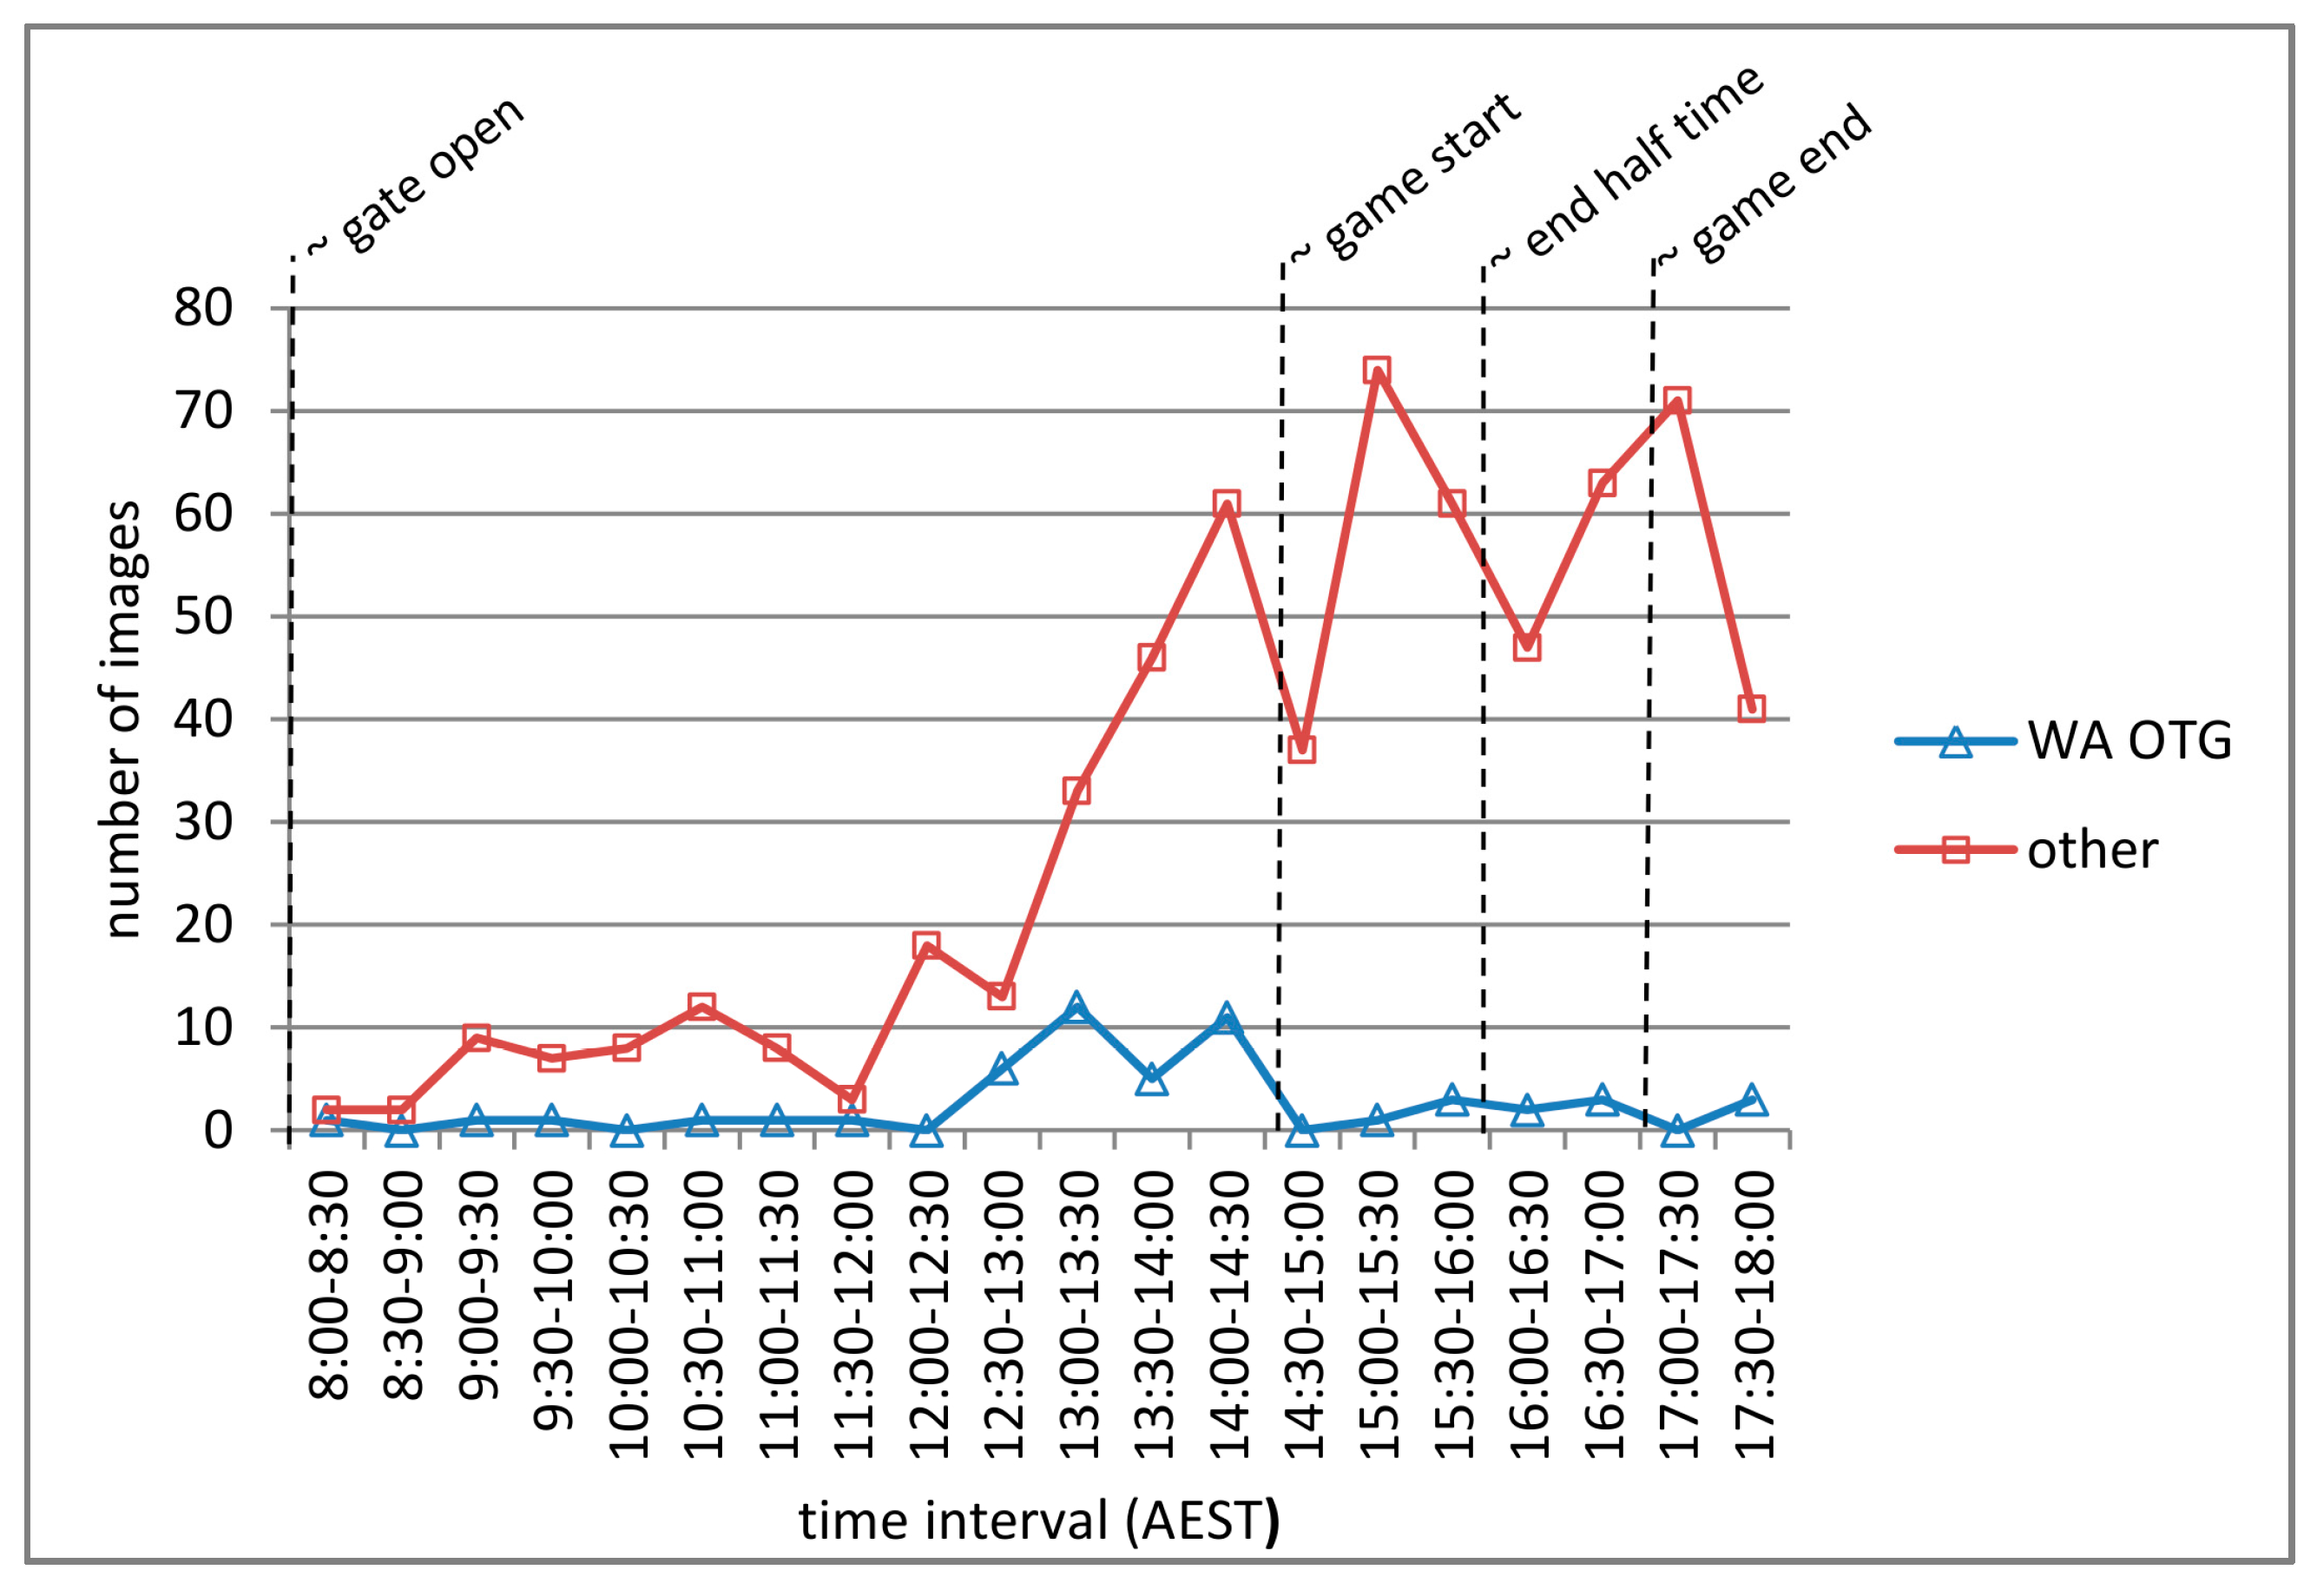
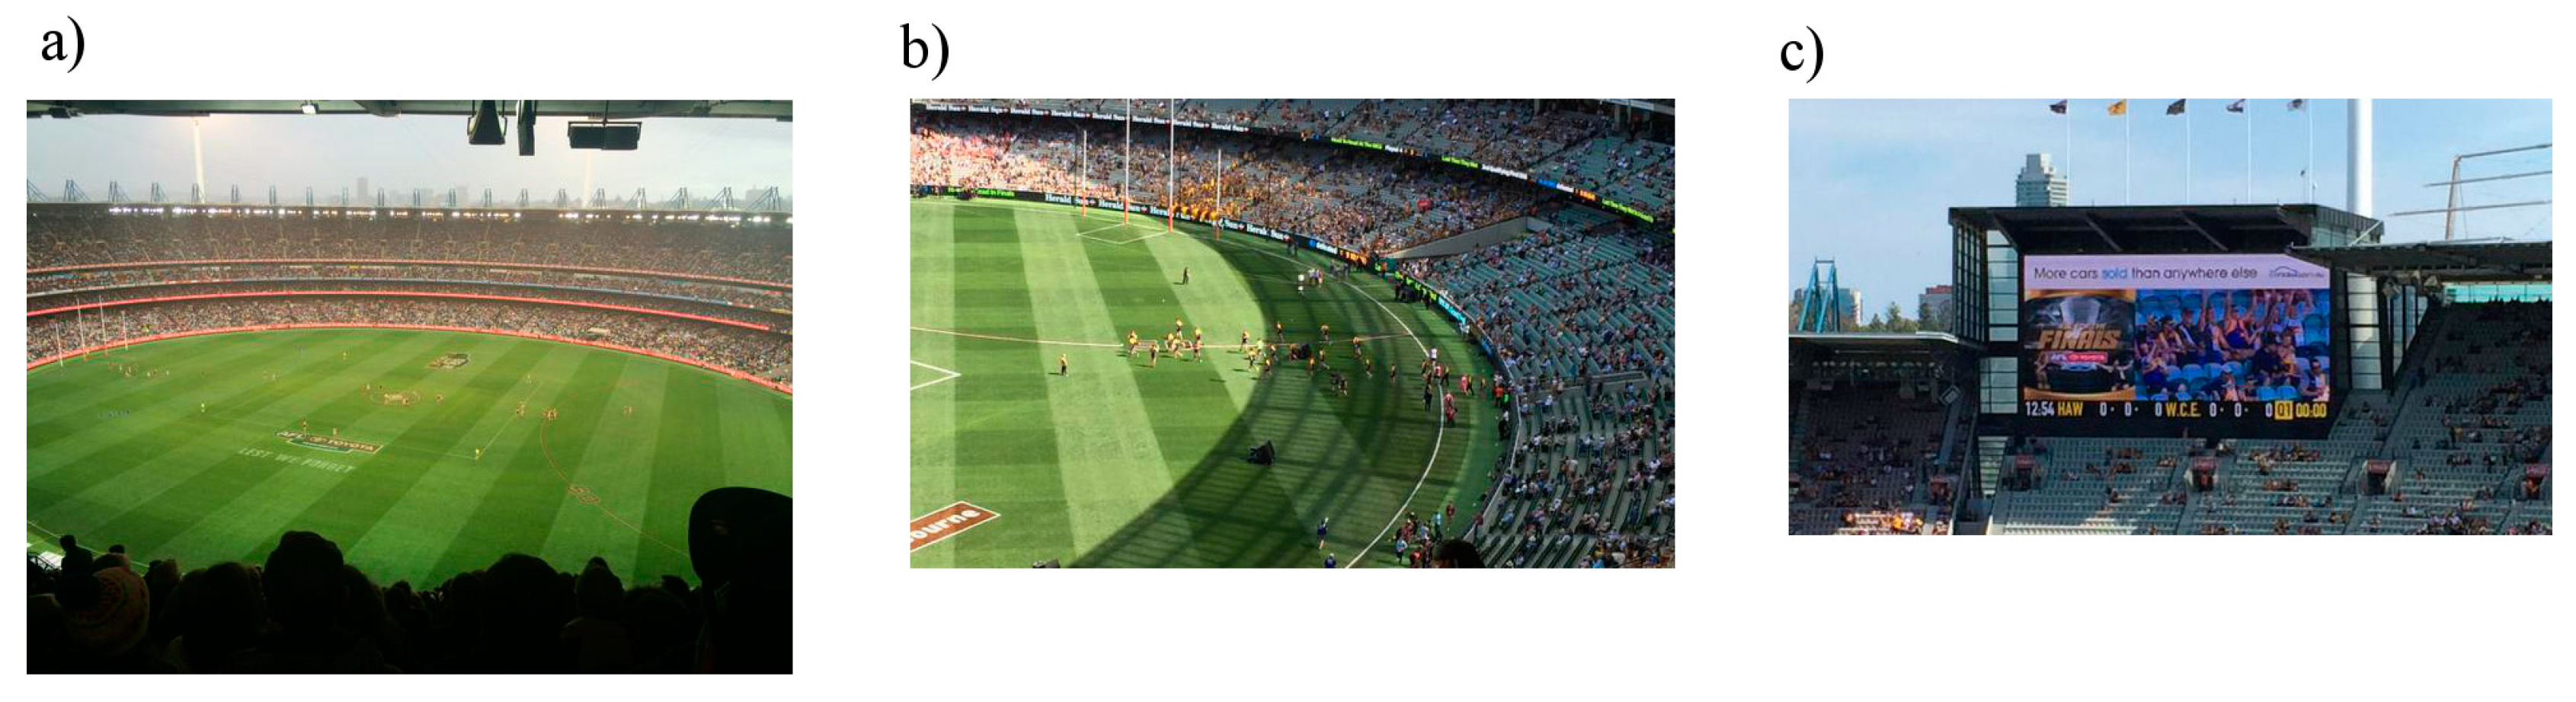
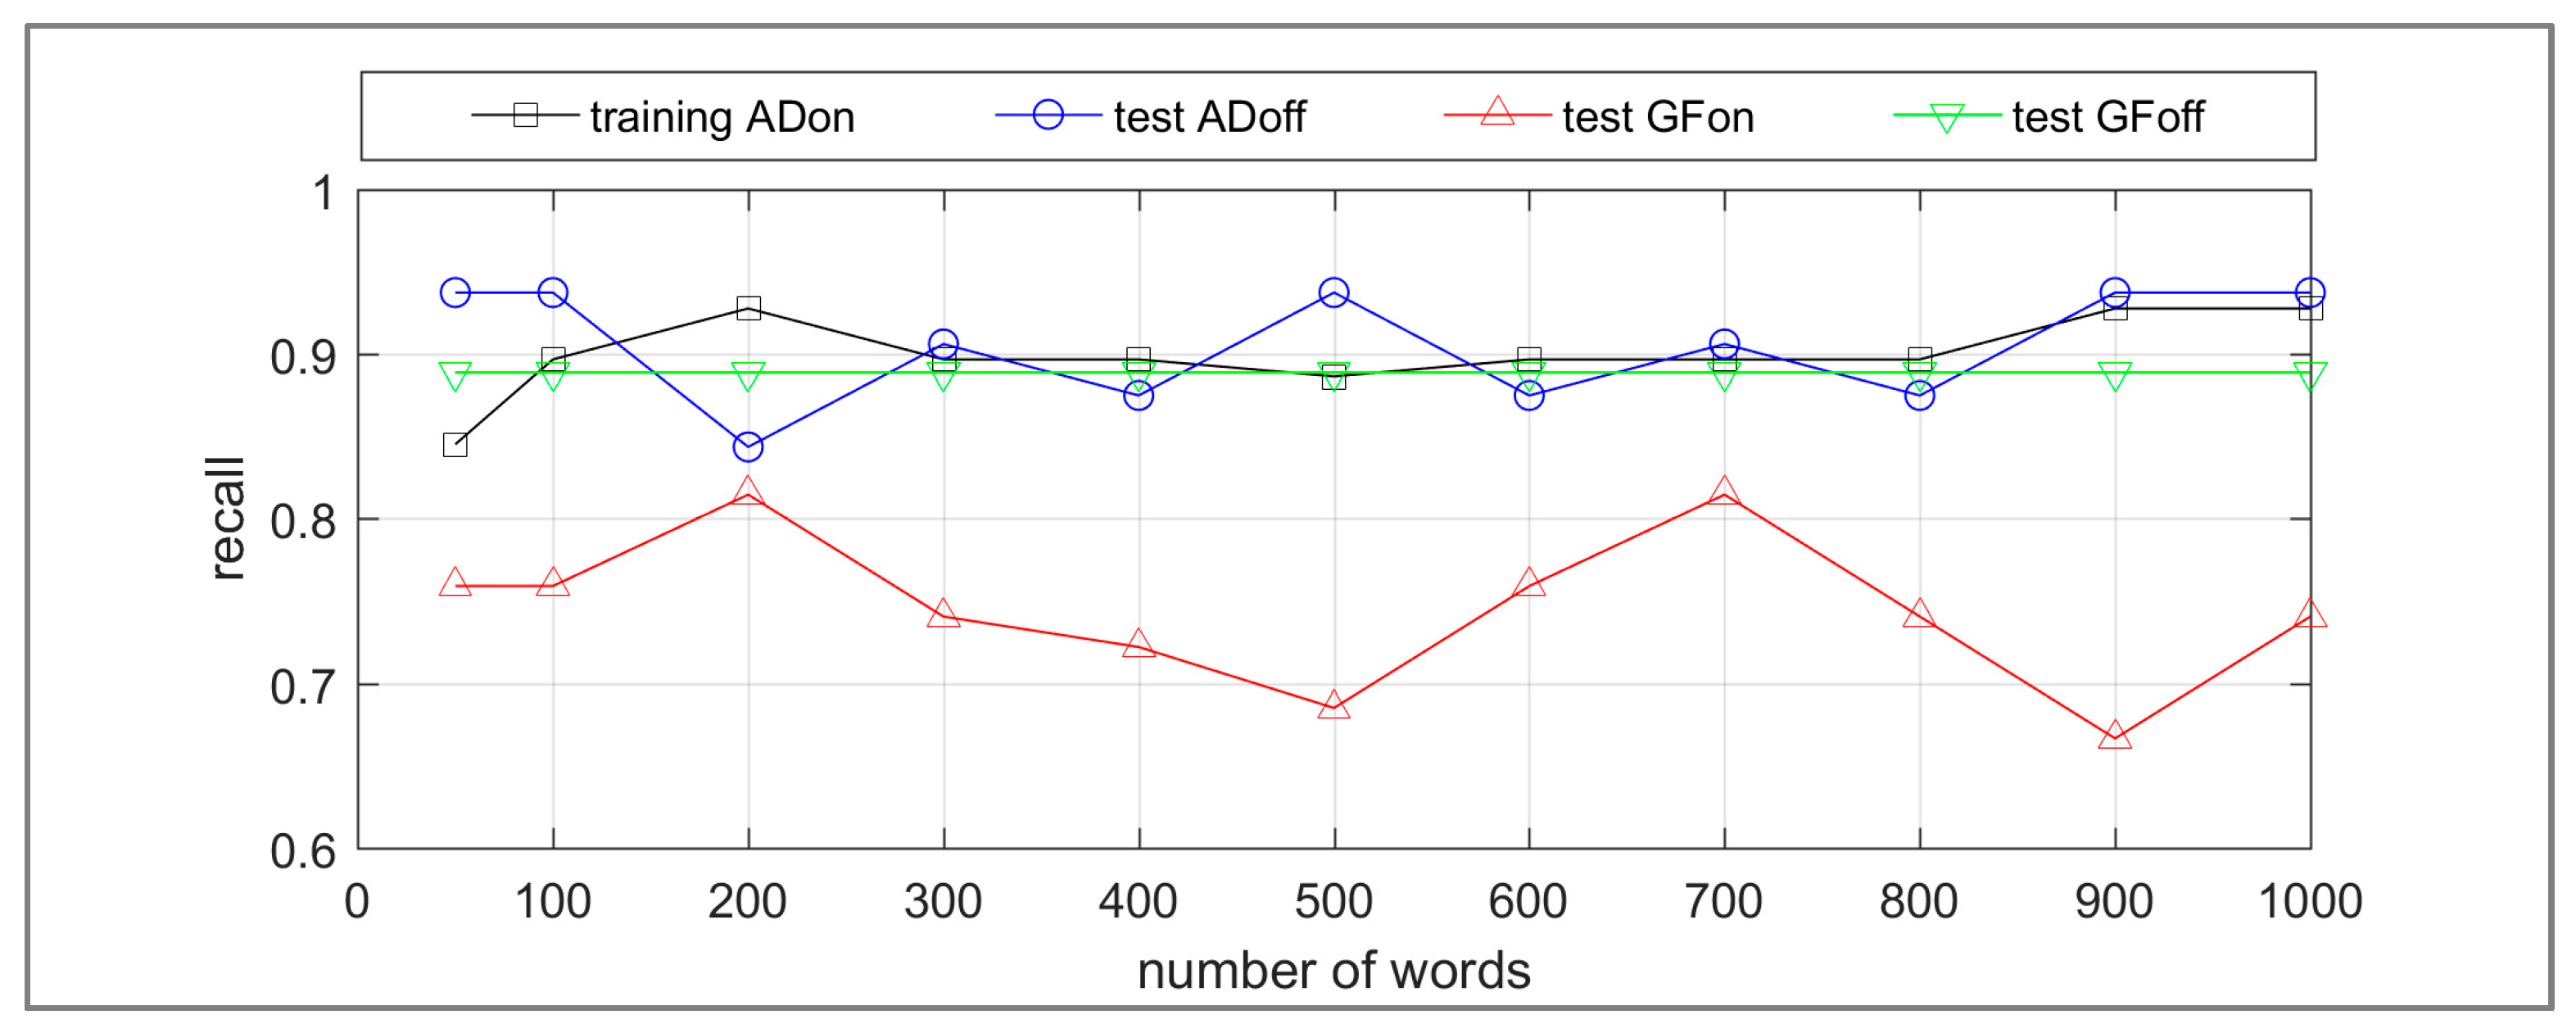
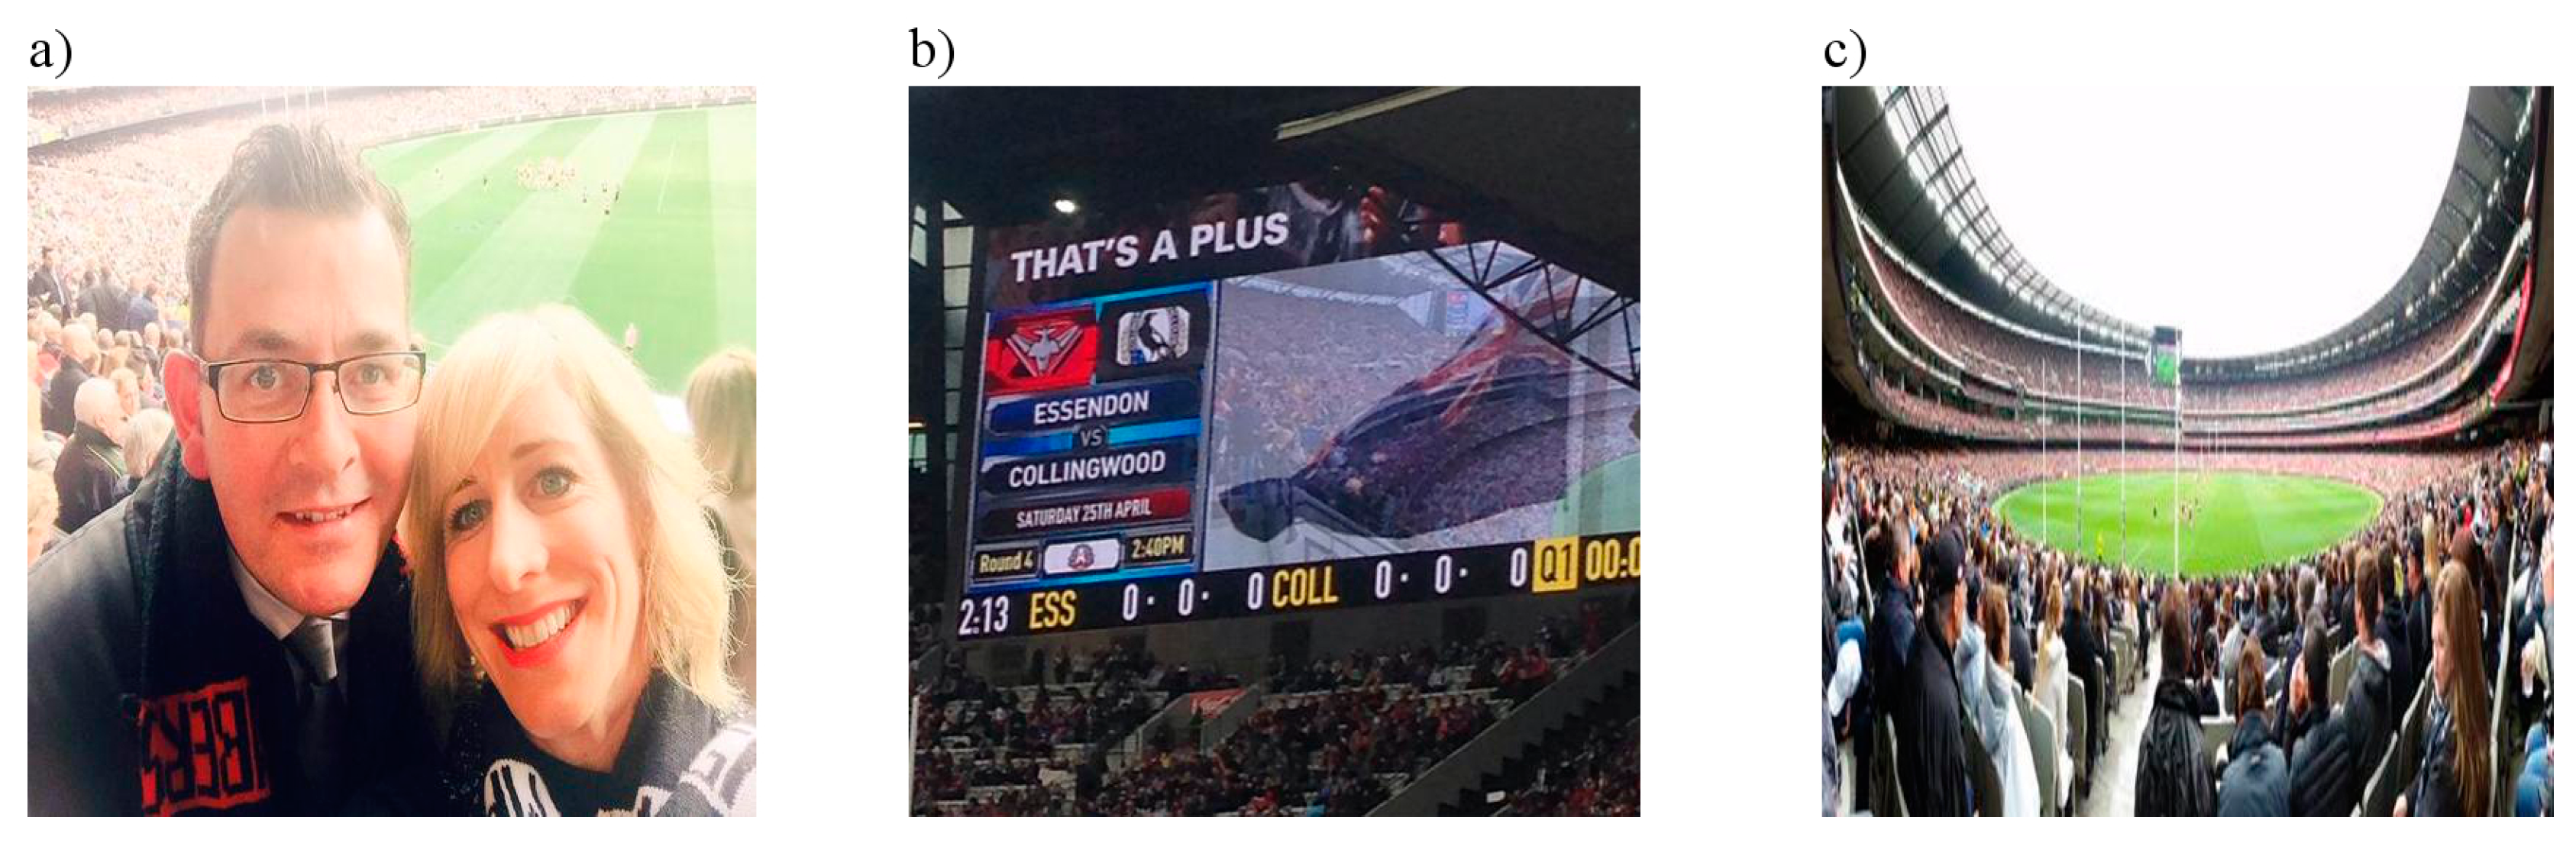
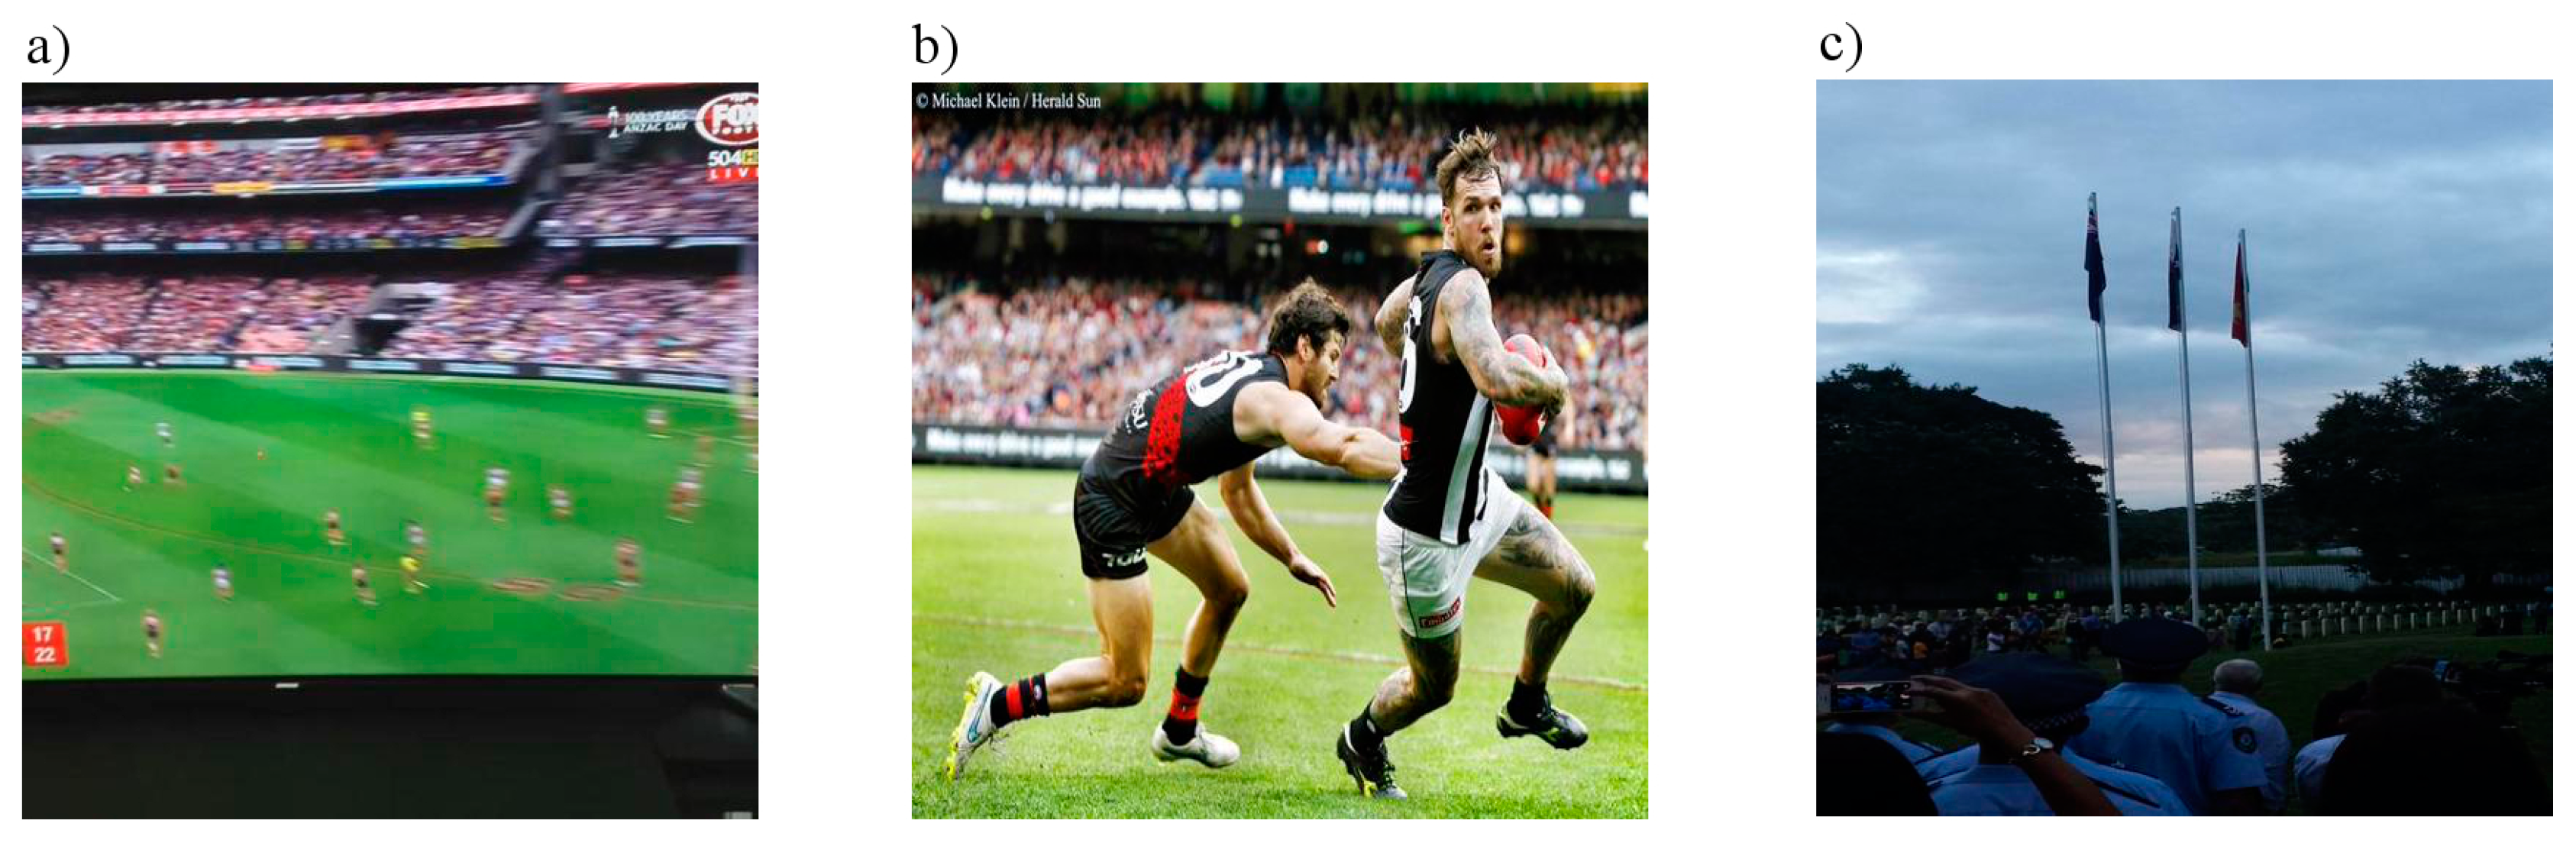
Table 1.
Summary description of case study events (times are AEST).
| Match | ANZAC Day: Essendon vs. Collingwood | Grand Final: West Coast vs. Hawthorn |
|---|---|---|
| Date | Saturday 25 April 2015 | Saturday 3 October 2015 |
| Match Time | 14:40–~17:00 | 14:40–~17:00 |
| Gates Open | ~11:00 | ~8:00 |
| Live Broadcast | 14:00–~17:00 | 14:00–~17:30 |
| Weather | Overcast, Rain | Sunny |
| Location | MCG | MCG |
| Attendance | 88,398 [52] | 98,633 [53] |
| TV ratings | 1298M [54] | 3524M [54] |
Table 2.
Summary of text and temporal sampling criteria for each micro-blog dataset (times are AEST).
Table 2.
Summary of text and temporal sampling criteria for each micro-blog dataset (times are AEST).
| Dataset Label | Text Criteria | Time Period |
|---|---|---|
| ANZAC Day on-hash (ADon) | Contains # afldonspies | 7:00–18:30 |
| ANZAC Day off-hash (ADoff) | Does not contain # afldonspies | 11:00–18:30 |
| Grand Final on-hash (GFon) | Contains # aflgf | 8:00–20:00 |
| Grand Final off-hash (GFoff) | Does not contain # aflgf | 8:00–20:00 |
Table 3.
The number of linked images contained in each dataset resulting from pre-processing to eliminate content that cannot support inferences of Witnessing OTG, such as non-original content.
Table 3.
The number of linked images contained in each dataset resulting from pre-processing to eliminate content that cannot support inferences of Witnessing OTG, such as non-original content.
| Dataset | No. Micro-Blogs | No. Micro-Blogs with Twitter/Instagram Image URLs | No. Twitter/Instagram Image URLs Processed | No. Images |
|---|---|---|---|---|
| ADon | 3260 | 322 | 353 | 285 |
| ADoff | 8791 | 1019 | 1075 | 510 |
| GFon | 9868 | 950 | 994 | 682 |
| GFoff | 14148 | 2137 | 2346 | 874 |
Table 4.
The visual topic categories detected in the ADon dataset including their description, summary statistics, evidence inference category, and training dataset category for the binary classification.
Table 4.
The visual topic categories detected in the ADon dataset including their description, summary statistics, evidence inference category, and training dataset category for the binary classification.
| Visual Topic Category Description | No. Images (% Total Images) | Evidence Inference Category | Training Dataset Category |
|---|---|---|---|
| View of MCG arena, typically includes the ground and stands, and the camera position is in the stands | 97 (34.0) | OTG | WA OTG |
| View of exterior of MCG, includes gates, and queues | 10 (3.5) | OTG | Other |
| View of a television or computer screen relaying the broadcast | 26 (9.1) | Not OTG | Other |
| Mainstream media photography, includes promotional material such as portraits of players | 46 (16.1) | No Evidence (NE) | Other |
| Selfies or portraits indeterminate locations | 40 (14.0) | NE | Other |
| Not real-life scenes, including statistical tables or graphs and animations | 26 (9.1) | NE | Other |
| Real-life scenes indeterminate locations | 13 (4.6) | NE | Other |
| AFL merchandise including close-ups of hats, shirts and footballs | 11 (3.8) | NE | Other |
| Screenshots from applications | 5 (1.7) | NE | Other |
| Other | 11 (3.9) | NE | Other |
Table 5.
The number of images categorized as WA OTG for each dataset.
| Dataset | ADon | ADoff | GFon | GFoff |
|---|---|---|---|---|
| No. WA OTG (% total images) | 97 (34%) | 32 (4%) | 54 (8%) | 9 (1%) |
Table 6.
Confusion Matrix results for baseline linear SVM classifier with 5-fold cross validation for the ADon dataset.
Table 6.
Confusion Matrix results for baseline linear SVM classifier with 5-fold cross validation for the ADon dataset.
| Training | Predicted | |
|---|---|---|
| Other | WA OTG | |
| Other | 169 | 19 |
| WA OTG | 10 | 87 |
Table 7.
Comparison of results achieved with different classifiers for the ADon dataset.
| Classifier | Accuracy % | WA OTG | Other | ||
|---|---|---|---|---|---|
| Prec. | Recall | Prec. | Recall | ||
| Decision Tree | 82.46 | 0.742 | 0.742 | 0.867 | 0.867 |
| Naïve Bayes | 83.51 | 0.727 | 0.825 | 0.903 | 0.840 |
| Random Forest | 89.82 | 0.905 | 0.784 | 0.896 | 0.957 |
| Linear SVM | 90.17 | 0.835 | 0.887 | 0.94 | 0.91 |
© 2017 by the authors. Licensee MDPI, Basel, Switzerland. This article is an open access article distributed under the terms and conditions of the Creative Commons Attribution (CC BY) license (http://creativecommons.org/licenses/by/4.0/).
Share and Cite
MDPI and ACS Style
Truelove, M.; Khoshelham, K.; McLean, S.; Winter, S.; Vasardani, M. Identifying Witness Accounts from Social Media Using Imagery. ISPRS Int. J. Geo-Inf. 2017, 6, 120. https://doi.org/10.3390/ijgi6040120
AMA Style
Truelove M, Khoshelham K, McLean S, Winter S, Vasardani M. Identifying Witness Accounts from Social Media Using Imagery. ISPRS International Journal of Geo-Information. 2017; 6(4):120. https://doi.org/10.3390/ijgi6040120
Chicago/Turabian StyleTruelove, Marie, Kourosh Khoshelham, Simon McLean, Stephan Winter, and Maria Vasardani. 2017. "Identifying Witness Accounts from Social Media Using Imagery" ISPRS International Journal of Geo-Information 6, no. 4: 120. https://doi.org/10.3390/ijgi6040120
Note that from the first issue of 2016, this journal uses article numbers instead of page numbers. See further details here.