Next Issue
Volume 6, July
Previous Issue
Volume 6, May


ISPRS Int. J. Geo-Inf., Volume 6, Issue 6 (June 2017) – 29 articles

Cover Story (view full-size image): 
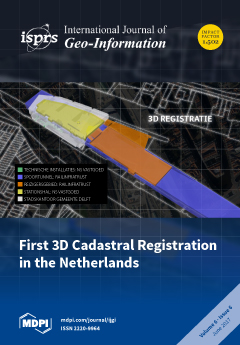
We present the first 3D cadastral registration in The Netherlands. The solution was sought within the current cadastral, organisational and technical frameworks to obtain optimal understanding of implementing a 3D registration, while avoiding discussions between experts from different domains. We present the developed methodology to represent legal volumes in an interactive 3D visualisation that can be registered in the land registers. The source data was the 3D Building Information Model (BIM) and the methodology was applied to two cases. Our research concludes that the registration of an interactive 3D visualisation in a multi-level property situation is possible and that it has significant advantages over a 2D approach. Further study is needed to implement the solution in a uniform way, from registration to queries and updates, and to develop a formal registration process accordingly. View the paper
  • Issues are regarded as officially published after their release is announced to the table of contents alert mailing list.
  • You may sign up for e-mail alerts to receive table of contents of newly released issues.
  • PDF is the official format for papers published in both, html and pdf forms. To view the papers in pdf format, click on the "PDF Full-text" link, and use the free Adobe Reader to open them.
Order results
Result details
Select all
Export citation of selected articles as:
3532 KiB  
Article
Quality Assessment Method for Linear Feature Simplification Based on Multi-Scale Spatial Uncertainty
by Jingsheng Zhai, Zhaoxing Li, Fang Wu, Hang Xie and Bo Zou
ISPRS Int. J. Geo-Inf. 2017, 6(6), 184; https://doi.org/10.3390/ijgi6060184 - 21 Jun 2017
Cited by 4 | Viewed by 3199
Abstract
This study discusses a method for quantitative quality assessment for the simplification of linear features. Considering the multi-scale nature of linear features, this paper combines the improved Douglas–Peucker method without threshold and the multiway tree model to construct a weighted hierarchical linear feature [...] Read more.
This study discusses a method for quantitative quality assessment for the simplification of linear features. Considering the multi-scale nature of linear features, this paper combines the improved Douglas–Peucker method without threshold and the multiway tree model to construct a weighted hierarchical linear feature representation model called the Douglas–Peucker Multiway Tree (DMC-tree). Subsequently, the uncertainty computation is conducted from the root of the DMC-Tree top-down level by level to obtain the quality indexes. Then, the quality index of the whole linear feature is obtained by combining the indexes of every layer together with their weights. The results of the presented method are compared with those of the length ratio method and the Hausdorff distance method. The results show the advantages of the presented method over the others, including (1) its sensitivity to feature points of multiple scales, (2) the quantitative characteristics of the indexes, and (3) the finer granularity in assessment. Full article
Show Figures

Figure 1

4825 KiB  
Article
“Turn Left after the WC, and Use the Lift to Go to the 2nd Floor”—Generation of Landmark-Based Route Instructions for Indoor Navigation
by Irene Fellner, Haosheng Huang and Georg Gartner
ISPRS Int. J. Geo-Inf. 2017, 6(6), 183; https://doi.org/10.3390/ijgi6060183 - 21 Jun 2017
Cited by 32 | Viewed by 5973
Abstract
People in unfamiliar environments often need navigation guidance to reach a destination. Research has found that compared to outdoors, people tend to lose orientation much more easily within complex buildings, such as university buildings and hospitals. This paper proposes a category-based method to [...] Read more.
People in unfamiliar environments often need navigation guidance to reach a destination. Research has found that compared to outdoors, people tend to lose orientation much more easily within complex buildings, such as university buildings and hospitals. This paper proposes a category-based method to generate landmark-based route instructions to support people’s wayfinding activities in unfamiliar indoor environments. Compared to other methods relying on detailed instance-level data about the visual, semantic, and structural characteristics of individual spatial objects, the proposed method relies on commonly available data about categories of spatial objects, which exist in most indoor spatial databases. With this, instructions like “Turn right after the second door, and use the elevator to go to the second floor” can be generated for indoor navigation. A case study with a university campus shows that the method is feasible in generating landmark-based route instructions for indoor navigation. More importantly, compared to metric-based instructions (i.e., the benchmark for indoor navigation), the generated landmark-based instructions can help users to unambiguously identify the correct decision point where a change of direction is needed, as well as offer information for the users to confirm that they are on the right way to the destination. Full article
Show Figures

Figure 1

259 KiB  
Article
Towards a Planetary Spatial Data Infrastructure
by Jason R. Laura, Trent M. Hare, Lisa R. Gaddis, Robin L. Fergason, James A. Skinner, Justin J. Hagerty and Brent A. Archinal
ISPRS Int. J. Geo-Inf. 2017, 6(6), 181; https://doi.org/10.3390/ijgi6060181 - 21 Jun 2017
Cited by 24 | Viewed by 5127
Abstract
Planetary science is the study of planets, moons, irregular bodies such as asteroids and the processes that create and modify them. Like terrestrial sciences, planetary science research is heavily dependent on collecting, processing and archiving large quantities of spatial data to support a [...] Read more.
Planetary science is the study of planets, moons, irregular bodies such as asteroids and the processes that create and modify them. Like terrestrial sciences, planetary science research is heavily dependent on collecting, processing and archiving large quantities of spatial data to support a range of activities. To address the complexity of storing, discovering, accessing, and utilizing spatial data, the terrestrial research community has developed conceptual Spatial Data Infrastructure (SDI) models and cyberinfrastructures. The needs that these systems seek to address for terrestrial spatial data users are similar to the needs of the planetary science community: spatial data should just work for the non-spatial expert. Here we discuss a path towards a Planetary Spatial Data Infrastructure (PSDI) solution that fulfills this primary need. We first explore the linkage between SDI models and cyberinfrastructures, then describe the gaps in current PSDI concepts, and discuss the overlap between terrestrial SDIs and a new, conceptual PSDI that best serves the needs of the planetary science community. Full article
Show Figures

Figure 1

4833 KiB  
Article
Experimental Evaluation of the Usability of Cartogram for Representation of GlobeLand30 Data
by Rui Han, Zhilin Li, Peng Ti and Zhu Xu
ISPRS Int. J. Geo-Inf. 2017, 6(6), 180; https://doi.org/10.3390/ijgi6060180 - 21 Jun 2017
Cited by 14 | Viewed by 6813
Abstract
GlobeLand30 is the world’s first global land cover dataset at 30 m resolution for two epochs, i.e., 2000 and 2010. On the official website, the data are represented by qualitative thematic maps which show the distribution of global land cover, and some proportional [...] Read more.
GlobeLand30 is the world’s first global land cover dataset at 30 m resolution for two epochs, i.e., 2000 and 2010. On the official website, the data are represented by qualitative thematic maps which show the distribution of global land cover, and some proportional symbol maps which are quantitative representations of land cover data. However, researchers have also argued that the cartogram, a kind of value-by-area representation, has some advantages over these maps in some cases, while others doubt their usability because of the possible distortion in shape. This led us to conduct an experimental evaluation of the usability of the cartogram for the representation of GlobeLand30. This experimental evaluation is a comparative analysis between the cartogram and the proportional symbol map to examine which is more effective in various kinds of quantitative analyses. The results show that the thematic map is better than the cartogram for the representation of quantity (e.g., area size), but the cartogram performs better in the representation of tendency distribution and areas’ multiple relationships. The usability of the cartogram is notably affected by map projection and the irregularity in area shapes, but the equal-area projection does not necessarily perform better than equidistance projection, especially at high latitudes. Full article
(This article belongs to the Special Issue Analysis and Applications of Global Land Cover Data)
Show Figures

Figure 1

3372 KiB  
Article
Retrieval and Comparison of Forest Leaf Area Index Based on Remote Sensing Data from AVNIR-2, Landsat-5 TM, MODIS, and PALSAR Sensors
by Wei Chen, Hang Yin, Kazuyuki Moriya, Tetsuro Sakai and Chunxiang Cao
ISPRS Int. J. Geo-Inf. 2017, 6(6), 179; https://doi.org/10.3390/ijgi6060179 - 21 Jun 2017
Cited by 7 | Viewed by 4881
Abstract
Remote sensing data from multi-source optical and SAR (Synthetic Aperture Radar) sensors have been widely utilized to detect forest dynamics under a variety of conditions. Due to different temporal coverage, spatial resolution, and spectral characteristics, these sensors usually perform differently from one another. [...] Read more.
Remote sensing data from multi-source optical and SAR (Synthetic Aperture Radar) sensors have been widely utilized to detect forest dynamics under a variety of conditions. Due to different temporal coverage, spatial resolution, and spectral characteristics, these sensors usually perform differently from one another. To conduct statistical modeling accuracies evaluation and comparison among several sensors, a linear statistical model was applied in this study for retrieval and comparative analysis based on remote-sensing indices from optical sensors of ALOS AVNIR-2 (Advanced Land Observing Satellite Advanced Visible and Near Infrared Radiometer type 2), Landsat-5 TM (Thematic Mapper), MODIS NBAR (Moderate Resolution Imaging Spectroradiometer Nadir BRDF-Adjusted Reflectance), and the SAR sensor of ALOS PALSAR (Advanced Land Observing Satellite Phased Array type L-band Synthetic Aperture Radar), respectively. This modeling used the forest leaf area index (LAI) as the field measured variable. During modeling, six optical vegetation indices were selected for evaluation and comparison between the three optical sensors, while simultaneously, two radar indices were calculated for the comparison between ALOS AVNIR-2 and PALSAR sensors. The gap between the spatial resolution of remote-sensing data and field plot size can account for the different accuracies found in this study. This study provides a reference for the selection of remote-sensing data types and spatial resolution in specific forest monitoring applications with different data acquisition costs and accuracy needs. Normally, at regional and national scales, remote sensing data with 30 m spatial resolution (e.g., Landsat) could provide significant results in the statistical modelling and retrieval of LAI while the MODIS cannot always meet the requirements. Full article
Show Figures

Figure 1

4804 KiB  
Article
Adaptive Surface Modeling of Soil Properties in Complex Landforms
by Wei Liu, Hai-Rong Zhang, Da-Peng Yan and Sheng-Li Wang
ISPRS Int. J. Geo-Inf. 2017, 6(6), 178; https://doi.org/10.3390/ijgi6060178 - 20 Jun 2017
Cited by 7 | Viewed by 4070
Abstract
Abstract: Spatial discontinuity often causes poor accuracy when a single model is used for the surface modeling of soil properties in complex geomorphic areas. Here we present a method for adaptive surface modeling of combined secondary variables to improve prediction accuracy during [...] Read more.
Abstract: Spatial discontinuity often causes poor accuracy when a single model is used for the surface modeling of soil properties in complex geomorphic areas. Here we present a method for adaptive surface modeling of combined secondary variables to improve prediction accuracy during the interpolation of soil properties (ASM-SP). Using various secondary variables and multiple base interpolation models, ASM-SP was used to interpolate soil K+ in a typical complex geomorphic area (Qinghai Lake Basin, China). Five methods, including inverse distance weighting (IDW), ordinary kriging (OK), and OK combined with different secondary variables (e.g., OK-Landuse, OK-Geology, and OK-Soil), were used to validate the proposed method. The mean error (ME), mean absolute error (MAE), root mean square error (RMSE), mean relative error (MRE), and accuracy (AC) were used as evaluation indicators. Results showed that: (1) The OK interpolation result is spatially smooth and has a weak bull's-eye effect, and the IDW has a stronger ‘bull’s-eye’ effect, relatively. They both have obvious deficiencies in depicting spatial variability of soil K+. (2) The methods incorporating combinations of different secondary variables (e.g., ASM-SP, OK-Landuse, OK-Geology, and OK-Soil) were associated with lower estimation bias. Compared with IDW, OK, OK-Landuse, OK-Geology, and OK-Soil, the accuracy of ASM-SP increased by 13.63%, 10.85%, 9.98%, 8.32%, and 7.66%, respectively. Furthermore, ASM-SP was more stable, with lower MEs, MAEs, RMSEs, and MREs. (3) ASM-SP presents more details than others in the abrupt boundary, which can render the result consistent with the true secondary variables. In conclusion, ASM-SP can not only consider the nonlinear relationship between secondary variables and soil properties, but can also adaptively combine the advantages of multiple models, which contributes to making the spatial interpolation of soil K+ more reasonable. Full article
Show Figures

Figure 1

1557 KiB  
Article
Multi-Feature Joint Sparse Model for the Classification of Mangrove Remote Sensing Images
by Yan-Min Luo, Yi Ouyang, Ren-Cheng Zhang and Hsuan-Ming Feng
ISPRS Int. J. Geo-Inf. 2017, 6(6), 177; https://doi.org/10.3390/ijgi6060177 - 20 Jun 2017
Cited by 13 | Viewed by 3795
Abstract
Mangroves are valuable contributors to coastal ecosystems, and remote sensing is an indispensable way to obtain knowledge of the dynamics of mangrove ecosystems. Due to the similar spectral features between mangroves and other land cover types, challenges are posed since the accuracy is [...] Read more.
Mangroves are valuable contributors to coastal ecosystems, and remote sensing is an indispensable way to obtain knowledge of the dynamics of mangrove ecosystems. Due to the similar spectral features between mangroves and other land cover types, challenges are posed since the accuracy is sometimes unsatisfactory in distinguishing mangroves from other land cover types with traditional classification methods. In this paper, we propose a classification method named the multi-feature joint sparse algorithm (MF-SRU), in which spectral, topographic, and textural features are integrated as the decision-making features, and sparse representation of both center pixels and their eight neighborhood pixels is proposed to represent the spatial correlation of neighboring pixels, which can make good use of the spatial correlation of adjacent pixels. Experiments are performed on Landsat Thematic Mapper multispectral remote sensing imagery in the Zhangjiang estuary in Southeastern China, and the results show that the proposed method can effectively improve the extraction accuracy of mangroves. Full article
(This article belongs to the Special Issue Advanced Geo-Information Technologies for Anticipatory Computing)
Show Figures

Figure 1

1285 KiB  
Article
Development and Comparison of Species Distribution Models for Forest Inventories
by Óscar Rodríguez de Rivera and Antonio López-Quílez
ISPRS Int. J. Geo-Inf. 2017, 6(6), 176; https://doi.org/10.3390/ijgi6060176 - 16 Jun 2017
Cited by 11 | Viewed by 4803
Abstract
A comparison of several statistical techniques common in species distribution modeling was developed during this study to evaluate and obtain the statistical model most accurate to predict the distribution of different forest tree species (in our case presence/absence data) according environmental variables. During [...] Read more.
A comparison of several statistical techniques common in species distribution modeling was developed during this study to evaluate and obtain the statistical model most accurate to predict the distribution of different forest tree species (in our case presence/absence data) according environmental variables. During the process we have developed maximum entropy (MaxEnt), classification and regression trees (CART), multivariate adaptive regression splines (MARS), showing the statistical basis of each model and, at the same time, we have developed a specific additive model to compare and validate their capability. To compare different results, the area under the receiver operating characteristic (ROC) function (AUC) was used. Every AUC value obtained with those models is significant and all of the models could be useful to represent the distribution of each species. Moreover, the additive model with thin plate splines gave the best results. The worst capability was obtained with MARS. This model’s performance was below average for several species. The additive model developed obtained better results because it allowed for changes and calibrations. In this case we were aware of all of the processes that occurred during the modeling. By contrast, models obtained using specific software, in general, perform like “hermetic machines”, because it could sometimes be impossible to understand the stages that led to the final results. Full article
(This article belongs to the Special Issue Spatial Ecology)
Show Figures

Figure 1

3074 KiB  
Article
Generalized Aggregation of Sparse Coded Multi-Spectra for Satellite Scene Classification
by Xian-Hua Han and Yen-wei Chen
ISPRS Int. J. Geo-Inf. 2017, 6(6), 175; https://doi.org/10.3390/ijgi6060175 - 16 Jun 2017
Cited by 4 | Viewed by 4647
Abstract
Satellite scene classification is challenging because of the high variability inherent in satellite data. Although rapid progress in remote sensing techniques has been witnessed in recent years, the resolution of the available satellite images remains limited compared with the general images acquired using [...] Read more.
Satellite scene classification is challenging because of the high variability inherent in satellite data. Although rapid progress in remote sensing techniques has been witnessed in recent years, the resolution of the available satellite images remains limited compared with the general images acquired using a common camera. On the other hand, a satellite image usually has a greater number of spectral bands than a general image, thereby permitting the multi-spectral analysis of different land materials and promoting low-resolution satellite scene recognition. This study advocates multi-spectral analysis and explores the middle-level statistics of spectral information for satellite scene representation instead of using spatial analysis. This approach is widely utilized in general image and natural scene classification and achieved promising recognition performance for different applications. The proposed multi-spectral analysis firstly learns the multi-spectral prototypes (codebook) for representing any pixel-wise spectral data, and then, based on the learned codebook, a sparse coded spectral vector can be obtained with machine learning techniques. Furthermore, in order to combine the set of coded spectral vectors in a satellite scene image, we propose a hybrid aggregation (pooling) approach, instead of conventional averaging and max pooling, which includes the benefits of the two existing methods, but avoids extremely noisy coded values. Experiments on three satellite datasets validated that the performance of our proposed approach is very impressive compared with the state-of-the-art methods for satellite scene classification. Full article
Show Figures

Figure 1

8527 KiB  
Article
Geospatial Big Data-Based Geostatistical Zonation of Seismic Site Effects in Seoul Metropolitan Area
by Han-Saem Kim, Chang-Guk Sun and Hyung-Ik Cho
ISPRS Int. J. Geo-Inf. 2017, 6(6), 174; https://doi.org/10.3390/ijgi6060174 - 15 Jun 2017
Cited by 19 | Viewed by 5098
Abstract
Seismic site effects are influenced mainly by geospatial uncertainties corresponding to geological or geotechnical spatial variance. Therefore, the development of a geospatial database is essential to characterize site-specific geotechnical information in multiscale areas and to optimize geospatial zonation methods with potentially high degrees [...] Read more.
Seismic site effects are influenced mainly by geospatial uncertainties corresponding to geological or geotechnical spatial variance. Therefore, the development of a geospatial database is essential to characterize site-specific geotechnical information in multiscale areas and to optimize geospatial zonation methods with potentially high degrees of spatial variability based on trial-and-error geostatistical assessments. In this study, a multi-source geospatial information framework, which included the construction of a big data platform, estimation of geostatistical density, optimization of the geostatistical interpolation method, assessment of seismic site effects, and determination of geospatial zonation for decision making, was established. Then, this framework was applied to the Seoul metropolitan area, South Korea. The GIS-based framework was established to develop the geospatial zonation of site-specific seismic site effects before considering the local characteristics of site effects dependent on topographic or geological conditions, based on a geospatial big-data platform in Seoul. The zonal conditions were composed of geo-layers, site effect parameters, and other multi-source geospatial maps for each administrative area, and infrastructure was determined based on the integration of the optimized geoprocessing framework. Full article
Show Figures

Figure 1

3714 KiB  
Article
Morphing of Building Footprints Using a Turning Angle Function
by Jingzhong Li, Xingong Li and Tian Xie
ISPRS Int. J. Geo-Inf. 2017, 6(6), 173; https://doi.org/10.3390/ijgi6060173 - 14 Jun 2017
Cited by 11 | Viewed by 3780
Abstract
We study the problem of morphing two polygons of building footprints at two different scales. This problem frequently occurs during the continuous zooming of interactive maps. The ground plan of a building footprint on a map has orthogonal characteristics, but traditional morphing methods [...] Read more.
We study the problem of morphing two polygons of building footprints at two different scales. This problem frequently occurs during the continuous zooming of interactive maps. The ground plan of a building footprint on a map has orthogonal characteristics, but traditional morphing methods cannot preserve these geographic characteristics at intermediate scales. We attempt to address this issue by presenting a turning angle function-based morphing model (TAFBM) that can generate polygons at an intermediate scale with an identical turning angle for each side. Thus, the orthogonal characteristics can be preserved during the entire interpolation. A case study demonstrates that the model yields good results when applied to data from a building map at various scales. During the continuous generalization, the orthogonal characteristics and their relationships with the spatial direction and topology are well preserved. Full article
Show Figures

Figure 1

3273 KiB  
Article
Application of a GIS-Based Slope Unit Method for Landslide Susceptibility Mapping along the Longzi River, Southeastern Tibetan Plateau, China
by Fei Wang, Peihua Xu, Changming Wang, Ning Wang and Nan Jiang
ISPRS Int. J. Geo-Inf. 2017, 6(6), 172; https://doi.org/10.3390/ijgi6060172 - 12 Jun 2017
Cited by 73 | Viewed by 8558
Abstract
The Longzi River Basin in Tibet is located along the edge of the Himalaya Mountains and is characterized by complex geological conditions and numerous landslides. To evaluate the susceptibility of landslide disasters in this area, eight basic factors were analyzed comprehensively in order [...] Read more.
The Longzi River Basin in Tibet is located along the edge of the Himalaya Mountains and is characterized by complex geological conditions and numerous landslides. To evaluate the susceptibility of landslide disasters in this area, eight basic factors were analyzed comprehensively in order to obtain a final susceptibility map. The eight factors are the slope angle, slope aspect, plan curvature, distance-to-fault, distance-to-river, topographic relief, annual precipitation, and lithology. Except for the rainfall factor, which was extracted from the grid cell, all the factors were extracted and classified by the slope unit, which is the basic unit in geological disaster development. The eight factors were superimposed using the information content method (ICM), and the weight of each factor was acquired through an analytic hierarchy process (AHP). The sensitivities of the landslides were divided into four categories: low, moderate, high, and very high, respectively, accounting for 22.76%, 38.64%, 27.51%, and 11.09% of the study area. The accuracies of the area under AUC using slope units and grid cells are 82.6% and 84.2%, respectively, and it means that the two methods are accurate in predicting landslide occurrence. The results show that the high and very high susceptibility areas are distributed throughout the vicinity of the river, with a large component in the north as well as a small portion in the middle and the south. Therefore, it is necessary to conduct landslide warnings in these areas, where the rivers are vast and the population is dense. The susceptibility map can reflect the comprehensive risk of each slope unit, which provides an important reference for later detailed investigations, including research and warning studies. Full article
Show Figures

Figure 1

9825 KiB  
Article
LandXML Encoding of Mixed 2D and 3D Survey Plans with Multi-Level Topology
by Rodney James Thompson, Peter Van Oosterom and Kean Huat Soon
ISPRS Int. J. Geo-Inf. 2017, 6(6), 171; https://doi.org/10.3390/ijgi6060171 - 12 Jun 2017
Cited by 19 | Viewed by 5384
Abstract
Cadastral spatial units around the world range from simple 2D parcels to complex 3D collections of spaces, defined at levels of sophistication from textural descriptions to complete, rigorous mathematical descriptions based on measurements and coordinates. The most common spatial unit in a cadastral [...] Read more.
Cadastral spatial units around the world range from simple 2D parcels to complex 3D collections of spaces, defined at levels of sophistication from textural descriptions to complete, rigorous mathematical descriptions based on measurements and coordinates. The most common spatial unit in a cadastral database is the 2D land parcel—the basic unit subject to cadastral Rights, Restrictions and Responsibilities (RRR). Built on this is a varying complexity of 3D subdivisions and secondary interests. Spatial units may also be subdivided into smaller units, with the remainder being kept as common property for the owners/tenants of the individual units. This has led to the adoption of hierarchical multi-level schemes. In this paper, we explore the encoding of spatial units in a way that highlights their 2D extent and topology, while fully defining their extent in the third dimension. Obviously, topological encoding itself is not new. However, having mixed a 2D and 3D topological structure is rather challenging. Therefore, despite the potential benefits of mixed 2D and 3D topology, it is currently not used in LandXML, one of the main and best documented formats when representing survey data. This paper presents a multi-level topological encoding for the purposes of survey plan representation in LandXML that is simple and efficient in space requirements, including the question of curved surfaces, (partly) unbounded spatial units, and grouping and division of 2D and 3D spatial units. No “off the shelf” software is available for validating newly lodged surveys and we present our prototype for this. It is further suggested that the conceptual model behind this encoding approach can be extend to the database schema itself. Full article
(This article belongs to the Special Issue Research and Development Progress in 3D Cadastral Systems)
Show Figures

Figure 1

5238 KiB  
Article
A Conceptual Model for Delineating Land Management Units (LMUs) Using Geographical Object-Based Image Analysis
by Deniz Gerçek
ISPRS Int. J. Geo-Inf. 2017, 6(6), 170; https://doi.org/10.3390/ijgi6060170 - 10 Jun 2017
Cited by 5 | Viewed by 4723
Abstract
Land management and planning is crucial for present and future use of land and the sustainability of land resources. Physical, biological and cultural characteristics of land can be used to define Land Management Units (LMUs) that aid in decision making for managing land [...] Read more.
Land management and planning is crucial for present and future use of land and the sustainability of land resources. Physical, biological and cultural characteristics of land can be used to define Land Management Units (LMUs) that aid in decision making for managing land and communicating information between different research and application domains. This study aims to describe the classification of ecologically relevant land units that are suitable for land management, planning and conservation purposes. Relying on the idea of strong correlation between landform and potential landcover, a conceptual model for creating Land Management Units (LMUs) from topographic data and biophysical information is presented. The proposed method employs a multi-level object-based classification of Digital Terrain Models (DTMs) to derive landform units. The sensitivity of landform units to changes in segmentation scale is examined, and the outcome of the landform classification is evaluated. Landform classes are then aggregated with landcover information to produce ecologically relevant landform/landcover assemblages. These conceptual units that constitute a framework of connected entities are finally enriched given available socio-economic information e.g., land use, ownership, protection status, etc. to generate LMUs. LMUs attached to a geographic database enable the retrieval of information at various levels to support decision making for land management at various scales. LMUs that are created present a basis for conservation and management in a biodiverse area in the Black Sea region of Turkey. Full article
Show Figures

Graphical abstract

5140 KiB  
Article
Geospatial Analysis of Earthquake Damage Probability of Water Pipelines Due to Multi-Hazard Failure
by Mohammad Eskandari, Babak Omidvar, Mahdi Modiri, Mohammad Ali Nekooie and Ali Asghar Alesheikh
ISPRS Int. J. Geo-Inf. 2017, 6(6), 169; https://doi.org/10.3390/ijgi6060169 - 09 Jun 2017
Cited by 18 | Viewed by 6017
Abstract
The main purpose of this study is to develop a Geospatial Information System (GIS) model with the ability to assess the seismic damage to pipelines for two well-known hazards, including ground shaking and ground failure simultaneously. The model that is developed and used [...] Read more.
The main purpose of this study is to develop a Geospatial Information System (GIS) model with the ability to assess the seismic damage to pipelines for two well-known hazards, including ground shaking and ground failure simultaneously. The model that is developed and used in this study includes four main parts of database implementation, seismic hazard analysis, vulnerability assessment and seismic damage assessment to determine the pipeline’s damage probability. This model was implemented for main water distribution pipelines of Iran and tested for two different earthquake scenarios. The final damage probability of pipelines was estimated to be about 74% for water distribution pipelines of Mashhad including 40% and 34% for leak and break, respectively. In the next step, the impact of each earthquake input parameter on this model was extracted, and each of the three parameters had a huge impact on changing the results of pipelines’ damage probability. Finally, the dependency of the model in liquefaction susceptibility, landslide susceptibility, vulnerability functions and segment length was checked out and specified that the model is sensitive just to liquefaction susceptibility and vulnerability functions. Full article
Show Figures

Figure 1

7750 KiB  
Article
Pan-Sharpening of Landsat-8 Images and Its Application in Calculating Vegetation Greenness and Canopy Water Contents
by Khan Rubayet Rahaman, Quazi K. Hassan and M. Razu Ahmed
ISPRS Int. J. Geo-Inf. 2017, 6(6), 168; https://doi.org/10.3390/ijgi6060168 - 07 Jun 2017
Cited by 31 | Viewed by 8793
Abstract
Pan-sharpening is the process of fusing higher spatial resolution panchromatic (PAN) with lower spatial resolution multispectral (MS) imagery to create higher spatial resolution MS images. Here, our overall objective was to pan-sharpen Landsat-8 images and calculate vegetation greenness (i.e., normalized difference vegetation index [...] Read more.
Pan-sharpening is the process of fusing higher spatial resolution panchromatic (PAN) with lower spatial resolution multispectral (MS) imagery to create higher spatial resolution MS images. Here, our overall objective was to pan-sharpen Landsat-8 images and calculate vegetation greenness (i.e., normalized difference vegetation index (NDVI)), canopy structure (i.e., enhanced vegetation index (EVI)), and canopy water content (i.e., normalized difference water index (NDWI))-related variables. Our proposed methods consisted of: (i) evaluating the relationships between PAN band (0.503–0.676 µm) with a spatial resolution of 15 m and individual MS bands of Landsat-8 from blue (i.e., acquiring in the range 0.452–0.512 µm), green (i.e., 0.533–0.590 µm), red (i.e., 0.636–0.673 µm), near infrared (NIR: 0.851–0.879 µm), shortwave infrared-I (SWIR-I: 1.566–1.651 µm), and SWIR-II (2.107–2.294 µm) bands with a spatial resolution of 30 m; (ii) determining the suitable individual MS bands to be enhanced into the spatial resolution of the PAN band; and (iii) calculating several vegetation greenness and canopy moisture indices (i.e., NDVI, EVI, NDWI-I, and NDWI-II) at 15 m spatial resolution and subsequent validation using their equivalent-values at a spatial resolution of 30 m. Our analysis revealed that strong linear relationships existed between the PAN and most of the MS individual bands of interest except NIR. For example, r2 values were 0.86–0.89 for blue band; 0.89–0.95 for green band; 0.84–0.96 for red band; 0.71–0.79 for SWIR-I band; and 0.71–0.83 for SWIR-II band. As a result, we performed smoothing filter-based intensity modulation method of pan-sharpening to enhance the spatial resolution of 30 m to 15 m. In calculating the vegetation indices, we used the enhanced MS images and resampled the NIR to 15 m. Finally, we evaluated these indices with their equivalents at 30 m spatial resolution and observed strong relationships (i.e., r2 values in the range 0.98–0.99 for NDVI, 0.95–0.98 for EVI, 0.98–1.00 for NDWI). Full article
Show Figures

Figure 1

5248 KiB  
Project Report
A High Performance, Spatiotemporal Statistical Analysis System Based on a Spatiotemporal Cloud Platform
by Baoxuan Jin, Weiwei Song, Kang Zhao, Xiaoyan Wei, Fei Hu and Yongyao Jiang
ISPRS Int. J. Geo-Inf. 2017, 6(6), 165; https://doi.org/10.3390/ijgi6060165 - 06 Jun 2017
Cited by 7 | Viewed by 4805
Abstract
With the increase in size and complexity of spatiotemporal data, traditional methods for performing statistical analysis are insufficient for meeting real-time requirements for mining information from Big Data, due to both data- and computing-intensive factors. To solve the Big Data challenges in geostatistics [...] Read more.
With the increase in size and complexity of spatiotemporal data, traditional methods for performing statistical analysis are insufficient for meeting real-time requirements for mining information from Big Data, due to both data- and computing-intensive factors. To solve the Big Data challenges in geostatistics and to support decision-making, a high performance, spatiotemporal statistical analysis system (Geostatistics-Hadoop) is proposed in this paper. The proposed system has several features: (1) Hadoop is enhanced to handle spatial data in a native format and execute a number of parallelized spatial analysis algorithms to solve practical geospatial analysis problems; (2) the Oozie-based workflow system is utilized to ease the operation and sharing of spatial analysis services; and (3) a private cloud platform based on Eucalyptus is leveraged to provide on-the-fly and elastic computing resources. Experimental results show that Geostatistics-Hadoop efficiently conducts rapid information mining and analysis of big spatiotemporal data sets, with the support of elastic computing resources from a cloud platform. The adoption of cloud computing and the Hadoop cluster to parallelize statistical calculations significantly improves the performance of Big Data analyses. Full article
Show Figures

Figure 1

8289 KiB  
Article
Construction of a Decision Support System Based on GP Services, Using a Warning–Judgment Module as an Example
by Xuejia Sang, Linfu Xue, Xiaopeng Leng, Jiwen Liu and Liang Zhan
ISPRS Int. J. Geo-Inf. 2017, 6(6), 167; https://doi.org/10.3390/ijgi6060167 - 05 Jun 2017
Cited by 1 | Viewed by 4013
Abstract
Decision-making departments need more detailed and timely data in order to meet the needs of emergency response. Sichuan province is an area that frequently suffers natural disasters, and many disasters are caused by rainfall. This study establishes a decision support system (DSS) based [...] Read more.
Decision-making departments need more detailed and timely data in order to meet the needs of emergency response. Sichuan province is an area that frequently suffers natural disasters, and many disasters are caused by rainfall. This study establishes a decision support system (DSS) based on geoprocessing (GP) services, which can locate the region that overran the rainfall threshold and provide the population or property analysis, query, map plot, and path analysis functions. Most of the functions of the system are developed on the basis of geoprocessing services. This paper uses the warning–judgment module as an example to introduce the structure and function of the DSS system. The system satisfies the demands of real-time data acquisition, calculation, analysis, and presentation. Full article
Show Figures

Figure 1

6611 KiB  
Article
A Knowledge-Driven Geospatially Enabled Framework for Geological Big Data
by Liang Wu, Lei Xue, Chaoling Li, Xia Lv, Zhanlong Chen, Baode Jiang, Mingqiang Guo and Zhong Xie
ISPRS Int. J. Geo-Inf. 2017, 6(6), 166; https://doi.org/10.3390/ijgi6060166 - 03 Jun 2017
Cited by 29 | Viewed by 5627
Abstract
Geologic survey procedures accumulate large volumes of structured and unstructured data. Fully exploiting the knowledge and information that are included in geological big data and improving the accessibility of large volumes of data are important endeavors. In this paper, which is based on [...] Read more.
Geologic survey procedures accumulate large volumes of structured and unstructured data. Fully exploiting the knowledge and information that are included in geological big data and improving the accessibility of large volumes of data are important endeavors. In this paper, which is based on the architecture of the geological survey information cloud-computing platform (GSICCP) and big-data-related technologies, we split geologic unstructured data into fragments and extract multi-dimensional features via geological domain ontology. These fragments are reorganized into a NoSQL (Not Only SQL) database, and then associations between the fragments are added. A specific class of geological questions was analyzed and transformed into workflow tasks according to the predefined rules and associations between fragments to identify spatial information and unstructured content. We establish a knowledge-driven geologic survey information smart-service platform (GSISSP) based on previous work, and we detail a study case for our research. The study case shows that all the content that has known relationships or semantic associations can be mined with the assistance of multiple ontologies, thereby improving the accuracy and comprehensiveness of geological information discovery. Full article
Show Figures

Figure 1

1291 KiB  
Article
Integration of Landscape Metrics and Variograms to Characterize and Quantify the Spatial Heterogeneity Change of Vegetation Induced by the 2008 Wenchuan Earthquake
by Ling Wang, Bingwei Tian, Katsuaki Koike, Buting Hong and Ping Ren
ISPRS Int. J. Geo-Inf. 2017, 6(6), 164; https://doi.org/10.3390/ijgi6060164 - 01 Jun 2017
Cited by 9 | Viewed by 4802
Abstract
The quantification of spatial heterogeneity can be used to examine the structure of ecological systems. The 2008 Wenchuan earthquake caused severe vegetation damage. In addition to simply detecting change, the magnitude of changes must also be examined. Remote sensing and geographic information system [...] Read more.
The quantification of spatial heterogeneity can be used to examine the structure of ecological systems. The 2008 Wenchuan earthquake caused severe vegetation damage. In addition to simply detecting change, the magnitude of changes must also be examined. Remote sensing and geographic information system techniques were used to produce landscape maps before and after the earthquake and analyze the spatial-temporal change of the vegetation pattern. Landscape metrics were selected to quantify the spatial heterogeneity in a categorical map at both the class and landscape levels. The results reveal that the Wenchuan earthquake greatly increased the heterogeneity in the study area. In particular, forests experienced the most fragmentation among all of the landscape types. In addition, spatial heterogeneity in a numerical map was studied by using variogram analysis of normalized difference vegetation indices derived from Landsat images. In comparison to before the earthquake, the spatial variability after the earthquake had doubled. The structure of the spatial heterogeneity represented by the range of normalized difference vegetation index (NDVI) variograms also changed due to the earthquake. Moreover, the results of the NDVI variogram analysis of three contrasting landscapes, which were farmland, broadleaved forest, and coniferous forest, confirm that the earthquake produced spatial variability and changed the structure of the landscapes. Regardless of before or after the earthquake, farmland sites are the most heterogeneous among the three landscapes studied. Full article
Show Figures

Figure 1

2339 KiB  
Article
Efficient Location Privacy-Preserving k-Anonymity Method Based on the Credible Chain
by Hui Wang, Haiping Huang, Yuxiang Qin, Yunqi Wang and Min Wu
ISPRS Int. J. Geo-Inf. 2017, 6(6), 163; https://doi.org/10.3390/ijgi6060163 - 01 Jun 2017
Cited by 15 | Viewed by 4111
Abstract
Currently, although prevalent location privacy methods based on k-anonymizing spatial regions (K-ASRs) can achieve privacy protection by sacrificing the quality of service (QoS), users cannot obtain accurate query results. To address this problem, it proposes a new location privacy-preserving k-anonymity method [...] Read more.
Currently, although prevalent location privacy methods based on k-anonymizing spatial regions (K-ASRs) can achieve privacy protection by sacrificing the quality of service (QoS), users cannot obtain accurate query results. To address this problem, it proposes a new location privacy-preserving k-anonymity method based on the credible chain with two major features. First, the optimal k value for the current user is determined according to the user’s environment and social attributes. Second, rather than forming an anonymizing spatial region (ASR), the trusted third party (TTP) generates a fake trajectory that contains k location nodes based on properties of the credible chain. In addition, location-based services (LBS) queries are conducted based on the trajectory, and privacy level is evaluated by instancing θ privacy. Simulation results and experimental analysis demonstrate the effectiveness and availability of the proposed method. Compared with methods based on ASR, the proposed method guarantees 100% QoS. Full article
(This article belongs to the Special Issue Applications of Internet of Things)
Show Figures

Figure 1

3134 KiB  
Article
Management System for Dam-Break Hazard Mapping in a Complex Basin Environment
by Jian Mao, Shandong Wang, Jianhua Ni, Changbai Xi and Jiechen Wang
ISPRS Int. J. Geo-Inf. 2017, 6(6), 162; https://doi.org/10.3390/ijgi6060162 - 01 Jun 2017
Cited by 18 | Viewed by 6004
Abstract
Flood disasters from dam breaks cause serious loss of human life and immense damage to infrastructure and economic stability. The application of Geographic Information System technology integrated with hydrological modeling for mapping flood-inundated areas and depth can play a momentous role in further [...] Read more.
Flood disasters from dam breaks cause serious loss of human life and immense damage to infrastructure and economic stability. The application of Geographic Information System technology integrated with hydrological modeling for mapping flood-inundated areas and depth can play a momentous role in further minimizing the risk and possible damage. In the present study, base terrain data, hydrological data, and dam engineering data were integrated using the MIKE-21 dam-break model to analyze flood routing under the most serious scenarios. A deterministic approach was used to calculate the hydraulic elements of dam breakage during a flood. Additionally, the hydraulic elements generated by the MIKE-21 dam-break model (a modelling system for estuaries, coastal waters, and seas)—including flood depth, submersion time, and flow direction—were integrated with a digital elevation model of the site downstream of the dam in order to map the possible affected areas. Using an empirical model in addition to using the superimposition of dam flood calculation results and the social and economic survey data, dam damage assessment was implemented. In accordance with a relevant standard, the flood risk mapping guidelines and a set of client/server structures were developed for a management system for dam-break hazard mapping of the Foziling reservoir. The simulation data and the study results can provide a scientific basis for emergency management of the reservoir and provide a socio-economic framework for downstream areas. Full article
Show Figures

Figure 1

2085 KiB  
Article
A Multiple Ant Colony Optimization Algorithm for Indoor Room Optimal Spatial Allocation
by Lina Yang, Xu Sun, Axing Zhu and Tianhe Chi
ISPRS Int. J. Geo-Inf. 2017, 6(6), 161; https://doi.org/10.3390/ijgi6060161 - 01 Jun 2017
Cited by 12 | Viewed by 5391
Abstract
Indoor room optimal allocation is of great importance in geographic information science (GIS) applications because it can generate effective indoor spatial patterns that improve human behavior and efficiency. However, few research concerning indoor room optimal allocation has been reported. Using an office building [...] Read more.
Indoor room optimal allocation is of great importance in geographic information science (GIS) applications because it can generate effective indoor spatial patterns that improve human behavior and efficiency. However, few research concerning indoor room optimal allocation has been reported. Using an office building as an example, this paper presents an integrative approach for indoor room optimal allocation, which includes an indoor room allocation optimization model, indoor connective map design, and a multiple ant colony optimization (MACO) algorithm. The mathematical optimization model is a minimized model that integrates three types of area-weighted costs while considering the minimal requirements of each department to be allocated. The indoor connective map, which is an essential data input, is abstracted by all floor plan space partitions and connectivity between every two adjacent floors. A MACO algorithm coupled with three strategies, namely, (1) heuristic information, (2) two-colony rules, and (3) local search, is effective in achieving a feasible solution of satisfactory quality within a reasonable computation time. A case study was conducted to validate the proposed approach. The results show that the MACO algorithm with these three strategies outperforms other types of ant colony optimization (ACO), Genetic Algorithm (GA), and particle swarm optimization (PSO) algorithms in quality and stability, which demonstrates that the proposed approach is an effective technique for generating optimal indoor room spatial patterns. Full article
(This article belongs to the Special Issue 3D Indoor Modelling and Navigation)
Show Figures

Figure 1

2116 KiB  
Article
A Map Spectrum-Based Spatiotemporal Clustering Method for GDP Variation Pattern Analysis Using Nighttime Light Images of the Wuhan Urban Agglomeration
by Penglin Zhang, Shuaijun Liu and Juan Du
ISPRS Int. J. Geo-Inf. 2017, 6(6), 160; https://doi.org/10.3390/ijgi6060160 - 31 May 2017
Cited by 13 | Viewed by 4091
Abstract
Estimates of gross domestic product (GDP) play a significant role in evaluating the economic performance of a country or region. Understanding the spatiotemporal process of GDP growth is important for estimating or monitoring the economic state of a region. Various GDP studies have [...] Read more.
Estimates of gross domestic product (GDP) play a significant role in evaluating the economic performance of a country or region. Understanding the spatiotemporal process of GDP growth is important for estimating or monitoring the economic state of a region. Various GDP studies have been reported, and several studies have focused on spatiotemporal GDP variations. This study presents a map spectrum-based clustering approach to analyze the spatiotemporal variation patterns of GDP growth. First, a sequence of nighttime light images (from the Defense Meteorological Satellite Program-Operational Linescan System (DMSP-OLS)) is used to support the spatial distribution of statistical GDP data. Subsequently, the time spectrum of each spatial unit is generated using a time series of dasymetric GDP maps, and then the spatial units with similar time spectra are clustered into one class. Each category has a similar spatiotemporal GDP variation pattern. Finally, the proposed approach is applied to analyze the spatiotemporal patterns of GDP growth in the Wuhan urban agglomeration. The experimental results illustrated regional discrepancies of GDP growth existed in the study area. Full article
Show Figures

Figure 1

4931 KiB  
Article
A Method of Ship Detection under Complex Background
by Ting Nie, Bin He, Guoling Bi, Yu Zhang and Wensheng Wang
ISPRS Int. J. Geo-Inf. 2017, 6(6), 159; https://doi.org/10.3390/ijgi6060159 - 31 May 2017
Cited by 24 | Viewed by 5213
Abstract
The detection of ships in optical remote sensing images with clouds, waves, and other complex interferences is a challenging task with broad applications. Two main obstacles for ship target detection are how to extract candidates in a complex background, and how to confirm [...] Read more.
The detection of ships in optical remote sensing images with clouds, waves, and other complex interferences is a challenging task with broad applications. Two main obstacles for ship target detection are how to extract candidates in a complex background, and how to confirm targets in the event that targets are similar to false alarms. In this paper, we propose an algorithm based on extended wavelet transform and phase saliency map (PSMEWT) to solve these issues. First, multi-spectral data fusion was utilized to separate the sea and land areas, and the morphological method was used to remove isolated holes. Second, extended wavelet transform (EWT) and phase saliency map were combined to solve the problem of extracting regions of interest (ROIs) from a complex background. The sea area was passed through the low-pass and high-pass filter to obtain three transformed coefficients, and the adjacent high frequency sub-bands were multiplied for the final result of the EWT. The visual phase saliency map of the product was built, and locations of ROIs were obtained by dynamic threshold segmentation. Contours of the ROIs were extracted by texture segmentation. Morphological, geometric, and 10-dimensional texture features of ROIs were extracted for target confirmation. Support vector machine (SVM) was used to judge whether targets were true. Experiments showed that our algorithm was insensitive to complex sea interferences and very robust compared with other state-of-the-art methods, and the recall rate of our algorithm was better than 90%. Full article
Show Figures

Figure 1

2391 KiB  
Article
Registration of Multi-Level Property Rights in 3D in The Netherlands: Two Cases and Next Steps in Further Implementation
by Jantien Stoter, Hendrik Ploeger, Ruben Roes, Els van der Riet, Filip Biljecki, Hugo Ledoux, Dirco Kok and Sangmin Kim
ISPRS Int. J. Geo-Inf. 2017, 6(6), 158; https://doi.org/10.3390/ijgi6060158 - 31 May 2017
Cited by 43 | Viewed by 6825
Abstract
This article reports on the first 3D cadastral registration in The Netherlands, accomplished in March 2016. The solution was sought within the current cadastral, organisational, and technical frameworks to obtain a deeper knowledge on the optimal way of implementing 3D registration, while avoiding [...] Read more.
This article reports on the first 3D cadastral registration in The Netherlands, accomplished in March 2016. The solution was sought within the current cadastral, organisational, and technical frameworks to obtain a deeper knowledge on the optimal way of implementing 3D registration, while avoiding discussions between experts from different domains. The article presents the developed methodology to represent legal volumes in an interactive 3D visualisation that can be registered in the land registers. The source data is the 3D Building Information Model (BIM). The methodology is applied to two cases: (1) the case of the railway station in Delft, resulting in the actual 3D registration in 2016; and (2) a building complex in Amsterdam, improving the Delft-case and providing the possibility to describe a general workflow from design data to a legal document. An evaluation provides insights for an improved cadastral registration of multi-level property rights. The main conclusion is that in specific situations, a 3D approach has important advantages for cadastral registration over a 2D approach. Further study is needed to implement the solution in a standardised and uniform way, from registration to querying and updating in the future, and to develop a formal registration process accordingly. Full article
(This article belongs to the Special Issue Research and Development Progress in 3D Cadastral Systems)
Show Figures

Figure 1

5358 KiB  
Article
Extraction of Terraces on the Loess Plateau from High-Resolution DEMs and Imagery Utilizing Object-Based Image Analysis
by Hanqing Zhao, Xuan Fang, Hu Ding, Strobl Josef, Liyang Xiong, Jiaming Na and Guoan Tang
ISPRS Int. J. Geo-Inf. 2017, 6(6), 157; https://doi.org/10.3390/ijgi6060157 - 27 May 2017
Cited by 41 | Viewed by 5963
Abstract
Abstract: Terraces are typical artificial landforms on the Loess Plateau, with ecological functions in water and soil conservation, agricultural production, and biodiversity. Recording the spatial distribution of terraces is the basis of monitoring their extent and understanding their ecological effects. The current [...] Read more.
Abstract: Terraces are typical artificial landforms on the Loess Plateau, with ecological functions in water and soil conservation, agricultural production, and biodiversity. Recording the spatial distribution of terraces is the basis of monitoring their extent and understanding their ecological effects. The current terrace extraction method mainly relies on high-resolution imagery, but its accuracy is limited due to vegetation coverage distorting the features of terraces in imagery. High-resolution topographic data reflecting the morphology of true terrace surfaces are needed. Terraces extraction on the Loess Plateau is challenging because of the complex terrain and diverse vegetation after the implementation of “vegetation recovery”. This study presents an automatic method of extracting terraces based on 1 m resolution digital elevation models (DEMs) and 0.3 m resolution Worldview-3 imagery as auxiliary information used for object-based image analysis (OBIA). A multi-resolution segmentation method was used where slope, positive and negative terrain index (PN), accumulative curvature slope (AC), and slope of slope (SOS) were determined as input layers for image segmentation by correlation analysis and Sheffield entropy method. The main classification features based on DEMs were chosen from the terrain features derived from terrain factors and texture features by gray-level co-occurrence matrix (GLCM) analysis; subsequently, these features were determined by the importance analysis on classification and regression tree (CART) analysis. Extraction rules based on DEMs were generated from the classification features with a total classification accuracy of 89.96%. The red band and near-infrared band of images were used to exclude construction land, which is easily confused with small-size terraces. As a result, the total classification accuracy was increased to 94%. The proposed method ensures comprehensive consideration of terrain, texture, shape, and spectrum characteristics, demonstrating huge potential in hilly-gully loess region with similarly complex terrain and diverse vegetation covers. Full article
Show Figures

Figure 1

4116 KiB  
Article
An Efficient Vector-Raster Overlay Algorithm for High-Accuracy and High-Efficiency Surface Area Calculations of Irregularly Shaped Land Use Patches
by Peng Xie, Yaolin Liu, Qingsong He, Xiang Zhao and Jun Yang
ISPRS Int. J. Geo-Inf. 2017, 6(6), 156; https://doi.org/10.3390/ijgi6060156 - 27 May 2017
Cited by 3 | Viewed by 4651
Abstract
The Earth’s surface is uneven, and conventional area calculation methods are based on the assumption that the projection plane area can be obtained without considering the actual undulation of the Earth’s surface and by simplifying the Earth’s shape to be a standard ellipsoid. [...] Read more.
The Earth’s surface is uneven, and conventional area calculation methods are based on the assumption that the projection plane area can be obtained without considering the actual undulation of the Earth’s surface and by simplifying the Earth’s shape to be a standard ellipsoid. However, the true surface area is important for investigating and evaluating land resources. In this study, the authors propose a new method based on an efficient vector-raster overlay algorithm (VROA-based method) to calculate the surface areas of irregularly shaped land use patches. In this method, a surface area raster file is first generated based on the raster-based digital elevation model (raster-based DEM). Then, a vector-raster overlay algorithm (VROA) is used that considers the precise clipping of raster cells using the vector polygon boundary. Xiantao City, Luotian County, and the Shennongjia Forestry District, which are representative of a plain landform, a hilly topography, and a mountain landscape, respectively, are selected to calculate the surface area. Compared with a traditional method based on triangulated irregular networks (TIN-based method), our method significantly reduces the processing time. In addition, our method effectively improves the accuracy compared with another traditional method based on raster-based DEM (raster-based method). Therefore, the method satisfies the requirements of large-scale engineering applications. Full article
Show Figures

Figure 1

1648 KiB  
Article
Evaluation of Device-Independent Internet Spatial Location
by Dan Komosny, Paul Pang, Miralem Mehic and Miroslav Voznak
ISPRS Int. J. Geo-Inf. 2017, 6(6), 155; https://doi.org/10.3390/ijgi6060155 - 27 May 2017
Cited by 1 | Viewed by 4977
Abstract
Device-independent Internet spatial location is needed for many purposes, such as data personalisation and social behaviour analysis. Internet spatial databases provide such locations based the IP address of a device. The free to use databases are natively included into many UNIX and Linux [...] Read more.
Device-independent Internet spatial location is needed for many purposes, such as data personalisation and social behaviour analysis. Internet spatial databases provide such locations based the IP address of a device. The free to use databases are natively included into many UNIX and Linux operating systems. These systems are predominantly used for e-shops, social networks, and cloud data storage. Using a constructed ground truth dataset, we comprehensively evaluate these databases for null responses, returned country/region/city, and distance error. The created ground truth dataset differs from others by covering cities with both low and high populations and maintaining only devices that follow the rule of one IP address per ISP (Internet Service Provider) and per city. We define two new performance metrics that show the effect of city population and trustworthiness of the results. We also evaluate the databases against an alternative measurement-based approach. We study the reasons behind the results. The data evaluated comes from Europe. The results may be of use for engineers, developers and researchers that use the knowledge of geographical location for related data processing and analysis, such as marketing. Full article
Show Figures

Figure 1

Previous Issue
Next Issue
Back to TopTop