Article

Application of a GIS-Based Slope Unit Method for Landslide Susceptibility Mapping along the Longzi River, Southeastern Tibetan Plateau, China

College of Construction Engineering, Jilin University, Changchun 130026, China
*
Author to whom correspondence should be addressed.
ISPRS Int. J. Geo-Inf. 2017, 6(6), 172; https://doi.org/10.3390/ijgi6060172
Submission received: 30 March 2017 / Revised: 11 June 2017 / Accepted: 11 June 2017 / Published: 12 June 2017

Abstract

:
The Longzi River Basin in Tibet is located along the edge of the Himalaya Mountains and is characterized by complex geological conditions and numerous landslides. To evaluate the susceptibility of landslide disasters in this area, eight basic factors were analyzed comprehensively in order to obtain a final susceptibility map. The eight factors are the slope angle, slope aspect, plan curvature, distance-to-fault, distance-to-river, topographic relief, annual precipitation, and lithology. Except for the rainfall factor, which was extracted from the grid cell, all the factors were extracted and classified by the slope unit, which is the basic unit in geological disaster development. The eight factors were superimposed using the information content method (ICM), and the weight of each factor was acquired through an analytic hierarchy process (AHP). The sensitivities of the landslides were divided into four categories: low, moderate, high, and very high, respectively, accounting for 22.76%, 38.64%, 27.51%, and 11.09% of the study area. The accuracies of the area under AUC using slope units and grid cells are 82.6% and 84.2%, respectively, and it means that the two methods are accurate in predicting landslide occurrence. The results show that the high and very high susceptibility areas are distributed throughout the vicinity of the river, with a large component in the north as well as a small portion in the middle and the south. Therefore, it is necessary to conduct landslide warnings in these areas, where the rivers are vast and the population is dense. The susceptibility map can reflect the comprehensive risk of each slope unit, which provides an important reference for later detailed investigations, including research and warning studies.

1. Introduction

Landslide susceptibility denotes the probability of a landslide occurring in an area based on the local geo-environment [1,2,3]. The identification and susceptibility mapping of landslide regions are significantly important for landslide hazard early warnings, especially because the use of mapping can reduce numerous losses, including building facilities, injury, and property damage.
Landslide occurrence is related to various factors, such as precipitation, geology, distance-to-fault, vegetation, and topography, which altogether encompass the attributes of landslide susceptibility mapping [4,5,6]. In recent years, different models have been used for landslide susceptibility mapping, such as an analytical hierarchy process [7,8,9], logistic regression [10,11], an artificial neural network [12,13], support vector machines [14,15], the entropy method, and the frequency ratio method [16]. Many methods use either a subjective evaluation or an objective evaluation, which limited itself the efficacy of the approach. Therefore, it is necessary to combine the subjective and objective evaluation methods [17].
The Analytical Hierarchy Process (AHP) is an expert-based evaluation method that is often applied in landslide susceptibility assessment and mapping [18]. According to the importance of the influencing factors, comparison matrices are obtained by experts, which is an important prerequisite for landslide hazard assessment [19]. However, the AHP method has the limitation of identifying the uncertainty associated with spatial outputs. The information content method (ICM) is an objective analysis method based on mathematical statistics. With the advent of GIS technology, the combination of the information content method (ICM) and analytic hierarchy process (AHP) approaches boasts a higher prediction accuracy [20]. Consequently, the combined approach was used in the Longzi River area in Tibet, trying to get rid of the shortcomings of the alternative methods.
Based on geological information available from remote sensing data and digital elevation models (DEMs), slope units are acquired by means of geomorphic units and watershed classifications. The significance of breaks in the slope during the quantitative evaluation of landforms was confirmed by Savigear, Cox, and Francou [21,22,23], who developed a method to manually interpret the profile of the slope unit. Carrara and Guzzetti thereafter proposed the slope unit method and proved the reliability of the approach by predicting landslide susceptibility in Umbria [24,25,26,27,28]. In this study, the slope unit was introduced into the evaluation system. The slope unit retains the integrity of the geological units, which can truly reflect the geomorphological characteristics of a landslide and the spatial characteristics of the valley. Consequently, the evaluation process is able to reflect the physical mechanisms responsible for the landslide, therefore improving the reliability of the evaluation results [29].
The study area is located in the Longzi River Basin in Tibet and belongs to the Yarlung Zangbo suture zone within the Himalayan block. The deep-cutting erosion of the river continuously shapes the unique landforms of the river valley. The villages on either side of the river are widely distributed and densely populated, and as a consequence, over 2400 people are constantly threatened by landslides. First, field surveys were performed and measurements were acquired with the assistance of GIS technology in order to construct 41 landslide datasets. Second, the eight aforementioned influencing factors were chosen to conduct an evaluation of landslide susceptibility. Third, the information of each factor was extracted using the slope unit, which was the basic evaluation unit. Subsequently, a landslide susceptibility evaluation system was established using GIS technology. Finally, the slope unit method was compared with the grid cell method, and the accuracy of the approach was verified according to historical landslide data and an evaluation accuracy analysis method.
In this paper, we constructed a landslide susceptibility model through slope units for the region along the Longzi River, Southeastern Tibetan Plateau, China. The landslide susceptibility was first presented using slope units. The innovation of this paper is that the slope unit method and the grid cell method are compared in the landslide susceptibility assessment. Results are discussed and a new evaluation framework is proposed based on the slope unit method.

2. Methodology

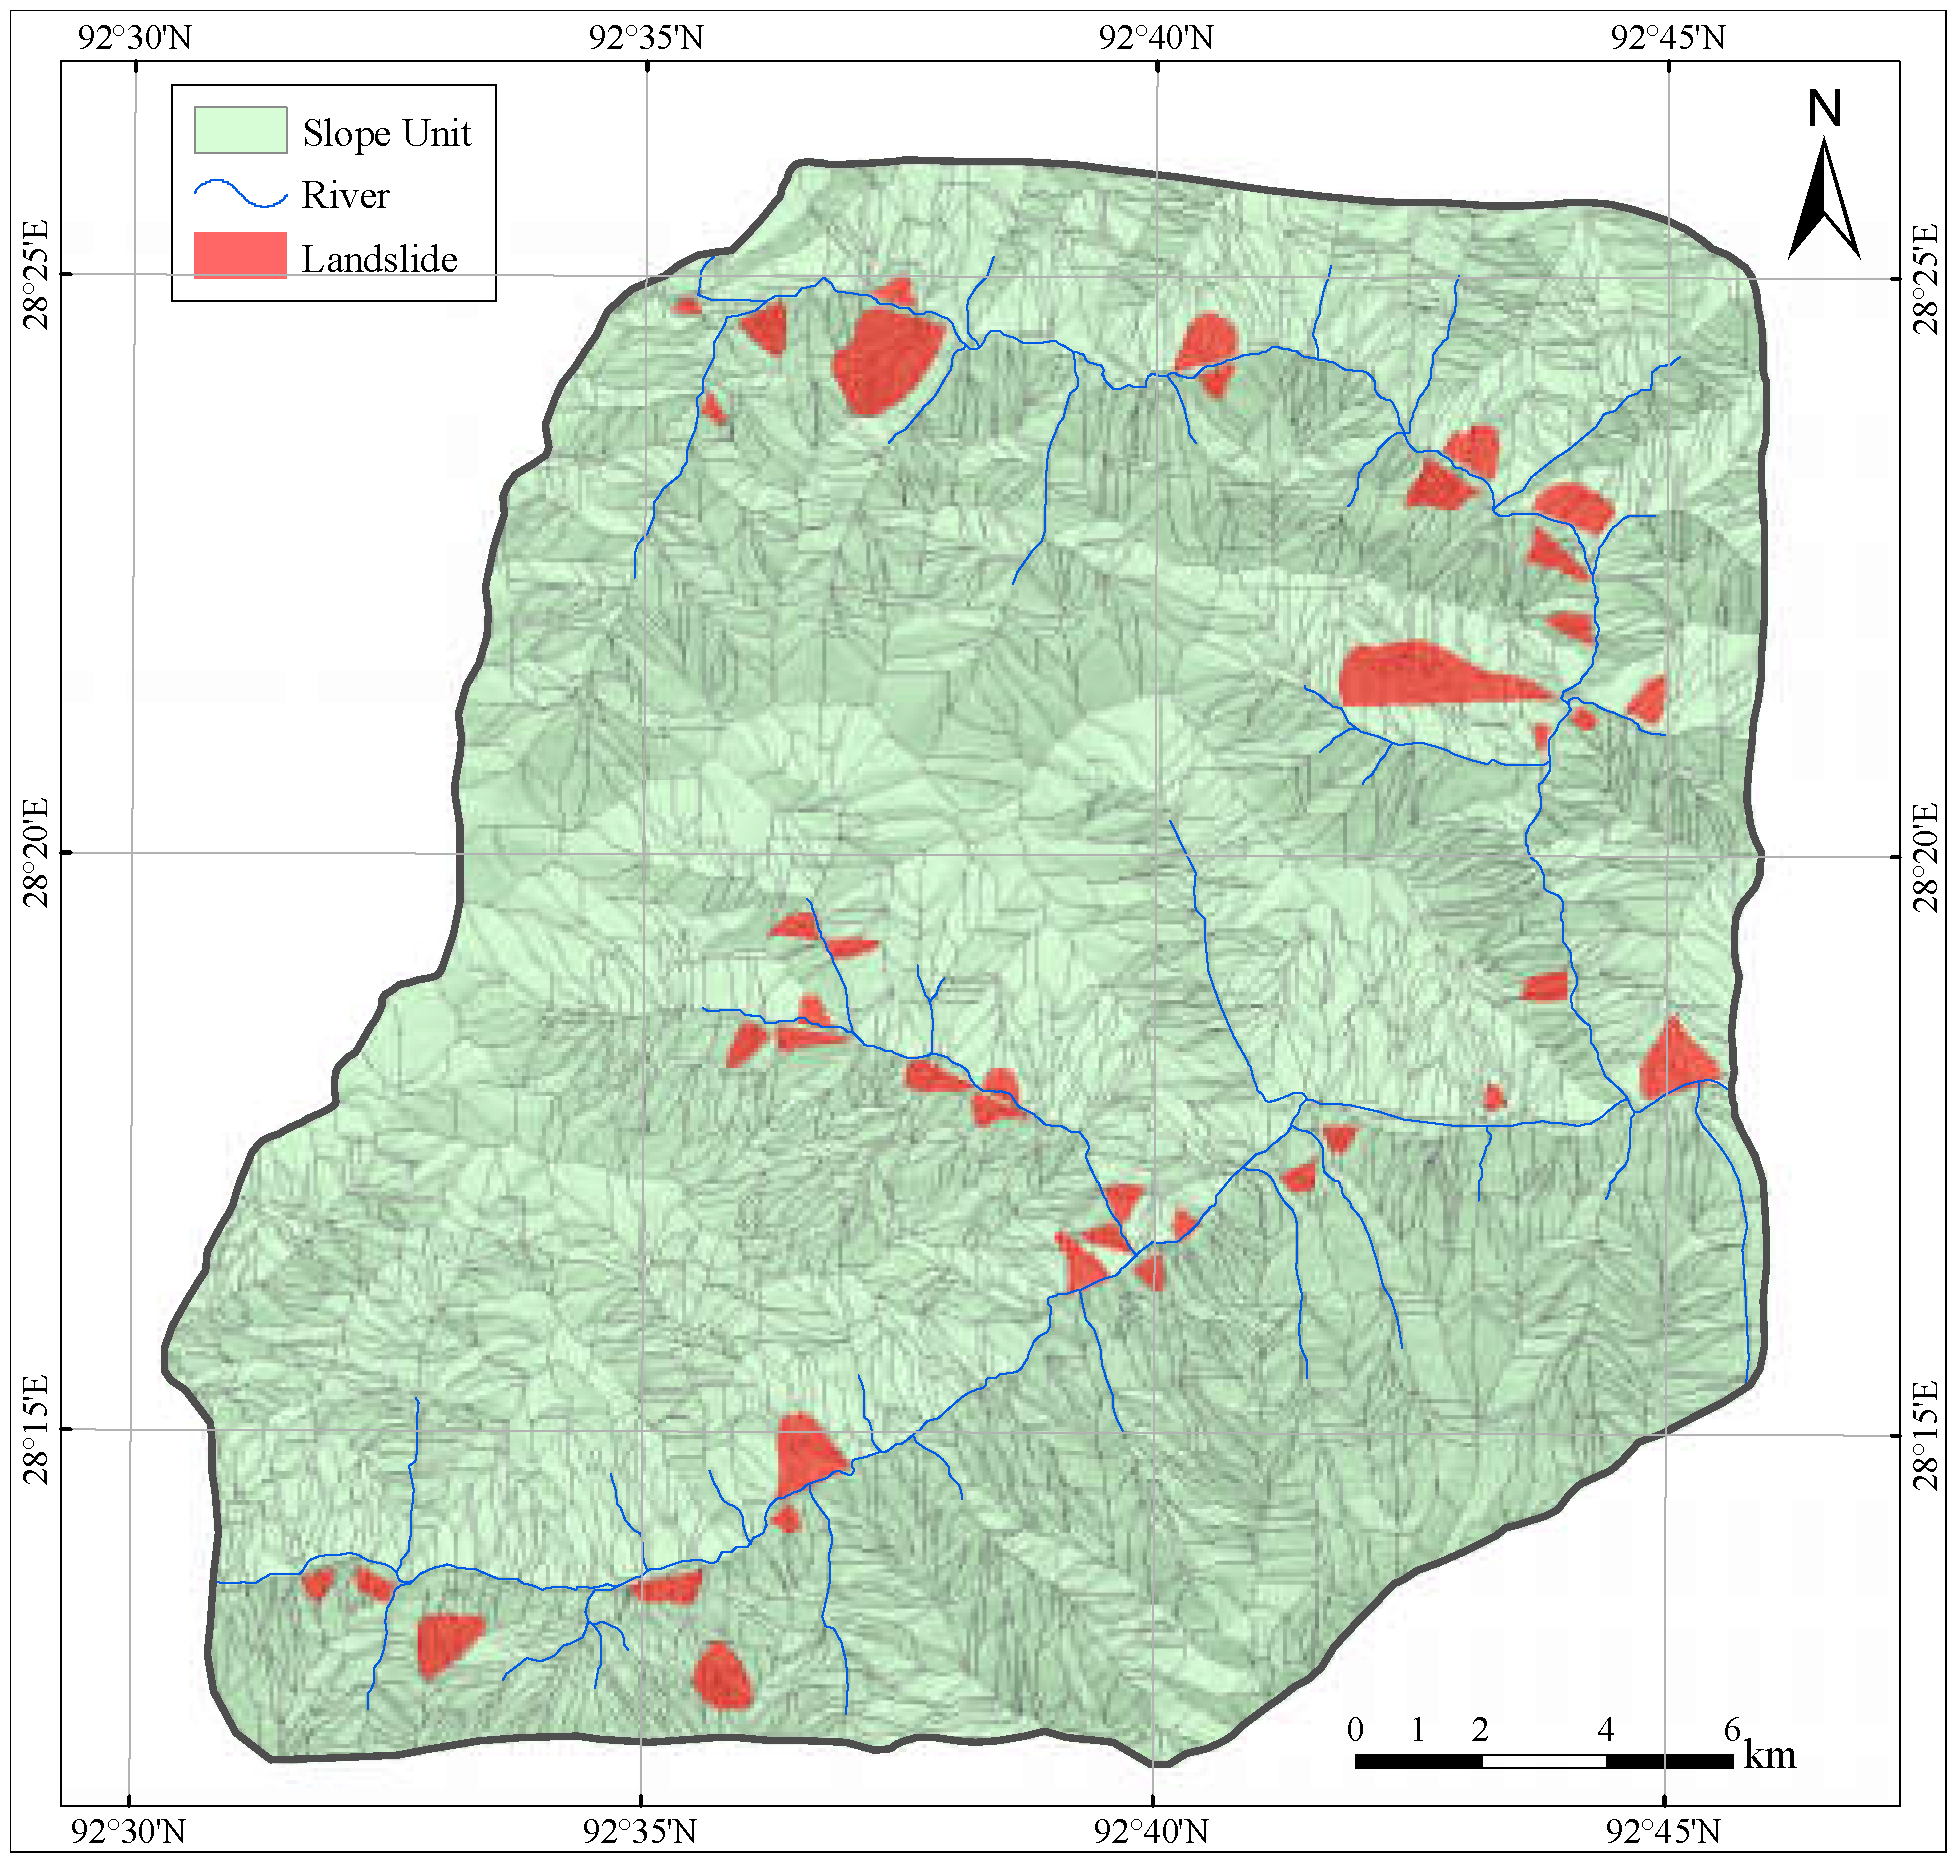
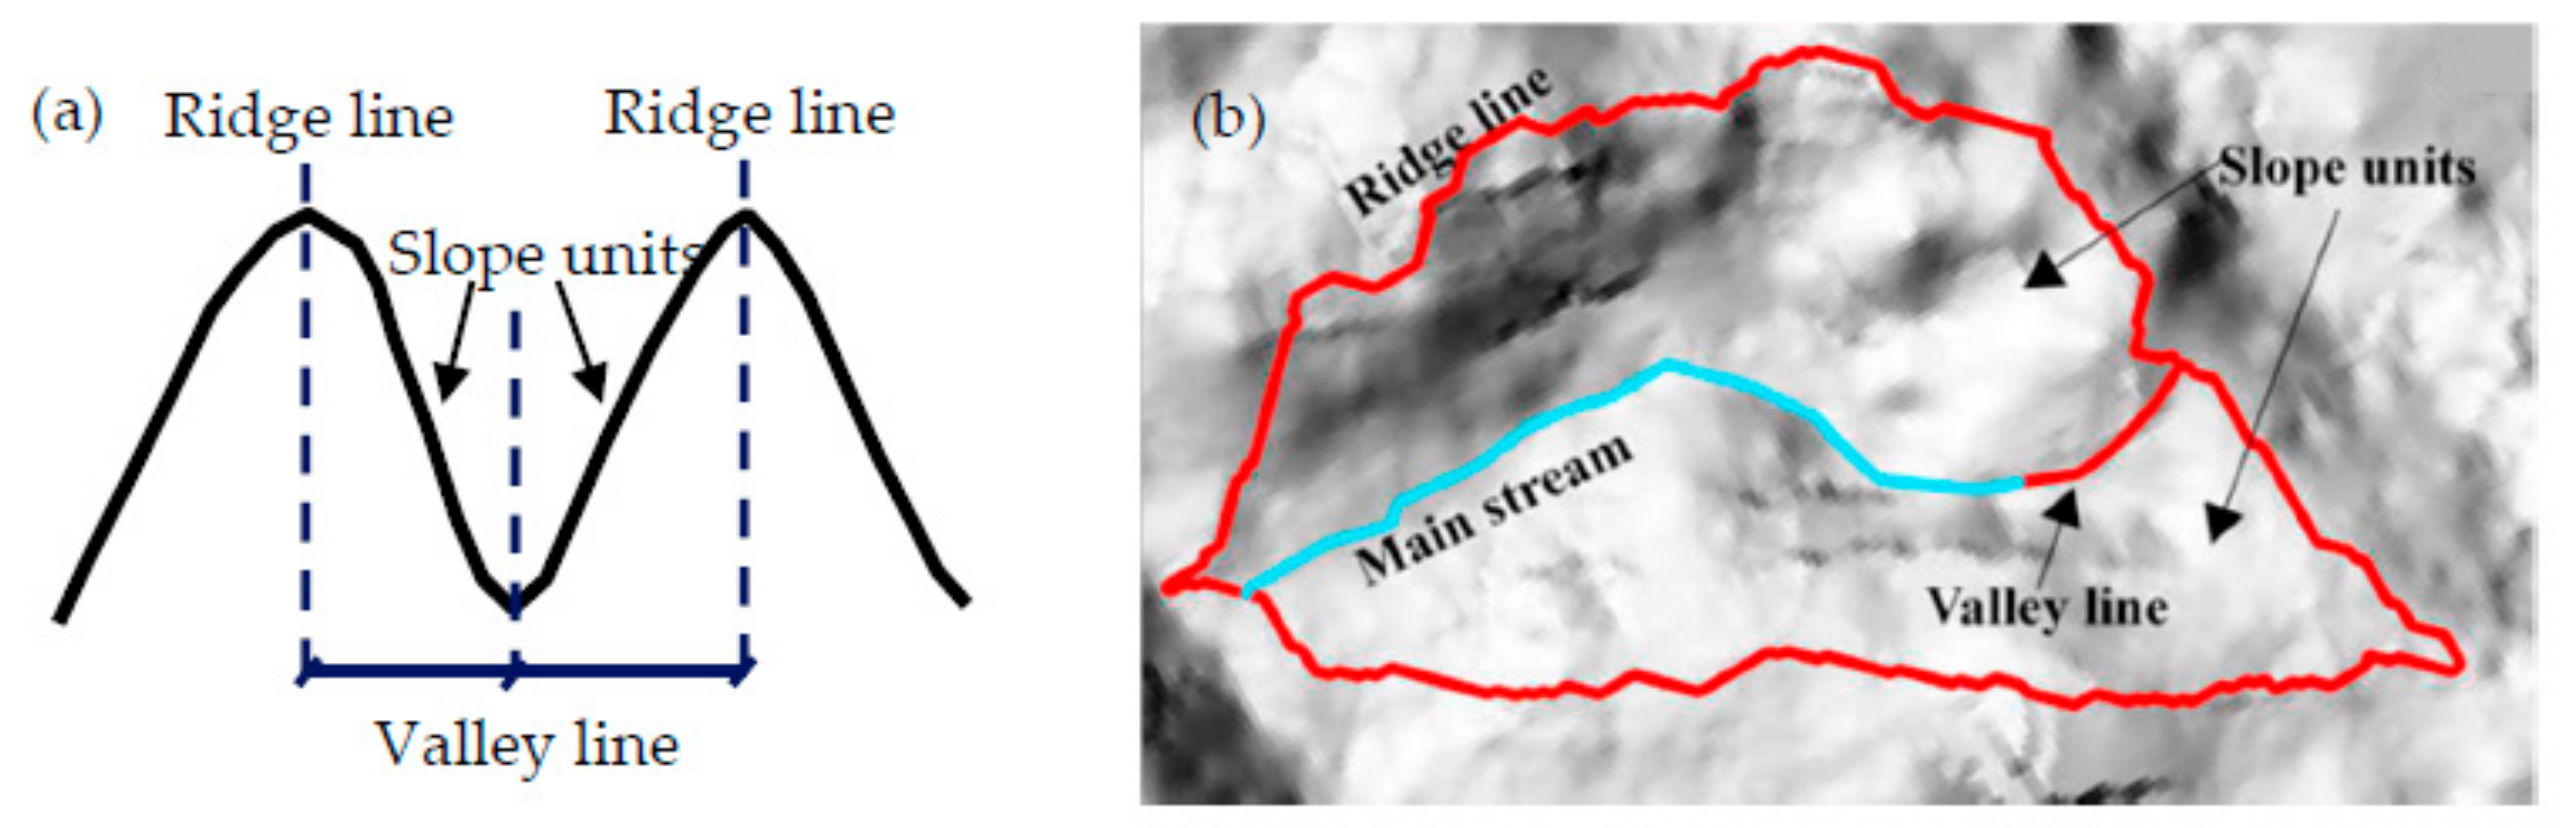
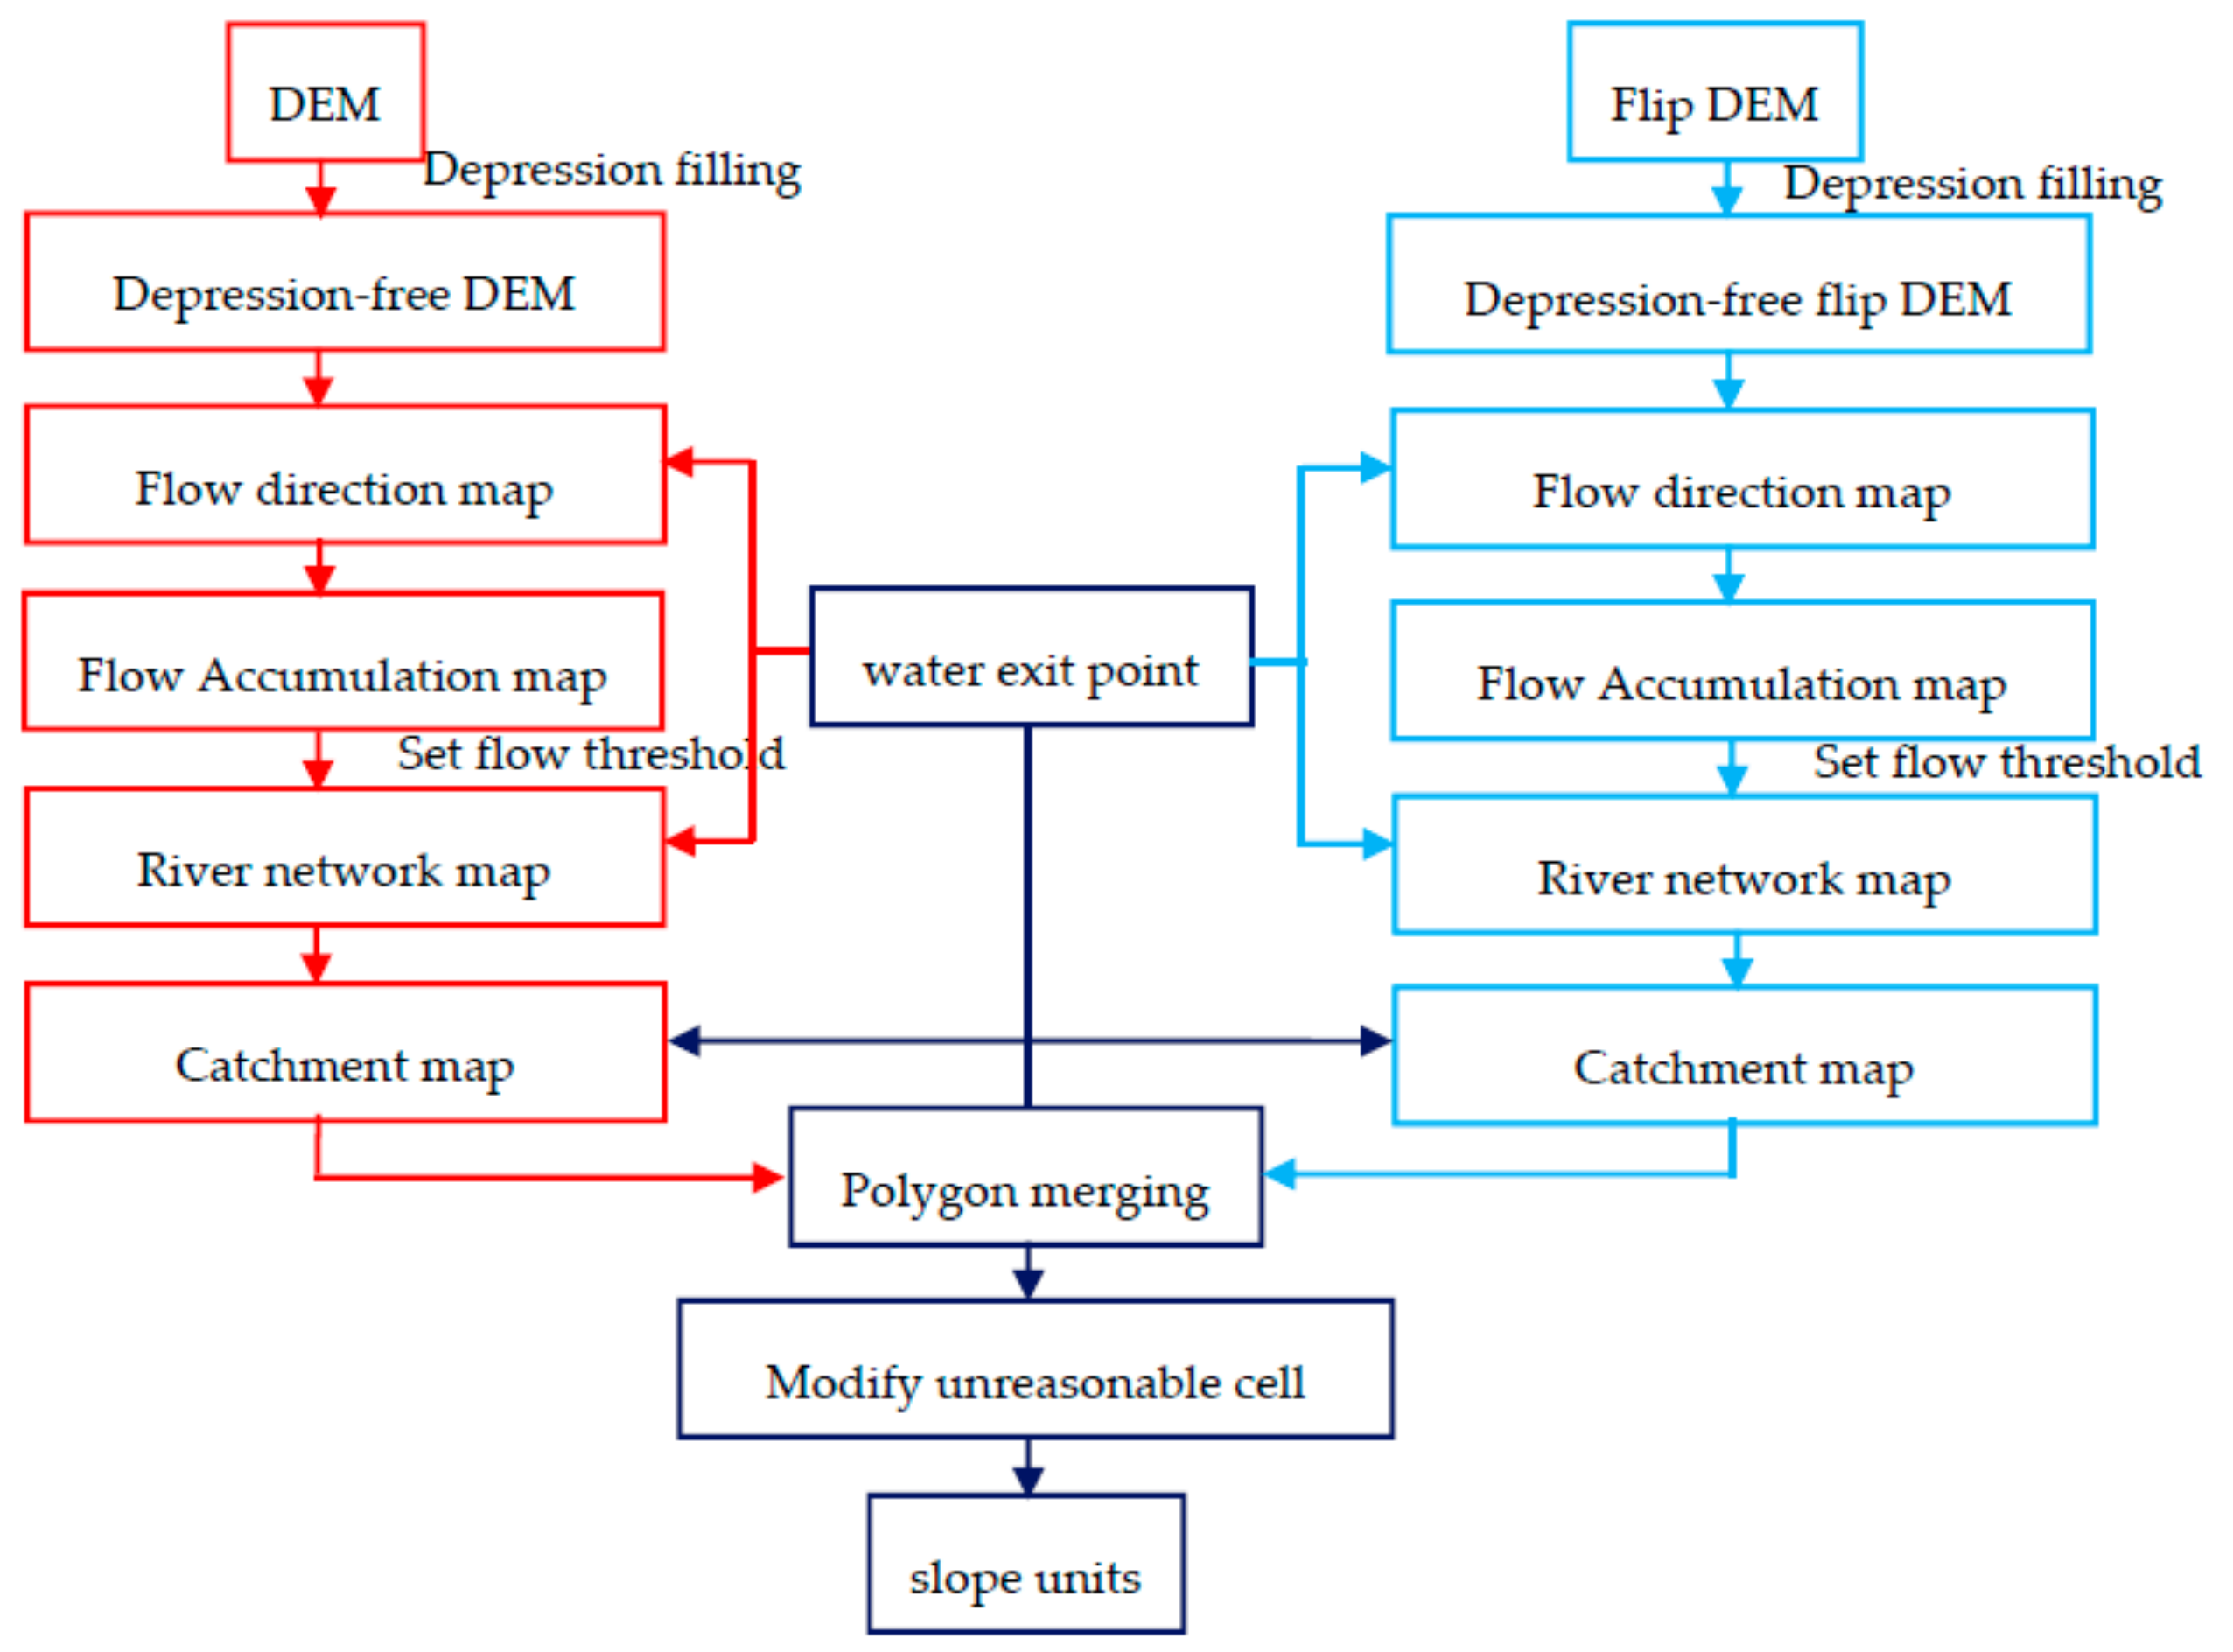
2.1. The Mapping Unit

The mapping unit is the smallest non-separable spatial entity within a geological hazard assessment, and data extraction is based on spatial primitives. That is, the accuracy of the data depends on the partitioning of the mapping unit. Therefore, employing the appropriate mapping units is essential for an effective landslide susceptibility evaluation. The mapping units, which can be regular or irregular primitives, are generally divided into the following five categories: grid cells, slope units, terrain units, unique-condition units, and topographic units.
The grid cell is the most commonly used basic evaluation unit in landslide geological hazard assessment. However, the disadvantage of this method is that the partition destroys the integrity of the slope. In this method, the entire research area is divided into several regular grids. Each grid cell is assigned with a certain geological factor, but the unit is almost completely unrelated to any spatial terrain information [30,31].
The slope unit represents the basic unit for assessing landslides, collapses, and other geological disasters. For all the influence factors, the developmental stage of valleys and rivers plays an important role in the formation of landslides and collapses. On the basis of juvenile valley division, the slope unit can be closely correlated with the conditions of the geological environment. Considering the effects of various factors, the slope unit ensures that the evaluation results are more perceptive of the reality [27].
Within the ArcGIS platform, a digital elevation model (DEM) is used to classify the slope unit. The slope unit can be considered as a part of the slope or as half of the catchment basin (Figure 1) [32]. In other words, the catchment basin can be divided into two slope units according to the crest line and the valley line. The construction algorithm of the slope unit is illustrated in Figure 2. First, the drainage network (i.e., the valley line) is extracted from the original DEM data in order to generate the catchment basin in positive relief through the hydrological analysis module in ArcGIS. Second, the original DEM data is inverted, wherein the highest point becomes the lowest point and vice versa. According to the same method, the drainage network (i.e., the crest line) is extracted according to the negative relief, thereby generating the catchment basin. Finally, the two catchment basins obtained using the positive and negative reliefs are superimposed and merged [33]. As a consequence, two slope units of the catchment basin are acquired.

2.2. The Analytic Hierarchy Process

The analytic hierarchy process (AHP) is a multi-index analysis and evaluation method that was initially proposed by Saaty [34]. The AHP method constructs a matrix by estimating the relationship between two influencing factors subjectively. The weight of each factor is assigned by the AHP, the process of which is divided into four steps as follows:
  • The first step is to establish a hierarchy model.
  • Judgement matrices are constructed through pairwise comparison. The results of comparison between the different factors are scored on a 1~9 scale method, and factors are assigned different values according to their importance (Table 1). The judgement matrix A = (aij) is established as follows:
    Α = ( a i j ) n × n = ( a 11 a 1 n a n 1 a n n )
  • The judgement matrix must satisfy the following formula:
    A α = λ max α
    where λ max is the largest eigenvalue of the judgement matrix A , and α is the eigenvector corresponding to λ max .
  • The AHP requires a consistency of the judgement matrix in order to ensure that the calculation results are reasonable. The random consistency ratio R c is required to satisfy the following formula:
    R c = I c / I R
    I c = ( λ max n ) / n 1
    where n is the order of the judgement matrix A , I c is the consistency index of the judgement matrix A , and I R is the random index, which is listed in Table 2.
If R c < 0.1 , the judgement matrix is considered to have good consistency, which suggests the weight distribution is reasonable. Otherwise, the judgement matrix needs to be adjusted until reasonable consistency is achieved.

2.3. The Information Content Model

The information content model (ICM) is derived from information theory and an engineering geological analogy method. Its theoretical basis lies within probability statistics and contrast mapping. In recent years, the ICM has often been applied to landslide risk assessments. The model is capable of calculating the effects of various engineering geological environments on the landslide using statistical analysis [35,36]. The calculation procedures are as follows:
  • The information content I ( X i , H ) of each factor that influences landslide occurrence is calculated separately:
    I ( X i , H ) = ln P ( X i , H ) P ( X i )
    where P ( X i , H ) is the probability of occurrence of X i in the landslide area, and P ( X i ) is the probability of occurrence of X i in the study area.
    I ( X i , H ) = ln N i / N S i / S
    where N is the number of landslide pixels in the study area, S is the total number of pixels in the study area, N i is the number of pixels for factor X i in the landslide area, and S i is the number of pixels for factor X i in the study area.
  • Calculate the total amount of information content for each factor X i :
    I i = i = 1 n I ( X i , H ) = i = 1 n ln N i / N S i / S
    where I i is the total amount of information content for factor X i . The greater the value, the more likely the landslide will occur.

2.4. The Landslide Susceptibility Assessment

Based on the AHP and ICM, the information weight for each factor can be obtained using the following formula:
I i ω = i = 1 n I ( X i , H ) = i = 1 n ω i × ln N i / N S i / S
where ω i is the weight for each factor obtained through the AHP, and I i ω is the comprehensive index of the landslide sensitivity. Subsequently, the information content value for each evaluation unit is sorted and divided, after which the sensitivity of the landslide can be classified as well.

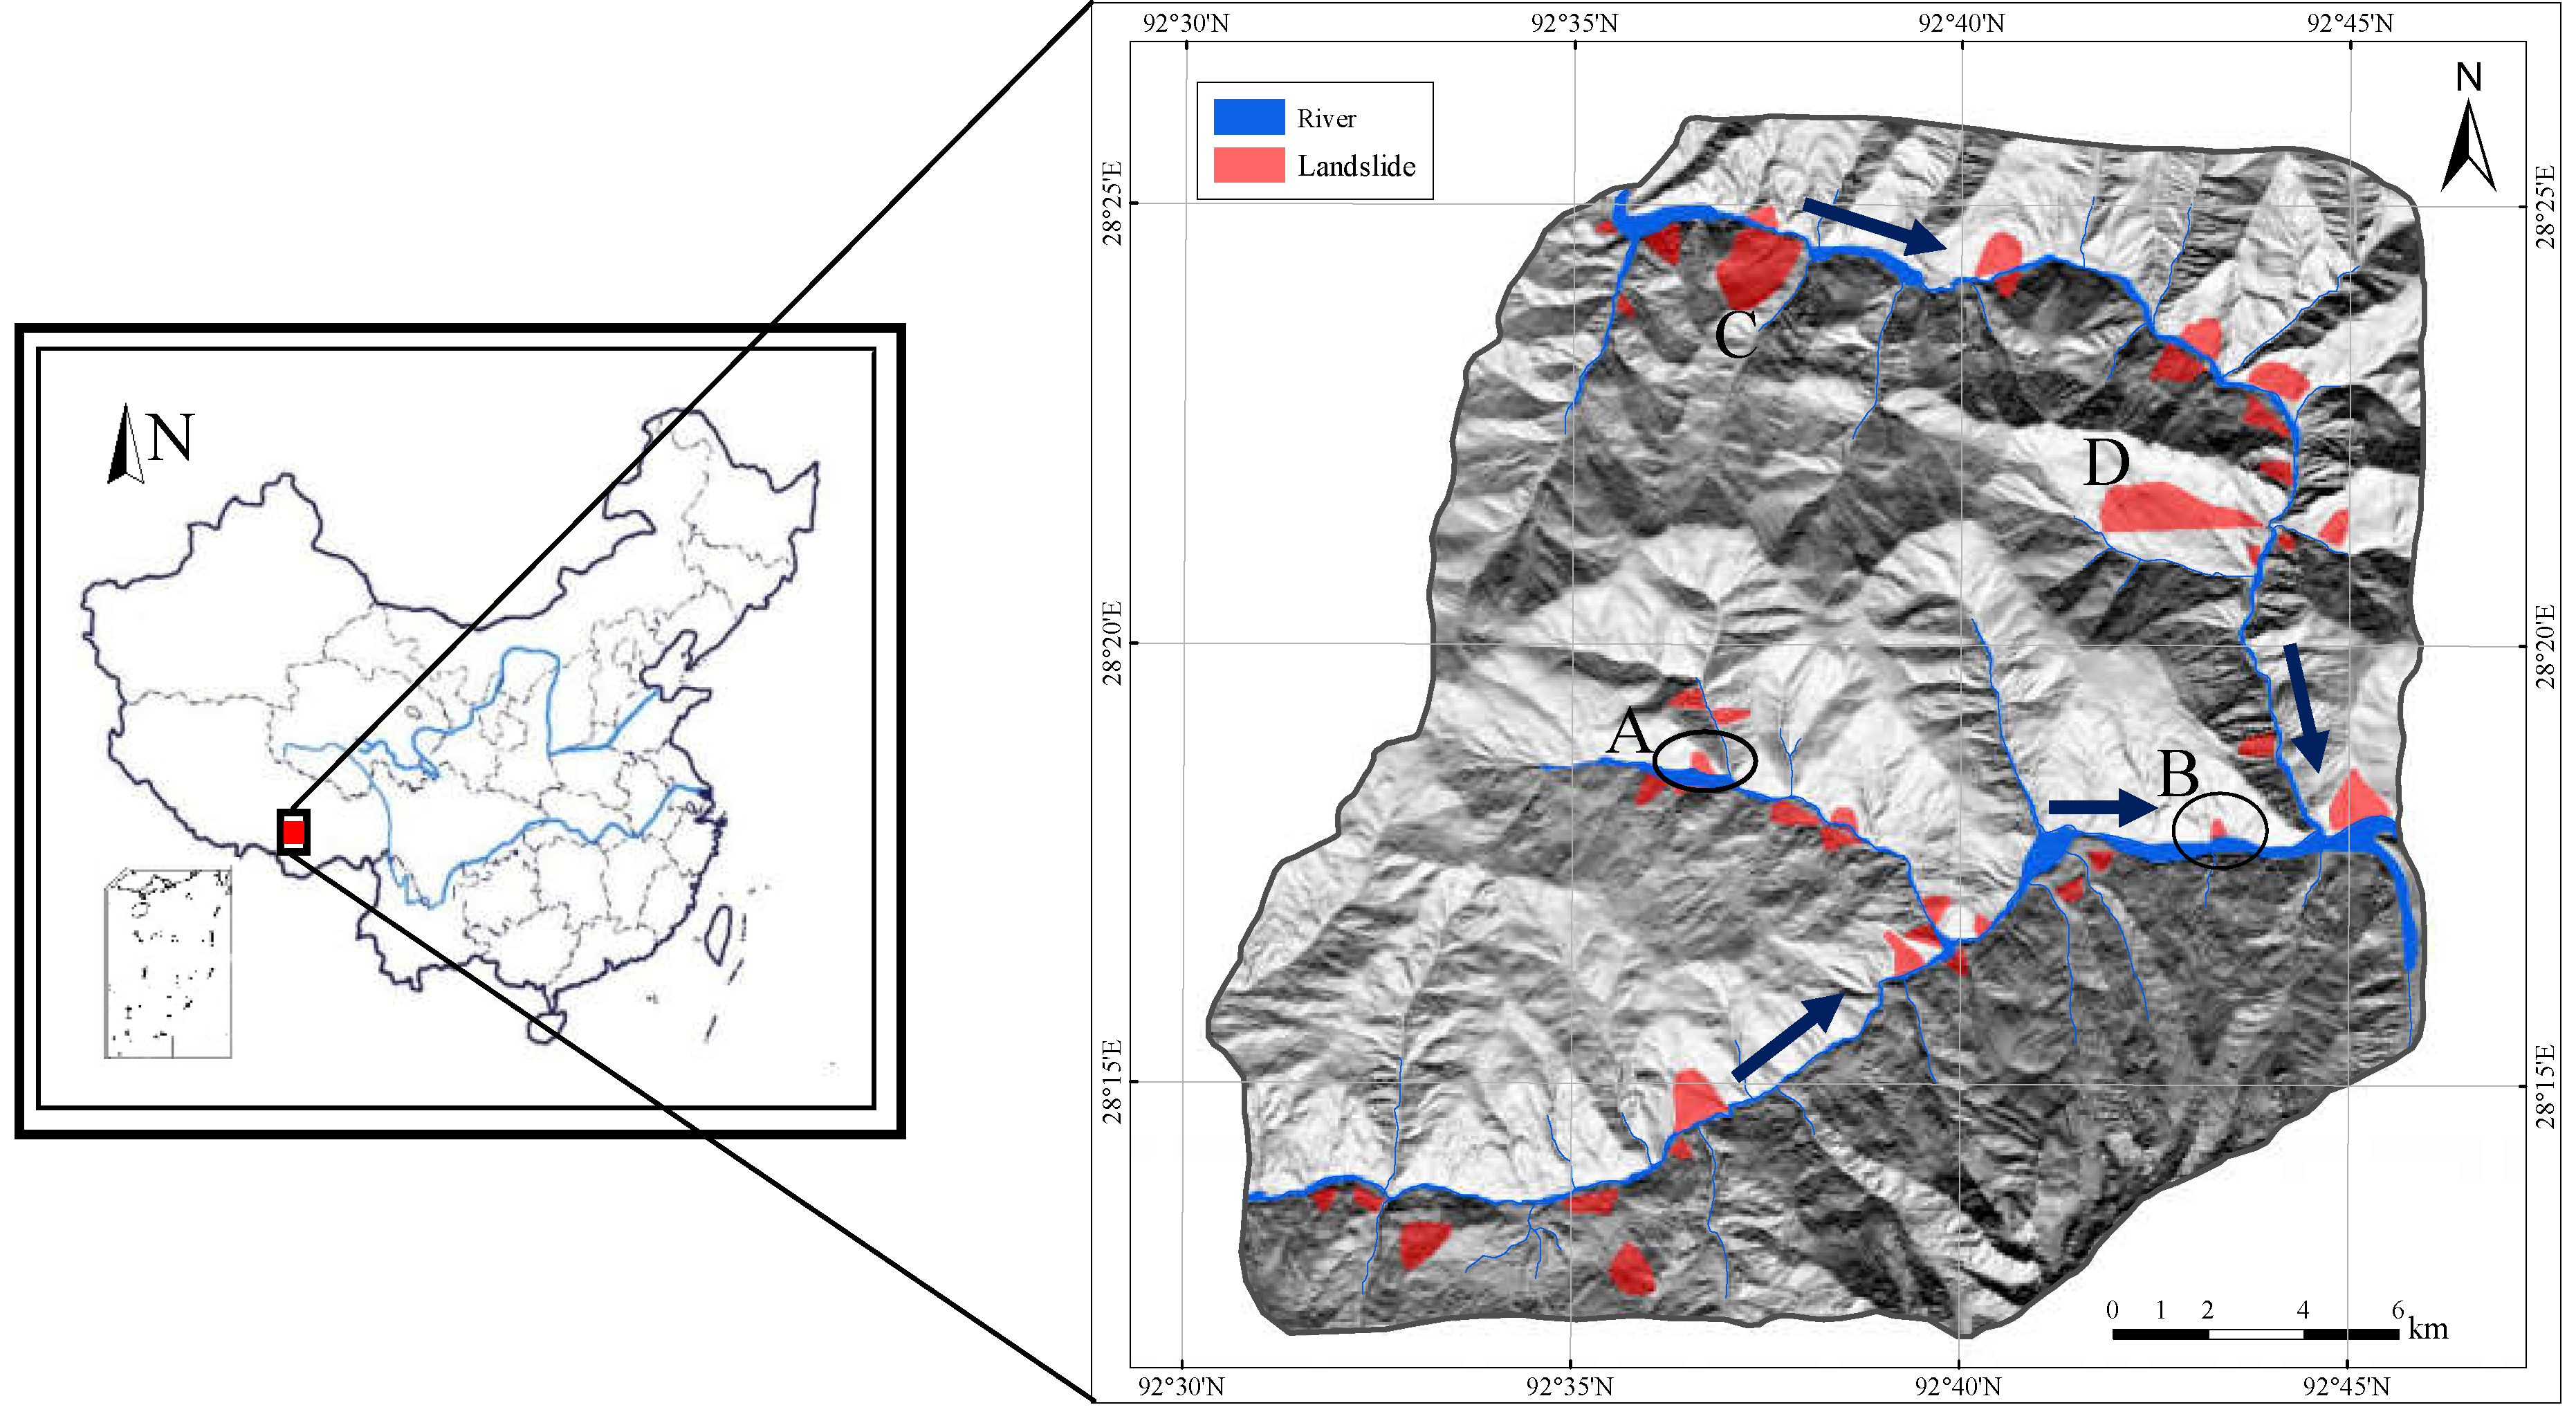
3. Study Area and Data
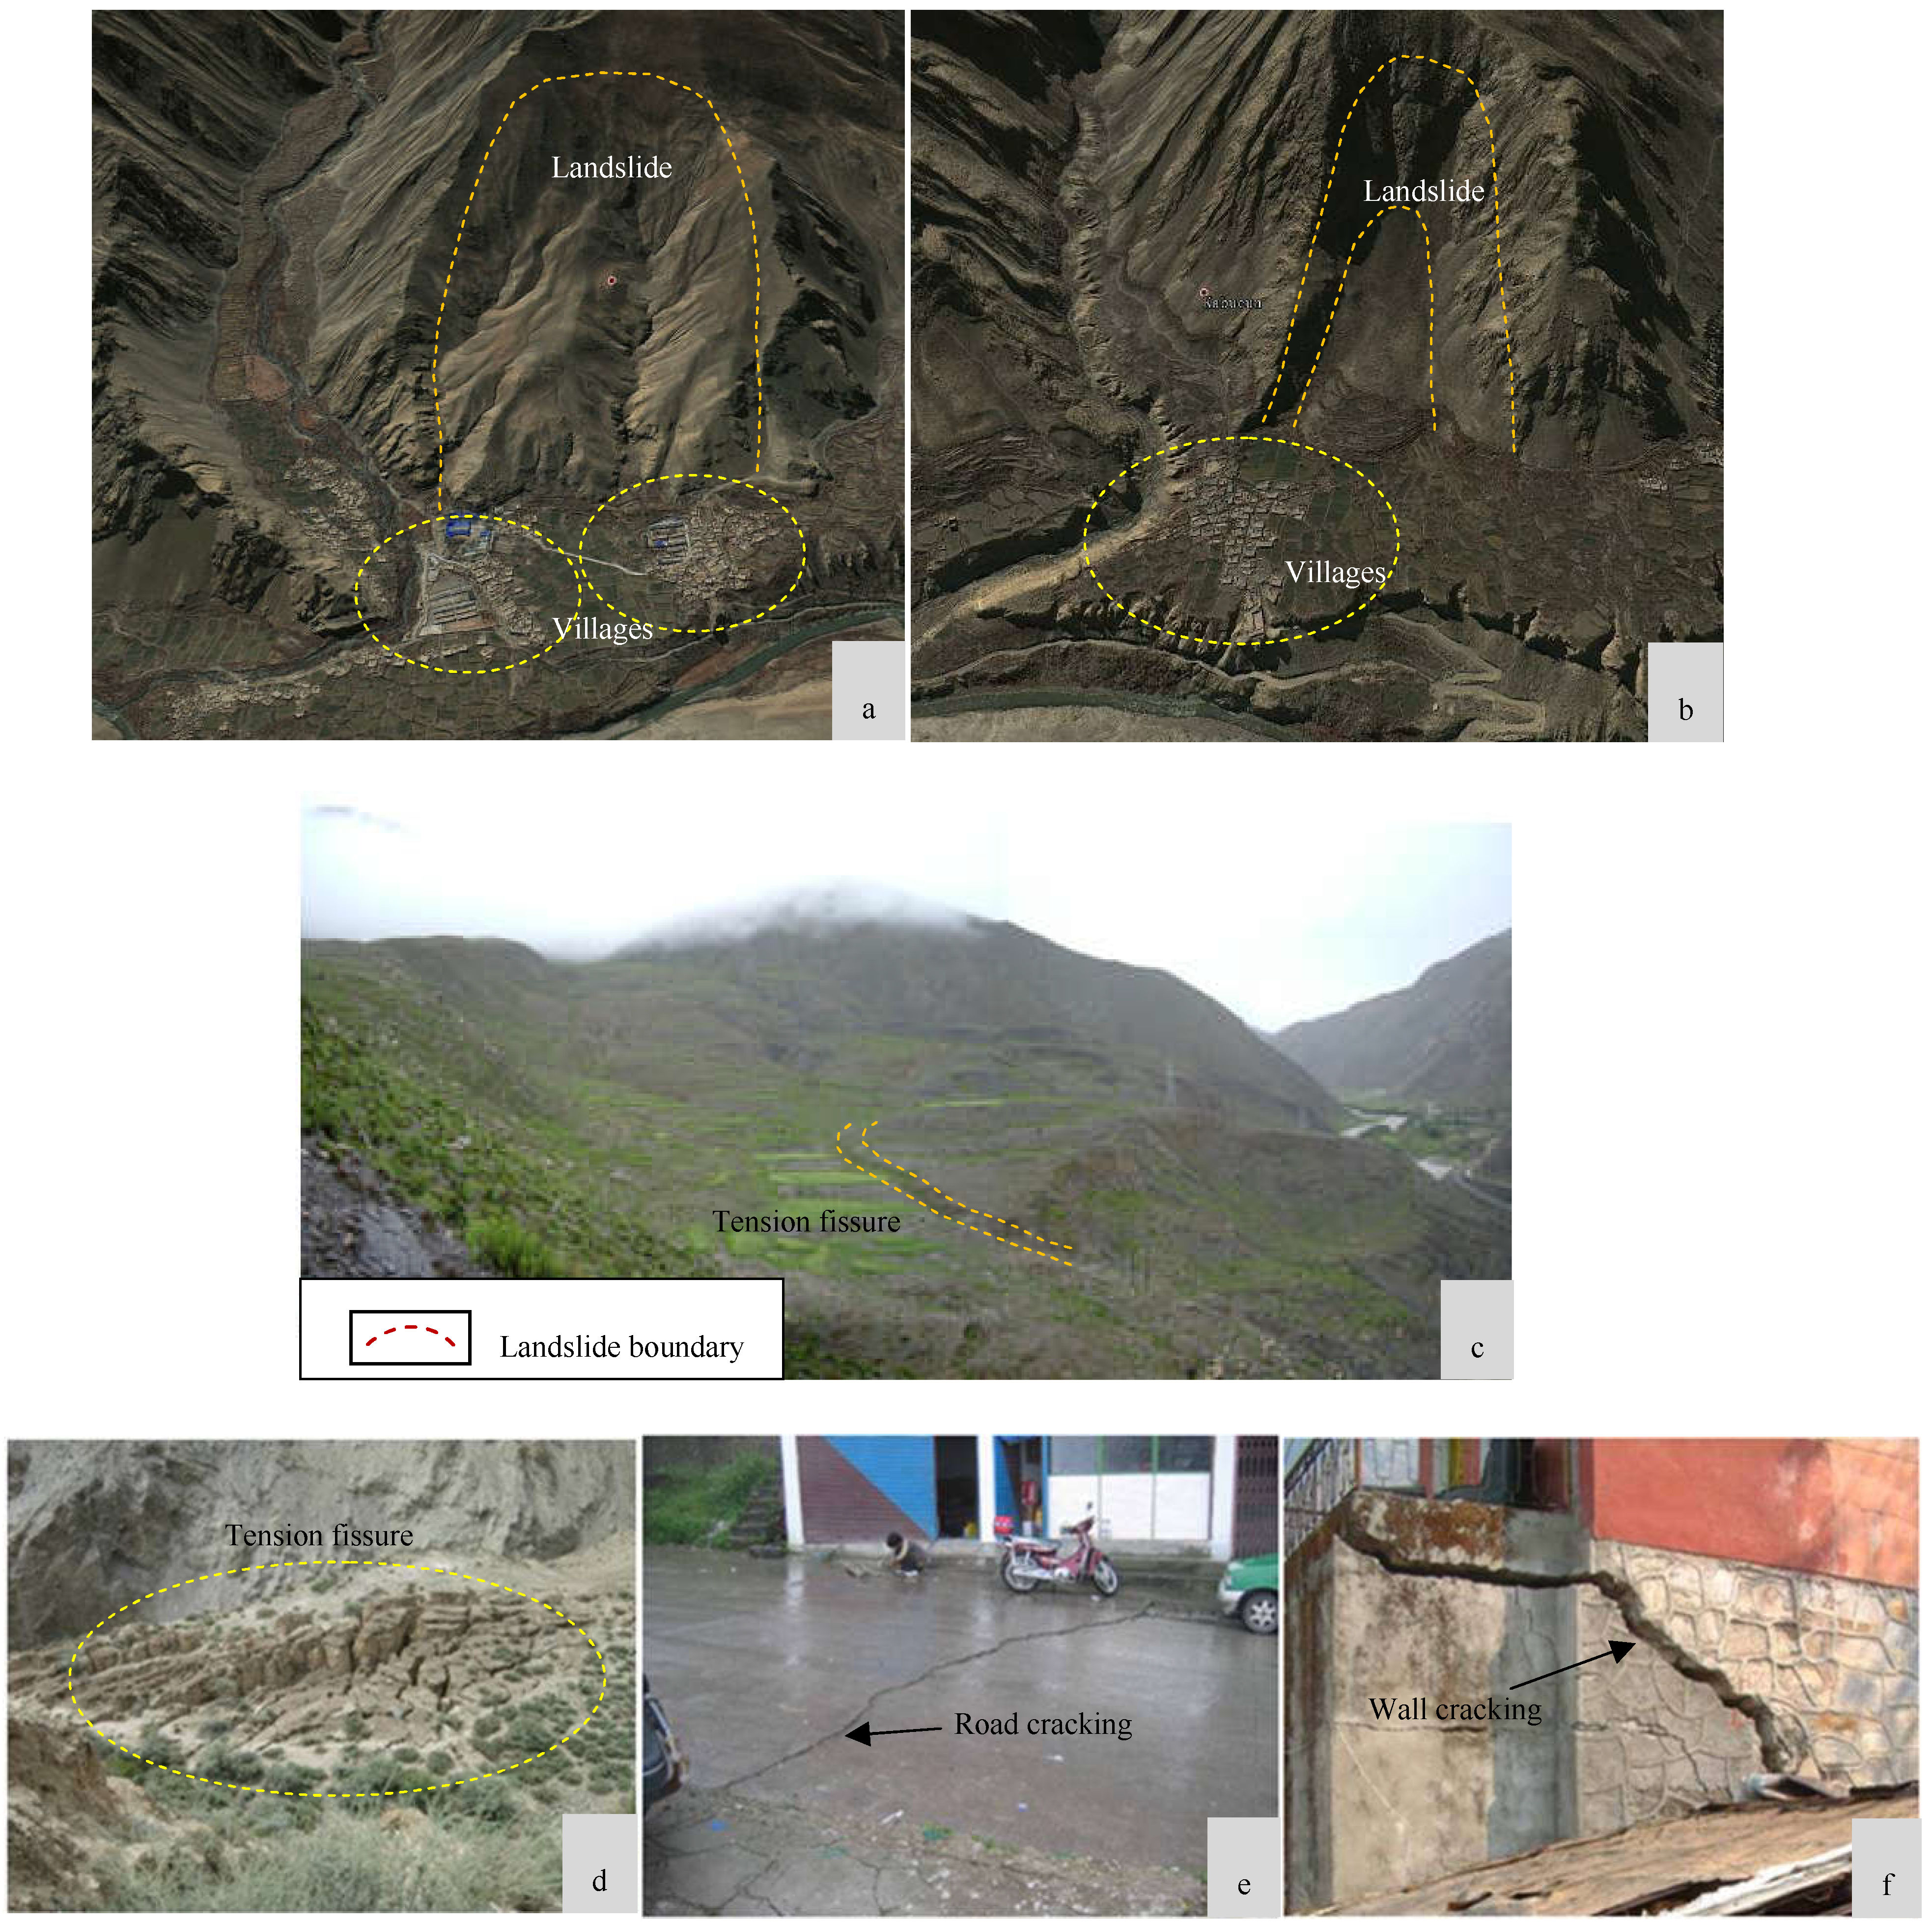
3.1. Study Area

The study area is located in Longzi County in Southeastern Tibet (Figure 3). The area, which is bounded between 28°12′ N–28°26′ N and 92°30′ E–92°45′ E, is marked by deep gorges, glaciated valleys, and rugged topography. It covers an area of about 517 km2. Located in the Himalayan plate region, the north of the area is the Yalung Tsangpo suture zone and the south is the main boundary fault zone of Xiwalike. Controlled by the tectonics of the Himalayan block and the Yalung Tsangpo suture zone, it belongs to the Kangma–Takako fold and thrust belt [37,38,39].
A spot investigation reveals that landslide disasters in the vicinity of the Liemai–Jiayu town, Longzi County, Tibet, are mainly distributed on either side of the Longzi River. Landslides within the study area are characterized by different degrees of potential danger and threat to the personal safety and property of local residents. According to census statistics, 2421 people reside in the study area and are affected by landslides. However, few attempts have been made to ameliorate these hazards.
The study area possesses a semi-arid temperate monsoon climate. The rainy season spans from May to September, with the precipitation during this period accounting for 90% of the total throughout the year. The seismic intensity within the area has a degree of VIII on the modified Mercalli index. At present, the continental crust is relatively stable, and there have been no reports concerning earthquake-induced landslides.
The study area belongs to the zone of stratigraphic division of the Northern Himalayan block. The exposed strata are mainly composed of Mesozoic Cretaceous, Jurassic, Triassic, and Cenozoic units. The Mesozoic Cretaceous contains the Laka Formation (K1l), the lithology of which mainly consists of calcirudyte, argillaceous slate, and siltstone. The Jurassic includes the Ritang Formation (J1r), the Lure Formation (J2lr), the Zhela Formation (J2z), and the Weimei Formation (J3w). The lithology of the Jurassic formations is mainly composed of siltstone, silty slates, basalt, tuff, and conglomerates. The Triassic primarily consists of the Nieru Formation (T3n), the lithology of which mostly encompasses metamorphic fine rock, and quartz sandstone. Finally, the Cenozoic strata primarily include Quaternary alluvium ( Q 4 al ) and Quaternary slope wash ( Q 4 el + dl ).
Extensive field investigations and acquisition of measurements were implemented in Longzi County in order to produce an accurate and detailed landslide inventory map. A total of 41 landslides were recorded and mapped by means of field investigation and laboratory analysis. Two types of landslide deformation modes occur in the region: slump-tensile rupture and creep-tensile rupture, both of which eventually lead to landslide instability. The maximum volume of the landslides is 3600 × 104 m3, and the minimum volume is 36.3 ×10⁴ m3. Figure 4 illustrates the location of the major landslides and their impacts on residents in the study region. The spatial resolution of the DEM is 5 m × 5 m. According to the slope unit method, the flow direction of each grid cell is demonstrated in Figure 5, and the study area can be divided into 3261 slope units (Figure 6). The minimum unit area is 0.01 km2, and the maximum is 1.26 km2.

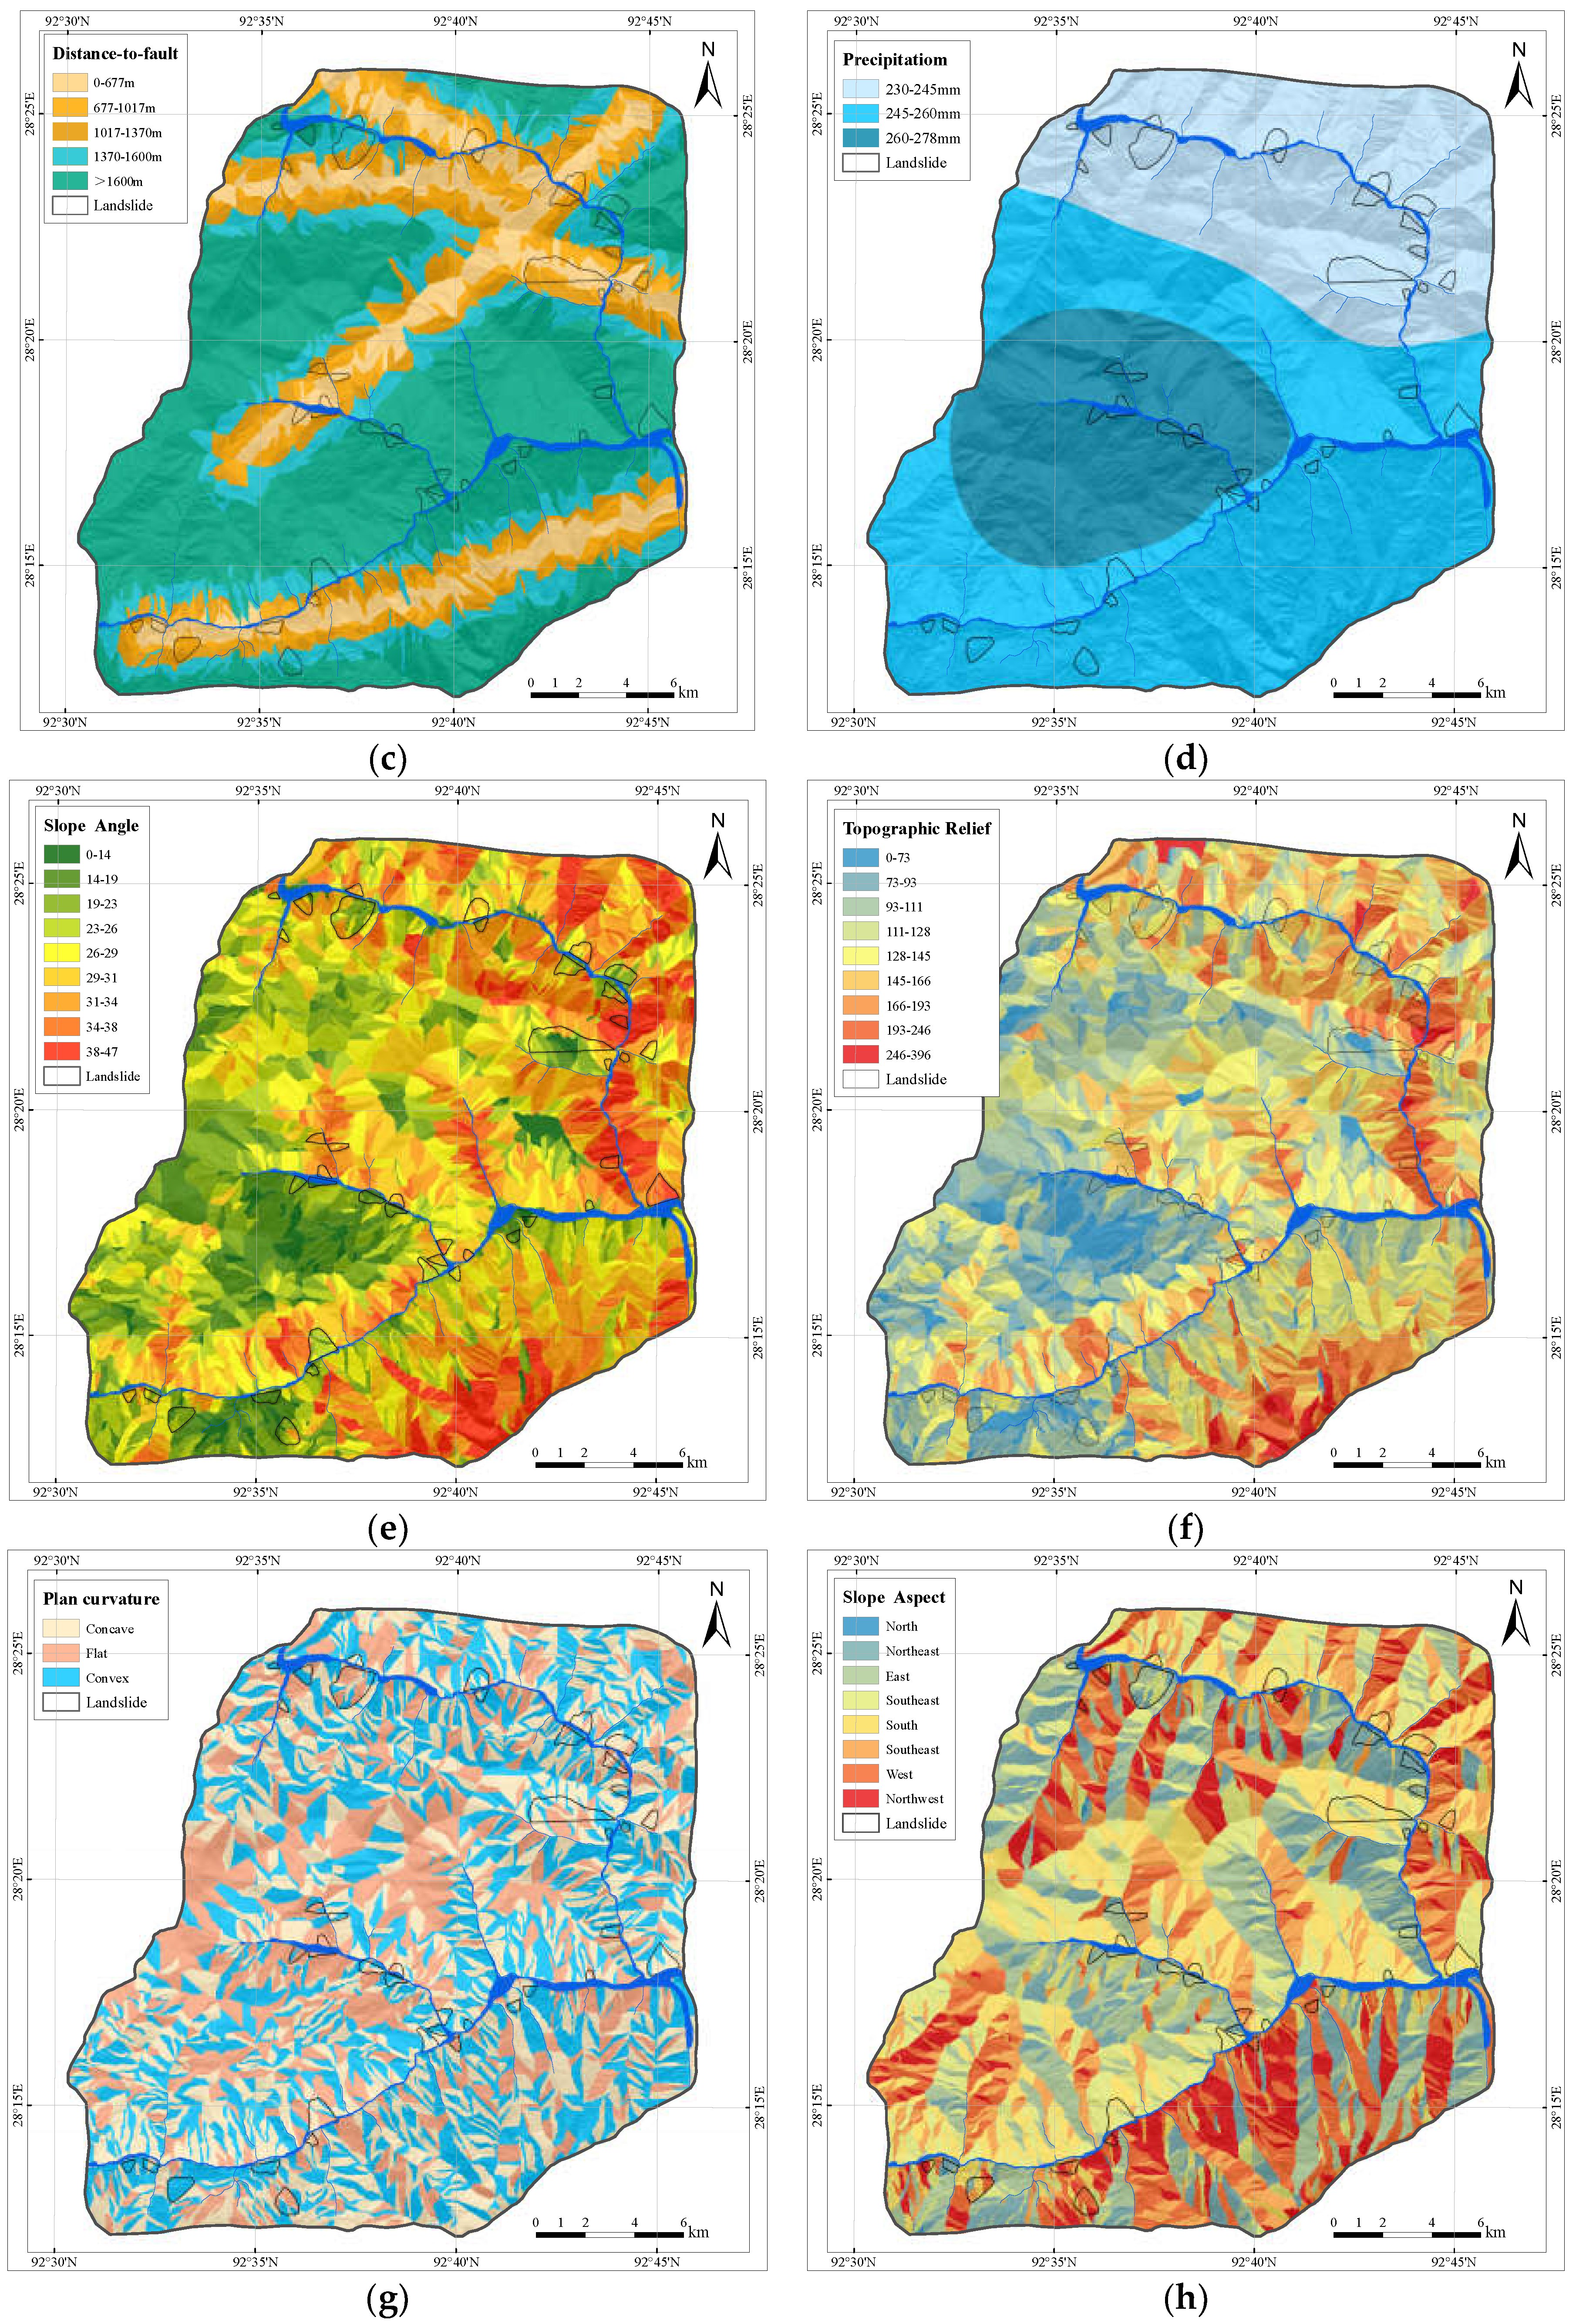
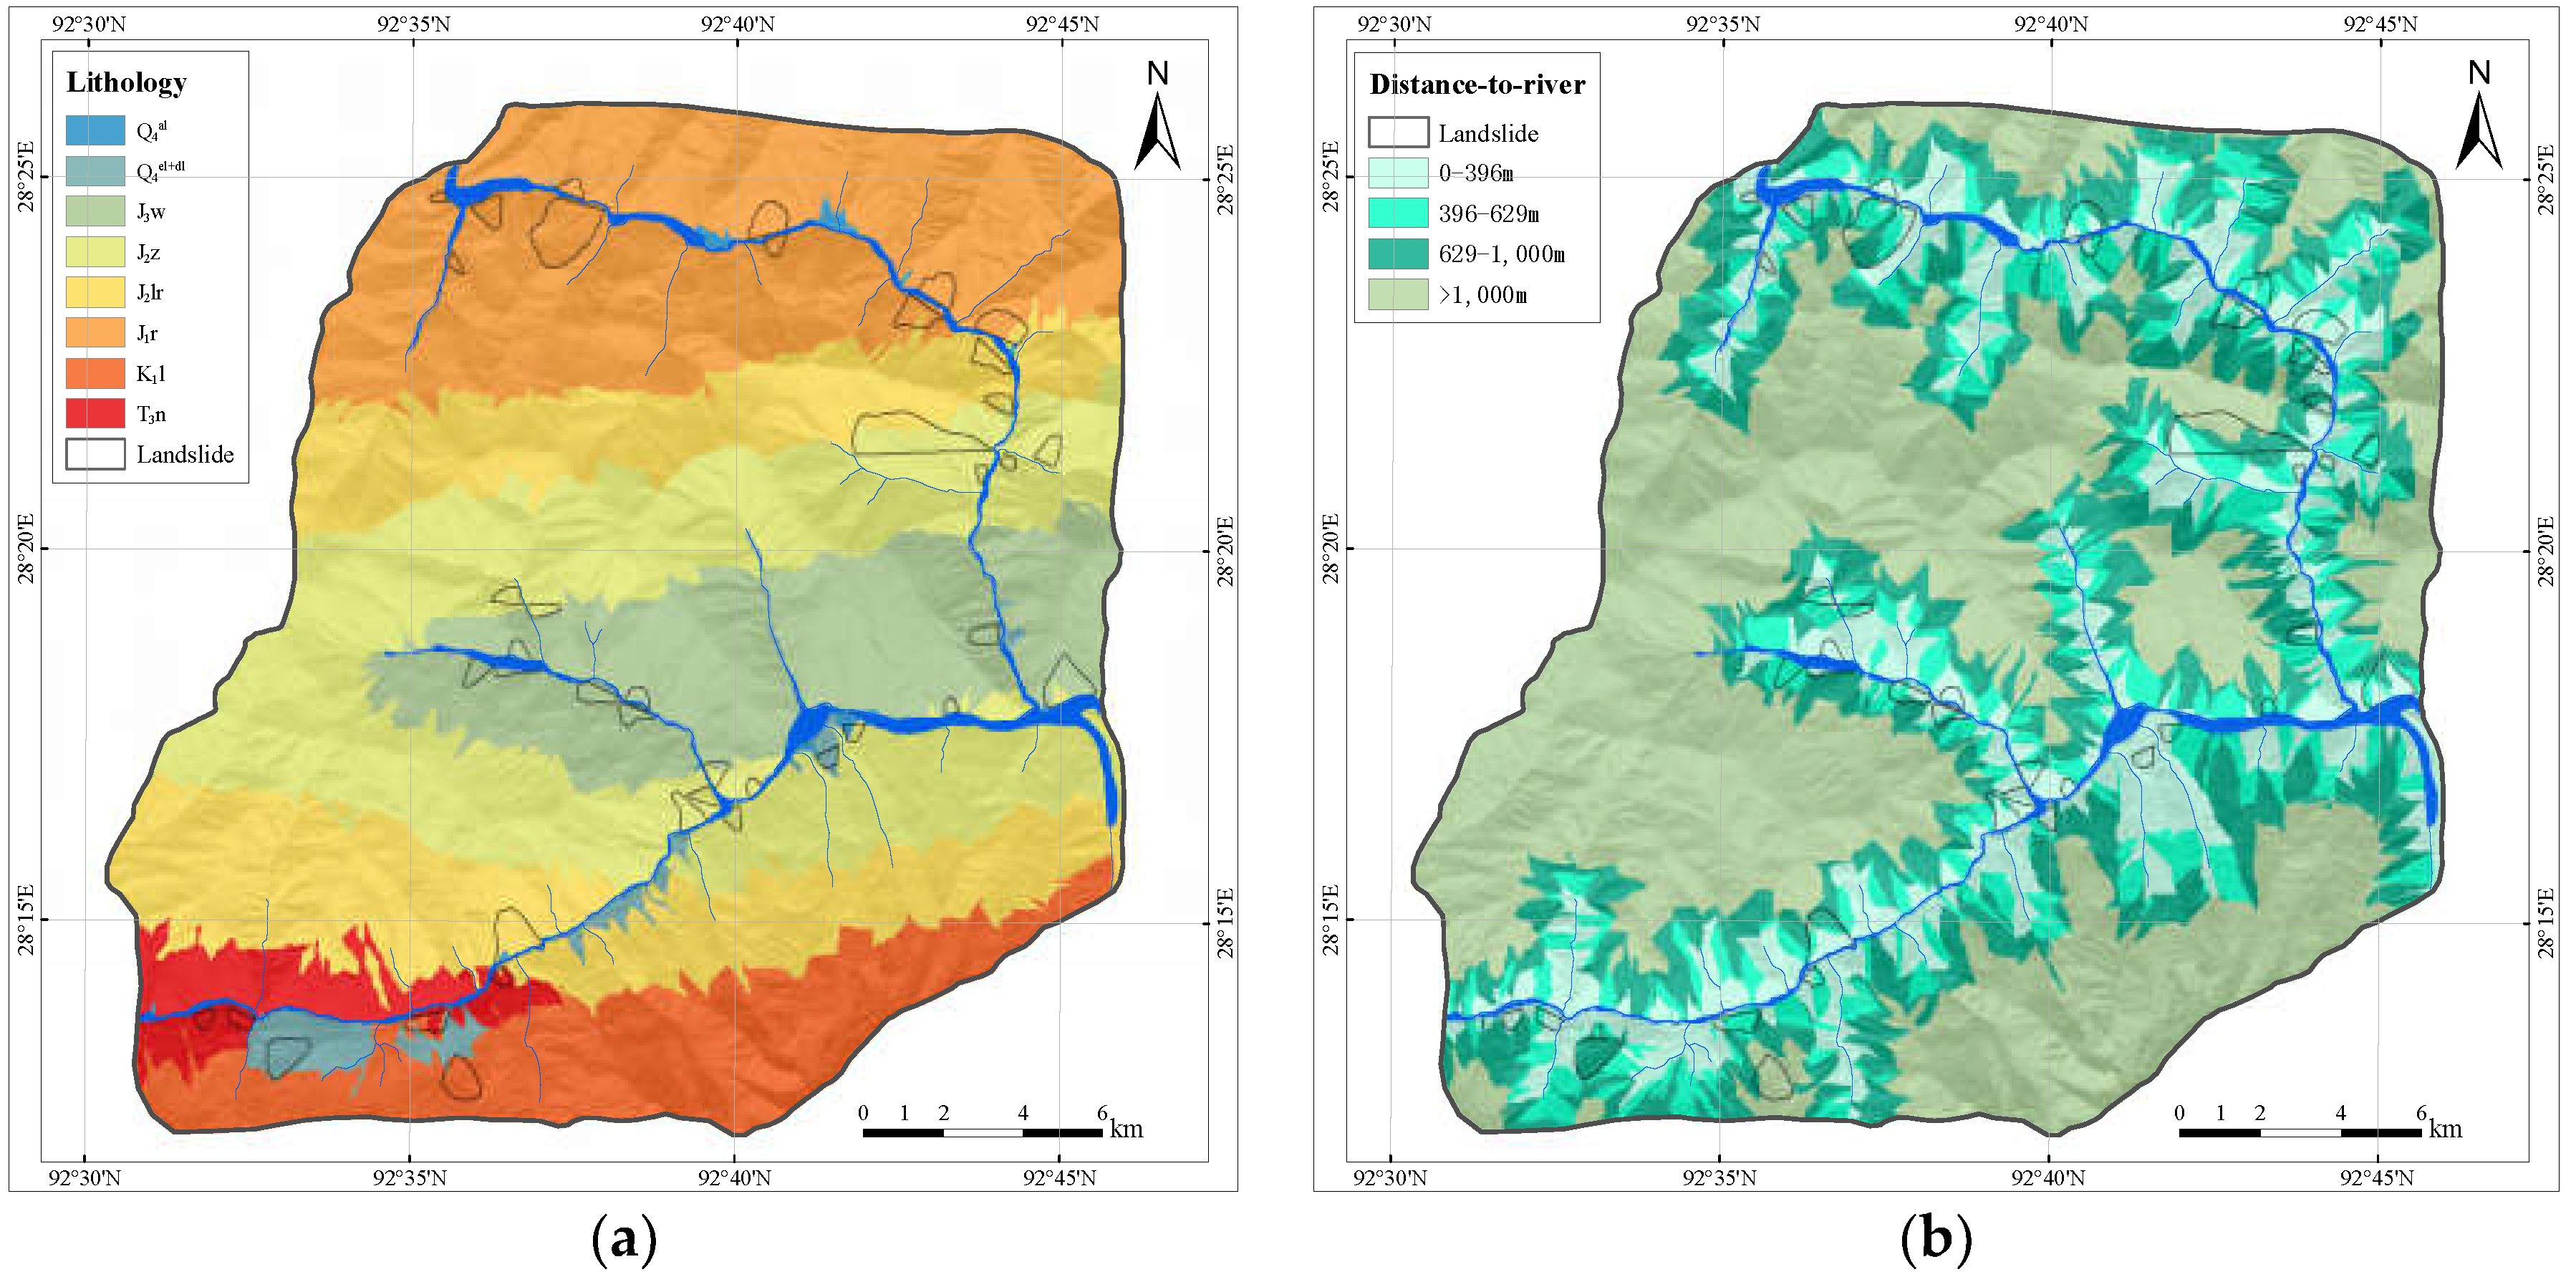
3.2. Influencing Factors

Landslide factors considered in this study include slope angle, slope aspect, plan curvature, distance-to-fault, distance-to-river, topographic relief, annual precipitation, and lithology. The selection of eight influencing factors was based on (a) the works of previous researchers [40,41] (b) field geological investigation experience and knowledge on landslide activities in the study area, and (c) collection of data availability in the study area. Because of the sparse vegetation in the study area, most of the bedrock is exposed, so the influence factor of vegetation coverage is not taken into account. The traces of the artificial excavation roads in the study area are not obvious, and the range of the distance-to-river is almost the same as that of the distance-to-river, so it is also not taken into account.
As the slope angle increases, shear stress within the soil or unconsolidated sediment generally increases [42]. According to field surveys and measurements, the eight aforementioned causative factors are selected in order to evaluate landslide sensibility. The slope angle map was extracted from the DEM through the slope unit, and the average slope angle of each slope unit was thereafter obtained [43]. The slope map was reclassified into nine classes: (1) 0°–8.5°, (2) 8.5°–15.7°, (3) 15.7°–20.0°, (4) 20.0°–23.7°, (5) 23.7°–27.2°, (6) 27.2°–30.5°, (7) 30.5°–34.0°, (8) 34.0°–38.3°, and (9) 38.3°–47.1°.
The distance-to-river has a particular controlling effect on the development of landslides [17]. Meanwhile, the significant influence of river erosion on landslide development is primarily due to the following aspects: (1) The softening effect of water on a rock mass reduces its strength. (2) Due to the long-term erosion of water, the river bank becomes steep. (3) The tension crack that is filled with surface water or groundwater will produce hydrostatic pressure on either side of the rock and soil, which is not conducive to the stability of the slope. (4) Hydrodynamic pressure will substantially affect the slope near the valley. (5) The buoyancy force of the groundwater will affect the free surface of the slope base, which can induce the occurrence of a landslide.
The distance-to-fault is closely related to the occurrence of landslides [44]. A weak structural plane within the faulted zone is developed, which leads to fragmentation and weathering of the rock, forming a zone of deep and significant weathering within the crust. Since almost all the landslides are located within 1000 m of the fault, 200 m is taken as the calculation interval for the distance-to-fault map.
Topographic relief is often used to describe and reflect the macroscopic features of the terrain surface, which is of great significance for landslide sensitivity analysis. Topographic relief of the study area was hence divided into nine classes.
Since rainfall is one of the most significant factors that can trigger a landslide, landslide hazards often occur during the rainy season [45]. Rainfall infiltration reduces both the shear strength of the soil and the friction between the soil and the bedrock, thus inducing geological hazards. However, the average precipitation of the study area varies insignificantly between 230 and 280 mm. As a result, rainfall is not regarded as the most important factor in sensitivity mapping.
Multiple temperature and climate factors, including sunshine exposure time, solar height, solar radiation, and temperature differences, among others, can affect the water state and soil texture [46]. For instance, changes in temperature cause the expansion and contraction of rock substrates. The freezing and melting of water during freeze–thaw processes eventually lead to the disintegration of rocks. The slope aspect also has an indirect effect on landslides, which will lead to a decrease of landslide stability.
The plan curvature of the mountain is the rate of change of the slope angle, which directly affects surface runoff and the development of landslides [47,48]. Plan curvature includes three types: concave, convex, and flat. The results of classification of all the influencing factors in the study area are shown in Figure 7.

4. Results

4.1. Determination of AHP Weights

In the study area, the evaluation factors incorporate the lithology, slope angle, topographic relief, distance-to-river, distance-to-fault, plan curvature, precipitation, and slope aspect. According to the principles of the analytic hierarchy process (AHP) mentioned above, these eight evaluation factors are compared with each other in order to determine their relative importance. The judgement matrix for these eight evaluation factors is shown in Table 3. In terms of Equations (2) and (3), I c and R c are calculated, resulting in I c = 0.0417 and R c = 0.0296 . Because R c is less than 0.1, the judgement matrix satisfies the consistency requirement, and the weights are deemed reasonable.

4.2. The Information Content (IC) of the Eight Factors

According to Equations (4), (5), and (7), the eight factors were used for an evaluation index, and the information contents of all the factors were calculated, the results of which are listed in Table 4. The sensitivity of a landslide has a close correlation with the value of the IC (Information Content). If IC > 0, the probability of landslide occurrence is greater than average. If IC < 0, the probability is lower than average. If IC = 0, the probability of occurrence is average.
Table 4 shows that, for most landslides (74.12%), the results of IC are statistically significant. Eight lithologies exist within the study area. Landslides are primarily developed within the Quaternary slope wash ( Q 4 el + dl ), the Weimei Formation (J3w), the Ritang Formation (J1r), and the Nieru Formation (T3n), for which the IC values are 1.2524, 0.1434, 0.3251, and 0.1505, respectively.
With regard to natural breaks, the slope angle was divided into nine classes. The slope angle values of each class were subtracted from the slope unit, following which the mean of each slope unit was generated. As a result, the slope angle of each slope unit varied between 0 and 47°. The areas in which the landslides occurred along the river demonstrate relatively flat slopes. In the vast mountainous areas, from which the faults are geographically distant, the slope was steeper, and the river erosion was inconspicuous, resulting in landslides being undeveloped.
The topographic relief was also divided into nine classes through the distribution of natural breaks. The average values of the topographic relief in the study area ranged from 0 to 396 m. The IC values for the classes of 0~73 m, 73~93 m, 93~111 m, 128~145 m, and 193~246 m were respectively 0.3596, 0.1936, 0.2331, 0.1581, and 0.2903. It can be observed that the topographic relief classes in the study area of 0~111 m, 128~145 m, and 193~246 m were prone to slope failure.
The slope aspect was also divided into eight types depending on the azimuth, encompassing north, northeast, east, southeast, south, southwest, west, and northwest. With regard to the ICM, the slope aspects in the northeast, southeast, and south, which possess respective IC values of 0.1082, 0.2241, and 0.5357, were more inclined to trigger landslides.
Areas closer to the river are characterized by stronger soil erosion properties, so a landslide in close proximity to the river is liable to occur. The distance-to-river map was divided into four regions. Faults provide extremely advantageous conditions for landslide development, and in addition, faults can directly dominate the boundaries of landslides and impact their range and extent. It is shown in Table 4 that the landslides were mainly distributed within 0–1370 m of the faults and 0–1000 m of the river. It is thus concluded that the IC values for regions farther away from the faults and the river were relatively smaller.
Since the plan curvature factor describes the slope shape, it effectively provides the space condition for landslides to occur. The IC values of the concave slope, flat slope, and convex slope were −0.0052, −0.0317, and 0.0281, respectively. The convex slope reflected the strong crustal uplift, wherein the stress concentration was prominently enhanced. As a consequence, the convex slope reduced the stabilization of the slope.

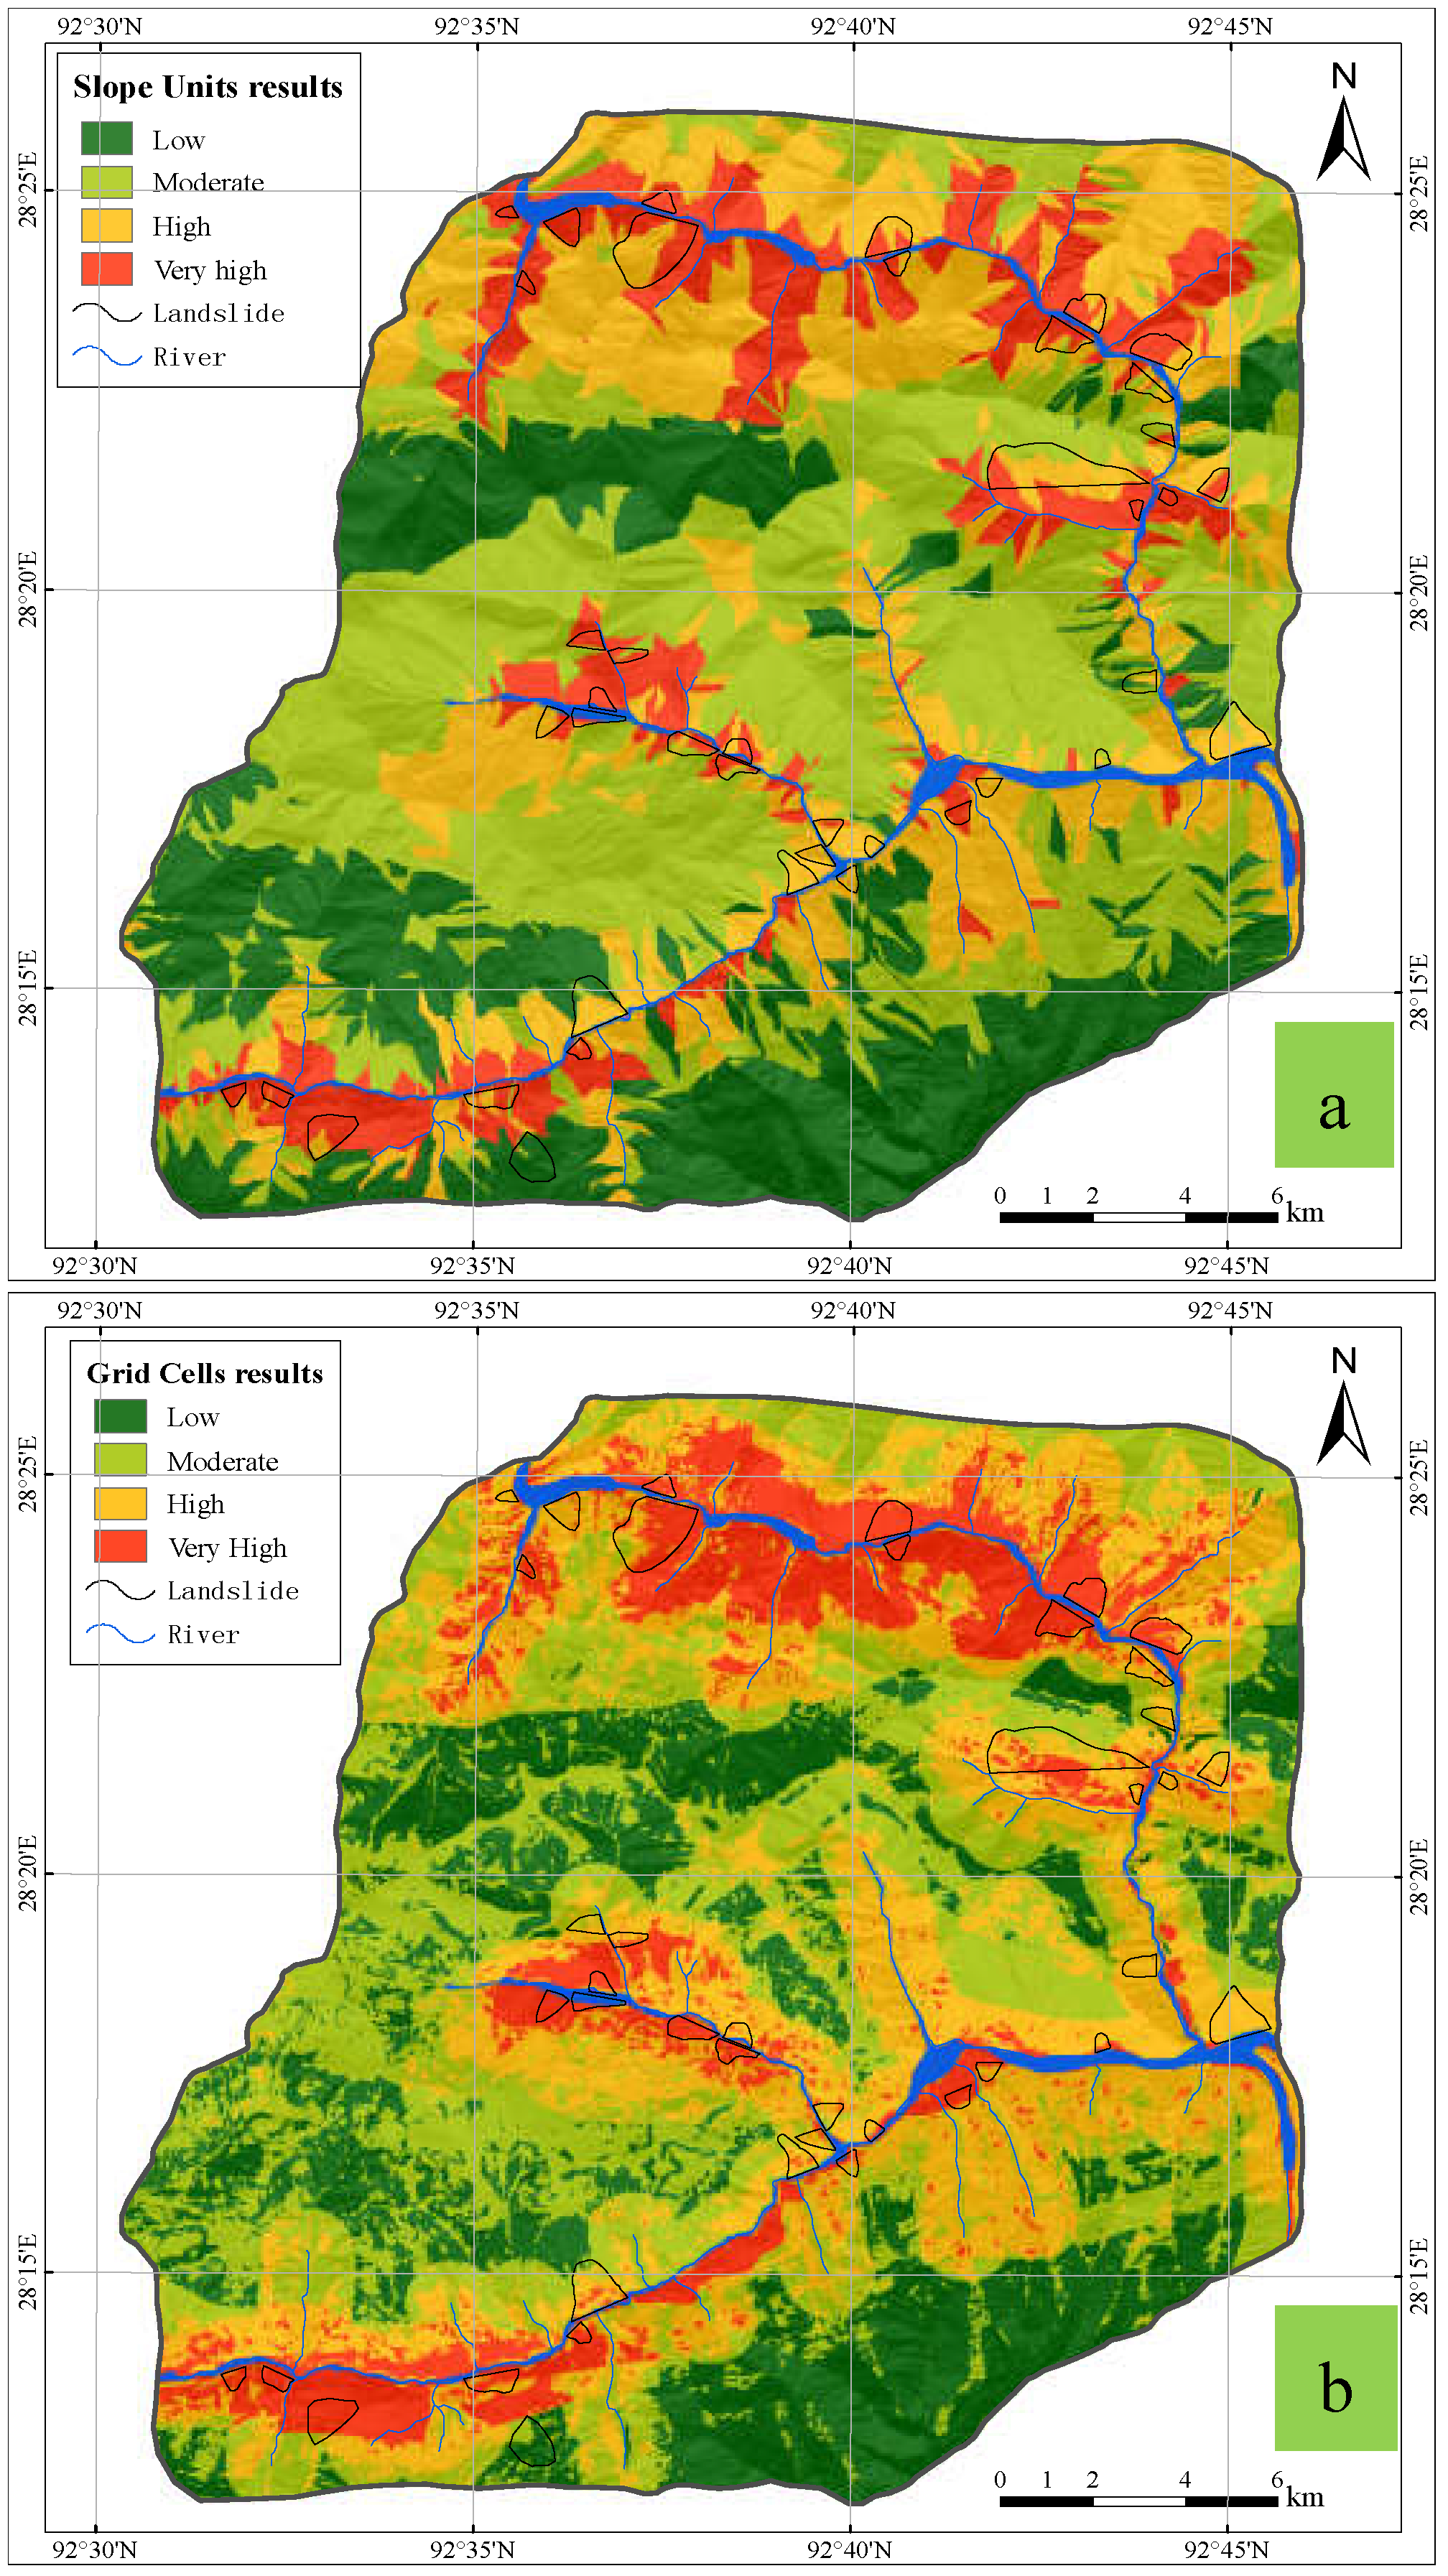
4.3. Landslide Susceptibility Mapping
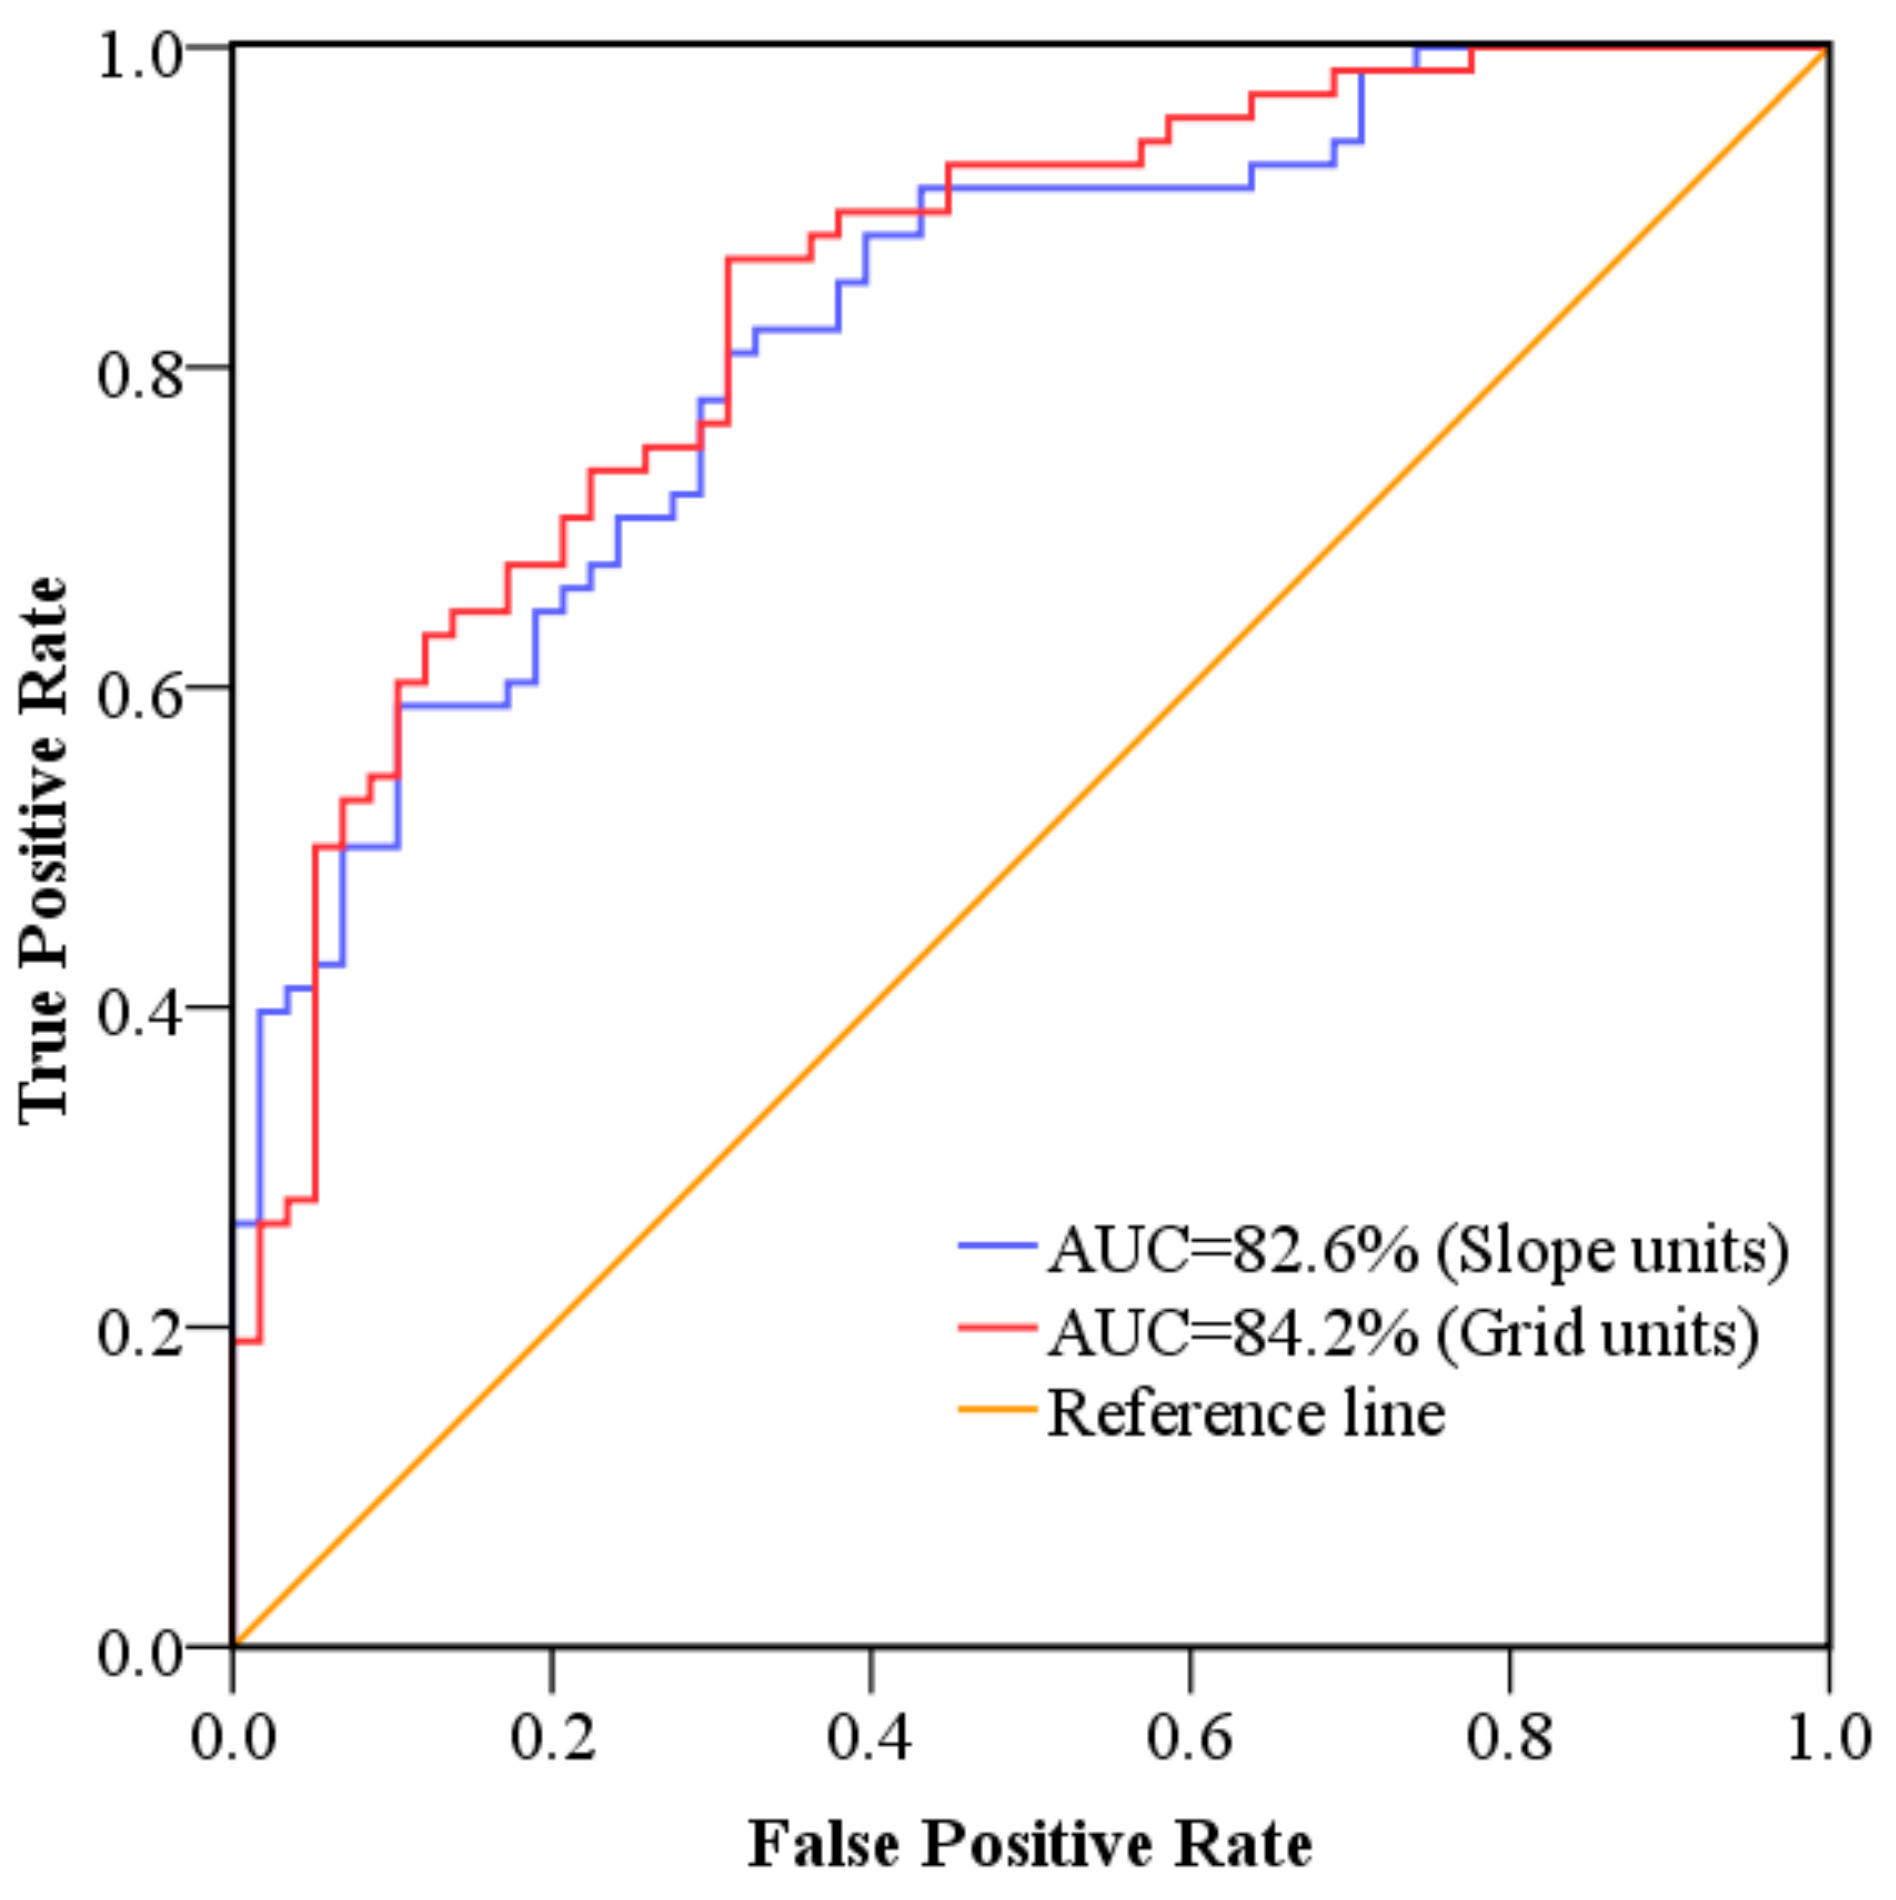
The eight influencing factors have been reclassified through the ICM. According to the weights of the eight factors calculated by the AHP, the eight factor maps were combined based on Equation (8) for the final landslide susceptibility mapping results. Since the different factors had diverse IC values, the comprehensive ICs were normalized to (0,1) for the purpose of comparison by the following equation:
A = ( I C I C min ) / ( I C max I C min )
where A is the normalized value of the comprehensive ICs, IC is the information content for each of the disparate classes, and I C max and I C min are the maximum and minimum information contents of all of the classes, respectively.
The study area was partitioned and extracted using the slope units, which is the primary and minimum geomorphic unit [24]. Typically, one landslide is comprised of several slope units. In the evaluation process, eight factors were chosen for the landslide sensitivity evaluation index. The precipitation was extracted and mapped using grid cells, while the other seven factors were extracted using the slope units (Figure 7). The final landslide susceptibility maps of slope units and grid units are shown in Figure 8.
In recent years, the natural breaks classification method has been extensively applied towards the evaluation of landslide susceptibilities. The purpose of the natural breaks classification method is to determine the optimal permutation that effectively divides numerical values into different categories [49]. As a method of data clustering, the average deviation of each class is minimized, and the mean value of each class deviating from the others is maximized. That is, the variance within each class is optimally reduced, while the variance between classes is maximized. Therefore, the natural breaks method is more suitable for a classification of the parameters obtained using the slope unit method.
Through a natural breaks classification and the use of GIS software, the landslide susceptibility maps of the slope units were reclassified into four categories: low (0–0.3346), moderate (0.3346–0.4764), high (0.4764–0.6417), and very high (0.6417–1). To facilitate a comparison with the slope unit evaluation method, the study area was evaluated using grid cells with a cell size of 10 m × 10 m. The landslide susceptibility maps of the grid cells were also reclassified into four categories: low (0–0.4016), moderate (0.4016–0.5236), high (0.5236–0.6574), and very high (0.6574–1). The statistical results using both the slope units and grid cells are shown in Table 5 and Table 6, respectively.

4.4. Validation

It is essential to validate the accuracy of the two methods, and the receiver operating characteristic (ROC) curve was constructed to measure the classification performance. The ROC curve is constructed by plotting the true positive rate (sensitivity) against the false positive rate (1-specificity) with the various cut-off thresholds. The area under the ROC curve (AUC) was used for quantitative comparison of the two methods, and the value of AUC is between 0.5 and 1. The larger the AUC value, the higher the accuracy of the model.
Figure 9 displays the evaluation results of the ROC curve, and the prediction accuracy using slope units was 82.6%, which was slightly lower than that using grid cells with an accuracy of 84.2%. The results show that both slope units and grid units are good at predicting the landslide susceptibility for the region along the Longzi River. However, due to the tiny size of the regular grid cell, some of the macroscopic properties of the factors were incapable of being exhibited well. The evaluation based on slope units is stiff with regard to the boundary of the slope, but the natural slope unit was superior to the grid cell for the description of the mechanical mechanisms, lithologies, and environmental boundaries of the slope. As a result, the prediction accuracy using slope units remained faithful by using the ICM and AHP methods, and the susceptibility mapping is deemed reliable.

5. Discussion

5.1. Application of AHP-ICM

The ICM is an objective evaluation method commonly applied for statistical analysis and is suitable for an evaluation of landslide susceptibilities. The ICM converts the actual value of landslide factors into an IC value that reflects the regional stability [50]. However, the ICM cannot reflect the relative significance of each influencing factor. Moreover, objective methods may retrieve misleading information. Based upon the field survey observations, an AHP is used to establish the hierarchical structure of the influencing factors. The relative significance of each factor is then determined by expert scoring, and the weight of each factor is subsequently acquired. The AHP-ICM approach combines the objective data with the semi-quantitative evaluation, thereby obtaining the landslide susceptibility map. The AHP-ICM method is superior to the other lone methods.
It can be observed from field investigations, historical data records and interpretation of Google imagery that lithology, river erosion, and fault development play significant roles in the deformation preceding a landslide and the ultimate failure. The weights of the eight influencing factors (lithology, distance-to-river, distance-to-fault, precipitation, slope angle, topographic relief, plan curvature, and slope aspect) calculated through the AHP were 0.2865, 0.1828, 0.1828, 0.1127, 0.1127, 0.0740, 0.0303, and 0.0182, respectively. The final landslide susceptibility map was created through the integration of various classification maps from the eight causative factors multiplied by the corresponding weight values obtained by the AHP.

5.2. Evaluation Results of the Slope Units

The statistical results of landslide susceptibility mapping utilizing slope units are shown in Table 5. The slope unit method indicated that the zone of very high susceptibility had an area of 57.31 km2, accounting for 11.09% of the entire study area. This region is mainly comprised of the Ritang Formation (J1r) and Quaternary-aged material. The high susceptibility zone close to the rivers and faults spanned an area of 142.23 km2, accounting for 27.51% of the total study area, which was mainly constituted by the Zhela Formation (J2z), the Weimei Formation (J3w), and the Ritang Formation (J1r). The lithologies of the very high and high susceptibility zones were mainly composed of slate, sandstone, siltstone, and so on. The rock group was a combination of soft- and medium-hardness substrates, which were prone to moderate-to-large landslides. Due to the erosion of the river and tectonic movement along the fault, both the rock and soil were strongly weathered, which provided a rich source of material for landslide development. The moderate and low susceptibility zones were 199.77 and 117.68 km2, accounting for 38.64% and 22.76%, respectively. The exposed strata of this area were mainly comprised of the Nieru Formation (T3n) and the Lure Formation (J2lr), the lithologies of which both constituted sandstone, metamorphic fine rock, and quartz sandstone. Since the moderate and low susceptibility areas were located far away from the fault and the river, the lithology was stable, and the occurrence of landslides was rare [51].
With respect to landslide occurrence, the very high, high, moderate, and low susceptibility zones spanned areas of 6.94 km2, 7.50 km2, 2.27 km2, and 0.81 km2, respectively, accounting for 39.61%, 42.81%, 12.97%, and 4.62% of the total landslide area. The proportion of the very high and high susceptibility zones to the total landslide area was 82.42%. The main stratum of this area was based in the Jurassic Period. With regard to the current investigation, most of the landslides occurred within very high and high sensitivity ranges. Consequently, it appears that it is more rational to predict and judge the landslide hazard range using the slope unit method.

5.3. Comparative Analysis of Slope Units and Grid Units

Advantages and limitations of the grid cell method were expressed during the susceptibility evaluation of landslides. As a consequence of utilizing regular grid cells, rapidity and simplification were achieved during computer processing. Nevertheless, as the grid cells became more and more refined, the unit became nearly unrelated to the geological, geomorphological, or other spatial terrain information [32]. Slope units, which are often utilized in numerous land resource investigations and disaster management, are more than capable of revealing such spatial information and geomorphologic context of the slopes.
The statistical results of the landslide susceptibility mapping utilizing grid cells are shown in Table 6. The results demonstrate that the area of the very high susceptibility zone was 81.07 km2, accounting for 15.68% of the entire study area. The high susceptibility zone was 157.38 km2, accounting for 30.44% of the entire study area. The proportions of the moderate and low susceptibility zones to the entirety of the study area were 32.29% and 21.59%, respectively. The extent of the low susceptibility area derived using the grid cell was equal to that acquired using the slope units. The moderate susceptibility area determined using the slope unit was larger than that using the grid cells, while the very high and high susceptibility areas were smaller when derived using slope units compared to those acquired from the grid cell approach. The study area was separated into regular square grids in the grid cell method, after which each cell was assigned a causative factor (e.g., the slope angle, slope aspect, and topographic relief), which was able to boost computational efficiency. Nevertheless, the grid cells lack a close association with geological conditions and topographic relief. Therefore, an inability to reflect the environmental boundaries and mechanical mechanisms of slope failure is another defect of grid cells. Since the area of the slope unit is much larger than that of the grid cell, equalization phenomena persist during the extraction of the influential factors using the slope unit [52].
With regard to the generation of landslides, the very high, high, moderate, and low susceptibility zones derived using the grid cells were 8.52 km2, 7.09 km2, 1.35 km2, and 0.56 km2, respectively, accounting for 48.61%, 40.46%, 7.73%, and 3.20% of the landslide areas. The very high susceptibility area of the grid unit is 9 percentage points higher than that of the slope unit, and the discrepancy between the two methods presents dominantly in the northern region. It can be concluded from the field investigation and Google imagery that the landslides in the northern area were distributed principally throughout the wide valleys. Arable land is abundant on both sides of the river and is characterized by large-scale landslides and low slope angles. The slope angle obtained through the grid cell varies greatly in concentration, not considering the integrity of the landslides. However, if the numerous grid cells cohesively form a slope unit, the average slope angle retrieved can embody the macroscopic characteristics of the landslides [53]. This is the equalization phenomenon referred to previously. In addition, the topographic relief is the most representative feature of the slope unit, which can efficiently express the fluctuation of landslides. The distance-to-fault and distance-to-river extracted from the slope unit can manifest the effects of the fault or the river on the entire slope unit, but not on a single grid cell. In summary, the two methods have their own distinct advantages and disadvantages, and it is worth noting that the slope unit evaluation reveals macroscopic characteristics. The slope unit is conducive to the investigation, evaluation, and management of a single landslide, which facilitates concentration on a single basin unit or a component of the landslide for research purposes.
The two evaluation methods demonstrated that the southeast and western regions of the study area were characterized by low or moderate susceptibility zones. These areas are predominantly alpine and are less affected by rivers and faults, and thus possess greater lithologic stability and few traces of human habitation and engineering construction. Due to the flat terrain near the river, the villages are mostly gathered in the northern, central, and southern areas that demonstrated high or very high susceptibilities. Inevitably, landslides pose a substantial threat to those proximal houses and fields. Tectonic movement plays an important role in the formation of landslides, and numerous types of weak structural planes control the distribution of sliding surfaces and the spatial distribution of landslides [54]. Large- and medium-sized landslides were mainly distributed in the range from 0 to 1000 m on either side of the river. The long-term lateral erosion and slope infiltration reduce the strength of the rock and soil and are consequently highly significant to landslide formation and development. Since the large area of a landslide may block the river, which will pose a considerable threat to the lives and property of local residents, it is essential that landslides should be prevented as soon as possible.

6. Conclusions

Landslide susceptibility maps are of great significance for the early warning of villages and residents in the Longzi River Basin. Based on a field investigation and analysis of remote sensing data, eight factors (the slope angle, slope aspect, plan curvature, distance-to-fault, distance-to-river, topographic relief, annual precipitation, and lithology) were selected as the relevant factors for an assessment of landslide susceptibility. Except for the rainfall factor, which was derived from grid cells, all the other factors were classified using the slope unit method. More importantly, the accuracy of the model has been verified, and it has been proven that the slope unit method is credible for evaluating landslide hazards.
The landslide susceptibility maps generated through the slope unit technique were divided into four categories: low, moderate, high, and very high susceptibility, accounting for 22.76%, 38.64%, 27.51%, and 11.09% of the study area, respectively. The ROC curve has been constructed to verify the accuracy of the slope unit method, and the prediction accuracy using slope units was 82.6%. It is proved that the slope unit is a good method to evaluate landslide susceptibility.
The range of very high susceptibility areas on the map produced with the slope unit method was less than that with the grid cell method, and vice versa for the case of high susceptibility areas. The slope unit presented a comprehensive macroscopic analysis and evaluation for each unit. Compared with the traditional rectangular grid cell, the slope unit was used as the evaluation unit with which to improve the consistency with the actual topography. Consequently, the final sensitivity map can precisely reflect the geological environmental conditions.
Most objective evaluation methods ignore the subjective understanding of the actual field survey, and the factor weight distribution is inconsistent with the reality. Thus, a subjective solution like that of the AHP approach should be utilized to assign weights. The ICM is a type of statistical analysis method that is most appropriate for an evaluation of the landslide sensitivity. A landslide hazard susceptibility map was generated utilizing the combination of an objective statistical method (ICM) and subjective weighting (AHP), thereby obtaining much more accurate results. The correctness and rationality of the solution were affirmed by an analysis of landslide sensitivities based on 41 landslides that have occurred in the field.
The slope unit was applied as the evaluation unit with which to estimate the landslide sensitivity, as is capable of truly expressing the spatial characteristics of a landslide. This method is beneficial to the quantification of watershed geomorphic factors, so that the evaluation process can preferably elaborate the physical mechanisms of landslides, thus improving the reliability of the evaluation results. Furthermore, the risk level of each watershed unit can be directly extracted from the susceptibility map, and the decision management department can readily take applicable measures to avoid the potential hazards inherent of landslides.

Acknowledgments

This work was supported by the Natural Science Foundations of China (Grant No. 41572257). The authors would like to thank Li Junxia (China Energy Engineering Group Tianjin Electric Power Design Institute Co., Ltd.) for her contribution in field investigation, data collection, and sorting.

Author Contributions

Fei Wang was devoted to data analysis, method utilization, theory exposition, graphics rendering, and manuscript writing. Changming Wang and Peihua Xu devised the main structure and arguments of the article. Ning Wang contributed to the revision of the manuscript. All of the authors proofread the final manuscript composition.

Conflicts of Interest

The authors declare no conflict of interest.

References

  1. Chalkias, C.; Ferentinou, M.; Polykretis, C. GIS supported landslide susceptibility modeling at regional scale: An expert-based fuzzy weighting method. ISPRS Int. J. Geo-Inf. 2014, 3, 523–539. [Google Scholar] [CrossRef]
  2. Youssef, A.M.; Pourghasemi, H.R.; Pourtaghi, Z.S.; Al-Katheeri, M.M. Landslide susceptibility mapping using random forest, boosted regression tree, classification and regression tree, and general linear models and comparison of their performance at Wadi Tayyah Basin, Asir Region, Saudi Arabia. Landslides 2016, 13, 839–856. [Google Scholar] [CrossRef]
  3. Pourghasemi, H.R.; Kerle, N. Random forests and evidential belief function-based landslide susceptibility assessment in western Mazandaran Province, Iran. Environ. Earth Sci. 2016, 75, 1–17. [Google Scholar] [CrossRef]
  4. Lee, S.; Pradhan, B. Landslide hazard mapping at selangor, malaysia using frequency ratio and logistic regression models. Landslides 2007, 4, 33–41. [Google Scholar] [CrossRef]
  5. Pourghasemi, H.R.; Pradhan, B.; Gokceoglu, C. Remote sensing data derived parameters and its use in landslide susceptibility assessment using Shannon’s entropy and GIS. Appl. Mech. Mater. 2012, 225, 486–491. [Google Scholar] [CrossRef]
  6. Bui, D.T.; Pradhan, B.; Lofman, O.; Revhaug, I.; Dick, O.B. Application of support vector machines in landslide susceptibility assessment for the Hoa Binh Province (Vietnam) with kernel functions analysis. In Proceedings of the iEMSs Sixth Biennial Meeting, Leipzig, Germany, 1–5 July 2012. [Google Scholar]
  7. Pourghasemi, H.R.; Pradhan, B.; Gokceoglu, C. Application of fuzzy logic and analytical hierarchy process (AHP) to landslide susceptibility mapping at Haraz watershed, Iran. Nat. Hazards 2012, 63, 965–996. [Google Scholar] [CrossRef]
  8. Hou, W.; Lu, X.; Wu, P.; Xue, A.; Li, L. An integrated approach for monitoring and information management of the Guanling Landslide (China). ISPRS Int. J. Geo-Inf. 2017, 6, 79. [Google Scholar] [CrossRef]
  9. Chhetri, S.K.; Kayastha, P. Manifestation of an analytic hierarchy process (AHP) model on fire potential zonation mapping in kathmandu metropolitan city, Nepal. ISPRS Int. J. Geo-Inf. 2015, 4, 400–417. [Google Scholar] [CrossRef]
  10. Bui, D.T.; Lofman, O.; Revhaug, I.; Dick, O. Landslide susceptibility analysis in the Hoa Binh Province of Vietnam using statistical index and logistic regression. Nat. Hazards 2011, 59, 1413. [Google Scholar] [CrossRef]
  11. Pourghasemi, H.; Moradi, H.; Aghda, S.F. Landslide susceptibility mapping by binary logistic regression, analytical hierarchy process, and statistical index models and assessment of their performances. Nat. Hazards 2013, 69, 749–779. [Google Scholar] [CrossRef]
  12. Conforti, M.; Pascale, S.; Robustelli, G.; Sdao, F. Evaluation of prediction capability of the artificial neural networks for mapping landslide susceptibility in the Turbolo River Catchment (northern Calabria, Italy). Catena 2014, 113, 236–250. [Google Scholar] [CrossRef]
  13. Zare, M.; Pourghasemi, H.R.; Vafakhah, M.; Pradhan, B. Landslide susceptibility mapping at Vaz watershed (Iran) using an artificial neural network model: A comparison between multilayer perceptron (MLP) and radial basic function (RBF) algorithms. Arab. J. Geosci. 2013, 6, 2873–2888. [Google Scholar] [CrossRef]
  14. Bui, D.T.; Tuan, T.A.; Klempe, H.; Pradhan, B.; Revhaug, I. Spatial prediction models for shallow landslide hazards: A comparative assessment of the efficacy of support vector machines, artificial neural networks, kernel logistic regression, and logistic model tree. Landslides 2016, 13, 361–378. [Google Scholar]
  15. Pourghasemi, H.R.; Jirandeh, A.G.; Pradhan, B.; Xu, C.; Gokceoglu, C. Landslide susceptibility mapping using support vector machine and GIS at the Golestan Province, Iran. J. Earth Syst. Sci. 2013, 122, 349–369. [Google Scholar] [CrossRef]
  16. Cao, C.; Xu, P.; Wang, Y.; Chen, J.; Zheng, L.; Niu, C. Flash flood hazard susceptibility mapping using frequency ratio and statistical index methods in coalmine subsidence areas. Sustainability 2016, 8, 948. [Google Scholar] [CrossRef]
  17. Park, S.; Choi, C.; Kim, B.; Kim, J. Landslide susceptibility mapping using frequency ratio, analytic hierarchy process, logistic regression, and artificial neural network methods at the Inje area, Korea. Environ. Earth Sci. 2013, 68, 1443–1464. [Google Scholar] [CrossRef]
  18. Pourghasemi, H.R.; Rossi, M. Landslide susceptibility modeling in a landslide prone area in Mazandarn Province, north of Iran: A comparison between GLM, GAM, MARS, and M-AHP methods. Theor. Appl. Climatol. 2016, 1–25. [Google Scholar] [CrossRef]
  19. Nefeslioglu, H.A.; Sezer, E.A.; Gokceoglu, C.; Ayas, Z. A modified analytical hierarchy process (M-AHP) approach for decision support systems in natural hazard assessments. Comput. Geosci. 2013, 59, 1–8. [Google Scholar] [CrossRef]
  20. Cao, C.; Wang, Q.; Chen, J.; Ruan, Y.; Zheng, L.; Song, S.; Niu, C. Landslide susceptibility mapping in vertical distribution law of precipitation area: Case of the xulong hydropower station reservoir, southwestern China. Water 2016, 8, 270. [Google Scholar] [CrossRef]
  21. Cox, N. Hillslope profile analysis (comment). Area 1978, 10, 131–133. [Google Scholar]
  22. Francou, B.; Manté, C. Analysis of the segmentation in the profile of Alpine Talus Slopes. Permafrost Periglac. Process. 1990, 1, 53–60. [Google Scholar] [CrossRef]
  23. Savigear, R. The Analysis and Classification of Slope Profile Forms; Université de Liège: Liège, Belgium, 1967. [Google Scholar]
  24. Carrara, A.; Cardinali, M.; Detti, R.; Guzzetti, F.; Pasqui, V.; Reichenbach, P. GIS techniques and statistical models in evaluating landslide hazard. Earth Surf. Process. Landf. 1991, 16, 427–445. [Google Scholar] [CrossRef]
  25. Carrara, A.; Cardinali, M.; Guzzetti, F. Uncertainty in assessing landslide hazard and risk. ITC J. 1992, 2, 172–183. [Google Scholar]
  26. Carrara, A.; Cardinali, M.; Guzzetti, F.; Reichenbach, P. GIS technology in mapping landslide hazard. In Geographical Information Systems in Assessing Natural Hazards; Springer: Dordrecht, The Netherlands, 1995; pp. 135–175. [Google Scholar]
  27. Guzzetti, F.; Cardinali, M. Landslide inventory map of the Umbria Region, central Italy. Proc. ALPS 1990, 90, 273–284. [Google Scholar]
  28. Guzzetti, F.; Cardinali, M.; Reichenbach, P. The avi project: A bibliographical and archive inventory of landslides and floods in Italy. Environ. Manag. 1994, 18, 623–633. [Google Scholar] [CrossRef]
  29. Guzzetti, F.; Cardinali, M.; Reichenbach, P. The influence of structural setting and lithology on landslide type and pattern. Environ. Eng. Geosci. 1996, 2, 531–555. [Google Scholar] [CrossRef]
  30. Cooper, P.R.; Friedman, D.E.; Wood, S.A. The automatic generation of digital terrain models from satellite images by stereo. Acta Astronaut. 1987, 15, 171–180. [Google Scholar] [CrossRef]
  31. Ehlers, M.; Welch, R. Stereocorrelation of Landsat TM Images; Food and Agriculture Organization of the United Nations: Rome, Italy, 1987. [Google Scholar]
  32. Jia, N.; Mitani, Y.; Xie, M.; Djamaluddin, I. Shallow landslide hazard assessment using a three-dimensional deterministic model in a mountainous area. Comput. Geotech. 2012, 45, 1–10. [Google Scholar] [CrossRef]
  33. Giles, P.T.; Franklin, S.E. An automated approach to the classification of the slope units using digital data. Geomorphology 1998, 21, 251–264. [Google Scholar] [CrossRef]
  34. Saaty, T.L. Modeling unstructured decision problems—The theory of analytical hierarchies. Math. Comput. Simul. 1978, 20, 147–158. [Google Scholar] [CrossRef]
  35. Du, J.; Yang, Q.-H.; Yan, J.; Xue, C.-S. Hazard evaluation of secondary geological disaster based on GIS and information value method. Earth Sci. Diqiu Kexue 2010, 35, 324–330. [Google Scholar]
  36. Gao, K.; Cui, P.; Zhao, C.; Wei, F. Landslide hazard evaluation of wanzhou based on GIS information value method in the Three Gorges Reservoir. Yanshilixue Yu Gongcheng Xuebao 2006, 25, 991–996. [Google Scholar]
  37. Chen, Y.; Zhou, F.; Feng, Y.; Xia, Y. Breach of a naturally embanked dam on Yalong River. Can. J. Civ. Eng. 1992, 19, 811–818. [Google Scholar] [CrossRef]
  38. Li, T.; Schuster, R.L.; Wu, J. Landslide dams in south-central China. In Landslide Dams: Processes, Risk, and Mitigation; ASCE: Reston, VA, USA, 1986; pp. 146–162. [Google Scholar]
  39. Shang, Y.; Yang, Z.; Li, L.; Liu, D.A.; Liao, Q.; Wang, Y. A super-large landslide in Tibet in 2000: Background, occurrence, disaster, and origin. Geomorphology 2003, 54, 225–243. [Google Scholar] [CrossRef]
  40. Junxia, L.; Wang, C.; Wang, G.; Liu, W. Analysis of landslide influential factors and coupling intensity based on third theory of quantification. Chin. J. Rock Mech. Eng. 2010, 6, 1206–1213. [Google Scholar]
  41. Li, J.-X.; Wang, C.-M.; Wang, G.-C. Landslide risk assessment based on combination weighting-unascertained measure theory. Rock Soil Mech. 2013, 34, 468–474. [Google Scholar]
  42. Pradhan, B. Landslide susceptibility mapping of a catchment area using frequency ratio, fuzzy logic and multivariate logistic regression approaches. J. Indian Soc. Remote Sens. 2010, 38, 301–320. [Google Scholar] [CrossRef]
  43. Lee, S.; Min, K. Statistical analysis of landslide susceptibility at Yongin, Korea. Environ. Geol. 2001, 40, 1095–1113. [Google Scholar] [CrossRef]
  44. Hong, H.; Pradhan, B.; Xu, C.; Bui, D.T. Spatial prediction of landslide hazard at the Yihuang Area (China) using two-class kernel logistic regression, alternating decision tree and support vector machines. Catena 2015, 133, 266–281. [Google Scholar] [CrossRef]
  45. Oh, H.-J.; Pradhan, B. Application of a neuro-fuzzy model to landslide-susceptibility mapping for shallow landslides in a tropical hilly area. Comput. Geosci. 2011, 37, 1264–1276. [Google Scholar] [CrossRef]
  46. Ercanoglu, M.; Gokceoglu, C.; Van Asch, T.W. Landslide susceptibility zoning north of Yenice (NW Turkey) by multivariate statistical techniques. Nat. Hazards 2004, 32, 1–23. [Google Scholar] [CrossRef]
  47. Nefeslioglu, H.A.; Duman, T.Y.; Durmaz, S. Landslide susceptibility mapping for a part of tectonic kelkit valley (eastern black sea region of Turkey). Geomorphology 2008, 94, 401–418. [Google Scholar] [CrossRef]
  48. Yilmaz, C.; Topal, T.; Süzen, M.L. GIS-based landslide susceptibility mapping using bivariate statistical analysis in devrek (zonguldak-Turkey). Environ. Earth Sci. 2012, 65, 2161–2178. [Google Scholar] [CrossRef]
  49. Feizizadeh, B.; Blaschke, T. GIS-multicriteria decision analysis for landslide susceptibility mapping: Comparing three methods for the Urmia Lake Basin, Iran. Nat. Hazards 2013, 65, 2105–2128. [Google Scholar] [CrossRef]
  50. Xu, W.; Yu, W.; Jing, S.; Zhang, G.; Huang, J. Debris flow susceptibility assessment by GIS and information value model in a large-scale region, Sichuan Province (China). Nat. Hazards 2013, 65, 1379–1392. [Google Scholar] [CrossRef]
  51. Du, G.-L.; Zhang, Y.-S.; Iqbal, J.; Yang, Z.-H.; Yao, X. Landslide susceptibility mapping using an integrated model of information value method and logistic regression in the Bailongjiang watershed, Gansu Province, China. J. Mt. Sci. 2017, 14, 249–268. [Google Scholar] [CrossRef]
  52. Guzzetti, F.; Reichenbach, P.; Ardizzone, F.; Cardinali, M.; Galli, M. Estimating the quality of landslide susceptibility models. Geomorphology 2006, 81, 166–184. [Google Scholar] [CrossRef]
  53. Guzzetti, F. Landslide hazard and risk by GIS-based multivariate models. In Proceedings of the International Workshop GIS in Assessing Natural Hazards, Perugia, Italy, 20–22 September 1993; pp. 20–22. [Google Scholar]
  54. Shang, Y.; Hyun, C.-U.; Park, H.-D.; Yang, Z.; Yuan, G. The 102 landslide: Human-slope interaction in SE Tibet over a 20-year period. Environ. Earth Sci. 2016, 76, 47. [Google Scholar] [CrossRef]
Figure 1. Division of two slope units in a catchment: (a) a slope unit sketched map; (b) a slope unit planar map.
Ijgi 06 00172 g001
Figure 2. Construction process of the slope unit.
Ijgi 06 00172 g002
Figure 3. Geographical location of the study area.
Ijgi 06 00172 g003
Figure 4. Typical landslides and their impacts on residents within the study area. (a) Lunba Landslide in a tributary. (b) Zhuolonglang landslide in Jiayu County. (c) Mentang power station landslide. (d) Landslide due to a tension fissure in Danglaimu. (e) Sino-Nepalese Highway cracking. (f) Wall cracking in a Public Security Bureau computer room.
Ijgi 06 00172 g004
Figure 5. Flow direction of each grid cell.
Ijgi 06 00172 g005
Figure 6. Division of slope units in the study area.
Ijgi 06 00172 g006
Figure 7. Maps of the influencing factors within the study area: (a) lithology; (b) distance-to-river; (c) distance-to-fault; (d) precipitation; (e) slope angle; (f) topographic relief; (g) plan curvature; (h) slope aspect.
Ijgi 06 00172 g007aIjgi 06 00172 g007b
Figure 8. Landslide susceptibility map results using (a) slope units and (b) grid cells.
Ijgi 06 00172 g008
Figure 9. Receiver operating characteristic (ROC) curve evaluation of the two methods.
Ijgi 06 00172 g009
Table 1. Scale of the judgement matrix and the corresponding descriptions.
Importance ScaleMeaning
1ai has the same importance as aj
3ai is slightly more important than aj
5ai is significantly more important than aj
7ai is much more strongly important than aj
9ai is extremely more important than aj
2, 4, 6, 8Represents the intermediate value of the above Judgement
Table 2. The random consistency ratio I R .
n1234567891011
R c 000.580.901.121.241.321.411.451.491.51
Table 3. Pair-wise comparison matrix for influencing factor weights.
HeadingX1X2X3X4X5X6X7X8Weights
X1112334790.2544
X2112334790.2544
X31/21/21223680.1645
X41/31/31/2112570.1050
X51/31/31/2112570.1050
X61/41/41/31/21/21460.0698
X71/71/71/61/51/51/4130.0291
X81/91/91/81/71/71/61/310.0176
Notes: X1: lithology; X2: distance-to-river; X3: distance-to-fault; X4: precipitation; X5: slope angle; X6: topographic relief; X7: plan curvature; X8: slope aspect.
Table 4. Distribution of the training pixels.
FactorClassLandslide Not OccurredLandslide OccurredTotal CountInformation Content
CountRatio/%CountRatio/%
Lithology Q 4 al 100,0970.0233040.02103,401−0.0589
Q 4 el + dl 73,7340.0199190.0683,6531.2524
J3w701,8580.1428,5720.16730,4300.1434
J2z1,249,7090.2541,8630.241,291,572−0.0446
J2lr1,128,1420.2323,6190.131,151,761−0.5024
J1r1,053,2080.2151,8390.301,105,0470.3251
K1l528,1290.1195210.05537,650−0.6491
T3n163,6560.0367120.04170,3680.1505
Distance-to-River/m0–396839,3910.1768,3340.39907,7250.7981
396–629623,9440.1246,3960.26670,3400.7140
629–10001,095,6000.2244,3880.251,139,9880.1388
>10002,439,5940.4916,2350.092,455,829−1.6344
Distance-to-Fault/m0–677625,2940.1340,1700.23665,4640.5772
677–1017534,9440.1130,3290.17565,2730.4594
1017–1370511,6690.1019,9770.11531,6460.1032
1370–1600825,4770.1726,3570.15851,834−0.0911
>16002,501,1490.5058,5160.332,559,665−0.3937
Precipitation/mm0–2451,433,0910.2989,9250.511,523,0160.5551
245–2602,503,3370.5060,8080.352,564,145−0.3571
260–2781,062,1050.2124,6160.141,086,7210.0551
Slope Angle/°0–14111,6690.0292340.05120,9030.8125
14–19404,7440.0814,6960.08419,4400.0333
19–23546,6820.1140,0190.23586,7010.6994
23–26726,0710.1528,8150.16754,8860.1189
26–29789,0230.1618,0160.10807,039−0.4175
29–31809,1610.1619,8550.11829,016−0.3472
31–34702,2540.1423,8530.14726,107−0.0312
34–38545,8740.1113,4470.08559,321−0.3434
38–47363,0550.0774140.04370,469−0.5268
Topographic relief0–73222,6410.0411,3630.06234,0040.3596
73–93469,2590.0920,1280.11489,3870.1936
93–111794,3210.1635,5050.20829,8260.2331
111–128946,8330.1924,0520.14970,885−0.3134
128–145892,4670.1836,8910.21929,3580.1581
145–166777,6050.1625,0080.14802,613−0.0841
166–193528,2990.1183270.05536,626−0.7812
193–246292,7900.0613,8950.08306,6850.2903
246–39674,3180.011800.0074,498−2.6410
Plan Curvature<−0.011,814,2170.3663,3020.361,877,519−0.0052
−0.01–0.011,365,6860.2746,3650.261,412,051−0.0317
>0.011,818,6300.3665,6820.371,884,3120.0281
Slope AspectNorth10,3370.001090.0010,446−1.1780
Northeast570,2400.1122,3790.13592,6190.1082
East894,0470.1829,2500.17923,297−0.0675
Southeast894,5550.1839,6130.23934,1680.2241
South714,6740.1443,9300.25758,6040.5357
Southwest643,5410.1314,6530.08658,194−0.4203
West800,0880.1616,8310.10816,919−0.4977
Northwest471,0510.0985840.05479,635−0.6385
Table 5. Statistical results of landslide susceptibility mapping using slope units.
SusceptibilityLandslide OccurredTotal Study Area
CountRatio (%)Area (km2)CountRatio (%)Area (km2)
Low80934.620.811,177,71322.76117.68
Moderate22,74412.972.271,999,24938.64199.77
High75,06142.817.501,423,38027.51142.23
Very High69,45539.616.94573,54011.0957.31
Table 6. Statistical results of landslide susceptibility mapping using grid cells.
SusceptibilityLandslide OccurredTotal Study Area
CountRatio (%)Area (km2)CountRatio (%)Area (km2)
Low56053.200.561,116,34121.59111.62
Moderate13,5587.731.351,669,57832.29166.93
High70,95440.467.091,573,98630.44157.38
Very High85,23548.618.52810,84015.6881.07

