Next Issue
Volume 6, August
Previous Issue
Volume 6, June


ISPRS Int. J. Geo-Inf., Volume 6, Issue 7 (July 2017) – 45 articles

Cover Story (view full-size image): 
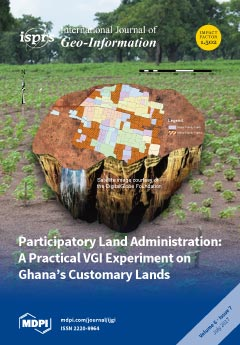
We present the results of an experiment into Participatory Land Administration (PLA), a VGI application, on customary lands. PLA connects emerging technologies to meet the current societal needs on customary lands, balancing the traditional government-led land administration with the emerging crowd-sourced land administration. The experiment is conducted in Nanton, a village in Ghana that needs a land administration system. The process was developed by the local farmers together with professionals based on the available technology and the local needs, in this case land consolidation. The experiment involved collecting farmland information over a two-week period based on PLA. Though the results show that PLA is faster, cheaper and can potentially support land consolidation, further investigation is needed for integration into the formal land administration system. View the paper
  • Issues are regarded as officially published after their release is announced to the table of contents alert mailing list.
  • You may sign up for e-mail alerts to receive table of contents of newly released issues.
  • PDF is the official format for papers published in both, html and pdf forms. To view the papers in pdf format, click on the "PDF Full-text" link, and use the free Adobe Reader to open them.
Order results
Result details
Select all
Export citation of selected articles as:
2944 KiB  
Article
Comparative Assessment of Three Nonlinear Approaches for Landslide Susceptibility Mapping in a Coal Mine Area
by Qiaomei Su, Jin Zhang, Shangmin Zhao, Li Wang, Jin Liu and Jianli Guo
ISPRS Int. J. Geo-Inf. 2017, 6(7), 228; https://doi.org/10.3390/ijgi6070228 - 23 Jul 2017
Cited by 50 | Viewed by 4946
Abstract
Landslide susceptibility mapping is the first and most important step involved in landslide hazard assessment. The purpose of the present study is to compare three nonlinear approaches for landslide susceptibility mapping and test whether coal mining has a significant impact on landslide occurrence [...] Read more.
Landslide susceptibility mapping is the first and most important step involved in landslide hazard assessment. The purpose of the present study is to compare three nonlinear approaches for landslide susceptibility mapping and test whether coal mining has a significant impact on landslide occurrence in coal mine areas. Landslide data collected by the Bureau of Land and Resources are represented by the X, Y coordinates of its central point; causative factors were calculated from topographic and geologic maps, as well as satellite imagery. The five-fold cross-validation method was adopted and the landslide/non-landslide datasets were randomly split into a ratio of 80:20. From this, five subsets for 20 times were acquired for training and validating models by GIS Geostatistical analysis methods, and all of the subsets were employed in a spatially balanced sample design. Three landslide models were built using support vector machine (SVM), logistic regression (LR), and artificial neural network (ANN) models by selecting the median of the performance measures. Then, the three fitted models were compared using the area under the receiver operating characteristics (ROC) curves (AUC) and the performance measures. The results show that the prediction accuracies are between 73.43% and 87.45% in the training stage, and 67.16% to 73.13% in the validating stage for the three models. AUCs vary from 0.807 to 0.906 and 0.753 to 0.944 in the two stages, respectively. Additionally, three landslide susceptibility maps were obtained by classifying the range of landslide probabilities into four classes representing low (0–0.02), medium (0.02–0.1), high (0.1–0.85), and very high (0.85–1) probabilities of landslides. For the distributions of landslide and area percentages under different susceptibility standards, the SVM model has more relative balance in the four classes compared to the LR and the ANN models. The result reveals that the SVM model possesses better prediction efficiency than the other two models. Furthermore, the five factors, including lithology, distance from the road, slope angle, elevation, and land-use types, are the most suitable conditioning factors for landslide susceptibility mapping in the study area. The mining disturbance factor has little contribution to all models, because the mining method in this area is underground mining, so the mining depth is too deep to affect the stability of the slopes. Full article
(This article belongs to the Special Issue Advanced Geo-Information Technologies for Anticipatory Computing)
Show Figures

Figure 1

8530 KiB  
Article
Evaluating the Evacuation and Rescue Capabilities of Urban Open Space from a Land Use Perspective: A Case Study in Wuhan, China
by Jie Gong, Yaolin Liu, Yanfang Liu, Pujiang Huang and Jiwei Li
ISPRS Int. J. Geo-Inf. 2017, 6(7), 227; https://doi.org/10.3390/ijgi6070227 - 21 Jul 2017
Cited by 8 | Viewed by 4770
Abstract
This study proposes an innovative integrated method for evaluating the evacuation and rescue capabilities of open spaces through a case study in Wuhan, China. A dual-scenario network analysis model was set up to calculate travel time among communities, open spaces, and rescue facilities [...] Read more.
This study proposes an innovative integrated method for evaluating the evacuation and rescue capabilities of open spaces through a case study in Wuhan, China. A dual-scenario network analysis model was set up to calculate travel time among communities, open spaces, and rescue facilities during peak and non-peak hours. The distribution of traffic flow was derived on the basis of a gravity model and used to construct supply-demand indexes (SDIs). SDIs such as evacuation (ESDI), rescue (RSDI), and comprehensive SDIs (CSDI) were used to evaluate the suitability of open space locations. This study drew five major findings as follows: (1) ESDI, RSDI, and CSDI can effectively evaluate the spatial suitability of open spaces when these SDIs are integrated with the gravity model. (2) The quadrant distribution analysis of ESDI can be an effective method for determining the reasons for the change in values in the two traffic scenarios and for helping planners in adjusting their policies to enhance the capability of an area. (3) The impact of the different β values on SDIs can show positive, negative, and inconspicuous correlations with large, moderate, and minimal variations, respectively. (4) The analysis of the supply-demand relationship of open spaces in Wuhan indicates a spatial mismatch in comprehensive evacuation and rescue capacities. (5) Traffic congestion can be a significant impact factor on evacuation and rescue capabilities but not on comprehensive capability. Full article
Show Figures

Figure 1

4412 KiB  
Article
Collaborative Geodesign and Spatial Optimization for Fragmentation-Free Land Allocation
by Yiqun Xie, Bryan C. Runck, Shashi Shekhar, Len Kne, David Mulla, Nicolas Jordan and Peter Wiringa
ISPRS Int. J. Geo-Inf. 2017, 6(7), 226; https://doi.org/10.3390/ijgi6070226 - 21 Jul 2017
Cited by 11 | Viewed by 5246
Abstract
Demand for agricultural food production is projected to increase dramatically in the coming decades, putting at risk our clean water supply and prospects for sustainable development. Fragmentation-free land allocation (FF-LA) aims to improve returns on ecosystem services by determining both space partitioning of [...] Read more.
Demand for agricultural food production is projected to increase dramatically in the coming decades, putting at risk our clean water supply and prospects for sustainable development. Fragmentation-free land allocation (FF-LA) aims to improve returns on ecosystem services by determining both space partitioning of a study area and choice of land-use/land-cover management practice (LMP) for each partition under a budget constraint. In the context of large-scale industrialized food production, fragmentation (e.g., tiny LMP patches) discourages the use of modern farm equipment (e.g., 10- to 20-m-wide combine harvesters) and must be avoided in the allocation. FF-LA is a computationally challenging NP-hard problem. We introduce three frameworks for land allocation planning, namely collaborative geodesign, spatial optimization and a hybrid model of the two, to help stakeholders resolve the dilemma between increasing food production capacity and improving water quality. A detailed case study is carried out at the Seven Mile Creek watershed in the midwestern US. The results show the challenges of generating near-optimal solutions through collaborative geodesign, and the potential benefits of spatial optimization in assisting the decision-making process. Full article
(This article belongs to the Special Issue Spatiotemporal Computing for Sustainable Ecosystem)
Show Figures

Figure 1

1374 KiB  
Article
FOSS Tools and Applications for Education in Geospatial Sciences
by Marco Ciolli, Bianca Federici, Ilaria Ferrando, Roberto Marzocchi, Domenico Sguerso, Clara Tattoni, Alfonso Vitti and Paolo Zatelli
ISPRS Int. J. Geo-Inf. 2017, 6(7), 225; https://doi.org/10.3390/ijgi6070225 - 21 Jul 2017
Cited by 19 | Viewed by 5281
Abstract
While the theory and implementation of geographic information systems (GIS) have a history of more than 50 years, the development of dedicated educational tools and applications in this field is more recent. This paper presents a free and open source software (FOSS) approach [...] Read more.
While the theory and implementation of geographic information systems (GIS) have a history of more than 50 years, the development of dedicated educational tools and applications in this field is more recent. This paper presents a free and open source software (FOSS) approach for education in the geospatial disciplines, which has been used over the last 20 years at two Italian universities. The motivations behind the choice of FOSS are discussed with respect to software availability and development, as well as educational material licensing. Following this philosophy, a wide range of educational tools have been developed, covering topics from numerical cartography and GIS principles to the specifics regarding different systems for the management and analysis of spatial data. Various courses have been implemented for diverse recipients, ranging from professional training workshops to PhD courses. Feedback from the students of those courses provides an invaluable assessment of the effectiveness of the approach, supplying at the same time directions for further improvement. Finally, lessons learned after 20 years are discussed, highlighting how the management of educational materials can be difficult even with a very open approach to licensing. Overall, the use of free and open source software for geospatial (FOSS4G) science provides a clear advantage over other approaches, not only simplifying software and data management, but also ensuring that all of the information related to system design and implementation is available. Full article
Show Figures

Figure 1

6452 KiB  
Article
Towards Enhancing Integrated Pest Management Based on Volunteered Geographic Information
by Yingwei Yan, Chen-Chieh Feng and Klarissa Ting-Ting Chang
ISPRS Int. J. Geo-Inf. 2017, 6(7), 224; https://doi.org/10.3390/ijgi6070224 - 21 Jul 2017
Cited by 17 | Viewed by 4735
Abstract
Integrated pest management (IPM) involves integrating multiple pest control methods based on site information obtained through inspection, monitoring, and reports. IPM has been deployed to achieve the judicious use of pesticides and has become one of the most important methods of securing agricultural [...] Read more.
Integrated pest management (IPM) involves integrating multiple pest control methods based on site information obtained through inspection, monitoring, and reports. IPM has been deployed to achieve the judicious use of pesticides and has become one of the most important methods of securing agricultural productivity. Despite the efforts made to strengthen IPM during the past decades, overuse as well as indiscriminate use of pesticides is still common. This problem is particularly serious in underserved farming communities which suffer from ineffectiveness with respect to pest management information collection and dissemination. The recent development of volunteered geographic information (VGI) offers an opportunity to the general public to create and receive ubiquitous, cost-effective, and timely geospatial information. Therefore, this study proposes to enhance IPM through establishing a VGI-based IPM. As a starting point of this line of research, this study explored how such geospatial information can contribute to IPM enhancement. Based on this, a conceptual framework of VGI interaction was built to guide the establishment of VGI-based IPM. To implement VGI-based IPM, a mobile phone platform was developed. In addition, a case study was conducted in the town of Shuibian in Jiangxi province of China to demonstrate the effectiveness of the proposed approach. In the case study, by analyzing infestation incidents of an overwintering outbreak of striped rice stem borers voluntarily reported by farmers through mobile phones, spatiotemporal infestation patterns of the borers throughout the study area were revealed and disseminated to the farmers. These patterns include the dates and degree-days the pest infestations intensified, and the orientation or spatial structural variations of the clustering of the infestations. This case study showcased the unique merit of VGI in enhancing IPM, namely the acquisition of previously unrecorded spatial data in a cost-effective and real-time manner for discovering and disseminating previously unknown pest management knowledge. Full article
Show Figures

Figure 1

4041 KiB  
Article
Overview of the Croatian Land Administration System and the Possibilities for Its Upgrade to 3D by Existing Data
by Nikola Vučić, Miodrag Roić, Mario Mađer, Saša Vranić and Peter Van Oosterom
ISPRS Int. J. Geo-Inf. 2017, 6(7), 223; https://doi.org/10.3390/ijgi6070223 - 20 Jul 2017
Cited by 21 | Viewed by 5898
Abstract
This paper explores the laws and other legal acts related to the Croatian 3D cadastre with an emphasis on those which relate to interests in strata, spatial planning, and other regulations that are valid or were valid on Croatian territory. The effects of [...] Read more.
This paper explores the laws and other legal acts related to the Croatian 3D cadastre with an emphasis on those which relate to interests in strata, spatial planning, and other regulations that are valid or were valid on Croatian territory. The effects of the application of these regulations on the present situation of registration in cadastre and land register were considered. This paper also explores current legal, institutional, and technical solutions implemented in the Croatian Land Administration System and the possibilities for its upgrade to 3D cadastre. Implementation of any technological option to establish a 3D cadastre is tightly related to legislation. Hence, legislation and technological options are considered to find solutions that will be possible to implement. One suggestion presented in this paper was to use other sources of 3D data such as topographic signs or symbols used to represent topographic objects on 2D maps. In combination with other geodetic and cartographic products, useful information can be obtained, often quite relevant to provide a reference context for a 3D cadastre. Topographic signs on topographic maps and on other geodetic products provide a representation of complex real-world situations (tunnels, bridges, overpasses etc.) that are not usually presented on cadastral maps. This paper presents the possibility of utilizing those topographic signs to achieve the first steps towards establishing a 3D cadastre. Furthermore, this study proposes the establishment of a 3D Multipurpose Land Administration System as the most efficient system of land administration in a time when spatial information is easier to obtain than ever before and traditional real estate registers are subject to frequent and demanding changes. Full article
(This article belongs to the Special Issue Research and Development Progress in 3D Cadastral Systems)
Show Figures

Figure 1

10069 KiB  
Article
Accuracy Improvement of DGPS for Low-Cost Single-Frequency Receiver Using Modified Flächen Korrektur Parameter Correction
by Jungbeom Kim, Junesol Song, Heekwon No, Deokhwa Han, Donguk Kim, Byungwoon Park and Changdon Kee
ISPRS Int. J. Geo-Inf. 2017, 6(7), 222; https://doi.org/10.3390/ijgi6070222 - 20 Jul 2017
Cited by 39 | Viewed by 8948
Abstract
A differential global positioning system (DGPS) is one of the most widely used augmentation systems for a low-cost L1 (1575.42 MHz) single-frequency GPS receiver. The positioning accuracy of a low-cost GPS receiver decreases because of the spatial decorrelation between the reference station (RS) [...] Read more.
A differential global positioning system (DGPS) is one of the most widely used augmentation systems for a low-cost L1 (1575.42 MHz) single-frequency GPS receiver. The positioning accuracy of a low-cost GPS receiver decreases because of the spatial decorrelation between the reference station (RS) of the DGPS and the users. Hence, a network real-time kinematic (RTK) solution is used to reduce the decorrelation error in the current DGPS system. Among the various network RTK methods, the Flächen Korrektur parameter (FKP) is used to complement the current DGPS, because its concept and system configuration are simple and the size of additional data required for the network RTK is small. The FKP was originally developed for the carrier-phase measurements of high-cost GPS receivers; thus, it should be modified to be used in the DGPS of low-cost GPS receivers. We propose an FKP-DGPS algorithm as a new augmentation method for the low-cost GPS receivers by integrating the conventional DGPS correction with the modified FKP correction to mitigate the positioning error due to the spatial decorrelation. A real-time FKP-DGPS software was developed and several real-time tests were conducted. The test results show that the positioning accuracy of the DGPS was improved by a maximum of 40%. Full article
(This article belongs to the Special Issue Mapping for Autonomous Vehicles)
Show Figures

Figure 1

3786 KiB  
Article
Robust Indoor Mobile Localization with a Semantic Augmented Route Network Graph
by Yan Zhou, Xianwei Zheng, Hanjiang Xiong and Ruizhi Chen
ISPRS Int. J. Geo-Inf. 2017, 6(7), 221; https://doi.org/10.3390/ijgi6070221 - 19 Jul 2017
Cited by 6 | Viewed by 4203
Abstract
In recent years, using smartphones to determine pedestrian locations in indoor environments is an extensively promising technique for improving context-aware applications. However, the applicability and accuracy of the conventional approaches are still limited due to infrastructure-dependence, and there is seldom consideration of the [...] Read more.
In recent years, using smartphones to determine pedestrian locations in indoor environments is an extensively promising technique for improving context-aware applications. However, the applicability and accuracy of the conventional approaches are still limited due to infrastructure-dependence, and there is seldom consideration of the semantic information inherently existing in maps. In this paper, a semantically-constrained low-complexity sensor fusion approach is proposed for the estimation of the user trajectory within the framework of the smartphone-based indoor pedestrian localization, which takes into account the semantic information of indoor space and its compatibility with user motions. The user trajectory is established by pedestrian dead reckoning (PDR) from the mobile inertial sensors, in which the proposed semantic augmented route network graph with adaptive edge length is utilized to provide semantic constraint for the trajectory calibration using a particle filter algorithm. The merit of the proposed method is that it not only exploits the knowledge of the indoor space topology, but also exhausts the rich semantic information and the user motion in a specific indoor space for PDR accumulation error elimination, and can extend the applicability for diverse pedestrian step length modes. Two experiments are conducted in the real indoor environment to verify of the proposed approach. The results confirmed that the proposed method can achieve highly acceptable pedestrian localization results using only the accelerometer and gyroscope embedded in the phones, while maintaining an enhanced accuracy of 1.23 m, with the indoor semantic information attached to each pedestrian’s motion. Full article
(This article belongs to the Special Issue 3D Indoor Modelling and Navigation)
Show Figures

Figure 1

1928 KiB  
Article
An Array Database Approach for Earth Observation Data Management and Processing
by Zhenyu Tan, Peng Yue and Jianya Gong
ISPRS Int. J. Geo-Inf. 2017, 6(7), 220; https://doi.org/10.3390/ijgi6070220 - 19 Jul 2017
Cited by 15 | Viewed by 6117
Abstract
Over the past few years, Earth Observation (EO) has been continuously generating much spatiotemporal data that serves for societies in resource surveillance, environment protection, and disaster prediction. The proliferation of EO data poses great challenges in current approaches for data management and processing. [...] Read more.
Over the past few years, Earth Observation (EO) has been continuously generating much spatiotemporal data that serves for societies in resource surveillance, environment protection, and disaster prediction. The proliferation of EO data poses great challenges in current approaches for data management and processing. Nowadays, the Array Database technologies show great promise in managing and processing EO Big Data. This paper suggests storing and processing EO data as multidimensional arrays based on state-of-the-art array database technologies. A multidimensional spatiotemporal array model is proposed for EO data with specific strategies for mapping spatial coordinates to dimensional coordinates in the model transformation. It allows consistent query semantics in databases and improves the in-database computing by adopting unified array models in databases for EO data. Our approach is implemented as an extension to SciDB, an open-source array database. The test shows that it gains much better performance in the computation compared with traditional databases. A forest fire simulation study case is presented to demonstrate how the approach facilitates the EO data management and in-database computation. Full article
Show Figures

Figure 1

4054 KiB  
Article
Robust and Parameter-Free Algorithm for Constructing Pit-Free Canopy Height Models
by Chuanfa Chen, Yifu Wang, Yanyan Li, Tianxiang Yue and Xin Wang
ISPRS Int. J. Geo-Inf. 2017, 6(7), 219; https://doi.org/10.3390/ijgi6070219 - 18 Jul 2017
Cited by 17 | Viewed by 3766
Abstract
Data pits commonly appear in lidar-derived canopy height models (CHMs) owing to the penetration ability of airborne light detection and ranging (lidar) into tree crowns. They have a seriously negative effect on the quality of tree detection and subsequent biophysical measurements. In this [...] Read more.
Data pits commonly appear in lidar-derived canopy height models (CHMs) owing to the penetration ability of airborne light detection and ranging (lidar) into tree crowns. They have a seriously negative effect on the quality of tree detection and subsequent biophysical measurements. In this study, we propose an algorithm based on robust locally weighted regression and robust z-scores for the construction of a pit-free CHM. A significant advantage of the new algorithm is that it is parameter free, which makes it efficient and robust for practical applications. Simulated and airborne lidar-derived data sets are employed to assess the performance of the new method for CHM construction, and its results are compared to those of three classical methods, namely the natural neighbor (NN) interpolation of the highest point method (HPM), mean filter, and median filter. The results from the simulated data set demonstrate that our algorithm is more accurate compared to the three classical methods for generating pit-free CHMs in the presence of data pits. CHM construction using the lidar-derived data set shows that, compared to the classical methods, the new method has a better ability to remove data pits as well as preserving the edges, shapes, and structures of canopy gaps and crowns. Moreover, the proposed method performs better compared to the classical methods in deriving plot-level maximum tree heights from CHMs. Thus, the new method shows high potential for pit-free CHM construction. Full article
Show Figures

Figure 1

3124 KiB  
Article
Semantic-Geographic Trajectory Pattern Mining Based on a New Similarity Measurement
by You Wan, Chenghu Zhou and Tao Pei
ISPRS Int. J. Geo-Inf. 2017, 6(7), 212; https://doi.org/10.3390/ijgi6070212 - 14 Jul 2017
Cited by 21 | Viewed by 6639
Abstract
Trajectory pattern mining is becoming increasingly popular because of the development of ubiquitous computing technology. Trajectory data contain abundant semantic and geographic information that reflects people’s movement patterns, i.e., who is performing a certain type of activity when and where. However, the variety [...] Read more.
Trajectory pattern mining is becoming increasingly popular because of the development of ubiquitous computing technology. Trajectory data contain abundant semantic and geographic information that reflects people’s movement patterns, i.e., who is performing a certain type of activity when and where. However, the variety and complexity of people’s movement activity and the large size of trajectory datasets make it difficult to mine valuable trajectory patterns. Moreover, most existing trajectory similarity measurements only consider a portion of the information contained in trajectory data. The patterns obtained cannot be interpreted well in terms of both semantic meaning and geographic distributions. As a result, these patterns cannot be used accurately for recommendation systems or other applications. This paper introduces a novel concept of the semantic-geographic pattern that considers both semantic and geographic meaning simultaneously. A flexible density-based clustering algorithm with a new trajectory similarity measurement called semantic intensity is used to mine these semantic-geographic patterns. Comparative experiments on check-in data from the Sina Weibo service demonstrate that semantic intensity can effectively measure both semantic and geographic similarities among trajectories. The resulting patterns are more accurate and easy to interpret. Full article
(This article belongs to the Special Issue Geospatial Big Data and Urban Studies)
Show Figures

Figure 1

9431 KiB  
Article
A Matrix-Based Structure for Vario-Scale Vector Representation over a Wide Range of Map Scales: The Case of River Network Data
by Lina Huang, Tinghua Ai, Peter Van Oosterom, Xiongfeng Yan and Min Yang
ISPRS Int. J. Geo-Inf. 2017, 6(7), 218; https://doi.org/10.3390/ijgi6070218 - 13 Jul 2017
Cited by 6 | Viewed by 5500
Abstract
The representation of vector data at variable scales has been widely applied in geographic information systems and map-based services. When the scale changes across a wide range, a complex generalization that involves multiple operations is required to transform the data. To present such [...] Read more.
The representation of vector data at variable scales has been widely applied in geographic information systems and map-based services. When the scale changes across a wide range, a complex generalization that involves multiple operations is required to transform the data. To present such complex generalization, we proposed a matrix model to combine different generalization operations into an integration. This study was carried on a set of river network data, where two operations, i.e., network pruning accompanied with river simplification, were hierarchically constructed as the rows and columns of a matrix. The correspondence between generalization operations and scale, and the scale linkage of multiple operations were also explicitly defined. In addition, we developed a vario-scale data structure to store the generalized river network data based on the proposed matrix. The matrix model was validated and assessed by a comparison with traditional methods that conduct generalization operations in sequence. It was shown that the matrix model enabled complex generalization with good generalization quality. Taking advantage of the corresponding vario-scale data structure, the river network data could be obtained at any arbitrary scale, and the vario-scale representation was achieved across a wide scale range. Full article
Show Figures

Figure 1

6258 KiB  
Article
SCMDOT: Spatial Clustering with Multiple Density-Ordered Trees
by Xiaozhu Wu, Hong Jiang and Chongcheng Chen
ISPRS Int. J. Geo-Inf. 2017, 6(7), 217; https://doi.org/10.3390/ijgi6070217 - 13 Jul 2017
Cited by 3 | Viewed by 6306
Abstract
With the rapid explosion of information based on location, spatial clustering plays an increasingly significant role in this day and age as an important technique in geographical data analysis. Most existing spatial clustering algorithms are limited by complicated spatial patterns, which have difficulty [...] Read more.
With the rapid explosion of information based on location, spatial clustering plays an increasingly significant role in this day and age as an important technique in geographical data analysis. Most existing spatial clustering algorithms are limited by complicated spatial patterns, which have difficulty in discovering clusters with arbitrary shapes and uneven density. In order to overcome such limitations, we propose a novel clustering method called Spatial Clustering with Multiple Density-Ordered Trees (SCMDOT). Motivated by the idea of the Density-Ordered Tree (DOT), we firstly represent the original dataset by the means of constructing Multiple Density-Ordered Trees (MDOT). In the constructing process, we impose additional constraints to control the growth of each Density-Ordered Tree, ensuring that they all have high spatial similarity. Furthermore, a series of MDOT can be successively generated from regions of sparse areas to the dense areas, where each Density-Ordered Tree, also treated as a sub-tree, represents a cluster. In the merging process, the final clusters are obtained by repeatedly merging a suitable pair of clusters until they satisfy the expected clustering result. In addition, a heuristic strategy is applied during the process of our algorithm for suitability for special applications. The experiments on synthetic and real-world spatial databases are utilised to demonstrate the performance of our proposed method. Full article
Show Figures

Figure 1

6631 KiB  
Article
A Novel Popular Tourist Attraction Discovering Approach Based on Geo-Tagged Social Media Big Data
by Xia Peng and Zhou Huang
ISPRS Int. J. Geo-Inf. 2017, 6(7), 216; https://doi.org/10.3390/ijgi6070216 - 13 Jul 2017
Cited by 55 | Viewed by 6602
Abstract
In the big data era, the social media data that contain users’ geographical locations are growing explosively. These kinds of spatiotemporal data provide a new perspective for us to observe the human movement behavior. By mining such spatiotemporal data, we can incorporate the [...] Read more.
In the big data era, the social media data that contain users’ geographical locations are growing explosively. These kinds of spatiotemporal data provide a new perspective for us to observe the human movement behavior. By mining such spatiotemporal data, we can incorporate the users’ collective wisdom, build novel services and bring convenience to people. Through spatial clustering of the original user locations, both the ‘natural’ boundaries and the human activity information of the tourist attractions are generated, which facilitate performing popularity analysis of tourist attractions and extracting the travelers’ spatio-temporal patterns or travel laws. On the one hand, the potential extracted knowledge could provide decision supports to the tourism management department in both tourism planning and resource development; on the other hand, the travel preferences are able to be extracted from the clustering-generated attractions, and thus, intelligent tourism recommendation services could be developed for the tourist to promote the realization of ‘smart tourism’. Hence, this paper proposes a new method for discovering popular tourist attractions, which extracts hotspots through integrating spatial clustering and text mining approaches. We carry out tourist attraction discovery experiments based on the Flickr geotagged images within the urban area of Beijing from 2005 to 2016. The results show that compared with the traditional DBSCAN method, this novel approach can distinguish adjacent high-density areas when discovering popular tourist attractions and has better adaptability in the case of an uneven density distribution. In addition, based on the finding results of scenic hotspots, this paper analyzes the popularity distribution laws of Beijing’s tourist attractions under different temporal and weather contexts. Full article
Show Figures

Figure 1

17257 KiB  
Article
Analysis of the Patrimonial Conservation of a Quito Suburb without Altering Its Commercial Structure by Means of a Centrality Measure for Urban Networks
by Taras Agryzkov, José L. Oliver, Leandro Tortosa and José F. Vicent
ISPRS Int. J. Geo-Inf. 2017, 6(7), 215; https://doi.org/10.3390/ijgi6070215 - 13 Jul 2017
Cited by 3 | Viewed by 3902
Abstract
In about 1940, Quito’s urban planning department contemplated the creation of a new suburb called Villaflora following the garden city model: homes in connection with nature but also near services. In Villaflora we do not find monumental elements that characterize patrimonial architecture; the [...] Read more.
In about 1940, Quito’s urban planning department contemplated the creation of a new suburb called Villaflora following the garden city model: homes in connection with nature but also near services. In Villaflora we do not find monumental elements that characterize patrimonial architecture; the value of Villaflora’s patrimony is in its urban model characterized by some architectonic elements. However, Villaflora is valuable because it is the result of a unique urban model. Over the years, the suburb has suffered profound degradation from the point of view of its patrimonial conservation. Hence, we propose an urban intervention in the suburb that contemplates the restoration of some important elements in the urban layout, without altering the commercial structure of the same. To accomplish this task we perform a study of the heritage conservation of each of the buildings of the suburb, as well as a study of the commercial activity that is developed in the suburb in order to determine those areas with the highest commercial activity and as a consequence, a greater presence of people in the streets and public spaces. Full article
Show Figures

Figure 1

1412 KiB  
Case Report
Three-Dimensional Modeling and Indoor Positioning for Urban Emergency Response
by Xin Zhang, Yongxin Chen, Linjun Yu, Weisheng Wang and Qianyu Wu
ISPRS Int. J. Geo-Inf. 2017, 6(7), 214; https://doi.org/10.3390/ijgi6070214 - 12 Jul 2017
Cited by 8 | Viewed by 5218
Abstract
Three-dimensional modeling of building environments and indoor positioning is essential for emergency response in cities. Traditional ground-based measurement methods, such as geodetic astronomy, total stations, and global positioning system (GPS) receivers, cannot meet the demand for high precision positioning and it is therefore [...] Read more.
Three-dimensional modeling of building environments and indoor positioning is essential for emergency response in cities. Traditional ground-based measurement methods, such as geodetic astronomy, total stations, and global positioning system (GPS) receivers, cannot meet the demand for high precision positioning and it is therefore essential to conduct multiple-angle data-acquisition and establish three-dimensional spatial models. In this paper, a rapid modeling technology is introduced, which includes multiple-angle remote sensing image acquisition based on unmanned aerial vehicles (UAVs), an algorithm to remove linear and planar foregrounds before reconstructing the backgrounds, and a three-dimensional modeling (3DM) framework. Additionally, an indoor 3DM technology is introduced based on building design drawings, and an indoor positioning technology is developed using iBeacon technology. Finally, a prototype system of the indoor and outdoor positioning-service system in an urban firefighting rescue scenario is introduced to demonstrate the value of the method proposed in this paper. Full article
Show Figures

Figure 1

2008 KiB  
Article
Integrating Decentralized Indoor Evacuation with Information Depositories in the Field
by Haifeng Zhao, Stephan Winter and Martin Tomko
ISPRS Int. J. Geo-Inf. 2017, 6(7), 213; https://doi.org/10.3390/ijgi6070213 - 11 Jul 2017
Cited by 12 | Viewed by 4710
Abstract
The lonelier evacuees find themselves, the riskier become their wayfinding decisions. This research supports single evacuees in a dynamically changing environment with risk-aware guidance. It deploys the concept of decentralized evacuation, where evacuees are guided by smartphones acquiring environmental knowledge and risk information [...] Read more.
The lonelier evacuees find themselves, the riskier become their wayfinding decisions. This research supports single evacuees in a dynamically changing environment with risk-aware guidance. It deploys the concept of decentralized evacuation, where evacuees are guided by smartphones acquiring environmental knowledge and risk information via exploration and knowledge sharing by peer-to-peer communication. Peer-to-peer communication, however, relies on the chance that people come into communication range with each other. This chance can be low. To bridge between people being not at the same time at the same places, this paper suggests information depositories at strategic locations to improve information sharing. Information depositories collect the knowledge acquired by the smartphones of evacuees passing by, maintain this information, and convey it to other passing-by evacuees. Multi-agent simulation implementing these depositories in an indoor environment shows that integrating depositories improves evacuation performance: It enhances the risk awareness and consequently increases the chance that people survive and reduces their evacuation time. For evacuating dynamic events, deploying depositories at staircases has been shown more effective than deploying them in corridors. Full article
(This article belongs to the Special Issue 3D Indoor Modelling and Navigation)
Show Figures

Figure 1

6463 KiB  
Article
A Method for Estimating Surveillance Video Georeferences
by Aleksandar Milosavljević, Dejan Rančić, Aleksandar Dimitrijević, Bratislav Predić and Vladan Mihajlović
ISPRS Int. J. Geo-Inf. 2017, 6(7), 211; https://doi.org/10.3390/ijgi6070211 - 09 Jul 2017
Cited by 18 | Viewed by 6649
Abstract
The integration of a surveillance camera video with a three-dimensional (3D) geographic information system (GIS) requires the georeferencing of that video. Since a video consists of separate frames, each frame must be georeferenced. To georeference a video frame, we rely on the information [...] Read more.
The integration of a surveillance camera video with a three-dimensional (3D) geographic information system (GIS) requires the georeferencing of that video. Since a video consists of separate frames, each frame must be georeferenced. To georeference a video frame, we rely on the information about the camera view at the moment that the frame was captured. A camera view in 3D space is completely determined by the camera position, orientation, and field-of-view. Since the accurate measuring of these parameters can be extremely difficult, in this paper we propose a method for their estimation based on matching video frame coordinates of certain point features with their 3D geographic locations. To obtain these coordinates, we rely on high-resolution orthophotos and digital elevation models (DEM) of the area of interest. Once an adequate number of points are matched, Levenberg–Marquardt iterative optimization is applied to find the most suitable video frame georeference, i.e., position and orientation of the camera. Full article
Show Figures

Figure 1

6171 KiB  
Article
Trajectory Data Mining via Cluster Analyses for Tropical Cyclones That Affect the South China Sea
by Feng Yang, Guofeng Wu, Yunyan Du and Xiangwei Zhao
ISPRS Int. J. Geo-Inf. 2017, 6(7), 210; https://doi.org/10.3390/ijgi6070210 - 08 Jul 2017
Cited by 6 | Viewed by 6164
Abstract
The equal division of tropical cyclone (TC) trajectory method, the mass moment of the TC trajectory method, and the mixed regression model method are clustering algorithms that use space and shape information from complete TC trajectories. In this article, these three clustering algorithms [...] Read more.
The equal division of tropical cyclone (TC) trajectory method, the mass moment of the TC trajectory method, and the mixed regression model method are clustering algorithms that use space and shape information from complete TC trajectories. In this article, these three clustering algorithms were applied in a TC trajectory clustering analysis to identify the TCs that affected the South China Sea (SCS) from 1949 to 2014. According to their spatial position and shape similarity, these TC trajectories were classified into five trajectory classes, including three westward straight-line movement trajectory clusters and two northward re-curving trajectory clusters. These clusters show different characteristics in their genesis position, heading, landfall location, TC intensity, lifetime and seasonality distribution. The clustering results indicate that these algorithms have different characteristics. The equal division of the trajectory method provides better clustering result generally. The approach is simple and direct, and trajectories in the same class were consistent in shape and heading. The regression mixture model algorithm has a solid theoretical mathematical foundation, and it can maintain good spatial consistency among trajectories in the class. The mass moment of the trajectory method shows overall consistency with the equal division of the trajectory method. Full article
Show Figures

Figure 1

4109 KiB  
Article
Applications of Location-Based Services and Mobile Technologies in K-12 Classrooms
by Robert Kolvoord, Kathryn Keranen and Paul Rittenhouse
ISPRS Int. J. Geo-Inf. 2017, 6(7), 209; https://doi.org/10.3390/ijgi6070209 - 08 Jul 2017
Cited by 11 | Viewed by 5938
Abstract
The use of location-based services and mobile technologies is increasing in K-12 classrooms. In this article, we describe the history and the current use of these tools in the innovative Geospatial Semester project in Virginia. We share a number of examples where students [...] Read more.
The use of location-based services and mobile technologies is increasing in K-12 classrooms. In this article, we describe the history and the current use of these tools in the innovative Geospatial Semester project in Virginia. We share a number of examples where students are creating projects of their own interest that use editable feature services, mobile data collection and other cutting-edge technologies. These projects help students build their spatial thinking and problem-solving skills, and help teachers build conceptual understanding in a variety of domains. Full article
Show Figures

Figure 1

3991 KiB  
Article
A Spatial Analysis Approach for Evaluating the Service Capability of Urban Greenways—A Case Study in Wuhan
by Junwen Bai, Penglin Zhang, Juan Du and Zheng Li
ISPRS Int. J. Geo-Inf. 2017, 6(7), 208; https://doi.org/10.3390/ijgi6070208 - 08 Jul 2017
Cited by 3 | Viewed by 4342
Abstract
A greenway is a low-speed road system built on high-level afforestation, and this system serves as a venue for sightseeing, relaxation, and exercise. In China, greenway planning and construction have been actively and successfully implemented to strengthen the construction of urban human settlements. [...] Read more.
A greenway is a low-speed road system built on high-level afforestation, and this system serves as a venue for sightseeing, relaxation, and exercise. In China, greenway planning and construction have been actively and successfully implemented to strengthen the construction of urban human settlements. However, a specific method has yet to be used to assess the service capability of urban greenways. On the basis of geographic information systems and geographical spatial data, we propose an approach to evaluate the overall service capability of urban greenways based on three different aspects. In the first aspect, a buffer-based service-level analysis method is applied to statistically analyze population and residential quarter areas within a greenway service coverage area. This aspect can also indicate the service level and scope of urban greenways. In the second aspect, minimum distance-based accessibility analysis method is utilized for the graduation statistics of residential quarter areas in different ranges of reach distance. This aspect can further reveal the service convenience of urban greenways. In the third aspect, a calculation model is built on the basis of regular grids, to analyze the value of comprehensive service capability in each grid, and to produce a spatial distribution map of the comprehensive service capability of urban greenways. This aspect can describe the service quality of urban greenways. The analysis results of these aspects can be integrated to identify service conditions in which an urban greenway is available to urban populations and residential zones, and to obtain the comprehensive service capability value of greenways. This approach can also emphasize the limitations of greenway construction, and thus help urban planners and decision-makers create optimized urban greenway designs. Full article
Show Figures

Figure 1

160 KiB  
Erratum
Erratum: Zhai, J., et al. Quality Assessment Method for Linear Feature Simplification Based on Multi-Scale Spatial Uncertainty. ISPRS International Journal of Geo-Information 2017, 6, 184
by IJGI Editorial Office
ISPRS Int. J. Geo-Inf. 2017, 6(7), 207; https://doi.org/10.3390/ijgi6070207 - 07 Jul 2017
Viewed by 2326
Abstract
The editorial team of the journal International Journal of Geo-Information (IJGI) would like to make the following corrections to the published paper [1]: [...]
Full article
6655 KiB  
Article
Automatic Room Segmentation of 3D Laser Data Using Morphological Processing
by Jaehoon Jung, Cyrill Stachniss and Changjae Kim
ISPRS Int. J. Geo-Inf. 2017, 6(7), 206; https://doi.org/10.3390/ijgi6070206 - 07 Jul 2017
Cited by 42 | Viewed by 7863
Abstract
In this paper, we introduce an automatic room segmentation approach based on morphological processing. The inputs are registered point-clouds obtained from either a static laser scanner or a mobile scanning system, without any required prior information or initial labeling satisfying specific conditions. The [...] Read more.
In this paper, we introduce an automatic room segmentation approach based on morphological processing. The inputs are registered point-clouds obtained from either a static laser scanner or a mobile scanning system, without any required prior information or initial labeling satisfying specific conditions. The proposed segmentation method’s main concept, based on the assumption that each room is bound by vertical walls, is to project the 3D point cloud onto a 2D binary map and to close all openings (e.g., doorways) to other rooms. This is achieved by creating an initial segment map, skeletonizing the surrounding walls of each segment, and iteratively connecting the closest pixels between the skeletonized walls. By iterating this procedure for all initial segments, the algorithm produces a “watertight” floor map, on which each room can be segmented by a labeling process. Finally, the original 3D points are segmented according to their 2D locations as projected on the segment map. The novel features of our approach are: (1) its robustness against occlusions and clutter in point-cloud input; (2) high segmentation performance regardless of the number of rooms or architectural complexity; and (3) straight segmentation boundary generation, all of which were proved in experiments with various sets of real-world, synthetic, and publicly available data. Additionally, comparisons with the five popular existing methods through both qualitative and quantitative evaluations demonstrated the feasibility of the proposed approach. Full article
Show Figures

Figure 1

2681 KiB  
Article
A Visual Analysis Approach for Inferring Personal Job and Housing Locations Based on Public Bicycle Data
by Xiaoying Shi, Zhenhai Yu, Qiming Fang and Quan Zhou
ISPRS Int. J. Geo-Inf. 2017, 6(7), 205; https://doi.org/10.3390/ijgi6070205 - 07 Jul 2017
Cited by 9 | Viewed by 4651
Abstract
Information concerning the home and workplace of residents is the basis of analyzing the urban job-housing spatial relationship. Traditional methods conduct time-consuming user surveys to obtain personal job and housing location information. Some new methods define rules to detect personal places based on [...] Read more.
Information concerning the home and workplace of residents is the basis of analyzing the urban job-housing spatial relationship. Traditional methods conduct time-consuming user surveys to obtain personal job and housing location information. Some new methods define rules to detect personal places based on human mobility data. However, because the travel patterns of residents are variable, simple rule-based methods are unable to generalize highly changing and complex travel modes. In this paper, we propose a visual analysis approach to assist the analyzer in inferring personal job and housing locations interactively based on public bicycle data. All users are first clustered to find potential commuting users. Then, several visual views are designed to find the key candidate stations for a specific user, and the visited temporal pattern of stations and the user’s hire behavior are analyzed, which helps with the inference of station semantic meanings. Finally, a number of users’ job and housing locations are detected by the analyzer and visualized. Our approach can manage the complex and diverse cycling habits of users. The effectiveness of the approach is shown through case studies based on a real-world public bicycle dataset. Full article
(This article belongs to the Special Issue Geospatial Big Data and Urban Studies)
Show Figures

Figure 1

21233 KiB  
Article
Integrating Global Open Geo-Information for Major Disaster Assessment: A Case Study of the Myanmar Flood
by Suju Li, Yan Cui, Ming Liu, Haixia He and Shirish Ravan
ISPRS Int. J. Geo-Inf. 2017, 6(7), 201; https://doi.org/10.3390/ijgi6070201 - 06 Jul 2017
Cited by 12 | Viewed by 5929
Abstract
Major disasters typically impact large areas, cause considerable damages, and result in significant human and economic losses. The timely and accurate estimation of impacts and damages is essential to better understand disaster conditions and to support emergency response operations. Geo-information drawn from various [...] Read more.
Major disasters typically impact large areas, cause considerable damages, and result in significant human and economic losses. The timely and accurate estimation of impacts and damages is essential to better understand disaster conditions and to support emergency response operations. Geo-information drawn from various sources at multi spatial-temporal scales can be used for disaster assessments through a synthesis of hazard, exposure, and post disaster information based on pertinent approaches. Along with the increased availability of open sourced data and cooperation initiatives, more global scale geo-information, including global land cover datasets, has been produced and can be integrated with other information for disaster dynamic damage assessment (e.g., impact estimation immediately after a disaster occurs, physical damage assessment during the emergency response stage, and comprehensive assessment following an emergency response). Residential areas and arable lands affected by the flood disaster occurring from July to August 2015 in Myanmar were assessed based on satellite images, GlobeLand30 data, and other global open sourced information as a study case. The results show that integrating global open geo-information could serve as a practical and efficient means of assessing damage resulting from major disasters worldwide, especially at the early emergency response stage. Full article
(This article belongs to the Special Issue Analysis and Applications of Global Land Cover Data)
Show Figures

Figure 1

3157 KiB  
Article
Disaster Hashtags in Social Media
by Nikita Murzintcev and Changxiu Cheng
ISPRS Int. J. Geo-Inf. 2017, 6(7), 204; https://doi.org/10.3390/ijgi6070204 - 05 Jul 2017
Cited by 33 | Viewed by 8032
Abstract
Social media is a rich data source for analyzing the social impact of hazard processes and human behavior in disaster situations; it is used by rescue agencies for coordination and by local governments for the distribution of official information. In this paper, we [...] Read more.
Social media is a rich data source for analyzing the social impact of hazard processes and human behavior in disaster situations; it is used by rescue agencies for coordination and by local governments for the distribution of official information. In this paper, we propose a method for data mining in Twitter to retrieve messages related to an event. We describe an automated process for the collection of hashtags highly related to the event and specific only to it. We compare our method with existing keyword-based methods and prove that hashtags are good markers for the separation of similar, simultaneous incidents; therefore, the retrieved messages have higher relevancy. The method uses disaster databases to find the location of an event and to estimate the impact area. The proposed method can also be adapted to retrieve messages about other types of events with a known location, such as riots, festivals and exhibitions. Full article
Show Figures

Figure 1

3071 KiB  
Article
Nationwide Flood Monitoring for Disaster Risk Reduction Using Multiple Satellite Data
by Young-joo Kwak
ISPRS Int. J. Geo-Inf. 2017, 6(7), 203; https://doi.org/10.3390/ijgi6070203 - 05 Jul 2017
Cited by 37 | Viewed by 6361
Abstract
As part of the contribution to flood disaster risk reduction, it is important to identify and characterize flood areas, locations, and durations. Multiple satellite-based flood mapping and monitoring are an imperative process and the fundamental part of risk assessment in disaster risk management. [...] Read more.
As part of the contribution to flood disaster risk reduction, it is important to identify and characterize flood areas, locations, and durations. Multiple satellite-based flood mapping and monitoring are an imperative process and the fundamental part of risk assessment in disaster risk management. In this paper, the MODIS-derived synchronized floodwater index (SfWi) was used to detect the maximum extent of a nationwide flood based on annual time-series data of 2015 in order to maximize the application of optical satellite data. The selected three major rivers—i.e., Ganges, Brahmaputra, and Meghna (GBM), transboundary rivers running through the great floodplain delta lying between Bangladesh and eastern India—show that a propensity of flood risk was revealed by the temporal and spatial dynamics of the maximum flood extent during the 2015 monsoon season. Resultant flood maps showed that SfWi-indicated flood areas were small but more accurate than those derived from the single use of the MODIS-derived water index. The return period of SfWi-indicated maximum flood extent was confirmed to be about 20 years based on historical flood records. Full article
Show Figures

Figure 1

208 KiB  
Editorial
Highlighting Current Trends in Volunteered Geographic Information
by David Jonietz, Vyron Antonio, Linda See and Alexander Zipf
ISPRS Int. J. Geo-Inf. 2017, 6(7), 202; https://doi.org/10.3390/ijgi6070202 - 04 Jul 2017
Cited by 15 | Viewed by 6562
Abstract
Volunteered Geographic Information (VGI) is a growing area of research. This Special Issue aims to capture the main trends in VGI research based on 16 original papers, and distinguishes between two main areas, i.e., those that deal with the characteristics of VGI and [...] Read more.
Volunteered Geographic Information (VGI) is a growing area of research. This Special Issue aims to capture the main trends in VGI research based on 16 original papers, and distinguishes between two main areas, i.e., those that deal with the characteristics of VGI and those focused on applications of VGI. The topic of quality assessment and assurance dominates the papers on VGI characteristics, whereas application-oriented work covers three main domains: human behavioral analysis, natural disasters, and land cover/land use mapping. In this Special Issue, therefore, both the challenges and the potentials of VGI are addressed. Full article
(This article belongs to the Special Issue Volunteered Geographic Information)
1544 KiB  
Article
A New Look at Public Services Inequality: The Consistency of Neighborhood Context and Citizens’ Perception across Multiple Scales
by Chunzhu Wei, Pablo Cabrera Barona and Thomas Blaschke
ISPRS Int. J. Geo-Inf. 2017, 6(7), 200; https://doi.org/10.3390/ijgi6070200 - 04 Jul 2017
Cited by 4 | Viewed by 4842
Abstract
A challenge in regional inequality is to identify the relative influence of objective neighborhood context on subjective citizens’ attitudes and experiences of place. This paper first presents six groups of hierarchal neighborhoods in optimizing public service inequality (PSI) indicators based on census blocks [...] Read more.
A challenge in regional inequality is to identify the relative influence of objective neighborhood context on subjective citizens’ attitudes and experiences of place. This paper first presents six groups of hierarchal neighborhoods in optimizing public service inequality (PSI) indicators based on census blocks collected in Quito, Ecuador. Multilevel models were then applied to understand the relative influence of neighborhood-level PSI on citizens’ perceptions of place, including individual-level perceptions of neighborhood social cohesion and neighborhood safety, and self-perceived health status. Our results show that the internal variability of the individual perceptions that is explained by neighborhood context is strongly influenced by the scale of neighborhood units. A spatial consistency between objective neighborhood context and subjective individual perception of place plays a crucial role in propagating mixed-methods approaches (qualitative-quantitative) and improves the spatial interpretation of public services inequality. Neighborhood context and citizens’ perception of place should be integrated to investigate urban segregation, thereby providing insights into the underlying societal inequality phenomenon and quality of life. Full article
(This article belongs to the Special Issue Geospatial Big Data and Urban Studies)
Show Figures

Figure 1

3410 KiB  
Article
Modified Neutral Models as Benchmarks to Evaluate the Dynamics of Land System (DLS) Model Performance
by Yingchang Xiu, Wenbao Liu and Wenjing Yang
ISPRS Int. J. Geo-Inf. 2017, 6(7), 199; https://doi.org/10.3390/ijgi6070199 - 03 Jul 2017
Cited by 1 | Viewed by 3725
Abstract
Assessing model performance is a continuous challenge for modelers of land use change. Comparing land use models with two neutral models, including the random constraint match model (RCM) and growing cluster model (GrC) that consider the initial land use patterns using a variety [...] Read more.
Assessing model performance is a continuous challenge for modelers of land use change. Comparing land use models with two neutral models, including the random constraint match model (RCM) and growing cluster model (GrC) that consider the initial land use patterns using a variety of evaluation metrics, provides a new way to evaluate the accuracy of land use models. However, using only two neutral models is not robust enough for reference maps. A modified neutral model that combines a density-based point pattern analysis and a null neutral model algorithm is introduced. In this case, the modified neutral model generates twenty different spatial pattern results using a random algorithm and mid-point displacement algorithm, respectively. The random algorithm-based modified neutral model (Random_MNM) results decrease regularly with the fragmentation degree from 0 to 1, while the mid-point displacement algorithm-based modified neutral model (MPD_MNM) results decrease in a fluctuating manner with the fragmentation degree. Using the modified neutral model results as benchmarks, a new proposed land use model, the Dynamics of Land System (DLS) model, for Jilin Province of China from 2003 to 2013 is assessed using the Kappa statistic and Kappain-out statistic for simulation accuracy. The results show that the DLS model output presents higher Kappa and Kappain-out values than all the twenty neutral model results. The map comparison results indicate that the DLS model could simulate land use change more accurately compared to the Random_MNM and MPD_MNM. However, the amount and spatial allocation of land transitions for the DLS model are lower than the actual land use change. Improving the accuracy of the land use transition allocations in the DLS model requires further investigation. Full article
Show Figures

Figure 1

Previous Issue
Next Issue
Back to TopTop