
Fusion of Multi-Temporal Interferometric Coherence and Optical Image Data for the 2016 Kumamoto Earthquake Damage Assessment


1
Remote Sensing and GIS FoS, School of Engineering and Technology, Asian Institute of Technology, P.O. Box 4, Klong Luang, Pathumthani 12120, Thailand
2
Graduate School of Sciences and Technology for Innovation, Yamaguchi University, 2-16-1, Tokiwadai, Ube, Yamaguchi 755-8611, Japan
*
Author to whom correspondence should be addressed.
ISPRS Int. J. Geo-Inf. 2017, 6(7), 188; https://doi.org/10.3390/ijgi6070188
Submission received: 10 April 2017
/
Revised: 25 May 2017
/
Accepted: 18 June 2017
/
Published: 22 June 2017
Abstract
:Earthquakes are one of the most devastating types of natural disasters, and happen with little to no warning. This study combined Landsat-8 and interferometric ALOS-2 coherence data without training area techniques by classifying the remote sensing ratios of specific features for damage assessment. Waterbodies and highly vegetated areas were extracted by the modified normalized difference water index (MNDWI) and normalized difference vegetation index (NDVI), respectively, from after-earthquake images in order to improve the accuracy of damage maps. Urban areas were classified from pre-event interferometric coherence data. The affected areas from the earthquake were detected with the normalized difference (ND) between the pre- and co-event interferometric coherence. The results presented three damage types; namely, damage to buildings caused by ground motion, liquefaction, and landslides. The overall accuracy (94%) of the confusion matrix was excellent. Results for urban areas were divided into three damage levels (e.g., none–slight, slight–heavy, heavy–destructive) at a high (90%) overall accuracy level. Moreover, data on buildings damaged by liquefaction and landslides were in good agreement with field survey information. Overall, this study illustrates an effective damage assessment mapping approach that can support post-earthquake management activities for future events, especially in areas where geographical data are sparse.

1. Introduction
Earthquakes are one of the most destructive types of natural hazards, and they often occur with little to no warning. Earthquakes generally affect large areas and cause major damage to buildings and other infrastructure. Fatalities are common during powerful earthquakes in populated areas. In addition to the primary damage caused by earthquakes, secondary damage can occur as a result of earthquake-induced natural disasters such as landslides, land subsidence, and soil liquefaction. These secondary events can also be very destructive to communities. Timely and accurate damage assessments can help to reduce adverse impacts on communities after earthquakes [1], and remote sensing technologies have been shown to be useful damage evaluation tools for post-earthquake emergency responses [2]. Measurements of the spatial and temporal scales of damage represent information that is critical to provide to international aid agencies for disaster management [3,4].
Satellite remote sensing is an effective technique for detecting changes that occur on Earth’s surface in inaccessible areas after dangerous earthquakes. The data types widely used for earthquake damage assessments include optical and synthetic aperture radar (SAR) images. Optical imagery for direct detection of building damage should be of a resolution higher than 1 m [5]. Building damage assessments have been conducted by both automated methods [6,7] and visualized interpretations with optical imagery [8]. However, such high resolution assessments can be expensive and typically only cover small scenes; furthermore, the viewing capacity may be limited by atmospheric conditions such as cloud coverage, especially during the rainy season.
Synthetic aperture radar technology is very useful for rapid disaster detection and monitoring, and it has the capacity to penetrate clouds and image the ground during both daytime and nighttime. Methods for intensity correlation and interferometric coherence analysis of multi-temporal SAR images have been developed for rapid damage assessments [9]. Interferometric coherence data from pre- and co-event times have been shown to be useful for earthquake damage assessments by many studies [10,11]. Hoffmann [12] mapped earthquake damage by interferometric coherence change during the Bam (Iran) earthquake in 2003 and achieved reliable results. Interferometric coherence by ALOS-2 (Advanced Land Observing Satellite-2)/PALSAR-2 (Phased Array Type L-Band Synthetic Aperture Radar) has been used successfully to detect Nepal earthquake damage in 2015 [13,14,15]. Furthermore, combinations of SAR data and optical images increased the accuracy of the earthquake damage assessments that were conducted after the Izmit and Bam earthquakes [16]. Based on a comprehensive review by Plank [9], damage assessment procedures should show worldwide applicability, be easy-to-use during the operational phase, and provide data suitable for end users.
The purpose of this study was to demonstrate a damage assessment mapping approach based on a combination of multi-interferometric SAR coherence and Landsat-8 data. Interferometric coherence analysis was conducted on multiple time point ALOS-2 imageries. Two images taken before an earthquake were used to compute the interferometric coherence during normal conditions, and two images taken around the time of the earthquake were used to determine the decorrelation induced by the earthquake. Landsat-8 data obtained after the earthquake were employed in this study because this remote sensing system can provide moderate-resolution data of very large areas at higher frequencies and lower costs than high resolution systems. Such data provide general surface information such as on waterbodies, forests, and urban areas and can reveal areas most affected by an earthquake. Data from the two sensors (e.g., ALOS-2 and Landsat-8) were integrated for damage assessment mapping during the 2016 Kumamoto earthquake. Through the combination, visualization of the damage assessment map could be improved. Furthermore, it will be helpful to users focusing on the adverse impacts of disasters in urban areas and in extracting more precise landslide areas.
This proposed method is fixable with an adaptive threshold for each satellite image that depends on data quality and time of acquisition. In this study, the method was used to extract information on three major damage types including damage to buildings caused by ground motion (Section 3.1), liquefaction (Section 3.2), and landslides (Section 3.3). The results presented high accuracies compared to ground truth data. Such an approach should be very useful for supporting disaster management activities during future earthquakes, especially in regions where geographic data are sparse.
2. Materials and Methods
2.1. Study Area and Data Collection
The Kumamoto earthquake series struck the west central Kyushu region, and it started with a 6.2 moment magnitude (Mw) foreshock on 14 April 2016 at 12:26 Coordinated Universal Time (UTC) or 21:26 Japan Standard Time (JST). After one day of foreshocks, the strong 7.0 Mw main shock occurred at 16:25 UTC (01:25 JST) beneath Kumamoto city of Kumamoto Prefecture at a shallow depth of approximately 10 km, as reported by the United States Geological Survey (USGS) [17]. These series of earthquakes were located on active faults, namely, the Futagawa and Hinagu faults [18]. According to the Japanese Red Cross report issued on 17 May 2016 [19], these earthquakes resulted in 67 casualties and more than 1600 injured. Additionally, more than 180,000 people had to be evacuated at the peak time of the crisis and an estimated 85,000 buildings, roads, and infrastructure facilities were damaged over an extensive area of land.
This study used several imagery scenes for the analysis, as shown in Table 1 and Figure 1. The main sensor for detecting earthquake damage is ALOS-2 PALSAR-2, which is operated by the Japan Aerospace Exploration Agency (JAXA). It operates in L-band, which enables a higher coherence over a longer time compared to SAR sensors using X- or C-band. This sensor provides high resolution data, owing to very accurate orbit control and an adequate revisit frequency (14 days) to meet the requirements for land and disaster monitoring. For the 2016 Kumamoto earthquake, ALOS-2 collected many images with PALSAR-2 in stripmap mode (SM1), and these data had a spatial resolution of 3 m over a swath width of 50 km. From the ALOS-2 images, path 23, scenes 2950 and 2560, were acquired for this damage assessment. They were in the format of single look complex (SLC) data. Moreover, the DInSAR analysis used ASTER (Advanced Spaceborne Thermal Emission and Reflection Radiometer) GDEM (Global Digital Elevation Model) data with a resolution of 30 m to remove the phase due to Earth’s curvature and topography for earthquake displacement and geocode interferogram products. Combinations of data with Landsat-8 were used to improve the general surface information on the extent of damage, which was assessed by using both the before and after images. These data had a spatial resolution of 30 m with 16 revisit days. This study selected optical imagery after the earthquake for the damage assessment, as these data were useful for not only excluding vegetation and water areas from the urban area, but also for accessing large landslide sites.
2.2. Interferometric SAR Coherence
DInSAR is a geodetic technique that identifies ground movement and deformation of the Earth by repeat-pass interferometry [20]. This technique is very useful for disasters related to ground deformation. It can provide rapid observations on earthquake deformation in all kinds of weather and over large coverage areas at a centimeter-level accuracy, which is useful for measuring surface displacement following crustal movement induced by earthquakes [21,22]. Interferometric coherence products can assist in providing further details about observed damaged areas through analyses of the coherence change. In this study, after data transfer, SAR images were analyzed for interferometric coherence during two key periods related to the Kumamoto earthquake, namely, the pre-earthquake period (30 November 2015–7 March 2016) and during-earthquake period (7 March 2016–18 April 2016); these data had a spatial resolution of 10 m.
In this study, interferometric coherence was assessed with the GMTSAR open source processing system [23]. This system is advantageous in that it not only determines the quality of the interferometric measurements, but also extracts thematic information about objects on the ground. It describes SAR backscattering characteristics altered by the ground surface changes and collapses or damages to buildings [24]. The coherence is defined as the magnitude of the cross-correlation coefficient between two co-registered complex images as shown in Equation (1):
where and are the corresponding complexes of two single look complex images. S* is the complex conjugate of S. It ranges from 0 (no correlation) to 1 (perfect correlation).
The coherence coefficient is a quantitative measure that is directly related to the amount of noise present in the interferogram between the two acquisitions. The main components of surface change consist of temporal surface correlations, geometric coherence proportional to the perpendicular baseline, and other noises including those inherent in the radar system and those due to data processing techniques and atmosphere conditions. For ALOS and ALOS-2, the perpendicular baselines are less than 200 m and have been demonstrated to produce high quality interferograms [25,26]. As shown by the data in Table 2, the perpendicular and temporal baselines of the pre-earthquake (30 November 2015–7 March 2016) and co-seismic interferograms at the same scene (7 March 2016–18 April 2016) during the Kumamoto earthquake had short and accurate values that were acceptable for the displacement detection and damage assessment.
2.3. Interferometric SAR Coherence Change for the Earthquake Damage Assessment
Temporal surface correlation contributes to the total interferometric coherence. An interferometric coherent image of the pre-event can show the degree of correlation between two SAR image acquisitions, and high coherence can be distinguished between urban and non-urban areas. During an earthquake, the decorrelation of coherence represents surface change such as that due to the earthquake itself, vegetation change, etc. To clarify the change of correlation between damaged areas and low coherence areas such as forests, plantations, and reservoirs, comparisons of pre-disaster and co-disaster interferogram correlations were used to evaluate the change caused by the Kumamoto earthquake. We evaluated buildings damaged by the earthquake [10,11,12] and detected areas of soil liquefaction [27]. The normalized difference (ND) of the coherence change (Equation (2)) was also used to detect damaged areas [9,13]:
where represents the pre-earthquake SAR image pair and represents the pre- and co-earthquake image pair.
This high-level index can present a high level of detail regarding surface physical changes that are properly associated with surface movement and damage. Changes of interferometric coherence are thus a timely analysis approach to use over wide areas during rapid damage assessments, as demonstrated in Figure 2.
2.4. Landsat-8 InformatioN: NDVI and NDWI
The Landsat-8 image contains data for nine spectral bands at different wavelengths such as visible, near-infrared, and shortwave light, which are collected at a spatial resolution of 30 m with the Operational Land Imager (OLI). Landsat data have been widely used to distinguish features like urban centers, water, forests, and other land uses. Some spectral bands of Landsat-8 were selected as supporting information for the damage assessment map produced from SAR coherence change. The necessary features extracted from Landsat-8 were waterbodies and highly vegetated areas. The locations of waterbodies can help one to understand the geology and damage due to liquefaction around deltas, lakes, and rivers. This study applied the modified normalized difference water index (MNDWI) for extracting waterbody data, because it generates less mixing between water and urban areas than the NDWI [28]. The MNDWI was calculated by using Equation (3):
where the green reflectance was derived from band 3 and the shortwave infrared 1 (SWIR_1) was derived from band 6 of Landsat-8.
The normalized difference vegetation index (NDVI) was used to classify the land into vegetation and non-vegetation classes. Specifically, it was used to reduce the confusion between low and high impact areas, for which manmade structures and urban areas tended to suffer more adverse impacts than forested and agricultural areas. The Landsat images can be used during both the pre- and post-earthquake periods. In particular, by utilizing after-event data from Landsat-8, one can extract large landslide at the same time. The NDVI as the normalized difference between band 5 near-infrared (Nir) and band 4 red reflectance (Red) data was calculated by using Equation (4):
2.5. Image Classification for the Earthquake Damage Assessment
This study developed a workflow that is less time consuming for unsupervised classifications after an earthquake. The ratio method (Equations (2)–(4)) can detect thematic information without training areas, and this reduces the time required for correcting and processing data. The classification was determined with an adaptive threshold that depended on the data quality in each study area.
The overall methodology is illustrated in Figure 3. Generally, earthquakes do not cause adverse impacts on waterbodies and vegetated areas. Therefore, the classification was designed at the first level based on waterbodies and vegetated areas by using MNDWI and NDVI data from Landsat-8. For water bodies or wetlands and highly vegetated areas, the threshold value determines whether a pixel belongs to a particular class by considering the influences of the next three classes. The suggested threshold was less than 0.0 in terms of the MNDWI for water body/wetland areas, and it was more than 0.7 in terms of the NDVI for highly vegetated areas.
Then, the coherence for the pre-earthquake period was used to differentiate urban and non-urban areas. A threshold of less than 0.2 was used for non-building or non-permanent areas, and a threshold of more than 0.2 was used for urban areas or permanent areas between two images during acquisition, because urban areas maintain high coherence values over a long period of time. Building footprints from OpenStreetMap (OSM) polygons (more than 160,000 polygons) were acquired for the near-population of buildings (Figure 3A). A threshold of more than 0.2 was found to be suitable for classifying buildings or urban areas correctly for more than 99% of the OSM building polygons.
Inner portions of the building areas were used to compute the normalized difference (ND) between the pre-event and co-event coherence, which ranged between −1.0 and 1.0. The ND of the coherence was classified into five classes using equal interval classification: −1.0 to −0.6, −0.6 to −0.2, −0.2 to 0.2, 0.2 to 0.6, and 0.6 to 1.0. The middle range (−0.2 to 0.2) represented non-change whole multi-temporal images. Therefore, values within −1.0 to −0.2 represented non-permanent areas, because pre-seismic coherence did not show a stable landcover. For building areas, the damage was classified into undamaged to slightly damaged urban areas (−0.2 to 0.2), slightly to heavily damaged areas (0.2 to 0.6), and heavily damaged areas and those with extensive destruction (0.6 to 1.0). Furthermore, using the original ND values of each survey building (144 buildings), the equal interval classification was confirmed suitable for representing damage levels around 84% of survey buildings (Figure 3B).
2.6. Accuracy Assessment
The confusion matrix and kappa coefficient were used to define the accuracy of the study results. The ground truth information was based on field observations collected on 16–17 June 2016, and on after-the-earthquake information derived from Google Earth [29], Google Maps [30], and the OSM project [31]. Ground truth data were manually interpreted as shown in Figure 4. Field surveys were conducted to determine the overall distribution of damaged locations and areas with very large damages. Google Map imagery in 3D mode provided very high-resolution data for defining damage areas and open street view helped in assessing damage levels.
Ground movement caused by earthquakes can cause damage to buildings. Moreover, earthquakes also cause other secondary hazards such as landslides. The phenomena that could be extracted in this study are as follows:
- Landslide areas from the combination of ALOS-2 and Landsat-8 data: these results were checked with large landslide information from the Geospatial Information Authority of Japan (GSI) [36].
3. Results
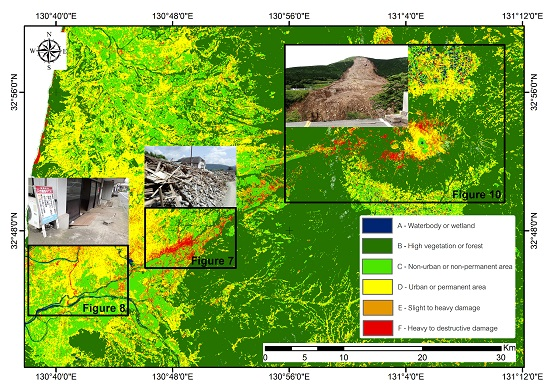
The damage assessment map of Kumamoto is illustrated in Figure 5. This figure presents the major landcover classes and damage degrees including
- A—Waterbodies or wetlands;
- B—Forested areas or highly vegetated areas;
- C—Non-building or non-permanent areas;
- D—Urban areas with no to slight damage;
- E and F—Affected areas including those with building damage, liquefaction regions in urban areas, and landslides induced by the earthquake.
Landsat-8 data were used to assess the distribution of the A and B classes. Waterbodies and wetlands can provide information for damage-related decision making and improve mapping details, such as the locations of landslides. Forested and highly vegetated areas were used to mask out noise through decorrelation analyses of the vegetated areas. Interferometric SAR coherence before the earthquake was used to separate the urban and non-urban areas. Coherence change between the pre- and co-event periods was computed for each level of damage. Data from two sensors were combined and classified as shown in the workflow presented in Figure 3.
The confusion matrix and kappa coefficient were examined to assess the accuracy of the results (Table 3). The overall accuracy of the classification was excellent, at 94.67%, and the kappa coefficient was 0.928. The accuracies of producer’s accuracy (classified result) and user’s accuracy (ground truth) were high for all classes.
Combinations of multi-temporal interferometric coherence and Landsat-8 data were used to extract both the primary and secondary hazards. The specific types assessed were as follows:
- Building damage caused by ground motion, i.e., buildings destroyed directly by surface movement. The degree of damage was classified into three damage patterns (see Section 3.1);
- Damage caused by liquefaction. This damage was related to the ground subsidence and inclination of buildings, which lead to losses of coherence in the SAR images between the earthquake periods assessed. The liquefaction areas showed high coherence in the E and F classes (see Section 3.2);
- Landslides induced by the earthquake. Interferometric SAR coherence combined with optical imagery or Landsat-8 data in this study were used to assess the landslides in a more precise manner than what could be achieved with SAR data alone. The areas surrounded by forests or highly vegetated areas were considered as potential landslide sites (see Section 3.3).
3.1. Buildings Damaged by Ground Motion
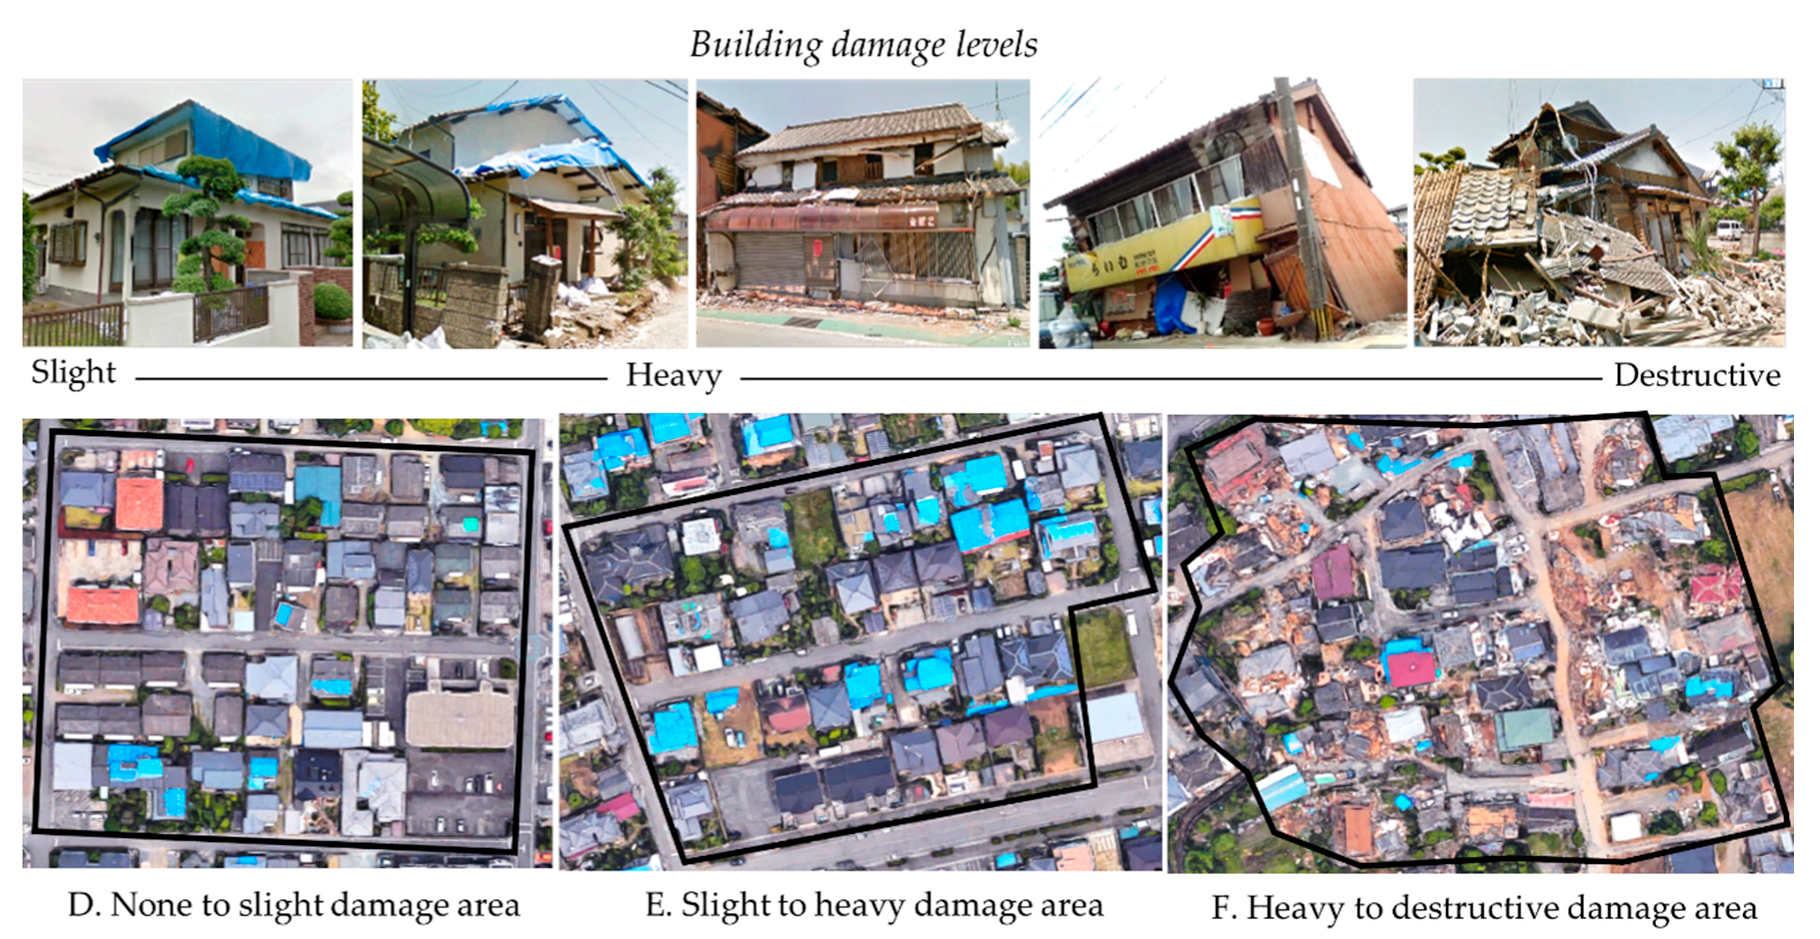
The results were validated by the confusion matrix (Table 4) and ground truth data of the damage extent collected by field surveys and high resolution images (Google Earth and Google Maps) after the earthquake. Categories of damage related to ground motion were modified from earthquake field guidelines issued by the Earthquake Engineering Research Institute [37] and damage patterns of buildings collected during the earthquake investigation by Okada and Takai [38,39]. There were three urban damage classes (Figure 6) used in this study, and these included areas with
- D—No damage to slight damage: slight structural damage included walls with cracks, roofing tile displacements, and wall mortar that was somewhat peeled off;
- E—Slight to heavy damage: this included considerable nonstructural and slight structural damage to considerable structural and extensive nonstructural damage, such as damage to portions of columns, beams, or walls and collapsed roof tiles;
- F—Heavy to destructive damage: this included structures that were more economical to demolish than repair, such as inclined, nearly collapsed, and completely collapsed buildings.
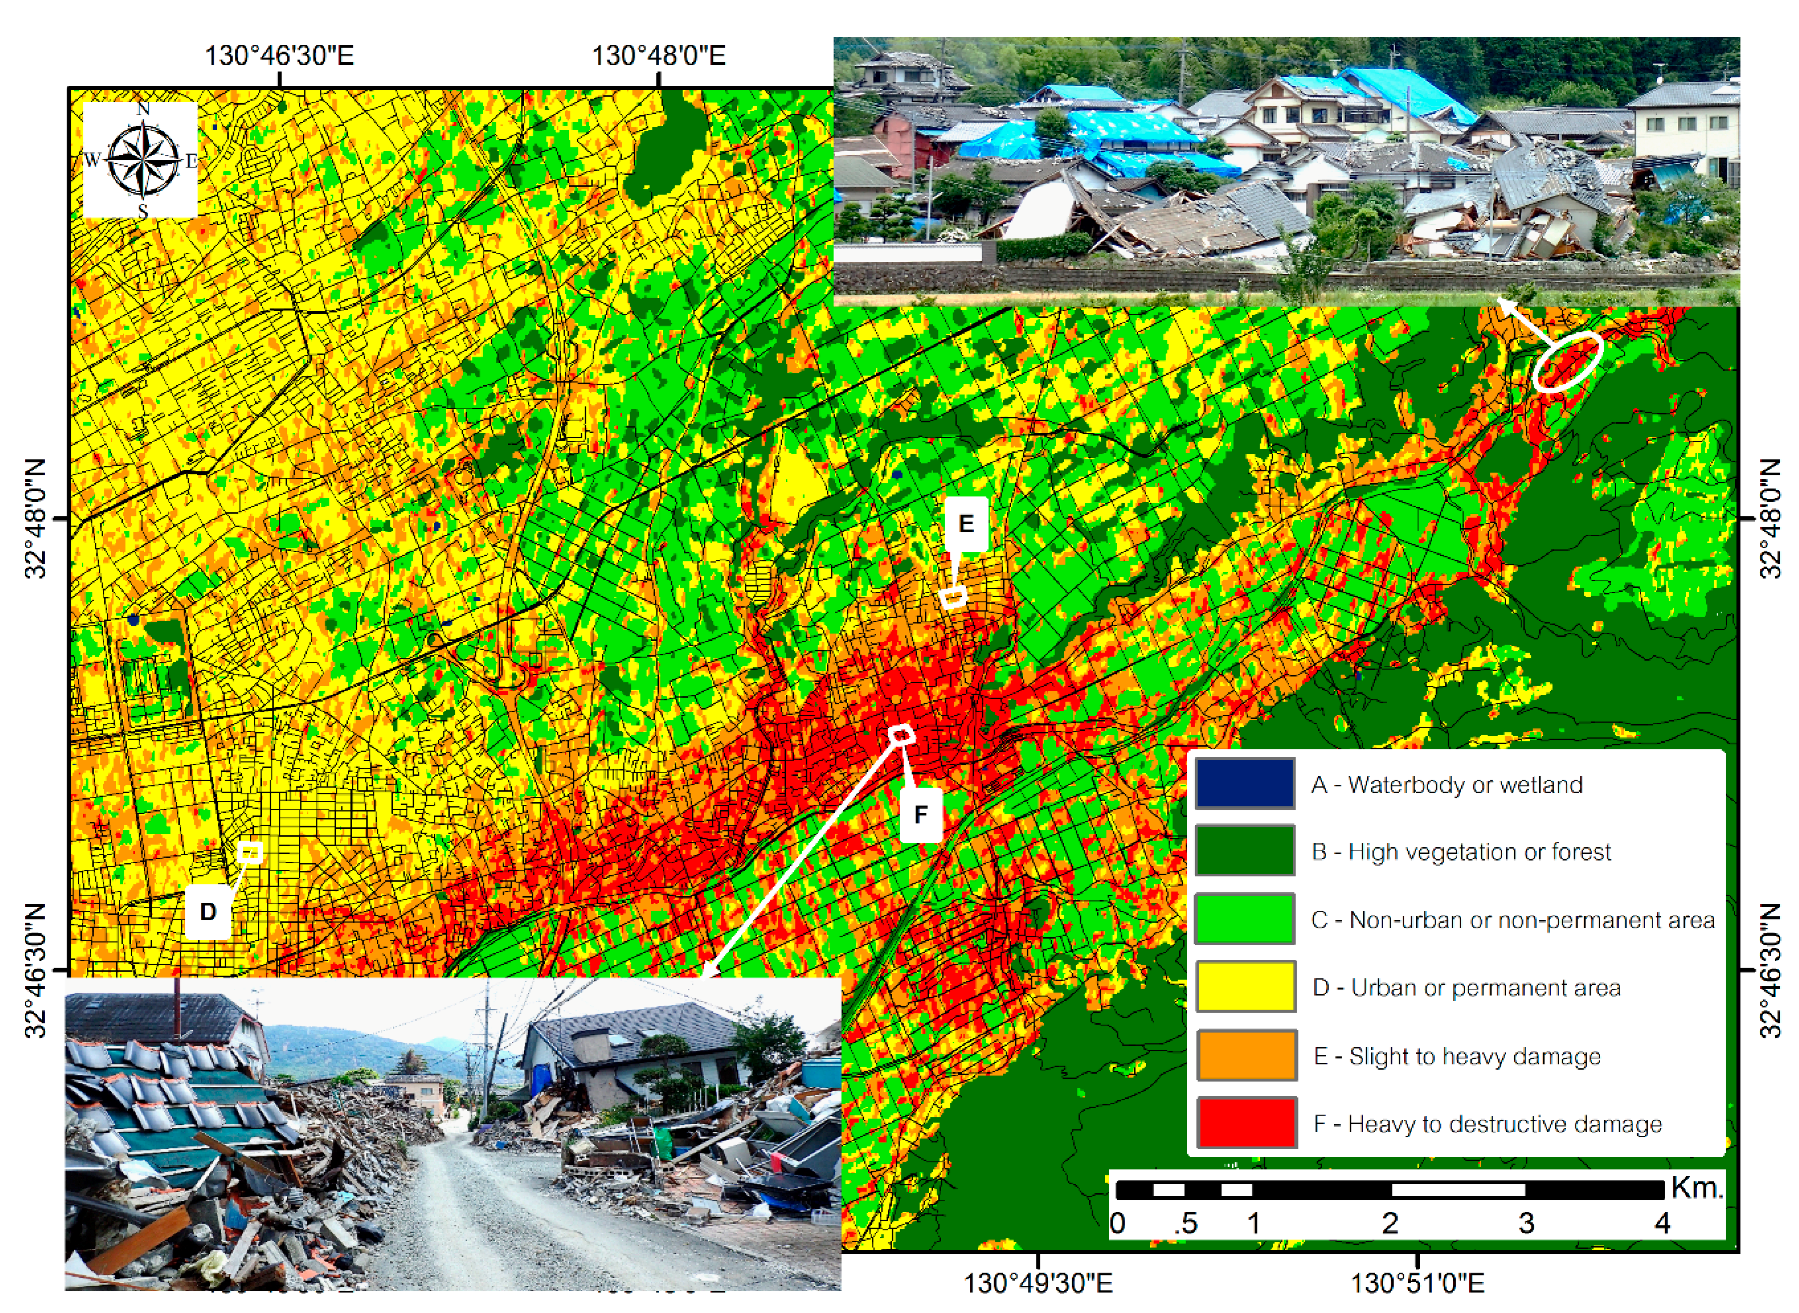
As shown by the map in Figure 7, severely affected areas were detected at a high density in Mashiki town. The overall accuracy of the urban damage area assessment was 90.84%, and the kappa coefficient was 0.854.
3.2. Buildings Damaged by Liquefaction
Liquefaction is a common phenomenon during earthquakes in areas with loose sand and silt that is saturated with water; these areas can behave like a liquid when shaken. The important factors governing whether liquefaction will occur include the geological, geomorphological, seismic, and geotechnical characteristics of the ground [40]. Earthquake waves cause the water pressure to increase in sediment, and sand grains lose contact with each other; thus, the sediment loses strength and behave like a liquid. Therefore, the soil loses its ability to support structures and this leads to damage to buildings, roads, and pipelines. Floodplains or alluvial lowlands are susceptible areas for soil liquefaction caused by earthquakes. Widespread liquefaction can occur and damage buildings and infrastructure long distances away from the rupture zone. Buildings on liquefaction-susceptible areas are mainly damaged by two processes: inclination and subsidence [39].
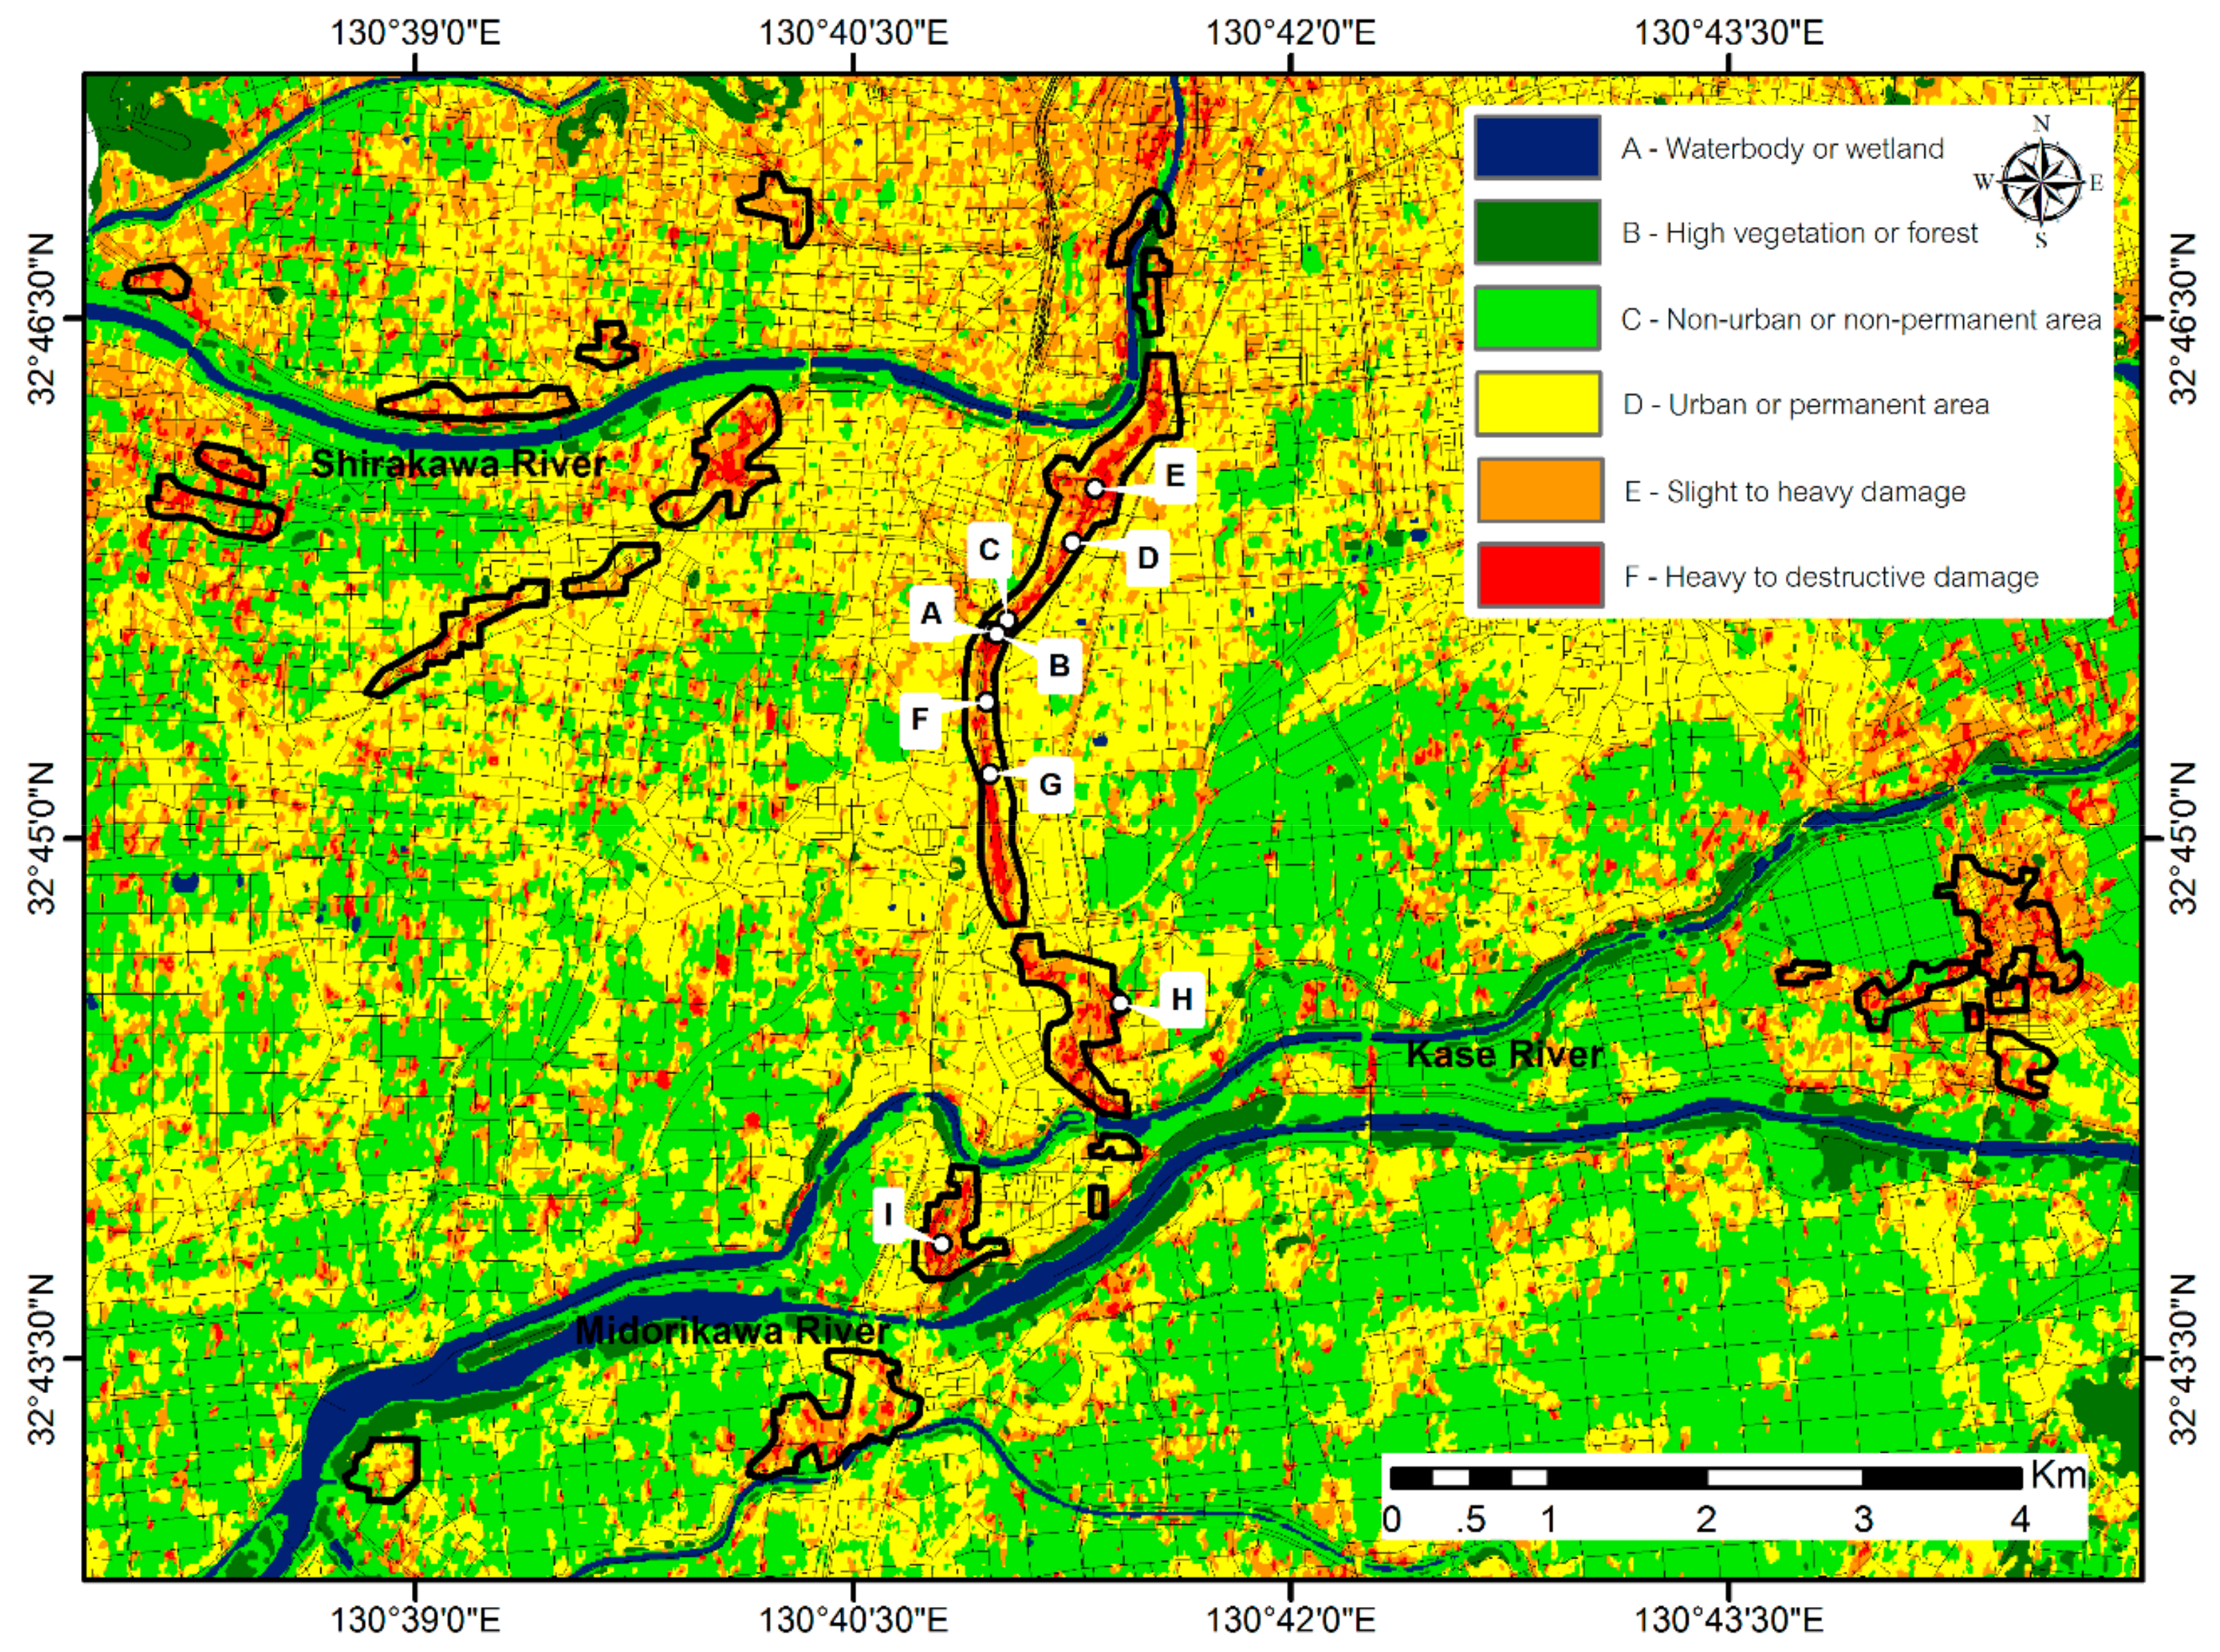
The interferometric coherence change between the pre- and during-earthquake periods was used to identify significant decorrelation caused by soil liquefaction. Water bodies and wetlands helped in determining the damage types. The results (Figure 8) presented clear liquefaction affected areas around the floodplain between the Shirakawa River, Kase River and Midorikawa River, and the findings were consistent with field survey data from JGS and JSCE [32,33,34,35]. Comparisons with photographic interpretations from field surveys revealed a good match, as shown in Figure 8 and Figure 9.
3.3. Landslide Areas
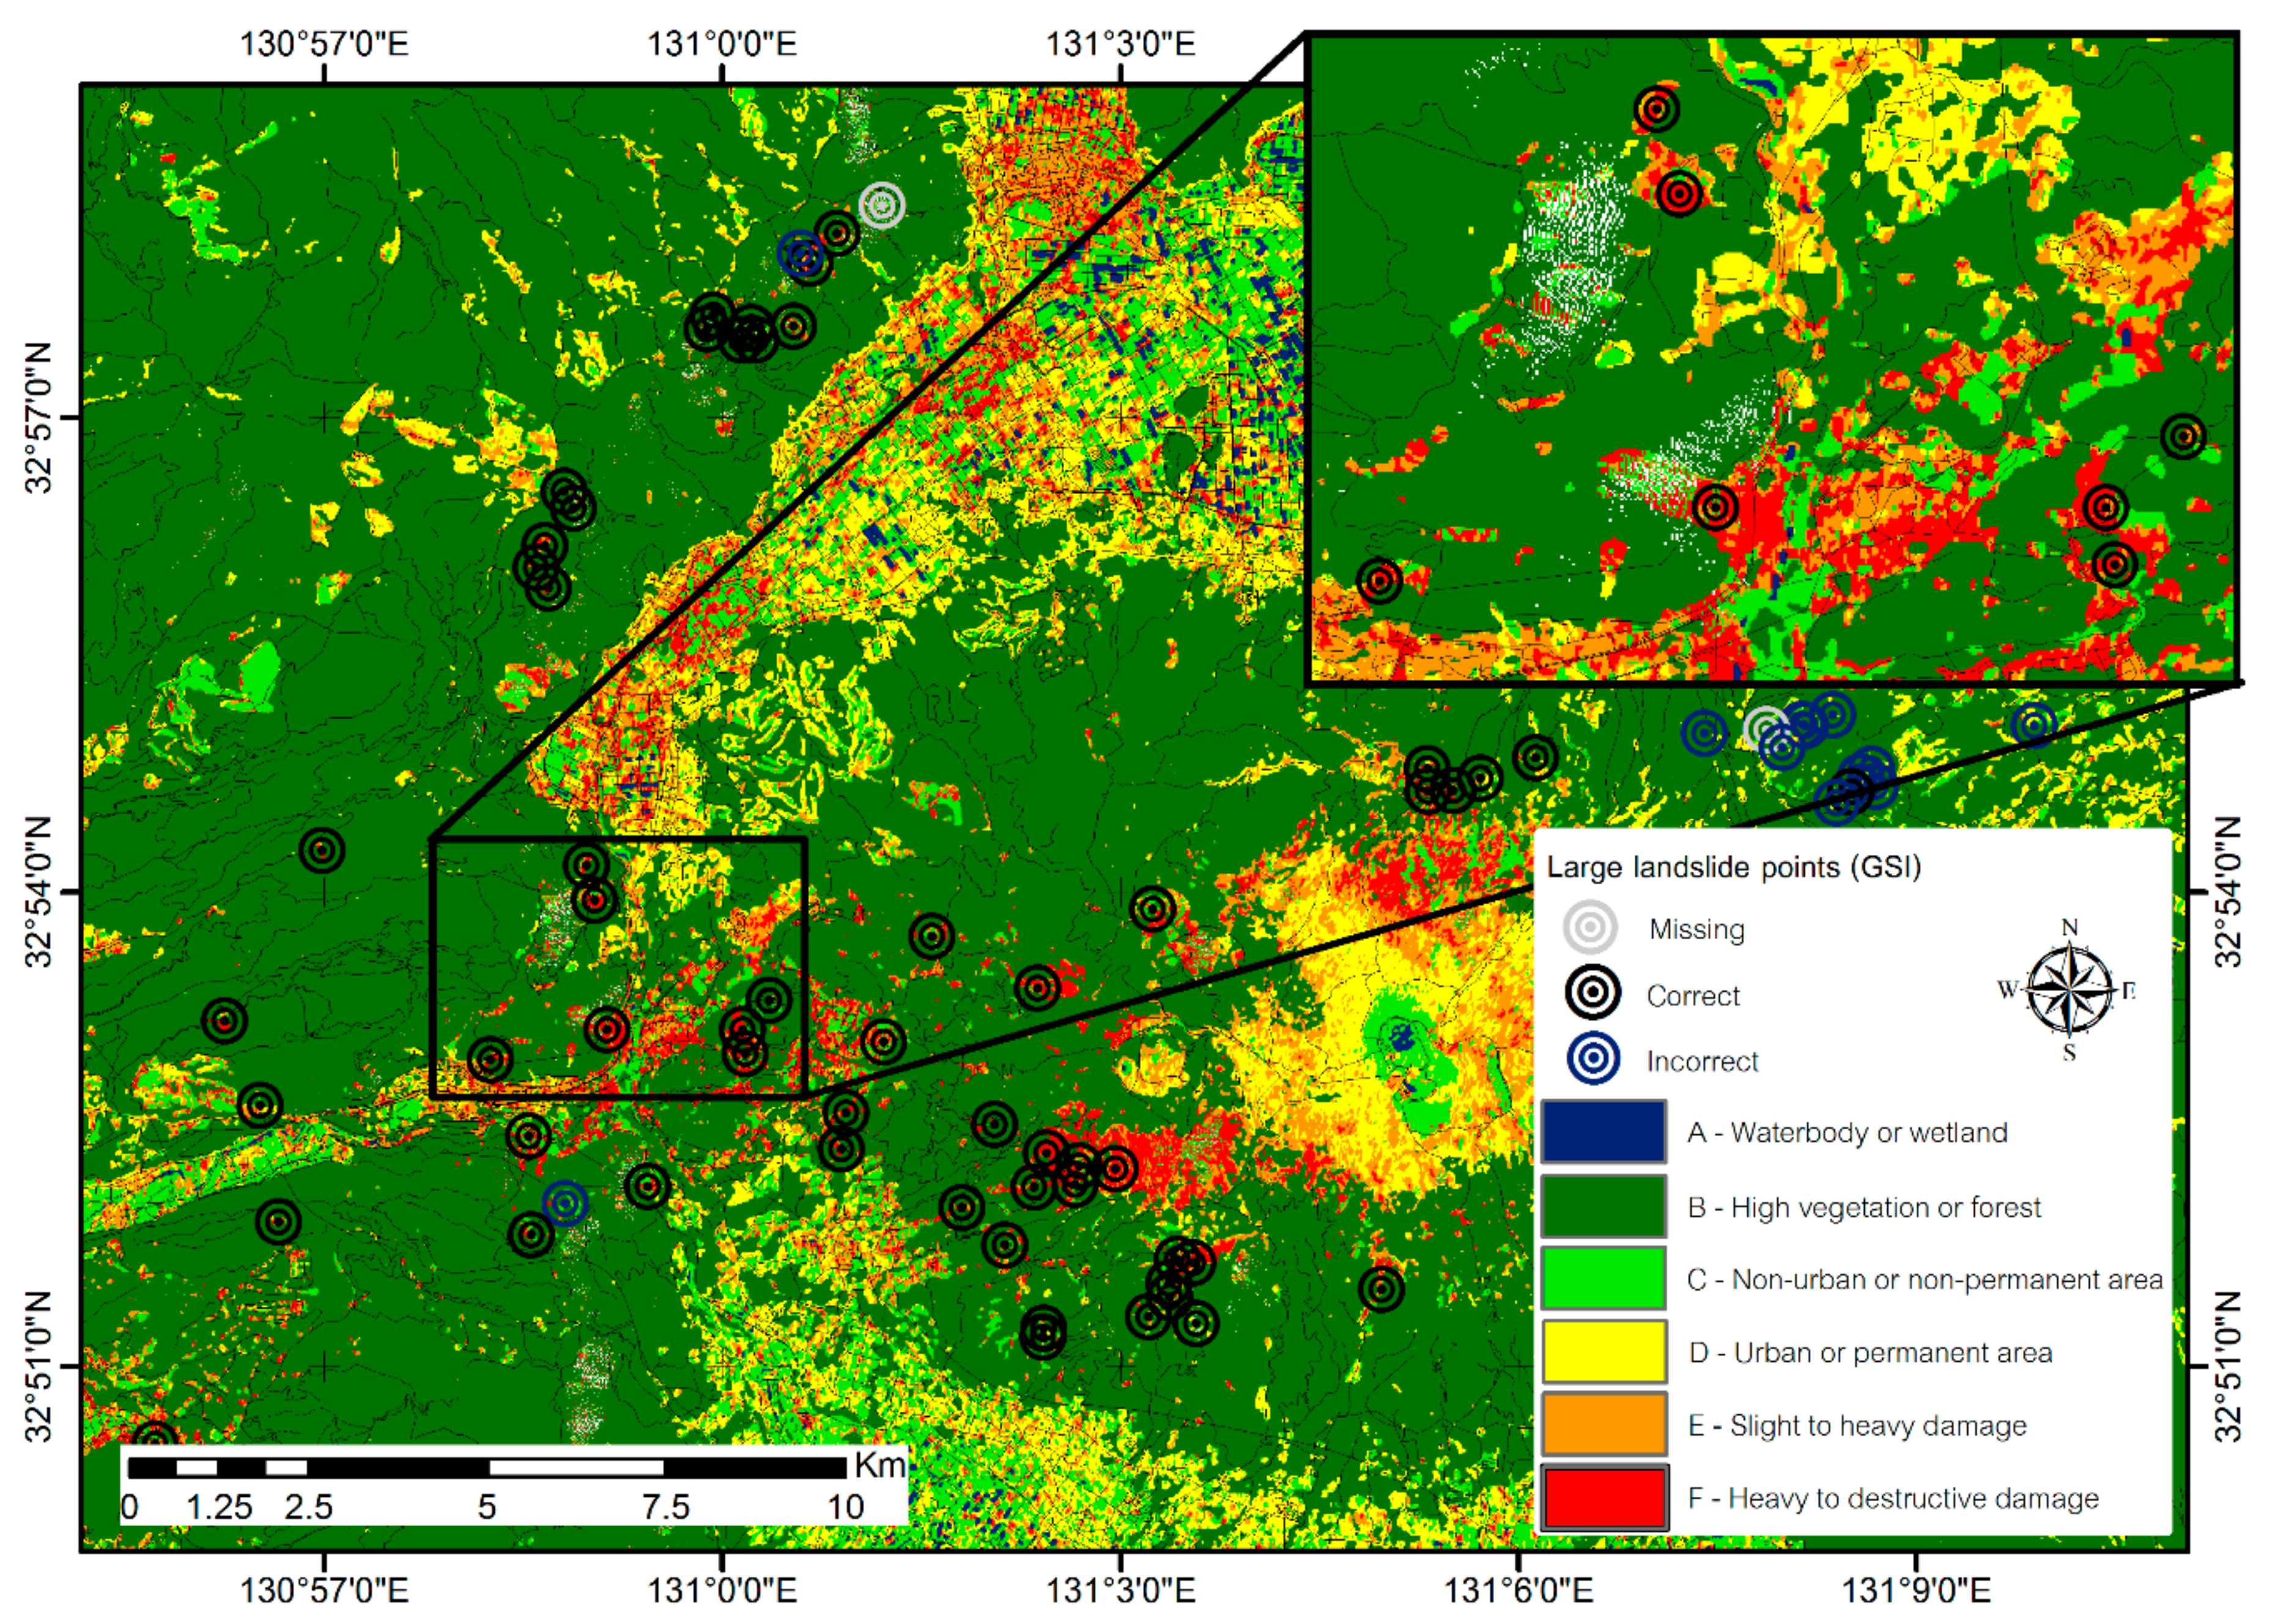
The strong ground motion of earthquakes can induce landslides and disaster-triggered deforestation events. The interferometric coherence method has been implemented as an effective tool for evaluating disaster-induced deforestation in previous work [41]. The long wavelength ALOS-2 L-band was used to produce interferometric coherence for the rapid assessment of landslides in a wide area around Mount Aso in the Kumamoto Prefecture. Earthquake-induced landslides were assessed by the decorrelation of interferometric coherence between pre- and co-earthquake pairs. The pre-seismic coherence showed high values, due to negligible changes in the surface under normal situations. Co-seismic coherence showed low values because the surface changes from forest area to barren and rocky surfaces. Therefore, the normalized coherence between pre- and co-seismic coherence showed a high degree for landslides. The fusion of these data with Landsat-8 data collected after the earthquake allowed us to locate the landslides more precisely by NDVI. Landslides appeared to be in E and F classes and could be separated from urban areas by visual interpretation because they were on highly sloping lands and typically surrounded by forested areas.
The resulting map (Figure 10) was checked with 82 points of large landslide information from GSI [36]. The results classified landslides correctly at 64 points; incorrect classifications occurred at 15 points, and missing information was encountered at 3 points. According to the analysis, the overall accuracy was 78%.
4. Discussion
4.1. Overall Study
This paper presents an approach that uses combinations of interferometric ALOS-2 coherence and Landsat-8 information to conduct damage assessments for both primary and secondary damage (liquefaction and landslides) induced by earthquakes. The overall accuracy of the damage assessment map constructed in this study was very high. This study thus demonstrates that it is feasible to combine and extend the advantages of two different remote sensing sensors for earthquake damage assessments. The urban damage levels following the 2016 Kumamoto earthquake were obtained from the degree of interferometric coherence of pre-seismic and co-seismic data, and the findings were consistent with the results of previous research reports that mapped the urban damage [11,12,13,15] and liquefaction areas [27] by using interferometric coherence.
The fusion of SAR and optical imagery has been shown to improve the results [16]. This study selected Landsat-8 data after the event to extract thematic information on water and vegetation indices, which helped to improve the damage classification and reduce the effect of ALOS-2 decorrelation between urban and vegetation areas. This study implemented the advantages of each sensor (i.e., ALOS-2 and Landsat-8) to develop a classification flow for earthquake damage assessments that does not require training areas; thus, the method is fast and is capable of creating good visualizations. The results from the integrated ALOS-2 and Landsat-8 data revealed three damage types covering an extensive area, namely, buildings damaged by ground motion, buildings damaged by liquefaction, and damage caused by landslides. The results were compared to ground truth data and an excellent overall accuracy at 94% was achieved.
4.2. Building Damage by Ground Motion and Liquefaction
Urban damage caused by ground motion was extracted from pre- and co-event interferometric coherence into three levels with high accuracy (90%). The accuracy was also high for buildings damaged by liquefaction; these areas were detected by the same method (ND) used for the damage caused by ground motion. This study also examined the different types of damage in detail. Waterbody/wetland areas and highly vegetated areas were extracted from Landsat-8 data, and these assisted in the damage type decisions. For example, the damage caused by liquefaction and the collapsed buildings could have been classified at the same damage level, but the patterns of damage were not the same. Therefore, information on waterbodies helped to roughly locate the floodplain and classify the liquefaction areas. Because some buildings displayed damage characteristics that could be attributed to both ground motion and liquefaction, this study separated the damage types to evaluate the accuracy. Notably, the results from this study showed good agreement with ground truth data for each of the damage types.
4.3. Landslides
Landslides extracted by fused sensor information were found to be more precise than those extracted by using only one type of data. The results assisted in the identification of large landslides at 78% accuracy based on large landslide location information from GSI. Landslides from optical imagery showed up as a loss of vegetation. However, it was sometimes unclear whether the vegetation change was from landslides or seasonal change. Therefore, SAR decorrelation data on the surface changes were used to extract the areas affected by the earthquake. In the same way, Landsat-8 data improved the landslide boundaries assessed by SAR coherence change. Moreover, results from SAR images are sometimes affected by SAR geometries, and this can lead to a loss of information such as foreshortening, layovers, and shadows. The damage assessment by SAR and Landsat-8 that captured the after-earthquake conditions was successful at extracting large landslides precisely (however, the extraction of smaller landslides was limited by the optical spatial resolution). In real applications, quick responses after a disaster are needed. Therefore, optical imagery before the earthquake may be analyzed first for a quick response and after-earthquake imagery can be analyzed after image acquisition. Moreover, multi-temporal optical imagery may be integrated to improve the quality of optical image results that may have been affected by seasonal change, cloud cover, and atmospheric conditions.
4.4. Recommendations
On the basis of this study, we recommend that additional data be used to improve damage types decisions if such data are available; these data could include building footprints and geology and geomorphology data related to building damage, liquefaction and landslides. Other image sensors could also be employed for a comprehensive and quick response after an earthquake.
5. Conclusions
A new approach for damage assessments was proposed based on a combination of interferometric SAR coherence and optical satellite imagery data. The approach can be implemented rapidly, because it does not require training areas. It is capable of making damage assessment maps with an adaptable method depending on the data quality and time of acquisition. Landsat-8 data collected after the earthquake were used to detect important information including waterbody/wetland areas and highly vegetated areas. ALOS-2 interferometric coherent images were analyzed during two periods. The coherence before the earthquake was found to be useful for separating urban and non-urban areas. The coherence before and during the earthquake were computed according to a normalized difference index to extract the damage levels. The combinations improve the damage assessment map visualization by allowing users to focus on adverse impacts in urban areas and landslide sites.
The approach was tested in the area damaged by the 2016 Kumamoto earthquake, and found to be accurate in terms of both primary (ground motion) and secondary (liquefaction and landslides) earthquake hazards; the results were compared to ground truth data, and an excellent overall accuracy at 94% was achieved. The data for buildings damaged by ground motion were divided into three levels of damage; specifically, none to slight, slight to heavy, and heavy to destructive damage. The overall accuracy of the results for the damaged buildings was still high at 90%. Buildings damaged by liquefaction were in good agreement with field survey data and survey information from JGS and JSCE. Moreover, the results assisted in the identification of large landslides at 78% accuracy based on large landslide location information from GSI. The workflow presented in this study should be applicable elsewhere and could generate useful damage assessment mapping information to support post-disaster mitigation work during future earthquakes.
Acknowledgments
The assistance received from the Japan Aerospace Exploration Agency (JAXA) in acquiring the ALOS-2 PALSAR-2 images is gratefully acknowledged.
Author Contributions
Nopphawan Tamkuan developed the research approach, processed data, and wrote the manuscript. Masahiko Nagai advised on the research framework and supported improvements to the manuscript.
Conflicts of Interest
The authors declare no conflicts of interest.
References
- Ansal, A. Perspectives on European Earthquake Engineering and Seismology; Springer: Cham, Switzerland, 2014; Volume 1, pp. 53–95. [Google Scholar]
- Boccardo, P.; Tonolo, F.G. Remote sensing role in emergency mapping for disaster response. In Engineering Geology for Society and Territory—Volume 5: Urban Geology, Sustainable Planning and Landscape Exploitation; Springer: Cham, Switzerland, 2015; pp. 17–24. [Google Scholar]
- Eguchi, R.T.; Huyck, K.; Adams, B.J.; Mansouri, B.; Houshmand, B.; Shinozuka, M. Resilient Disaster Response: Using Remote Sensing Technologies for Post-Earthquake Damage Detection. MCEER Research and Accomplishements 2001–2003; Multidiscplinary Center for Earthquake Engineering Research (MCEER): Buffalo, NY, USA, 2003; pp. 125–137. [Google Scholar]
- Miyazaki, H.; Nagai, M.; Shibasaki, R. Reviews of geospatial information technology and collaborative data delivery for disaster risk management. ISPRS Int. J. Geo-Inf. 2015, 4, 1936–1964. [Google Scholar] [CrossRef]
- Dong, L.; Shan, J. A comprehensive review of earthquake-induced building damage detection with remote sensing techniques. ISPRS J. Photogramm. Remote Sens. 2013, 84, 85–99. [Google Scholar] [CrossRef]
- Cooner, A.J.; Shao, Y.; Campbell, J.B. Detection of urban damage using remote sensing and machine learning algorithms: Revisiting the 2010 Haiti earthquake. Remote Sens. 2016, 8, 868. [Google Scholar] [CrossRef]
- Barazzetti, L.; Brumana, R.; Cuca, B.; Previtali, M. Change detection from very high resolution satellite time series with variable off-nadir angle. In Proceedings of the Third International Conference on Remote Sensing and Geoinformation of the Environment, Paphos, Cyprus, 16 March 2015; Volume 3. [Google Scholar]
- Yamazaki, F. Earthquake damage detection using high-resolution satellite images. In Proceedings of the 2004 IEEE Interational Geoscience and Remote Sensing Symposium, Anchprage, AK, USA, 20–24 September 2004. [Google Scholar]
- Plank, S. Rapid damage assessment by means of multi-temporal SAR—A comprehensive review and outlook to Sentinel-1. Remote Sens. 2014, 6, 4870–4906. [Google Scholar] [CrossRef]
- Matsuoka, M.; Yamazaki, F. Use of interferometric satellite SAR for earthquake damage detection. In Proceedings of the 6th International Conference on Seismic Zonation, EERI, Palm Springs, CA, USA, 12–15 November 2000. [Google Scholar]
- Arciniegas, G.A.; Bijker, W.; Kerle, N.; Tolpekin, V.A. Coherence- and amplitude-based analysis of seismogenic damage in Bam, Iran, using ENVISAT ASAR data. IEEE Trans. Geosci. Remote Sens. 2007, 45, 1571–1581. [Google Scholar] [CrossRef]
- Hoffmann, J. Mapping damage during the Bam (Iran) earthquake using interferometric coherence. Int. J. Remote Sens. 2007, 28, 1199–1216. [Google Scholar] [CrossRef]
- Watanabe, M.; Thapa, R.B.; Ohsumi, T.; Fujiwara, H.; Yonezawa, C.; Tomii, N.; Suzuki, S. Detection of damaged urban areas using interferometric SAR coherence change with PALSAR-2. Earth Planets Space 2016, 68, 131. [Google Scholar] [CrossRef]
- Ge, L.; Ng, A.H.-M.; Li, X.; Liu, Y.; Du, Z.; Liu, Q. Near real-time satellite mapping of the 2015 Gorkha earthquake, Nepal. Ann. GIS 2015, 21, 175–190. [Google Scholar] [CrossRef]
- Yun, S.-H.; Hudnut, K.; Owen, S.; Webb, F.; Simons, M.; Sacco, P.; Gurrola, E.; Manipon, G.; Liang, C.; Fielding, E.; et al. Rapid damage mapping for the 2015 Mw 7.8 Gorkha earthquake using synthetic aperture radar data from COSMO—SkyMed and ALOS-2 Satellites. Seismol. Res. Lett. 2015, 86, 1549–1556. [Google Scholar] [CrossRef]
- Stramondo, S.; Bignami, C.; Chini, M.; Pierdicca, N.; Tertulliani, A. Satellite radar and optical remote sensing for earthquake damage detection: Results from different case studies. Int. J. Remote Sens. 2006, 27, 4433–4447. [Google Scholar] [CrossRef]
- United States Geological Survey (USGS). M7.0-1 km E of Kumamoto-shi, Japan. Available online: https://earthquake.usgs.gov/earthquakes/eventpage/us20005iis#executive (accessed on 30 May 2016).
- Yagi, Y.; Okuwaki, R.; Enescu, B.; Kasahara, A.; Miyakawa, A.; Otsubo, M. Rupture process of the 2016 Kumamoto earthquake in relation to the thermal structure around Aso volcano. Earth Planets Space 2016, 68, 118. [Google Scholar] [CrossRef]
- Cross, J.R. Red Cross Responses Keep the Kumamoto Red Cross Hospital Operating. Available online: http://reliefweb.int/report/japan/japan-kumamoto-earthquake-one-month-report-infographics-17-may-2016 (accessed on 30 June 2016).
- Hanssen, R.F. Remote Sensing and Digital Image Processing. In Radar Interferometry: Data Interpretation and Error Analysis; Springer: Dordrecht, The Netherlands, 2001; Volume 2, p. 38. [Google Scholar]
- Stramondo, S.; Moro, M.; Tolomei, C.; Cinti, F.R.; Doumaz, F. InSAR surface displacement field and fault modelling for the 2003 Bam earthquake (southeastern Iran). J. Geodyn. 2005, 40, 347–353. [Google Scholar] [CrossRef]
- Raucoules, D.; Ristori, B.; de Michele, M.; Briole, P. Surface displacement of the Mw 7 Machaze earthquake (Mozambique): Complementary use of multiband InSAR and radar amplitude image correlation with elastic modelling. Remote Sens. Environ. 2010, 114, 2211–2218. [Google Scholar] [CrossRef]
- Sandwell, D.; Mellors, R.; Tong, X.; Wei, M.; Wessel, P. GMTSAR: An InSAR Processing System Based on Generic Mapping Tools. Available online: http://escholarship.org/uc/item/8zq2c02m (accessed on 15 May 2014).
- Yonezawa, C.; Takeuchi, S. Dection of urban damage using interferometric SAR decorrelation. In Proceedings of the 1999 IEEE International Geoscience and Remote Sensing Symposium, Hamburg, Germany, 28 June–2 July 1999. [Google Scholar]
- Lindsey, E.O.; Natsuaki, R.; Xu, X.; Shimada, M.; Hashimoto, M.; Melgar, D.; Sandwell, D.T. Line-of-sight displacement from ALOS-2 interferometry: Mw 7.8 Gorkha Earthquake and Mw 7.3 aftershock. Geophys. Res. Lett. 2015, 42, 6655–6661. [Google Scholar] [CrossRef]
- Sandwell, D.T.; Myer, D.; Mellors, R.; Shimada, M.; Brooks, B.; Foster, J. Accuracy and resolution of ALOS interferometry: Vector deformation maps of the Father’s Day intrusion at Kilauea. IEEE Trans. Geosci. Remote Sens. 2008, 46, 3524–3534. [Google Scholar] [CrossRef]
- Ishitsuka, K.; Tsuji, T.; Matsuoka, T. Detection and mapping of soil liquefaction in the 2011 Tohoku earthquake using SAR interferometry. Earth Planets Space 2013, 64, 1267–1276. [Google Scholar] [CrossRef]
- Xu, H. Modification of normalised difference water index (NDWI) to enhance open water features in remotely sensed imagery. Int. J. Remote Sens. 2006, 27, 3025–3033. [Google Scholar] [CrossRef]
- Google Earth. Available online: https://www.google.com/earth/ (accessed on 5 December 2016).
- Google Maps. Available online: https://www.google.co.th/maps/ (accessed on 5 December 2016).
- Google Street View. Available online: https://www.google.com/streetview/ (accessed on 5 December 2016).
- Liquefaction Survey for Kumamoto Earthquake by JSCE. Available online: http://committees.jsce.or.jp/eec205/system/files/liq_survey_2016kumamoto.pdf (accessed on 24 January 2017).
- Preliminary Report: Kumamoto Liquefaction Damage (27 April 2016) by JGS. Available online: https://www.jiban.or.jp/images/saigai/H28Kumamoto_jisinsaigai_0427ekijoka.pdf (accessed on 24 January 2017).
- Preliminary Report: Kumamoto Liquefaction Damage (24 June 2016) by Fukuoka University. Available online: http://www.tec.fukuoka-u.ac.jp/tc/labo/drr/gis/H28KumamotoEQ/kaisetsu0624.pdf (accessed on 24 January 2017).
- Preliminary Report: Kumamoto Liquefaction Damage (11 May 2016) by JGS. Available online: https://www.jiban.or.jp/images/saigai/H28Kumamoto_jisinsaigai_0511ekijoka.pdf (accessed on 24 January 2017).
- Information about the 2016 Kumamoto Earthquake, GSI. Available online: http://www.gsi.go.jp/BOUSAI/H27-kumamoto-earthquake-index.html (accessed on 5 January 2016).
- Earthquake Engineering Research Institute (EERI). Section 7 Engineered Buildings—Field Investigation. Available online: https://www.eeri.org/lfe/pdf/Field_Guide_Section_7.pdf (accessed on 8 January 2016).
- Okada, S.; Takai, N. Classifications of structural types and damage patterns of buildings for earthquake field investigation. In Proceedings of the 12th World Conference on Earthquake Engineering, Auckland, New Zealand, 30 January–4 February 2000; pp. 1–8. [Google Scholar]
- Hengjian, L.; Kohiyama, M.; Horie, K.; Maki, N.; Hayashi, H.; Tanaka, S. Building damage and casualties after an earthquake. Nat. Hazards 2003, 29, 387–403. [Google Scholar] [CrossRef]
- Aghda, S.M.F.; Koike, K.; Suzuki, A.; Kitazono, Y. Geological hazard risk assessment by using fuzzy sets theory. Geoinformatics 1994, 5, 113–128. [Google Scholar] [CrossRef]
- Chen, F.; Guo, H.; Ishwaran, N.; Zhou, W.; Yang, R.; Jing, L.; Chen, F.; Zeng, H. Synthetic aperture radar (SAR) interferometry for assessing Wenchuan earthquake (2008) deforestation in the Sichuan giant panda site. Remote Sens. 2014, 6, 6283–6299. [Google Scholar] [CrossRef]
Figure 1.
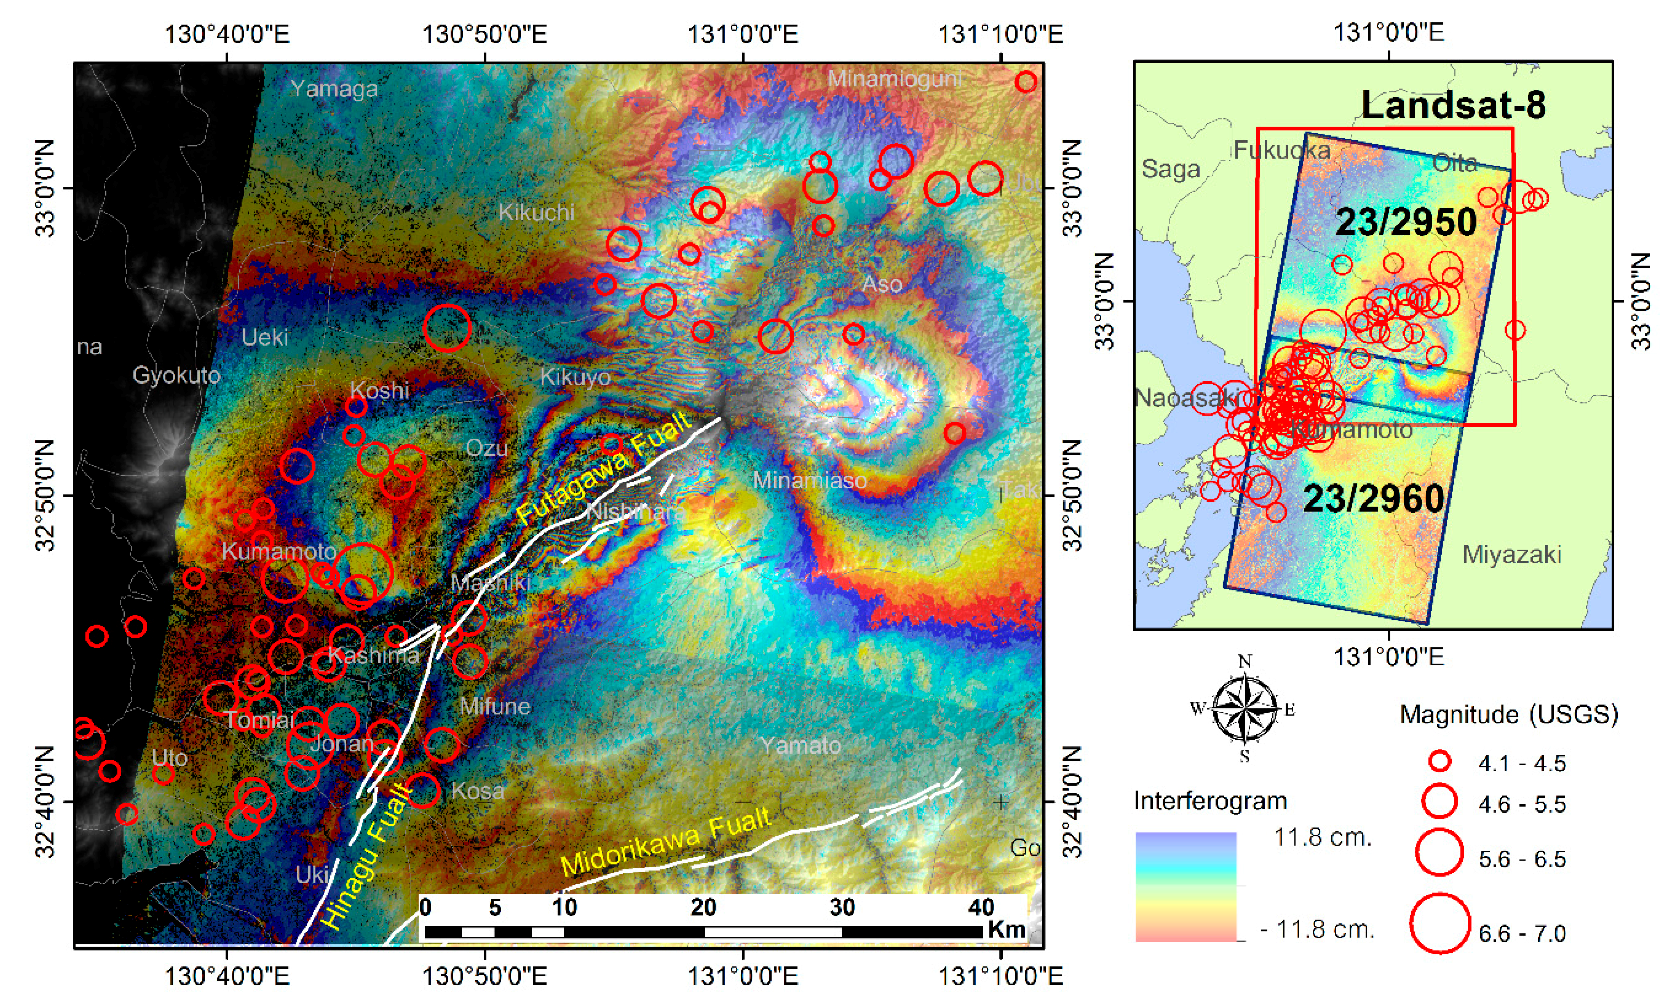
Co-seismic interferogram of the study area and earthquake locations with magnitudes of more than 4.1 Mw between 14 April 2015 and 14 May 2015 from USGS. The earthquakes were mapped along the Futagawa and Hinagu faults (fault line data sources: Geological Survey of Japan). The right map outlines the ALOS-2 PALSAR2 and Landsat-8 images used in this study.
Figure 1.
Co-seismic interferogram of the study area and earthquake locations with magnitudes of more than 4.1 Mw between 14 April 2015 and 14 May 2015 from USGS. The earthquakes were mapped along the Futagawa and Hinagu faults (fault line data sources: Geological Survey of Japan). The right map outlines the ALOS-2 PALSAR2 and Landsat-8 images used in this study.

Figure 2.
(a) Pre-earthquake coherence, (b) during-earthquake coherence, and (c) coherence change index (ND).
Figure 2.
(a) Pre-earthquake coherence, (b) during-earthquake coherence, and (c) coherence change index (ND).
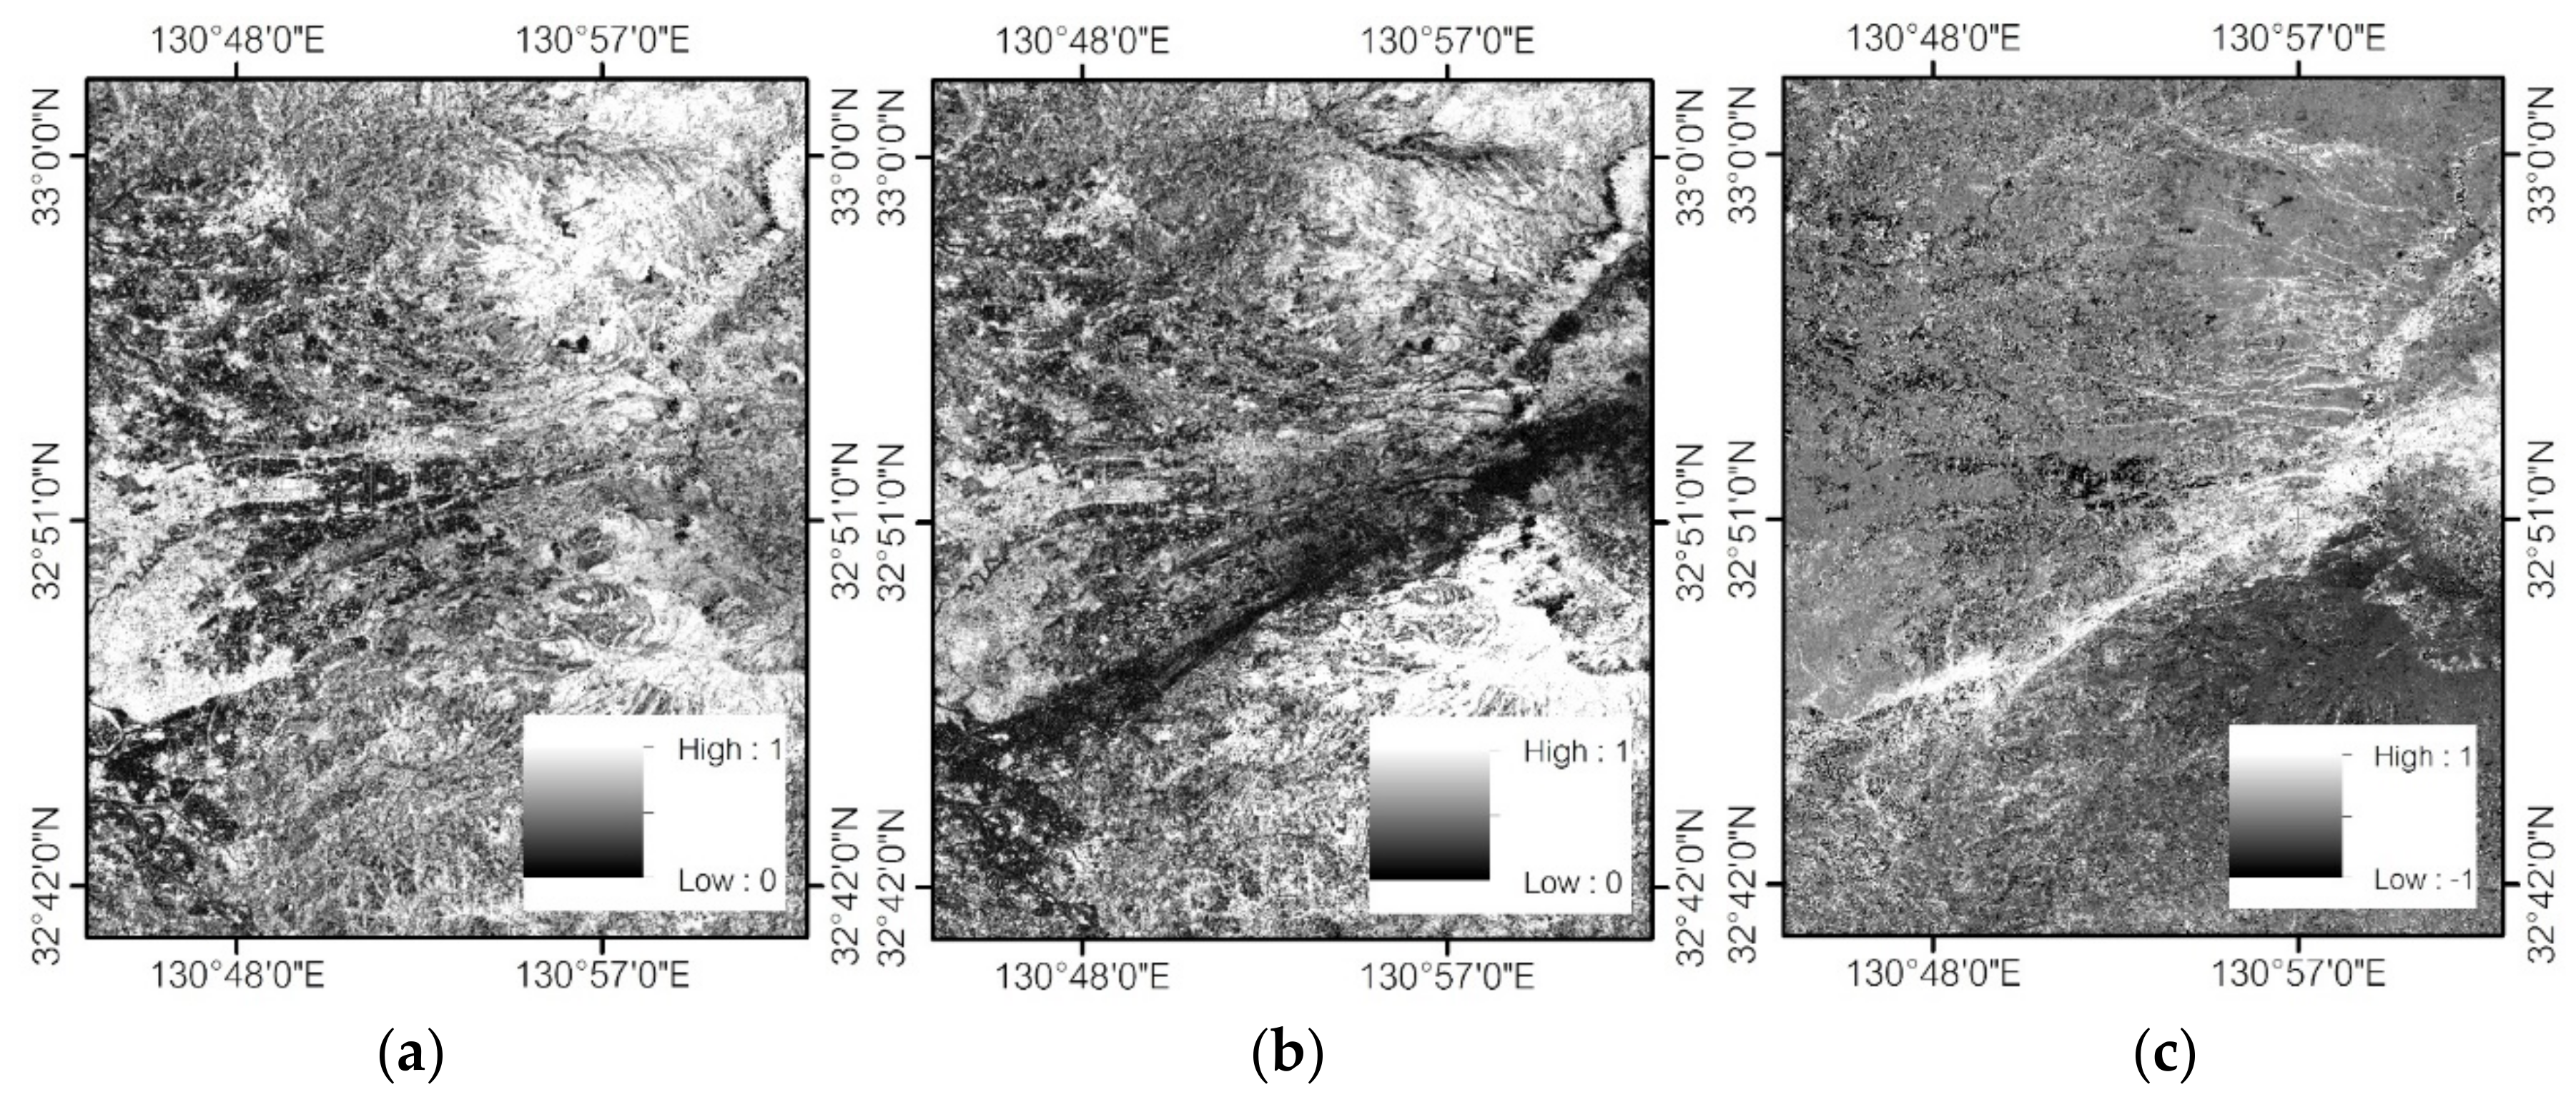
Figure 3.
Classification workflow and the proposed threshold. (A) OSM polygons for determining threshold value of building area (B) the original ND values of 144 buildings for confirming ranges of damage levels.
Figure 3.
Classification workflow and the proposed threshold. (A) OSM polygons for determining threshold value of building area (B) the original ND values of 144 buildings for confirming ranges of damage levels.
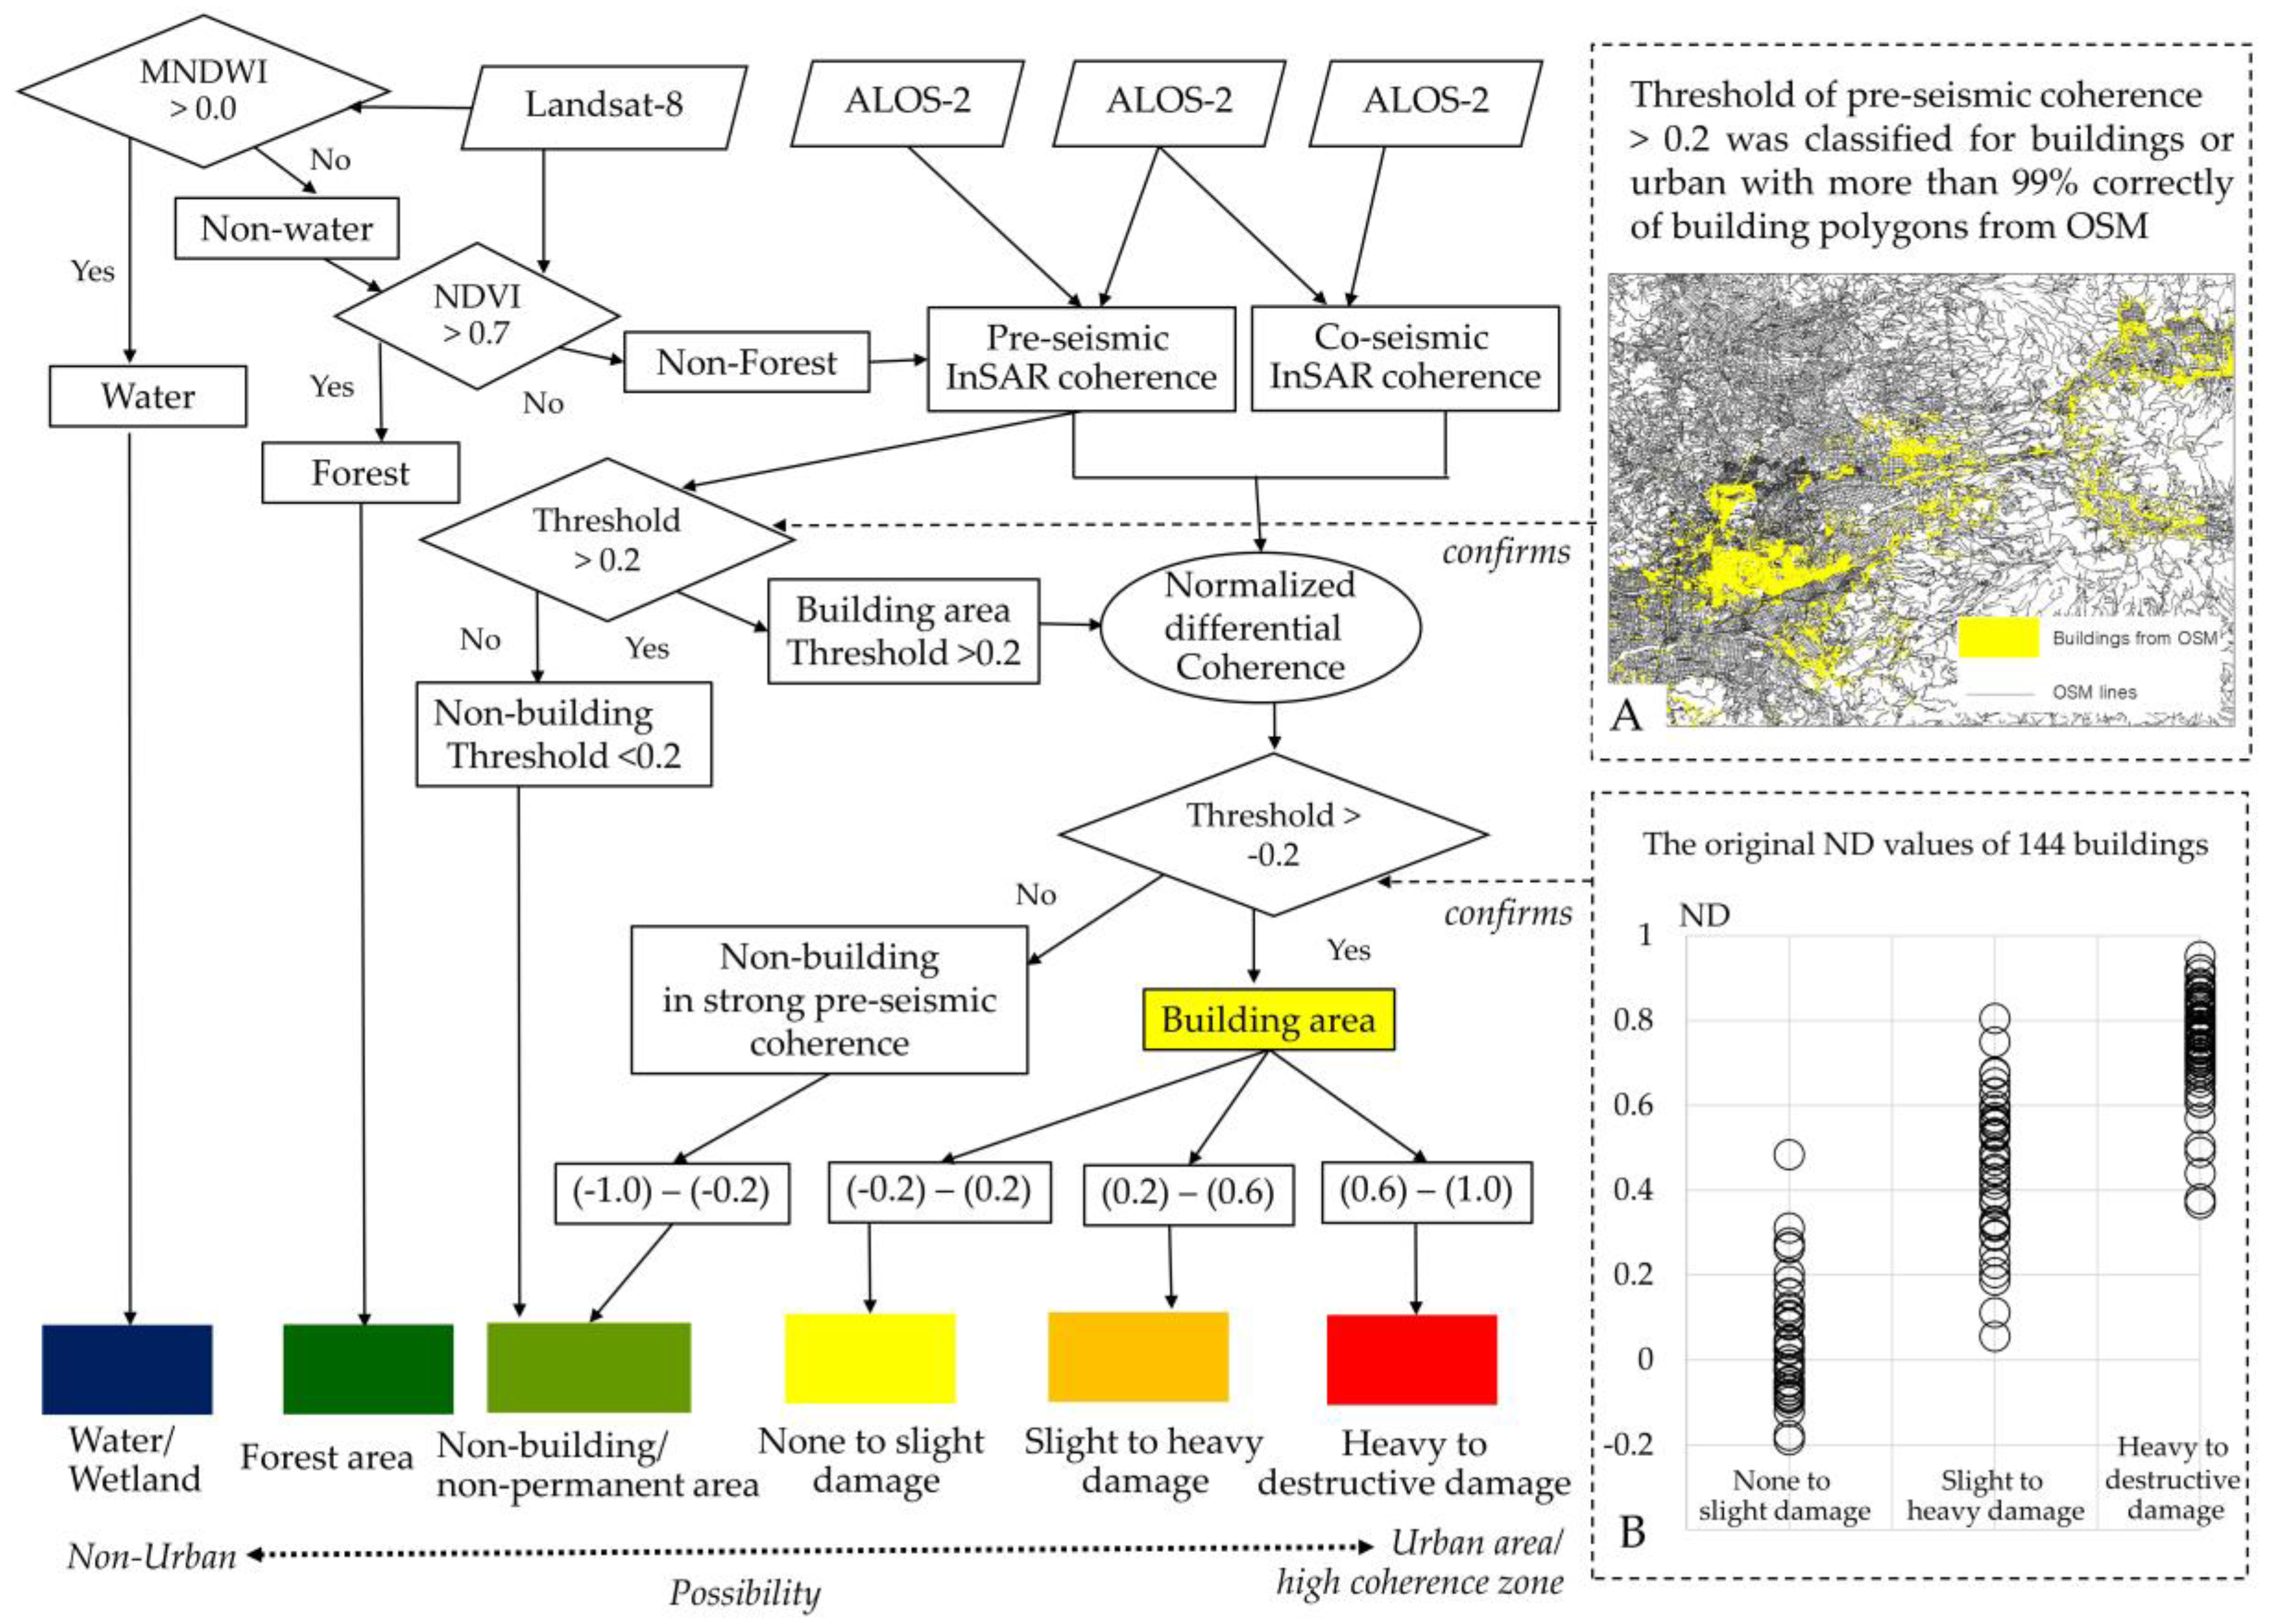
Figure 4.
Ground truth map for accuracy assessment.
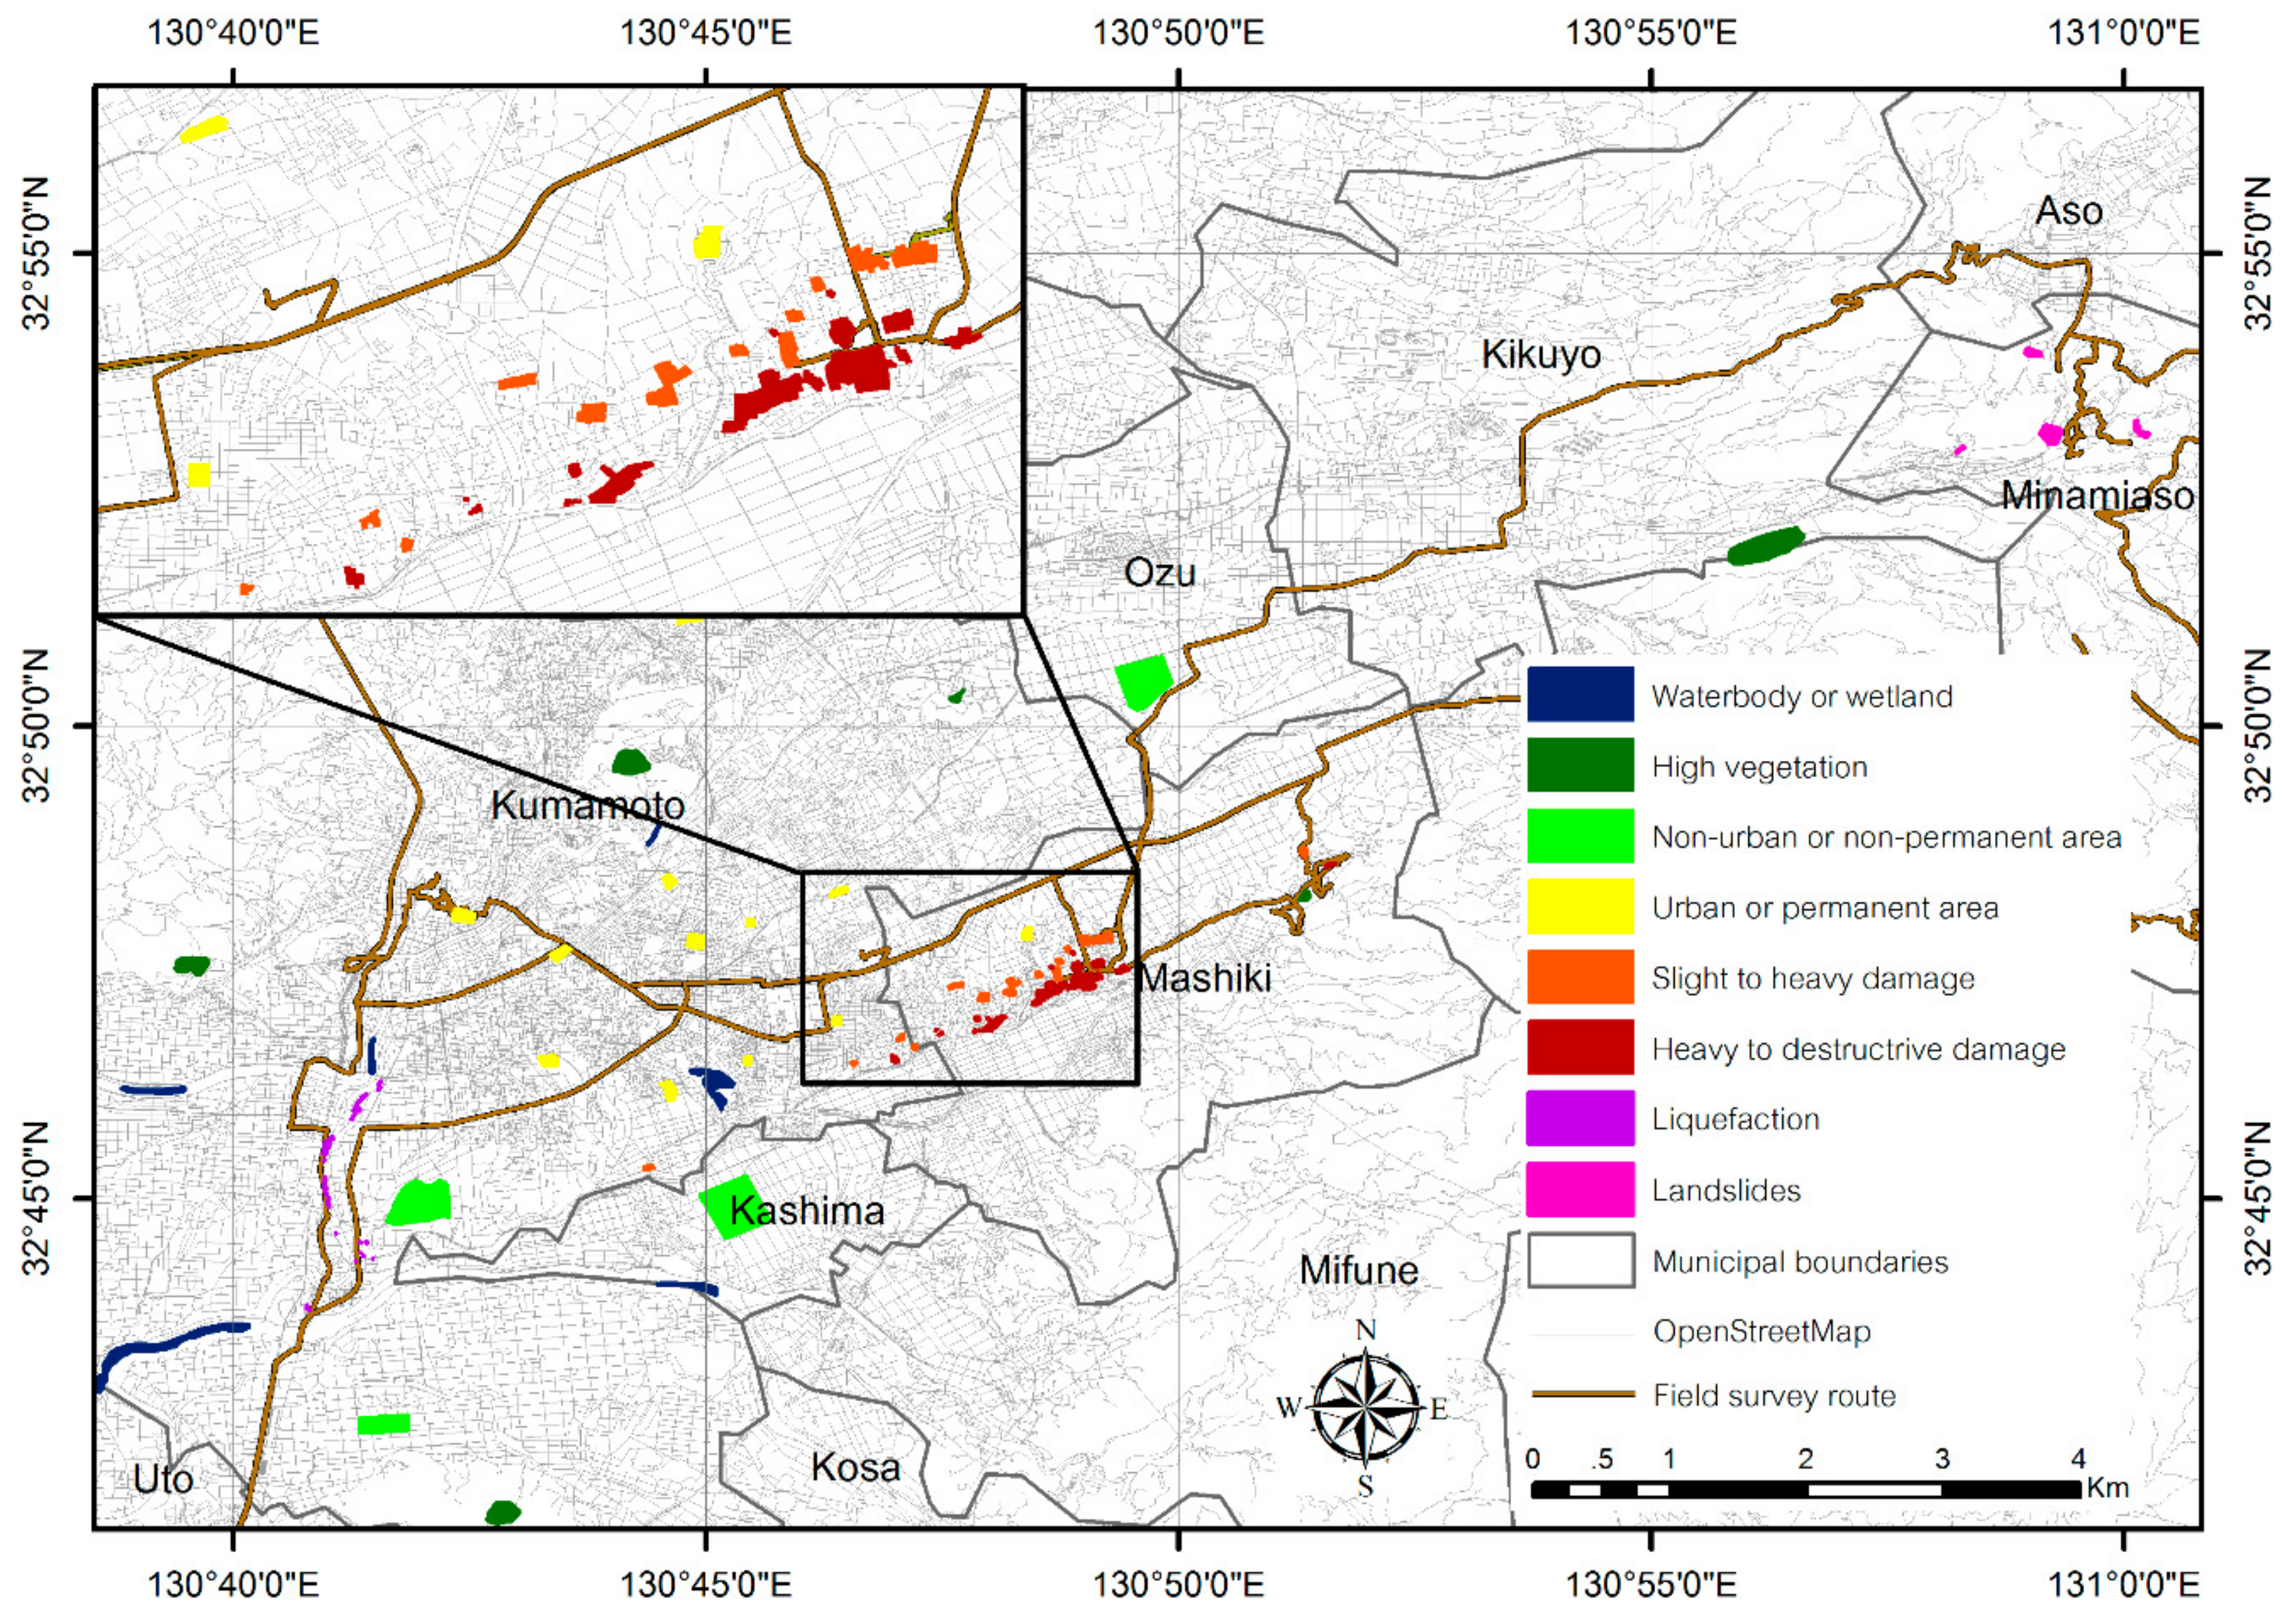
Figure 5.
Classification results for the Kumamoto earthquake damage assessment. More information is presented in Section 3.1, Buildings Damaged by Ground Motion; Section 3.2, Buildings Damaged by Liquefaction, and Section 3.3, Landslide Areas.
Figure 5.
Classification results for the Kumamoto earthquake damage assessment. More information is presented in Section 3.1, Buildings Damaged by Ground Motion; Section 3.2, Buildings Damaged by Liquefaction, and Section 3.3, Landslide Areas.
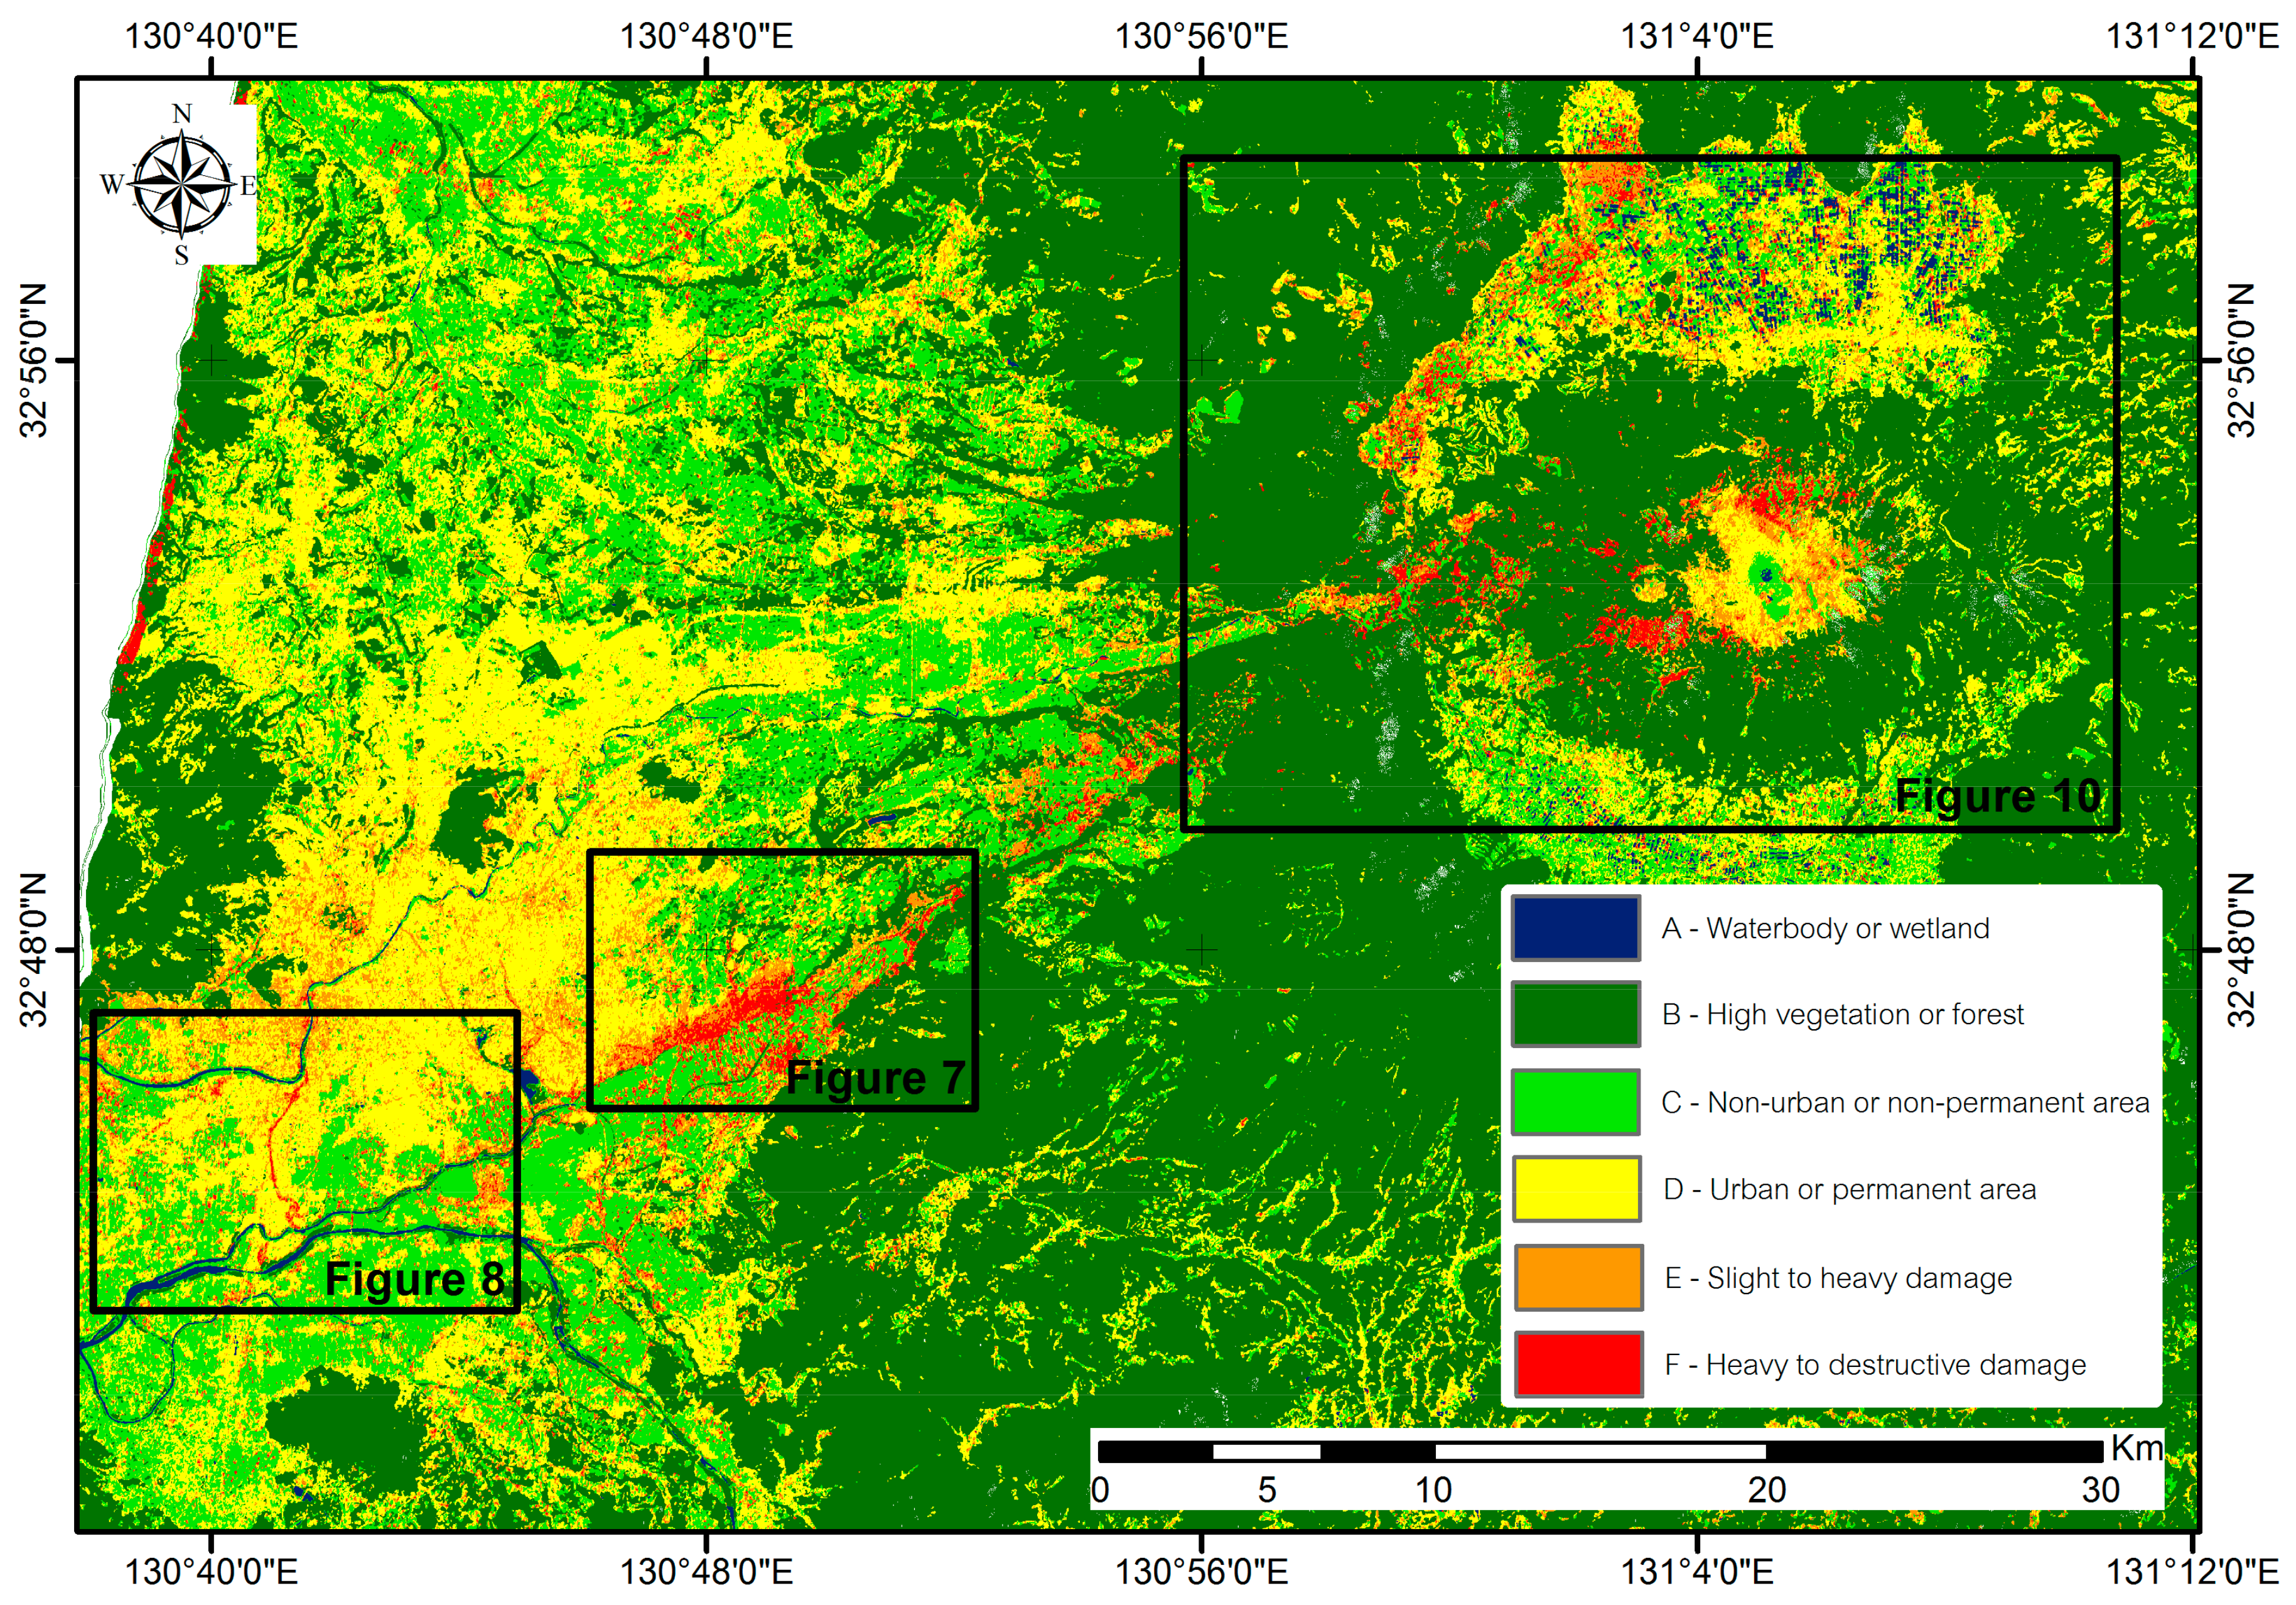
Figure 6.
Examples of the urban damage degrees considered as ground truth for the accuracy assessment. Damaged areas were observed from Google Maps (2017). Field surveys and Google Street View after the earthquake also confirmed the damage levels. The locations of ground truth examples are provided in Figure 7.

Figure 7.
Damage assessment map for the area around Mashiki town. D, E, and F are locations of ground truth examples in Figure 6.
Figure 7.
Damage assessment map for the area around Mashiki town. D, E, and F are locations of ground truth examples in Figure 6.

Figure 8.
Liquefaction map obtained through analysis and liquefaction areas from the JGS and JSCE survey (black boundaries).
Figure 8.
Liquefaction map obtained through analysis and liquefaction areas from the JGS and JSCE survey (black boundaries).

Figure 9.
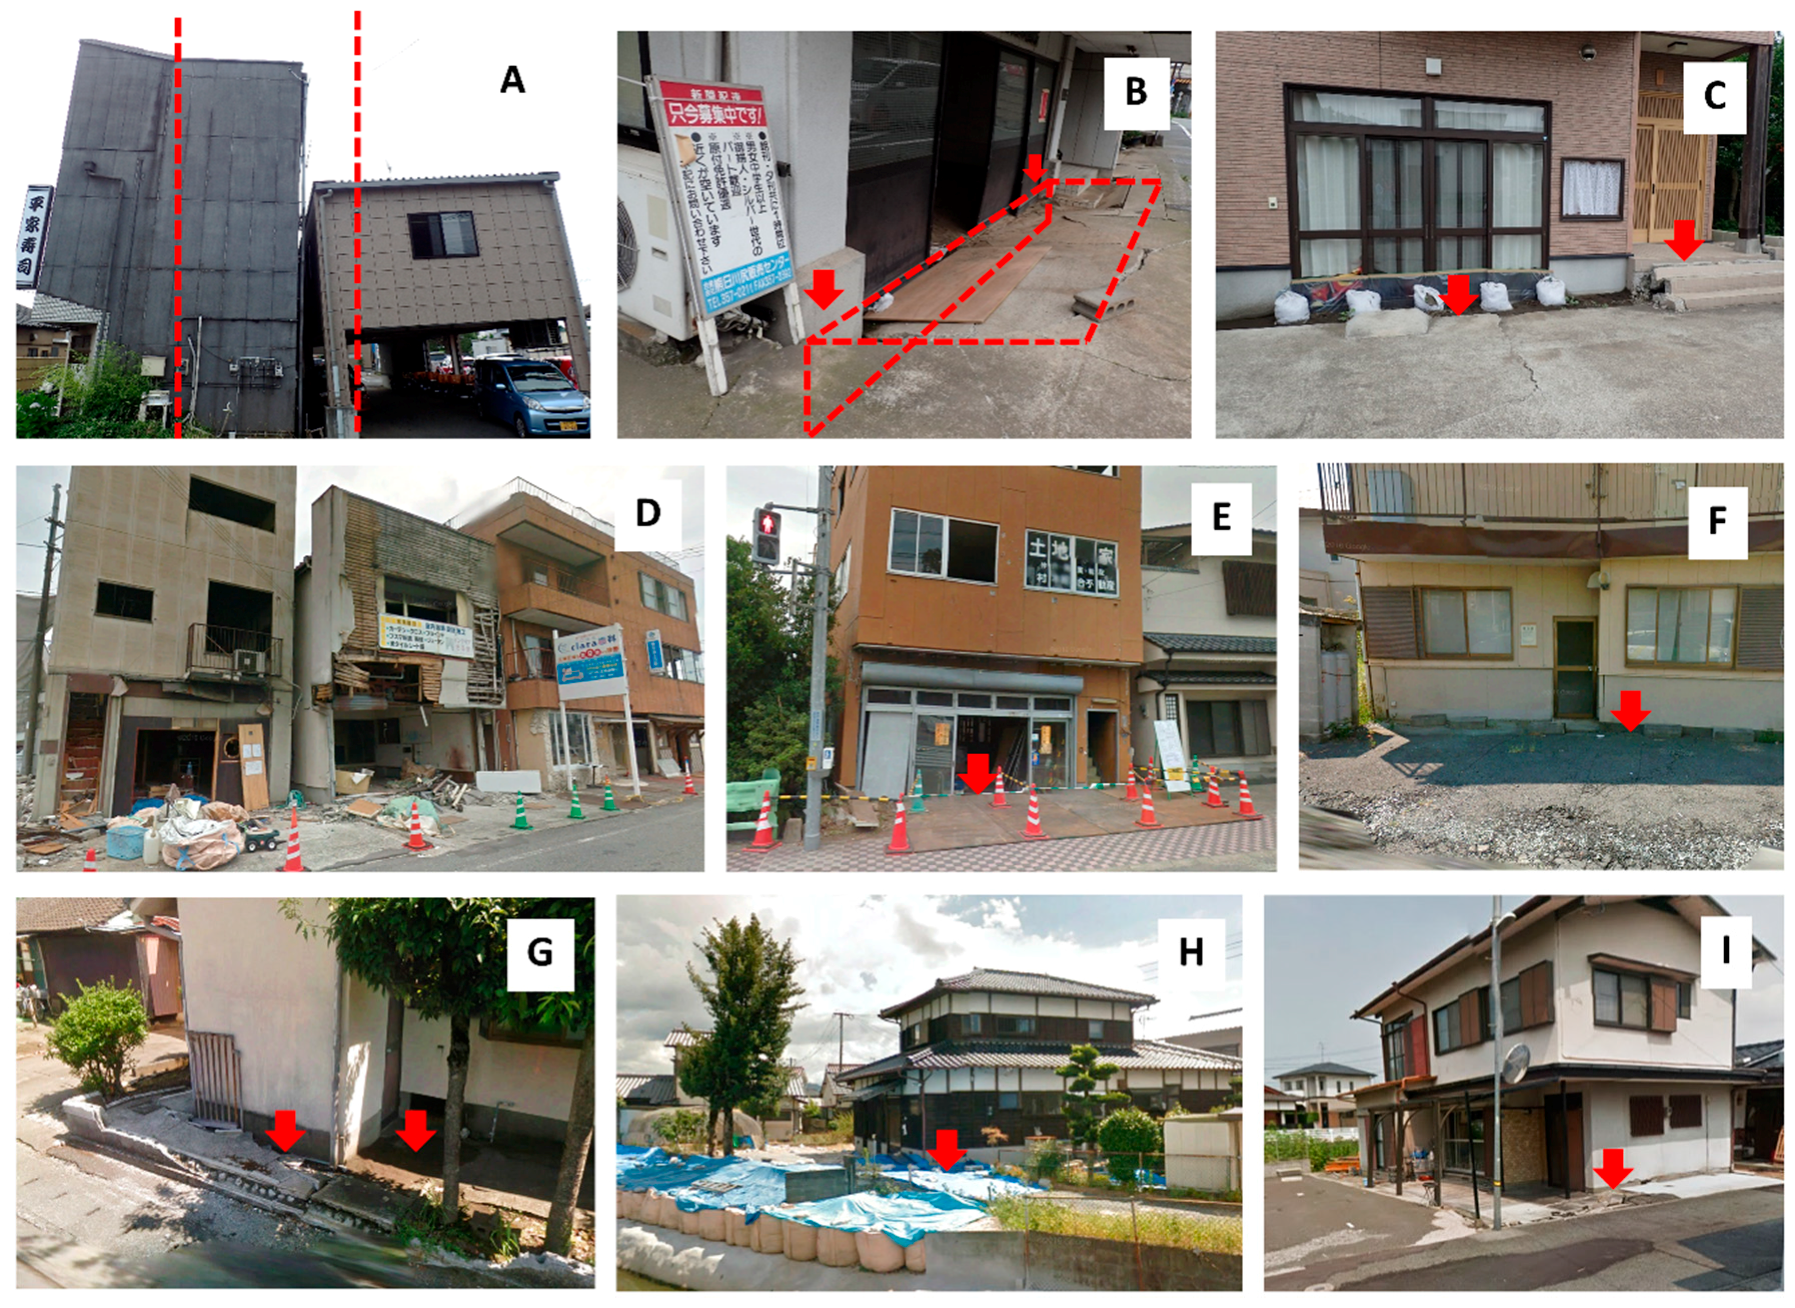
(A–I) Example locations for damaged buildings in the liquefaction area. The damage patterns are subsidence, inclination and other structural building damage. (A) building damaged by high inclination and subsidence, (B) building with high subsidence level, (D) other structural building damage, (G) sand boils around buildings and (C,E,F,H,I) slight subsidence and inclination buildings
Figure 9.
(A–I) Example locations for damaged buildings in the liquefaction area. The damage patterns are subsidence, inclination and other structural building damage. (A) building damaged by high inclination and subsidence, (B) building with high subsidence level, (D) other structural building damage, (G) sand boils around buildings and (C,E,F,H,I) slight subsidence and inclination buildings

Figure 10.
The affected areas and surrounding high vegetation levels where landslides occurred; large landslide locations are from GSI.
Figure 10.
The affected areas and surrounding high vegetation levels where landslides occurred; large landslide locations are from GSI.


Table 1.
Satellite images used in this study.
| Satellite Images | Acquisition Date |
|---|---|
| ALOS-2 before event | 2015/11/30 |
| ALOS-2 before event | 2016/03/07 |
| ALOS-2 after event | 2016/04/18 |
| Landsat-8 | 2016/05/23 |
Table 2.
Perpendicular and parallel baselines and time intervals of DInSAR data.
| DInSAR | Master (Date) | Slave (Date) | Perpendicular Baseline (m) | Parallel Baseline (m) | Time (Days) |
|---|---|---|---|---|---|
| Pre-EQ 23/2950 | 2015/11/30 | 2016/03/07 | 33.698301 | −102.815781 | 98 |
| Pre-EQ 23/2960 | 2015/11/30 | 2016/03/07 | 31.493618 | −104.774610 | 98 |
| During EQ 23/2950 | 2016/03/07 | 2016/04/18 | −88.228228 | −115.876068 | 42 |
| During EQ 23/2960 | 2016/03/07 | 2016/04/18 | −89.499914 | −116.796991 | 42 |
Note: all scenes were captured from the descending trajectory with a right look direction.
Table 3.
Confusion matrix for accuracy assessment (unit: pixel).
| Classes | A | B | C | D | E and F | Total | UA |
|---|---|---|---|---|---|---|---|
| A | 6427 | 38 | 257 | 4 | 1 | 6727 | 95.54% |
| B | 0 | 13,545 | 0 | 33 | 0 | 13,578 | 99.76% |
| C | 9 | 999 | 19,738 | 541 | 263 | 21,550 | 91.59% |
| D | 2 | 0 | 7 | 4488 | 235 | 4732 | 94.84% |
| E and F | 7 (0&7) | 51 (11&40) | 153 (3&150) | 262 (257&5) | 6681 (4921&1760) | 7154 | 93.39% |
| Total | 6445 | 14,633 | 20,155 | 5328 | 7180 | All | 53,741 |
| PA | 99.72% | 92.56% | 97.93% | 84.23% | 93.05% | Correct | 50,879 |
Overall accuracy 94.67%, kappa coefficient 0.928. PA—producer’s accuracy, UA—user’s accuracy. The ground truth of E and F classes was combined into the affected area and included building damage as well as damage by liquefaction and landslides during the evaluation of the overall accuracy. For example, the E and F classes consisted of 4921 pixels from damaged buildings and 1760 pixels from liquefaction and landslides.
Table 4.
Confusion matrix for the accuracy assessment (unit: pixel).
| Classes | D | E | F | Total | UA |
|---|---|---|---|---|---|
| D | 4488 | 191 | 44 | 4723 | 95.02% |
| E | 257 | 1606 | 229 | 2092 | 76.77% |
| F | 0 | 186 | 2900 | 3086 | 93.97% |
| Total | 4745 | 1983 | 3173 | All | 9901 |
| PA | 94.58% | 80.99% | 91.40% | Correct | 8994 |
Overall accuracy 90.84%, kappa coefficient 0.854. PA—producer’s accuracy, UA—user’s accuracy.
© 2017 by the authors. Licensee MDPI, Basel, Switzerland. This article is an open access article distributed under the terms and conditions of the Creative Commons Attribution (CC BY) license (http://creativecommons.org/licenses/by/4.0/).
Share and Cite
MDPI and ACS Style
Tamkuan, N.; Nagai, M. Fusion of Multi-Temporal Interferometric Coherence and Optical Image Data for the 2016 Kumamoto Earthquake Damage Assessment. ISPRS Int. J. Geo-Inf. 2017, 6, 188. https://doi.org/10.3390/ijgi6070188
AMA Style
Tamkuan N, Nagai M. Fusion of Multi-Temporal Interferometric Coherence and Optical Image Data for the 2016 Kumamoto Earthquake Damage Assessment. ISPRS International Journal of Geo-Information. 2017; 6(7):188. https://doi.org/10.3390/ijgi6070188
Chicago/Turabian StyleTamkuan, Nopphawan, and Masahiko Nagai. 2017. "Fusion of Multi-Temporal Interferometric Coherence and Optical Image Data for the 2016 Kumamoto Earthquake Damage Assessment" ISPRS International Journal of Geo-Information 6, no. 7: 188. https://doi.org/10.3390/ijgi6070188
Note that from the first issue of 2016, this journal uses article numbers instead of page numbers. See further details here.