
Nationwide Flood Monitoring for Disaster Risk Reduction Using Multiple Satellite Data

International Centre for Water Hazard and Risk Management (ICHARM) under the auspices of UNESCO, Public Works Research Institute (PWRI), 1-6 Minamihara, Tsukuba, Ibaraki 305-8516, Japan
ISPRS Int. J. Geo-Inf. 2017, 6(7), 203; https://doi.org/10.3390/ijgi6070203
Submission received: 31 May 2017
/
Revised: 23 June 2017
/
Accepted: 29 June 2017
/
Published: 5 July 2017
(This article belongs to the Special Issue Smart Solutions for Disaster Risk Reduction: Big Data Concepts for Disaster Risk Reduction (DRR))
Abstract
:As part of the contribution to flood disaster risk reduction, it is important to identify and characterize flood areas, locations, and durations. Multiple satellite-based flood mapping and monitoring are an imperative process and the fundamental part of risk assessment in disaster risk management. In this paper, the MODIS-derived synchronized floodwater index (SfWi) was used to detect the maximum extent of a nationwide flood based on annual time-series data of 2015 in order to maximize the application of optical satellite data. The selected three major rivers—i.e., Ganges, Brahmaputra, and Meghna (GBM), transboundary rivers running through the great floodplain delta lying between Bangladesh and eastern India—show that a propensity of flood risk was revealed by the temporal and spatial dynamics of the maximum flood extent during the 2015 monsoon season. Resultant flood maps showed that SfWi-indicated flood areas were small but more accurate than those derived from the single use of the MODIS-derived water index. The return period of SfWi-indicated maximum flood extent was confirmed to be about 20 years based on historical flood records.
1. Introduction
Future disaster risk and climate change are fundamental threats to sustainable development of all countries, including advanced countries [1]. Since the early 21st century, increases in natural disaster risk have been globally recognized; in particular, large-scale floods have been more frequent in both developing and advanced countries. Even after the adoption of the Sustainable Development Goals (SDGs), natural disasters continue to undermine efforts to implement national and international developments. In response, the mainstreaming of Disaster Risk Reduction (DRR) has been strengthened to reduce the number of people killed or affected by natural disasters including water-related disasters at local, national, regional, and global levels in priority areas defined by UNISDR [2]. The importance of understanding disaster risk was mentioned as the first priority with evidence-based policy making and practices for disaster risk management. The significance of strengthening disaster risk governance also was highlighted to manage disaster risk as the next priority. In 2015, the third UN World Conference on DRR (WCDRR) was held in Sendai, Japan, and emphasized the importance of “geospatial and space-based technologies and related services and maintaining and strengthening in situ and remotely-sensed earth and climate observations” to support national measures for understanding disaster risk and successful disaster risk communication [2]. In the context of the UN framework on climate change, the Paris agreement (COP21) was adopted by UN member nations as a new climate agreement to promote coherence and mutual reinforcement of disaster risk reduction after the Sendai Conference [1,3,4].
In the remote sensing application related to disaster risk management, multiple satellite-based flood mapping and monitoring are an imperative process and an essential part of risk assessment so that authorities and stakeholders can carry out appropriate disaster response and relief activities to achieve disaster risk reduction and mitigation under the emergency aid strategy at the early stage. Multiple satellite constellations, such as European Sentinel and COSMO-SkyMed (Constellation of Small Satellites for Mediterranean basin Observation, conceived by Agenzia Spaziale Italiana, and funded by the Italian Ministry of Research and the Italian Ministry of Defense, Rome, Italy.), and frequent revisiting time steps with wide area coverage are useful in providing valuable risk information to determine damage distribution for recovery activities and restoration planning. Recently, remote sensing technology has been rapidly developed with big data and cloud-computing technology to bring innovation opportunities with advanced computer technology, e.g., web-based tools, data storage, data processing, and data sharing [5,6]. For example, the Google Earth Engine is an advanced cloud-based geo-spatial processing platform using globally available open big data including remotely sensed imagery and geospatial datasets via petabyte-scale archives on a global scale [7,8].
During the past few decades, earth observation satellite (EOS) imagery has become one of the most credible data sources to find evidence of the earth’s surface changes. Land-cover change detection focusing on flood detection is one of the traditional themes of satellite-based observation utilizing optical and synthetic aperture radar (SAR) sensors. For example, optical sensing-based index algorithms have been designed and developed to detect surface water, relying mainly on the calculation of spectral band, such as the Normalized Difference Water Index (NDWI) [9,10] and the Land Surface Water Index (LSWI) [11,12]. The Moderate Resolution Imaging Spectroradiometer (MODIS), one of the main contributors to global mapping and monitoring, is able to generate near-real-time global flood maps on a daily basis [5,13,14,15,16]. At the same time, SAR systems are currently the most effective sensor to detect earth surface dynamics because they are independent from solar illumination and relatively insensitive to atmospheric weather conditions, owing to their near all-weather/day–night acquisition capabilities [17,18,19,20,21].
For the first step before data processing, the selection of suitable sensors that are both cost effective and the availability of free charge global dataset and open data source are critical issues in the development of disaster risk maps [22]. In order to provide more accurate disaster information such as flood extent in inundated areas, multiple earth observation time series data could be a powerful tool in regular preparedness and emergency response to generate uniform information covering large areas. For the next data-processing step, development of advanced global flood mapping algorithms is a key process to create a flood indicator that produces essential risk information beyond the traditional issue of flood mapping for disaster risk reduction. The main purpose of this study is to detect and monitor the maximum extent of an annual nationwide flood in a transboundary river basin using multiple satellite data to minimize the limitations of optical and multispectral images. The proposed synchronized floodwater index (SfWi) was applied to a Bangladesh floodplain in a monsoon region. It was then tested to maximize the utilization of optical satellite sensors based on annual time series data with in-situ water level data. Imagery-derived products are able to support flood disaster management including forecasting and prediction of flood inundation through model calibration of optimized parameters and validation with a final product of hydrological flood simulation. As “flood disaster big data”, based on the multi-dimension and multi-time-series data from multi-satellites, this approach will be able to contribute to the production of an accurate flood map at a national level in terms of an image fusion and synthesis, under the framework of nationwide monitoring for supporting emergency risk management and flood risk reduction.
2. Materials and Methods
2.1. Data Used
The availability of data that is free and open for public use is a major challenge to developing countries in search of an effective solution at both national and regional levels at the early stages of disaster management. In this study, three primary annual time-series data sets were used to detect the nationwide 2015 flood in the transboundary river basin of Ganges, Brahmaputra, and Meghna (GBM) rivers. Emergency observation data with high spatial resolution images were also used when responding to requests from emergency users and agencies in cooperation with Sentinel Asia. Table 1 lists the used data including designed process for 2015 flood detection and the applicable data for near real-time flood mapping.
First, the annual time-series data of Moderate Resolution Imaging Spectrometer (MODIS) were used to mainly detect floodwaters in the case of the 2015 flood. In particular, temporal and spatial changes of surface water bodies—focusing on floodwater—were detected for one-year flood mapping at an international river scale from the MOD09A1 (Terra) level-3 eight-day composite surface reflectance products, one of the MODIS products in the sinusoidal projection (swath: 2000 km, spatial resolution: 500 m), containing the best observations of bands 1, 2, 3, 4, 5, 6, and 7 (centered at 648, 858, 470, 555, 1240, 1640, and 2130 nm, respectively), during an eight-day period [23]. Next, the level-3 MODIS Land Surface Temperature (LST; unit is Kelvin) product was also used to confirm surface water bodies and floodwaters collected within that eight-day period. Then, to improve the accuracy of flood mapping based on the Modified Land Surface Water Index (MLSWI), the 2015 water level data, collected at three stations (Sirajganj, Baghabari, and Bhagyakul of the Brahmaputra River) and provided by the Bangladesh Water Development Board (BWDB), were used. BWDB has a nationwide hydrological network, which measures surface water levels and water discharges five times a day [24]. This procedure compared a MODIS-derived water index (MLSWI) with in situ measurement data for verification at the representative training sites [25,26].
In addition, investigation was conducted on the availability of multiple satellite data in the Asia Monsoon region for near real-time flood mapping based on disaster framework shown by Figure 1. With typical sensors for water-related disaster risk reduction, the Japan Aerospace Exploration Agency’s (JAXA) Advanced Land Observing Satellite (ALOS-2 launched in 2014) Phased Array-type L-band Synthetic Aperture Radar 2 (PALSAR-2) data will be able to use for verification of the flood-affected areas and the maximum extent [27,28]. In case of the 2015 flood, emergency observation imagery (i.e., ScanSAR mode: 350 km swath width and 100 m spatial resolution) was acquired at 05:53 AM (UTC) 5 September 2015 during the flood in response to requests from emergency users, including the International Centre for Water Hazard and Risk Management (ICHARM). Initiatives of international cooperation in space—i.e., International Chart and Sentinel Asia—have been providing observation data and nationwide monitoring in emergencies to mitigate disasters including transboundary river-basin floods [29,30]. Also, Advanced Himawari Imagers (AHI: Himawari-8 was launched in 2014 and Himawari-9 in 2016) onboard the Japanese Geostationary Meteorological Satellite (GMS) as multifunctional transported satellites (MTSAT) have been provided as convincing data sources. Real-time Himawari 8 and 9 imageries will be able to contribute to the monitoring and forecasting of floods covering the East Asia and Western Pacific regions. The data of Himawari-8 imagery provides rapid assimilation of flood disaster big data having a file size of 329 GB per day, 930 MB per 10 min, whereas total data volume of MODIS data is just below 100 MB per day [31].
2.2. Nationwide Flood Mapping Framework
2.2.1. National Disaster Monitoring: Scheme A
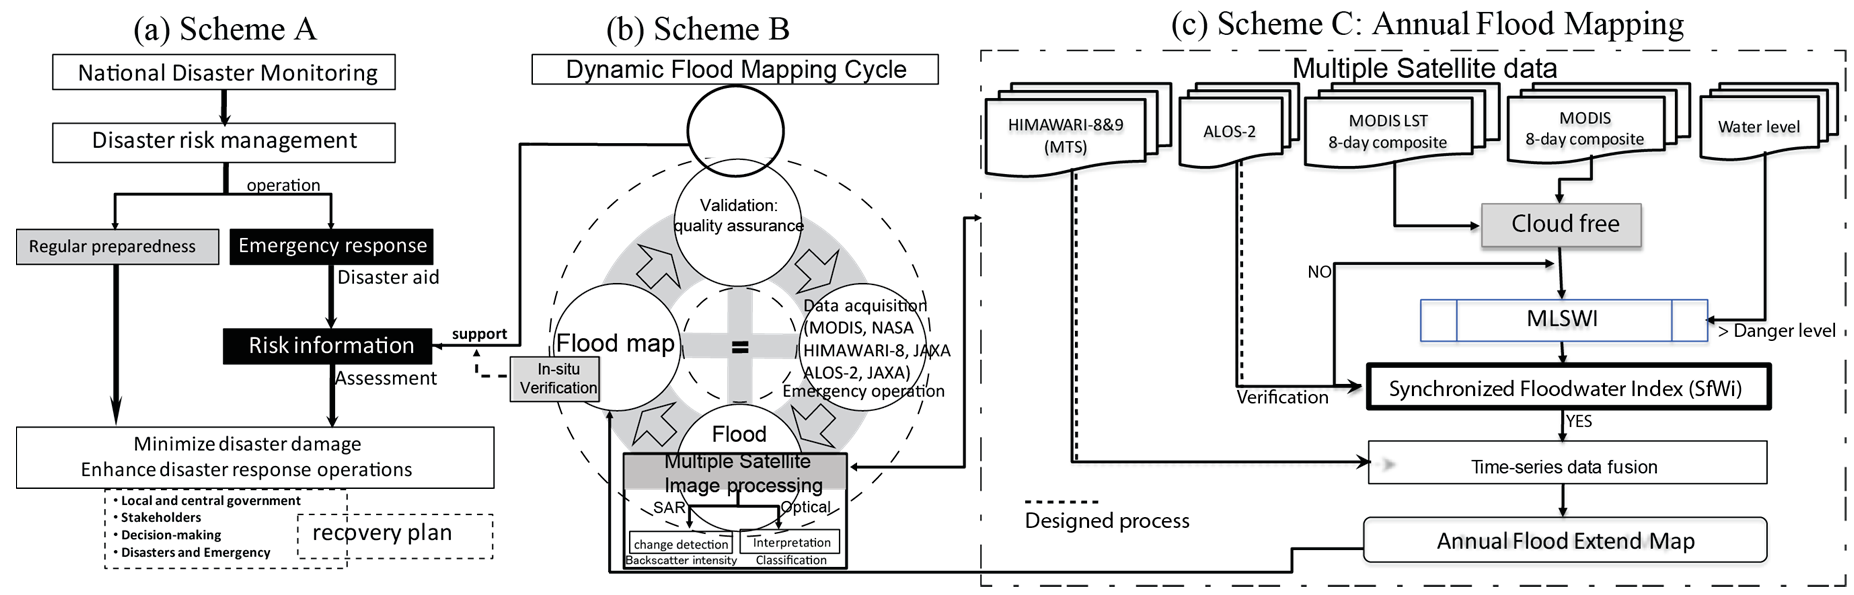
In response to the need for national flood monitoring, the goal has been set to develop a novel flood monitoring system based on a new flood monitoring framework and index. After data acquisition, an advanced global flood-mapping algorithm was applied to perform surface water change detection, specifically focusing on dynamic flood mapping based on national disaster monitoring in Figure 1. The conceptual framework of Figure 1a, Scheme A, shows that national land monitoring is necessary for both regular preparedness and disaster emergency response to support operational activities, especially emergency planning and action using multiple satellite data. At the same time, numerical models can be combined for flood reproduction and prediction to support the enhancement of disaster response operations using hydrological simulation and flood forecasting models in national and international river basins.
2.2.2. Dynamic Floodwater Mapping Cycle: Scheme B
Using multiple satellites, Scheme B, a dynamic floodwater mapping cycle, links to the component of risk information to provide rapid flood maps. Figure 1b shows the four main steps in the dynamic flood mapping cycle, i.e., data acquisition, preprocessing, multiple image processing of SAR and optical images, and validation. This cycle is proposed in order to achieve and improve rapid response operations in consideration of large and long duration floods.
2.2.3. Annual Flood Mapping: Scheme C
In Figure 1c, a robust pixel-based detection of surface water changes is widely applicable to create an accurate nationwide flood map at both national and transboundary river scales using a synchronized multiple index such as MODIS-derived annual Synchronized floodwater index (SfWi) based on MLSWI [25,26]. In particular, a time-series change detection of pixel-based classification is connected with annual hydrological data, i.e., water level, to identify and estimate the flood duration and the starting and ending time of the event. In spite of the limitations of satellite data—e.g., cloud cover, mixed pixel, and spatial resolution—the annual flood map is of great value to overview and understand an actual flood situation to assist disaster monitoring and response efforts to minimize disaster risk and damage.
2.3. Pilot Country: Bangladesh
Bangladesh was selected as the pilot country according to the first priority target from the preceding research. For example, Kwak et al. (2012) reported that Bangladesh was the country with the highest future flood risk among 14 Asian developing countries in the case of a 50-year return period flood under climate change scenarios [4,32]. Also, Bangladesh is one of the most flood-prone countries in the Asian monsoon region and suffers from flood disasters every year due to its geographical location and extreme rainfall; a rainfall event in 2010 recorded the highest annual rainfall of 5690 mm in the northeast of Bangladesh and the highest annual total rainfall of 4939 mm at the Sylhet station. Table 2 shows floods of different return periods with their corresponding averages of the total inundated area from historical records after 1950 in Bangladesh. For example, two-year return period floods have caused, on average, an inundated area of about 20% of the total area of the country. Among the extremely large floods after 1950, the flood in 1998 (return period: 100 years) affected approximately 100,200 km2, or about 68%, of the total area of the country. Four events were recorded as the most devastating [33,34]. Figure 2 shows water level gauge stations (points) with the differential river water depth as an overflow vulnerability indicator in the nationwide river network. The differential river water depth (=Hmax − DL, unit: meter) was calculated by the difference between a historical highest water level and danger level [24]. Red and blue circles of water level gauge stations are categorized as the low differential water depth with the high vulnerability and the high differential water depth with the low vulnerability, respectively.
2.4. Synchronized Floodwater Index
2.4.1. Modified Land Surface Water Index (MLSWI)
MLSWI was used for floodwater detection in Equation (1) [25,26]. MLSWI can be developed and applied to temporal processing to extract floodwater using annual time-series data such as the cloud-free 46 images in 2015. After adjusting the range of MLSWI according to land classification at training sites in the Sirajganj district (2480 km2), the detected floodwater areas were validated to be representative of the seriously flood-damaged district, and had been listed by BWDB as one of the priority areas for the implementation of flood mitigation measures. The time-series MLSWI of floodwater was matched with the time-series water levels observed in 2015. In addition, the behavior of the time-series MLSWI was evaluated and analyzed with in-situ data, ground truth samples.
where ρ is the atmospherically corrected surface reflectance of MODIS, ρNIR is band 2 (NIR: 841–876 nm), ρSWIR is band 7 (SWIR: 2105–2155 nm).
2.4.2. Time-Series Synchronized Floodwater Index (SfWi)
SfWi was developed by taking advantage of the similarity in behavior between the flood area from MODIS data and the flood hydrograph in the part where the water level exceeds the flood danger level (DL). SfWi is a new conditional indexing algorithm capable of flood detection with annual temporal and spatial changes using time-series MLSWI-derived flood maps with observed water level data exceeding DL in Equation (2). Based on changes in the time-series MLSWI values (0 < MLSWI < 1), SfWi was calculated using the moving average according to the gradient of MLSWI (the temporal interval is 40 days within five points) over the optimal threshold value (Th) and the threshold of the flood danger level (DL) at the three gauge stations (Sirajganj: 13.35 m, Baghabari: 10.40 m, Bhagyakul: 6.3 m).
where t is the composite-day-of-year (DOY) in the year of acquisition, x is MLSWI values ranging from 0 to 1, y is the river water level at gauge stations, Th is the optimized threshold value of MLSWI, and DL is the flood danger level of river water when a flood occurs.
SfWi indicates the frequency of cumulated annual floodwater by the time-series MLSWI’s value calculation with an unsupervised binary classification from the moving average calculation counted on the three sequential points (of MLSWI) exceeding flood danger level, at the same time utilizing existing points (of MLSWI) during periods of flooding as the major threshold value for flood extent mapping.
3. Results
Overall, this study confirmed the validity of the proposed method because the in situ hydrograph in Figure 3 and the high-resolution SAR data in Figure 4 show that the flood propagation of 2015 was in good agreement with the observation data. As a result, this method can be an effective tool with the capability of performing change detection for nationwide flood extent extraction directly related to risk changes, strongly depending on the temporal and spatial dynamics of hazard such as a maximum flood extent. The results of the flood dynamics are summarized as follows.
3.1. Validated Synchronized Floodwater Index
3.1.1. Time-Series MLSWI Coupled with Water Level
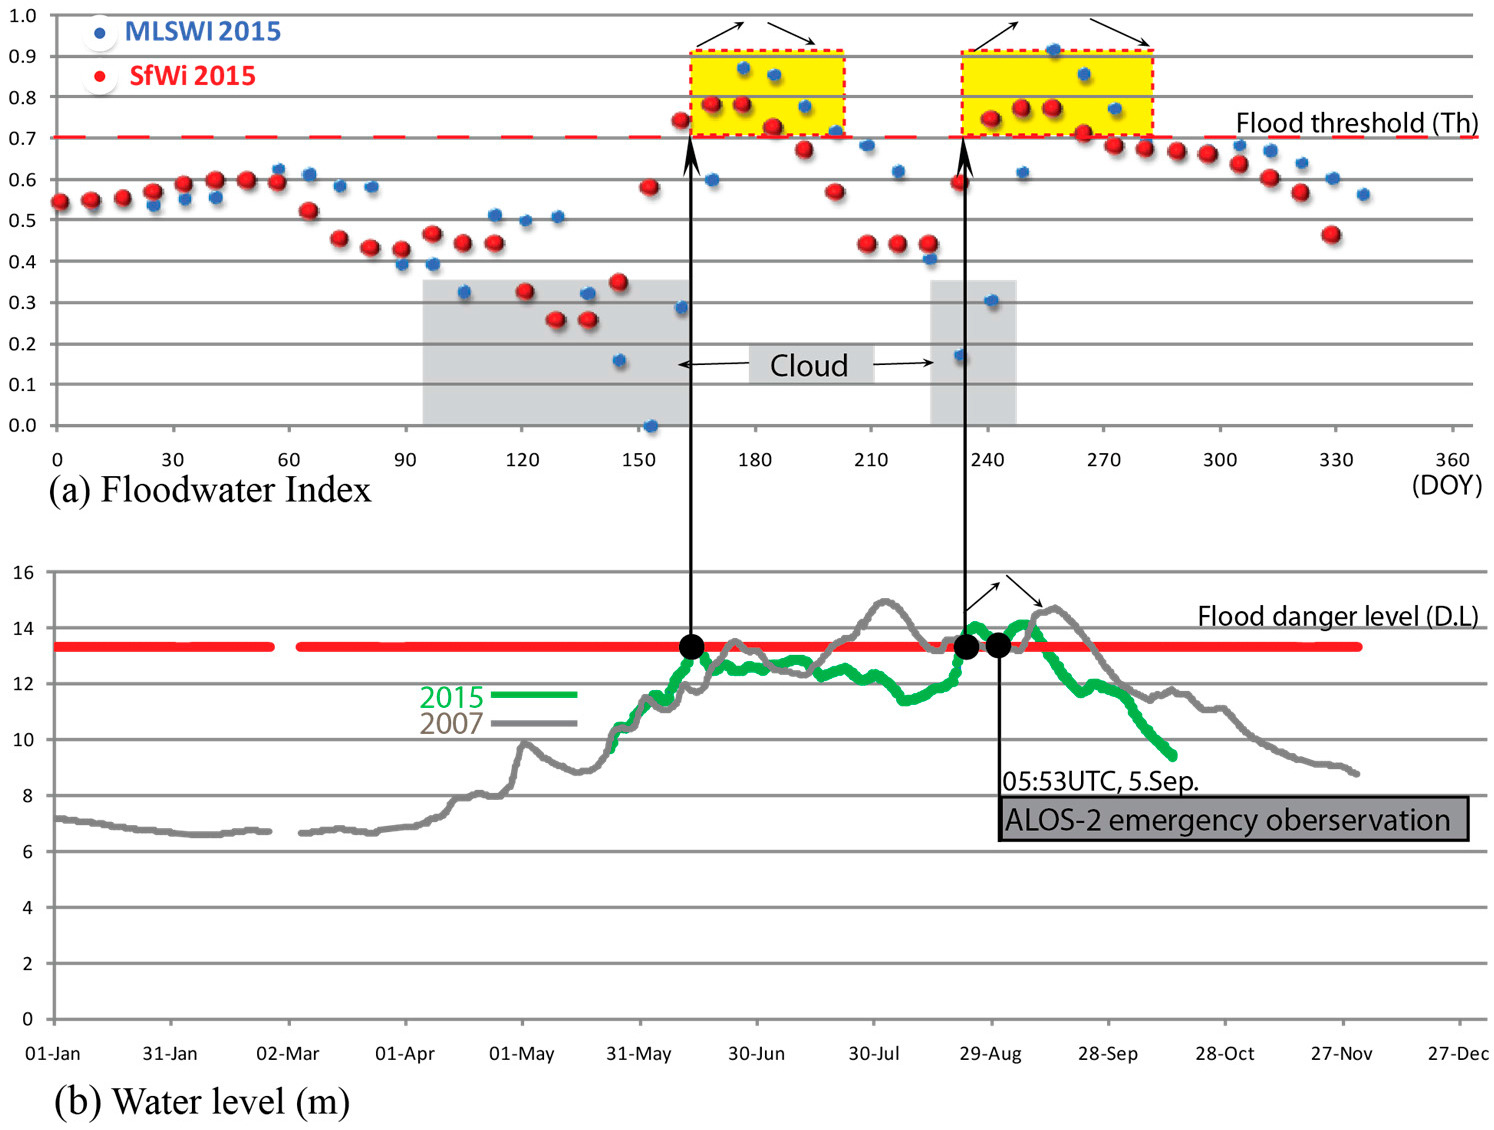
In order to reduce cloud-error effect particularly during the monsoon period, pixels containing clouds 10 percent or less were selected through pixel-based classification. Then the flood area was validated and modified using time-series MLSWI with water level data from 2015. Figure 3 shows the time-series annual behaviors of average MLSWI calculated by the single use of MLSWI (blue dots) (Figure 3a) and water level (Figure 3b). The figure also shows the behavior of SfWi (red dots) to compare it with that of water level, based on the data collected at the training sites. The comparison finds that SfWi exhibits two peaks on 10 June and 21 August 2015, when the water level exceeded the flood danger level. The global threshold of MLSWI, which is the MLSWI value at the time of floodwaters exceeding the flood danger level, was optimized to over 0.7 of MLSWI by means of supervised classification, i.e., flooded rice field and river water, based on the samplings at the training sites in the Sirajganj district. In particular, time-series SfWi was proved by ALOS-2 data to clarify the behavior of floodwater. In Figure 3a, the blue dots with the lowest MLSWI values at the second peak of the grey zone were confirmed as surface or flood water covered by cloud validating the floodwater pixels of MLSWI in comparison with the water pixels from backscattering of ALOS-2 data.
3.1.2. In Situ Field Survey
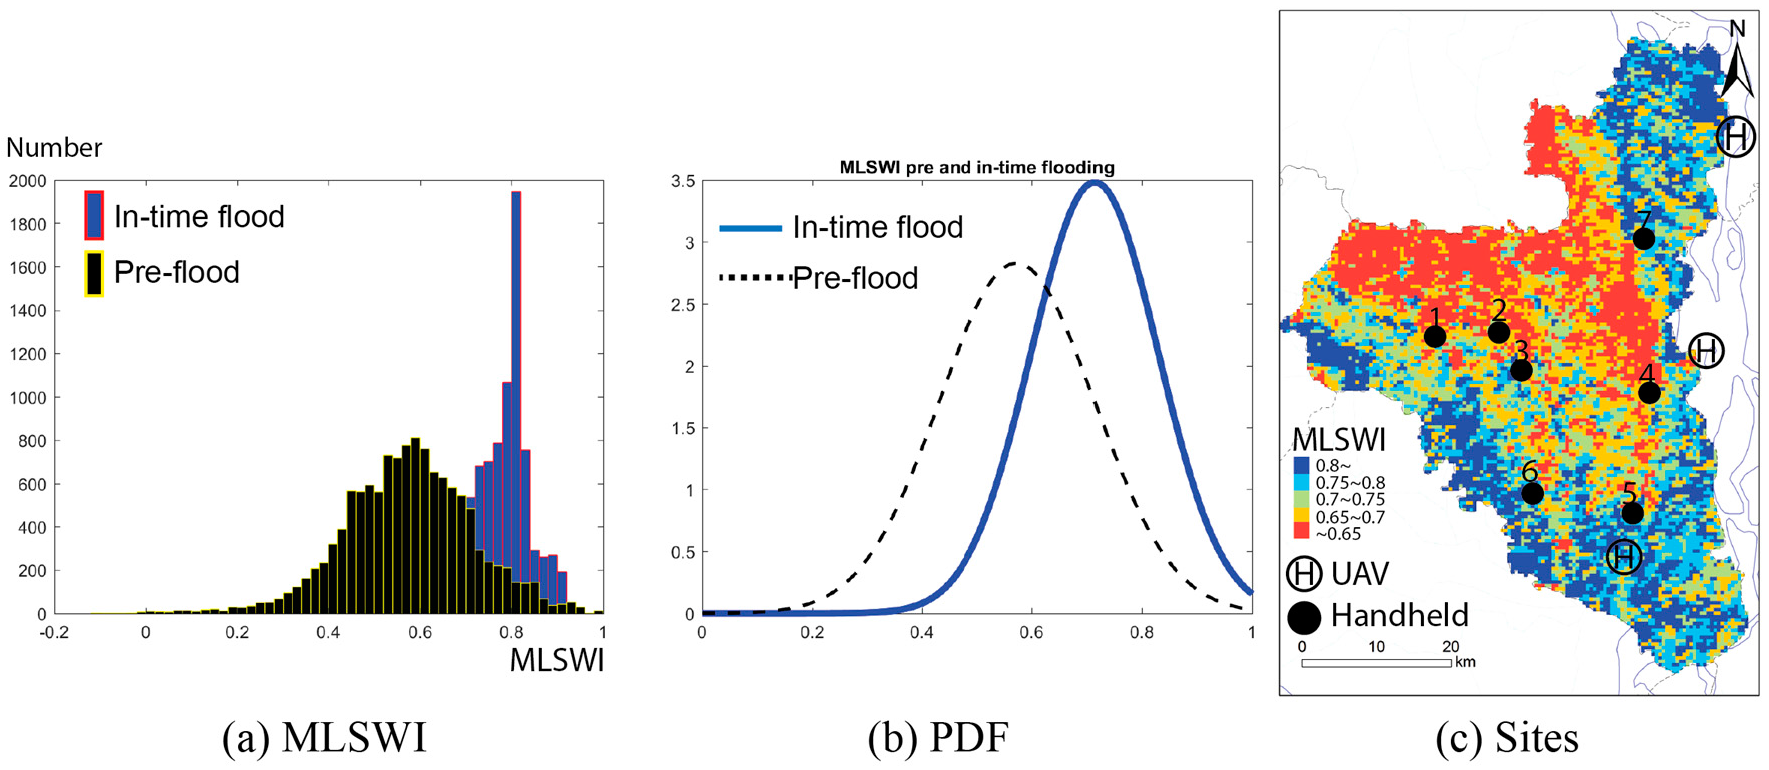
In order to confirm and validate to the MLSWI’s behavior, the probability density function (PDF) histogram method was employed to directly compare the difference of pixel-based distributed MLSWI between flood and flood-free areas in the case of the 2015 flood. Figure 4a shows the distributed histogram of MLSWI’s pixel values both before flood (black bar) and during flood (blue bar) in the entirety of the Sirajganj district. After the flooding, Figure 4b shows remarkable change from increased MLSWI closed to 1. To understand the flood situation and micro-geographical information, a small Unmanned Aerial Vehicle (UAV: Phantom2 vision+ quadcopter with a flight control system, DJI Technology Co. Ltd., Shenzhen, China), equipped with a small high-vision camera for aerial photos and video shooting, was used to collect ground truth data from three representative inundated areas in Sirajganj district, including those in the flood on 2–7 September 2015 (circle of H in Figure 4c). The UAV (Phantom2 vision+) captured images of river water and damaged rice fields covered with floodwaters about two meters deep at the peak of the flood. Extensive field surveys were also conducted to obtain total ground truth samples using a FieldSpec® HandHeld 2 spectroradiometer by the Analytical Spectral Devices Inc. (ASD, Colorado, USA), at seven homogeneous training sites (black points, 1–7, in Figure 4c), in which MLSWI’s pixel values at 500 m spatial resolution were confirmed. The field-portable HandHeld 2 provides spectral features with a wavelength range of 325–1075 nm, at an accuracy of 1 nm. These sites were selected by the pixel-based classification of MLSWI between flood-prone and agriculture-dominant areas located in the area of 60%–100% damage levels that represent the whole of the Brahmaputra flood plain of Bangladesh [35].
3.2. Nationwide Annual Flood Mapping
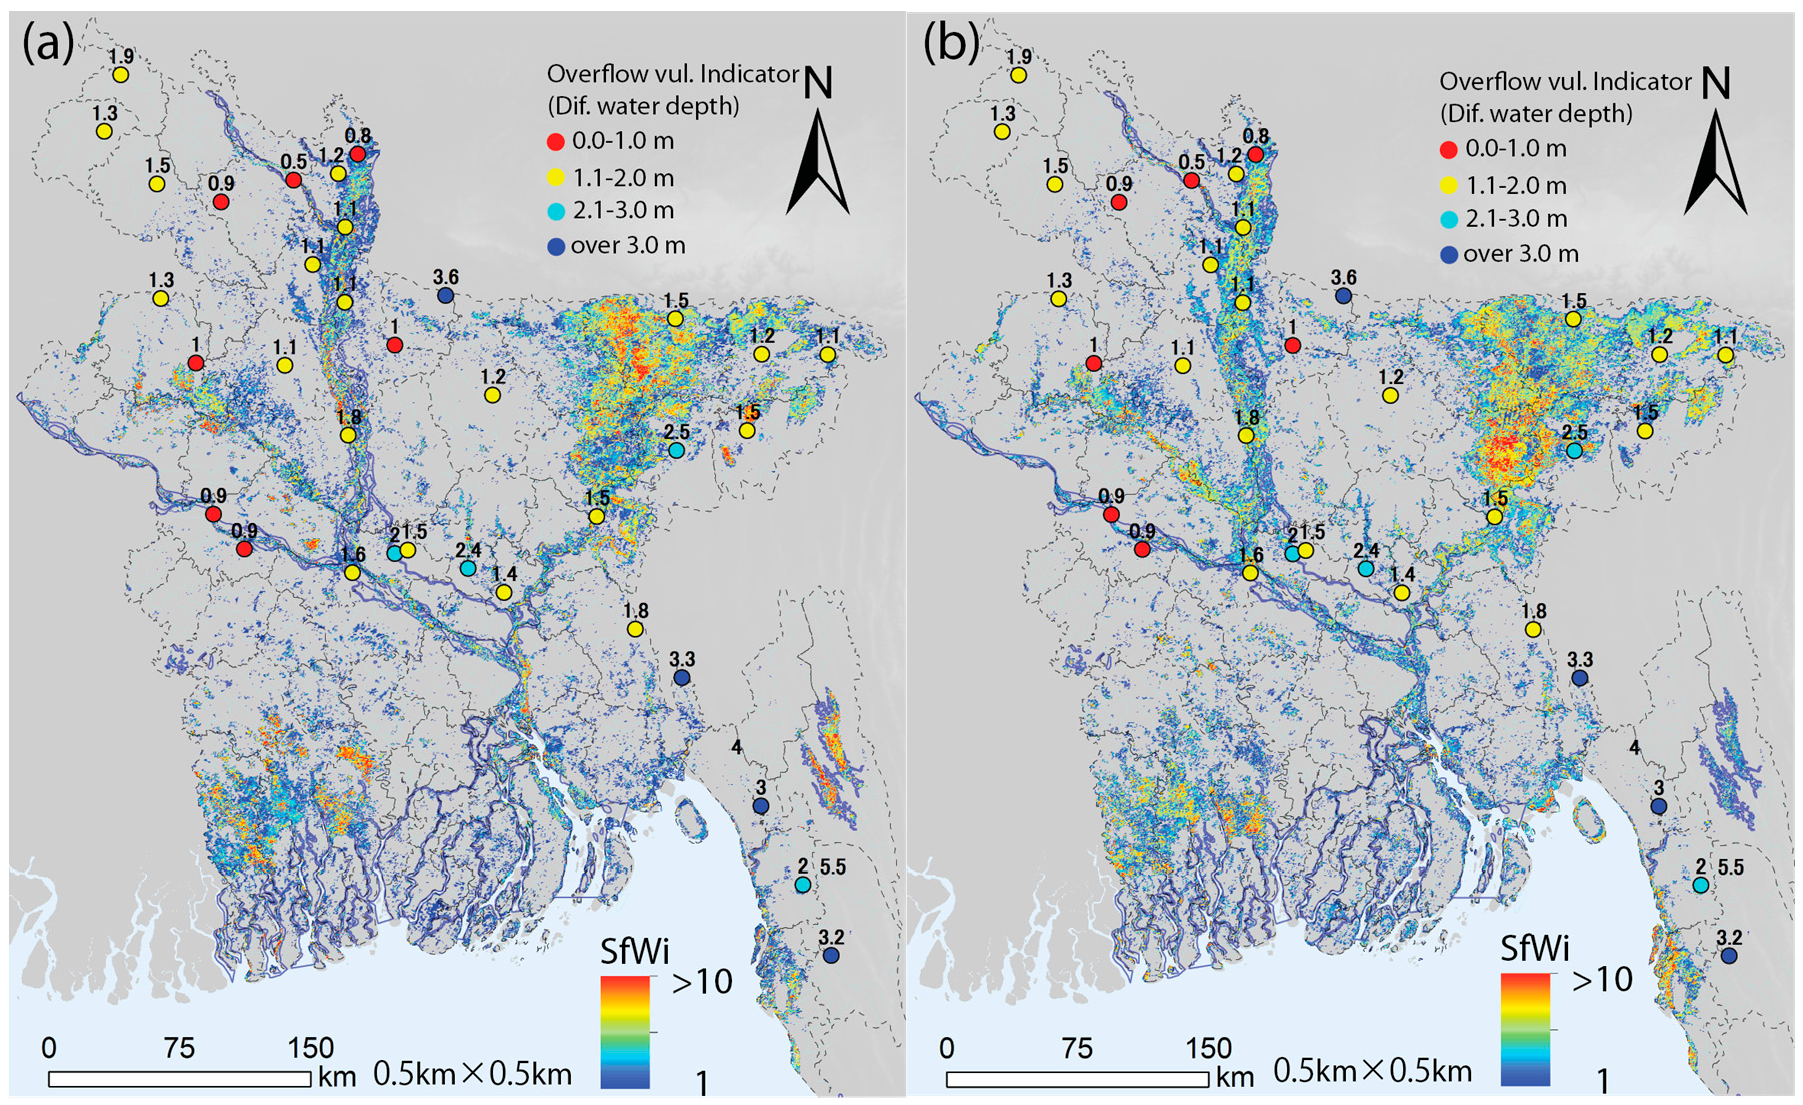
After better understanding the characteristics of the 2015 flood from the in situ and hydrological data, the satellite-derived water index (SfWi) was employed to generate an annual flood extent map. The characteristics of the hydrograph during the 2015 flood (Figure 3) represent a clear relationship between the observed water levels and the SfWi’s values, an index designed to show progress in flood extent. The resultant annual flood extent map revealed a remarkable change in the detected extent of floodwaters in 2015, compared with an average annual flood. Figure 5 shows the maximum flood inundation extent with different periods of flood duration at different locations. The SfWi-derived flood map was produced by counting how many times the floodwater pixel appeared at a certain location in the 46 images. The map shows that the annual SfWi increases over the optimal threshold (over 0.7 of MLSWI) in the part where SfWi = 1 for all MLSWI > 0.7 (yellow zone in Figure 3), which started when the water level reached the flood danger level on 21 August 2015. The red pixels, derived from SfWi, indicate the locations with 5–10 water-pixel appearances based on the eight-day composite images, which estimate the maximum flood duration of about 80 days. The light blue pixels, also derived from SfWi, indicate the locations with 1–4 water-pixel appearances, or a flood duration of about a month. The flood propagation was in good agreement with the timing of the water level exceeding the flood danger level, which is 13.35 m above mean sea level (MSL) in the case of the 10-year return period flood event—particularly at the Sirajganj station—compared with historical records in Table 2 [33,34]. Moreover, the SfWi-indicated flood extent is represented in Figure 5 with strong relationship between hydrological responses highlighted by yellow and red point stations as the overflow vulnerability index. In the case of the monsoon regional flood, I have found that the clear relationship between SfWi-indicated flood area and flood danger level is a key flood indicator. In particular, after the peak water level on 6 September 2015, the maximum flood inundation extent represented larger flooded area than before the peak water level. In Figure 5, the two maps show that the annual maximum inundation area from SfWi is estimated at 32% (29,900 km2) of the total area of Bangladesh. All these results confirmed that the flood plain area near the Brahmaputra River is the most vulnerable to flood hazard and risk in Bangladesh.
4. Discussion
The advantages of rapid nationwide flood mapping are discussed in this section. The good agreement between the behaviors of SfWi and the water level suggests that the proposed synchronized floodwater detection algorithm can contribute to a comprehensive and instant understanding of a cross-boundary flood over Bangladesh and northeastern India. The algorithm makes it possible to identify large flood areas more accurately and rapidly than the single use of a water index, such as MLSWI, despite limited data availability in terms of data acquisition and weather conditions.
However, a flood mapping algorithm—i.e., floodwater index and time-series image fusion—need further improvement with modified band calculation and combination of additional data based on better understanding of an actual flood situation and its characteristics. For example, water level data collected at over 80 widely dispersed gauge stations should be continually analyzed and converted to spatially- and temporally-distributed hydrological data with a river network. In addition, DEM-based flood simulation coupled with a distributed flood danger level can contribute to increasing the accuracy of estimating the maximum flood extent. In numerical flood simulations, it is also important to identify critical parameters—such as flow velocity, flood discharge, and sediment transport load—that affect the magnitude of flood propagation [36,37].
Several satellite images, taken at different times from different types of sensors, are required to collect comprehensive risk information in order to detect a large volume of floodwater over widespread areas. Taking advantage of both optical (MODIS) and SAR (ALOS-2) data during flooding, due consideration should be given to two main challenges between two types of change detection: MODIS-derived index-induced change detection using different band combinations and SAR-backscattering intensity-derived change detection. In this study, the first challenge is to estimate accurate flood area using a pixel-based water fraction approach with multiple satellite data with different spatial resolutions, which influence the detection of water body in a pixel. The second challenge is to synthesize pixel-based images from multiple satellite data—i.e., optical and SAR imagery—and produce dynamic flood maps.
Utilization of big data processing must be in place prior to a disaster in order to mitigate disaster risk. For example, the quasi-real-time Himawari 8/9 gridded data will be able to fully utilize an application of flood monitoring via big-data technologies. In line with the synchronized floodwater index (SfWi), floodwater pixels are identified and combined by multi-sensor image fusion after overcoming problems regarding data preprocessing associated with geocoded grid data, synthetic cloud-free data from a time-series cloud removal algorithm, and an identical spatial resolution from different bands.
In the near future, flood risk mapping can be quickly provided as a low-cost solution with exposure and risk assessment for people and assets. Potential flood risk and damage can be computed for each grid in combination with indicators such as land use, population, and potentially relevant GIS data layers considering different flood situations and damage functions [38]. Therefore, flood risk could be provided to prioritize issues for public and private investment in disaster risk prevention and reduction based on an actual flood map through annual flood monitoring. In order to support risk information for public flood risk maps, flood maps are a fundamental element and help facilitate an evidence-based decision process in cooperation with central and local governments of disaster management. The new algorithm proposed in this study is expected to be a useful tool in disaster risk reduction, not only to monitor floods but also to standardize nationwide flood monitoring using combined multiple satellite images with the SfWi, and thus to promote global flood mapping and flood forecasting systems.
5. Conclusions
This study confirmed that time-series SfWi can be a key tool for pattern change analysis of spatio-temporal distribution of nationwide flood extent using time-series multiple satellite data. Many improvements should be made to fill the gap between data and algorithms as well as to achieve a rapid response of risk information for more accurate and efficient mega-flood change detection under the framework of nationwide flood monitoring. Through time-series monitoring of a flood event on the floodplain, it is possible to understand dynamic processes defining flood characteristics. Dynamic change in a flooded area can be integrated into physical hazard, exposure, and risk based on actual characteristics of spatio-temporal flood distribution. With near-real-time big data related to disasters, a nationwide flood monitoring and mapping system will help provide more credible risk information for stakeholders via web and mobile GIS applications not only to support evidence-based policy making at local, regional, national, and international levels, but also to implement international cooperation for disaster preparedness and disaster risk reduction.
Acknowledgments
This research was supported by the Japan Society for the Promotion of Science (JSPS) KAKENHI Grant-in-Aid for Scientific Research B: 15H05136. I thank Jonggoel Park for supporting an improved flood mapping algorithm and also thank B. Arifuzzanman for sharing hydrological data.
Author Contributions
Young-joo Kwak led this research as the principal investigator of Grant B: 15H05136. He designed the whole study from a conceptual framework to the development of a flood mapping algorithm using multiple satellite data.
Conflicts of Interest
The authors declare no conflict of interest.
References
- World Meteorological Organization. IPCC’s Fifth Assessment Report (AR5); Climate Change 2014 Synthesis Report; WMO: Geneva, Switzerland, 2014. [Google Scholar]
- The UN Office for Disaster Risk Reduction (UNISDR). Sendai Framework for Disaster Risk Reduction 2015–2030. In Proceedings of the 3rd United Nations World Conference on Disaster Risk Reduction in Sendai of Japan, Geneva, Switzerland, 14–18 March 2015. [Google Scholar]
- United Nations. Sendai Framework for Disaster Risk Reduction 2015–2030; A/CONF.224/L.2; United Nations Office for Disaster Risk Reduction (UNISDR): Geneva, Switzerland, 2015; 32 p. [Google Scholar]
- Kwak, Y.; Iwami, Y. Rapid global flood exposure assessment for extreme river flood risk under climate change. J. Disaster Res. 2016, 11, 1128–1136. [Google Scholar] [CrossRef]
- JPL-NASA. The Advanced Rapid Imaging and Analysis (ARIA) Center for Natural Hazards. Available online: https://aria.jpl.nasa.gov (accessed on 31 January 2014).
- Schumann, G.J.-P. Preface: Remote Sensing in Flood Monitoring and Management. Remote Sens. 2015, 7, 17013–17015. [Google Scholar] [CrossRef]
- Google Earth Engine. Application Programming Interface (API). Available online: https://developers.google.com/earth-engine (accessed on 1 November 2016).
- Xiong, J.; Thenkabail, P.S.; Gumma, M.K.; Teluguntla, P.; Poehnelt, J.; Congalton, R.G.; Yadav, K.; Thau, D. Automated cropland mapping of continental Africa using Google Earth Engine cloud computing. ISPRS J. Photogramm. Remote Sens. 2017, 126, 225–244. [Google Scholar] [CrossRef]
- McFeeters, S.K. The use of the Normalized Difference Water Index (NDWI) in the delineation of open water features. Int. J. Remote Sens. 1996, 17, 1425–1432. [Google Scholar] [CrossRef]
- Gao, B. NDWI—A normalized difference water index for remote sensing of vegetation liquid water from space. Remote Sens. Environ. 1996, 58, 257–266. [Google Scholar] [CrossRef]
- Xiao, X.; Hollinger, D.; Aber, J.D.; Goltz, M.; Davidson, E.A.; Zhang, Q.Y. Satellite-based modeling of gross primary production in an evergreen needle leaf forest. Remote Sens. Environ. 2004, 89, 519–534. [Google Scholar] [CrossRef]
- Chandrasekar, K.; Sesha Sai, M.; Roy, P.; Dwevedi, R. Land Surface Water Index (LSWI) response to rainfall and NDVI using the MODIS Vegetation Index product. Int. J. Remote Sens. 2010, 31, 3987–4005. [Google Scholar] [CrossRef]
- Pinheiro, A.C.T.; Descloitres, J.; Privette, J.L.; Susskind, J.; Iredell, L.; Schmaltz, J. Near-real time retrievals of land surface temperature within the MODIS rapid response system. Remote Sens. Environ. 2007, 106, 326–336. [Google Scholar] [CrossRef]
- Dartmouth Flood Observatory (DFO). Dartmouth Atlas of Global Flood Hazard. 2008. Available online: http://www.dartmouth.edu/~floods/index.html (accessed on 15 April 2012).
- National Aeronautics and Space Administration (NASA). Near Real-Time (NRT) Global MODIS Flood Mapping. 2015. Available online: http://oas.gsfc.nasa.gov/floodmap/ (accessed on 3 January 2015).
- Revilla-Romero, B.; Hirpa, F.A.; del Pozo, J.T.; Salamon, P.; Pappenberg, F.; De Groeve, T. On the Use of Global Flood Forecasts and Satellite-Derived Inundation Maps for Flood Monitoring in Data-Sparse Regions. Remote Sens. 2015, 7, 15702–15728. [Google Scholar] [CrossRef]
- Shumann, G.; Baldassarre, G.; Bates, P. The Utility of Spaceborne Radar to Render Flood Inundation Maps Based on Multialgorithm Ensembles. IEEE Trans. Geosci. Remote Sens. 2009, 47, 2801–2807. [Google Scholar] [CrossRef]
- Kwak, Y.; Park, Y.; Takeuchi, W.; Iwami, Y. A Synchronized Floodwater Index for Flood Risk Mapping using Multiple Satellite Data: A Case Study of 2015 Bangladesh Flood. Presented at JpGU-AGU Joint Meeting, Chiba, Japan, 20–25 May 2017; Available online: https://confit.atlas.jp/guide/event/jpguagu2017/subject/HDS13-03/advanced (accessed on 20 May 2017).
- Schlaffer, S.; Matgen, P.; Hollaus, M.; Wagner, W. Flood detection from multi-temporal SAR data using harmonic analysis and change detection. Int. J. Appl. Earth Obs. GeoInf. 2015, 38, 15–24. [Google Scholar] [CrossRef]
- Bovolo, F.; Bruzzone, L. A detail-preserving scale-driven approach to change detection in multitemporal SAR images. IEEE Trans. Geosci. Remote Sens. 2005, 43, 2963–2972. [Google Scholar] [CrossRef]
- Chapman, B.; McDonald, K.; Shimada, M.; Rosenqvist, A.; Schroeder, R.; Hess, L. Mapping Regional Inundation with Spaceborne L-Band SAR. Remote Sens. 2015, 7, 5440–5470. [Google Scholar] [CrossRef]
- Kwak, Y.; Yorozuya, A.; Iwami, Y. Disaster Risk Reduction using Image Fusion of Optical and SAR data before and after Tsunami Disaster. In Proceedings of the 2016 IEEE Aerospace Conference, Big Sky, MT, USA, 5–12 March 2016; pp. 1–11. [Google Scholar]
- NASA-USGS. The Land Processes Distributed Active Archive Center (LP DAAC). Available online: https://lpdaac.usgs.gov/dataset_discovery/modis/modis_products_table/ (accessed on 31 May 2017).
- Bangladesh Water Development Board (BWDB). Flood Forecasting & Warning Centre (FFWC). 2014. Available online: http://www.ffwc.gov.bd (accessed on 31 May 2017).
- Kwak, Y.J.; Arifuzzanman, B.; Iwami, Y. Prompt Proxy Mapping of Flood Damaged Rice Fields using MODIS-derived Indices. Remote Sens. 2015, 7, 15969–15988. [Google Scholar] [CrossRef]
- Kwak, Y.; Park, J.; Fukami, K. Near real-time flood volume estimating from MODIS time-series imagery in the Indus River basin. IEEE J. Sel. Top. Appl. Earth Obs. Remote Sens. 2014, 7, 578–586. [Google Scholar] [CrossRef]
- Japan Aerospace Exploration Agency (JAXA). Data Access from Earth Observation Data Utilization Promotion Platform. Available online: http://www.eorc.jaxa.jp/ALOS/en/top/doc_top.htm (accessed on 31 May 2017).
- Natsuaki, R.; Motohka, T.; Shimada, M.; Suzuki, S. Burst Misalignment Evaluation for ALOS-2 PALSAR-2 ScanSAR-ScanSAR Interferometry. Remote Sens. 2017, 9, 216. [Google Scholar] [CrossRef]
- The International Charter. International Chart Space and Major Disaster. Available online: https://www.disasterscharter.org (accessed on 31 May 2017).
- Japan Aerospace Exploration Agency (JAXA). Sentinel Asia. Available online: https://sentinel.tksc.jaxa.jp/sentinel2/emobSelect.jsp (accessed on 31 May 2017).
- Japan Meteorological Agency. Himawari-8/9 Spacecraft Overview. Available online: http://www.data.jma.go.jp/mscweb/en/himawari89/space_segment/spsg_spacecraft.html (accessed on 1 September 2016).
- Kwak, Y.; Takeuchi, K.; Fukami, K.; Magome, J. A new approach to flood risk assessment in Asia-Pacific region based on MRI-AGCM outputs. Hydrol. Res. Lett. 2012, 6, 70–75. [Google Scholar] [CrossRef]
- Hofer, T.; Messerli, B. Floods in Bangladesh: History, Dynamics and Rethinking the Role of the Himalayas; United Nations University Press: Tokyo, Japan, 2006. [Google Scholar]
- Bangladesh Water Development Board (BWDB). Annual Flood Report 2007; Flood Forecasting & Warning Centre (FFWC): Dhaka, Bangladesh, 2007.
- Kwak, Y.; Park, J.; Arifuzzaman, B.; Iwami, Y.; Amirul, Md.; Kondoh, A. Rapid Exposure Assessment of Nationwide River Flood for Disaster Risk Reduction. Int. Arch. Photogramm. Remote Sens. Spat. Inf. Sci. 2016, XLI-B8, 1357–1362. [Google Scholar] [CrossRef]
- Kourgialas, N.N.; Karatzas, G.P. A hydro-sedimentary modeling system for flash flood propagation and hazard estimation under different agricultural practices. Nat. Hazards Earth Syst. Sci. 2014, 14, 625–634. [Google Scholar] [CrossRef]
- Moel, H.; Alphen, J.; Aerts, J.C.J.H. Flood maps in Europe—Methods, availability and use. Nat. Hazards Earth Syst. Sci. 2009, 9, 289–301. [Google Scholar] [CrossRef]
- Alphen, J.; Passchier, R. Atlas of Flood Maps. Examples from 19 European Countries, USA and Japan, 2007. Ministry of Transport, Public Works and Water Management: Hague, The Netherlands. Available online: http://ec.europa.eu/environment/water/flood_risk/flood_atlas/index.htm (accessed on 1 May 2017).
Figure 1.
Framework of nationwide monitoring for supporting emergency risk management.

Figure 2.
Pilot country: water level gauge stations (points) in a nationwide river network (blue lines) of Bangladesh and visited district for field verification (dark gray).
Figure 2.
Pilot country: water level gauge stations (points) in a nationwide river network (blue lines) of Bangladesh and visited district for field verification (dark gray).
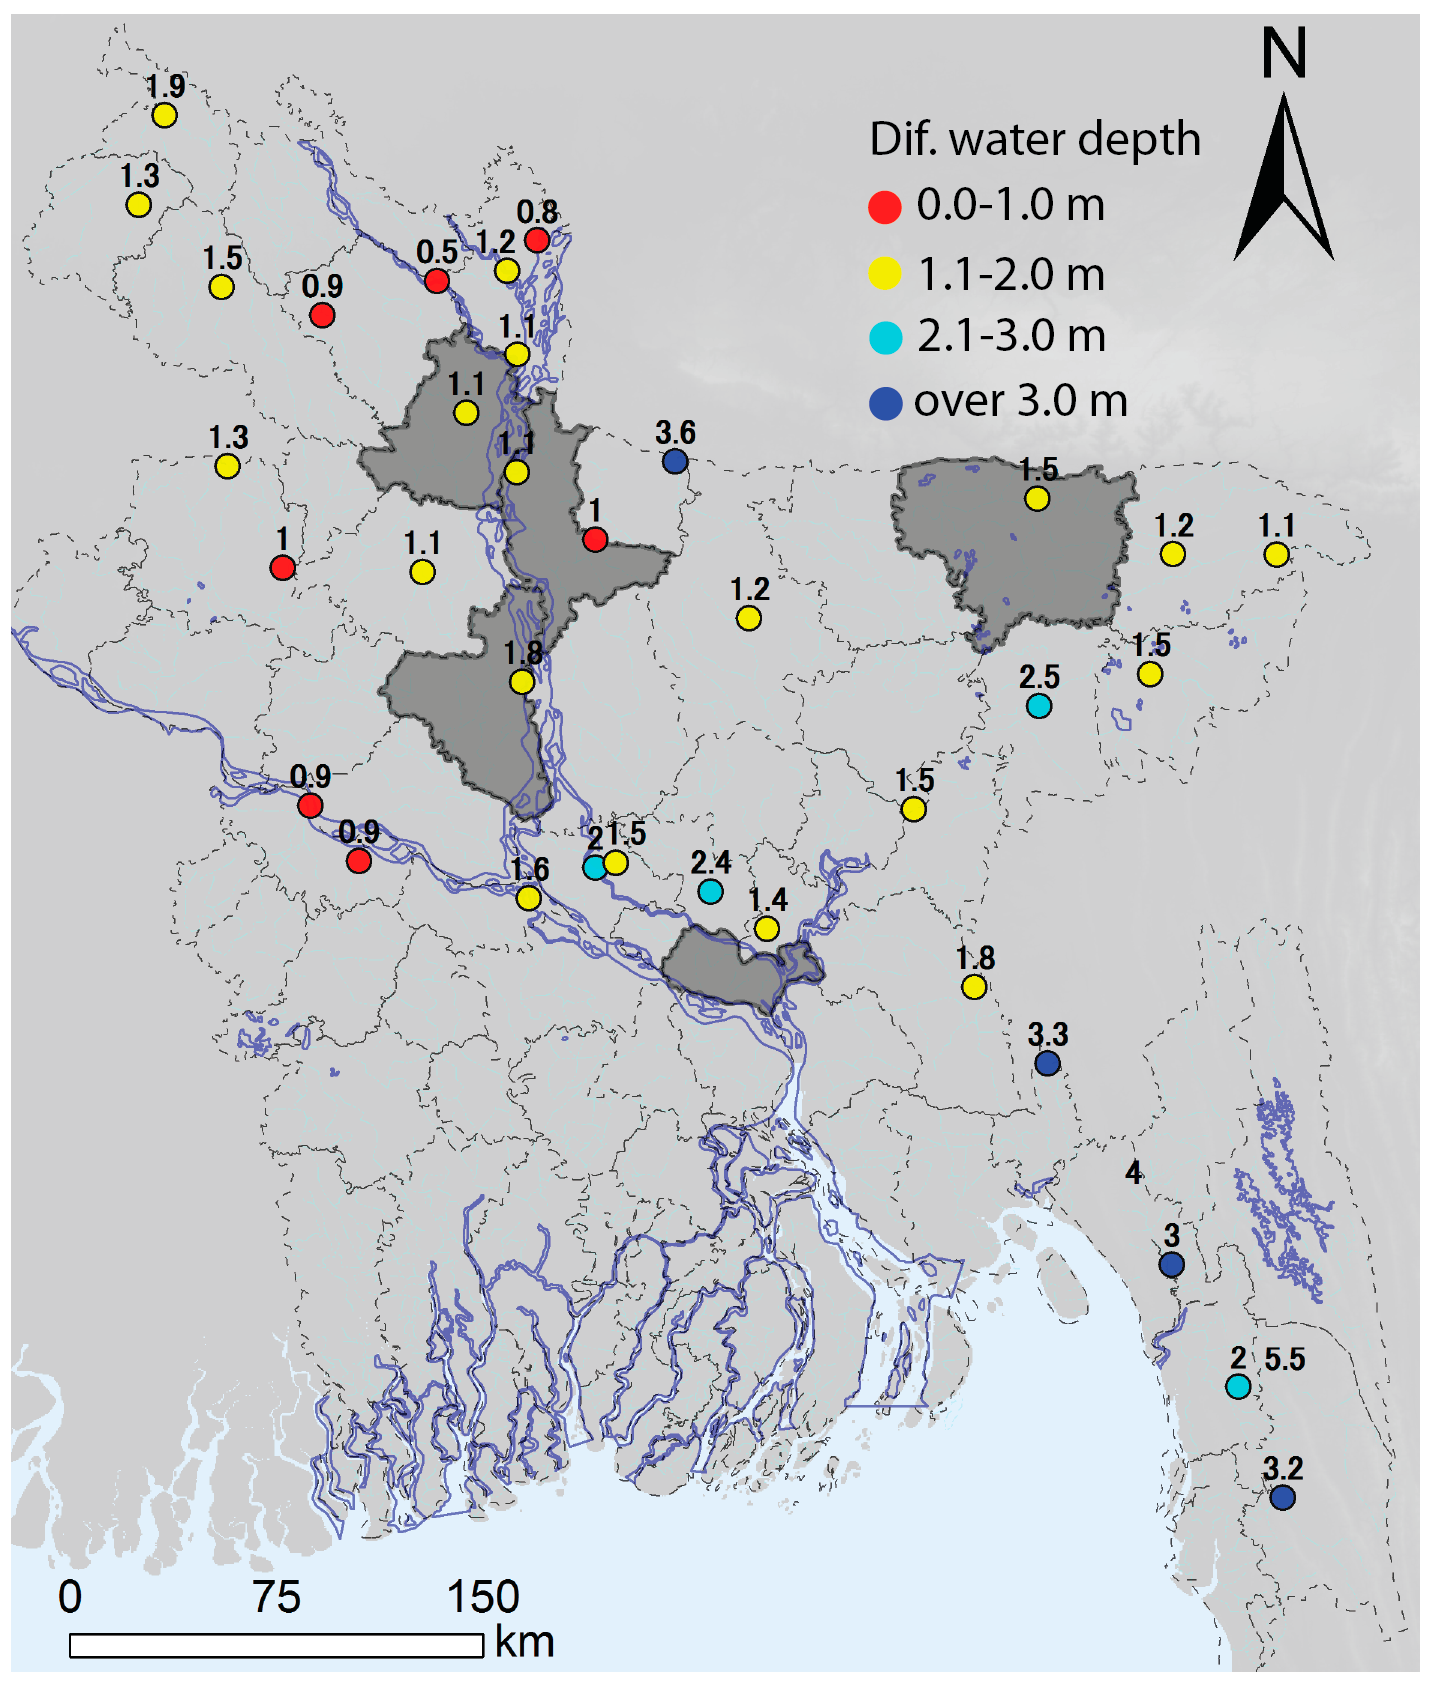
Figure 3.
Mean annual SfWi change between MLSWI and water level in selected Sirajganj sites.

Figure 4.
Cross-validated observations of in situ and high-resolution SAR data: (a) Comparisons of histogram of distributed MLSWI values before (black bar) and during (blue bar) the 2015 flood in sampling site, Sirajgangj district; (b) Comparisons of PDF histogram before (dash line) and during (blue line) the 2015 flood; (c) sampling sites, UAV-assisted field investigation (circle of H) and handheld measurement (black points) for ground validation based on the pixel-based classification of MLSWI.

Figure 5.
Nationwide annual flood mapping using SfWi across international river scale, GBM Rivers: the maximum flood inundation extent (a) before the peak water level; (b) after the peak water level on 6 September 2015.
Figure 5.
Nationwide annual flood mapping using SfWi across international river scale, GBM Rivers: the maximum flood inundation extent (a) before the peak water level; (b) after the peak water level on 6 September 2015.

Table 1.
Used data including designed process for 2015 flood detection.
| Dataset | Contents | Used Band | Resolution (Spatial/Time) |
|---|---|---|---|
| MODIS (MOD09A1) 1 | Land surface reflectance | Band 2 & 7 | 500 m/eight-day |
| MODIS (MOD11A2) 1 | Land surface temperature | 1000 m/eight-day | |
| Water level 2 | Meter | - | -/one day |
| ALOS-2 3 | Backscattering coefficient | HH | 100 m/one day |
| HIMAWARI 8 4 | Shortwave-IR | Band 5 & 6 | 2000 m/10 min |
1 NASA-USGS, 2015. 2 BWDB, 2015. 3 JAXA, 2015. 4 JMA, 2015.
| Return Period (Year) | Inundated Area (%, km2) | |
|---|---|---|
| 2 | 20 | 29,900 |
| 5 | 30 | 43,000 |
| 10 | 37 | 55,000 |
| 20 | 43 | 62,000 |
| 50 | 52 | 75,000 |
| 100 | Over 60 | 89,000 |
| The average of inundated area: 2-year return period = 20% | ||
| The 2007 flood: 20-year return period = 43% | ||
| The 1998 flood: 100-year return period = over 68% | ||
© 2017 by the author. Licensee MDPI, Basel, Switzerland. This article is an open access article distributed under the terms and conditions of the Creative Commons Attribution (CC BY) license (http://creativecommons.org/licenses/by/4.0/).
Share and Cite
MDPI and ACS Style
Kwak, Y.-j. Nationwide Flood Monitoring for Disaster Risk Reduction Using Multiple Satellite Data. ISPRS Int. J. Geo-Inf. 2017, 6, 203. https://doi.org/10.3390/ijgi6070203
AMA Style
Kwak Y-j. Nationwide Flood Monitoring for Disaster Risk Reduction Using Multiple Satellite Data. ISPRS International Journal of Geo-Information. 2017; 6(7):203. https://doi.org/10.3390/ijgi6070203
Chicago/Turabian StyleKwak, Young-joo. 2017. "Nationwide Flood Monitoring for Disaster Risk Reduction Using Multiple Satellite Data" ISPRS International Journal of Geo-Information 6, no. 7: 203. https://doi.org/10.3390/ijgi6070203
Note that from the first issue of 2016, this journal uses article numbers instead of page numbers. See further details here.