
Disaster Hashtags in Social Media


1
Institute of Geographic Sciences and Natural Resources Research, CAS, Beijing 100101, China
2
College of Resources and Environment, Graduate University, CAS, Beijing 100049, China
3
State Key Laboratory of Earth Surface Processes and Resource Ecology, Beijing Normal University, Beijing 100875, China
4
Faculty of Geographical Science, Beijing Normal University, Beijing 100875, China
*
Author to whom correspondence should be addressed.
†
Current address: 11A, Datun Road, Chaoyang District, Beijing 100101, China.
‡
These authors contributed equally to this work.
ISPRS Int. J. Geo-Inf. 2017, 6(7), 204; https://doi.org/10.3390/ijgi6070204
Submission received: 30 April 2017
/
Revised: 13 June 2017
/
Accepted: 30 June 2017
/
Published: 5 July 2017
(This article belongs to the Special Issue Smart Solutions for Disaster Risk Reduction: Big Data Concepts for Disaster Risk Reduction (DRR))
Abstract
:Social media is a rich data source for analyzing the social impact of hazard processes and human behavior in disaster situations; it is used by rescue agencies for coordination and by local governments for the distribution of official information. In this paper, we propose a method for data mining in Twitter to retrieve messages related to an event. We describe an automated process for the collection of hashtags highly related to the event and specific only to it. We compare our method with existing keyword-based methods and prove that hashtags are good markers for the separation of similar, simultaneous incidents; therefore, the retrieved messages have higher relevancy. The method uses disaster databases to find the location of an event and to estimate the impact area. The proposed method can also be adapted to retrieve messages about other types of events with a known location, such as riots, festivals and exhibitions.
1. Introduction
Historically, most research on social media has been conducted using Twitter data. Twitter provides an open Application Programming Interface (API) to retrieve data and attributive information about social communication. Like other commercial services, Twitter imposes constraints: only 1% of messages can be downloaded free of charge (the so-called “Spritzer” version), and the time range is limited to the past seven days. The Internet Archive project also publishes Twitter data. Although the collection is also limited to 1% of messages, it contains historical data from as early as 2011 [1]. Additional data can be analyzed on the Twitter website or bought through several official distributors.
Content analysis methods of text messages are still limited. For this reason, humans often do most of the work by reading messages and extracting knowledge about the situation in a disaster area. The project Ushahidi involves crowdsourcing to collect, classify and geotag messages [2]. Social media produces a large quantity of data. Every day, 500 million new messages are published on Twitter [3]. The relevance of retrieved data should be as high as possible to reduce the laboriousness of this manual job.
Many computer classification systems were developed to filter topic-related data, to separate it into different categories and to visualize it in spatial and temporal dimensions. For example, the AIDR project uses small sets (approximately 200 messages) collected by humans to train a classifier and use this model to filter real-time streaming data [4]. The full history and evolution of these platforms can be found in Imran et al. [5]. The weakness of the existing classification platforms is that the model must be trained separately for every event. Classification models are computationally expensive. Therefore, initially collected messages should be processed to exclude non-relevant messages using a simpler method.
Another active area of research is social network analyses. Contrary to the methods described before, a network analysis is usually performed using archived data rather than by online monitoring. Network analysis has been used to find news distribution methods, rumor propagation sources and the coordination efficacy of different government and humanitarian agencies [6,7,8].
The previously-mentioned applications of social media have a significant variety of required data. Disaster management requires valid information about damages and victims, whereas social research studies interconnections between users not only in the impact area of an event, but also outside, as well.
Sentiment analyses of foreign news media, the coordination of charity and volunteer foundations and all elements of humanitarian activity around an event operate with different types of information. This is why we propose separating the data retrieval process into two parts. We first retrieve messages relevant to the event, and in the second step, we separate them into several categories according to the research goals. In this paper, we concentrate only on the first part in our attempt to develop a general method suitable for the retrieval of all kinds of information about a disaster.
Typical research starts with the choice of keywords that will be used to retrieve messages. As applied to photo and video materials, keywords are called tags. These keywords should characterize an event well and be as specific as possible to separate non-related data and to simplify the subsequent analysis (manual or automatic). Usually, keywords are selected by a researcher depending on his/her experience and knowledge of foreign languages [9]. The manual choice of keywords is a source of data bias. In their work, Olteanu et al. [10] proposed a method to build topic-specific lexicons and to find the words most frequently used in disaster messages. These words can be used as keywords. This method simplifies the manual preliminary study of an event and removes bias. The lexicon can be built for a broad class of events (e.g., disaster lexicon) or constructed specially for an event to increase the data relevancy. However, this process requires a training dataset for every event.
A hashtag is a word, a combination of 2–3 words, or an abbreviation. It always starts with “#”, the hash sign (a double-hashtag format is used in the Chinese language, e.g., #北京#). Hashtags are used to mark the topic of the text. For example, almost every Tweet about the 2016 Olympic Games in Rio used the hashtag #rio2016. In Twitter, hashtags are used as internal references to consolidate same-topic messages for the easy search of information. The concept of hashtags is similar to tags used in photo- and video-sharing services. As topics can describe abstract or specific ideas, a set of hashtags can be found to relate to a particular event. Twitter users can create new or reuse existing hashtags. Government agencies can offer advice regarding the use of special disaster hashtags, but cannot control Internet citizens. Usually, a disaster event has five or more concurrent associated hashtags. Twitter Inc. has never published a real number of existing hashtags. The largest hashtag directory Twubs [11] contains more than 70,000 records. Just in one month, December 2015, 75,500 hashtags were used in English messages on Twitter (counted on a 1% data slice from the Internet Archive [1]).
Hashtags are actively used in data retrieval, and usually, they are not separated by a special group, but are rather treated as other keywords. For example, Olteanu et al. [9] used the following keywords to find information about haze in Singapore: #sghaze; Singapore haze; #hazyday; blamethehaze; mustbehazee; #sg #haze; Singapore #hazy. In addition to other keywords, the researcher chose hashtags manually after a preliminary survey of the media. Our method is designed for the automatic collection of hashtags related to an event. Using the proposed method, an expert can be removed from the data retrieval process to construct a more effective information awareness platform and to reduce bias.
Users of social media are not accurate in writing messages, especially Twitter users, because texts in this platform are limited to 140 characters. For example, abbreviations (custy, cx → customer) and shorthands (5ever, 7ever → forever) are very common in Twitter [12]. Existing methods for text normalization [13,14] can be applied to already downloaded messages, but are useless for initial data retrieval. However, Twitter encourages joining messages into group chats; hence, users carefully choose hashtags. For these reasons, we expect that usage of hashtags makes data retrieval more stable and reliable.
Users of distinct social media platforms describing similar events tend to use similar hashtags. For example, throughout the activity of the disastrous cyclone Haiyan (Philippines, 2013), two event-related hashtags #haiyan and #yolanda were used to mark messages in the Twitter and Facebook social platforms; the same hashtags can be used to find photos of damages caused by the cyclone on the media-sharing website Instagram. Accordingly, hashtags collected on Twitter messages can be used to retrieve data from several social media sources. This observation significantly simplifies data retrieval and enriches information awareness, because it is lexicon- and language-indifferent and suitable even for obtaining photo and video data.
Twitter messages are short, and users usually describe a change of situation or the development of an accident, but not the event details. For this reason, the information contained in Twitter is not sufficient for gaining a full picture of an event. In their research, de Albuquerque et al. [15] state social media as volunteered geographic information, so not fully-proven, and compare this with “authoritative data” derived from official sources of information (academic institutions, government agencies). They engage “authoritative data” to estimate a potentially flooded area using digital elevation models, hydrological and sensor data. Following this idea, we involve external knowledge in the study of social media. There are many disaster databases that aim to have complete and validated information about hazard events. The most important parameter for finding appropriate hashtags is the spatial location of an event. Additionally, we use process parameters to estimate the impact area. For example, a cyclone is characterized by wind speed.
2. Materials and Methods
2.1. Method Overview
Twitter messages can be retrieved using keywords or geographic coordinates. Section 2.3 describes how to extract spatial information from a disaster database and to estimate the impact area. Toponyms (cities, towns and villages) from the area are used as keywords to retrieve messages, and messages with embedded coordinates are selected using the area polygon. In the next step (Section 2.5), hashtags are extracted from the retrieved messages, and several heuristics are used to filter out non-relevant hashtags (Figure 1).
The key element of the filtering process is the classification of messages by their content. Such classification models are a common element of nearly all research on disaster media, but usually, the quality of these models is not high (see Table 3 for a comparison). Imran et al. [4] concluded that “pre-trained classifiers significantly drop in classification accuracy when used in different but similar disasters” and proposed an infrastructure to train a new individual model for every disaster event. Our classifier has higher quality than existing models, and once trained, the model can recognize messages about a wide variety of natural and technological disasters. Therefore, we expect that our model will be useful for future research, even research unrelated to the hashtag retrieval method. Details of the classifier design can be found in Section 2.4.
We have to deal with two main challenges. The first one follows from the short length of the messages. Very often, users do not mention cities where they live and where a disaster happens. This can be explained through the private character of the messages, so their addressees (friends) already know where the author lives. News media, especially foreign news agencies, can use generic toponyms, e.g., country name, supposing detailed information can be found on the website referenced in the message. For example, two messages published on 12 November 2013 from the account CNN Breaking News (@cnnbrk) testify to both cases:
- Typhoon #Haiyan has displaced at least 800,000 people, U.N. estimates.
- Typhoon #Haiyan deaths likely 2000 to 2500—not 10,000, Philippine president tells
The second challenge follows from the correctness of the impact area estimation. Because the area is not recorded in the database, but estimated using several rules, it can include cities not really affected by the disaster or omit actually harmed places. Therefore, it increases the number of non-relevant messages and reduces the amount of useful messages that are used in the next step to extract hashtags.
2.2. Datasets
Twitter messages for September–November 2013 were obtained via the Internet Archive [1], a free collection containing 1% of Twitter data (the so-called “Spritzer” version). Morstatter et al. [16] show that it is a representative sample of the true activity on Twitter. Despite limited amounts of messages, this data source can be used for the analysis of a series of disasters in the past. It is open and permits full reproducibility of the work. To analyze ongoing events, the Twitter Streaming API can be used similarly.
To build the classification model, we used 3 labeled datasets, CrisisLexT6, CrisisLexT26 and AIDR2015Q2, with approximately 80,000 records [4,9,10]. A more detailed description of these datasets can be found in Section 2.4.
The physical parameters of hazard processes were extracted from several disaster databases: EM-DAT, IBTrACS and GAALFE [17,18,19,20].
Toponyms were obtained from the OpenStreetMap project [21].
2.3. Impact Area
The instrumental monitoring of disaster processes is recorded in the disaster databases. It can be a direct impact area registration (e.g., the contour of flooded territory or burned region) or an indirect reference to a key hazard characteristic (epicenter coordinates or cyclone track). The last property should be transformed to cover adjacent areas for some distance and to estimate a potential emergency zone.
In this research, we experiment with floods and tropical cyclones. Other types of disasters should be processed in a similar way.
The Global Active Archive of Large Flood Events (GAALFE [20]) contains contours of submerged regions. The georeference accuracy can be illustrated by the example of the 2013 Alberta flood in Canada (Entry Number 4068 in GAALFE). This flood affected two river basins, the South Saskatchewan and Elk rivers [22], but the most disastrous damage was observed in 5 cities and towns in the basin of South Saskatchewan [23] (Figure 2). The solid line in the figure delineates the South Saskatchewan river basin [24], and the dashed polygon shows the location of the event as it is recorded in GAALFE. We can consider that the georeference of the database fairly represents the river; nevertheless, the flood occurred in the highland western part of the basin and did not affect the lower course.
Therefore, the polygon from GAALFE includes populated places not affected by the event and loses important harmed places. Because a list of cities and towns is used in the following steps to find hashtags, this inaccuracy leads to a significant increase in noise, as will be shown later.
International Best Track Archive for Climate Stewardship (IBTrACS [18,19]) represents information about cyclones in track form. The affected area should be reconstructed using additional process parameters. One of the cyclone hazard factors is wind speed. It is recorded in the form of the radii of wind speed that exceeds 34-knot thresholds (higher level radii are not important in this case). For a reasonable approximation, these radii, four for every cardinal direction, can be reduced to the one maximal radius (Figure 3). If the maximal wind speed of a cyclone is less than 34 knots (such as a “tropical depression”, according to some classifications), then it can be recommended to use a constant radius, e.g., 20 nautical miles.
The second hazard factor is rainfall. Total precipitation from the ECMWF ERA Interim dataset [25] was summed throughout the whole time of cyclone activity (Figure 4a). Rainfall can also be represented by cloudiness throughout the cyclone region (Figure 4b).
Rainfall is the most dangerous cyclone factor; it triggers floods and landslides and contributes to much of the human loss. In 2013, two hurricanes, Manuel and Ingrid, hit the territory of Mexico almost at the same time: 13–19 September (Manuel) and 12–17 September (Ingrid) [26,27]. Most of the victims of the hurricanes were reported from three spots (yellow and red colors on Figure 4a). The total precipitation represents the most accurate disaster impact and is consistent with on-site reports. However, in the case of two simultaneous disasters in the same region, e.g., cyclones Manuel and Ingrid, it is practically impossible to separate rainfall into two parts according to the initial cyclones. Cloudiness also does not facilitate disambiguation (Figure 4b).
The wind speed boundary is not as accurate as rainfall, but can be easily referenced to the cyclone, because it was constructed from the cyclone track recorded in the database. In the following experiments, we use wind speed boundaries to define the impact area. This approach has the above-mentioned limitations. However, we expect that the situation in the places not included in that area is described using the same hashtags.
For our experimental system flood, polygons from the GAALFE and cyclone tracks from the IBTrACS were imported into the PostGIS database (PostgreSQL). Flood polygons are left unchanged. The cyclone track consists of points (one point every 6 hour) with a 34-knot wind radius. These points are converted into buffers and joined into one polygon for every cyclone. Hence, we lose information about the dynamics of a cyclone, but it seems to be a reasonable simplification, otherwise data processing should be done for every day separately, which complicates the algorithm. Transformation of the points into a polygon is a simple and straightforward operation. The updating of data and the addition of new records can be fully automatized. The source code of all processing functions can be found in the Supplementary Materials
The estimated contour of the disaster area is used to find affected populated places (cities, towns and villages). We use a gazetteer based on a preprocessed OpenStreetMap dataset: city polygons were converted to central points, with population information added [21].
Disaster polygons (flooded areas and cyclone buffers) are used to find populated places inside of the impact area. For optimization, the 20 most populated places are chosen to make a list of affected places. The PostgreSQL database provides effective full text searching infrastructure. Therefore, all Twitter messages were indexed; every message that mentions a place from the list is collected for the subsequent processing and extraction of hashtags. Some toponyms in the texts can be misprinted; however, we do not make any text correction or apply fuzzy search methods. It is expected that, dealing with big data, the loss of several messages is unessential.
Disaster polygons can also be used to directly find messages with embedded coordinates (geotweets). The portion of geotweets in all Twitter records for September–November 2013 is only 2.7%. However, these geotweets are expected to be strongly related to an event. In our experiments, we use the two approaches (city list and coordinates) together.
2.4. Classifier
The classification of messages by their content is the main element of nearly all research on disaster media and is also the key element of the proposed method. The task of message filtering can be formalized as a binary classification problem with two classes, disaster and non-disaster. In our research, we use labeled datasets prepared in former research; hence, classes are not strictly defined. For example, CrisisLexT6 (see below) defines several classes: “not applicable”, “not related”, “related and informative” and “related, but not informative”. In our research, the first two classes are treated as the non-disaster category, and the last two classes are joined into the disaster category.
The main goal of the designed classifier is to find all kinds of social response on a disaster regardless of credibility and usefulness. The model should be generalized as much as possible, because this one model is to be used in the processing of a series of disasters without adaptation or modification. The aim of our research is to retrieve messages that are highly relevant to an event. We expect that the retrieved messages will be classified using other task-specific models according to the goals of the real application.
Former research used relatively small datasets and usually did not publish them [28,29]. To the best of our knowledge, the first public disaster-related dataset was CrisisLexT6 in 2014 [10]. To build our corpus, we used 3 independent datasets. The natural balance of the classes is not constant and changes in wide ranges. For this reason, an equal balance of the records was chosen at a 1:1 proportion.
CrisisLexT6 is a well-prepared dataset (this and the following datasets can be downloaded from the website http://crisislex.org). In our corpus, 5 of 6 events were used, including 2 floods, 2 storms (hurricane and tornado) and 1 technological disaster. A terrorist incident was excluded. Approximately 5000 Tweets describe each of these events.
CrisisLexT26 [9] is a collection of 26 events represented by several languages (mostly English and Spanish). Only English messages were picked out for the corpus. This dataset uses multi-class labels, which were rearranged according to the binary classification task. Most of the messages (80–90%) were disaster-related. This dataset added the following events to the corpus: 2 wildfires, 4 earthquakes, 4 floods, 2 storms and 7 technological disasters. The resulting number of messages varied from 85–900 per event.
AIDR2015Q2 [4] is a comparatively noisy dataset with broken character encoding. However, it contains some rare collections. We used 4 of them, including 1 storm, 1 earthquake, 1 volcano and 1 collection of landslides (including avalanches). The number of records was up to 2500 per event. The dataset was not balanced, and the number of non-disaster messages was twice the number of disaster messages. A large number of non-disaster messages is given to balance the corpus.
Imran et al. [4] showed that disaster messages use a highly distinguishable lexicon, in which every event can be recognized using a small set of specific words. For example, almost every message about Hurricane Sandy in 2012 contained the words: nyc, obama, romney, sandy, #hurricane, #romneystormtips. To make the model more general, event-specific words were removed from the corpus, such as toponyms, responsible persons, proper names and dates.
Inter-annotator agreement was not recorded for any of these datasets. According to a similar project, this can be expected to equal 75–87% [30].
The resulting dataset contained 36,122 disaster messages and an equal number of non-disaster messages (Table 1).
The lack of some disaster categories (for example, tsunamis, heat waves and epidemic diseases) places a limitation on the classification model. It is not clear how biological (epidemic and epizootic) and long-term climatological (heat waves and droughts) disasters can be incorporated into one general model. Terrorist incidents seem similar to technological disasters, but are not included in this research. The study of the lexicon of these disaster categories is a task for future research.
Some categories (volcanoes and wildfires) are underrepresented in the corpus. However, it will be shown later that different categories share a common disaster vocabulary (victims, losses and damage) and complement each other so that the designed classification model has some generalizability.
According to previous research, the preparation of a corpus can vary. However, all non-words (URLs, hashtags, usernames) are usually removed or replaced by placeholders. The feature set is constructed from unigrams [28,30,31] or is extended by POS tags and Verbnet classes [32]. We follow this common practice, and the processing includes the removal of URLs, user names and punctuation, as well as lower case transformation and stemming. Messages are transformed into a document-term matrix with a reduction of low-frequency terms. A very simple feature set was chosen for the future adaptation of the model to new national languages.
Several machine-learning methods can be used to train the model, and the best results in previous research were achieved using logistic regression and supervised Latent Dirichlet Allocation (sLDA) [28], random forest [29] and naive Bayes [32]. In our research, two methods were tested: Support Vector Machine (SVM) and sLDA implemented in the R packages RTextTools [33,34] and lda [35]. The SVM method was used with default settings: C-classification, radial basis kernel. The optimal number of topics, for sLDA, was estimated using the methods of Cao Juan et al. [36] and Griffiths and Steyvers [37] (R package ldatuning [38]).
At the training stage, the model is very sensitive to event-specific words. For this reason, 5 events (earthquake, flood, storm, wildfire and technological disaster) were separated from the corpus to construct the testing dataset; the remaining part composed the training dataset (8% and 92%, respectively). In this way, the training and testing datasets contained messages from non-overlapping events, so the model was always being tested by messages from unseen disasters.
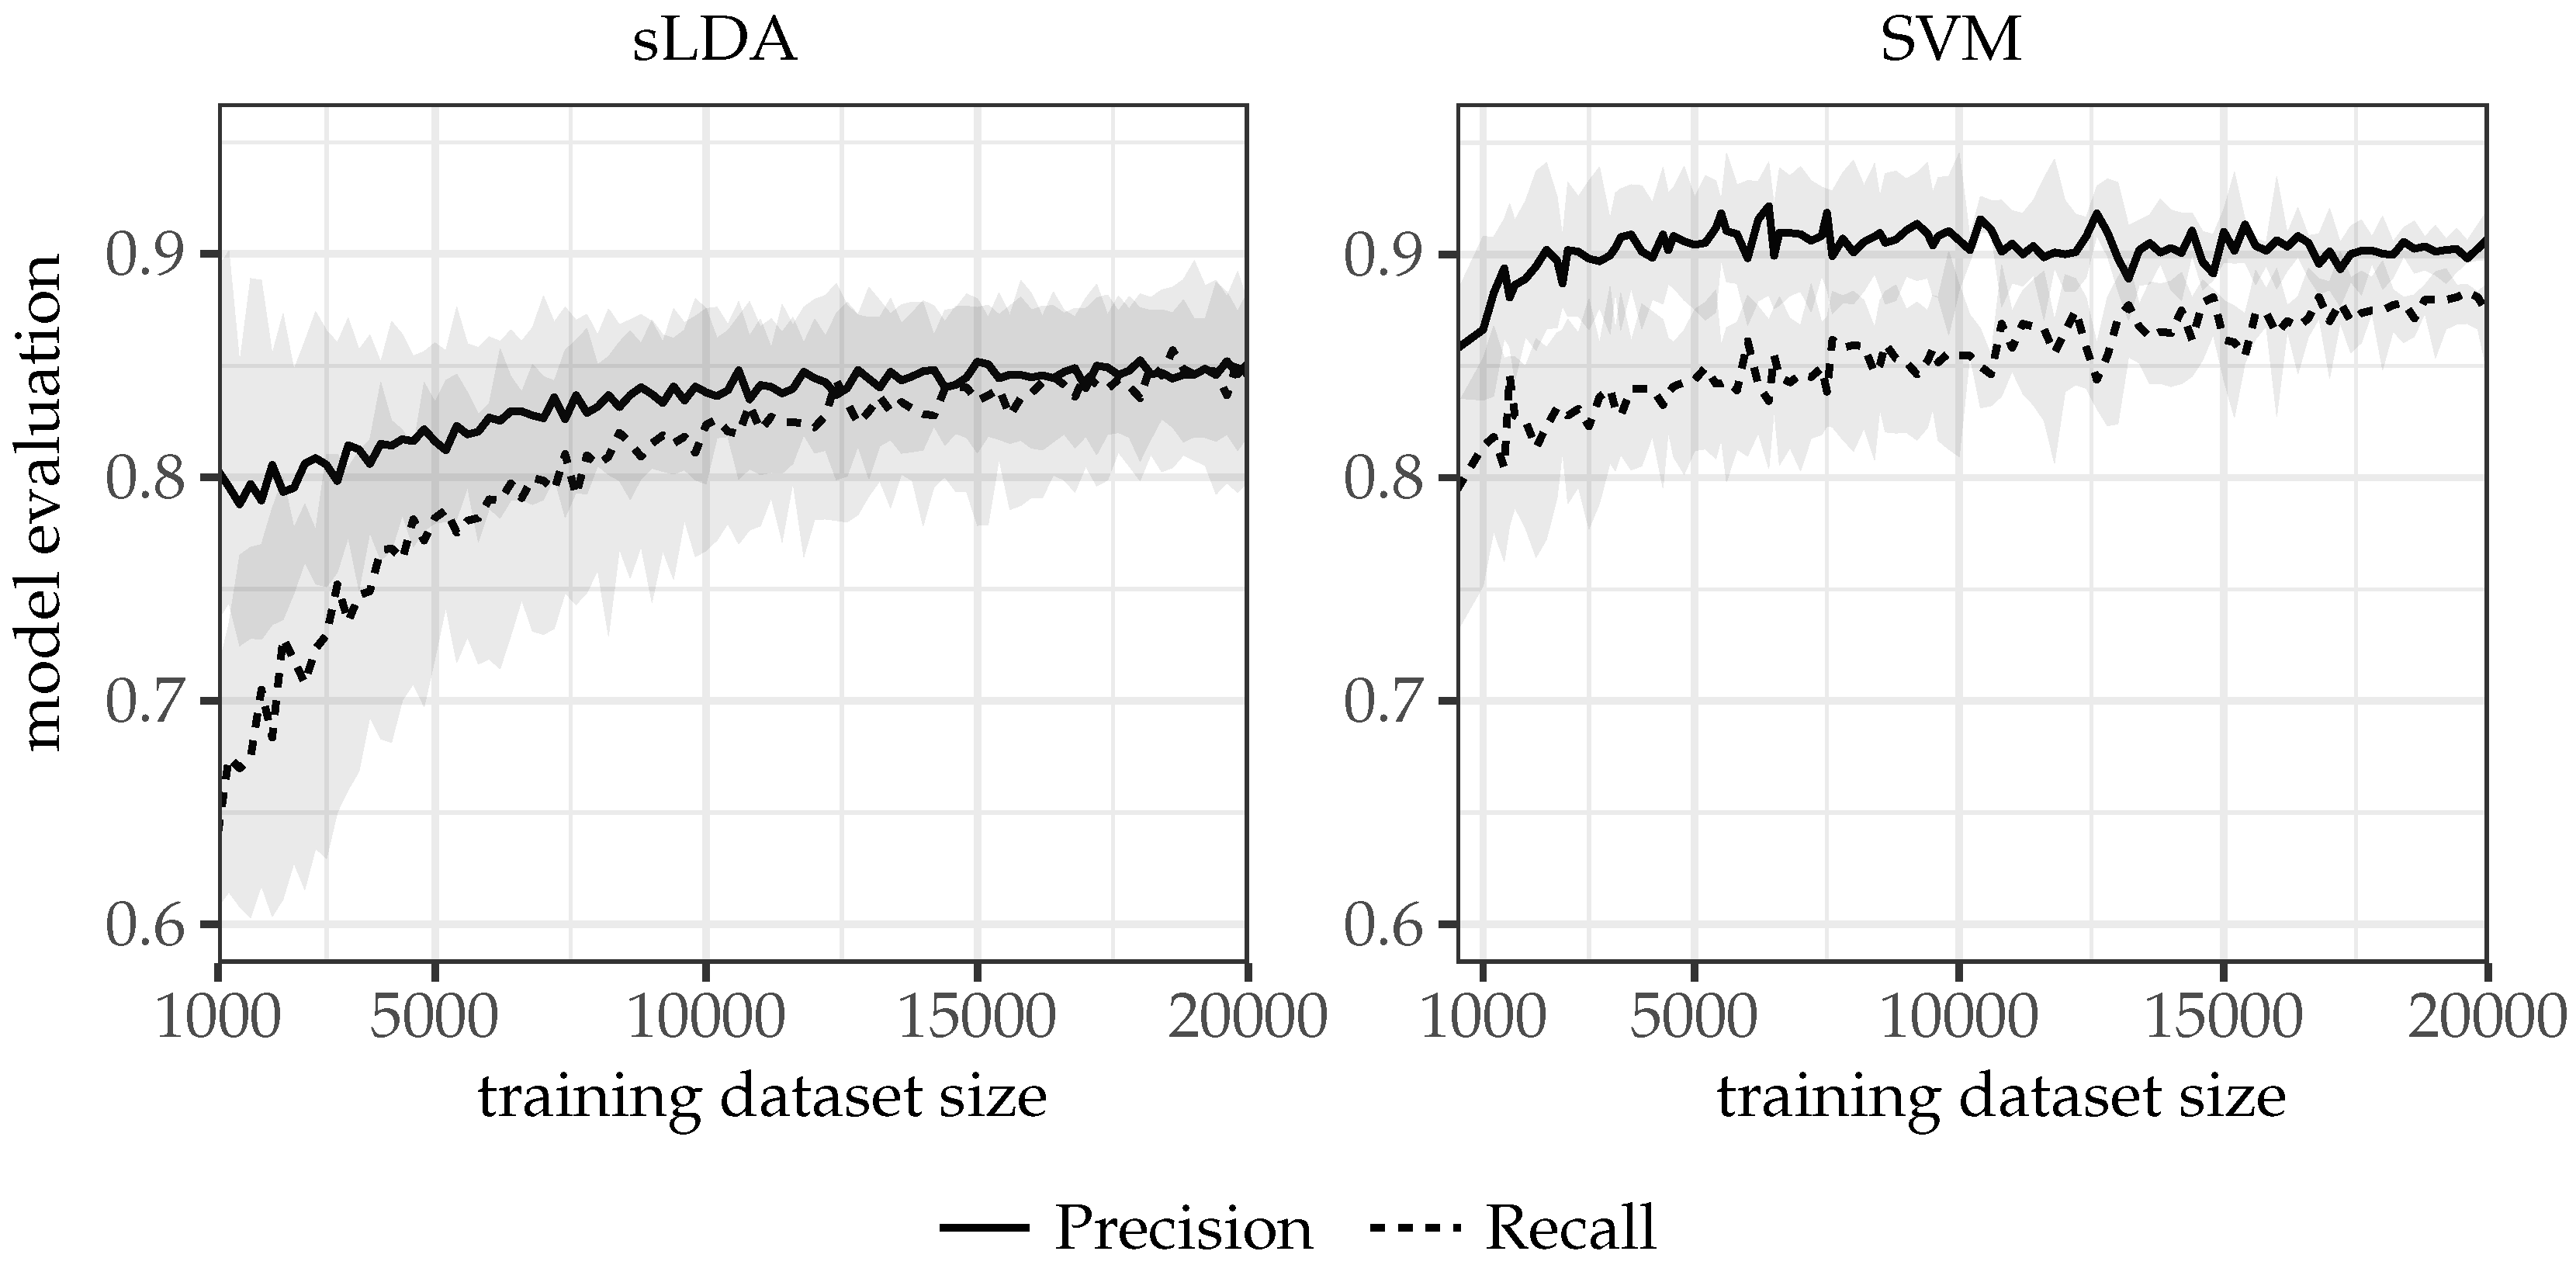
The designed models should successfully recognize disaster-related texts; hence, the performance of the classifier is measured using standard information retrieval metrics: the portion of event-related messages (precision) and the portion of recognized messages among all event-related messages (recall). The area under curve (AUC) is utilized to compare the models.
Two models were trained: SVM and sLDA. Latent Dirichlet allocation is a stochastic method, and for that reason, the sLDA model was trained ten times, with one selected with the highest area under curve (AUC) value. SVM showed a better result, with an AUC of 0.937 versus 0.909 for sLDA. Therefore, it was chosen for further use in the research.
The examination of the testing dataset shows that the model demonstrates good generalizability (Table 2). One of the underrepresented categories, “wildfires” (1648 records in the training and 1659 in the testing datasets) was classified with acceptable quality, which can be explained by the existence of a common disaster vocabulary.
Disaster message classification models have been used in many previous studies [29,30,31,32,39]. All of them solve slightly different problems. However, in all cases, the quality of the models is not high. For example, the classifier developed by Ashktorab et al. [28] has a precision of 78% and recall of 57%.
Two models from former research were chosen for comparison. Ashktorab et al. [28] found messages about damage and casualty in the set of texts representing 12 crises; Cobo et al. [29] built a classifier that filters tweets relevant and non-relevant to an earthquake. The new model, compared with models from previous research, was significantly improved in terms of recall (Table 3). The substantial difference between the number of records in the training datasets should be noted. As was said before, large labeled disaster datasets were published only during the past two years.
To estimate a sufficient size for the training dataset, messages were chosen from the category “flood”, and the model was trained using datasets of different size. Figure 5 shows that the stabilization of the education process was reached when the size of the training dataset was approximately 10,000 messages for the sLDA model (and 13,000 for SVM). These values can be treated as the minimum required dataset size for every disaster category.
LDA topics show good ability to separate classes. It is expected that incorporation of LDA topics as additional features of SVM can improve model.
2.5. Hashtag Extraction and Filtering
Toponyms and coordinates defined using disaster databases (Section 2.3) are used to retrieve messages from the 1% Twitter archive. Hashtags extracted from these messages represent several social phenomena in the defined region related to the disaster and to ordinary life (e.g., shopping, birthday) and long-term overlapping events of different origin (e.g., election campaigns). For this reason, we propose several heuristics (filters) to remove non-disaster hashtags.
To illustrate the filtering process, two disastrous floods were chosen: the so-called “Halloween flood” in south-central Texas (Entry Number 2013-0510 in EM-DAT, 4101 in GAALFE) [40] and river flooding in northern Colorado (Entry Number 4089 in GAALFE) [41]. Both events occurred in Autumn 2013. In spite of the fact that GAALFE scores both floods as extreme events (2 severity class), the Colorado flood received relatively higher consideration on social media. Therefore, we expect a high level of noise in messages related to the flood in Texas.
Using the estimated impact region, we can find messages about Texas flood in the 1% Twitter archive. Coordinates of 224 messages get into the impact region; 19,187 messages mention toponyms in their text (Section 2.3). From all discovered messages, we extract in total 4314 hashtags.
Filter 1. Low-frequency hashtags: The hashtags used in a small number of messages can be removed from the hashtag set using a certain noise level. Even if these hashtags are event specific, it should be expected that they are not productive and are not important for data retrieval.
In our example, 3412 hashtags (79%) occur only once. Messages are collected on the 1% archive; the full Twitter dataset can contain more messages with this hashtag. However, the disaster hashtag should symbolize a process important for the region and be highly represented in social media; therefore, low-frequency hashtags can be removed as insignificant.
According to the Colorado flood, the following 3 most frequent hashtags are event related: #boulderflood, #coflood, #longmontflood. The first hashtag related to the Texas flood can be found only at Position 55 of the hashtag list. Hence, noisy hashtags cannot be just cut using a certain level of frequency; rather, a more complex approach should be applied.
Filter 2. Pre-disaster hashtags: Assuming that topics discussed in the region before the disaster are not related to the event, pre-disaster hashtags can be filtered out. These filters effectively remove hashtags related to local toponyms, everyday life and other disasters (current or lapsed).
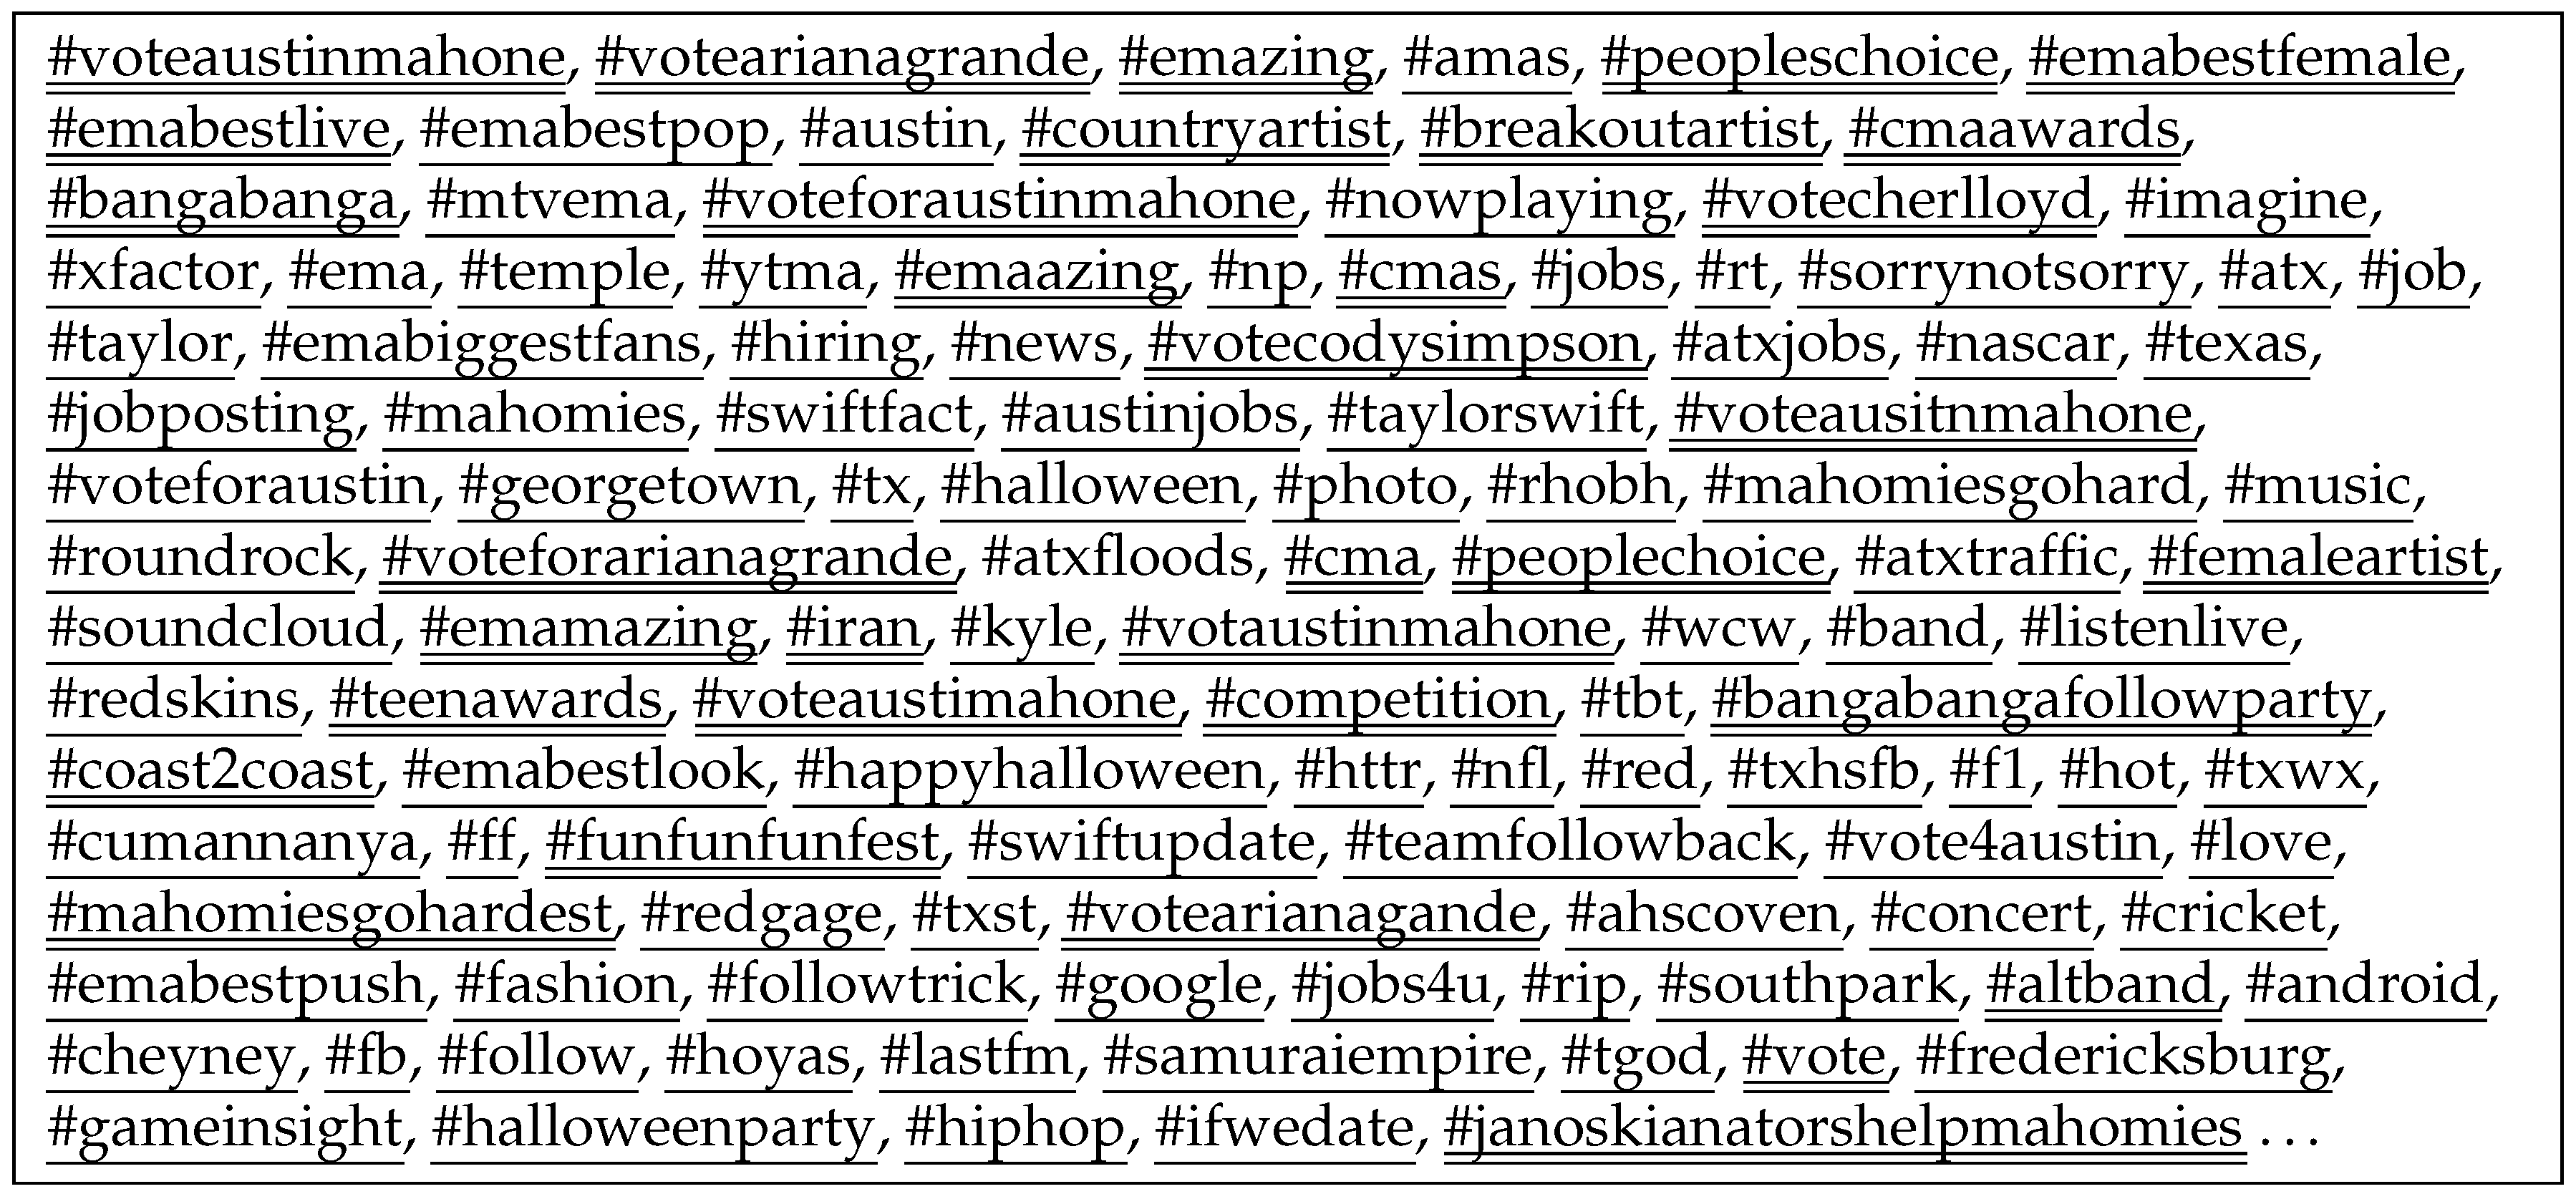
The same geographic method (coordinates and toponyms) is used to retrieve new messages from the impact area, but up to a week before the event. Hashtags extracted from new messages are clearly not related to the event. In our example, these hashtags correspond to local geographic places (#atx, #texas, #georgetown), recent events discussed in news-media (#news, #mtvema, #nascar), everyday life (#jobs, #atxtraffic, #hiring), leisure activity (#photo, #concert, #music), and so on (single underlined hashtags in Figure 6).
Filter 3. Classification: To address classifier mistakes and odd uses of hashtags, up to 200 messages are retrieved for every hashtag. These messages are classified using the model described in Section 2.4. A hashtag is defined as “disaster” if the ratio of supporting messages is higher than 0.5.
It should be noted that every time, we use the same model described in Section 2.4 without modification. Because the precision of the model is estimated at the level of 89%, it is expected that several messages will be classified incorrectly.
Simultaneously to the flood, people from the impact area discussed other non-disaster events, such as the MTV Europe Music Awards or gubernatorial debates between Wendy Davis and Greg Abbott. These events were reflected in social media as hashtags: #ema, #emabestfemale, #voteaustinmahone, #votearianagrande (MTV); #wendydavis (debates). Most of the messages related to such events were classified as non-disasters. Most of the misclassified messages are very short (1–2) or contain words from disaster lexicon (3–4):
- #EMABestFemale Selena Gomez . my queen
- Everyone RT this. #EMABestFemale Miley Cyrus
- omg i woke up at 6:30am today and im just dead #votearianagrande
- #Iraq’i government complicit in deadly attack at #CampAshraf on #Iran’ian refugees
Because of that, we choose a supporting ratio of messages. The hashtag is recognized as disaster related only if the majority of corresponding messages were classified as disaster related. For this reason, we do not recommend classifying messages retrieved in the beginning of this section because only a small proportion of Tweets mention toponyms in the text, and this sample does not represent well the real meaning of the hashtags. Therefore, some important hashtags will be lost. Nevertheless, this approach can be used for computational optimization.
Ofter applying Filter 3, the hashtag set for the flood in Texas still contains non-disaster hashtags: #wendydavis and #alienwarehangar. Just a few records matching these hashtags can be found in the Twitter 1% archive: 19 and 4, respectively. Such small sets of messages are very sensitive to classifier mistakes; hence, these hashtags should be removed according to the total number of supporting messages.
Filter 4. Common hashtags: At this point, the hashtag list already contains only disaster-related hashtags. However, some of them can be used among many disasters, such as #flood, #redcross and #donations. These “common” hashtags can be easily found through the intersection of hashtag lists collected for several disasters. For example, hashtag #floods can be found in messages about both flood events. These hashtags should be removed from the resulting set because they are not event-specific.
Additional control over hashtag filtering can be made through choosing the frequency limit in Filter 1 and the supporting level in Filter 3. Network analysis and clusterization of pairwise co-occurrences of the hashtags in the texts should be studied in future research.
3. Results
The proposed method is a keyword-based data retrieval method. For this reason, it should be compared with another keyword-based methods. Olteanu et al. [10] proposed a method to build a disaster lexicon based on a sample of disaster messages, whereas our method collects hashtags. The words from the disaster lexicon or the hashtags are used as keywords to retrieve messages. We expect that both methods can find disaster messages. Therefore, in this section, we present a test case to illustrate the limitations of the lexicon-based method.
At any moment on Earth, several disasters can occur at the same time. According to the GAALFE dataset [20], during 2013–2015, an average of five flood events with human losses occurred every month. Every flood overlaps with 4–6 (up to 16) simultaneous flood events. This reasoning can be extended to include all varieties of disasters to show that when trying to retrieve information about one disaster, we have to address many simultaneous events.
Olteanu et al. [10] recommend using in total 380 keywords (unigrams and bigrams) for the data retrieval: flood crisis, victims, flood victims, flood powerful, powerful storms, hoisted flood, storms amazing, explosion, amazing rescue, rescue women, flood cost, etc. Using different sample sets, several lexicons can be built for every type of disaster (e.g., flood lexicon, wildfire lexicon). In such a way, the baseline method can be adapted to separate a target disaster from coincident events. However, only very distinct types of disasters use strongly different lexicons (e.g., floods and wildfires), whereas the lexicon cannot differentiate many disasters with similar impacts (e.g., floods and cyclones).
The classification model developed for our method was trained to conform to disasters of any nature, and the method also utilizes geographic features to localize events in space. For this reason, it can naturally differentiate disaster events.
To demonstrate the high selectivity of the proposed method, the following two groups of simultaneous disasters were chosen: tropical cyclones Nari (Philippines) and Phailin (India) in October 2013; and tropical cyclone Haiyan (Philippines) and a flood in Texas (USA) in November 2013. All of these disasters had similar impacts, i.e., heavy rainfall and river flooding, so a similar lexicon should be used in matching messages. This situation cannot be disambiguated using the baseline method, and the retrieved messages are a mix of corresponding messages. For this reasoning, the separation of cyclones Nari and Phailin requires the training of a specialized classifier; however, it is impossible to disambiguate a large part of the messages, because of the short length of the texts. Cyclone Haiyan was a very disastrous event. It received a large international response in social media. In contrast, the flood in Texas was a local event. Therefore, cyclone Haiyan masked all overlaying disasters in social media.
However, the proposed method is able to find well-separated non-overlapping sets of hashtags. The usage of these hashtags as keywords leads to the retrieval of highly relevant messages for every event separately.
- Group 1:
- –
- Nari: #walangpasok, #santiph
- –
- Phailin: #phailin, #cyclonephailin
- Group 2:
- –
- Flood in Texas: #atxfloods, #atxwx
- –
- Haiyan: #yolandaph, #haiyan, #tacloban, #prayforthephilippines, #prayfortacloban, #rescueph, #yolanda, #tracingph, #reliefph, #ormoc, #typhoonyolanda, #ugc, #typhoonhaiyan, #yolandaupdates, #prayfortheph, #prayforphilippines, #surigaodelnorte, #bangonvisayas, #strongerph, #zoraidaph
Cyclone Haiyan was extensively studied so that the resulting set can be compared with manually-chosen hashtags. Olteanu et al. [9] used the following hashtags to retrieve Twitter messages (keywords are omitted from the list): #typhoonyolanda, #yolandaph, #yolanda, #haiyan, #tracingph, #floodph, #safenow, #rescueph, #reliefph, #typhoonhaiyan, #typhoonaid, #philippines, #supertyphoon, #redcrossphilippines, #yolandaactionweekend.
Hashtag #philippines is a toponym, and #floodph and #typhoon are general disaster markers. These hashtags were frequently mentioned during cyclone Nari, which occurred one month before cyclone Haiyan. The method filtered these hashtags out as not event specific. The hashtags #yolandaactionweekend and #typhoonaid were used to raise money for disaster victims. Messages with these hashtags do not contain toponyms other than “Philippines” and cannot be recognized by this method. Hashtags #safenow and #supertyphoon were low frequency and were removed from the resulting set. The hashtag #redcrossphilippines could not be found in the 1% archive, and the online search retrieved only 31 messages.
The hashtags used in Graham et al. [42] included #haiyan, #yolandaph, #philippines, #typhoonhaiyan, #yolanda, #rescueph, #typhoon, #filipinas, #news and #vietnam. Only parts of them are strongly related to the event: #haiyan, #yolandaph, #typhoonhaiyan, #yolanda and #rescueph. All of them were found by this method.
Using an online search, all messages published on Twitter during the first 30 days following the beginning of the accident were calculated. The top 20 most productive hashtags related to the cyclone Haiyan are listed in Table 4.
From Table 4, it can be seen that the proposed method can locate the very fruitful hashtag #prayforthephilippines not used in the previous research, as well as other low-frequency hashtags. The last hashtag in the list, #zoraidaph, is related to cyclone Podul (local name Zoraida). It affected the Philippines and overlapped with cyclone Haiyan: 3–11 November (Haiyan) and 11–15 November (Podul). The proposed method uses time and location to disambiguate events. This example shows that the time-space feature set is sometimes not enough. Specifically, in this situation, the end date of the earlier event (Haiyan) should be shifted to prevent overlapping.
4. Conclusions and Discussion
In this paper, we tested the idea that hashtags can be connected with related events using geographic information from disaster databases. The experiments show that the method can find distinct clearly-defined hashtag sets, even in the case of multiple simultaneous events with similar impacts. Compared to the baseline, the proposed method has high precision and selectivity.
However, not every message contains hashtags; therefore, when using the proposed method, the messages without hashtags are lost. The fraction of messages with at least one hashtag rose from 16% in 2013 to 24% in 2016 (1% sample of English Tweets). Hashtags are used to attract more attention to a message and to connect it with same-topic messages. Accordingly, we expect that users will mark urgent information and requests for help with hashtags more frequently than in ordinary conversations, so hashtags in disaster messages should be used more often.
Compared to the baseline method, the use of disaster hashtags makes it possible to separate simultaneous events. Hence, the proposed method leads to a significant increase in information relevance in cases when traditional methods are practically useless, such as the analysis of overlapping events. However, the usage of hashtags also has known limitations. For example, during the first days of a disaster, users prefer to use common disaster hashtags; only in the second to third days do event-specific hashtags become popular. A crowd-sourcing and semi-automatic method could be more accurate in data retrieval, while the strongest side of the proposed method is the processing of a series of disasters. In real applications, collected hashtags can be combined with other keyword-based methods to achieve the required balance of information relevance and fullness.
In this paper, we describe a fully-automatic system. We show that simple rules can be developed to estimate the geographic impact area at an acceptable accuracy. The classifier was designed to be general for a large variety of research on disaster media; this does not limit possible application, but rather provides relevant messages that can be classified into more classes according to the research goals [9].
The collected hashtags have good geospatial reference to the region of event activity; therefore, the retrieved messages could also be georeferenced to this region. Hence, standard GIS methods can be used to analyze these social data on a disaster. For example, it can be sentiment analyzing of messages inside of the emergency zone and nearby [43,44]. Gallegos et al. [45] study the difference between the coordinates from the user account (which is probably his/her residence place) and the coordinates where the message was published. Since our hashtags are geocoded to the disaster region, we can propose a third location: the coordinates of a place discussed in the text, so that the international response outside of the impact area can be studied, as well. Analyzing the collocation of these three coordinates of one message is an interesting task for future research.
Hashtags are widely used not only on Twitter, but also on many social networks, such as Facebook, Instagram, Google+ and YouTube. For this reason, the hashtag approach significantly increases the number of data sources and facilitates enriched information awareness through photo and video data from specialized web-sharing services.
The proposed method can be easily adapted to retrieve social media information regarding any event with good spatial localization (riots, festivals, exhibitions). The distribution of biological disasters, such as diseases, may be too wide, making the spatial feature irrelevant.
Disaster databases impose a limitation on the analysis of recent events. For example, the flood database GAALFE publishes new records with a 3–4-month time lag. Cyclone activity in the IBTrACS database is updated every four hours, so that it can be used for near real-time monitoring of social media.
Supplementary Materials
The following are available online at www.mdpi.com/2220-9964/6/7/204/s1: the source code for Section 2.4: corpus preparation and model training; and the source code for Section 2.3, Section 2.4 and Section 2.5: impact area reconstruction and filtering.
Acknowledgments
This work was partially supported by National Key Research and Development Plan of China (Grant Number 2017YFB0504100), the National Natural Science Foundation of China (Grant Number 41222009) and the Fundamental Research Funds for the Central Universities.
Author Contributions
The research was made by Nikita Murzintcev under the supervising of Professor Changxiu Cheng. Shen Shi actively participated in research discussion and data preparation.
Conflicts of Interest
The authors declare no conflict of interest.
Abbreviations
The following abbreviations are used in this manuscript:
| AIDR | Artificial Intelligence for Disaster Response |
| API | Application Programming Interface |
| AUC | Area Under the Curve |
| EM-DAT | Emergency Events Database |
| GAALFE | Global Active Archive of Large Flood Events |
| IBTrACS | International Best Track Archive for Climate Stewardship |
| POS | Parts Of Speech |
| sLDA | Supervised LDA |
| SVM | Support Vector Machine |
References
- Internet Archive. Available online: https://archive.org/details/twitterstream (accessed on 25 January 2017).
- Okolloh, O. Ushahidi or ’testimony’: Web 2.0 tools for crowdsourcing crisis information. Particip. Learn. Action 2009, 59, 65–70. [Google Scholar]
- Haustein, S.; Bowman, T.D.; Holmberg, K.; Tsou, A.; Sugimoto, C.R.; Larivière, V. Tweets as impact indicators: Examining the implications of automated “bot” accounts on Twitter. J. Assoc. Inf. Sci. Technol. 2015, 67, 232–238. [Google Scholar] [CrossRef]
- Imran, M.; Castillo, C.; Lucas, J.; Meier, P.; Vieweg, S. AIDR: Artificial Intelligence for Disaster Response. In Proceedings of the 23rd International Conference on World Wide Web, Seoul, Korea, 7–11 April 2014; International World Wide Web Conferences Steering Committee: Seoul, Korea, 2014; pp. 159–162. [Google Scholar]
- Imran, M.; Castillo, C.; Diaz, F.; Vieweg, S. Processing Social Media Messages in Mass Emergency: A Survey. ACM Comput. Surv. 2015, 47. [Google Scholar] [CrossRef]
- Xiong, F.; Liu, Y.; Zhang, Z.; Zhu, J.; Zhang, Y. An information diffusion model based on retweeting mechanism for online social media. Phys. Lett. A 2012, 376, 2103–2108. [Google Scholar] [CrossRef]
- Xiong, F.; Liu, Y.; Zhang, H.F. Multi-source information diffusion in online social networks. J. Stat. Mech. Theory Exp. 2015, 2015, 07008. [Google Scholar] [CrossRef]
- Friggeri, A.; Adamic, L.A.; Eckles, D.; Cheng, J. Rumor Cascades. In Proceedings of the 8th International AAAI Conference on Weblogs and Social Media, Ann Arbor, MI, USA, 1–4 June 2014; pp. 101–110. [Google Scholar]
- Olteanu, A.; Vieweg, S.; Castillo, C. What to Expect When the Unexpected Happens: Social Media Communications Across Crises. In Proceedings of the 18th ACM Conference on Computer Supported Cooperative Work & Social Computing, Vancouver, BC, Canada, 14–18 March 2015; ACM: Vancouver, BC, Canada, 2015; pp. 994–1009. [Google Scholar]
- Olteanu, A.; Castillo, C.; Diaz, F.; Vieweg, S. CrisisLex: A Lexicon for Collecting and Filtering Microblogged Communications in Crises. In Proceedings of the 8th International Conference on Weblogs and Social Media (ICWSM), Ann Arbor, MI, USA, 1–4 June 2014; AAAI Press: Ann Arbor, MI, USA, 2014; pp. 376–385. [Google Scholar]
- Twubs: Hashtag Directory. Available online: http://twubs.com/p/hashtag-directory (accessed on 25 January 2017).
- Han, B.; Baldwin, T. Lexical Normalisation of Short Text Messages: Makn Sens a #Twitter. In Proceedings of the 49th Annual Meeting of the Association for Computational Linguistics: Human Language Technologies, Portland, OR, USA, 19–24 June 2011; Association for Computational Linguistics: Portland, OR, USA, 2011; Volume 1, pp. 368–378. [Google Scholar]
- Ahmed, B. Lexical normalisation of Twitter Data. In Proceedings of the 2015 Science and Information Conference, London, UK, 28–30 July 2015; Institute of Electrical and Electronics Engineers (IEEE): London, UK, 2015. [Google Scholar]
- Sridhar, V.K.R. Unsupervised text normalization using distributed representations of words and phrases. In Proceedings of the NAACL-HLT, Denver, CO, USA, 31 May–5 June 2015; Association for Computational Linguistics: Denver, CO, USA, 2015; pp. 8–16. [Google Scholar]
- De Albuquerque, J.P.; Herfort, B.; Brenning, A.; Zipf, A. A geographic approach for combining social media and authoritative data towards identifying useful information for disaster management. Int. J. Geogr. Inf. Sci. 2015, 29, 1–23. [Google Scholar] [CrossRef]
- Morstatter, F.; Pfeffer, J.; Liu, H. When is It Biased? Assessing the Representativeness of Twitter’s Streaming API. In Proceedings of the 23rd International Conference on World Wide Web, Seoul, Korea, 7–11 April 2014; ACM: Seoul, Korea, 2014; pp. 555–556. [Google Scholar]
- Guha-Sapir, D.; Below, R.; Hoyois, P.; Université Catholique de Louvain, Brussels, Belgium. EM-DAT: International Disaster Database. Available online: http://www.emdat.be/ (accessed on 25 January 2017).
- Knapp, K.R.; Applequist, S.; Diamond, H.J.; Kossin, J.P.; Kruk, M.; Schreck, C. NCDC International Best Track Archive for Climate Stewardship (IBTrACS) Project, Version 3. [CrossRef]
- Knapp, K.R.; Kruk, M.C.; Levinson, D.H.; Diamond, H.J.; Neumann, C.J. The International Best Track Archive for Climate Stewardship (IBTrACS). Bull. Am. Meteorol. Soc. 2010, 91, 363–376. [Google Scholar] [CrossRef]
- Brakenridge, G.R.; Dartmouth Flood Observatory, University of Colorado. Global Active Archive of Large Flood Events. Available online: http://floodobservatory.colorado.edu/Archives/index.html (accessed on 25 January 2017).
- Ramm, F. OpenStreetMap Data in Layered GIS Format. Version 0.6.7. Available online: https://www.geofabrik.de/data/geofabrik-osm-gis-standard-0.6.pdf (accessed on 25 January 2017).
- Pomeroy, J.W.; Stewart, R.E.; Whitfield, P.H. The 2013 flood event in the South Saskatchewan and Elk River basins: Causes, assessment and damages. Can. Water Resour. J. Rev. Can. Ressour. Hydr. 2015, 41, 105–117. [Google Scholar] [CrossRef]
- Milrad, S.M.; Gyakum, J.R.; Atallah, E.H. A Meteorological Analysis of the 2013 Alberta Flood: Antecedent Large-Scale Flow Pattern and Synoptic-Dynamic Characteristics. Mon. Weather Rev. 2015, 143, 2817–2841. [Google Scholar] [CrossRef]
- Natural Resources Canada (NRCan). Atlas of Canada 1,000,000 National Frameworks Data, Hydrology—Major River Basin. v6.0. Dataset; 2003. Available online: http://geogratis.gc.ca/api/en/nrcan-rncan/ess-sst/14f77ebc-5600-5e33-9565-1bd58086f98d.html (accessed on 25 January 2017).
- Dee, D.P.; Uppala, S.M.; Simmons, A.J.; Berrisford, P.; Poli, P.; Kobayashi, S.; Andrae, U.; Balmaseda, M.A.; Balsamo, G.; Bauer, P.; et al. The ERA-Interim reanalysis: Configuration and performance of the data assimilation system. Q. J. R. Meteorol. Soc. 2011, 137, 553–597. [Google Scholar] [CrossRef]
- Blake, E.S. The 2013 Atlantic Hurricane Season: The Quietest Year in Two Decades. Weatherwise 2014, 67, 28–34. [Google Scholar] [CrossRef]
- Kimberlain, T.B. The 2013 Eastern North Pacific Hurricane Season: Mexico Takes the Brunt. Weatherwise 2014, 67, 35–42. [Google Scholar] [CrossRef]
- Ashktorab, Z.; Brown, C.; Nandi, M.; Culotta, A. Tweedr: Mining Twitter to Inform Disaster Response. In Proceedings of the 11th International ISCRAM Conference, University Park, PA, USA, 18–21 May 2014; Hiltz, S.R., Pfaff, M.S., Plotnick, L., Shih, P.C., Eds.; 2014; pp. 354–358. [Google Scholar]
- Cobo, A.; Parra, D.; Navón, J. Identifying Relevant Messages in a Twitter-based Citizen Channel for Natural Disaster Situations. In Proceedings of the 24th International Conference on World Wide Web, Florence, Italy, 18–22 May 2015; pp. 1189–1194. [Google Scholar]
- Roy Chowdhury, S.; Imran, M.; Asghar, M.R.; Amer-Yahia, S.; Castillo, C. Tweet4act: Using Incident-Specific Profiles for Classifying Crisis-Related Messages. In Proceedings of the 10th International ISCRAM Conference, Baden-Baden, Germany, 12–15 May 2013; Comes, T., Fiedrich, F., Fortier, S., Geldermann, J., Müller, T., Eds.; 2013; p. 159. [Google Scholar]
- Li, H.; Guevara, N.; Herndon, N.; Caragea, D.; Caragea, K.N.C.; Squicciarini, A.; Tapia, A.H. Twitter Mining for Disaster Response: A Domain Adaptation Approach. In Proceedings of the 12th International Conference on Information Systems for Crisis Response and Management (ISCRAM 2015), Kristiansand, Norway, 24–27 May 2015; Palen, L., Buscher, M., Comes, T.A.H., Eds.; 2015. [Google Scholar]
- Meier, P.P.; Castillo, C.; Imran, M.; Elbassuoni, S.M.; Diaz, F. Extracting Information Nuggets from Disaster-Related Messages in Social Media. In Proceedings of the 10th International ISCRAM Conference, Baden-Baden, Germany, 12–15 May 2013; Comes, T., Fiedrich, F., Fortier, S., Geldermann, J., Müller, T., Eds.; p. 129. [Google Scholar]
- Jurka, T.P.; Collingwood, L.; Boydstun, A.E.; Grossman, E.; van Atteveldt, W. RTextTools: Automatic Text Classification via Supervised Learning, R Package Version 1.4.2; 2014. Available online: https://CRAN.R-project.org/package=RTextTools (accessed on 25 January 2017).
- Meyer, D.; Dimitriadou, E.; Hornik, K.; Weingessel, A.; Leisch, F. e1071: Misc Functions of the Department of Statistics, Probability Theory Group (Formerly: E1071), TU Wien, R Package Version 1.6-7; 2015. Available online: https://CRAN.R-project.org/package=e1071 (accessed on 25 January 2017).
- Chang, J. lda: Collapsed Gibbs Sampling Methods for Topic Models, R Package Version 1.3.2; 2012. Available online: https://CRAN.R-project.org/package=lda (accessed on 25 January 2017).
- Cao, J.; Xia, T.; Li, J.; Zhang, Y.; Tang, S. A density-based method for adaptive LDA model selection. Neurocomputing 2009, 72, 1775–1781. [Google Scholar] [CrossRef]
- Griffiths, T.L.; Steyvers, M. Finding scientific topics. Proc. Natl. Acad. Sci. USA 2004, 101, 5228–5235. [Google Scholar] [CrossRef] [PubMed]
- Murzintcev, N. ldatuning: Tuning of the Latent Dirichlet Allocation (LDA) Models Prameters, R Package Version 0.1.9000; 2015. Available online: https://CRAN.R-project.org/package=lda (accessed on 25 January 2017).
- Kireyev, K.; Palen, L.; Anderson, K. Applications of topics models to analysis of disaster-related twitter data. In NIPS Workshop on Applications for Topic Models: Text and Beyond; NIPS Workshop: Whistler, BC, Canada, 2009. [Google Scholar]
- Earl, R.A.; Jordan, T.R.; Scanes, D.M. Halloween 2013: Another “100-Year” Storm and Flood in Central Texas. Pap. Appl. Geogr. 2015, 1, 342–347. [Google Scholar] [CrossRef]
- Gochis, D.; Schumacher, R.; Friedrich, K.; Doesken, N.; Kelsch, M.; Sun, J.; Ikeda, K.; Lindsey, D.; Wood, A.; Dolan, B.; et al. The Great Colorado Flood of September 2013. Bull. Am. Meteorol. Soc. 2015, 96, 1461–1487. [Google Scholar] [CrossRef]
- Graham, C.; Thompson, C.; Wolcott, M.; Pollack, J.; Tran, M. A guide to social media emergency management analytics: Understanding its place through Typhoon Haiyan tweets. Stat. J. IAOS 2015, 31, 227–236. [Google Scholar] [CrossRef]
- Beigi, G.; Hu, X.; Maciejewski, R.; Liu, H. An Overview of Sentiment Analysis in Social Media and Its Applications in Disaster Relief. In Sentiment Analysis and Ontology Engineering: An Environment of Computational Intelligence; Pedrycz, W., Chen, S.M., Eds.; Springer: Cham, Switzerland, 2016; pp. 313–340. [Google Scholar]
- Lu, Y.; Hu, X.; Wang, F.; Kumar, S.; Liu, H.; Maciejewski, R. Visualizing Social Media Sentiment in Disaster Scenarios. In Proceedings of the 24th International Conference on World Wide Web, Florence, Italy, 18–22 May 2015; ACM: New York, NY, USA, 2015; pp. 1211–1215. [Google Scholar]
- Gallegos, L.; Lerman, K.; Huang, A.; Garcia, D. Geography of Emotion: Where in a City Are People Happier? In Proceedings of the 25th International Conference Companion on World Wide Web, Montreal, QC, Canada, 11–15 April 2016; International World Wide Web Conferences Steering Committee: Geneva, Switzerland, 2016; pp. 569–574. [Google Scholar]
Figure 1.
Workflow diagram of the proposed method.
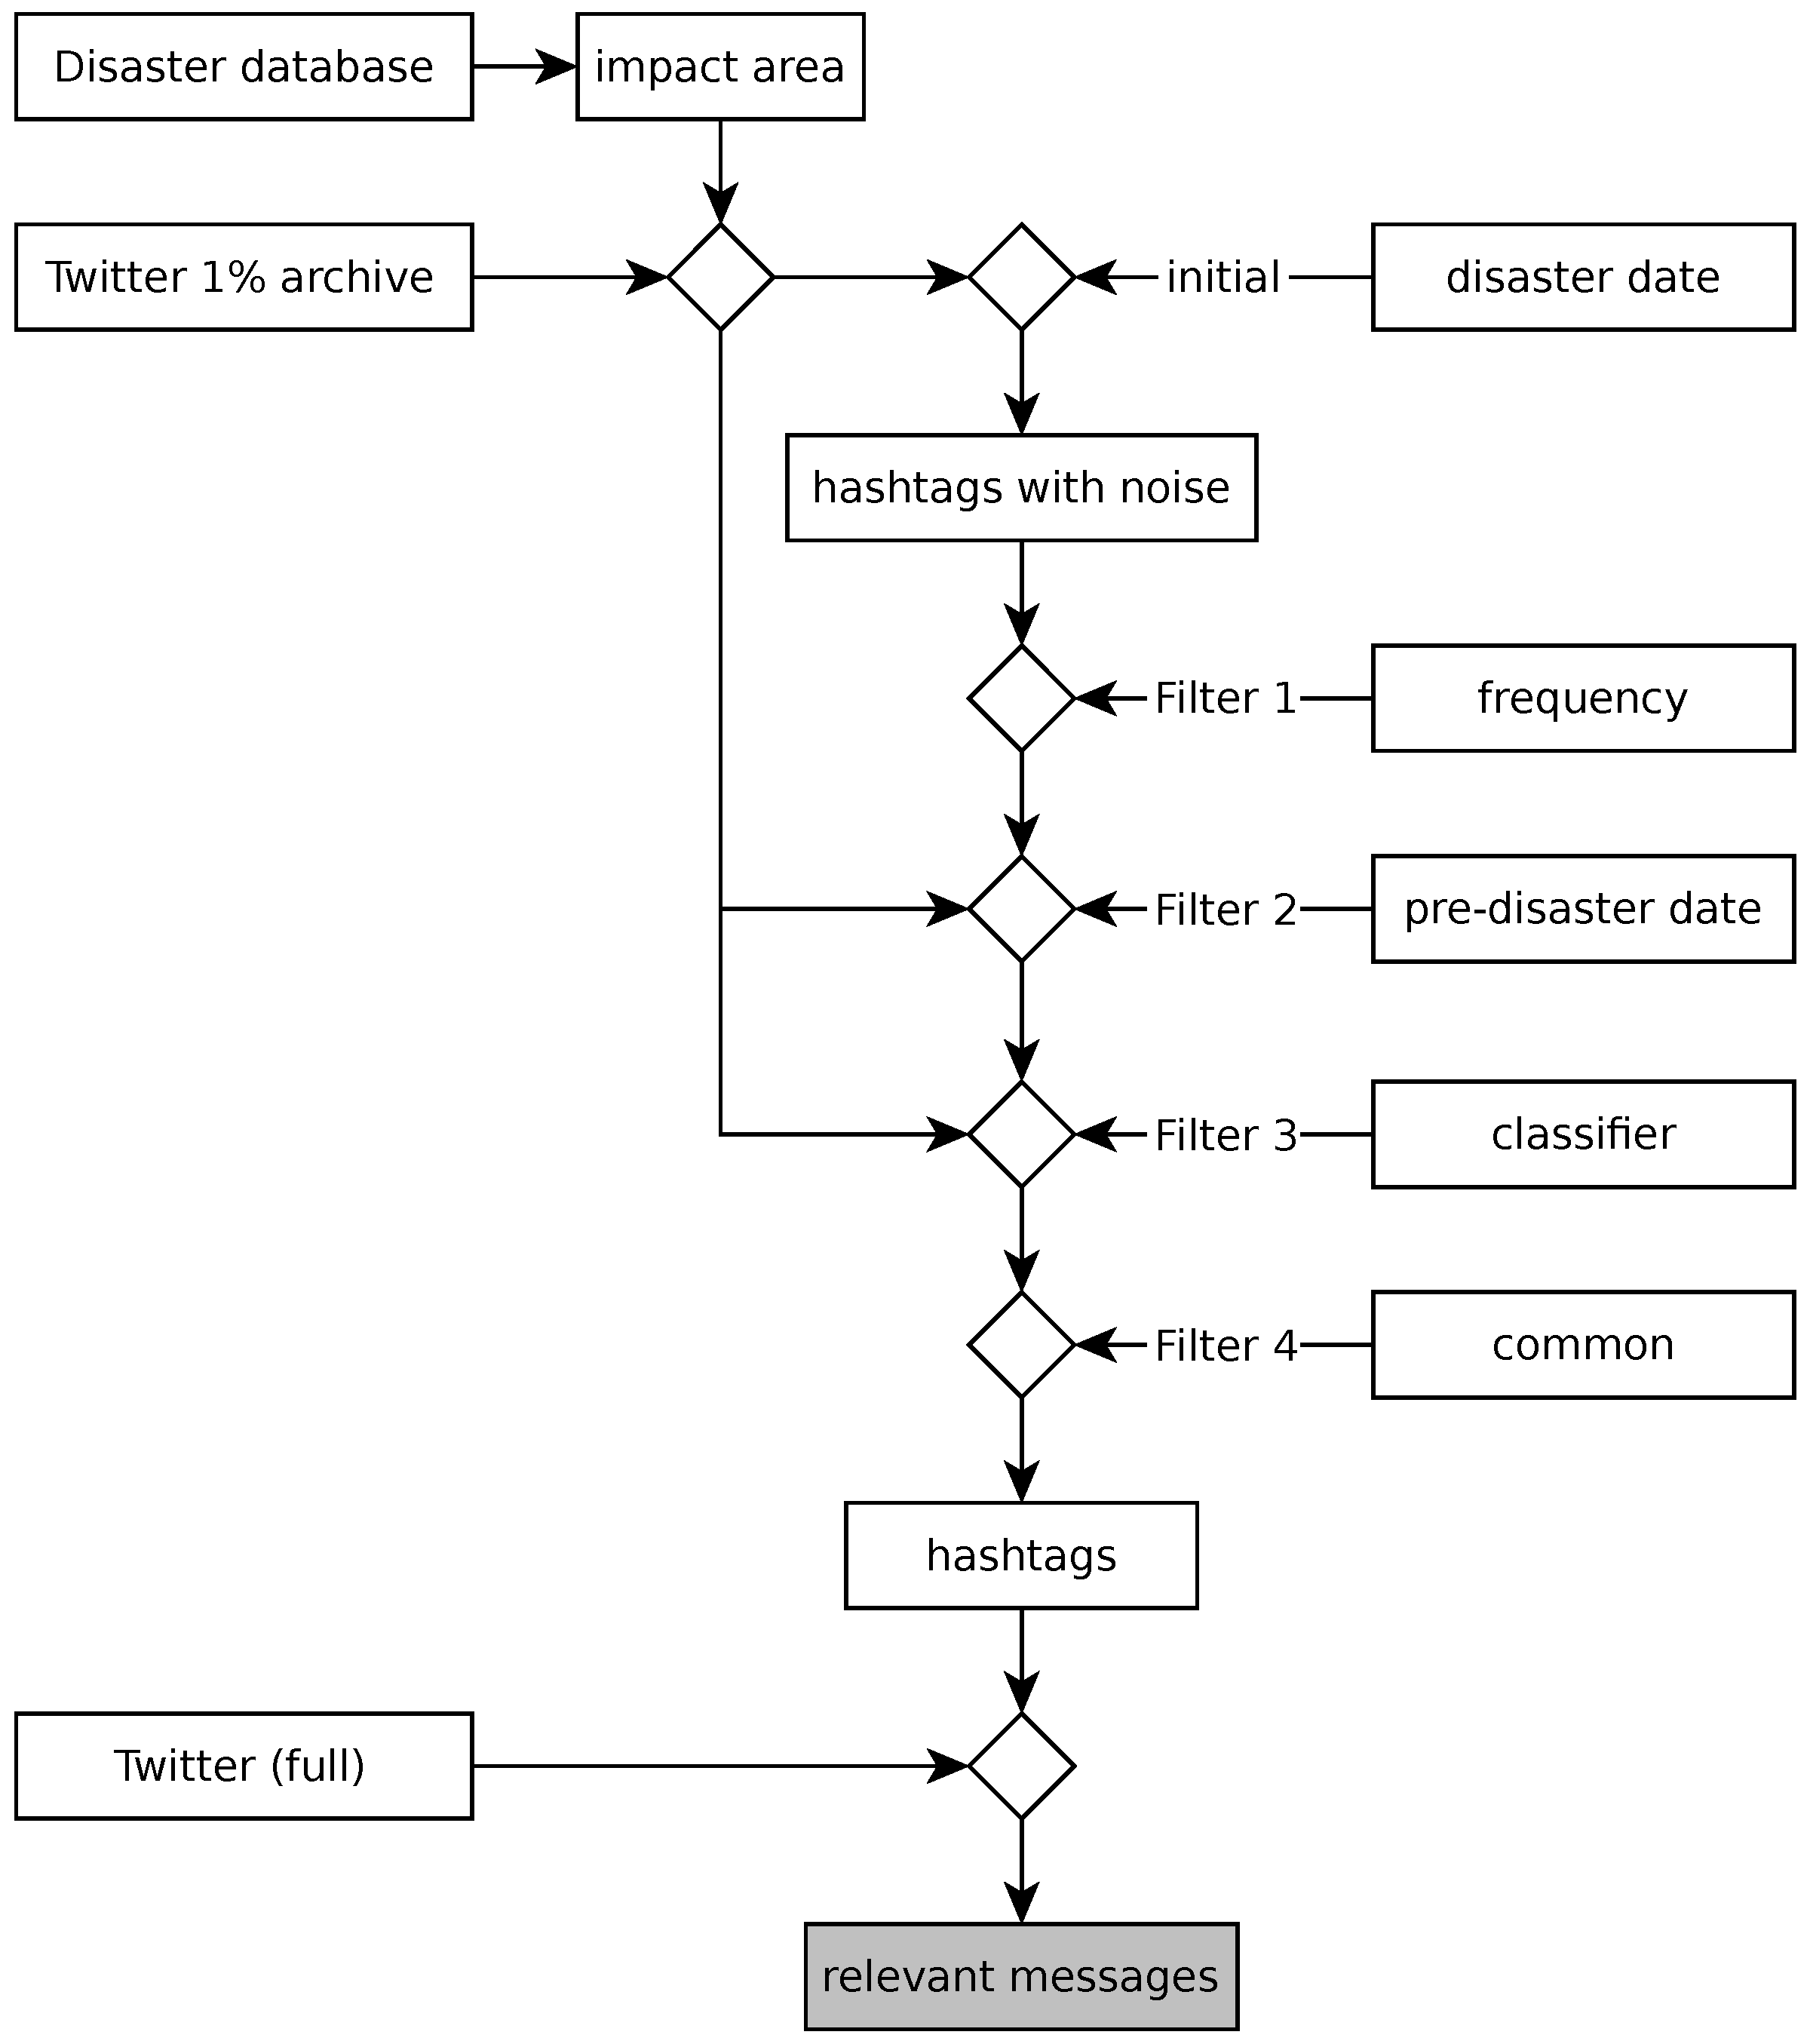
Figure 2.
Region affected by the 2013 Alberta flood, Canada. South Saskatchewan river basin (solid line), polygon from the GAALFE dataset (dashed line).
Figure 2.
Region affected by the 2013 Alberta flood, Canada. South Saskatchewan river basin (solid line), polygon from the GAALFE dataset (dashed line).
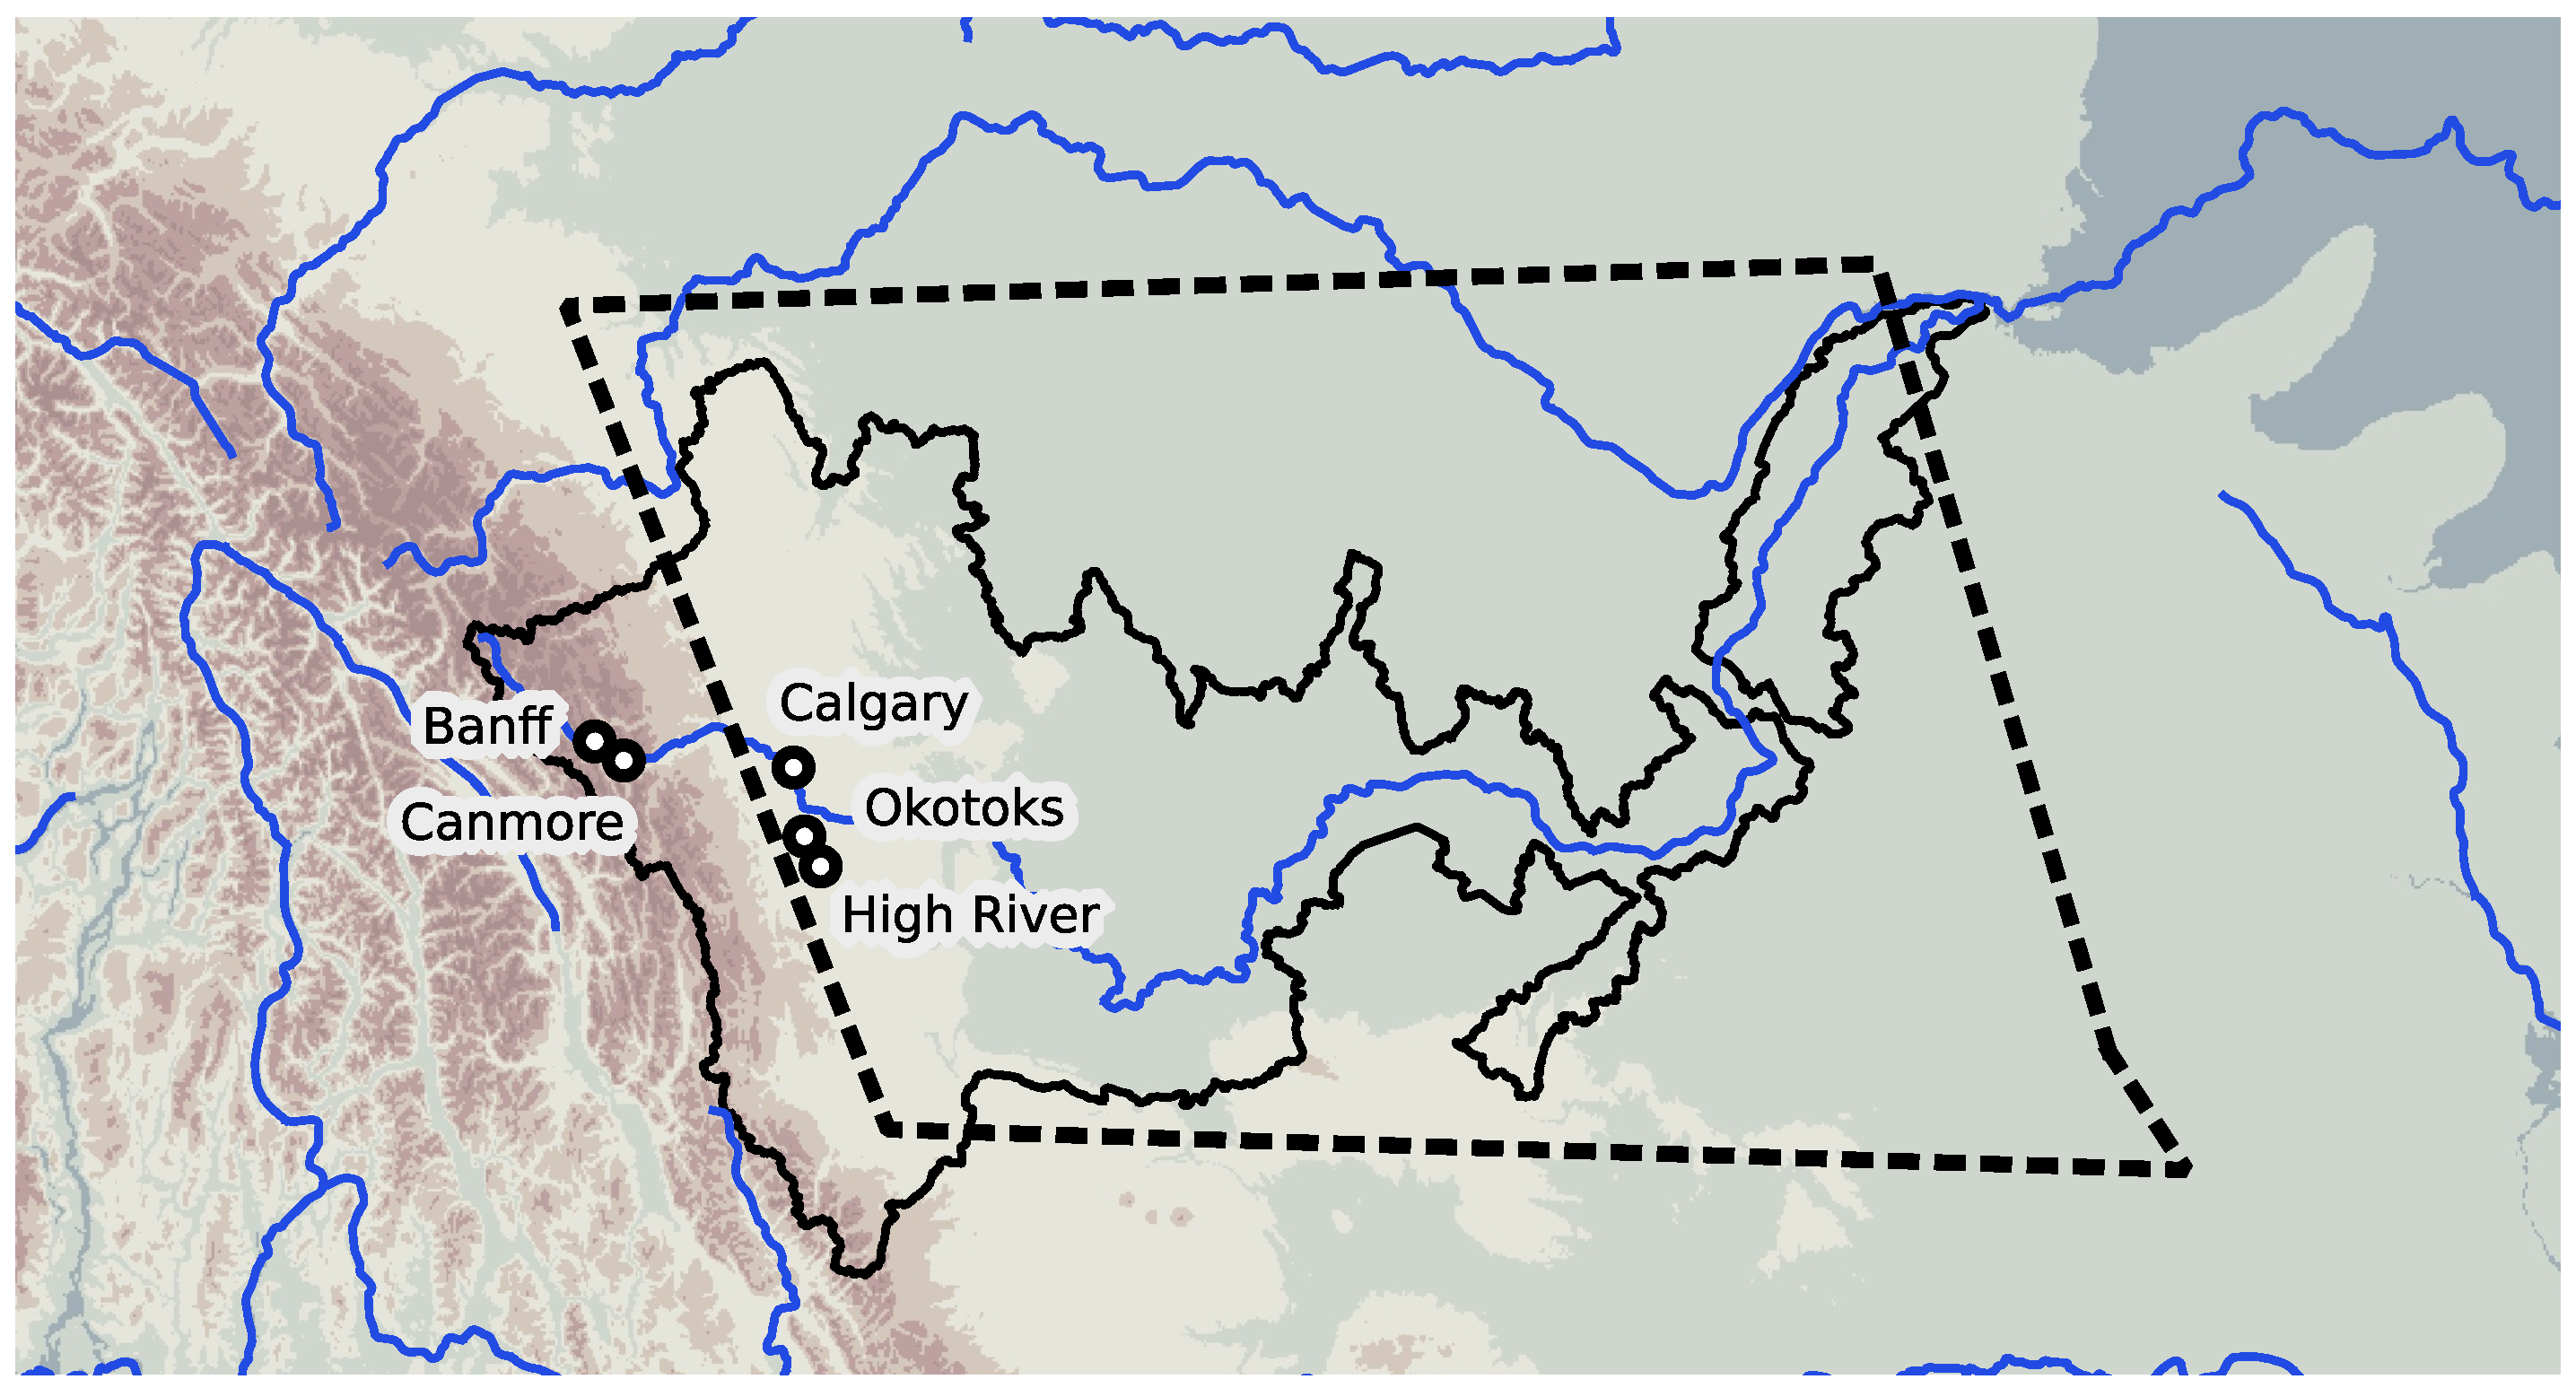
Figure 3.
Transformation of the cyclone track to 34-knot boundaries (cyclones Manuel and Ingrid, 2013).Wind speed boundaries
Figure 3.
Transformation of the cyclone track to 34-knot boundaries (cyclones Manuel and Ingrid, 2013).Wind speed boundaries
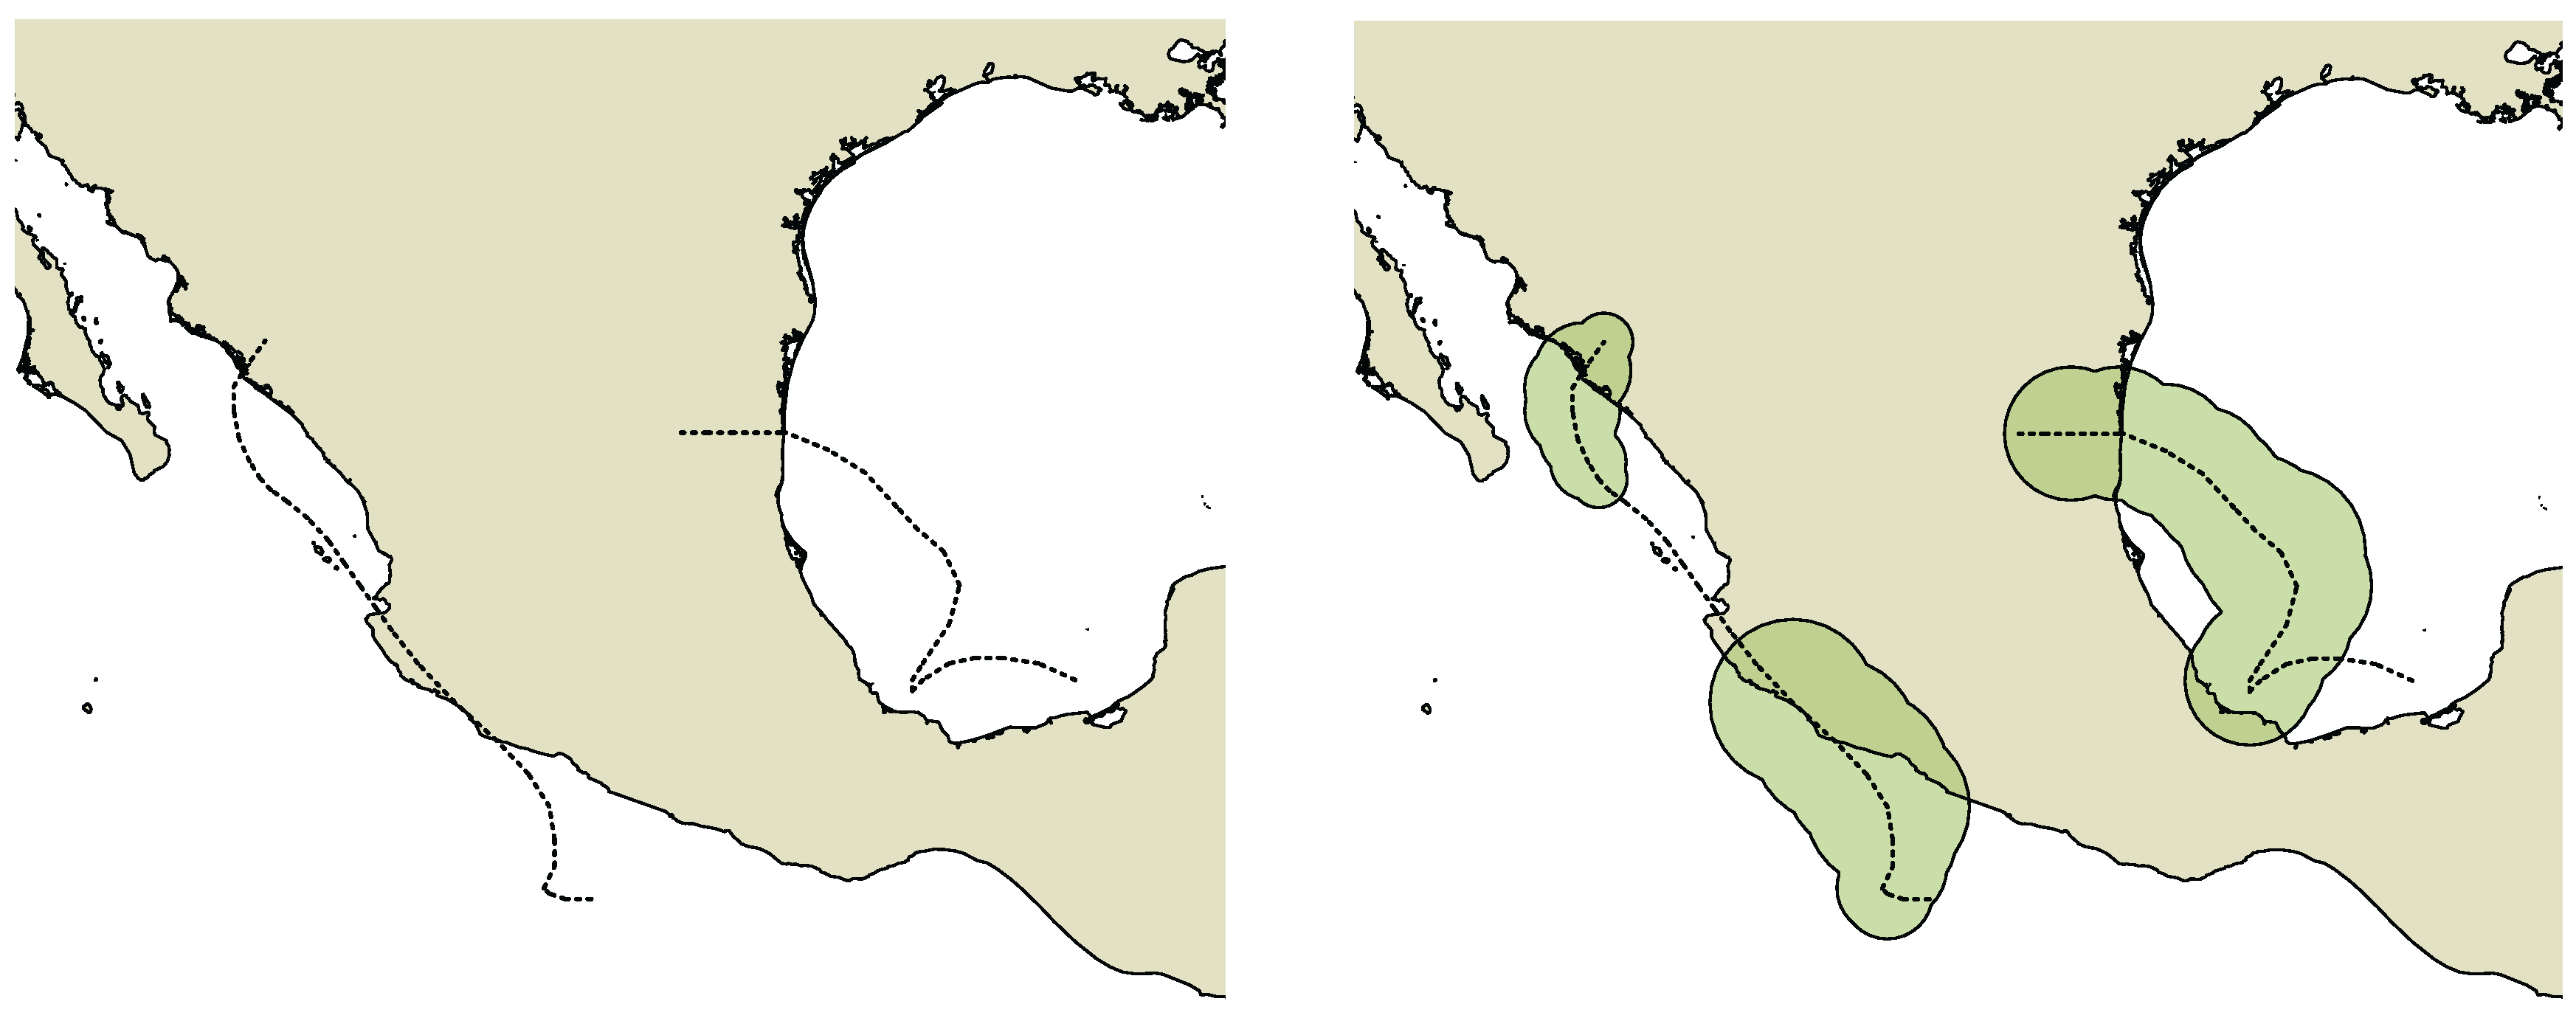
Figure 4.
Representation of a disaster process (cyclones Manuel and Ingrid, 2013).
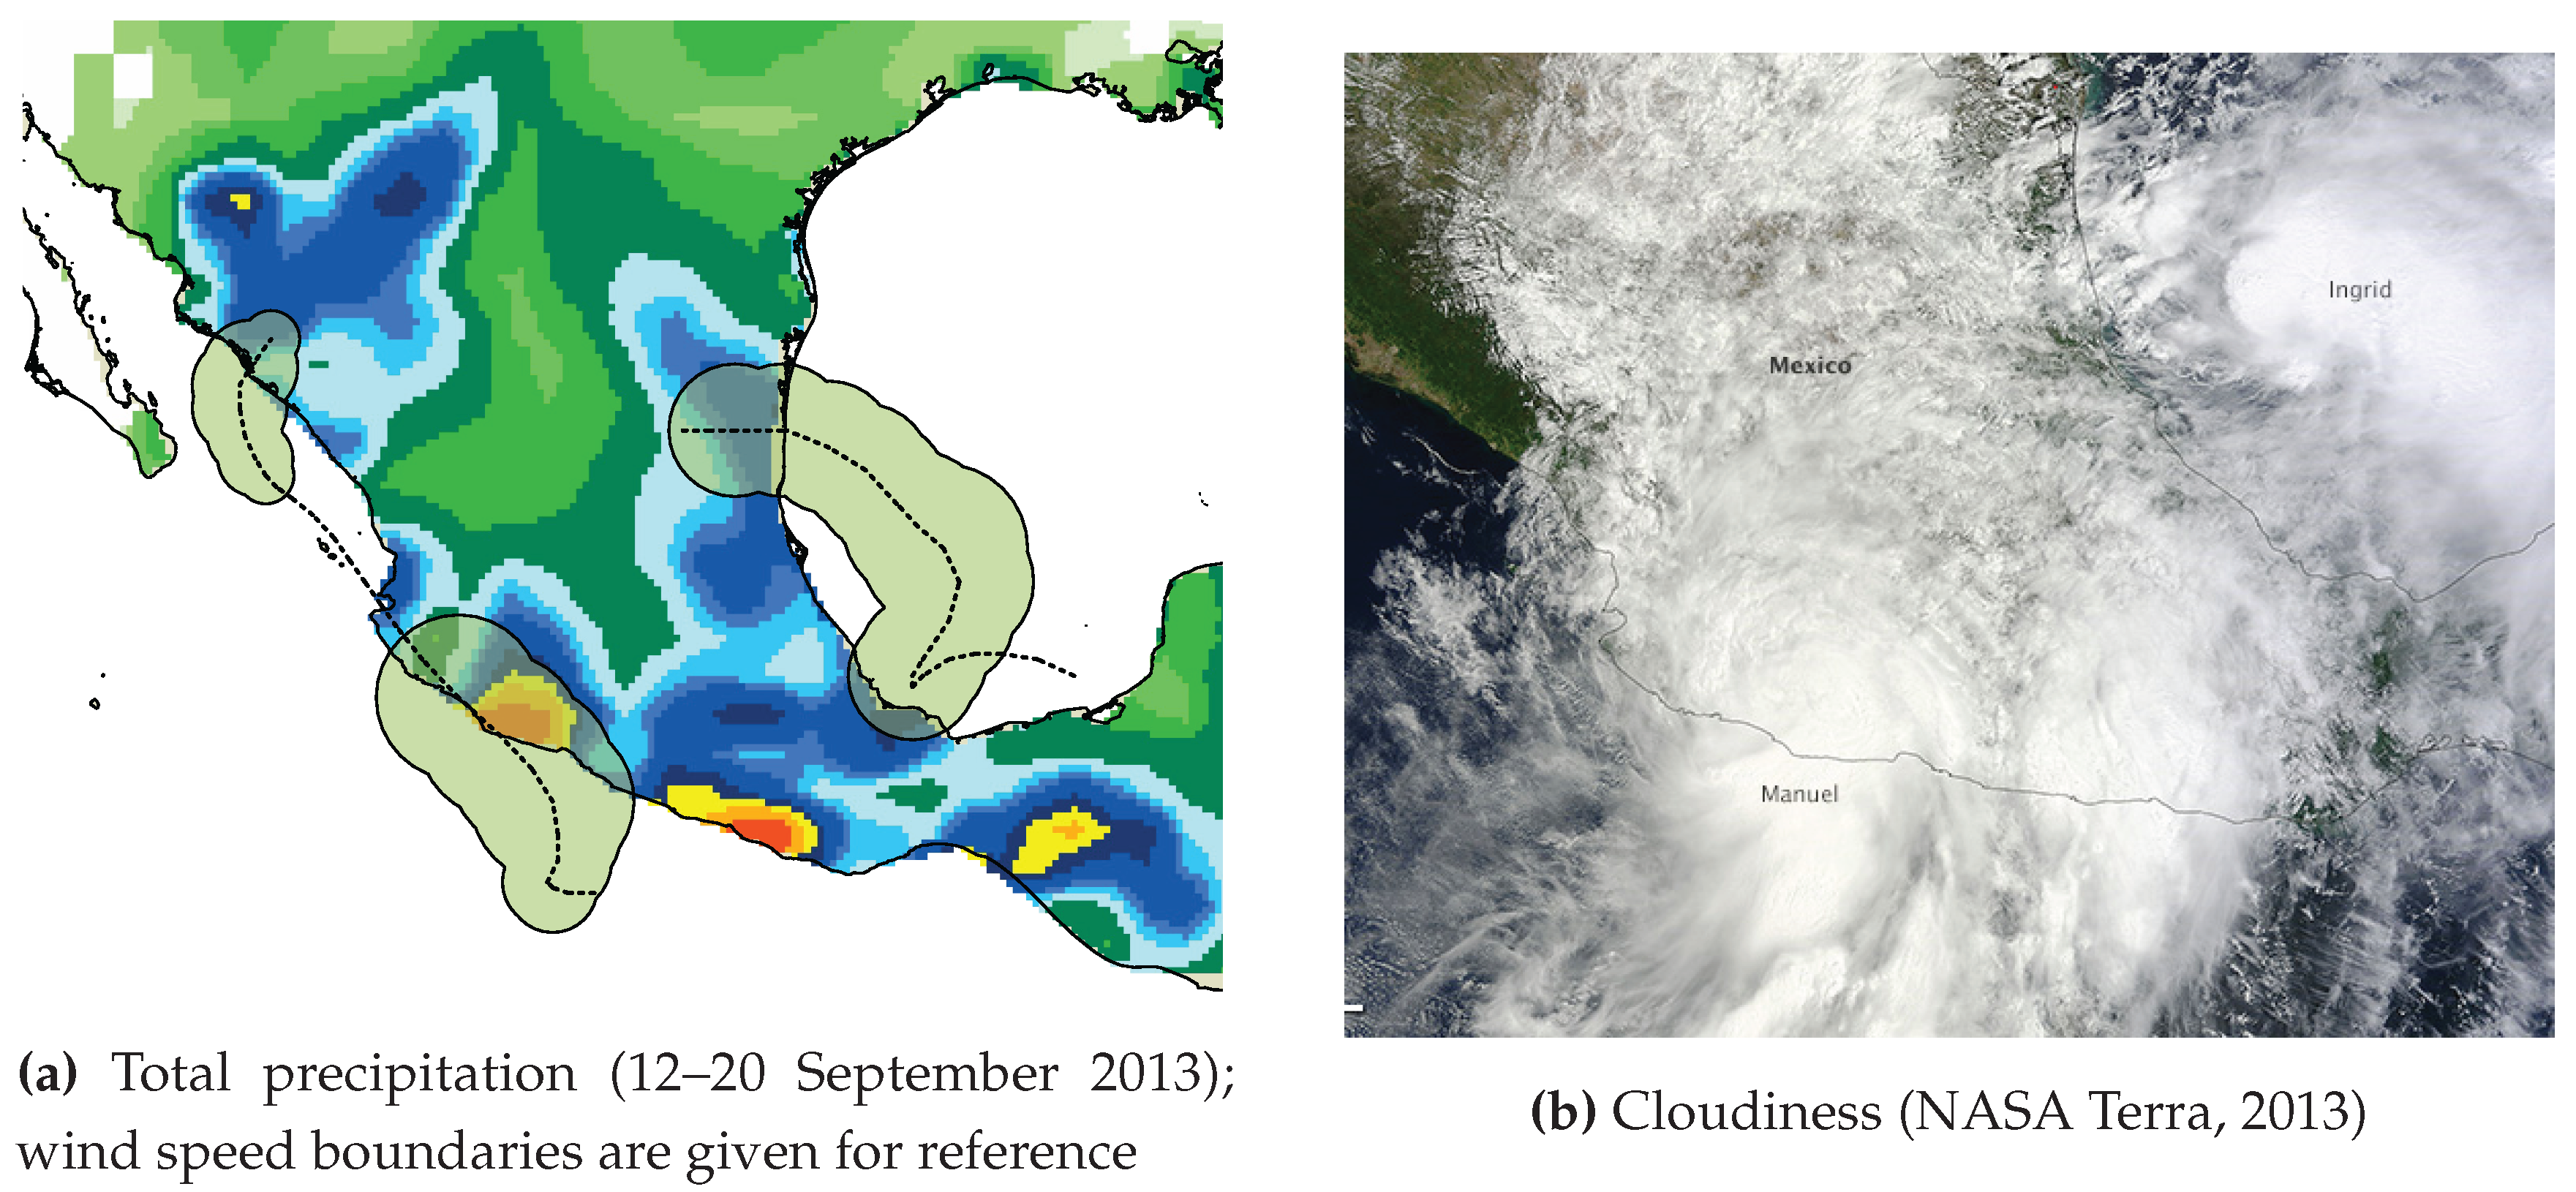
Figure 5.
Model quality according to the different sizes of training datasets.

Figure 6.
List of hashtags used in messages from the impact area of flood in Texas, USA (2013).


Table 1.
Corpus size by categories.
| Category | Messages | Events |
|---|---|---|
| earthquake | 3689 | 5 |
| geophysical | 648 | 2 |
| flood | 11,221 | 6 |
| storm | 11,263 | 5 |
| wildfire | 1678 | 2 |
| technological | 7613 | 8 |
| Total | 36,112 | 28 |
Table 2.
Models quality by disaster categories.
| SVM | sLDA | |||||
|---|---|---|---|---|---|---|
| Events | Precision | Recall | AUC | Precision | Recall | AUC |
| earthquake | 90.5% | 90.2% | 0.946 | 84.1% | 89.8% | 0.920 |
| flood | 88.9 | 84.3 | 0.928 | 84.7 | 82.2 | 0.896 |
| storm | 90.9 | 88.1 | 0.954 | 84.7 | 88.4 | 0.925 |
| technological | 90.4 | 95.7 | 0.976 | 84.8 | 99.1 | 0.974 |
| wildfires | 87.0 | 78.9 | 0.908 | 81.3 | 81.4 | 0.877 |
| all-in-one | 89.3 | 85.4 | 0.937 | 83.7 | 86.1 | 0.909 |
Table 3.
Model quality compared to the baseline methods.
| Training Dataset | Model Quality | ||||
|---|---|---|---|---|---|
| Messages | Events | Precision | Recall | AUC | |
| Ashktorab et al. [28] | 1049 | 12 | 78.0 | 57.0 | 0.880 |
| Cobo et al. [29] | 2187 | 1 | 80.7 | 67.3 | 0.844 |
| new model sLDA | 73,698 | 28 | 83.7 | 86.1 | 0.909 |
| new model SVM | 89.3 | 85.4 | 0.937 | ||
Table 4.
Number of messages corresponding to hashtags.
| Hashtag | Messages | Hashtag | Messages |
|---|---|---|---|
| yolandaph | 109,852 | prayfortacloban | 4373 |
| prayforthephilippines | 104,280 | bangonvisayas | 4147 |
| haiyan | 56,218 | tracingph | 3610 |
| typhoonhaiyan | 21,225 | supertyphoon | 2660 |
| yolanda | 17,299 | strongerph | 2160 |
| reliefph | 16,758 | yolandaupdates | 1716 |
| rescueph | 8607 | ugc | 810 |
| prayforphilippines | 8229 | ormoc | 806 |
| tacloban | 7825 | prayfortheph | 471 |
| typhoonyolanda | 5184 | safenow | 139 |
© 2017 by the authors. Licensee MDPI, Basel, Switzerland. This article is an open access article distributed under the terms and conditions of the Creative Commons Attribution (CC BY) license (http://creativecommons.org/licenses/by/4.0/).
Share and Cite
MDPI and ACS Style
Murzintcev, N.; Cheng, C. Disaster Hashtags in Social Media. ISPRS Int. J. Geo-Inf. 2017, 6, 204. https://doi.org/10.3390/ijgi6070204
AMA Style
Murzintcev N, Cheng C. Disaster Hashtags in Social Media. ISPRS International Journal of Geo-Information. 2017; 6(7):204. https://doi.org/10.3390/ijgi6070204
Chicago/Turabian StyleMurzintcev, Nikita, and Changxiu Cheng. 2017. "Disaster Hashtags in Social Media" ISPRS International Journal of Geo-Information 6, no. 7: 204. https://doi.org/10.3390/ijgi6070204
Note that from the first issue of 2016, this journal uses article numbers instead of page numbers. See further details here.