Comparative Assessment of Three Nonlinear Approaches for Landslide Susceptibility Mapping in a Coal Mine Area

Abstract
:1. Introduction
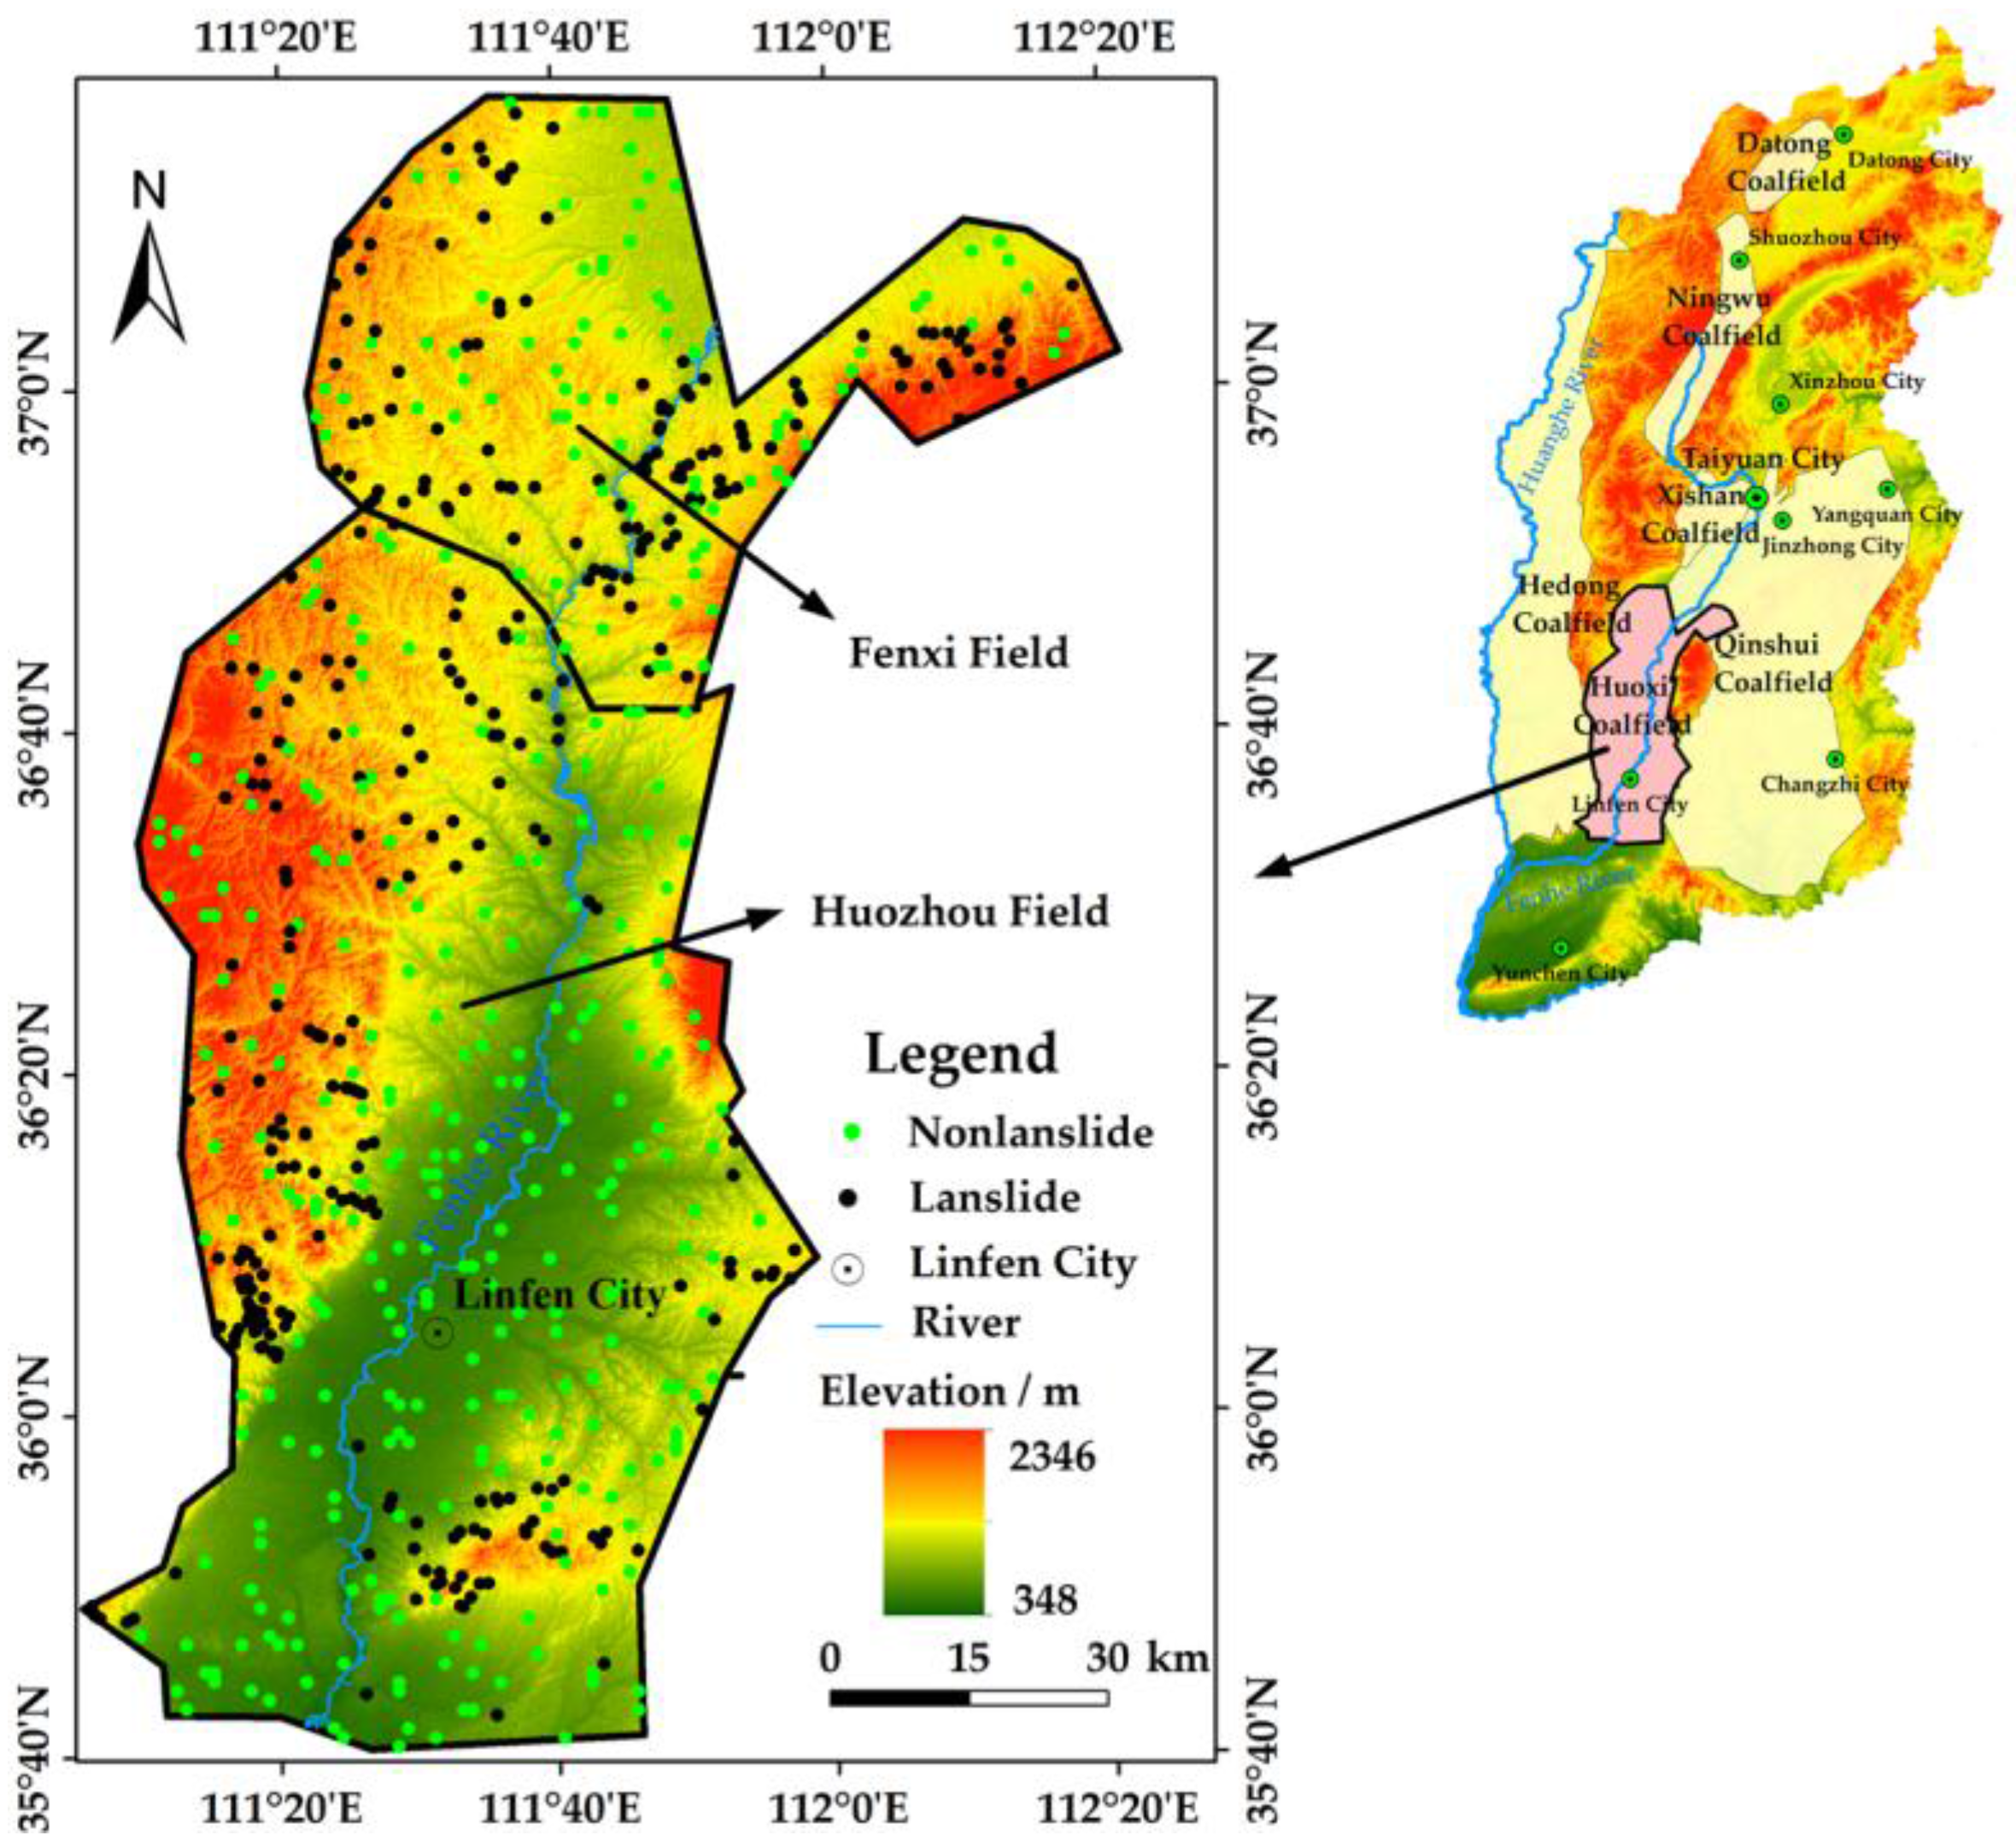
2. Study Area
3. Landslide Inventory and Conditioning Factors
3.1. Landslide Inventory
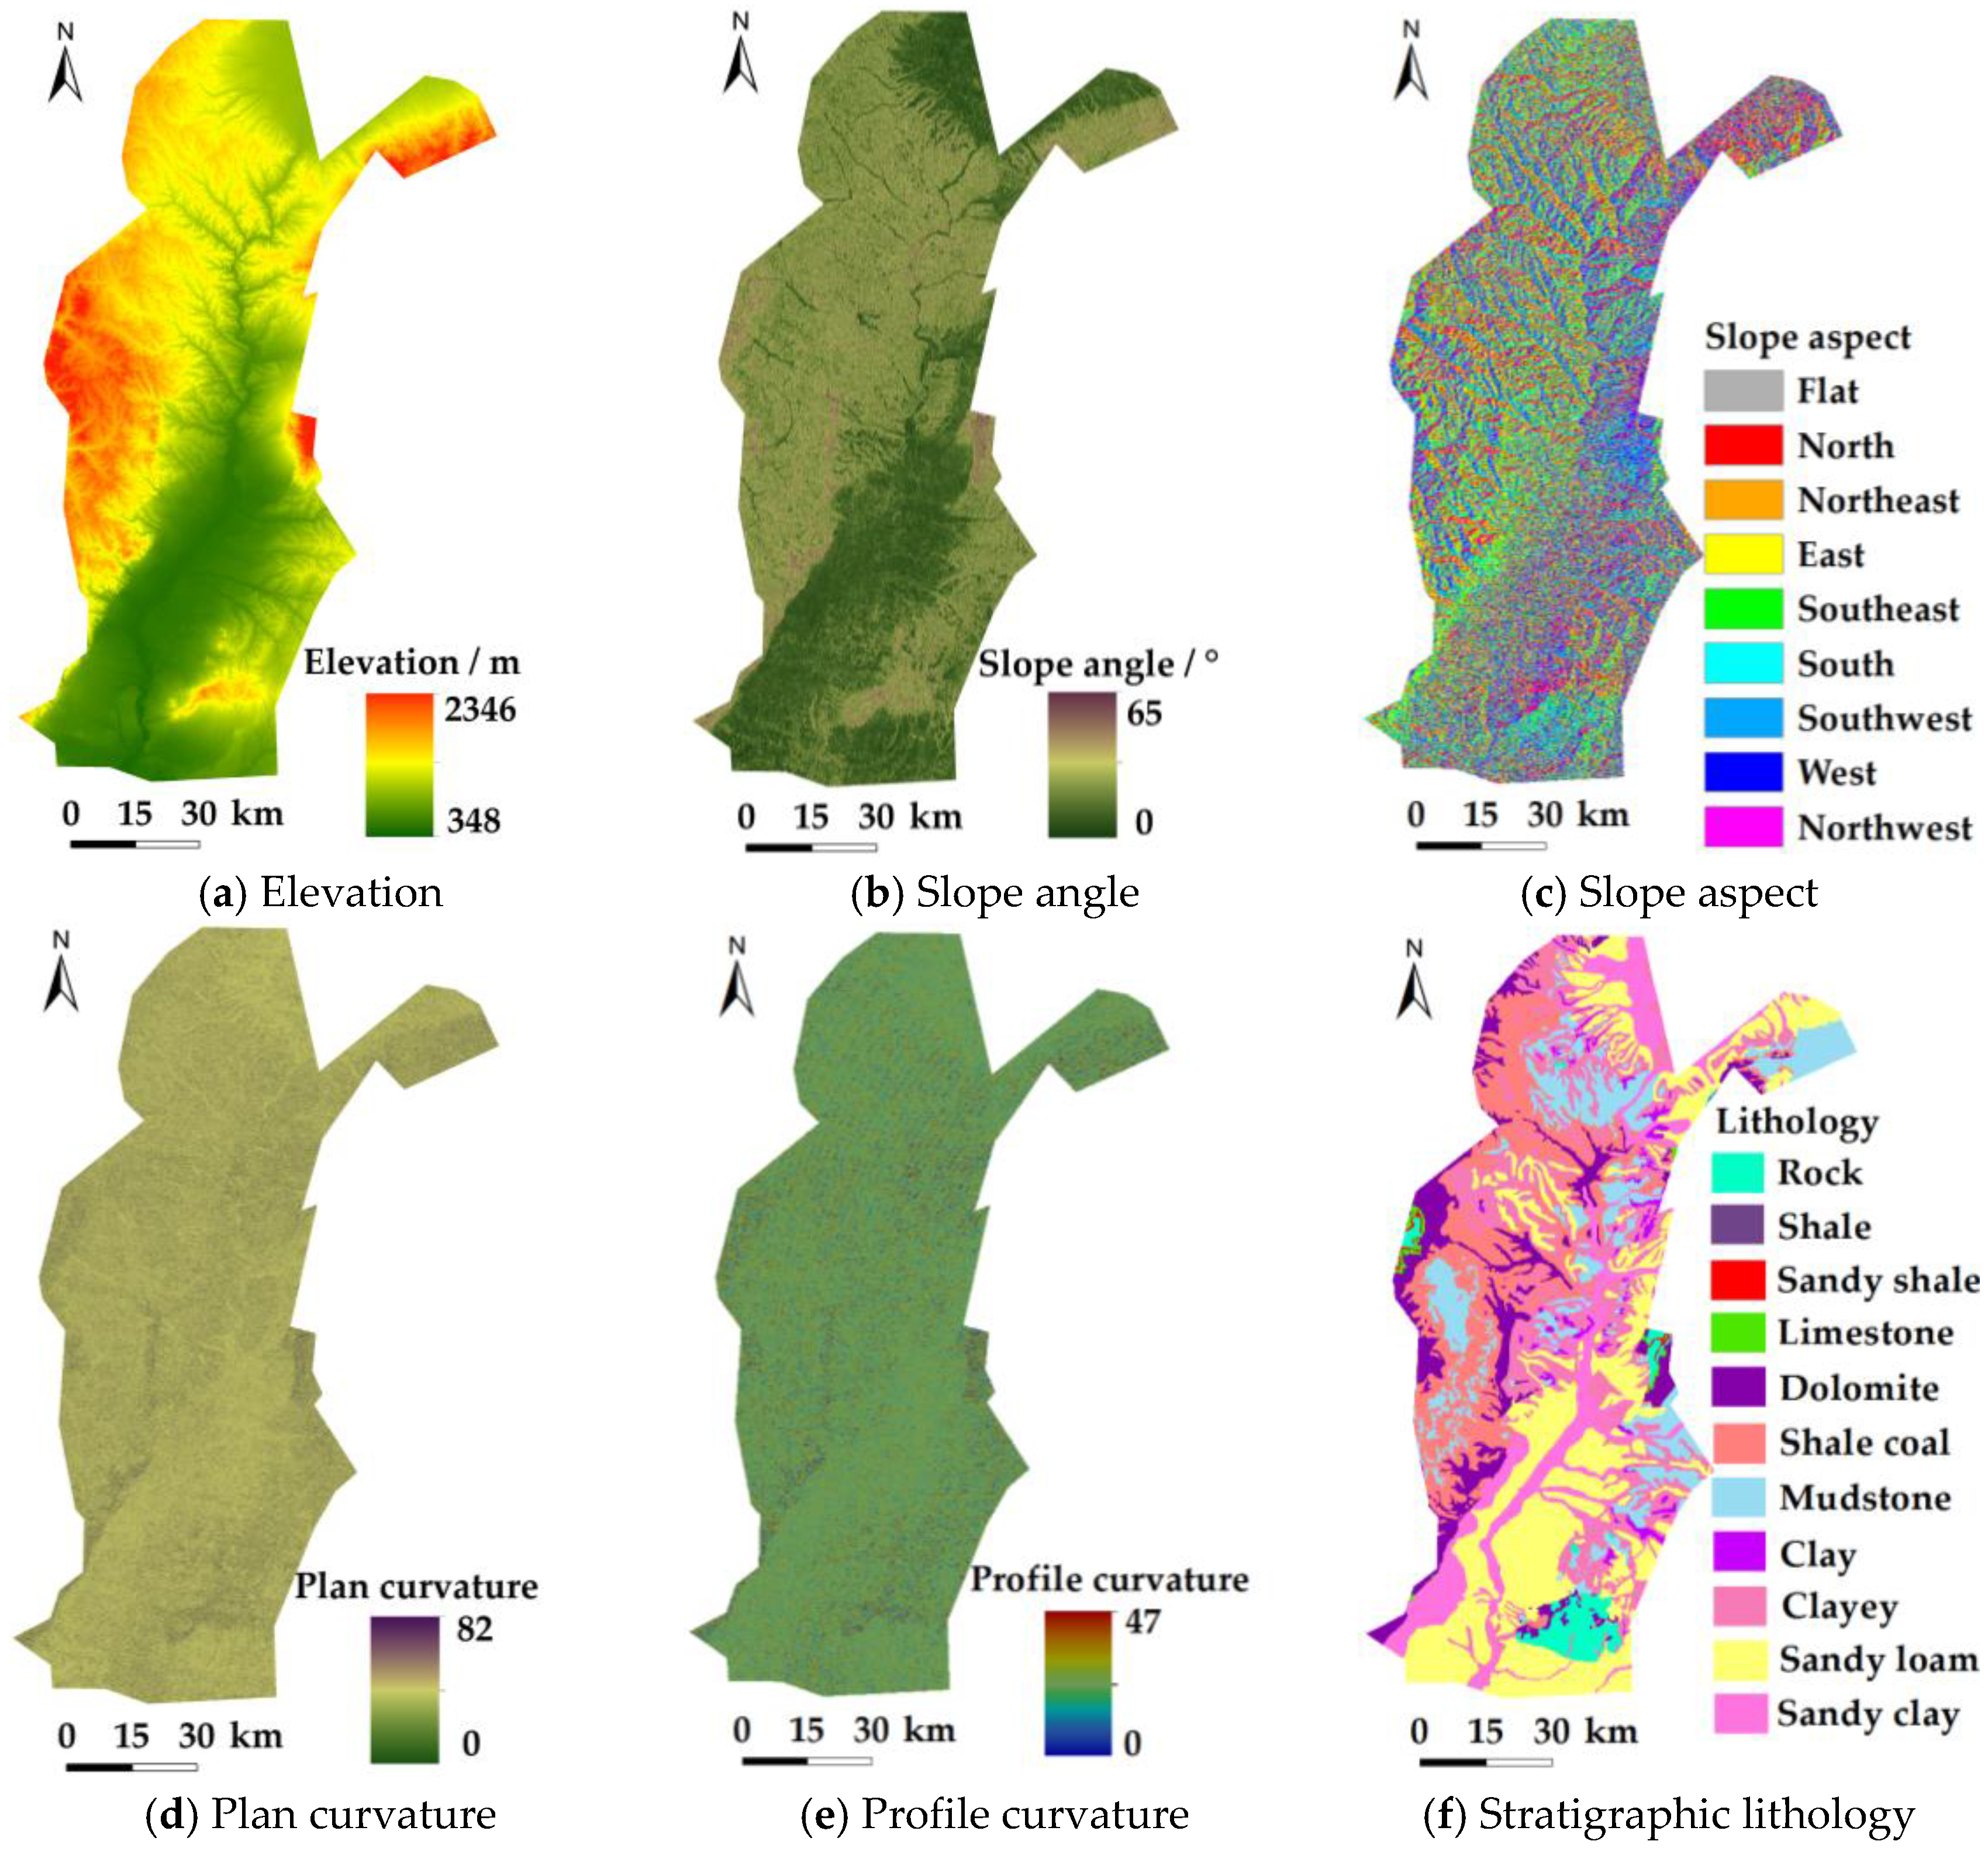
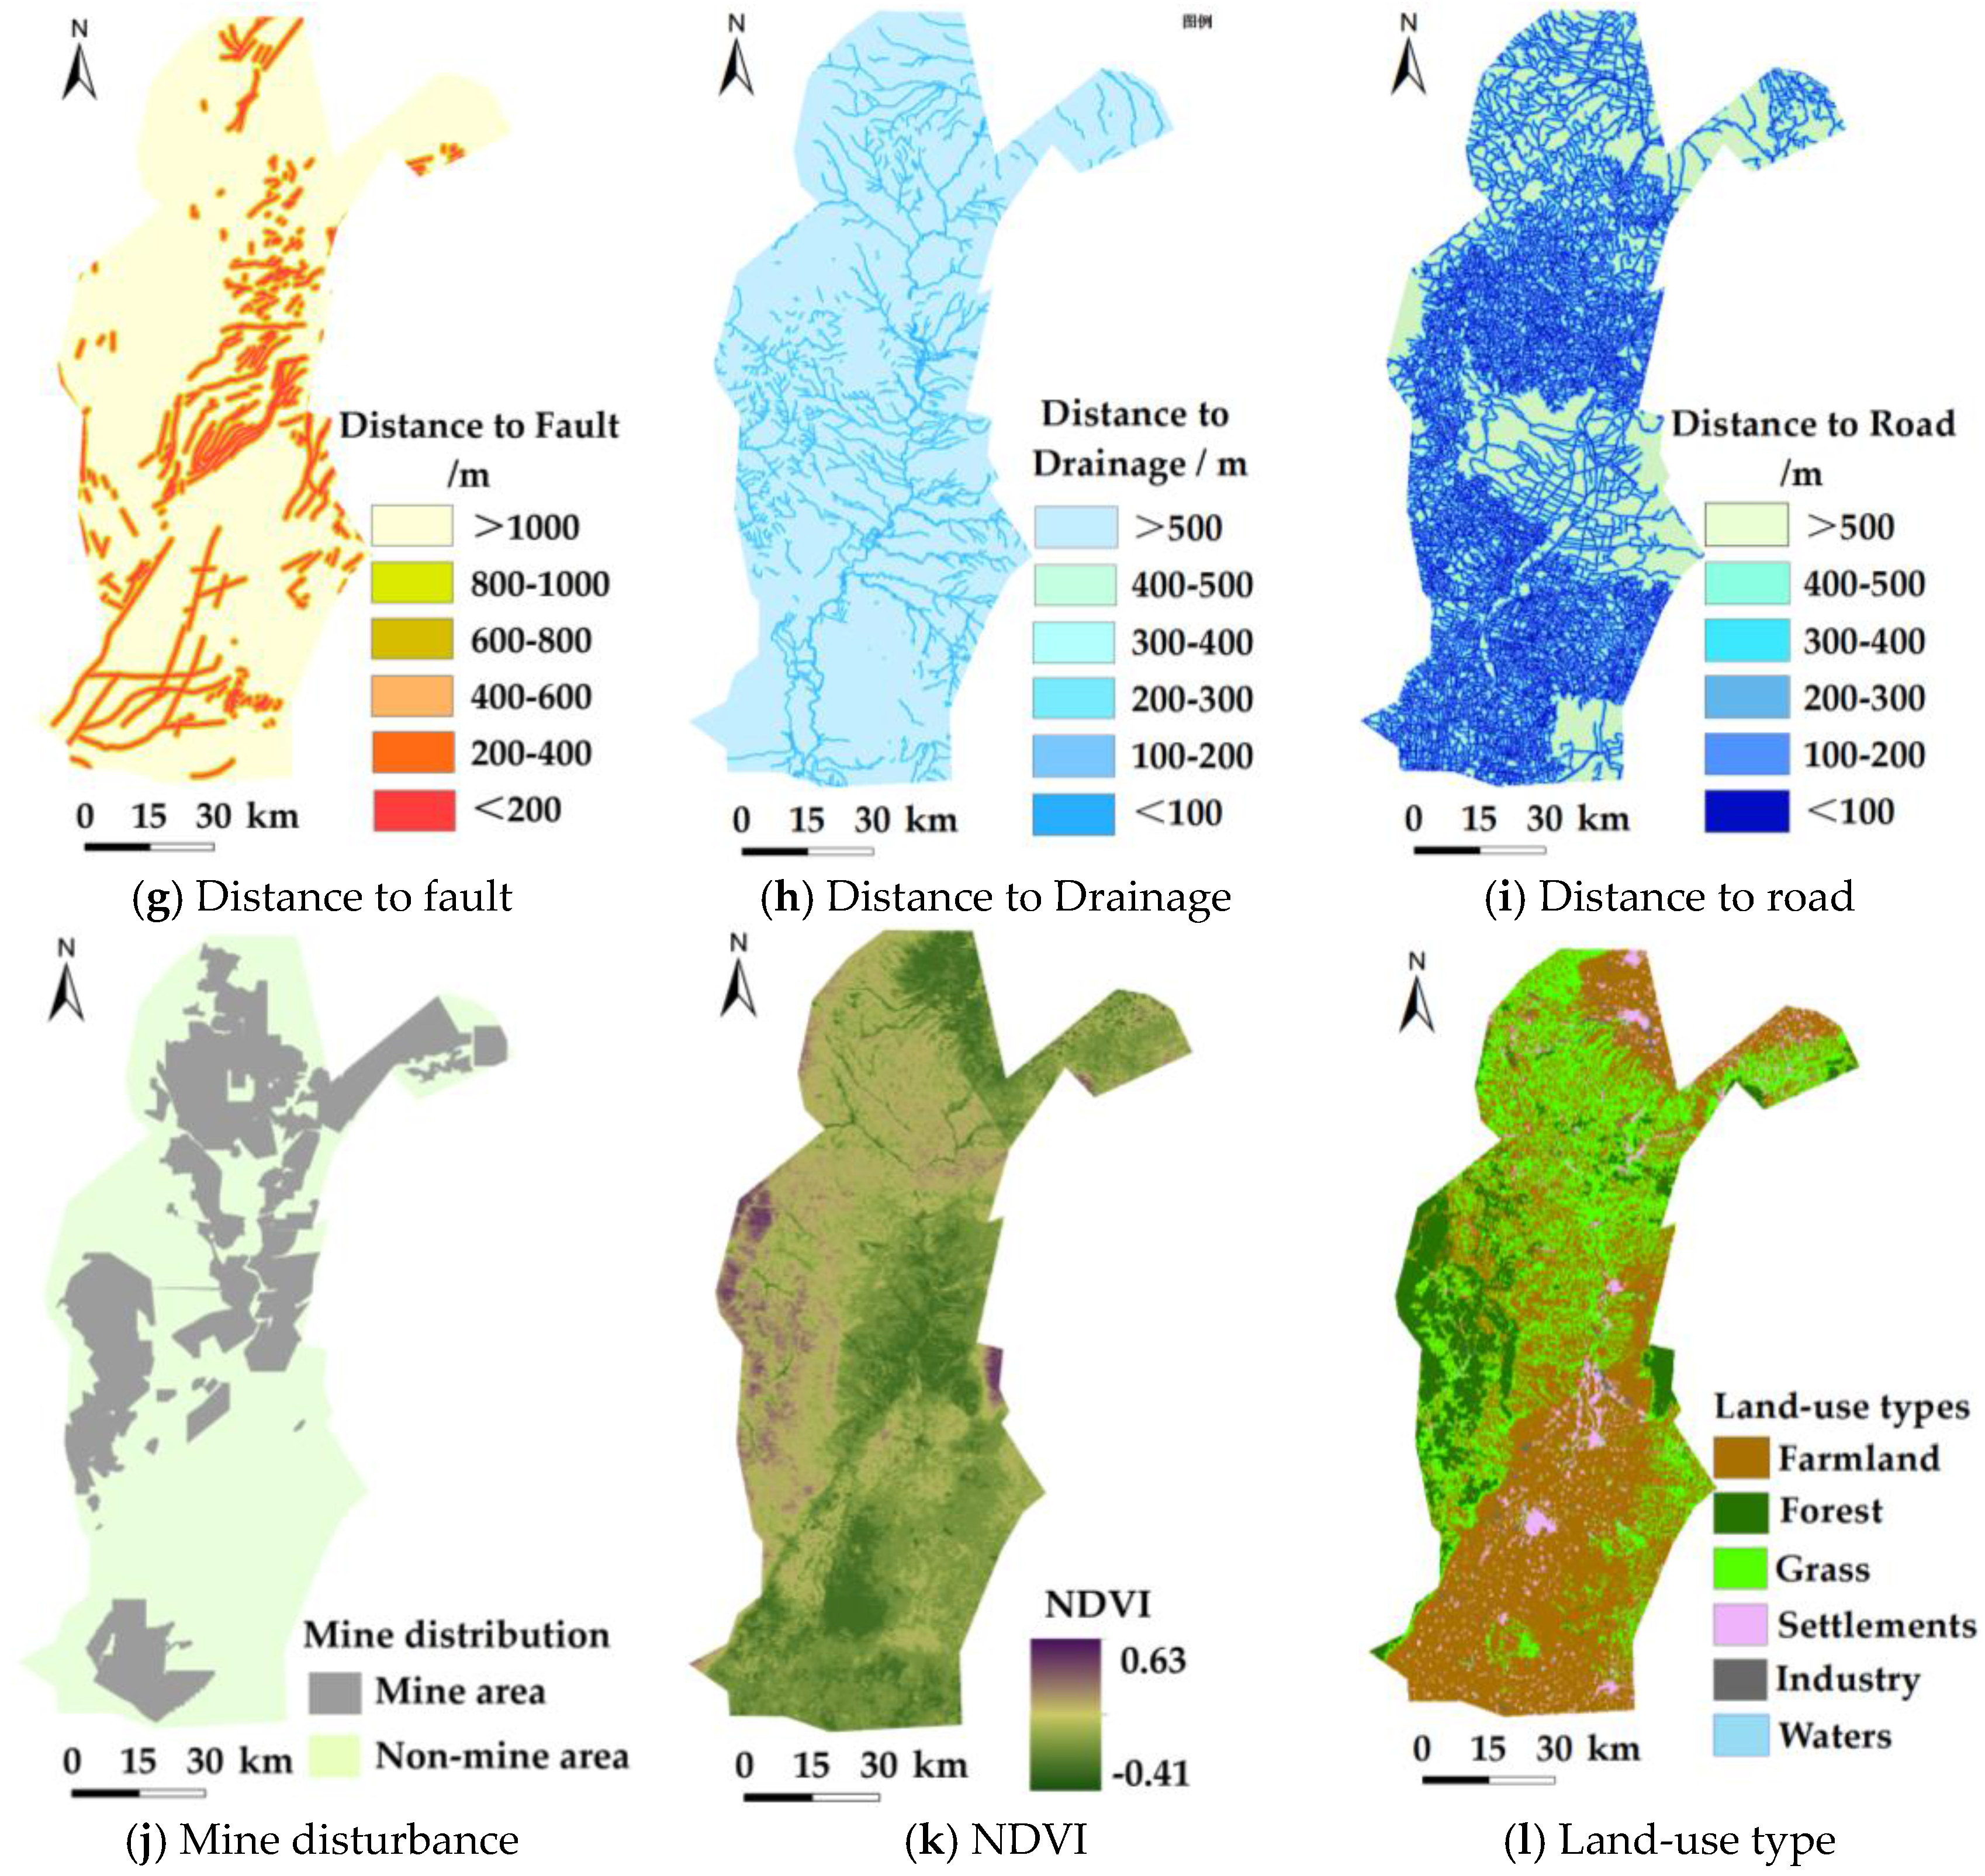
3.2. Landslide Conditioning Factors
4. Landslide Susceptibility Mapping
4.1. Preparation of Training and Testing Datasets
4.2. Logistic Regression Model
4.3. Artificial Neural Network
4.4. Support Vector Machine
4.5. Accuracy Assessment and Comparison
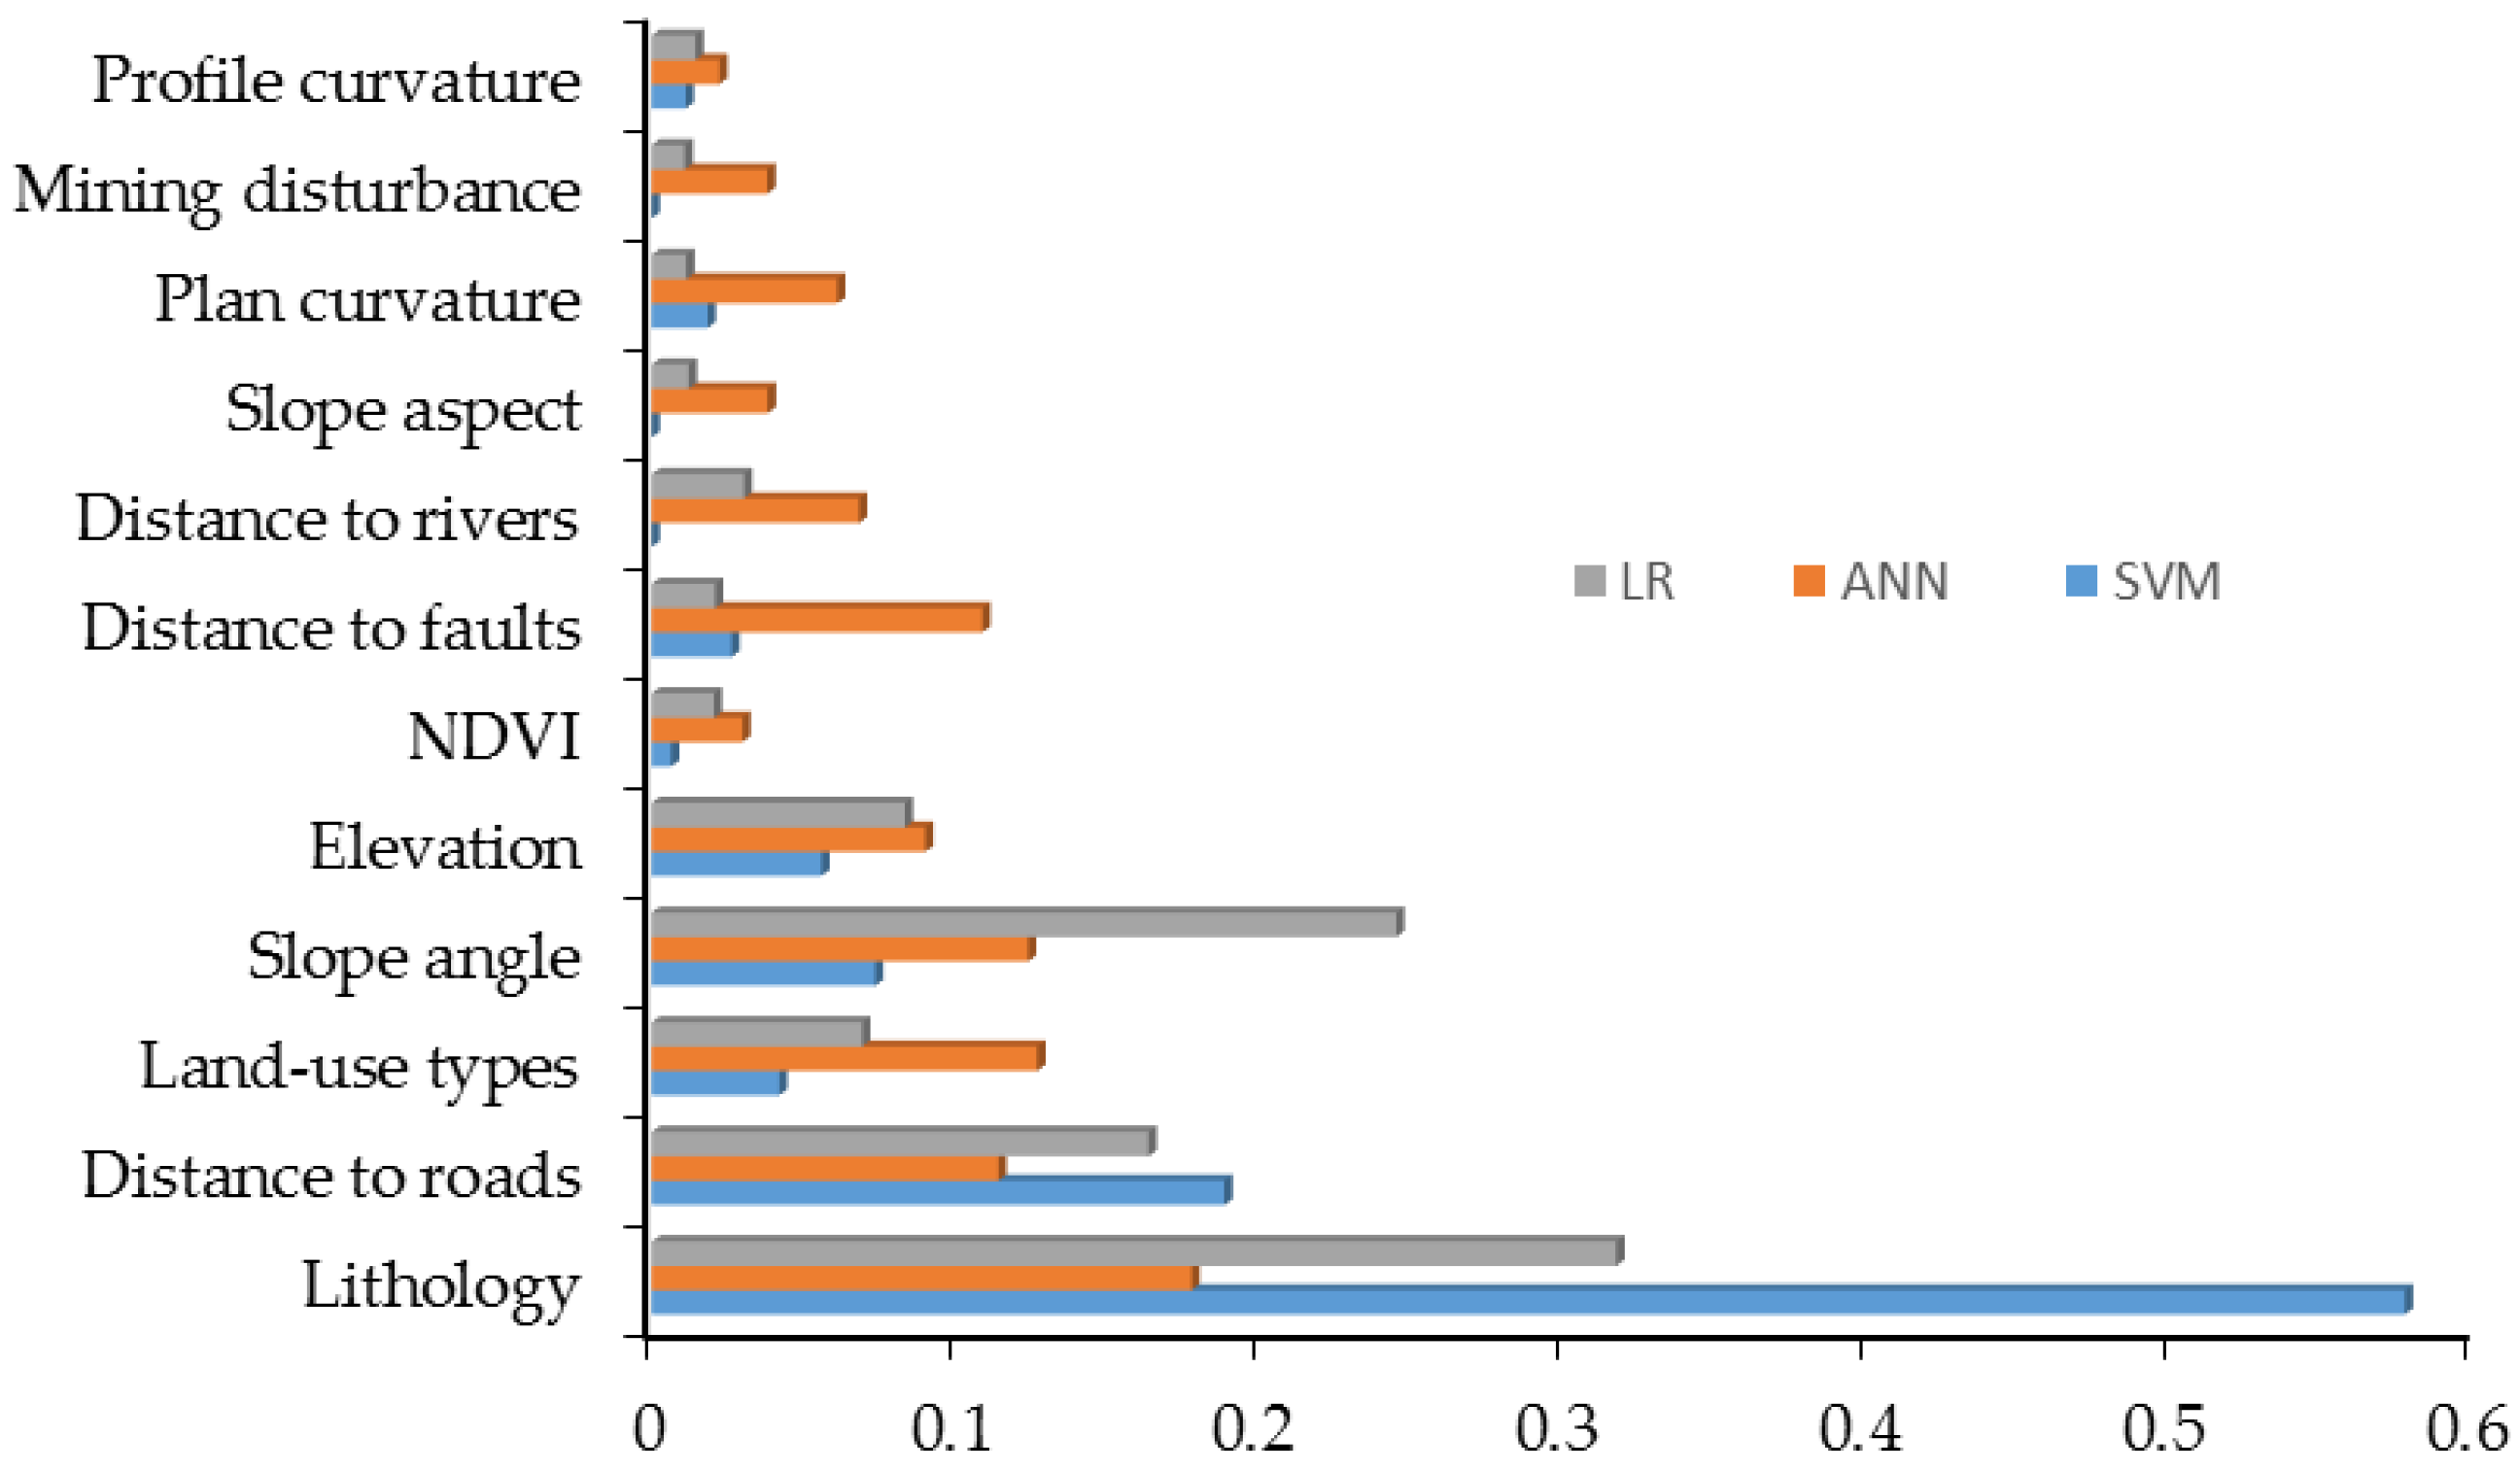
4.6. The Importance of Landslide Conditioning Factor
4.7. Landslide Susceptibility Map
5. Results
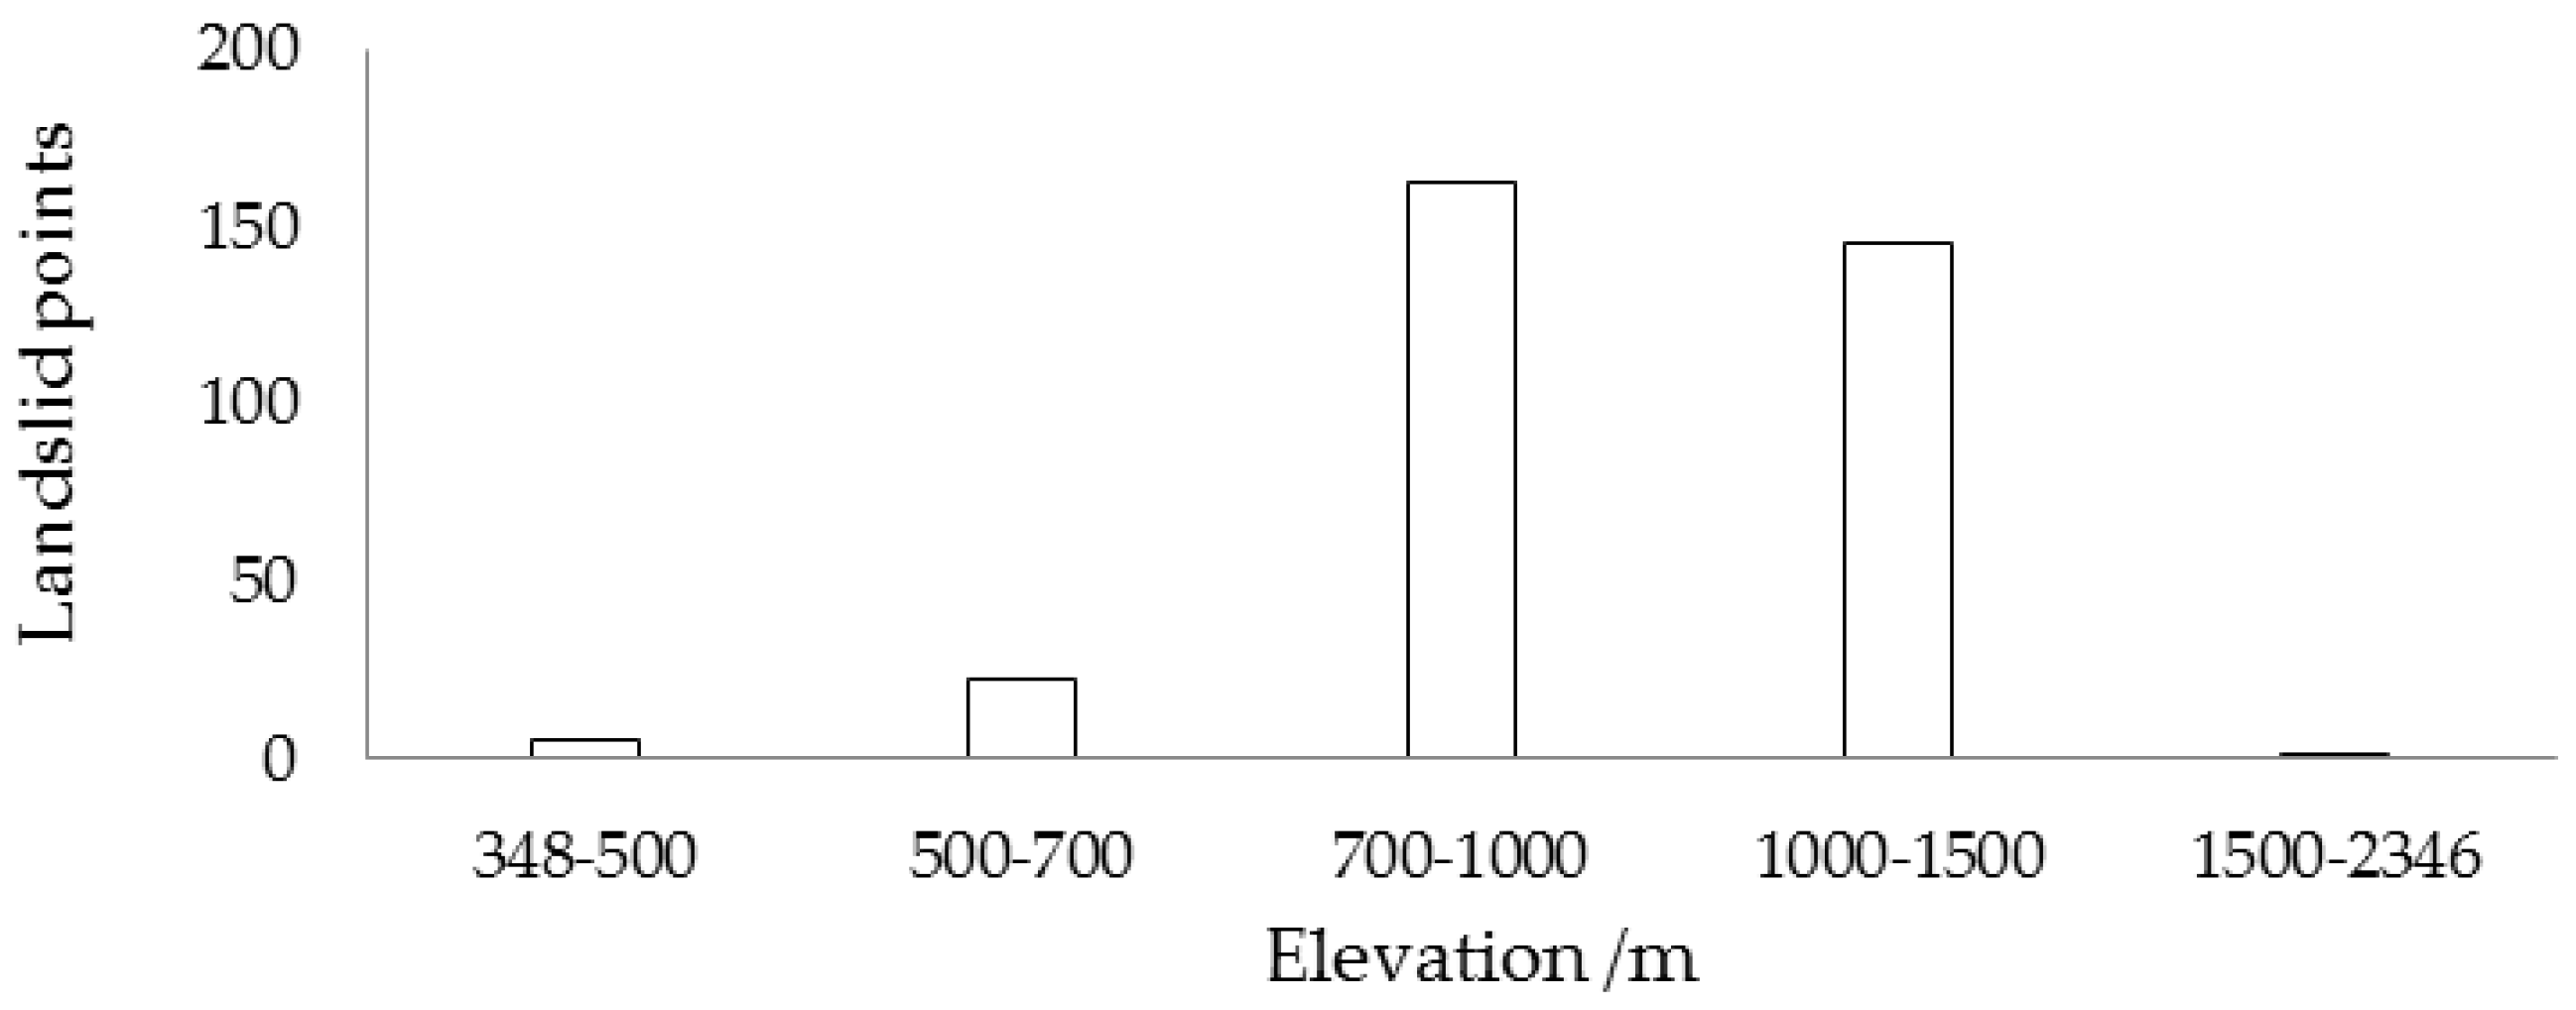
5.1. Landslide Conditioning Factor Analysis
5.2. Model Fitting Results and Analysis
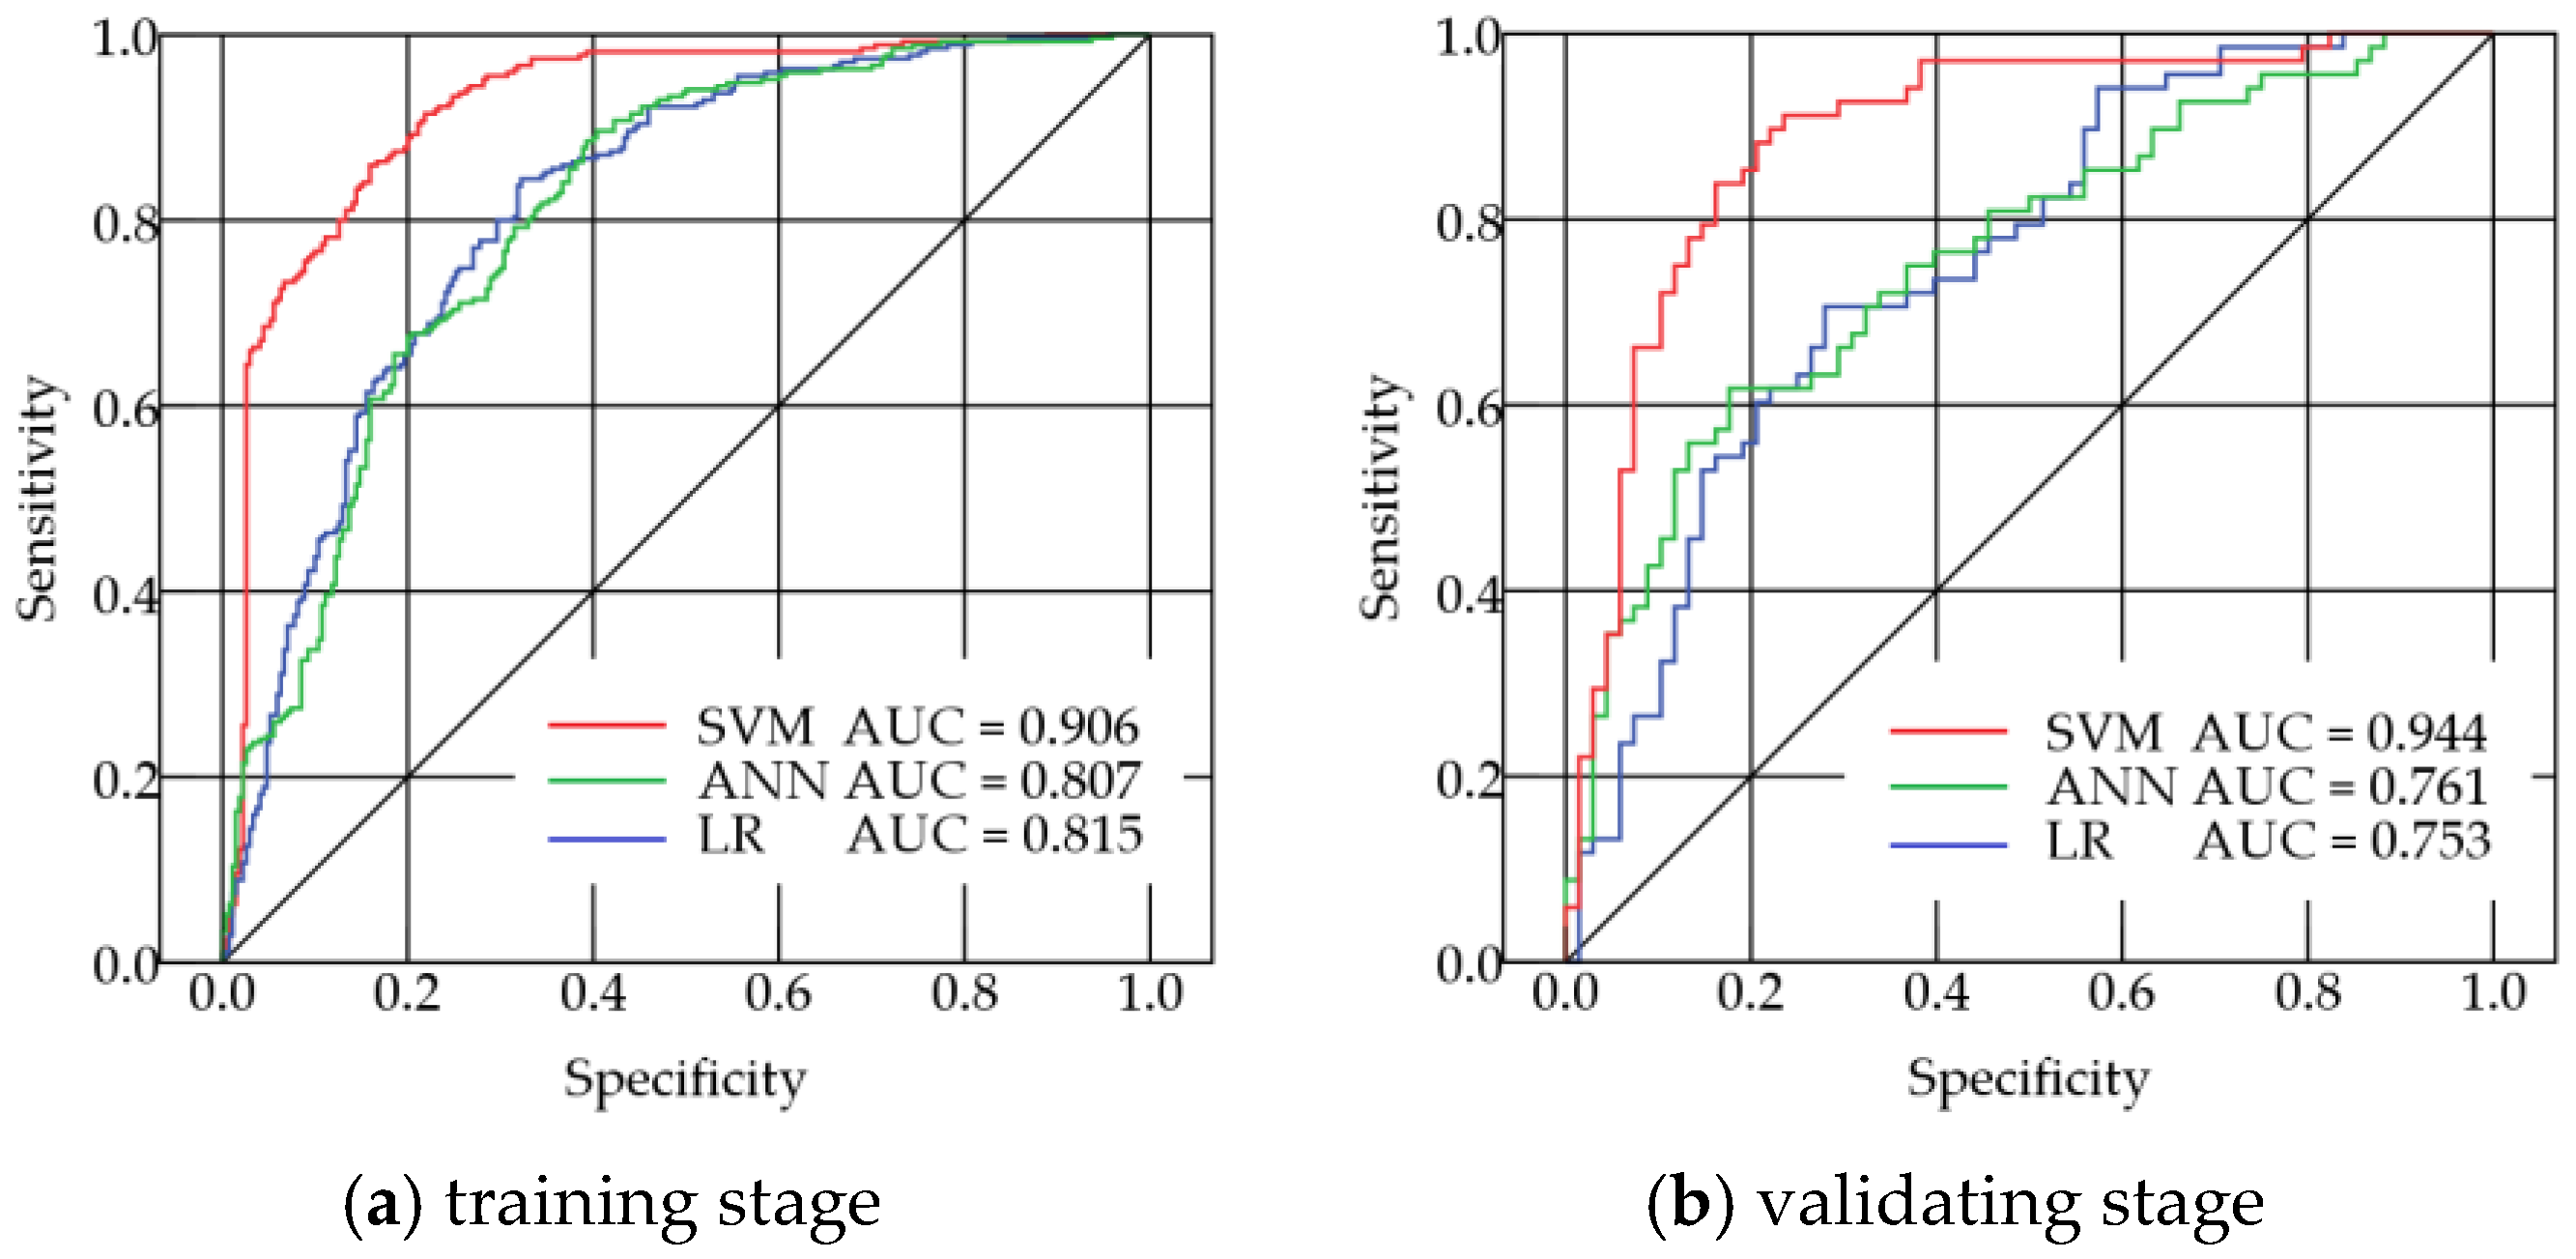
5.3. ROC Curve and AUC Value Analysis
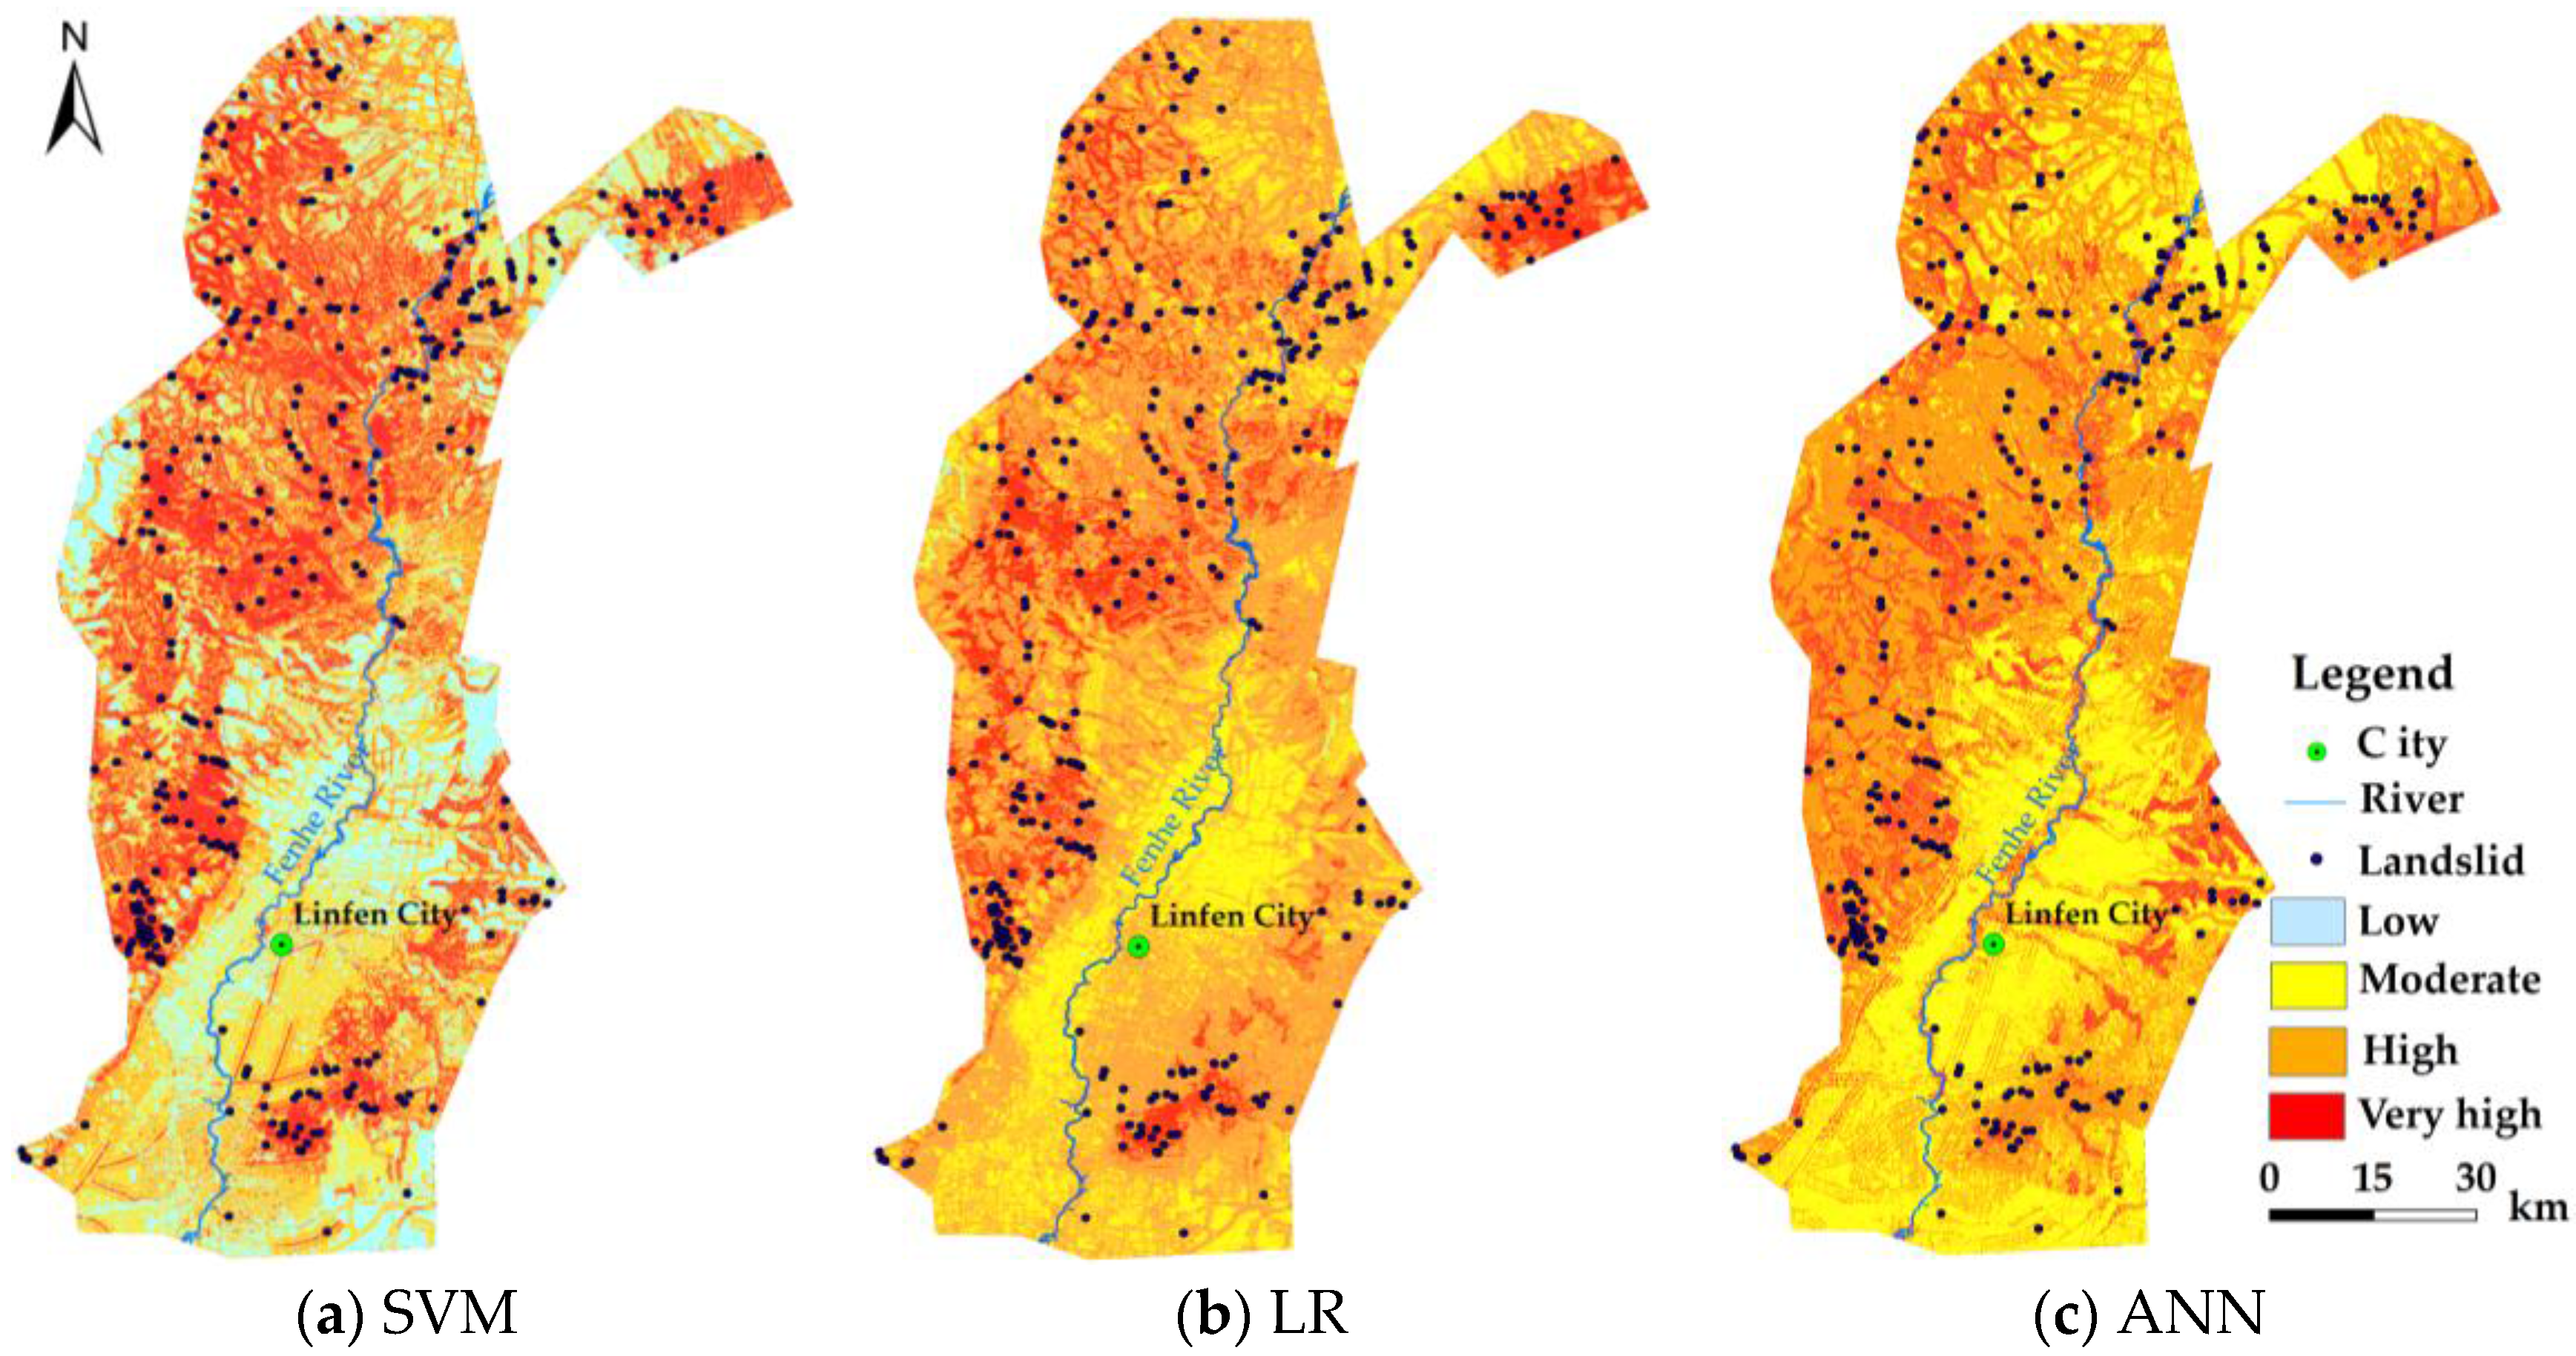
5.4. Landslide Susceptibility Map Analysis
6. Discussion
6.1. Advantages and Disadvantages of the Three Models
6.2. Accuracy Comparison for the Three Models
6.3. Variable Importance
7. Conclusions
Acknowledgments
Author Contributions
Conflicts of Interest
References
- Wang, Z.H. Landslide Remote Sensing; Science Press: Beijing, China, 2012. [Google Scholar]
- Qiu, H.J. Study on the regional landslide characteristic analysis and hazard assessment: A case study of Ningqiang County. Ph.D. Thesis, Northwestern University, Xi’an, China, 2012. [Google Scholar]
- Martha, T.R.; van Westen, C.J.; Kerle, N.; Jetten, V.; Kumar, K.V. Landslide hazard and risk assessment using semi-automatically created landslide inventories. Geomorphology 2013, 184, 139–150. [Google Scholar] [CrossRef]
- Cascini, L. Applicability of landslide susceptibility and hazard zoning at different scales. Eng. Geol. 2008, 102, 164–177. [Google Scholar] [CrossRef]
- Guzzetti, F.; Reichenbach, P.; Cardinali, M. Probabilistic landslide hazard assessment at the basin scale. Geomorphology 2005, 72, 272–299. [Google Scholar] [CrossRef]
- Nguyen, Q.K.; Tien, B.D.; Hoang, N.D.; Trinh, P.T.; Nguye, V.-H.; Yilmaz, I. A Novel Hybrid Approach Based on Instance Based Learning Classifier and Rotation Forest Ensemble for Spatial Prediction of Rainfall-Induced Shallow Landslides using GIS. Sustainability 2017, 9, 813. [Google Scholar] [CrossRef]
- Guzzetti, F.; Reichenbach, P.; Ardizzone, F.; Cardinali, M.; Gall, M. Estimating the quality of landslide susceptibility models. Geomorphology 2006, 81, 166–184. [Google Scholar] [CrossRef]
- Van Westen, C.J. Geo-Information tools for landslide risk assessment: An overview of recent developments. In Landslides: Evaluation and Stabilization; Lacerda, W.A., Ed.; Taylor & Francis Group: London, UK, 2004; pp. 39–56. [Google Scholar]
- Yao, X.; Tham, L.G.; Dai, F.C. Landslide susceptibility mapping based on Support Vector Machine: A case study on natural slopes of Hong Kong, China. Geomorphology 2008, 101, 572–582. [Google Scholar] [CrossRef]
- Tien Bui, D.; Tuan, T.A.; Klempe, H.; Pradhan, B.; Revhaug, I. Spatial prediction models for shallow landslide hazards: A comparative assessment of the efficacy of support vector machines, artificial neural networks, kernel logistic regression, and logistic model tree. Landslides 2015, 13, 361–378. [Google Scholar] [CrossRef]
- Pham, B.T.; Pradhan, B.; Bui, D.T.; Prakash, I.; Dholakia, M.B. A comparative study of different machine learning methods for landslide susceptibility assessment: A case study of Uttarakhand area (India). Environ. Modell. Softw. 2016, 84, 240–250. [Google Scholar] [CrossRef]
- Pardeshi, S.D.; Autade, S.E.; Pardeshi, S.S. Landslide hazard assessment: Recent trends and techniques. Springerplus 2013, 2, 1–11. [Google Scholar] [CrossRef] [PubMed]
- Akgun, A.; Dag, S.; Bulut, F. Landslide susceptibility mapping for a landslide-prone area (Findikli, NE of Turkey) by likelihood frequency ratio and weighted linear combination models. Environ. Geol. 2008, 54, 1127–1143. [Google Scholar] [CrossRef]
- Yilmaz, I. Landslide susceptibility mapping using frequency ratio, logistic regression, artificial neural networks and their comparison: A case study from Kat landslides (Tokat—Turkey). Comput. Geosci. 2009, 35, 1125–1138. [Google Scholar] [CrossRef]
- Patriche, C.V.; Pirnau, R.; Grozavu, A.; Rosca, B. A Comparative Analysis of Binary Logistic Regression and Analytical Hierarchy Process for Landslide Susceptibility Assessment in the Dobrov River Basin, Romania. Pedosphere 2016, 26, 335–350. [Google Scholar] [CrossRef]
- Brenning, A. Spatial prediction models for landslide hazards: Review, comparison and evaluation. Nat. Hazards Earth Syst. Sci. 2005, 5, 853–862. [Google Scholar] [CrossRef]
- Yilmaz, I. Comparison of landslide susceptibility mapping methodologies for Koyulhisar, Turkey: Conditional probability, logistic regression, artificial neural networks, and support vector machine. Environ. Earth Sci. 2010, 61, 821–836. [Google Scholar] [CrossRef]
- Kavzoglu, T.; Sahin, E.K.; Colkesen, I. Landslide susceptibility mapping using GIS-based multi-criteria decision analysis, support vector machines, and logistic regression. Landslides 2014, 11, 425–439. [Google Scholar] [CrossRef]
- Tan, L.; Chen, G.; Wang, S.; Meng, X. Landslide susceptibility mapping based on logistic regression and support vector machines. J. Eng. Geol. 2014, 22, 56–63. (In Chinese) [Google Scholar]
- Colkesen, I.; Sahin, E.K.; Kavzoglu, T. Susceptibility mapping of shallow landslides using kernel-based Gaussian process, support vector machines and logistic regression. J. Afr. Earth Sci. 2016, 118, 53–64. [Google Scholar] [CrossRef]
- Pradhan, B. A comparative study on the predictive ability of the decision tree, support vector machine and neuro-fuzzy models in landslide susceptibility mapping using GIS. Comput. Geosci. 2013, 51, 350–365. [Google Scholar] [CrossRef] [Green Version]
- Chen, W.; Chai, H.; Zhao, Z.; Wang, Q.; Hong, H. Landslide susceptibility mapping based on GIS and support vector machine models for the Qianyang County, China. Environ. Earth Sci. 2016, 75, 1–13. [Google Scholar] [CrossRef]
- Wang, Q.; Li, W.; Chen, W.; Bai, H. GIS-based assessment of landslide susceptibility using certainty factor and index of entropy models for the Qianyang County of Baoji city, China. J. Earth Syst. Sci. 2015, 124, 1–17. [Google Scholar] [CrossRef]
- Xiao, H.P. Important geological hazards of coal-mine and its prevention measures in China. Chin. J. Geol. Hazard Control 2001, 12, 51–54. [Google Scholar]
- Zhai, W.J.; Zhong, Y.Z.; Jiang, D.L.; Wang, Zh.; Li, F. Prediction of Geological hazard in West open pit of Fushun coal mine. J. Nat. Disasters 2006, 15, 132–137. [Google Scholar]
- Wang, X.G.; Zhai, X.J.; Zhang, P.H.; Zhang, S.P. Analysis of geological hazards development Characteristics and effect factors in Xiao Qinling Mountains mining area. Ground Water 2010, 32, 162–164. [Google Scholar]
- Zhang, G.L.; Yang, B.L.; Zhang, Z.; Wang, S.J. Susceptibility Prediction of under groudmining collapse based on GIS and BP Neural Network. Trop. Geogr. 2015, 35, 770–776. [Google Scholar]
- Lee, S.; Park, I.; Choi, J.K. Spatial prediction of ground subsidence susceptibility using an Artificial Neural Network. Environ. Manag. 2012, 49, 347–358. [Google Scholar] [CrossRef] [PubMed]
- Suh, J.; Choi, Y.; Park, H.D. GIS-based evaluation of mining-induced subsidence susceptibility considering 3D multiple mine drifts and estimated mined panels. Environ. Earth Sci. 2016, 75, 1–19. [Google Scholar] [CrossRef]
- Oh, H.J.; Ahn, S.C.; Choi, J.K.; Lee, S. Sensitivity analysis for the GIS-based mapping of the ground subsidence hazard near abandoned underground coal mines. Environ. Earth Sci. 2011, 64, 347–358. [Google Scholar] [CrossRef]
- Ma, Q.H. Analysis of the Control Effect of Formation Lithology and Geological Structure on the Development of Geological Disasters in Qinba Mountain. Ph.D. Thesis, Chang’an University, Xi’an, China, 2011. [Google Scholar]
- Chau, K.T.; Sze, Y.L.; Fung, M.K.; Wong, W.Y.; Fong, E.L.; Chan, L.C.P. Landslide hazard analysis for Hong Kong using landslide inventory and GIS. Comput. Geosci. 2004, 30, 429–443. [Google Scholar] [CrossRef]
- Domínguez-Cuesta, M.J.; Jiménez-Sánchez, M.; Berrezueta, E. Landslides in the Central Coalfield (Cantabrian Mountains, NW Spain): Geomorphological features, conditioning factors and methodological implications in susceptibility assessment. Geomorphology 2007, 89, 358–369. [Google Scholar] [CrossRef]
- Peart, M.R.; Ng, K.Y.; Zhang, D.D. Landslides and sediment delivery to a drainage system: Some observations from Hong Kong. Asian Earth Sci. 2005, 25, 821–836. [Google Scholar] [CrossRef]
- Petschko, H.; Brenning, A.; Bell, R.; Goetz, J.; Glade, T. Assessing the quality of landslide susceptibility maps-case study Lower Austria. Nat. Hazards Earth Syst. Sci. 2014, 14, 95–118. [Google Scholar] [CrossRef] [Green Version]
- Vapnik, V.N. Statistical Learning Theory; John Wiley & Sons: New York, NY, USA, 1998; p. 736. [Google Scholar]
- Ercanoglu, M. Landslide susceptibility assessment of SE Bartin (West Black Sea region, Turkey) by Artificial Neural Networks. Nat. Hazards Earth Syst. Sci. Discuss. 2005, 5, 979–992. [Google Scholar] [CrossRef]
- Mather, P.M. The use of BackPropagating Artificial Neural Networks in land cover classification. Int. J. Remote Sens. 2003, 24, 4907–4938. [Google Scholar]
- Şenkal, O.; Kuleli, T. Estimation of solar radiation over turkey using artificial neural network and satellite data. Appl. Energy 2009, 86, 1222–1228. [Google Scholar] [CrossRef]
- Gokceoglu, C.; Sonmez, H.; Nefeslioglu, H.A.; Duman, T.; Can, T. The 17 March 2005 Kuzulu landslide (Sivas, Turkey) and landslide-susceptibility map of its near vicinity. Eng. Geol. Int. J. 2005, 81, 65–83. [Google Scholar] [CrossRef]
- Sasikala, S.; Balamurugan, S.A.A.; Geetha, S. Multi filtration feature selection (MFFS) to improve discriminatory ability in clinical data set. Appl. Comput. Inform. 2016, 12, 117–127. [Google Scholar] [CrossRef]
- Sossa, H.; Guevara, E. Efficient training for dendrite morphological neural networks. Neurocomputing 2014, 131, 132–142. [Google Scholar] [CrossRef]
- Kavzoglu, T.; Colkesen, I. A kernel functions analysis for support vector machines for land cover classification. Int. J. Appl. Earth Obs. 2009, 11, 352–359. [Google Scholar] [CrossRef]
- Zhuang, L.; Dai, H.H. Parameter optimization of kernel-based one-class classifier on imbalance text learning. PRICAI 2006: Trends Artif. Intell. Proc. 2006, 4099, 434–443. [Google Scholar]
- Chung, C.J.; Fabbri, A.G. Predicting landslides for risk analysis—Spatial models tested by a cross-validation technique. Geomorphology 2008, 94, 438–452. [Google Scholar] [CrossRef]
- Frattini, P.; Crosta, G.; Carrara, A. Techniques for evaluating the performance of landslide susceptibility models. Eng. Geol. 2010, 111, 62–72. [Google Scholar] [CrossRef]
- Brenning, A. Spatial cross-validation and bootstrap for the assessment of prediction rules in remote sensing: The R package sperrorest. Geosci. Remote Sens. Symp. 2012, 53, 5372–5375. [Google Scholar]
- Walter, S.D. Properties of the summary receiver operating characteristic (SROC) curve for diagnostic test data. Stat. Med. 2002, 21, 1237–1256. [Google Scholar] [CrossRef] [PubMed]
- Akgun, A. A comparison of landslide susceptibility maps produced by logistic regression, multi-criteria decision, and likelihood ratio methods: A case study at İzmir, Turkey. Landslides 2012, 9, 93–106. [Google Scholar] [CrossRef]
- Hong, H.; Pradhan, B.; Jebur, M.N.; Bui, D.T.; Xu, C.; Akgun, A. Spatial prediction of landslide hazard at the Luxi area (China) using support vector machines. Environ. Earth Sci. 2016, 75, 1–14. [Google Scholar] [CrossRef]
- Costanzo, D.; Rotigliano, E.; Irigaray, C.; Jorge David, J.-P.; José, C.M. Factors selection in landslide susceptibility modeling on large scale following the GIS matrix method: Application to the river Beiro basin (Spain). Nat. Hazards Earth Syst. Sci. 2012, 12, 327–340. [Google Scholar] [CrossRef] [Green Version]
- Pradhan, B.; Lee, S. Landslide susceptibility assessment and factor effect analysis: Backpropagation Artificial Neural Networks and their comparison with frequency ratio and bivariate logistic regression modelling. Environ. Modell. Softw. 2010, 25, 747–759. [Google Scholar] [CrossRef]
- Li, Y.R.; Aydin, A.; Xiang, X.Q.; Ju, N.P.; Zhao, J.J.; Ozbek, A. Landslide Susceptibility Mapping and Evaluation along a River Valley in China. Acta Geol. Sin. 2012, 86, 1022–1030. [Google Scholar]


| Parameters | Data Source | Data Class or Range | Variables Type |
|---|---|---|---|
| Elevation | Advanced Spaceborne Thermal Emission and Reflection Radiometer, the global digital elevation model (ASTER-GDEM) (30 m) | 348–2346 m | Continues |
| Plan Curvature | 0–82.03 | ||
| Profile Curvature | 0–46.85 | ||
| Slope Angle | 0–64.5° | ||
| Slope Aspect | Flat, N, NE, E, SE, S, SW, W, NW | Categorical | |
| Stratigraphic Lithology | Department of Geological Survey (1:50,000) | rock, shale, sandy shale, limestone, dolomite, shale coal, mudstone, clay, clayey, sandy loam, sandy clay | Categorical |
| Distance to Fault | <200, 200–400, 400–600, 600–800, 800–1000, >1000 (m) | ||
| Distance to Drainage | Department of Land Resource (1:50,000) | <100, 100–200, 200–300, 300–400, 400–500, >500 (m) | Categorical |
| Distance to Road | <100, 100–200, 200–300, 300–400, 400–500, >500 (m) | ||
| Mining disturbance | Mining area/Non-mining area | ||
| Land-use 2 | Thematic Mapper (TM) (30 m) | farmland; forest; grassland; esidential; industrial land; water body 1 | Categorical |
| Normalized Difference Vegetation Index (NDVI) | −0.414~0.631 | Continues |
| Model | Stage | Accuracy | Sensitivity | Specificity | Positive Prediction | Negative Prediction |
|---|---|---|---|---|---|---|
| LR | training | 73.43 | 73.61 | 73.26 | 73.06 | 73.80 |
| validating | 71.64 | 72.73 | 71.64 | 71.64 | 72.73 | |
| Artificial Neural Network (ANN) | training | 78.23 | 73.68 | 84.93 | 87.82 | 68.63 |
| validating | 67.16 | 64.20 | 71.70 | 76.12 | 56.72 | |
| Support Vector Machine (SVM) | training | 87.45 | 87.45 | 87.45 | 87.45 | 87.45 |
| validating | 73.13 | 74.60 | 71.83 | 77.61 | 76.12 |
| Models | Low (0–0.02) | Medium (0.02–0.10) | High (0.10–0.85) | Very High (0.85–1) | |
|---|---|---|---|---|---|
| ANN | Number of landslides | 0 | 20 | 190 | 128 |
| Area percentage/% | 0 | 17.79 | 43.80 | 38.42 | |
| LR | Number of landslides | 1 | 8 | 181 | 148 |
| Area percentage/% | 0.12 | 23.12 | 60.32 | 16.43 | |
| SVM | Number of landslides | 1 | 21 | 67 | 249 |
| Area percentage/% | 20.38 | 28.64 | 25.71 | 25.28 | |
© 2017 by the authors. Licensee MDPI, Basel, Switzerland. This article is an open access article distributed under the terms and conditions of the Creative Commons Attribution (CC BY) license (http://creativecommons.org/licenses/by/4.0/).
Share and Cite
Su, Q.; Zhang, J.; Zhao, S.; Wang, L.; Liu, J.; Guo, J. Comparative Assessment of Three Nonlinear Approaches for Landslide Susceptibility Mapping in a Coal Mine Area. ISPRS Int. J. Geo-Inf. 2017, 6, 228. https://doi.org/10.3390/ijgi6070228
Su Q, Zhang J, Zhao S, Wang L, Liu J, Guo J. Comparative Assessment of Three Nonlinear Approaches for Landslide Susceptibility Mapping in a Coal Mine Area. ISPRS International Journal of Geo-Information. 2017; 6(7):228. https://doi.org/10.3390/ijgi6070228
Chicago/Turabian StyleSu, Qiaomei, Jin Zhang, Shangmin Zhao, Li Wang, Jin Liu, and Jianli Guo. 2017. "Comparative Assessment of Three Nonlinear Approaches for Landslide Susceptibility Mapping in a Coal Mine Area" ISPRS International Journal of Geo-Information 6, no. 7: 228. https://doi.org/10.3390/ijgi6070228