Visually-Enabled Active Deep Learning for (Geo) Text and Image Classification: A Review


1
Department of Geography and Institute for CyberScience, The Pennsylvania State University, University Park, PA 16802, USA
2
College of Information Sciences and Technology, The Pennsylvania State University, University Park, PA 16802, USA
3
Computer Science Department, Universidad Carlos III de Madrid, 28911-Leganés, Madrid, Spain
*
Authors to whom correspondence should be addressed.
ISPRS Int. J. Geo-Inf. 2018, 7(2), 65; https://doi.org/10.3390/ijgi7020065
Submission received: 29 December 2017
/
Revised: 12 February 2018
/
Accepted: 17 February 2018
/
Published: 20 February 2018
Abstract
:This paper investigates recent research on active learning for (geo) text and image classification, with an emphasis on methods that combine visual analytics and/or deep learning. Deep learning has attracted substantial attention across many domains of science and practice, because it can find intricate patterns in big data; but successful application of the methods requires a big set of labeled data. Active learning, which has the potential to address the data labeling challenge, has already had success in geospatial applications such as trajectory classification from movement data and (geo) text and image classification. This review is intended to be particularly relevant for extension of these methods to GISience, to support work in domains such as geographic information retrieval from text and image repositories, interpretation of spatial language, and related geo-semantics challenges. Specifically, to provide a structure for leveraging recent advances, we group the relevant work into five categories: active learning, visual analytics, active learning with visual analytics, active deep learning, plus GIScience and Remote Sensing (RS) using active learning and active deep learning. Each category is exemplified by recent influential work. Based on this framing and our systematic review of key research, we then discuss some of the main challenges of integrating active learning with visual analytics and deep learning, and point out research opportunities from technical and application perspectives—for application-based opportunities, with emphasis on those that address big data with geospatial components.
1. Introduction
Big data are leading to dramatic changes in science (with the advent of data-driven science) and in society (with potential to support economic, public health, and other advances). Machine leaning and deep learning technologies are central to leveraging big data for applications in both domains. Recent advances in machine learning and especially in deep learning, coupled with release of many open source tools (e.g., Google TensorFlow [1]—an open-source software library for machine intelligence), creates the potential to leverage big data to address GIScience and Remote Sensing (RS) research and application challenges. But, doing so requires an in-depth understanding of the methods, their limitations, and strategies for overcoming those limitations. Two primary goals for this paper are: (1) to synthesize ideas and results from machine learning and deep learning, plus visual analytics, and (2) to provide a base from which new GIScience and RS advances can be initiated.
Machine learning (ML) and deep learning (DL), where DL is a sub-domain of ML, are increasingly successful in extracting information from big data (when mentioned together subsequently, we use the abbreviation of M&DL). The primary focus of research in M&DL has thus far been accurate results, often at the expense of human understanding of how the results were achieved [2,3,4,5,6]. However, accurate results often depend on building large human-generated training data sets that can be expensive in both financial and person cost to create [7,8,9,10,11,12,13]. As a result, there remain several impediments to broader adoption of M&DL, along with a range of concerns about potential negative outcomes related to the explainability of results produced. We agree here with a range of authors who have pointed to the need for human-in-the-loop strategies to both improve performance of the methods for complex problems and to increase explainability of the methods and their results [2,4,5,11,13,14,15]. There is a clear need for methods that allow human decision-makers to assess when to accept those results and when to treat them with caution or even skepticism.
Further, we contend that advances in visual analytics offer a broad framework for addressing both the performance and explainability needs cited above. Visual analytics provides systems that enable analytical reasoning about complex problems [16]. They accomplish this through close coupling of computational data processing methods with visual interfaces designed to help users make efficient choices: in building training data, in parameterizing and steering computational methods, and in understanding the results of those methods and how they were derived (further details about why and how visual analytics can aid M&DL, are elaborated in Section 3.2).
One rapidly developing ML method, active learning (Section 3.1), aims at achieving good learning results with a limited labeled data set, by choosing the most beneficial unlabeled data to be labeled by annotators (human or machine), in order to train and thus improve ML model performance [17,18]. Active deep learning (Section 3.4) is a method introduced to help cope with the tension between the typical DL requirement to have a very large gold standard training set and the impracticality of building such a big training set initially in domains that require expertise to label training data. As we elaborate below, recent developments in visual analytics offer strategies to enable productive human-in-the-loop active learning.
In this paper, we argue specifically for taking a visual analytics approach to empowering active deep learning for (geo) text and image classification; we review a range of recent developments in the relevant fields that can be leveraged to support this approach. Our contention is that visual anaytics interfaces can reduce the time that domain experts need to devote to labeling data for text (or image) classification, by applying an iterative, active learning process. We also contextualize the potential of integrating active learning, visual analytics, and active deep learning methods in GIScience and RS through discussion of recent work.
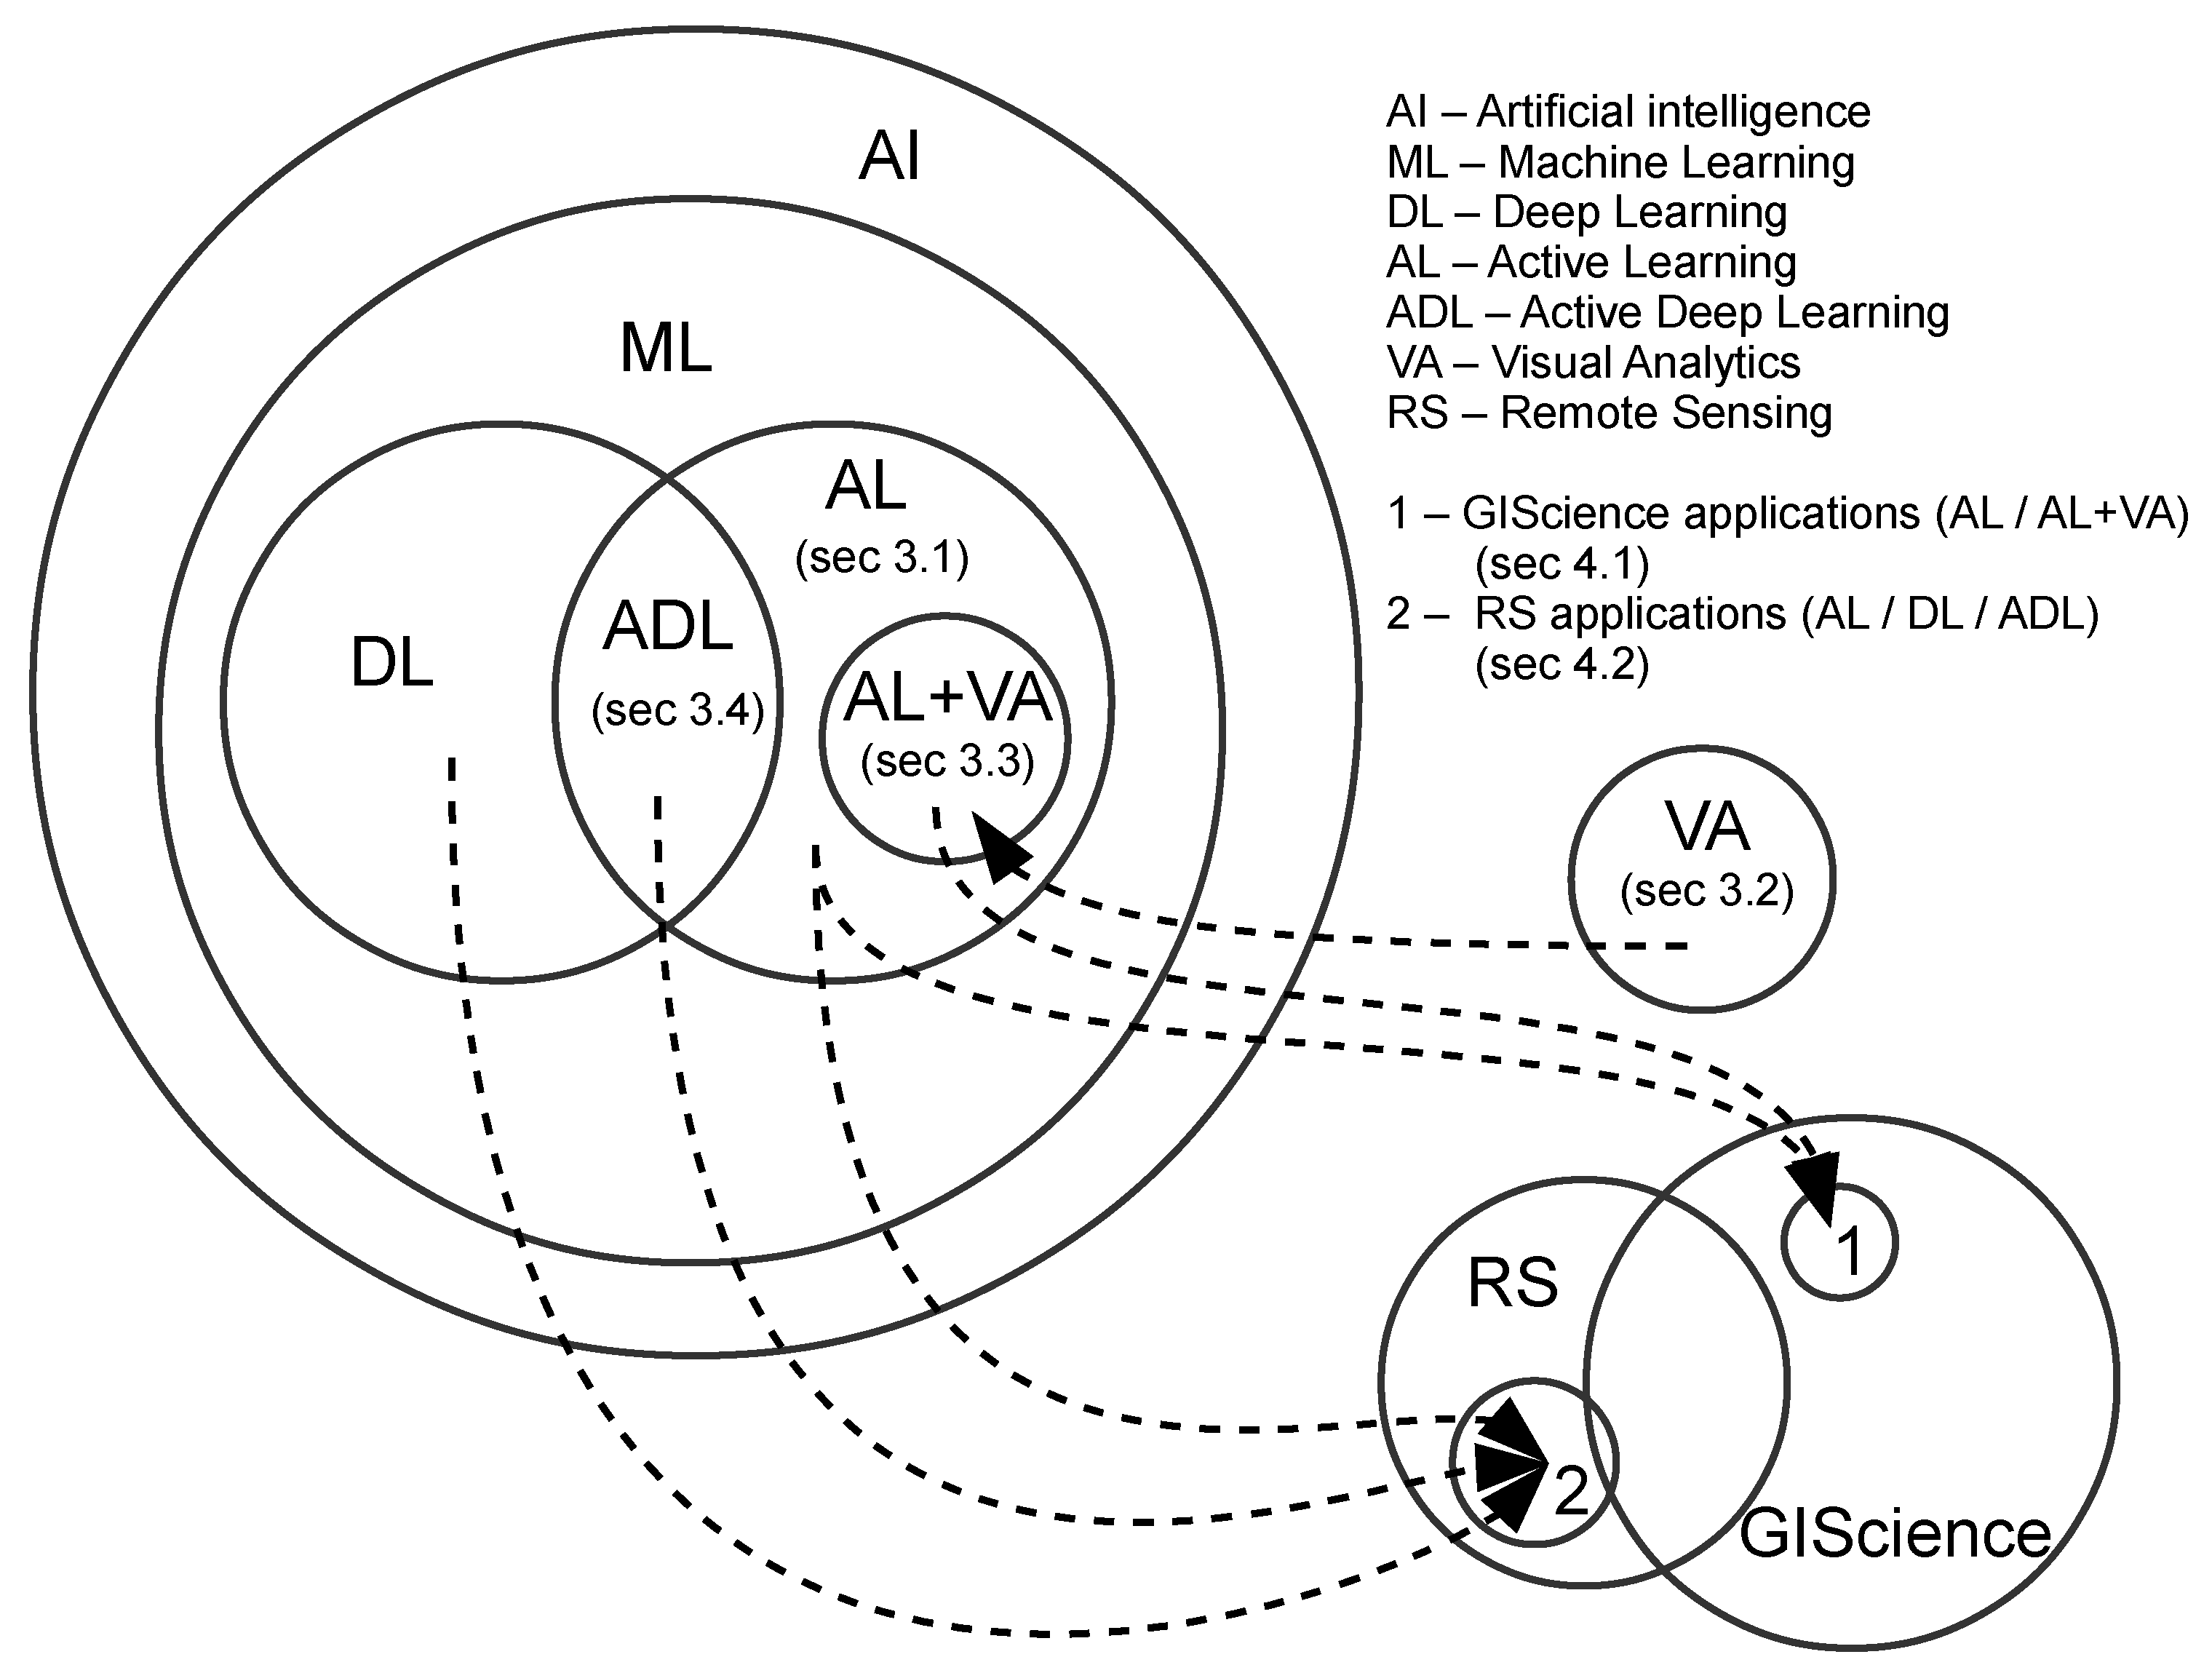
Here, we provide a road map to the rest of the paper. Section 2 outlines the scope of this review and our intended audience. Section 3, is the core of the paper, focused on synthesizing important and recent developments and their implications and applications. Here, we focus on recent advances in several subfields of Computer Science that GIScience and RS can leverage. Specifically, we examine and appraise key components of influential work in active learning (Section 3.1), visual analytics (Section 3.2), active learning with visual analytics (Section 3.3), and active deep learning (Section 3.4), respectively. In Section 4, we review recent GIScience and RS applications in (geo) text and image classification that take advantage of the methods from one or a combination of different fields covered in Section 3. The paper concludes in Section 5 with discussion of key challenges and opportunities—from both technical (Section 5.2.1) and application (Section 5.2.2, particularly for GIScience and RS) perspectives. The paper covers a wide array of recent research from multiple domains with many cross-connections. Given that text must present the sub-domains linearly, we start with a diagrammatic depiction of the domains and their relations to preview the overall structure of the review and the key connections. Specifically, Figure 1 illustrates the links between different fields covered in this paper and the flows that can guide the reader through the core part of this review. To provide background for readers (particularly those from GIScience and RS) who are new to M&DL, in Appendix A, we introduce essential terms and the main types of classification tasks in M&DL.
2. Scope and Intended Audience
The potential to bring the advances in M&DL to GIScience is reflected in a fairly long history of work on spatial and spatio-temporal data mining. In 2001, for example, Han and Miller [19] provided a broad introduction to data mining and knowledge discovery methods for geographic data. In a second edition in 2009 [20], with reversed authorship, multivariate spatial clustering was discussed and visual exploration and explanation in geospatial analysis was touched upon. Directed to a broader audience, Han et al. [21] provided one of the most highly cited introductions to data mining; the third edition includes an introduction to active learning (Section 3.1) and briefly introduces neural networks (the core technology of DL), but visual analytics (Section 3.2) is not mentioned. Even though they include an introduction to data visualization and visual data mining, Han and colleagues’ focus is on traditional data visualization methods for understanding data prior to making decisions on data mining methods and for understanding outcomes of data mining, not on the more integrated visual-computational approaches that characterize advances in visual analytics. Thus, their visual data mining approach, while it does propose leveraging visualization advances in productive ways, is comparable to ideas introduced in the late 1990s (e.g., [22,23]); it does not focus on visual interfaces to enable human input to the data mining process or on support of human reasoning about that process.
In work that complements that cited above, Guo and Mennis [24] also investigated spatial data mining and geographic knowledge discovery, where they briefly reviewed several common spatial data mining tasks, including spatial classification and prediction, spatial cluster analysis, and geovisualization. The authors argued that data mining is data-driven, but more importantly, human-centered, with users controlling the selection and integration of data, choosing analysis methods, and interpreting results—it is an iterative and inductive learning process. Guo and Mennis pointed out that handling big and complex spatial data and understanding (hidden) complex structure are two major challenges for spatial data mining. To address these challenges, both efficient computational algorithms to process large data sets and effective visualization techniques to present and explore complex patterns from big spatial data, are required. In earlier work outside the GISience context, Fayyad et al. [25] emphasized the potential role of information visualization in data mining and knowledge discovery. They proposed that the next breakthroughs will come from integrated solutions that allow (domain) end users to explore their data using a visual interface—with the goal being to unify data mining algorithms and visual interfaces , and thereby to enable human analysts to explore and discover patterns hidden in big data sets.
The main goals of this review paper, building on the long term GIScience interest in ML, are to: (1) survey recent work on active learning, DL, and active DL to provide suggestions for new directions built upon these evolving methods, and (2) bring active learning, DL, active DL, and complementary developments in visual analytics to GIScience, and by doing so extend the current GIScience “toolbox”.
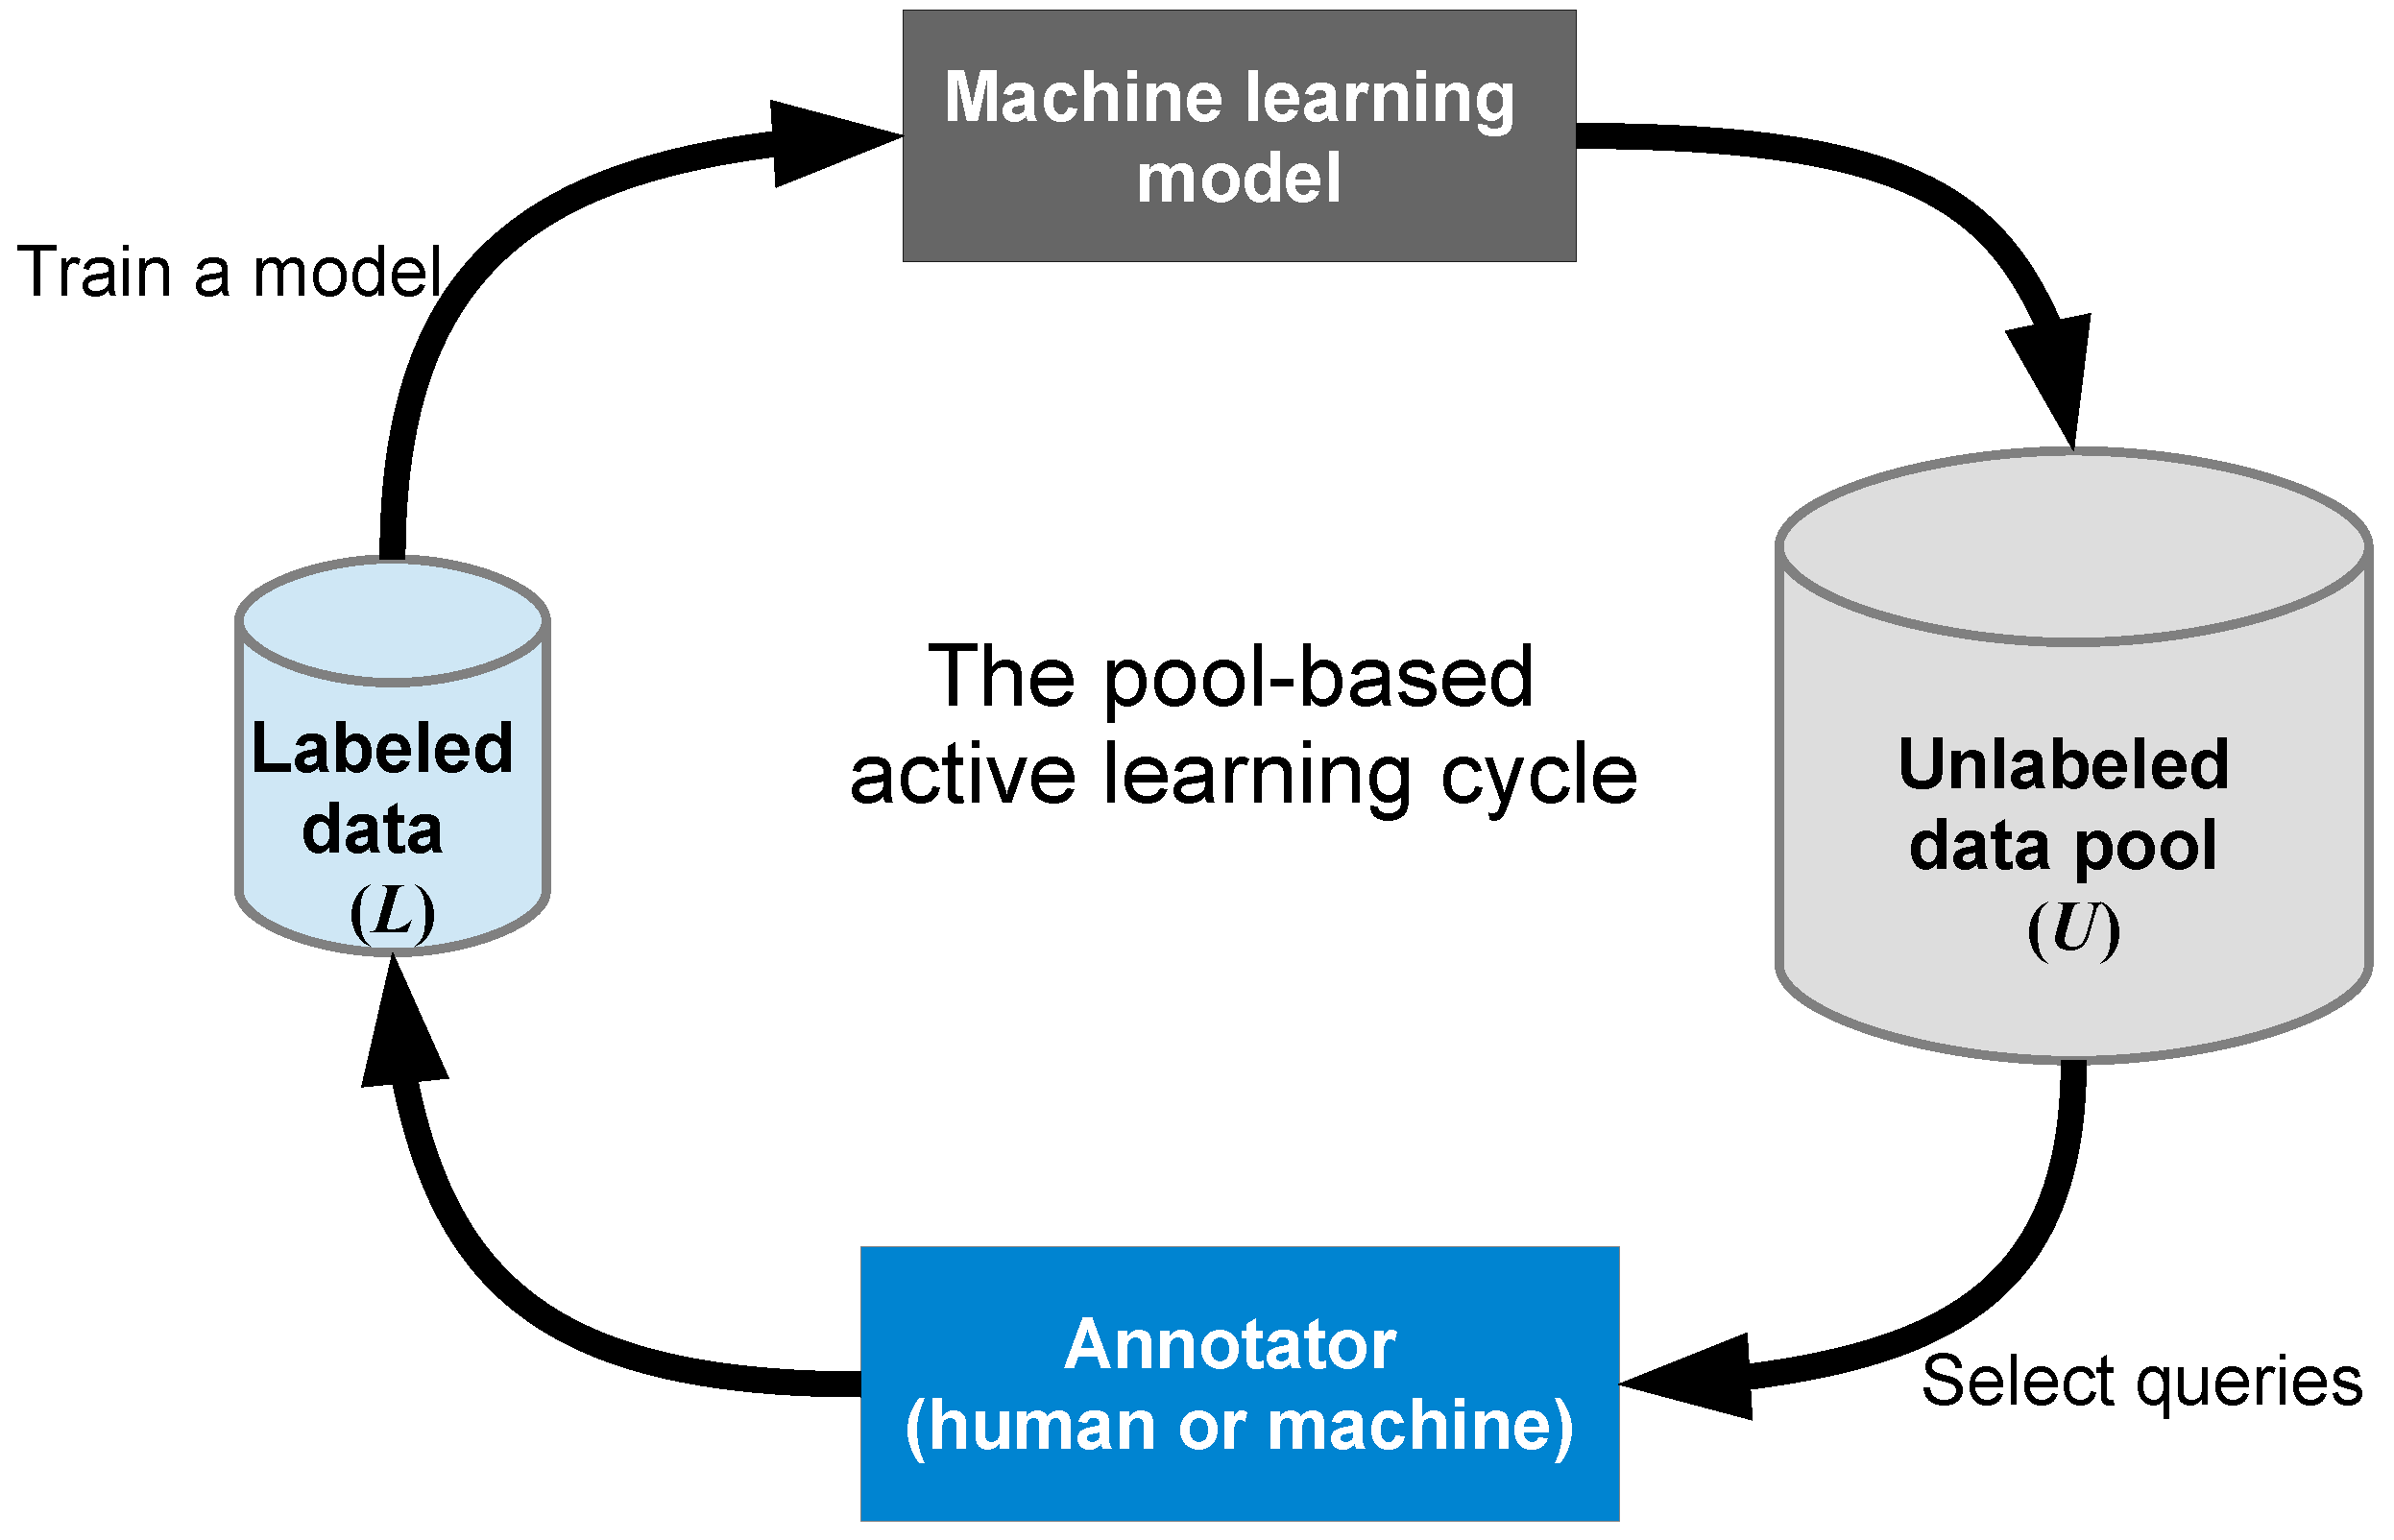
Through the synthesis of multiple rapidly developing research areas, this systematic review is relevant to multiple research domains, including but not limited to GIScience, computer science, data science, information science, visual analytics, information visualization, image analysis, and computational linguistics. This paper does not attempt to review pure/traditional active learning (see Figure 2, which illustrates a typical pool-based active learning cycle); for classic and recent reviews of these topics, see: [26,27]. A survey aimed at making active learning more practical for real-world use can be found in [28]; a survey from the perspective of natural language processing (NLP) can be found in [29]; and a survey of active learning in multimedia annotation and retrieval can be found in [30]. Our review focuses on investigating methods that extend and/or integrate active learning with visual analytics and DL for (geo) text and image classification, specifically on the two parts of the active learning cycle highlighted in Figure 3.
3. The State of the Art: Active Learning, Visual Analytics, and Deep Learning
As outlined above, leveraging the potential of DL to increase classification accuracy (for images or text) requires extensive amounts of manually labeled data. This is particularly challenging in domains requiring experts with prior knowledge that is often tacit [18,31,32,33,34,35]—in such cases, even crowdsourcing [36], such as Amazon Mechanical Turk [37,38], will not help much. In this section, we review several techniques that are central to addressing this challenge—in particular, active learning (Section 3.1), visual analytics (Section 3.2), active learning with visual analytics (Section 3.3), and active deep learning (Section 3.4).
3.1. Active Learning (AL)
In this section, we introduce the core ideas and concepts of active learning (AL) to help the understanding of later topics in this paper. We start by defining AL and why we need it (Section 3.1.1). Then, some core AL concepts, components, and methods are elaborated, with grounding in relevant literature (Section 3.1.2, Section 3.1.3, Section 3.1.4 and Section 3.1.5). Finally, we discuss some recent and important developments in AL (Section 3.1.6) and provide a brief summary and discussion (Section 3.1.7).
3.1.1. What’s AL and Why AL?
Can machines learn with fewer labeled training instances than those needed in supervised learning (a full explanation of which is provided in Appendix A.2.1) if they are allowed to ask questions? The answer is “yes”, with many encouraging results that have been demonstrated for a variety of problem settings and domains. AL [26,27,28,39] is a sub-field of semi-supervised learning (for details, see Appendix A.2.3) that implements this question-asking idea as an iterative process. AL differs from traditional “passive” learning systems that purely “learn from examples”. AL systems aim to make ML more economical and more accurate, because the learning algorithms can participate in the acquisition of their own training data, and are able to avoid using unrepresentative or poorly annotated data based on query strategies (Section 3.1.5).
AL is well-motivated in many ML based applications, where unlabeled data is massive, but labels are difficult, time-consuming, or expensive to obtain. The key idea behind AL is that a ML model can achieve high accuracy with a minimum of manual labeling effort if the (machine) learner is allowed to ask for more informative labeled examples by selection query. A query is often in the form of an unlabeled instance (e.g., an image or a piece of text), picked by the machine learner according to a specific query strategy (Section 3.1.5), to be labeled by an annotator who understands the nature of the domain problem [27]. Informative examples refer to those instances that can help improve the machine learner’s learning performance, and the informativeness is measured by different query strategies (Section 3.1.5).
AL has been successfully applied to a number of natural language processing tasks [29], such as information extraction, named entity recognition, text categorization, part-of-speech tagging, parsing, and word sense disambiguation. Tuia et al. [7] surveyed AL algorithms for RS image classification. Nalisink et al. employed AL to reduce the labeling effort for image classification [8]. A good example using AL to overcome label quality problems by combining experts and crowd-sourced annotators can be found in [40]. Another good example of using AL from crowds can be found in [41], where a multi-annotator (see Section 3.1.6) AL algorithm was provided. Most AL based methods are for binary classification tasks (see Appendix A.4.1), see [42] for an example of multi-class classification (see Appendix A.4.2) AL for image classification. While there has been increasing attention to AL, with applications in many domains, systematic and comprehensive comparison of different AL strategies is missing in the literature. We will come back to this later in Section 3.1.7.
3.1.2. AL Problem Scenarios
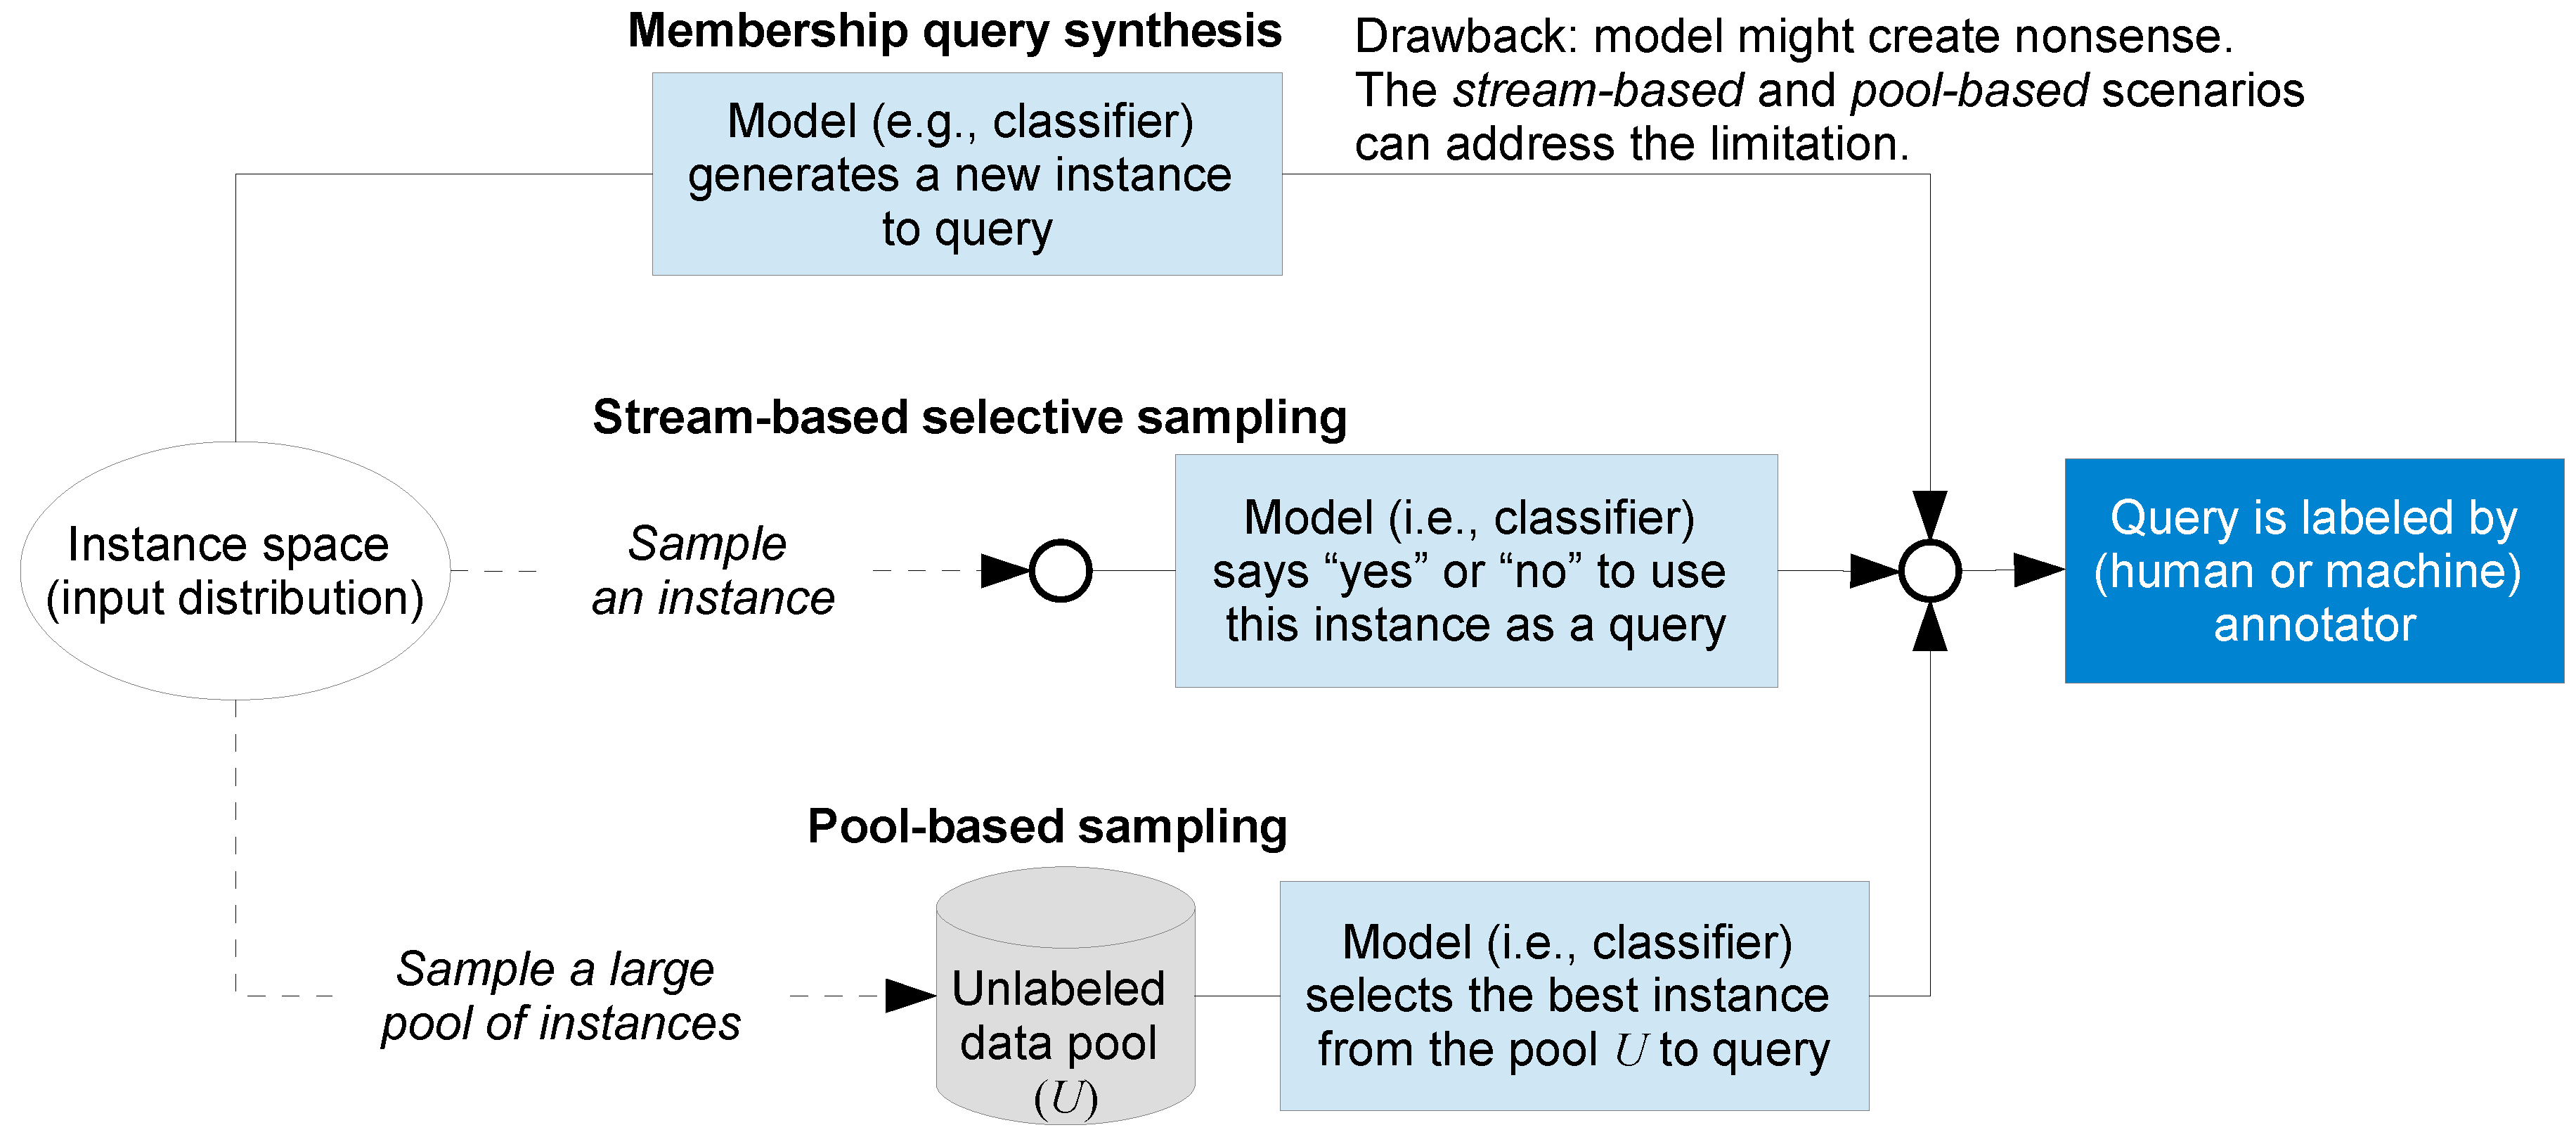
The AL literature [26,27,30] showcases several different problem scenarios in which the active machine learner may solicit input. The three most common scenarios considered in the literature are: membership query synthesis, stream-based selective sampling, and pool-based sampling. All three scenarios assume that machine learners query unlabeled instances to be labeled by annotators (humans or machines). Figure 4 illustrates the differences among these three AL scenarios. The dashed lines connecting instance space (set of possible observations—also called input space [27,43,44]) in Figure 4, represent that the machine learner does not know the definition of the instance space (thus the features of the space and their ranges are not known [27,43]).
Membership query synthesis was proposed in [45], and further developed and extended in [46,47,48,49,50]. In this scenario, the machine learner knows the definition of the instance space (e.g., feature dimensions and ranges are known). The learner can generate (i.e., synthesize) a new instance (e.g., an image or a piece of text) from scratch (thus one that meets the parameters of the instance space, but may or may not actually exist [28]) that satisfies the instance space definition, and then enlist an annotator for labeling [49,50]. Query synthesis can synthesize a new artificial (membership) query from scratch using a small amount of labelled data—it is therefore very efficient [49]. Query synthesis is often tractable and efficient for finite problem domains [46]. Thus, query synthesis has recently gained interest in some domains in which labels do not come from human annotators, but from experiments, where only heuristics are known. In such domains, artificial queries can be synthesized to elicit information (e.g., automated science [47,48]) or to detect and extract knowledge and design information with minimal cost (e.g., adversarial reverse engineering) [50].
Query synthesis is reasonable for some domain problems, but one major problem is that the synthesized (membership) queries are often not meaningful, and thus annotators, particularly human ones, can find it hard to assign labels [51,52]. By contrast, the stream-based and pool-based scenarios introduced below can address these limitations, because the queries always correspond to real examples. Therefore, the labels can be more readily provided by annotators [52].
In stream-based selective sampling (also called stream-based or sequential AL), given an unlabeled instance, which is drawn one at a time from the data source, the machine learner must decide whether to query its label or to discard it [26,39,52,53,54]. In a stream-based selective sampling scenario, learners can use the following two ways to query: (1) use a query strategy (Section 3.1.5.), (2) compute a region of uncertainty and pick instances falling in that region. The stream-based scenario has been studied in several real-world tasks (e.g., learning ranking functions for information retrieval [55], social media text classifications [56], and word sense disambiguation [57], where a word such as “bank” in “river bank” can be distinguished from the word “bank” in “financial bank”). One advantage of the stream-based selective sampling AL method is that it is suitable for mobile and embedded devices where memory and power is often limited, because in this scenario, each unlabeled instance is drawn one at a time from the data source.
In pool-based sampling AL [58,59], samples are selected from an existing pool for labeling using criteria designed to assess the informativeness of an instance. Informativeness has been defined as representing the ability of an instance to reduce the generalization error of a ML model [60,61]; query strategies designed to achieve informativeness of samples are discussed in Section 3.1.5.
A substantial proportion of AL methods in the literature are pool-based [26,56], with examples in domains that include: text classification (see examples later in this paper for text and image classification), image classification and retrieval [30], information retrieval [62], video classification and retrieval [30], speech recognition [63], and cancer diagnosis [64]. Only a few AL methods employed stream-based selective sampling [56]. For many real-world learning problems, large collections of unlabeled data can be gathered at once. This motivates pool-based sampling, because pool-based sampling evaluates and ranks the entire collection before selecting the best query [26]. This helps build a classifier with better performance and less labeled examples.
As outlined above, the three sampling scenarios have different primary applications. Membership query synthesis is most applicable to limited applications such as automated scientific discovery and adversarial reverse engineering [50], due to fact that instances produced by synthesized queries might be not recognizable to human annotators [51]. Stream-based methods are typically used for streaming data (as the name implies) because they scan the data sequentially and make individual decisions for each instance. Because they do not consider the data as a whole, stream-based selective sampling methods are typically less effective than pool-based for any situation in which data can be assembled ahead of time. Due to the limited focus of membership query synthesis and stream-based selective sampling, and the broad focus of pool-based sampling, a substantial proportion of AL methods discussed in the literature are pool-based [26,56]. Not surprisingly, this is also true for application of AL to (geo) text and image classification. Given this overall emphasis in the literature, and within the subset directed to geospatial applications, the focus in the remainder of the paper is on pool-based sampling, with the alternatives mentioned only to highlight particular recent innovations.
3.1.3. AL Core Components
A typical AL system contains two components: a learning engine and a sample selection engine. A learning engine refers to a ML model for most AL methods in the literature or a committee of ML models when the AL query strategy used is QBC (see Section 3.1.5). A sample selection engine is the query strategy used to measure how informative an unlabeled instance is (elaborated in Section 3.1.5).
A typical AL system works in an iterative way, as illustrated in Figure 2. In each iteration, the learning engine trains a model based on the current training set. The sample selection engine then selects the most informative unlabeled samples for labeling, and these (newly labeled) samples are added to the training set. As a contrast, the random sampling strategy [65] selects instances randomly from the unlabeled pool, without considering whether they provide the most beneficial information to improve the classifier’s learning performance. This strategy is equivalent to “passive” learning.
3.1.4. Batch-Mode AL
In most AL research, queries are selected in serial (i.e., labeling one instance at a time). This is not practical when training a model is slow or expensive. By contrast, batch-mode (also batch mode) AL [28] allows the machine learner to query a batch (i.e., group) of unlabeled instances simultaneously to be labeled, which is better suited to parallel labeling environments or models with slow training procedures to accelerate the learning speed. In batch-mode AL, the number of instances in each query group is called batch size. For some recent overview papers for batch-mode AL, see [56,66,67].
3.1.5. AL Query Strategies
Query strategies are central in AL methods; they are used to identify those training examples that can contribute most to the learning performance of ML models. Various AL query strategies have been proposed, defined, and discussed in several surveys to improve over random sample selection [7,26,28,29,30]. Here we highlight the most commonly used query strategies in AL: (1) uncertainty sampling, (2) diversity, (3) density, and (4) relevance.
Uncertainty sampling [58] picks the instances that the (machine) learner model is most uncertain about. Due to its simplicity, intuitiveness, and empirical success in many domains, uncertainty sampling is the most commonly used strategy. Though uncertainty sampling has many limitations, such as sensitivity to noise and outliers, it still works surprisingly well [68]. The heuristic of selecting the most uncertain instances stems from the fact that in many learning algorithms the essential classification boundary can be preserved based solely on the nearby samples, and the samples that are far from the boundary can be viewed as redundant. For a binary classification, the samples that are closest to a classification boundary will be selected. When multiple learners exist, a widely applied strategy is selecting the samples that have the maximum disagreement among the learners [69,70]. The disagreement of multiple learners can also be viewed as an uncertainty measure. This query strategy is called query-by-committee (QBC) [70]. A committee of ML models are trained on the same data set. Each committee member then votes on the labelings of query candidates. The most informative query is the instance on which they most disagree. Two main disagreement measures have been proposed in the literature: (1) vote entropy [54] and (2) average Kullback-Leibler (KL) divergence [71]. Vote entropy compares only the committee members’ top ranked class [71], whereas KL divergence metric [72] measures the difference between two probability distributions. KL divergence to the mean [73] is an average of the KL divergence between each distribution and the mean of all the distributions. Thus, this disagreement measure picks the instance with the largest average difference between the label distributions of any committee member and the consensus as the most informative query [26].
Other commonly used uncertainty sampling variants include: least confident, margin sampling, and entropy. Least confident is an uncertainty sampling variant for multi-class classification (Appendix A.4.2), where the machine learner queries the instance whose prediction is the least confident (as the name implies). The least confident strategy only considers information about the most probable label, and thus, it “throws away” information about the remaining label distribution. Margin sampling [74] can overcome the drawback (mentioned in the preceding sentence) of the least confident strategy, by considering the posterior of the second most likely label [26]. Entropy is an uncertainty sampling variant that uses entropy [75] as an uncertainty measure. Entropy-based uncertainty sampling has achieved strong empirical performance across many tasks [26]. A detailed discussion about when each variant of uncertainty sampling should be used is provided in [26].
The second query strategy, based on a diversity criterion [76], was first investigated in batch-mode AL (Section 3.1.4), where Brinker [76] used diversity in AL with SVMs. Diversity concerns the capability of the learning model to avoid selecting query candidates that rank well according to the heuristic (i.e., query strategy), but are redundant among each other. More specifically, a diversity based query strategy is used to select those unlabeled samples that are far from the selected set and thus can reduce redundancy within the selected samples. Diversity has been studied extensively for margin-based heuristics, where the base margin sampling heuristic is constrained using a measure of diversity between the candidates. An algorithm for a general diversity-based heuristic can be found in [7]. In many applications, we need to select a batch of samples instead of just one in an AL iteration. For example, updating (i.e., retraining) a model may need extensive computation, and thus labeling just one sample each time will make the AL process quite slow. Joshi et al. [42] proposed that the selected samples in a batch should be diverse. Dagli et al. [77] and Wu et al. [78] emphasized that the diversity criterion should not only be investigated in batch-mode but also be considered on all labeled samples, to avoid having selected samples being constrained in an (increasingly) restricted area.
The third strategy used by a machine learner is to select samples using a density [59] criterion that selects samples within regions of high density. The main argument for a density-based criterion [26] is that informative instances should not only be those that are uncertain, but also those that are “representative” of the underlying distribution (i.e., inhabit dense regions of the instance space). In density-based selection, the query candidates are selected from dense areas of the feature space because those instances are considered as most representative [26,60,61,78]. The representativeness of an instance can be evaluated by how many instances among the unlabeled data are similar to it. Density-based selection of candidates can be used to initialize an AL model when no labels are available at all. Wu et al. [78] proposed a representativeness measure for each sample according to the distance to its nearby samples. Another strategy uses clustering-based methods [79,80], which first group the samples and then selects samples at and around the cluster centers. Qi et al. [80] combine AL with clustering, and their method can refine the clusters with merging and splitting operations after each iteration, which is beneficial for selecting the most informative samples in the AL process, and also helps further improve the final annotation accuracy in the post-processing step.
The fourth strategy, relevance criterion, is usually applied in multi-label classification tasks (Appendix A.4.3). Based on a relevance criterion, those samples that have the highest probability to be relevant for a certain class are selected [30]. This strategy fosters the identification of positive examples for a class. Ayache and Quénot [81] have conducted an empirical study on different sample selection strategies for AL for indexing concepts in videos. Their experimental results clearly show that the relevance criterion can achieve better performance than an uncertainty criterion for some concepts.
It is difficult to directly compare these criteria. Seifert and Granitzer’s experiments [82] showed that the benefits of these strategies depend on specific tasks, data sets, and classifiers (Appendix A.3). Wang et al. [30] provided several general suggestions: (1) for binary classification problems, applying a relevance criterion may achieve the best results for some extremely unbalanced cases where positive samples are much less frequent than negative ones, (2) in batch-mode AL (Section 3.1.4), integrating a diversity criterion will be helpful for computational efficiency, (3) in many cases, these criteria are combined explicitly or implicitly, (4) the diversity and density criteria are normally not used individually (because they are not directly associated with classification results) and most commonly they are used to enhance the uncertainty criterion. The uncertainty criterion relates to the confidence of a ML algorithm in correctly classifying the considered sample, while the diversity criterion aims at selecting a set of unlabeled samples that are as diverse (distant from one another) as possible, thus reducing the redundancy among the selected samples. The combination of the two criteria results in the selection of the potentially most informative set (Section 3.1.1) of samples at each iteration of the AL process. Patra et al. [83] combine the uncertainty and diversity criteria, where they proposed a batch-mode AL (Section 3.1.4) method for multi-class classification (Appendix A.4.2) with SVM classifiers. In the uncertainty step, m samples are selected from all over the uncertain regions of the classifiers. In the diversity step, a batch of h (m > h > 1) samples that are diverse from each other are chosen among the m samples that are selected in the uncertainty step. Xu et al. [84] also employed SVM-based batch-mode AL, whereas their method incorporated diversity and density measures. To improve classifier performance for interactive video annotation, Wang et al. [85] have combined uncertainty, diversity, density and relevance for sample selection in AL and named the comprehensive strategy as effectiveness.
3.1.6. Recent and Novel AL Methods
Yan et al. [41], Sharma et al. [9], and Sharma and Bilgic [68] introduced some very recent and novel AL based methods. Typical AL algorithms rely on a single annotator (i.e., oracle) who serves in the role of a “teacher”. By contrast, the following multiple annotator AL scenario poses new challenges: an oracle, who knows the ground truth, does not exist, and multiple annotators, with varying expertise, are available for querying. Such scenarios are not uncommon in the real world, for example, decision making for emergency management. To bridge the gap, Yan et al. [41] focused on an AL scenario from multiple crowdsourcing annotators. The machine learner asks which data sample should be labeled next and which annotator should be queried to improve the performance of the classifier the most. Specifically, Yan et al. employed a probabilistic model to learn from multiple annotators—the model can also learn the annotator’s expertise even when their expertise may not be consistently accurate across the task domain. The authors provided an optimization formulation that allows the machine learner to select the most uncertain sample and the most appropriate annotator to query the labels. Their experiments on multiple annotator text data and on three UCI benchmark data sets [86] showed that their AL approach combined with information from multiple annotators improves the learning performance.
One of the bottlenecks in eliciting domain knowledge from annotators is that the traditional supervised learning approaches (Appendix A.2.1) cannot handle the elicited rich feedback from domain experts. To address the gap, many methods have been developed, but they are often classifier-specific [9]; these methods do not transfer directly from one domain to another. To further address this problem, Sharma et al. [9] proposed an AL approach that can incorporate rationales elicited from annotators into the training of any existing classifier for text classification (Appendix A.5). Their experimental results using four text categorization datasets showed that their approach is effective for incorporating rationales into the learning of multinomial Naıve Bayes, logistic regression, and SVMs classifiers.
Traditional uncertainty sampling does not consider the reasons why a (machine) learner is uncertain on the selected instances. Sharma and Bilgic [68] addressed this gap by using an evidence-based framework to do so. Specifically, the authors focused on two types of uncertainty: conflicting-evidence uncertainty and insufficient-evidence uncertainty. In the former type of uncertainty, the model is uncertain due to presence of strong but conflicting evidence for each class; in the latter type, the model is uncertain due to insufficient evidence for either class. Their empirical evaluations on several real-world datasets using naıve Bayes for binary classification tasks showed that distinguishing between these two types of uncertainties has a drastic impact on the learning efficiency: conflicting-evidence uncertainty provides the most benefit for learning, substantially outperforming both traditional uncertainty sampling and insufficient-evidence uncertainty sampling. The authors, in their explanation of these results, showed that the instances that are uncertain due to conflicting evidence have lower density in the labeled set, compared to instances that are uncertain due to insufficient evidence; that is, there is less support in the training data for the perceived conflict than for the insufficiency of the evidence.
3.1.7. AL Summary and Discussion
Even though AL has been successfully applied to many problems in different domains, no systematic and comprehensive comparison of AL strategies have been examined. This might be caused by the fact that most of the work has been disconnected, using different data sets in different problem domains with insufficient consistency to easily compare AL strategies etc. Ramirez-Loaiza and colleagues [87] have made the first attempt to address this recently, but they only evaluated two classifiers and two AL strategies.
Ramirez-Loaiza et al., based on a meta-analysis of 54 published papers, found that most empirical evaluations of AL approaches in the literature have focused on a single classifier (83%) and a single performance measure (91%) [87]. To provide important practical advice for AL methods, these authors also conducted an extensive empirical evaluation of common AL baselines, using two probabilistic classifiers (naive Bayes and logistic regression) and two of the most common AL strategies (uncertainty sampling and QBC). Their evaluation used several performance measures on a number of large datasets. They experimented with both synthetic and real-world datasets, specifically, 10 large real-world binary classification data sets. The smallest dataset had 19 K instances and the largest 490 K. The domains and class distributions of these data sets are diverse—from housing, through ecology, to handwriting and letter recognition. Ramirez-Loaiza et al. [87] concluded that AL algorithms can reduce the time, effort, and resources needed to train an accurate predictive model by carefully choosing which instances should be labeled. Ramirez-Loaiza and colleagues’ findings also highlighted the importance of overlooked choices in AL experiments in the literature. For example, they showed that model selection is as important as development of an AL algorithm.
3.2. Visual Analytics (VA) and Human-in-the-Loop
VA focuses on the integration of computational methods (e.g., analytical reasoning algorithms) and interactive visual interfaces to extend the perceptual and cognitive abilities of humans [88], and thus to support human reasoning (via exploratory knowledge discovery) about complex phenomenon with big and often heterogeneous data. VA emphasizes the key role of visual representations as the most effective means to convey information to the human and prompt human cognition and reasoning.
VA can support at least three of the core challenges in the context of M&DL: (1) building labeled data efficiently, thus in ways that minimizes the time of human annotators, (2) tuning the methods to produce the most accurate classification results with the least amount of training data and processing time, and (3) helping end users understand both the process through which classifiers are constructed and applied and the end result of their applications (thus supporting “explainable” M&DL).
There is now more than a decade of research in VA, an annual conference (one of the three making up IEEE Vis), and increasing research on basic and applied VA across many domains. Thus, a comprehensive review of even the subset of VA focused on classification tasks is beyond the scope of this paper; for some recent overview papers see [4,89,90,91,92,93,94]. A VA agenda is provided in [95,96], and then for geovisual analytics and related topics in [97]. Here, we focus specifically on the role of VA interfaces helping analysts understand M&DL, and then in Section 3.3 we review the recent efforts that are specifically focused on the integration of VA with AL methods.
After surveying a range of projects that support VA contextually in the sensemaking loop, Endert et al. [98] argued for a shift from a ‘human-in-the-loop’ philosophy to a ‘human is the loop’ viewpoint. A similar argument about the central role of analysts can be found in [99], where the authors emphasized that a human-centered understanding of ML can lead not only to more usable ML tools, but to new ways of framing learning computationally. Biewald [14] explained why human-in-the-loop computing is the future of ML, and the related need for explainable M&DL is discussed in [100]. In related research, Liu et al. [5] provided a comprehensive review about using VA via interactive visualization to understand, diagnose, and refine ML models. Additional calls for a VA-enabled human-in-the-loop approach to improve the accuracy of black-box M&DL models are discussed in [101,102].
Beyond the arguments for the potential of VA to support ML, a few recent studies demonstrated empirically that VA based interactive interfaces can help users understand DL architectures and thus improve the models’ classification accuracy. Wongsuphasawa et al. [103] (the Best paper of VAST 2017; IEEE VAST is the leading international conference dedicated to advances in VA) demonstrated a successful example of employing VA to visualize dataflow graphs of DL models in TensorFlow (one of the very popular M&DL libraries released open source in 2015 by Google). The approach used TensorBoard (a VA component for TensorFlow) to help TensorFlow developers understand the underlying behavior of DL models implemented in the system.
In research not so closely tied to one particular toolkit, Alsallakh et al. [104] presented VA methods to help inspect CNNs and improve the design and accuracy for image classification. Their VA interface can reveal and analyze the hierarchy of similar classes in terms of internal features in CNNs. The authors found that this hierarchy not only influences the confusion patterns between the classes, it furthermore influences the learning behavior of CNNs. Specifically, the early layers in CNNs detect features that can separate high-level groups of classes, even after a few training epochs (in M&DL, an epoch is a complete pass through all the training examples; in other words, the classifier sees all the training examples once by the end of an epoch). By contrast, the latter layers require substantially more epochs to detect specialized features that can separate individual classes. Their methods can also identify various quality issues (e.g., overlapping class semantics, labeling issues, and imbalanced distributions) in the training data. In complementary work, Ming et al. [6] developed a VA interface, RNNVis, for understanding and diagnosing RNNs for NLP tasks. Specifically, they designed and implemented an interactive co-clustering visualization of hidden state unit memories and word clouds, which allows domain users to explore, understand, and compare the internal behavior of different RNN models (i.e., regular RNN, LSTM, and GRU). In particular, the main VA interface of the RNNVis contains glyph-based sentence visualization, memory chips visualization for hidden state clusters, and word clouds visualization for word clusters, as well as a detail view, which shows the model’s responses to selected words such as “when” and “where” and interpretations of selected hidden units. Their evaluation—two case studies (focused on language modeling and sentiment analysis) and expert interviews—demonstrated the effectiveness of using their system to understand and compare different RNN models.
3.3. AL with VA
AL alone has already been applied successfully to many applications (Section 3.1) where labeled data are limited. Here we review some work in AL empowered by VA. In the literature, the integration of interactive VA interfaces and AL methods is also known as interactive ML [10,105,106,107]. All of the reviewed work below strongly indicates that VA can play a powerful role in AL.
A number of case studies were investigated by Amershi et al. [105] to demonstrate how interactivity results in a tight coupling between learning systems and users. The authors report three key results: (1) although AL results in faster convergence, users often get frustrated by having to answer the machine learner’s long stream of questions and not having control over the interaction, (2) users naturally want to do more than just label data, and (3) the transparency of ML models can help people provide more effective labels to build a better classifier.
Several additional strong arguments about the power to combine VA with AL to leverage the relative advantages of (experienced) human expertise and computational power can be found in the literature [10,11,15]. In one of the more detailed accounts, Holzinger [10] emphasized that in the health (informatics) domain, a small number of data sets or rare events is not uncommon, and so ML based approaches suffer from insufficient training samples. They also present an argument for a human-in-the-loop approach with domain experts by integrating AL with VA, proposing that this integration can be beneficial in solving computationally hard health data problems (e.g., subspace clustering and protein folding), where human expertise can help to reduce an exponential search space through heuristic selection of samples. The ultimate goal of a human-in-the-loop methodology is to design and develop M&DL algorithms that can automatically learn from data and thus can improve with experience over time and eventually without any human-in-the-loop (other than to understand and act upon the results) [10].
Most existing AL research is focused on mechanisms and benefits of selecting meaningful instances for labeling from the machine learner’s perspective [28]. A drawback of this typical AL query strategy is that users cannot control which instances are selected to be labeled [11,18]—this may affect the performance of an AL model [18]. Seifert and Granitzer [82] proposed user-based visually-supported AL strategies that allow the user to select and label examples posed by a machine learner. Their experiments showed that restricting human input to labeling only instances that the system picks is suboptimal. Giving users a more active role in terms of a visual selection of examples and in adapting their labeling strategies on top of tailored visualization techniques can increase labeling efficiency. In their experiments, the basis for the user’s decision is a visualization of the a-posteriori probabilities of the unlabeled samples.
Bernard et al. [15] investigated the process of labeling data instances with users in the loop, from both ML (in particular, AL) and VA perspectives. Based on reviewing similarities and differences between AL and VA, they proposed a unified process called visual-interactive labeling (VIL), through which they aim to combine the strengths of VA and AL (first initiatives for the integration of AL and VIL can be found in [82,108,109,110]). In follow on research, Bernard et al. [11] performed an experimental study to compare VIL and AL labeling strategies (used independently). In that project, they developed an evaluation toolkit that integrates 16 different established AL strategies, five classifiers, and four visualization techniques. Using their toolkit, Bernard et al. conducted an empirical study with 16 expert participants. Their investigation shows that VIL achieves similar performance to AL. One suggestion based on Bernard et al. [11]’s experiment findings was to incorporate (visual) analytical guidance in the labeling process in AL. Their investigation represents an important step towards a unified labeling process that combines the individual strengths of VA and AL strategies. We share the same vision with Bernard et al. [11,15]—while they call it VIL, we think that VA enabled AL is a more intuitive term for the integration of the power of AL and VA, because VIL “hides” the essential role of AL.
Recent developments in ML and VA signal that the two fields are getting closer [11]—for example, Sacha et al. [4] proposed a conceptual framework that models human interactions with ML components in the VA process, and makes the interplay between automated algorithms and interactive visualizations more concrete. At the core of the Sacha et al.’s [4] conceptual framework lies the idea that the underlying ML models and hyper-parameters, which cannot be optimized automatically, can be steered via iterative and accessible user interactions. Interactive visualizations serve as an aid or “lens” that not only facilitates the process of interpretation and validation, but also makes the interactions with ML models accessible to domain users [4].
AL and VA alone are not new, but interactive annotation tools empowered by M&DL classifiers for (geo) text and image data are not well developed, and the role of visualization in active learning for text and image related tasks has not been well developed, either. Höferlin et al. [109] extended AL by integrating human experts’ domain knowledge via an interactive VA interface for ad-hoc classifiers applied to video classification. Their classifier visualization facilitates the detection and correction of inconsistencies between the classifier trained by examples and the user’s mental model of the class definition. Visual feedback of the training process helps the users evaluate the performance of the classifier and, thus, build up trust in the trained classifier. The main contributions of their approach are the quality assessment and model understanding by explorative visualization and the integration of experts’ background knowledge by data annotation and model manipulation (modifying a model based on users’ expertise can boost the learner, especially in early training epochs, by including fresh domain knowledge). They demonstrated the power of AL combined with VA in the domain of video VA by comparing its performance with the results of random sampling and uncertainty sampling of the training sets. Huang and colleagues’ [18,111] experiments and their early results showed that active learning with VA improves learning models performance compared to methods with AL alone for text classification, with an interactive and iterative labeling interface; their AL with visualization method is for a binary (i.e., positive and negative) classification problem (Appendix A.4.1). Heimerl et al. [108] incorporated AL to various degrees with VA for text document retrieval to reduce the labeling effort and to increase effectiveness. Specifically, their VA interface for visual classifier training has a main view (shows the classifier’s state with projected documents) , a cluster view (shows the documents with most uncertain classification), a content view (shows the selected documents), a manual view used during evaluation, a classifier history for undo/redo navigation, a labeled document view for listing labeled documents, and most importantly the labeling controls with a preview of the estimated impact of the newly labeled documents on the classifier.
In more recent work, Kucher et al. [13] combined the power of VA and AL for stance classification of social media text. The stance categories Kucher et al. used are: agreement and disagreement, certainty, concession and contrariness, hypotheticals, need/requirment, prediction, source of knowledge, tact and rudeness, uncertainty, volition, irrelevant, neutral. Kucher et al. developed a system called ALVA, which has been used by their domain experts in linguistics and computational linguistics to improve the understanding of stance phenomena and to build a stance classifier for applications such as social media monitoring. Stance classification is a multi-label classification (Appendix A.4.3) problem. Their ALVA system supports annotation of text for multi-label classification, ML classifier training with an AL approach, and exploratory visual analysis of the annotated data. The VA component makes labeling examples for multi-label classification (Appendix A.4.3) much easier and intuitive for the analysts in linguistics and computational linguistics.
3.4. Active Deep Learning (ADL)
As discussed further in Appendix A.1, DL can discover intricate patterns hidden in big data. Advances in DL have been dramatic and rapid, and the landscape of M&DL is changing quickly as a result. For example, Jean and colleagues [112,113] in 2015 demonstrated for the first time that DL could beat Google’s existing phrase-based statistical process for language translation and by November 2016, after Google switched to that approach, evidence showed that their new system was already on par with human translation [114].
We have seen above many successful use cases for AL (Section 3.1) and AL integrated with VA (Section 3.3). Now we review some recent work in AL combined with DL—active deep learning (ADL). It is also called deep active learning (e.g., see [115]), but active deep learning is a much more commonly used term in the literature. The main process of ADL is very similar to AL. The main difference is that the machine learner in regular AL is a traditional ML algorithm (e.g., SVM), whereas in ADL, the learner is a DL one, such as CNN. As emphasized in Appendix A.1, DL has better scalability for Big Data problems than traditional ML [116]. This motivates ADL because it combines the power of DL and AL—better scalability than ML and less labeled data than regular DL for training a good machine learner.
AL has been investigated with some DL architectures for image classification and text classification (including sentiment analysis). Wang and Shang [17] applied AL methods in DL networks for image classification. The (DL) classifiers they used are stacked restricted Boltzmann machines (stacked RBMs) and stacked auto-encoders, with three commonly used uncertainty sampling based query strategies (i.e., least confidence, margin sampling, and entropy, see Section 3.1.5). Their experiments were run on the well-known MNIST [117] benchmark data set (one of the classic data sets for benchmarking ML algorithms). The authors conclude that their ADL method outperforms random sampling consistently by a significant margin, regardless of the selection of uncertainty-based strategy and classifier. Gal et al. [118] also developed an AL framework that integrates DL for image classification, whereas the classifier they used is Bayesian CNNs. Their result showed a significant improvement on existing AL approaches.
Another successful integration example of deep CNNs and AL for image classification can be found in [119]—the authors proposed an ADL framework called Cost-Effective Active Learning (CEAL), where the classifier can be simultaneously updated with progressively annotated informative samples. Unlike most traditional AL methods focusing on uncertain samples of low prediction confidence, their strategy selects two complementary kinds of samples to incrementally improve the classifier training and feature learning: (1) the minority informative kind contributes to training more powerful classifiers, and (2) the majority high confidence kind contributes to learning more discriminative feature representations. Although the number of samples that belongs to the first type is small (e.g., an image with a soccer ball and a dog is much more rare than images that contain only a soccer ball), the most uncertain unlabeled samples usually have great potential impact on the classifiers. Selecting and annotating them as part of the training set can contribute to a better decision boundary of the classifiers. Their framework progressively selects the minority samples among most informative samples, and automatically pseudo-labels (i.e., pick up the class which has the maximum predicted probability, and use it as if it was the true label [120]) majority high confidence samples from the unlabeled set for feature learning and model updating. The labeled minority samples benefit the decision boundary of the classifier and the majority pseudo-labeled samples provide sufficient training data for robust feature learning. Their experiment results, on two challenging public benchmark data sets (face recognition on CACD database [121] and object categorization on Caltech-256 [122]), demonstrated the effectiveness of their CEAL framework.
Most AL methods in the literature (Section 3.1) ask annotators to annotate data samples. By contract, Huijser and van Gemert [123] provide a recent example of combining AL with DL, where they took a completely different approach—it asks for annotators to annotate the decision boundary. At this point, their method focuses on a binary classification (Appendix A.4.1) and a linear classification model (i.e., SVM). Additionally, the method used a deep generative model to synthesize samples according to a small amount of labeled samples, which will not work for text related tasks (because deep generative models are designed for continuous data like images [124,125], rather than the discrete data of words and phrases that must be dealt with in NLP problems [126]).
After reviewing some ADL methods for image classification, we now introduce recent ADL work for text classification problems. Zhou et al. [127] integrated AL with DL for semi-supervised sentiment classification using RBMs. Their experiments on five sentiment classification data sets showed that their ADL methods outperform classic semi-supervised learning algorithms and DL architectures applied for sentiment classification. Zhang and Wallace [128] proposed an ADL method for text classification, where the classifier is a CNN. In contrast to traditional AL approaches (e.g., uncertainty sampling), the most novel contribution is that their method is designed to quickly induce discriminative word embeddings (Appendix A.6), and thus improve text classification. Taking sentiment classification as an example, selecting examples in this way quickly pushes the embeddings of “bad” and “good” apart. Their empirical results (with three data sets about sentiment where two were categorized as positive/negative, one as subjective/objective) show that the method outperforms baseline AL approaches. However, their method is for binary classification (Appendix A.4.1), other types of classification tasks (Appendix A.4.2, Appendix A.4.3 and Appendix A.4.4) are not touched upon.
Research on combining AL with RNNs for short-text classification is rare. To address the gap, Zhou [115] demonstrated using AL with RNNs as classifiers for (Chinese) short-text classification. The proposed ADL algorithm dramatically decreases the amount of labeled samples without significantly influencing the classification accuracy of the original RNNs classifier, which trained on the whole data set. In some cases, the proposed ADL algorithm even achieves better classification accuracy with less trained data than the original RNNs classifier.
4. GIScience and RS Applications Using AL and ADL
In this section, we review recent work in which AL and/or ADL have been applied to GIScience and RS problems. We provide some very recent applications in GIScience using AL, one of which integrated VA, in Section 4.1, and also cover some applications using AL/ADL in RS in Section 4.2 (AL applied in RS has much longer history than in non-RS components of GIScience, and ADL has recently emerged in RS areas. To our knowledge, no RS applications have integrated AL or ADL with VA). All of those applications shown that AL and ADL, combined with VA ideally, are promising methods to bring the power of M&DL, as well as VA, to GIScience and RS communities.
4.1. GIScience Applications Using AL/AL with VA
Júnior et al. [65]’s very recent (2017) work on GPS trajectory classification provides solid evidence that AL can be used together with VA to help domain experts perform semantic labeling of movement data. In this work, they pose three research questions: (1) Is there a ML method that supports building a good classifier for automatic trajectory classification but with a reduced number of required human labeled trajectories? (2) Is the AL method effective for trajectory data? and (3) How can we help the user in labeling trajectories? To answer the rest of their research questions, Júnior et al. developed a web-based interactive tool named ANALYTiC to visually assist domain experts to perform GPS trajectory classification using AL and a simple VA interface, where users can pick one of the six (traditional ML) classifiers (Ada boost, decision tree, Gaussian naive Bayes, k-nearest neighbors (KNN), logistic regression, and random forest) and one of the three query strategies (uncertainty sampling, QBC, and random sampling) to start with trajectory labeling. Their interactive tool supports only binary classification (Appendix A.4.1). Júnior et al. also conducted a series of empirical evaluation experiments with three trajectories data sets (animals, fishing vessels, and GeoLife). Their results showed how the AL strategies choose the best subset to annotate and performed significantly better than the random sampling (baseline strategy). Their examples also demonstrated how the ANALYTiC web-based visual interface can support the domain expert in the AL process and specifically in the trajectory annotation using a set of visual solutions that ease the labeling inference task. They concluded that ML algorithms can infer semantic annotations defined by domain users (e.g., fishing, non-fishing) from trajectories, by learning from sets of manually labeled data. Specifically, AL approaches can reduce the set of trajectories to be labeled while preserving good performance measures. Their ANALYTiC web-based interactive tool visually guides domain experts through this annotation process.
Another very recent AL study that is very closely related to GIScience problems can be found in [56], where Pohl et al. applied AL methods to social media data (i.e., tweets) for crisis management. Two ML classifiers (i.e., kNN and SVM) are used in their AL application with several uncertainty strategies for binary classification (Appendix A.4.1) to distinguish between relevant and irrelevant information contained in a data stream. The authors used stream-based (Section 3.1.2) batch-mode AL (Section 3.1.4). Two types of data sets are used in their experiments: synthetic and social media data sets related to crises. Their empirical results illustrate that batch-mode AL is able to, with good performance, distinguish between relevant and irrelevant information from tweets for crisis management.
Overall, the application of AL with ML (or DL) applied to non-RS GIScience problems is just beginning. Given the rapid advances in M&DL and AL, we anticipate this situation to change quickly, with additional applications to mobility data, geospatial text analysis, and a range of location-based service applications. An objective of this review, of course, is to enable such development.
4.2. RS Applications Using AL/ADL
DL has achieved success in many applications, however, a large set of good quality labeled samples are needed to train a good DL classifier, as emphasized in Appendix A.1. Zhu et al. [12] provided a very recent survey of DL in RS, where they reviewed the recent advances and analyzed the challenges of using DL with RS data analysis. More importantly, they advocate that RS scientists should adapt DL to tackle large-scale RS challenges, such as application of RS and DL to study climate change and urbanization. However, AL (Section 3.1) and ADL (Section 3.4) based methods are not touched on in their review. In their conclusions, the authors did emphasize that limited training samples in RS represents a challenging bottle-neck to progress. Our review provides a promising solution to the challenges they pointed out. To help RS researchers get started with DL, a technical tutorial on DL for RS data is provided in [129].
AL has a relatively long history and has been widely studied for RS applications (compared with attention given to AL in other components of GIScience). Many successful AL examples in RS in the literature (reviewed below in this section) have demonstrated that AL can aid RS image classification tasks, whereas ADL (Section 3.4) has only been recently applied to RS for image classification. Below, we first introduce some AL methods used for RS image classification, and then more recent ADL methods applied to RS image classification problems.
Some pioneering work using AL for RS image classification can be found in [130,131,132,133,134]. Tuia et al. (2011) [7] surveyed and tested several main AL methods used in RS communities for (multispectral and hyperspectral) RS image classification. As introduced in Section 3.1, an AL process requires the interaction between the annotator (e.g., domain experts) and the model (e.g., a classifier)—the former provides labels, which integrates domain knowledge while labeling, and the latter provides the most informative pixels to enlist annotators for labels. This is crucial for the success of an AL algorithm—the machine learner needs a query strategy (Section 3.1.5) to rank the pixels in the RS image pool. Tuia et al. [7] used AL query strategies (Section 3.1.5), also called heuristics in the RS community [7], to group the AL algorithms they reviewed into three main categories [132]: committee, large margin, and posterior probability-based. Tuia et al. also analyzed and discussed advantages and drawbacks of the methods they reviewed, and provided some advice for how to choose a good AL architecture. One of the directions they pointed out is the inclusion of contextual information in heuristics (i.e., AL query strategies)—they emphasized that the heuristics proposed in the literature mainly used spectral criteria, whereas few heuristics directly considered positional information and/or textures. To address the gap of lacking heuristics that consider spatial constraints, Stumpf et al. [135] developed region-based AL heuristics for RS image classification. Empirical tests with multitemporal and multisensor satellite images of their region-based heuristics, which considered both uncertainty and diversity criteria, demonstrated that their method outperformed pointwise sampling and region-based methods that considered only uncertainty.
An early example of applying AL methods in RS can be found in [130], in which Mitra et al. employed an AL technique that selects the n most uncertain samples for segmentation of multispectral RS images, using SVMs for binary classification (Appendix A.4.1). Their AL query strategy is to select the sample closest to the current separating hyperplane of each binary SVM. Ferecatu and Boujemaa [136] also employed an SVM classifier in their AL method for remote-sensing image retrieval. Their experimental evaluation of classification performance confirmed the effectiveness of their AL approach for RS image retrieval. Their AL selection criterion focused on minimizing redundancy between the candidate images shown to the user.
Obtaining training data for land cover classification using remotely sensed imagery is time consuming and expensive, especially for relatively inaccessible locations. In an early step toward the goal of designing classifiers that use as few labeled data points as possible, Rajan et al. [131] proposed an AL technique that efficiently updates existing classifiers by using minimal labeled data points. Specifically, Rajan et al. [131] used an AL technique that selects the unlabeled sample that maximizes the information gain between the posteriori probability distribution estimated from the current training set and the (new) training set obtained by including that sample into it. The information gain is measured by the Kullback-Leibler divergence [71] (Section 3.1.5). One main contribution they made was that their AL method can adapt classifiers when there is substantial change in the spectral signatures between labeled and unlabeled data. Their AL approach is also useful for classifying a series of spatially/temporally related images, wherein the spectral signatures vary across the images. Their empirical results provided good performance, which was tested on both single and spatially/temporally related hyperspectral data sets.
As introduced in Section 3.1.4, batch-mode AL is better suited to parallel labeling environments or models with slow training procedures to accelerate the learning speed. Tuia et al. [132] proposed two batch-mode AL algorithms for multi-class (Appendix A.4.2) RS image classification. The first algorithm extended the SVM margin sampling (Section 3.1.5) by incorporating diversity (Section 3.1.5) in kernel space, while the second is an entropy-based (Section 3.1.5) version of the query-by-bagging algorithm. The AL algorithms in pseudo code were provided in their appendix. Demir et al. [133] also investigated several multi-class (Appendix A.4.2) SVM-based batch-mode AL techniques for interactive classification of RS images; one outcome of the research was a proposed cluster-based diversity criterion for informative query selection. Patra and Bruzzone [134] also proposed a fast cluster-assumption based AL technique, but they only considered the uncertainty criterion. In a follow up study, Patra and Bruzzone [83] proposed a batch-mode AL (Section 3.1.4) technique that considered both uncertainty and diversity criteria for solving multi-class classification (Appendix A.4.2) problems using SVM classifier with OAA architecture. Their experimental results running on two different RS data sets (i.e., hyperspectral and multispectral) confirmed the effectiveness of the proposed technique.
Above, we have seen some successful AL methods to tackle RS problems. Now, we will introduce recent ADL (Section 3.4) work for RS image classification. A RS scene can be classified into a specific scene theme (e.g., a part of a forest, a parking lot, and a lake). In this type of classification task, supervised learning techniques are usually employed. Zou et al. [137] used AL for RS scene classification to remove less informative deep belief network (DBN) features [138], before a t-test was applied on the remaining features for discriminative feature selection. Specifically, they used iterative execution of AL, with 200 iterations, to collect an informative feature set from the DBN features, and then perform a t-test for feature selection.
It is expensive to get good labeled samples in hyperspectral images for RS applications. To address this challenge, Liu et al. [139] proposed an ADL method for RS hyperspectral image classification, where their algorithm selects training samples that maximize two selection criteria (i.e., representativeness and uncertainty). The performance of their algorithm was compared with several other AL (but not integrated with DL) classification algorithms that used different query strategies (i.e., random sampling, maximum uncertainty sampling [26], and QBC [7]; see Section 3.1.5). Their results demonstrated that the proposed algorithm achieved higher accuracy with fewer training samples by actively selecting training samples.
DL has been widely studied to recognize ground objects from satellite imagery, whereas Chen and Zipf [140] also emphasized that finding ground truth especially for developing and rural areas is not easy and manually labeling a large set of training data is very expensive. To tackle this challenge, Chen and Zipf [140] propose an ongoing research project named DeepVGI, with the goal of employing ADL (Section 3.4) to classify satellite imagery with Volunteered Geographic Information (VGI) data. In their deepVGI method, Chen and Zipf [140] tested two classic CNNs (LeNet [141] and AlexNet [142]) and a multilayer perceptron (MLP) (a class of the feed-forward neural network) [143]. The overall testing performance of their intial DeepVGI results, compared with Deep-OSM and MapSwipe, demonstrated that DeepVGI’s performance (in particular, F1 score and accuracy) is significantly better than DeepOSM, but less good than the MapSwipe volunteers (each image is voted on by three volunteers). Training neural networks with OpenStreetMap (OSM) data, DeepOSM can make predictions of mis-registered roads in OSM data by classifying roads and features from satellite imagery [144]. The DL architecture DeepOSM used is a simple one layer CNN. MapSwipe is a crowd-sourcing mobile application that allows volunteers to label images with buildings or roads.
Almost all reported methods applying DL in RS, shared the motivation that getting labeled data for RS imagery is challenging. Thus, AL/ADL, will help clear some hurdles in the process of empowering RS research with DL.
5. Challenges and Research Opportunities
In this section, we first provide a brief summary and discussion of key themes and overall insights (Section 5.1) derived from reviewing the range of research discussed above. Then, in Section 5.2, we discuss some challenges and related research opportunities identified through this systematic review of existing work on AL, AL combined with VA and/or DL.
5.1. Summary and Discussion
After introducing the essential terms and types of classification tasks in M&DL (Appendix A), we reviewed (Section 3) recent and influential research for (geo) text and image classification in AL, VA, AL with VA, and ADL, as well as some recent work in GIScience and RS using AL and ADL.
As we discussed briefly in Appendix A.1, DL algorithms do not require feature engineering, and they also have much better scalability to discover intricate patterns hidden in big data. However, pure supervised DL is impractical in some situations, such as those for which the labeling tasks require domain knowledge from experts, since there are only a few domain experts with time and willingness to label (geo) text or images for training. There is clear evidence in the research reviewed (Section 3) that an AL-enabled DL approach that uses VA methods to iteratively collect modest amounts of input from domain experts and uses that input to refine the DL classifiers will be productive.
While the work investigated in Section 3 has demonstrated the power of AL, AL with VA, and ADL, very few studies thus far combine the power of VA with ADL for (geo) text and image classification. Also, most existing research on AL is focused on single-label classification (Appendix A.4.3), and with substantially less attention to multi-label or hierarchical classification (Appendix A.4.3 and Appendix A.4.4). However, many real world applications require multi-label and/or hierarchical classification. For example, consider an image that contains a major highway as well as a park. In this case, the image should be tagged as two categories, instead of one. Similarly, for a piece of text that talks about both a hurricane and flooding, we cannot simply group it into a single category of natural disaster when we need to make decisions on both wind and water risks, respectively.
5.2. Challenges and Research Opportunities
Among many challenges and thus opportunities, below we provide some major ones we identified through our systematic investigation. We group the challenges and opportunities into two sets: technical (Section 5.2.1) and application (Section 5.2.2).
5.2.1. Technical Challenges and Opportunities
Below we list some main technical challenges and opportunites, from classifier and AL problem scenarios related, to VA and AL/ADL integration.
- Multi-label classification: Most existing multi-label classification research has been based on simple ML models (such as logistic regression [68,87], naive Bayes [68,87,145], and SVM [7,68,83,146]); but, very few on DL architectures, such as CNNs and RNNs. We need to extend the traditional ML models to DL ones for Big Data problems, because as we emphasized in Appendix A.1, DL algorithms have better scalability than traditional ML algorithms [116]. Wang et al. [147] and Chen et al. [148] have developed a CNN-RNN framework and an order-free RNN for multi-label classification for image data sets, respectively, whereas few DL based multi-label classification methods for text data have been proposed.
- Hierarchical classification: As Silla et al. [149] pointed out in their survey about hierarchical classification (Appendix A.4.4) across different application domains, flat classification (Appendix A.4.4) has received much more attention in areas such as data mining and ML. However, many important real-world classification problems are naturally cast as hierarchical classification problems, where the classes to be predicted are organized into a class hierarchy (e.g., for geospatial problems, feature type classification provides a good example)—typically a tree or a directed acyclic graph (DAG). Hierarchical classification algorithms, which utilize the hierarchical relationships between labels in making predictions, can often achieve better prediction performance than flat approaches [150,151]. Thus, there is a clear research challenge to develop new approaches that are flexible enough to handle hierarchical classification tasks, in particular, the integration of hierarchical classification with single-label classification and with multi-label classification (i.e., HSC and HMC), respectively.
- Stream-based selective sampling AL: As introduced in Section 3.1.2 and discussed in [26,56], most AL methods in the literature use a pool-based sampling scenario; only a few methods have been developed for data streams. The stream-based approach is more appropriate for some real world scenarios, for example, when memory or processing power is limited (mobile and embedded devices) [26], crisis management during disaster leveraging social media data streams, or monitoring distributed sensor networks to identify categories of events that pose risks to people or the environment. To address the challenges of the rapidly increasing availability of geospatial streaming data, a key challenge is to develop more effective AL methods and applications using a stream-based AL scenario.
- Intergration of different AL problem scenarios: As introduced in Section 3.1.2, among the three main AL problem scenarios, pool-based sampling has received substantial development. But, there is a potential to combine scenarios to take advantage of their respective strengths (e.g., use of real instances that humans are able to annotate for the pool-based sampling and efficiency of membership query synthesis). In early work in this direction, Hu et al. [152] and Wang et al. [49] have combined membership query synthesis and pool-based sampling scenarios. The conclusion, based on their experiments on several real-world data sets, showed the strength of the combination against pool-based uncertainty sampling methods in terms of time complexity. More query strategies (Section 3.1.5) and M&DL architectures need to be tested to demonstrate the robustness of the improvement of the combination.
- Intergration of VA with AL/ADL: As Biewald explained in [14], human-in-the-loop computing is the future of ML. Biewald emphasized that it is often very easy to get a ML algorithm to 80% accuracy whereas almost impossible to get an algorithm to 99%; the best ML models let humans handle that 20%, because 80% accuracy is not good enough for most real world applications. To integrate human-in-the-loop methodology into ML architectures, AL is the most successful “bridge” [11,13,56,65,115], and VA can further enhance and ease the human’s role in the human-machine computing loop [4,5,11,24,25]. Intergrating the strengths of AL (especially ADL) and VA will raise the effectiveness and efficiency to new levels (Section 3.1, Section 3.2, Section 3.3 and Section 3.4). Bernard et al. [11] provided solid evidence to support this thread of research (Section 3.3).
5.2.2. Challenges and Opportunities from Application Perspective (for GIScience and RS Audience)
As Raad emphasized in [153], “When data volume swells beyond a human’s ability to discern the patterns in it … GIS, infused with artificial intelligence, can help executives make better decisions”, we share the same vision that GIScience researchers need to bring M&DL into our community, and start to build GeoAI.
Early achievements in M&DL have thus far been greater for image data than for text [154,155] (the main reasons are discussed in [156]). A major reason is the availability of big image repositories, such as ImageNet [157], that support such work for benchmarking. For example, well-known pre-trained CNN models (i.e., ConvNets)—AlexNet [142], VGG ConvNets [158], and GoogLeNet [159])—are trained on the ImageNet [157]. Although substantial progress has been made in applying M&DL to image-based tasks, a range of challenges remain in RS and other geospatial image domains. One key challenge is related to leveraging image data collected by the increasing variety of drone-mounted sensors. Drones can easily get a big set of image data, for example, in disaster management applications. In this context, DL has already been applied to building extraction in disaster situations [160], as well as avalanche support focused on finding victims [161]. Moving beyond “traditional” uses of supervised DL with image classification, one challenge is to develop interactive web apps that combine AL/ADL and VA to ask volunteers and domain experts to label a small set of data and then build a good classifier, which can help to quickly classify the images and then plot them on map. Doing so can help decision makers to get the big picture and generate insights in a quick and accurate manner. Such a system, of course, will require substantial testing to be usable in domains where life and property are at risk, but it is that risk that should drive research toward this objective.
While M&DL for image classification has a longer history [154,155], success in handling NLP tasks, such as language modeling and sentiment analysis [6,162], is catching up. As Knight [156] emphasizes, it is hard to envision how we will collaborate with AI machines without machines understanding our language, since language is the most powerful way we make sense of the world and interact with it.
These advances in text processing are particularly important since massive amounts of unstructured text are generated each day; based on industry estimates, as much as 80% of data generated by be unstructured [163]. Estimates suggest that at least 60% of that unstructured text contains geospatial references [164]. These unstructured data signify and give meaning to geospatial information through natural language. However, GIScience has paid limited attention to unstructured data sources. An important step in moving from the unstructured text to meaningful information is to classify the text into categories relevant to target tasks (i.e., text classification, Appendix A.5).
In Section 4, we have seen some successful applications using AL and ADL in the GIScience and RS fields. Even though most of these are based on RS imagery, with some on GPS trajectories, and only a few focus on geospatial text data, as outlined in the review above, advances in M&DL are rapidly being extending into a wide array of other domains, including to address NLP and other text related challenges.
Related to these image and NLP processing advances in M&DL, there are multiple GIScience and RS problems, such as geographic information retrieval (GIR), geospatial semantics, and geolocalization, to which VA, AL, and ADL based strategies can be applied productively. We highlight just a few of these below.
- Geospatial image based applications: Based on the advances achieved in M&DL, many promising geospaital applications using big geospatial image data sets are becoming possible. Diverse GIScience and RS problems can benefit from the methods we reviewed in this paper, potential applications include: land use and land cover classification [165,166], identification and understanding of patterns and interests in urban environments [167,168], and geospatial scene understanding [169,170] and content-based image retrieval [136,171]. Another important research direction is image geolocalization (prediction of the geolocation of a query image [172]), see [173] for an example of DL based geolocalization using geo-tagged images, which did not touch on AL or VA.
- Geospatial text based applications: GIR and spatial language processing have potential application to social media mining [174] in domains such as emergency management. There have already been some successful examples of DL classification algorithms being applied to tackling GIScience problems relating to crisis management, sentiment analysis, sarcasm detection, and hate speech detection in tweets; see: [162,175,176,177,178].A review of the existing geospatial semantic research can be found in [179], but neither DL or AL, nor VA are touched upon in that review. Thus, the research topics and challenges discussed there can find potential solutions using the methods we have investigated in this paper. For example, the methods we investigated here will be useful for semantic similarity and word-sense disambiguation, which are the important components of GIR [180]. Through integrating GIR with VA, AL and/or ADL, domain experts can play an important role into the DL empowered computational loop for steering the improvement of the machine learner’s performance. Recently, Adams and McKenzie [181] used character-level CNN to classify multilingual text, and their method can be improved using the “tool sets” we investigated in this paper. Some specific application problems for which we believe that VA-enabled ADL has the potential to make a dramatic impact are: identification of documents (from tweets, through news stories, to blogs) that are “about” places; classification of geographic statements by scale; and retrieval of geographic statements about movement or events.
- Geospatial text and image based applications: Beyond efforts to apply AL and related methods to text alone, text-oriented applications can be expanded with the fusion of text and geospatial images (e.g., RS imagery). See Cervone et al. [182] for an example in which RS and social media data (specifically, tweets and Flickr images) are fused for damage assessment during floods. The integration of VA and AL/ADL should also be explored as a mechanism to generate actionable insights from heterogeneous data sources in a quick manner.Deep learning shines where big labeled data is available. Thus, existing research in digital gazetteer that used big data analytics (see [183] for an example, where neither DL or AL, nor VA was used) can also be advanced from the methods reviewed in this paper. More specifically, for example, the method used in [183]—place types from (Flickr) photo tags, can be extended and enriched by image classification and recognition from the geospatial image based applications mentioned above.
Overall, based on the review above, we contend that GeoAI, as implemented via M&DL methods empowered with VA, AL, and ADL, will have a wide array of geospatial applications and thus has considerable potential to address major scientific and societal challenges.
Acknowledgments
The authors are grateful to NVIDIA for awarding one Titan X Pascal GPU to support this work. This work was supported in part by Penn State ICS Seed Grant. The authors are also grateful to Guido Cervone for useful discussions relating to Remote Sensing, and to the reviewers for their useful suggestions.
Author Contributions
All authors have contributed to this review paper. L.Y. had the biggest role of initiating the review, taking the lead on identifying relevant literature, writing and organization, and coordinating input from other authors. A.M.M. provided input on overall organization of the paper, identified selected research to include in the review, contributed to writing and editing the text. P.M. and T.O. both have contributed to editing and P.M. also contributed to identifying some of the research sub-domains to integrate through our regular group meetings for ICS Seed Grant project. All authors have revised the manuscript.
Conflicts of Interest
The authors declare no conflict of interest.
Abbreviations
The following abbreviations are used in this manuscript:
| VA | Visual Analytics |
| AL | Active Learning |
| ADL | Active Deep Learning |
| AI | Artificial Intelligence |
| ML | Machine Learning |
| DL | Deep Learning |
| M&DL | Machine Learning and Deep Learning |
| GIScience | Geographical Information Science |
| RS | Remote Sensing |
| VIL | Visual-Interactive Labeling |
| CNN | Convolutional Neural Network |
| RNN | Recurrent Neural Network |
| LSTM | Long Short-Term Memory |
| GRU | Gated Recurrent Unit |
| RBM | Restricted Boltzmann Machines |
| DBN | Deep Belief Network |
| MLP | MultiLayer Perceptron |
| SVM | Support Vector Machine |
| EM | Expectation–Maximization |
| KL divergence | Kullback-Leibler divergence |
| DAG | Directed Acyclic Graph |
| NLP | Natural Language Processing |
| NER | Named Entity Recognition |
| GIR | Geographic Information Retrieval |
| VGI | Volunteered Geographic Information |
| OSM | OpenStreetMap |
| QBC | Query-By-Committee |
| OVA/OAA/OVR | One-Vs-All / One-Against-All / One-Vs-Rest |
| OVO/OAO | One-Vs-One / One-Against-One |
| KNN | K-Nearest Neighbors |
| PCA | Principal Component Analysis |
| HMC | Hierarchical Multi-label Classification |
| HSC | Hierarchical Single-label Classification |
| IEEE VAST | The IEEE Conference on Visual Analytics Science and Technology |
Appendix A. Essential Terms and Types of Classification Tasks
In this appendix, we introduce some essential terms in M&DL that are fundamental to understanding the main survey provided in Section 3.
Appendix A.1. Machine Learning and Deep Learning
Machine learning (ML) [143,184] is a sub-field of computer science, in particular, artificial Intelligence (AI), that focuses on algorithms for learning from data. Traditional ML relies on feature engineering, the process of using domain-specific prior knowledge to manually extract features from data [43,185,186]. The features are then used to generate a ML model, which can make predictions for new unseen data. In both ML and pattern recognition, a feature (sometimes also called signal) [143] is an individual measurable attribute/property or characteristic of a phenomenon being observed. Features encode information from raw data that allows ML algorithms to predict the category of an unknown object (e.g., a piece of text or an image) or a value (e.g., stock price) [187]. Thus, any attribute that improves the ML algorithm’s performance can serve as a feature.
Deep learning (DL, i.e., deep neural nets) is a subset of ML, where ML is a subset of AI (see [188] for a detailed introduction to the relations among the three domains of research and practice). DL can discover intricate hidden patterns from big data without feature engineering [154]. Feature engineering is a core, human labor intensive technique for traditional ML [43,186,187], and the potential to skip this often expensive step is one motivation for recent attention to DL. Furthermore, DL algorithm performance improves dramatically when data volume increases [116]—thus, DL algorithms have better scalability than traditional ML algorithms for Big Data problems.
The expensive process of feature engineering is skipped for DL, because DL can automatically learn features from data, but it must be replaced by much larger labeled data sets that can be as time consuming to create as the process of feature engineering. While data set labeling is easier than discovering the underlying features that generalize the category it belongs to, the volume of data needed is the bottleneck for DL. This is why we need active deep learning (Section 3), to reduce the amount of data that must be labeled.
Appendix A.2. Types of Learning Methods
There are three major types of learning methods in ML (and DL, since DL is a branch of ML) [189,190]: supervised learning, unsupervised learning, and semi-supervised learning.
Appendix A.2.1. Supervised Learning
Supervised learning [191] is the ML task of inferring a function from labeled training data. In supervised learning, the data instances are labeled by human annotators or experts in a problem domain [192]. Labeling refers to the process of annotating each piece of text or image with one of a pre-defined set of class names. ML methods can use this information to learn a model that can infer the knowledge needed to automatically label new (i.e., never seen before) data instances.
Supervised ML methods usually divide the data set into two (i.e., training and test) or three (i.e., training, validation, and test) disjoint subsets. The labels of instances in the test set will not be given to the ML algorithm, but will only be used to evaluate its performance. The main idea of supervised learning is to build a ML model (e.g., a classifier for classification tasks, or a regression model for regression tasks) using the training data set and using the testing data set to validate the model’s performance. With supervised learning there are several metrics to measure success. These metrics can be used to judge the adequacy of a method in particular situations and to compare the effectiveness of different methods over various situations [189].
Appendix A.2.2. Unsupervised Learning
Unsupervised learning [189] is the ML task of inferring a function to describe hidden structure from “unlabeled” data (i.e., without human annotation). Since the examples given to the learner are unlabeled, expert knowledge is not a foundation of the learning and there is no evaluation of the accuracy of the structure learned by the relevant algorithm. A clustering algorithm called k-means and another algorithm called principal component analysis (PCA) [189] are popular unsupervised ML algorithms, among others.
Appendix A.2.3. Semi-Supervised Learning
Semi-supervised learning [193,194] is a learning paradigm concerned with the study of how computers and humans learn using both labeled and unlabeled data. One goal of research in semi-supervised learning is to understand how combining labeled and unlabeled data may change the learning behavior, and design algorithms that take advantage of such a combination. A survey focusing on semi-supervised learning for classification can be found in [194]. In the survey, Zhu emphasized that there are some similarities between ML and human learning. Understanding human cognitive model(s) can lead to novel ML approaches [195,196]. Do humans learn in a semi-supervised manner? The answer is “yes”. Humans accumulate “unlabeled” input data, which (often unconsciously) are used to help build the connection between “labels” and input once labeled data is provided [194].
As emphasized in Section 1, labeled data sets are often difficult, expensive, and/or time consuming to obtain, as they require the efforts of experienced human annotators or domain experts. Semi-supervised learning addresses this problem by using a large amount of unlabeled data, together with a relatively small amount of labeled data, to build good classifiers (Appendix A.3). Semi-supervised learning has received considerable attention both in theory and in practice in ML and data mining because it requires less human effort and gives higher accuracy than supervised methods [194].
Appendix A.2.4. Brief Discussion of Learning Types
When a data set contains both labeled and unlabeled samples, ML methods can combine techniques from the two previous categories (i.e., supervised and unsupervised) to accomplish semi-supervised learning tasks [193]. Labeled data instances can be used to induce a model, as in supervised learning, then the model can be refined with the information from unlabeled samples. Analogously, unsupervised tasks can be improved by introducing the clues given by the labeled instances. Active learning (Section 3.1) is semi-supervised learning, and most DL algorithms (e.g., CNN, RNN, and LSTM) belong to supervised learning.
In this paper, we focus on M&DL for classification (where the output of the process is categorical/discrete). Supervised/semi-supervised ML is also used for regression tasks (where the output of the process is continuous). The application of regression is beyond the scope of this paper; interested readers can find recent overviews in [194,197,198,199,200].
Appendix A.3. Classifier
A ML algorithm that implements a type of classification task (Appendix A.4) is known as a classifier. The most popular ML algorithms for classification problems are: logistic regression, naive Bayes, and support vector machine (SVM). The convolutional neural network (CNN), recurrent neural network (RNN), and two variants of RNN—long short-term memory (LSTM) and gated recurrent unit (GRU), are among most commonly used DL algorithms (also called architectures) for classification problems.
Appendix A.4. Types of Classification Tasks
Classification in M&DL is a predictive task, which aims to learn from existing labeled data and predict the label for new data [201]. The labels representing classes or categories are finite and discrete (otherwise the task would be regression, instead of classification) [202]. In supervised/semi-supervised ML (Appendix A.2.1 and Appendix A.2.3), classification tasks include the following types [190,203]: binary, multi-class, multi-label, and hierarchical classifications. See Figure A1 for an example of each type of classification task, each of which is elaborated in the following subsections (Appendix A.4.1, Appendix A.4.2, Appendix A.4.3 and Appendix A.4.4). Appendix A.4.5 briefly introduces the evaluation metrics of classification tasks.
Figure A1.
An illustration of classification tasks in machine learning.

Appendix A.4.1. Binary Classification
Binary classification is the simplest and most commonly implemented type of classification algorithm. It classifies the instances of a given data set into two mutually exclusive classes, where each class has an associated label. One widespread classification application of binary text classification is spam filtering, where emails are classified into two categories: spam and non-spam; another binary classification example is sentiment analysis (i.e., positive or negative).
Appendix A.4.2. Multi-Class Classification
Similar to binary classification, multi-class classification is one of the most commonly implemented supervised/semi-supervised learning tasks (Appendix A.2.1 and Appendix A.2.3) [191]. Multi-class classification (also called multiclass classification or multinomial classification) [191] refers to the task of classifying instances into one and only one of a set of (more than two) pre-defined and mutually exclusive classes [190] (e.g., adding a “neutral” class to the “positive” and “negative” in sentiment analysis). Multi-class classification can be seen as a generalization of binary classification (Appendix A.4.1).
Many multi-class classification algorithms rely on binarization [202], a method that iteratively trains a binary classifier for each class against the others, following a one-vs-all (OVA) (also called one-against-all (OAA) or one-vs-rest (OVR)) approach, or for each pair of classes, using an one-vs-one (OVO) (also called one-against-one (OAO)) technique [143]. A comparison between OAO and OAA can be found in [204] for handwriting recognition with SVMs.
Appendix A.4.3. Multi-Label Classification
Both binary and multi-class classifications are “single-label” methods (thus, binary/multi-class classifications is also called single-label classification in the literature [205]), where each instance is only associated with a single class label (see Figure A1a,b for an illustration). By contrast, multi-label classification (also multilabel classification) produces a labeled data set where each instance is associated with a vector of output values [190,206,207,208,209], instead of only one value. The length of this vector is fixed according to the number of different, pre-defined, and not mutually exclusive labels in the data set. Each element of the vector will be a binary value, indicating if the corresponding label is true for the sample or not. Several labels can be active simultaneously. Each distinct combination of labels is known as a labelset [190]. Figure A1c provides one of the most common multi-label applications, image labeling. The data set has four labels in total and each image can be assigned any of them, or even all at once if there was an image in which the four concepts, corresponding to the labels, appear.
Multi-label classification has its roots as a solution for tagging documents with several but not mutually exclusive categories (e.g., a piece of text might be about any of: religion, politics, finance, and education at the same time or none of these). Multi-label classification is currently applied in many fields, most of them related to automatic labeling of social media resources such as images, music, video, news, and blog posts [190].
Appendix A.4.4. Hierarchical Classification
Hierarchical classification, as the name implies, differs from the three types discussed above (Appendix A.4.1, Appendix A.4.2 and Appendix A.4.3), which all consider each class to be at the same level, called flat classification (flat here means non-hierarchical [150]). For hierarchical classification, classes are defined at multiple levels and are organized in hierarchies [210], as illustrated in Figure A1d. The hierarchy is predefined and cannot be changed during classification. The categories are partially ordered, usually from more generic to more specific [150]. In hierarchical classification, the output labels reside on a tree or directed acyclic graph (DAG) structured hierarchy [151,211,212]. Silla and Freitas [149] provide a survey of hierarchical classification across different application domains.
Many ML classification algorithms are flat, where they simply ignore the label structure and treat the labels as a loose set. By contrast, hierarchical classification algorithms, utilize the hierarchical relationships between labels in making predictions; they can often predict better than flat approaches [150,151]. Ghazi et al. [150] explored text classification based on emotions expressed in the text. Their method organized neutrality, polarity, and emotions hierarchically. The authors tested their method on two datasets and showed that their method outperforms the corresponding “flat” approach. However, Sapozhnikov and Ulanov [213] pointed out in some cases, classification performance cannot be enhanced using a hierarchy of labels. Some authors [214] showed that flat classification outperforms a hierarchical one in the presence of a large number of labels (See later in this section for a further discussion about a systematic comparison between hierarchical and flat classifications).
Hierarchical classification combined with single-label classification (Appendix A.4.3) are called hierarchical single-label classification (HSC) in the literature [205]. Vailaya et al. [215] provided an early example of hierarchical classification combined with binary classification (Appendix A.4.1). The authors employed binary Bayesian classifiers to perform hierarchical classification of vacation images. The results of their experiments showed that high-level concepts can be detected from images if each image can be correctly classified into pre-defined categories. Hierarchical classification has also been integrated with multi-class classification (Appendix A.4.2), see [216,217] for examples. Kowsari et al. [217] presented a new approach to hierarchical multi-class text classification, where the authors employed stacks of DL architectures to provide specialized understanding at each level of the text (document) hierarchy. Their experiment ran on a data set of documents from the Web of Science, and the authors employed a hierarchy of two levels: level-1 (they also called it parent-level) contains classes such as “Computer Science” and “Medical Sciences”, and at level-2 (they also called this child-level) the parent level “Computer science” has sub-classes such as “Computer Graphics” and “Machine Learning”. Their results showed that combinations of RNN at the higher level (i.e., level-1 or parent-level in their experiment) and CNN at the lower level (i.e., level-2 or child-level) achieve much better and more consistent performance than those obtained by conventional approaches using naive Bayes or SVM. Their results also showed that DL methods can improve document classification performance and that they can provide extensions to methods that only considered the multi-class problem and thus can classify documents within a hierarchy with better performance.
Hierarchical classification has been integrated with multi-label classification (Appendix A.4.3), called hierarchical multi-label classification (HMC) in the literature [205,218]. HMC is a variant of classification where the pre-defined classes are organized in a hierarchy and each instance may belong to multiple classes simultaneously [205,211]. Ren et al. [218] conducted extensive experiments on a large real-world data set and their results showed the effectiveness of their method for HMC of social text streams.
HMC has received attention, because many real world classification scenarios are multi-label classification and the labels are normally hierarchical in nature. But, research has not yet established when it is proper to consider such relationships (hierarchical and multi-label) among classes, and when this presents an unnecessary burden for classification methods. To address this problem, Levatic et al. [205] conducted a comparative study over 8 data sets that have HMC properties. The authors investigated two important influences in HMC: multiple labels per example and information about the hierarchy. Specifically, Levatic et al. considered four ML classification tasks: multi-label classification (Appendix A.4.3), HMC, single-label classification (Appendix A.4.3), and HSC. The authors concluded that the inclusion of hierarchical information in the model construction phase for single trees improves the predictive performance—whether they used HMC trees or HSC tree architecture. HMC trees should be used on domains with a well-populated class hierarchy (), while the HSC tree architecture performs better if the number of labels per example is closer to one.
Appendix A.4.5. Evaluation Metrics for Classification Tasks
Different types of classification tasks need different evaluation metrics. Sokolova and Lapalme [203] systematically analyzed and summarized twenty-four performance measures used in ML classification tasks (i.e., binary, multi-class, multi-label, and hierarchical) in tables (with formula and concise descriptions of evaluation focus). Their formal analysis was supported by examples of applications where invariance properties of measures lead to a more reliable evaluation of classifiers (Appendix A.3).
Appendix A.5. Text and Image Classifications
Text classification and image classification are two important applications of classification tasks in ML (Appendix A.4). Image classification is the task of classifying images to pre-defined class names (i.e., labels). Image classification can be applied to many real-world problems, for example, retrieval of all images that contain (damaged) roads. A survey of multimedia (i.e., images and videos) annotation and retrieval using active learning (Section 3.1) can be found in [30]. A review on deep learning algorithms in computer vision for tasks, such as image classification and image retrieval, can be found in [219].
Text classification (also called text categorization), analogous to image classification, is the task of classifying text to pre-defined categories. Text classification in ML is a fundamental step in making large repositories of unstructured text searchable and has important applications in the real world [108,176,217]. For example, automatically tagging social media messages during natural disasters by topics can facilitate information retrieval for crisis management [220]. Text classification is also closely related to standard natural language processing (NLP) problems such as named entity recognition (NER), in which words are classified into: person, location, organization, etc. Some of the best methods to accomplish this task are ML based (e.g., Stanford NER [221,222]). A comprehensive review of text classification methods and results can be found in [223], including evaluation of text classifiers, particularly measures of text categorization effectiveness. Significance tests in the evaluation of text classification methods can be found in [224].
Appendix A.6. Word Embedding
We have introduced text and image classifications above (Appendix A.5). When using DL algorithms for text classification and image classification, one of the big technical differences is that images have matrix representations and thus can be directly fed into deep neural nets. But, for text data, translation into word embeddings is needed. In NLP and DL, a word embedding is basically vectors of real numbers mapped from words or phrases from the vocabulary to represent semantic/syntactic information of words in a way that computers can understand. Once word embeddings have been trained, we can use them to obtain relations such as similarities between words.
Word2Vec [225,226] and GloVe (Global Vectors for word representation) [227] are two popular word embedding algorithms used to construct vector representations for words. Word2Vec “vectorizes” words—it is a two-layer neural network that processes text. Its input is a text corpus and its output is a vocabulary in which each item has a vector attached to it, which can be fed into a deep neural net or simply queried to detect relationships between words. While Word2vec is not a deep neural network, it turns text into a numerical form that deep nets can understand. So we can start with powerful mathematical operations on words to detect semantic similarities between words. Similar to Word2Vec, GloVe is an unsupervised learning algorithm (Appendix A.2.2) used to compute vector representations for words. Training is performed on aggregated global word-word co-occurrence statistics from a input corpus, and the resulting representations showcase linear substructures of the word vector space. The main difference between Word2Vec and GloVe is that the former is a “predictive” model, whereas the latter is a “count-based” model [228]. If we can control well all the hyper-parameters of Word2Vec and GloVe, the embeddings generated using the two methods are very similarly in NLP tasks. One advantage of GloVe over Word2Vec is that it is easier to parallelize the implementation [227], which means it is easier to train over a big volume of data on GPUs for parallelism.
References
- Abadi, M.; Agarwal, A.; Barham, P.; Brevdo, E.; Chen, Z.; Citro, C.; Corrado, G.S.; Davis, A.; Dean, J.; Devin, M.; et al. Tensorflow: Large-scale machine learning on heterogeneous distributed systems. arXiv, 2016; arXiv:1603.04467. [Google Scholar]
- Domingos, P. The Master Algorithm: How the Quest for the Ultimate Learning Machine Will Remake Our World; Basic Books: New York, NY, USA, 2015. [Google Scholar]
- Karpathy, A.; Johnson, J.; Fei-Fei, L. Visualizing and understanding recurrent networks. arXiv, 2015; arXiv:1506.02078. [Google Scholar]
- Sacha, D.; Sedlmair, M.; Zhang, L.; Lee, J.A.; Weiskopf, D.; North, S.; Keim, D. Human-centered machine learning through interactive visualization: Review and Open Challenges. In Proceedings of the ESANN 2016 Proceedings, European Symposium on Artificial Neural Networks, Computational Intelligence and Machine Learning, Bruges, Belgium, 27–29 April 2016. [Google Scholar]
- Liu, S.; Wang, X.; Liu, M.; Zhu, J. Towards better analysis of machine learning models: A visual analytics perspective. Vis. Inf. 2017, 1, 48–56. [Google Scholar] [CrossRef]
- Ming, Y.; Cao, S.; Zhang, R.; Li, Z.; Chen, Y.; Song, Y.; Qu, H. Understanding Hidden Memories of Recurrent Neural Networks. arXiv, 2017; arXiv:1710.10777. [Google Scholar]
- Tuia, D.; Volpi, M.; Copa, L.; Kanevski, M.; Munoz-Mari, J. A survey of active learning algorithms for supervised remote sensing image classification. IEEE J. Sel. Top. Signal Process. 2011, 5, 606–617. [Google Scholar] [CrossRef]
- Nalisnik, M.; Gutman, D.A.; Kong, J.; Cooper, L.A. An interactive learning framework for scalable classification of pathology images. In Proceedings of the 2015 IEEE International Conference on Big Data (Big Data), Santa Clara, CA, USA, 29 October–1 November 2015; pp. 928–935. [Google Scholar]
- Sharma, M.; Zhuang, D.; Bilgic, M. Active learning with rationales for text classification. In Proceedings of the 2015 Conference of the North American Chapter of the Association for Computational Linguistics: Human Language Technologies, Denver, CO, USA, 31 May–5 June 2015; pp. 441–451. [Google Scholar]
- Holzinger, A. Interactive machine learning for health informatics: When do we need the human-in-the-loop? Brain Inf. 2016, 3, 119–131. [Google Scholar] [CrossRef] [PubMed]
- Bernard, J.; Hutter, M.; Zeppelzauer, M.; Fellner, D.; Sedlmair, M. Comparing Visual-Interactive Labeling with Active Learning: An Experimental Study. IEEE Trans. Vis. Comput. Graph. 2018, 24, 298–308. [Google Scholar] [CrossRef] [PubMed]
- Zhu, X.X.; Tuia, D.; Mou, L.; Xia, G.S.; Zhang, L.; Xu, F.; Fraundorfer, F. Deep learning in remote sensing: A review. arXiv, 2017; arXiv:1710.03959. [Google Scholar]
- Kucher, K.; Paradis, C.; Sahlgren, M.; Kerren, A. Active Learning and Visual Analytics for Stance Classification with ALVA. ACM Trans. Interact. Intell. Syst. 2017, 7, 14. [Google Scholar] [CrossRef]
- Biewald, L. Why Human-in-the-Loop Computing Is the Future of Machine Learning. 2015. Available online: https://www.computerworld.com/article/3004013/robotics/why-human-in-the-loop-computing-is-the-future-of-machine-learning.html (accessed on 10 November 2017).
- Bernard, J.; Zeppelzauer, M.; Sedlmair, M.; Aigner, W. A Unified Process for Visual-Interactive Labeling. In Proceedings of the 8th International EuroVis Workshop on Visual Analytics (Eurographics Proceedings), Barcelona, Spain, 12–13 June 2017. [Google Scholar]
- Andrienko, G.; Andrienko, N.; Keim, D.; MacEachren, A.M.; Wrobel, S. Challenging problems of geospatial visual analytics. J. Vis. Lang. Comput. 2011, 22, 251–256. [Google Scholar] [CrossRef]
- Wang, D.; Shang, Y. A new active labeling method for deep learning. In Proceedings of the 2014 International Joint Conference on Neural Networks (IJCNN), Beijing, China, 6–11 July 2014; pp. 112–119. [Google Scholar]
- Huang, L.; Matwin, S.; de Carvalho, E.J.; Minghim, R. Active Learning with Visualization for Text Data. In Proceedings of the 2017 ACM Workshop on Exploratory Search and Interactive Data Analytics, Limassol, Cyprus, 13 March 2017; pp. 69–74. [Google Scholar]
- Han, J.; Miller, H.J. Geographic Data Mining and Knowledge Discovery; CRC Press: Boca Raton, FL, USA, 2001. [Google Scholar]
- Miller, H.J.; Han, J. Geographic Data Mining and Knowledge Discovery, 2nd ed.; CRC Press: Boca Raton, FL, USA, 2009. [Google Scholar]
- Han, J.; Pei, J.; Kamber, M. Data Mining: Concepts and Techniques; Elsevier: Amsterdam, The Netherlands, 2011. [Google Scholar]
- Keim, D.A.; Kriegel, H.P. Visualization techniques for mining large databases: A comparison. IEEE Trans. Knowl. Data Eng. 1996, 8, 923–938. [Google Scholar] [CrossRef]
- MacEachren, A.M.; Wachowicz, M.; Edsall, R.; Haug, D.; Masters, R. Constructing knowledge from multivariate spatiotemporal data: integrating geographical visualization with knowledge discovery in database methods. Int. J. Geogr. Inf. Sci. 1999, 13, 311–334. [Google Scholar] [CrossRef]
- Guo, D.; Mennis, J. Spatial data mining and geographic knowledge discovery—An introduction. Comput. Environ. Urban Syst. 2009, 33, 403–408. [Google Scholar]
- Fayyad, U.M.; Wierse, A.; Grinstein, G.G. Information vIsualization in Data Mining and Knowledge Discovery; Morgan Kaufmann: San Francisco, CA, USA, 2002. [Google Scholar]
- Settles, B. Active Learning Literature Survey; Computer Sciences Technical Report 1648; University of Wisconsin: Madison, WI, USA, 2010. [Google Scholar]
- Settles, B. Active learning. Synth. Lect. Artif. Intell. Mach. Learn. 2012, 6, 1–114. [Google Scholar] [CrossRef]
- Settles, B. From theories to queries: Active learning in practice. In Proceedings of the Active Learning and Experimental Design Workshop In Conjunction with AISTATS 2010, Sardinia, Italy, 16 May 2011; pp. 1–18. [Google Scholar]
- Olsson, F. A Literature Survey of Active Machine Learning in the Context of Natural Language Processing; Swedish Institute of Computer Science: Kista, Sweden, 2009. [Google Scholar]
- Wang, M.; Hua, X.S. Active learning in multimedia annotation and retrieval: A survey. ACM Trans. Intell. Syst. Technol. 2011, 2, 10. [Google Scholar] [CrossRef]
- Muslea, I.; Minton, S.; Knoblock, C. Selective sampling with naive cotesting: Preliminary results. In Proceedings of the ECAI 2000 Workshop on Machine Learning for Information Extraction, Berlin, Germany, 21 August 2000. [Google Scholar]
- Peltola, T.; Soare, M.; Jacucci, G.; Kaski, S. Interactive Elicitation of Knowledge on Feature Relevance Improves Predictions in Small Data Sets. In Proceedings of the 22nd International Conference on Intelligent User Interfaces, Limassol, Cyprus, 13–16 March 2017. [Google Scholar]
- Xiao, T.; Xia, T.; Yang, Y.; Huang, C.; Wang, X. Learning from massive noisy labeled data for image classification. In Proceedings of the IEEE Conference on Computer Vision and Pattern Recognition, Boston, MA, USA, 7–12 June 2015; pp. 2691–2699. [Google Scholar]
- Turney, P.D. Types of cost in inductive concept learning. arXiv, 2002; arXiv:cs/0212034. [Google Scholar]
- Weiss, G.M.; Provost, F. Learning when training data are costly: The effect of class distribution on tree induction. J. Artif. Intell. Res. 2003, 19, 315–354. [Google Scholar]
- Kittur, A.; Chi, E.H.; Suh, B. Crowdsourcing user studies with Mechanical Turk. In Proceedings of the SIGCHI Conference on Human Factors in Computing Systems, Florence, Italy, 5–10 April 2008; pp. 453–456. [Google Scholar]
- Paolacci, G.; Chandler, J.; Ipeirotis, P.G. Running experiments on amazon mechanical turk. Judgm. Decis. Mak. 2010, 5, 411–419. [Google Scholar]
- Buhrmester, M.; Kwang, T.; Gosling, S.D. Amazon’s Mechanical Turk: A new source of inexpensive, yet high-quality, data? Perspect. Psychol. Sci. 2011, 6, 3–5. [Google Scholar] [CrossRef] [PubMed]
- Cohn, D.; Atlas, L.; Ladner, R. Improving generalization with active learning. Mach. Learn. 1994, 15, 201–221. [Google Scholar] [CrossRef]
- Zhao, L.; Sukthankar, G.; Sukthankar, R. Incremental relabeling for active learning with noisy crowdsourced annotations. In Proceedings of the 2011 IEEE Third International Conference on Privacy, Security, Risk and Trust (PASSAT) and 2011 IEEE Third Inernational Conference on Social Computing (SocialCom), Boston, MA, USA, 9–11 October 2011; pp. 728–733. [Google Scholar]
- Yan, Y.; Fung, G.M.; Rosales, R.; Dy, J.G. Active learning from crowds. In Proceedings of the 28th International Conference on Machine Learning (ICML-11), Bellevue, WA, USA, 28 June–2 July 2011; pp. 1161–1168. [Google Scholar]
- Joshi, A.J.; Porikli, F.; Papanikolopoulos, N. Multi-class active learning for image classification. In Proceedings of the IEEE Conference on Computer Vision and Pattern Recognition, Miami, FL, USA, 20–25 June 2009; pp. 2372–2379. [Google Scholar]
- Domingos, P. A few useful things to know about machine learning. Commun. ACM 2012, 55, 78–87. [Google Scholar] [CrossRef]
- Chen, W.; Fuge, M. Active Expansion Sampling for Learning Feasible Domains in an Unbounded Input Space. arXiv, 2017; arXiv:1708.07888. [Google Scholar]
- Angluin, D. Queries and concept learning. Mach. Learn. 1988, 2, 319–342. [Google Scholar] [CrossRef]
- Angluin, D. Queries revisited. In Algorithmic Learning Theory; Springer: Berlin/Heidelberg, Germany, 2001; pp. 12–31. [Google Scholar]
- King, R.D.; Whelan, K.E.; Jones, F.M.; Reiser, P.G.; Bryant, C.H.; Muggleton, S.H.; Kell, D.B.; Oliver, S.G. Functional genomic hypothesis generation and experimentation by a robot scientist. Nature 2004, 427, 247–252. [Google Scholar] [CrossRef] [PubMed]
- King, R.D.; Rowland, J.; Oliver, S.G.; Young, M.; Aubrey, W.; Byrne, E.; Liakata, M.; Markham, M.; Pir, P.; Soldatova, L.N.; et al. The automation of science. Science 2009, 324, 85–89. [Google Scholar] [CrossRef] [PubMed]
- Wang, L.; Hu, X.; Yuan, B.; Lu, J. Active learning via query synthesis and nearest neighbour search. Neurocomputing 2015, 147, 426–434. [Google Scholar] [CrossRef] [Green Version]
- Chen, L.; Hassani, S.H.; Karbasi, A. Near-Optimal Active Learning of Halfspaces via Query Synthesis in the Noisy Setting. AAAI, 2017; arXiv:1603.03515. [Google Scholar]
- Baum, E.B.; Lang, K. Query learning can work poorly when a human oracle is used. In Proceedings of the International Joint Conference on Neural Networks, Beijing, China, 3–6 November 1992; Volume 8, pp. 335–340. [Google Scholar]
- He, J. Analysis of Rare Categories; Springer Science & Business Media: Berlin/Heidelberg, Germany, 2012. [Google Scholar]
- Atlas, L.E.; Cohn, D.A.; Ladner, R.E. Training connectionist networks with queries and selective sampling. In Proceedings of the Advances in Neural Information Processing Systems, Denver, CO, USA, 26–29 November 1990; pp. 566–573. [Google Scholar]
- Dagan, I.; Engelson, S.P. Committee-based sampling for training probabilistic classifiers. In Proceedings of the Twelfth International Conference on Machine Learning, Tahoe City, CA, USA, 9–12 July 1995; pp. 150–157. [Google Scholar]
- Yu, H. SVM selective sampling for ranking with application to data retrieval. In Proceedings of the Eleventh ACM SIGKDD International Conference On Knowledge Discovery in Data Mining, Chicago, IL, USA, 21–24 August 2005; pp. 354–363. [Google Scholar]
- Pohl, D.; Bouchachia, A.; Hellwagner, H. Batch-based active learning: Application to social media data for crisis management. Expert Syst. Appl. 2018, 93, 232–244. [Google Scholar] [CrossRef]
- Fujii, A.; Tokunaga, T.; Inui, K.; Tanaka, H. Selective sampling for example-based word sense disambiguation. Comput. Linguist. 1998, 24, 573–597. [Google Scholar]
- Lewis, D.D.; Gale, W.A. A sequential algorithm for training text classifiers. In Proceedings of the 17th annual international ACM SIGIR Conference On Research and Development in Information Retrieval, Dublin, Ireland, 3–6 July 1994; pp. 3–12. [Google Scholar]
- Settles, B.; Craven, M. An analysis of active learning strategies for sequence labeling tasks. In Proceedings of the Conference on Empirical Methods in Natural Language Processing, Honolulu, HI, USA, 25–27 October 2008; pp. 1070–1079. [Google Scholar]
- Huang, S.J.; Jin, R.; Zhou, Z.H. Active learning by querying informative and representative examples. In Proceedings of the Advances in Neural Information Processing Systems, Vancouver, BC, Canada, 6–11 December 2010; pp. 892–900. [Google Scholar]
- Du, B.; Wang, Z.; Zhang, L.; Zhang, L.; Liu, W.; Shen, J.; Tao, D. Exploring representativeness and informativeness for active learning. IEEE Trans. Cybern. 2017, 47, 14–26. [Google Scholar] [CrossRef] [PubMed]
- Zhang, C.; Chen, T. An active learning framework for content-based information retrieval. IEEE Trans. Multimed. 2002, 4, 260–268. [Google Scholar] [CrossRef]
- Tur, G.; Hakkani-Tür, D.; Schapire, R.E. Combining active and semi-supervised learning for spoken language understanding. Speech Commun. 2005, 45, 171–186. [Google Scholar]
- Liu, Y. Active learning with support vector machine applied to gene expression data for cancer classification. J. Chem. Inf. Comput. Sci. 2004, 44, 1936–1941. [Google Scholar] [CrossRef] [PubMed]
- Júnior, A.S.; Renso, C.; Matwin, S. ANALYTiC: An Active Learning System for Trajectory Classification. IEEE Comput. Graph. Appl. 2017, 37, 28–39. [Google Scholar] [CrossRef] [PubMed]
- Hoi, S.C.; Jin, R.; Zhu, J.; Lyu, M.R. Batch mode active learning and its application to medical image classification. In Proceedings of the 23rd International Conference on Machine Learning, Pittsburgh, PA, USA, 25–29 June 2006; pp. 417–424. [Google Scholar]
- Hoi, S.C.; Jin, R.; Zhu, J.; Lyu, M.R. Semisupervised SVM batch mode active learning with applications to image retrieval. ACM Trans. Inf. Syst. 2009, 27, 16. [Google Scholar] [CrossRef]
- Sharma, M.; Bilgic, M. Evidence-based uncertainty sampling for active learning. Data Min. Knowl. Discov. 2017, 31, 164–202. [Google Scholar] [CrossRef]
- Freund, Y.; Seung, H.S.; Shamir, E.; Tishby, N. Selective sampling using the query by committee algorithm. Mach. Learn. 1997, 28, 133–168. [Google Scholar] [CrossRef]
- Seung, H.S.; Opper, M.; Sompolinsky, H. Query by committee. In Proceedings of the fIfth Annual Workshop on Computational Learning Theory, Pittsburgh, PA, USA, 27–29 July 1992; pp. 287–294. [Google Scholar]
- McCallumzy, A.K.; Nigamy, K. Employing EM and pool-based active learning for text classification. In Proceedings of the International Conference on Machine Learning (ICML), Madison, WI, USA, 24–27 July 1998; pp. 359–367. [Google Scholar]
- Kullback, S.; Leibler, R.A. On information and sufficiency. Ann. Math. Stat. 1951, 22, 79–86. [Google Scholar] [CrossRef]
- Pereira, F.; Tishby, N.; Lee, L. Distributional clustering of English words. In Proceedings of the 31st Annual Meeting on Association for Computational Linguistics, Columbus, OH, USA, 22–26 June 1993; pp. 183–190. [Google Scholar]
- Scheffer, T.; Decomain, C.; Wrobel, S. Active hidden markov models for information extraction. In International Symposium on Intelligent Data Analysis; Springer: Berlin/Heidelberg, Germany, 2001; pp. 309–318. [Google Scholar]
- Shannon, C.E. A mathematical theory of communication. ACM SIGMOBILE Mob. Comput. Commun. Rev. 2001, 5, 3–55. [Google Scholar] [CrossRef]
- Brinker, K. Incorporating diversity in active learning with support vector machines. In Proceedings of the 20th International Conference on Machine Learning (ICML-03), Washington, DC, USA, 21–24 August 2003; pp. 59–66. [Google Scholar]
- Dagli, C.K.; Rajaram, S.; Huang, T.S. Leveraging active learning for relevance feedback using an information theoretic diversity measure. Lect. Notes Comput. Sci. 2006, 4071, 123. [Google Scholar]
- Wu, Y.; Kozintsev, I.; Bouguet, J.Y.; Dulong, C. Sampling strategies for active learning in personal photo retrieval. In Proceedings of the 2006 IEEE International Conference on Multimedia and Expo, Toronto, ON, Canada, 9–12 July 2006; pp. 529–532. [Google Scholar]
- Nguyen, H.T.; Smeulders, A. Active learning using pre-clustering. In Proceedings of the twenty-first International Conference on Machine Learning, Banff, AB, Canada, 4–8 July 2004; p. 79. [Google Scholar]
- Qi, G.J.; Song, Y.; Hua, X.S.; Zhang, H.J.; Dai, L.R. Video annotation by active learning and cluster tuning. In Proceedings of the Computer Vision and Pattern Recognition Workshop, New York, NY, USA, 17–22 June 2006; p. 114. [Google Scholar]
- Ayache, S.; Quénot, G. Evaluation of active learning strategies for video indexing. Signal Process. Image Commun. 2007, 22, 692–704. [Google Scholar] [CrossRef]
- Seifert, C.; Granitzer, M. User-based active learning. In Proceedings of the 2010 IEEE International Conference on Data Mining Workshops (ICDMW), Sydney, Australia, 13 December 2010; pp. 418–425. [Google Scholar]
- Patra, S.; Bruzzone, L. A batch-mode active learning technique based on multiple uncertainty for SVM classifier. IEEE Geosci. Remote Sens. Lett. 2012, 9, 497–501. [Google Scholar] [CrossRef]
- Xu, Z.; Akella, R.; Zhang, Y. Incorporating diversity and density in active learning for relevance feedback. In ECiR; Springer: Berlin/Heidelberg, Germany, 2007; Volume 7, pp. 246–257. [Google Scholar]
- Wang, M.; Hua, X.S.; Mei, T.; Tang, J.; Qi, G.J.; Song, Y.; Dai, L.R. Interactive video annotation by multi-concept multi-modality active learning. Int. J. Semant. Comput. 2007, 1, 459–477. [Google Scholar] [CrossRef]
- Blake, C.L.; Merz, C.J. UCI Repository of Machine Learning Databases; University of California: Irvine, CA, USA, 1998. [Google Scholar]
- Ramirez-Loaiza, M.E.; Sharma, M.; Kumar, G.; Bilgic, M. Active learning: An empirical study of common baselines. Data Min. Knowl. Discov. 2017, 31, 287–313. [Google Scholar] [CrossRef]
- Cook, K.A.; Thomas, J.J. Illuminating The Path: The Research and Development Agenda for Visual Analytics; IEEE Computer Society Press: Washington, DC, USA, 2005. [Google Scholar]
- Lu, Y.; Garcia, R.; Hansen, B.; Gleicher, M.; Maciejewski, R. The State-of-the-Art in Predictive Visual Analytics. Comput. Graph. Forum 2017, 36, 539–562. [Google Scholar] [CrossRef]
- Ma, Y.; Xu, J.; Wu, X.; Wang, F.; Chen, W. A visual analytical approach for transfer learning in classification. Inf. Sci. 2017, 390, 54–69. [Google Scholar] [CrossRef]
- Miller, C.; Nagy, Z.; Schlueter, A. A review of unsupervised statistical learning and visual analytics techniques applied to performance analysis of non-residential buildings. Renew. Sustain. Energy Rev. 2018, 81, 1365–1377. [Google Scholar] [CrossRef]
- Sacha, D.; Zhang, L.; Sedlmair, M.; Lee, J.A.; Peltonen, J.; Weiskopf, D.; North, S.C.; Keim, D.A. Visual interaction with dimensionality reduction: A structured literature analysis. IEEE Trans. Vis. Comput. Graph. 2017, 23, 241–250. [Google Scholar] [CrossRef] [PubMed]
- Zhang, L.; Stoffel, A.; Behrisch, M.; Mittelstadt, S.; Schreck, T.; Pompl, R.; Weber, S.; Last, H.; Keim, D. Visual analytics for the big data era—A comparative review of state-of-the-art commercial systems. In Proceedings of the 2012 IEEE Conference on Visual Analytics Science and Technology (VAST), Seattle, WA, USA, 14–19 October 2012; pp. 173–182. [Google Scholar]
- Keim, D.; Andrienko, G.; Fekete, J.D.; Gorg, C.; Kohlhammer, J.; Melançon, G. Visual analytics: Definition, process, and challenges. Lect. Notes Comput. Sci. 2008, 4950, 154–176. [Google Scholar]
- Thomas, J.J.; Cook, K.A. A visual analytics agenda. IEEE Comput. Graph. Appl. 2006, 26, 10–13. [Google Scholar] [CrossRef] [PubMed]
- Ellis, G.; Mansmann, F. Mastering the information age solving problems with visual analytics. Eurographics 2010, 2, 5. [Google Scholar]
- Robinson, A.C.; Demšar, U.; Moore, A.B.; Buckley, A.; Jiang, B.; Field, K.; Kraak, M.J.; Camboim, S.P.; Sluter, C.R. Geospatial big data and cartography: Research challenges and opportunities for making maps that matter. Int. J. Cartogr. 2017, 1–29. [Google Scholar] [CrossRef]
- Endert, A.; Hossain, M.S.; Ramakrishnan, N.; North, C.; Fiaux, P.; Andrews, C. The human is the loop: New directions for visual analytics. J. Intell. Inf. Syst. 2014, 43, 411–435. [Google Scholar] [CrossRef]
- Gillies, M.; Fiebrink, R.; Tanaka, A.; Garcia, J.; Bevilacqua, F.; Heloir, A.; Nunnari, F.; Mackay, W.; Amershi, S.; Lee, B.; et al. Human-Centred Machine Learning. In Proceedings of the 2016 CHI Conference Extended Abstracts on Human Factors in Computing Systems, San Jose, CA, USA, 7–12 May 2016; pp. 3558–3565. [Google Scholar]
- Knight, W. The Dark Secret at the Heart of AI - MIT Technology Review. 2017. Available online: https://www.technologyreview.com/s/604087/the-dark-secret-at-the-heart-of-ai (accessed on 10 November 2017).
- Tamagnini, P.; Krause, J.; Dasgupta, A.; Bertini, E. Interpreting Black-Box Classifiers Using Instance-Level Visual Explanations. In Proceedings of the 2nd Workshop on Human-In-the-Loop Data Analytics, Chicago, IL, USA, 14 May 2017; p. 6. [Google Scholar]
- Sacha, D.; Sedlmair, M.; Zhang, L.; Lee, J.A.; Peltonen, J.; Weiskopf, D.; North, S.C.; Keim, D.A. What You See Is What You Can Change: Human-Centered Machine Learning By Interactive Visualization. Neurocomputing 2017, 268, 164–175. [Google Scholar] [CrossRef]
- Wongsuphasawat, K.; Smilkov, D.; Wexler, J.; Wilson, J.; Mané, D.; Fritz, D.; Krishnan, D.; Viégas, F.B.; Wattenberg, M. Visualizing Dataflow Graphs of Deep Learning Models in TensorFlow. IEEE Trans. Vis. Comput. Graph. 2018, 24, 1–12. [Google Scholar] [CrossRef] [PubMed]
- Alsallakh, B.; Jourabloo, A.; Ye, M.; Liu, X.; Ren, L. Do Convolutional Neural Networks Learn Class Hierarchy? IEEE Trans. Vis. Comput. Graph. 2018, 24, 152–162. [Google Scholar] [CrossRef] [PubMed]
- Amershi, S.; Cakmak, M.; Knox, W.B.; Kulesza, T. Power to the people: The role of humans in interactive machine learning. AI Mag. 2014, 35, 105–120. [Google Scholar] [CrossRef]
- Kim, B. Interactive and Interpretable Machine Learning Models for Human Machine Collaboration. Ph.D. Thesis, Massachusetts Institute of Technology, Cambridge, MA, USA, 2015. [Google Scholar]
- Sharma, M. Active Learning with Rich Feedback. Ph.D. Thesis, Illinois Institute of Technology, Chicago, IL, USA, 2017. [Google Scholar]
- Heimerl, F.; Koch, S.; Bosch, H.; Ertl, T. Visual classifier training for text document retrieval. IEEE Trans. Vis. Comput. Graph. 2012, 18, 2839–2848. [Google Scholar] [CrossRef] [PubMed]
- Höferlin, B.; Netzel, R.; Höferlin, M.; Weiskopf, D.; Heidemann, G. Inter-active learning of ad-hoc classifiers for video visual analytics. In Proceedings of the 2012 IEEE Conference on Visual Analytics Science and Technology (VAST), Seattle, WA, USA, 14–19 October 2012; pp. 23–32. [Google Scholar]
- Settles, B. Closing the loop: Fast, interactive semi-supervised annotation with queries on features and instances. In Proceedings of the Conference on Empirical Methods in Natural Language Processing, Scotland, UK, 27–31 July 2011; pp. 1467–1478. [Google Scholar]
- Huang, L. Active Learning with Visualization. Master’s Thesis, Dalhousie University, Halifax, NS, Canada, 2017. [Google Scholar]
- Jean, S.; Cho, K.; Memisevic, R.; Bengio, Y. On using very large target vocabulary for neural machine translation. arXiv, 2015; arXiv:1412.2007v2. [Google Scholar]
- Jean, S.; Firat, O.; Cho, K.; Memisevic, R.; Bengio, Y. Montreal Neural Machine Translation Systems for WMT’15. In Proceedings of the Tenth Workshop on Statistical Machine Translation, Lisboa, Portugal, 17–18 September 2015; pp. 134–140. [Google Scholar]
- Monroe, D. Deep learning takes on translation. Commun. ACM 2017, 60, 12–14. [Google Scholar] [CrossRef]
- Zhao, W. Deep Active Learning for Short-Text Classification. Master’s Thesis, KTH Royal Institute of Technology, Stockholm, Sweden, 2017. [Google Scholar]
- Ng, A. What Data Scientists Should Know about Deep Learning (See Slide 30 of 34). 2015. Available online: https://www.slideshare.net/ExtractConf (accessed on 15 October 2017).
- LeCun, Y.; Cortes, C.; Burges, C. MNIST handwritten Digit Database. 1998. Available online: http://yann.lecun.com/exdb/mnist/ (accessed on 18 October 2017).
- Gal, Y.; Islam, R.; Ghahramani, Z. Deep Bayesian Active Learning with Image Data. arXiv, 2017; arXiv:1703.02910. [Google Scholar]
- Wang, K.; Zhang, D.; Li, Y.; Zhang, R.; Lin, L. Cost-effective active learning for deep image classification. IEEE Trans. Circ. Syst. Video Technol. 2017, 27, 2591–2600. [Google Scholar] [CrossRef]
- Lee, D.H. Pseudo-label: The simple and efficient semi-supervised learning method for deep neural networks. In Workshop on Challenges in Representation Learning; ICML: Atlanta, GA, USA; Volume 3, p. 2.
- Chen, B.C.; Chen, C.S.; Hsu, W.H. Cross-age reference coding for age-invariant face recognition and retrieval. In European Conference on Computer Vision; Springer: Berlin/Heidelberg, Germany, 2014; pp. 768–783. [Google Scholar]
- Griffin, G.; Holub, A.; Perona, P. Caltech-256 Object Category Dataset. 2007. Available online: http://resolver.caltech.edu/CaltechAUTHORS:CNS-TR-2007-001 (accessed on 20 October 2017).
- Huijser, M.W.; van Gemert, J.C. Active Decision Boundary Annotation with Deep Generative Models. arXiv, 2017; arXiv:1703.06971. [Google Scholar]
- Goodfellow, I.; Pouget-Abadie, J.; Mirza, M.; Xu, B.; Warde-Farley, D.; Ozair, S.; Courville, A.; Bengio, Y. Generative adversarial nets. In Proceedings of the Advances in Neural Information Processing Systems, Montreal, QC, Canada, 8–13 December 2014; pp. 2672–2680. [Google Scholar]
- Salimans, T.; Goodfellow, I.; Zaremba, W.; Cheung, V.; Radford, A.; Chen, X. Improved techniques for training gans. In Proceedings of the Advances in Neural Information Processing Systems, Barcelona, Spain, 5–10 December 2016; pp. 2234–2242. [Google Scholar]
- Goodfellow, I. Generative Adversarial Networks for Text. 2016. Available online: https://www.reddit.com/r/MachineLearning/comments/40ldq6/generative_adversarial_networks_for_text/ (accessed on 15 October 2017).
- Zhou, S.; Chen, Q.; Wang, X. Active deep learning method for semi-supervised sentiment classification. Neurocomputing 2013, 120, 536–546. [Google Scholar] [CrossRef]
- Zhang, Y.; Lease, M.; Wallace, B. Active Discriminative Text Representation Learning. In Proceedings of the Thirty-First AAAI Conference on Artificial Intelligence (AAAI-17), San Francisco, CA, USA, 4–9 February 2017; pp. 3386–3392. [Google Scholar]
- Zhang, L.; Zhang, L.; Du, B. Deep learning for remote sensing data: A technical tutorial on the state of the art. IEEE Geosci. Remote Sens. Mag. 2016, 4, 22–40. [Google Scholar] [CrossRef]
- Mitra, P.; Shankar, B.U.; Pal, S.K. Segmentation of multispectral remote sensing images using active support vector machines. Pattern Recognit. Lett. 2004, 25, 1067–1074. [Google Scholar] [CrossRef]
- Rajan, S.; Ghosh, J.; Crawford, M.M. An active learning approach to hyperspectral data classification. IEEE Trans. Geosci. Remote Sens. 2008, 46, 1231–1242. [Google Scholar] [CrossRef]
- Tuia, D.; Ratle, F.; Pacifici, F.; Kanevski, M.F.; Emery, W.J. Active learning methods for remote sensing image classification. IEEE Trans. Geosci. Remote Sens. 2009, 47, 2218–2232. [Google Scholar] [CrossRef]
- Demir, B.; Persello, C.; Bruzzone, L. Batch-mode active-learning methods for the interactive classification of remote sensing images. IEEE Trans. Geosci. Remote Sens. 2011, 49, 1014–1031. [Google Scholar] [CrossRef]
- Patra, S.; Bruzzone, L. A fast cluster-assumption based active-learning technique for classification of remote sensing images. IEEE Trans. Geosci. Remote Sens. 2011, 49, 1617–1626. [Google Scholar] [CrossRef]
- Stumpf, A.; Lachiche, N.; Malet, J.P.; Kerle, N.; Puissant, A. Active learning in the spatial domain for remote sensing image classification. IEEE Trans. Geosci. Remote Sens. 2014, 52, 2492–2507. [Google Scholar] [CrossRef]
- Ferecatu, M.; Boujemaa, N. Interactive remote-sensing image retrieval using active relevance feedback. IEEE Trans. Geosci. Remote Sens. 2007, 45, 818–826. [Google Scholar] [CrossRef]
- Zou, Q.; Ni, L.; Zhang, T.; Wang, Q. Deep learning based feature selection for remote sensing scene classification. IEEE Geosci. Remote Sens. Lett. 2015, 12, 2321–2325. [Google Scholar] [CrossRef]
- Hinton, G.E.; Osindero, S.; Teh, Y.W. A fast learning algorithm for deep belief nets. Neural Comput. 2006, 18, 1527–1554. [Google Scholar] [CrossRef] [PubMed]
- Liu, P.; Zhang, H.; Eom, K.B. Active deep learning for classification of hyperspectral images. IEEE J. Sel. Top. Appl. Earth Obs. Remote Sens. 2017, 10, 712–724. [Google Scholar] [CrossRef]
- Chen, J.; Zipf, A. DeepVGI: Deep Learning with Volunteered Geographic Information. In Proceedings of the 26th International Conference on World Wide Web Companion. International World Wide Web Conferences Steering Committee, Perth, Australia, 3–7 April 2017; pp. 771–772. [Google Scholar]
- LeCun, Y. LeNet-5, Convolutional Neural Networks 2015. Available online: http://yann.lecun.com/exdb/lenet/ (accessed on 18 October 2017).
- Krizhevsky, A.; Sutskever, I.; Hinton, G.E. Imagenet classification with deep convolutional neural networks. In Proceedings of the Advances in Neural Information Processing Systems, Lake Tahoe, NV, USA, 3–8 December 2012; pp. 1097–1105. [Google Scholar]
- Bishop, C.M. Pattern Recognition and Machine Learning; Springer: Berlin/Heidelberg, Germany, 2006. [Google Scholar]
- Mooney, P.; Minghini, M. A review of OpenStreetMap data. In Mapp. Citiz. Sens.; Ubiquity Press: London, UK, 2017; pp. 37–59. [Google Scholar] [CrossRef]
- McCallum, A. Multi-label text classification with a mixture model trained by EM. AAAI Workshop Text Learn. 1999, 1–7. Available online: https://mimno.infosci.cornell.edu/info6150/readings/multilabel.pdf (accessed on 17 November 2017).
- Godbole, S.; Sarawagi, S. Discriminative methods for multi-labeled classification. Adv. Knowl. Discov. Data Min. 2004, 22–30. [Google Scholar] [CrossRef]
- Wang, J.; Yang, Y.; Mao, J.; Huang, Z.; Huang, C.; Xu, W. Cnn-rnn: A unified framework for multi-label image classification. In Proceedings of the IEEE Conference on Computer Vision and Pattern Recognition, Las Vegas, NV, USA, 26 June–1 July 2016; pp. 2285–2294. [Google Scholar]
- Chen, S.F.; Chen, Y.C.; Yeh, C.K.; Wang, Y.C.F. Order-free rnn with visual attention for multi-label classification. arXiv, 2017; arXiv:1707.05495. [Google Scholar]
- Silla, C.N., Jr.; Freitas, A.A. A survey of hierarchical classification across different application domains. Data Min. Knowl. Discov. 2011, 22, 31–72. [Google Scholar] [CrossRef]
- Ghazi, D.; Inkpen, D.; Szpakowicz, S. Hierarchical versus flat classification of emotions in text. In Proceedings of the NAACL HLT 2010 Workshop on Computational Approaches to Analysis and Generation of Emotion in Text, Los Angeles, CA, USA, 5 June 2010; pp. 140–146. [Google Scholar]
- Bi, W.; Kwok, J.T. Mandatory leaf node prediction in hierarchical multilabel classification. IEEE Trans. Neural Netw. Learn. Syst. 2014, 25, 2275–2287. [Google Scholar] [CrossRef] [PubMed]
- Hu, X.; Wang, L.; Yuan, B. Querying representative points from a pool based on synthesized queries. In Proceedings of the 2012 International Joint Conference on Neural Networks (IJCNN), Brisbane, Australia, 10–15 June 2012; pp. 1–6. [Google Scholar]
- Raad, M. A nEw Business Intelligence Emerges: Geo.AI. 2017. Available online: https://www.esri.com/about/newsroom/publications/wherenext/new-business-intelligence-emerges-geo-ai/ (accessed on 17 November 2017).
- LeCun, Y.; Bengio, Y.; Hinton, G. Deep learning. Nature 2015, 521, 436–444. [Google Scholar] [CrossRef] [PubMed]
- Manning, C.D. Computational linguistics and deep learning. Comput. Linguist. 2015, 41, 701–707. [Google Scholar] [CrossRef]
- Knight, W. AI’s Language Problem—MIT Technology Review. 2016. Available online: https://www.technologyreview.com/s/602094/ais-language-problem (accessed on 15 November 2017).
- Deng, J.; Dong, W.; Socher, R.; Li, L.J.; Li, K.; Fei-Fei, L. Imagenet: A large-scale hierarchical image database. In Proceedings of the IEEE Conference on Computer Vision and Pattern Recognition, Miami, FL, USA, 20–25 June 2009; pp. 248–255. [Google Scholar]
- Simonyan, K.; Zisserman, A. Very deep convolutional networks for large-scale image recognition. arXiv, 2014; arXiv:1409.1556. [Google Scholar]
- Szegedy, C.; Liu, W.; Jia, Y.; Sermanet, P.; Reed, S.; Anguelov, D.; Erhan, D.; Vanhoucke, V.; Rabinovich, A. Going deeper with convolutions. In Proceedings of the IEEE Conference on Computer Vision and Pattern Recognition, Boston, MA, USA, 7–12 June 2015; pp. 1–9. [Google Scholar]
- Xia, J.; Wang, F.; Zheng, X.; Li, Z.; Gong, X. A novel approach for building extraction from 3D disaster scenes of urban area. In Proceedings of the 2017 25th International Conference on Geoinformatics, Buffalo, NY, USA, 2–4 August 2017; pp. 1–4. [Google Scholar]
- Bejiga, M.B.; Zeggada, A.; Nouffidj, A.; Melgani, F. A convolutional neural network approach for assisting avalanche search and rescue operations with uav imagery. Remote Sens. 2017, 9, 100. [Google Scholar] [CrossRef]
- Badjatiya, P.; Gupta, S.; Gupta, M.; Varma, V. Deep learning for hate speech detection in tweets. In Proceedings of the 26th International Conference on World Wide Web Companion. International World Wide Web Conferences Steering Committee, Perth, Australia, 3–7 April 2017; pp. 759–760. [Google Scholar]
- Andriole, S. Unstructured Data: The Other Side of Analytics. 2015. Available online: http://www.forbes.com/sites/steveandriole/2015/03/05/the-other-side-of-analytics (accessed on 20 October 2017).
- Hahmann, S.; Burghardt, D. How much information is geospatially referenced? Networks and cognition. Int. J. Geogr. Inf. Sci. 2013, 27, 1171–1189. [Google Scholar] [CrossRef]
- Castelluccio, M.; Poggi, G.; Sansone, C.; Verdoliva, L. Land use classification in remote sensing images by convolutional neural networks. arXiv, 2015; arXiv:1508.00092. [Google Scholar]
- Tracewski, L.; Bastin, L.; Fonte, C.C. Repurposing a deep learning network to filter and classify volunteered photographs for land cover and land use characterization. Geo-Spat. Inf. Sci. 2017, 20, 252–268. [Google Scholar] [CrossRef]
- Hu, Y.; Gao, S.; Janowicz, K.; Yu, B.; Li, W.; Prasad, S. Extracting and understanding urban areas of interest using geotagged photos. Comput. Environ. Urban Syst. 2015, 54, 240–254. [Google Scholar] [CrossRef]
- Albert, A.; Kaur, J.; Gonzalez, M.C. Using convolutional networks and satellite imagery to identify patterns in urban environments at a large scale. In Proceedings of the 23rd ACM SIGKDD International Conference on Knowledge Discovery and Data Mining, Halifax, NS, Canada, 13–17 August 2017; pp. 1357–1366. [Google Scholar]
- Zhou, B.; Lapedriza, A.; Xiao, J.; Torralba, A.; Oliva, A. Learning deep features for scene recognition using places database. In Proceedings of the Advances in Neural Information Processing Systems, Montreal, QC, Canada, 8–13 December 2014; pp. 487–495. [Google Scholar]
- Cordts, M.; Omran, M.; Ramos, S.; Rehfeld, T.; Enzweiler, M.; Benenson, R.; Franke, U.; Roth, S.; Schiele, B. The cityscapes dataset for semantic urban scene understanding. In Proceedings of the IEEE Conference on Computer Vision and Pattern Recognition, Las Vegas, NV, USA, 26 June–1 July 2016; pp. 3213–3223. [Google Scholar]
- Wan, J.; Wang, D.; Hoi, S.C.H.; Wu, P.; Zhu, J.; Zhang, Y.; Li, J. Deep learning for content-based image retrieval: A comprehensive study. In Proceedings of the 22nd ACM International Conference on Multimedia, Orlando, FL, USA, 3–7 November 2014; pp. 157–166. [Google Scholar]
- Lin, T.Y.; Belongie, S.; Hays, J. Cross-view image geolocalization. In Proceedings of the 2013 IEEE Conference on Computer Vision and Pattern Recognition (CVPR), Portland, OR, USA, 23–28 June 2013; pp. 891–898. [Google Scholar]
- Lin, T.Y.; Cui, Y.; Belongie, S.; Hays, J. Learning deep representations for ground-to-aerial geolocalization. In Proceedings of the Proceedings of the IEEE Conference on Computer Vision and Pattern Recognition, Boston, MA, USA, 7–12 June 2015; pp. 5007–5015. [Google Scholar]
- Zafarani, R.; Abbasi, M.A.; Liu, H. Social Media Mining: An Introduction; Cambridge University Press: Cambridge, UK, 2014. [Google Scholar]
- Nguyen, D.T.; Mannai, K.A.A.; Joty, S.; Sajjad, H.; Imran, M.; Mitra, P. Rapid Classification of Crisis-Related Data on Social Networks using Convolutional Neural Networks. arXiv, 2016; arXiv:1608.03902. [Google Scholar]
- Nguyen, D.T.; Al-Mannai, K.; Joty, S.R.; Sajjad, H.; Imran, M.; Mitra, P. Robust Classification of Crisis-Related Data on Social Networks Using Convolutional Neural Networks. In Proceedings of the Eleventh International AAAI Conference on Web and Social Media (ICWSM), Montreal, QC, Canada, 15–18 May 2017; pp. 632–635. [Google Scholar]
- Severyn, A.; Moschitti, A. Twitter sentiment analysis with deep convolutional neural networks. In Proceedings of the 38th International ACM SIGIR Conference on Research and Development in Information Retrieval, Santiago, Chile, 9–13 August 2015; pp. 959–962. [Google Scholar]
- Poria, S.; Cambria, E.; Hazarika, D.; Vij, P. A deeper look into sarcastic tweets using deep convolutional neural networks. arXiv, 2016; arXiv:1610.08815. [Google Scholar]
- Hu, Y. Geospatial semantics. arXiv, 2017; arXiv:1707.03550v2. [Google Scholar]
- Janowicz, K.; Raubal, M.; Kuhn, W. The semantics of similarity in geographic information retrieval. J. Spat. Inf. Sci. 2011, 2011, 29–57. [Google Scholar] [CrossRef]
- Adams, B.; McKenzie, G. Crowdsourcing the Character of a Place: Character-Level Convolutional Networks for Multilingual Geographic Text Classification. Trans. GIS 2018. [Google Scholar] [CrossRef]
- Cervone, G.; Sava, E.; Huang, Q.; Schnebele, E.; Harrison, J.; Waters, N. Using Twitter for tasking remote-sensing data collection and damage assessment: 2013 Boulder flood case study. Int. J. Remote Sens. 2016, 37, 100–124. [Google Scholar] [CrossRef]
- Gao, S.; Li, L.; Li, W.; Janowicz, K.; Zhang, Y. Constructing gazetteers from volunteered big geo-data based on Hadoop. Comput. Environ. Urban Syst. 2017, 61, 172–186. [Google Scholar] [CrossRef]
- Goodfellow, I.; Bengio, Y.; Courville, A. Deep Learning; MIT Press: Cambridge, MA, USA, 2016; Available online: http://www.deeplearningbook.org (accessed on 10 October 2017).
- Scott, S.; Matwin, S. Feature engineering for text classification. ICML 1999, 99, 379–388. [Google Scholar]
- Bengio, Y.; Courville, A.; Vincent, P. Representation learning: A review and new perspectives. IEEE Trans. Pattern Anal. Mach. Intell. 2013, 35, 1798–1828. [Google Scholar] [CrossRef] [PubMed]
- Anderson, M.R.; Antenucci, D.; Bittorf, V.; Burgess, M.; Cafarella, M.J.; Kumar, A.; Niu, F.; Park, Y.; Ré, C.; Zhang, C. Brainwash: A Data System for Feature Engineering. In Proceedings of the 6th Biennial Conference on Innovative Data Systems Research (CIDR ’13), Asilomar, CA, USA, 6–9 January 2013. [Google Scholar]
- Yang, L. AI vs. Machine Learning vs. Deep Learning—Deep Learning Garden. 2016. Available online: http://deeplearning.lipingyang.org/2016/11/23/machine-learning-vs-deep-learning/ (accessed on 17 October 2017).
- Hastie, T.; Tibshirani, R.; Friedman, J. The Elements of Statistical Learning: Data Mining, Inference, and Prediction, 2nd ed.; Springer: Berlin/Heidelberg, Germany, 2009. [Google Scholar]
- Herrera, F.; Charte, F.; Rivera, A.J.; Del Jesus, M.J. Multilabel Classification: Problem Analysis, Metrics and Techniques; Springer: Berlin/Heidelberg, Germany, 2016. [Google Scholar]
- Mohri, M.; Rostamizadeh, A.; Talwalkar, A. Foundations of Machine Learning; MIT press: Cambridge, MA, USA, 2012. [Google Scholar]
- Cherkassky, V.; Mulier, F.M. Learning From Data: Concepts, Theory, and Methods; John Wiley & Sons: Hoboken, NJ, USA, 2007. [Google Scholar]
- Zhu, X.; Goldberg, A.B. Introduction to semi-supervised learning. Synth. Lect. Artif. Intell. Mach. Learn. 2009, 3, 1–130. [Google Scholar] [CrossRef]
- Zhu, X. Semi-Supervised Learning Literature Survey; Computer Sciences Technical Report 1530; University of Wisconsin: Madison, MI, USA, 2005. [Google Scholar]
- Langley, P. Intelligent behavior in humans and machines. American Association for Artificial Intelligence. 2006. Available online: http://lyonesse.stanford.edu/~langley/papers/ai50.dart.pdf (accessed on 29 December 2017).
- Mitchell, T.M. The Discipline of Machine Learning; Technical Report CMU-ML-06-108; Carnegie Mellon University: Pittsburgh, PA, USA, 2006. [Google Scholar]
- Kendall, A.; Grimes, M.; Cipolla, R. Posenet: A convolutional network for real-time 6-dof camera relocalization. In Proceedings of the IEEE International Conference on Computer Vision, Santiago, Chile, 7–13 December 2015; pp. 2938–2946. [Google Scholar]
- Gebru, T.; Krause, J.; Wang, Y.; Chen, D.; Deng, J.; Aiden, E.L.; Fei-Fei, L. Using deep learning and google street view to estimate the demographic makeup of the us. arXiv, 2017; arXiv:1702.06683. [Google Scholar]
- Kendall, A.; Cipolla, R. Geometric loss functions for camera pose regression with deep learning. arXiv, 2017; arXiv:1704.00390. [Google Scholar]
- Vandal, T.; Kodra, E.; Ganguly, S.; Michaelis, A.; Nemani, R.; Ganguly, A.R. DeepSD: Generating High Resolution Climate Change Projections through Single Image Super-Resolution. arXiv, 2017; arXiv:1703.03126. [Google Scholar]
- Aggarwal, C.C. Data Classification: Algorithms and Applications; CRC Press: Boca Raton, FL, USA, 2014. [Google Scholar]
- Galar, M.; Fernández, A.; Barrenechea, E.; Bustince, H.; Herrera, F. An overview of ensemble methods for binary classifiers in multi-class problems: Experimental study on one-vs-one and one-vs-all schemes. Pattern Recognit. 2011, 44, 1761–1776. [Google Scholar] [CrossRef]
- Sokolova, M.; Lapalme, G. A systematic analysis of performance measures for classification tasks. Inf. Process. Manag. 2009, 45, 427–437. [Google Scholar] [CrossRef]
- Milgram, J.; Cheriet, M.; Sabourin, R. “One against one” or “one against all”: Which one is better for handwriting recognition with SVMs? In Tenth International Workshop on Frontiers in Handwriting Recognition; Suvisoft: La Baule, France, October 2006. [Google Scholar]
- Levatić, J.; Kocev, D.; Džeroski, S. The importance of the label hierarchy in hierarchical multi-label classification. J. Intell. Inf. Syst. 2015, 45, 247–271. [Google Scholar] [CrossRef]
- Tsoumakas, G.; Katakis, I.; Vlahavas, I. Mining multi-label data. In Data Mining and Knowledge Discovery Handbook; Springer: Berlin/Heidelberg, Germany, 2009; pp. 667–685. [Google Scholar]
- Read, J.; Pfahringer, B.; Holmes, G.; Frank, E. Classifier chains for multi-label classification. Mach. Learn. 2011, 85, 333–359. [Google Scholar] [CrossRef]
- Zhang, M.L.; Zhou, Z.H. A review on multi-label learning algorithms. IEEE Trans. Knowl. Data Eng. 2014, 26, 1819–1837. [Google Scholar] [CrossRef]
- Gibaja, E.; Ventura, S. A tutorial on multilabel learning. ACM Comput. Surv. (CSUR) 2015, 47, 52. [Google Scholar] [CrossRef]
- Kiritchenko, S.; Matwin, S.; Nock, R.; Famili, A.F. Learning and evaluation in the presence of class hierarchies: Application to text categorization. In Canadian Conference on AI; Springer: Berlin/Heidelberg, Germany, 2006; Volume 2006, pp. 395–406. [Google Scholar]
- Vens, C.; Struyf, J.; Schietgat, L.; Džeroski, S.; Blockeel, H. Decision trees for hierarchical multi-label classification. Mach. Learn. 2008, 73, 185–214. [Google Scholar] [CrossRef]
- Bi, W.; Kwok, J.T. Multi-label classification on tree-and dag-structured hierarchies. In Proceedings of the 28th International Conference on Machine Learning (ICML-11), Bellevue, WA, USA, 28 June–2 July 2011; pp. 17–24. [Google Scholar]
- Sapozhnikov, G.; Ulanov, A. Extracting Hierarchies from Data Clusters for Better Classification. Algorithms 2012, 5, 506–520. [Google Scholar] [CrossRef]
- Wang, X.; Zhao, H.; Lu, B. Enhanced K-Nearest Neighbour Algorithm for Large-scale Hierarchical Multi-label Classification. In Proceedings of the Joint ECML/PKDD PASCAL Workshop on Large-Scale Hierarchical Classification, Athens, Greece, 5 September 2011. [Google Scholar]
- Vailaya, A.; Figueiredo, M.; Jain, A.; Zhang, H.J. Content-based hierarchical classification of vacation images. In Proceedings of the IEEE International Conference on Multimedia Computing and Systems, Austin, TX, USA, 7–11 June 1999; Volume 1, pp. 518–523. [Google Scholar]
- Cheong, S.; Oh, S.H.; Lee, S.Y. Support vector machines with binary tree architecture for multi-class classification. Neural Inf. Process. Lett. Rev. 2004, 2, 47–51. [Google Scholar]
- Kowsari, K.; Brown, D.E.; Heidarysafa, M.; Meimandi, K.J.; Gerber, M.S.; Barnes, L.E. Hdltex: Hierarchical deep learning for text classification. arXiv, 2017; arXiv:1709.08267. [Google Scholar]
- Ren, Z.; Peetz, M.H.; Liang, S.; Van Dolen, W.; De Rijke, M. Hierarchical multi-label classification of social text streams. In Proceedings of the 37th international ACM SIGIR Conference On Research & Development in Information Retrieval, Gold Coast, Australia, 6–11 July 2014; pp. 213–222. [Google Scholar]
- Guo, Y.; Liu, Y.; Oerlemans, A.; Lao, S.; Wu, S.; Lew, M.S. Deep learning for visual understanding: A review. Neurocomputing 2016, 187, 27–48. [Google Scholar] [CrossRef]
- Imran, M.; Mitra, P.; Srivastava, J. Cross-language domain adaptation for classifying crisis-related short messages. arXiv, 2016; arXiv:1602.05388. [Google Scholar]
- Stanford NER Recognizer. Available online: https://nlp.stanford.edu/software/CRF-NER.shtml (accessed on 10 October 2017).
- Stanford Named Entity Tagger. Available online: http://nlp.stanford.edu:8080/ner (accessed on 10 October 2017).
- Sebastiani, F. Machine learning in automated text categorization. ACM Comput. Surv. (CSUR) 2002, 34, 1–47. [Google Scholar] [CrossRef]
- Yang, Y.; Liu, X. A re-examination of text categorization methods. In Proceedings of the 22nd Annual International ACM SIGIR Conference On Research and Development in Information Retrieval, Berkeley, CA, USA, 15–19 August 1999; pp. 42–49. [Google Scholar]
- Mikolov, T.; Sutskever, I.; Chen, K.; Corrado, G.S.; Dean, J. Distributed representations of words and phrases and their compositionality. In Proceedings of the Advances in Neural Information Processing Systems, Lake Tahoe, NV, USA, 5–10 December 2013; pp. 3111–3119. [Google Scholar]
- Mikolov, T.; Chen, K.; Corrado, G.; Dean, J. Efficient estimation of word representations in vector space. arXiv, 2013; arXiv:1301.3781. [Google Scholar]
- Pennington, J.; Socher, R.; Manning, C. Glove: Global vectors for word representation. In Proceedings of the 2014 Conference on Empirical Methods in Natural Language Processing (EMNLP), Doha, Qatar, 25–29 October 2014; pp. 1532–1543. [Google Scholar]
- Baroni, M.; Dinu, G.; Kruszewski, G. Don’t count, predict! A systematic comparison of context-counting vs. context-predicting semantic vectors. ACL 2014, 1, 238–247. [Google Scholar]
Figure 1.
An overview of the review flow and the links between different research domains—the dashed lines indicate the flows among the (interdisciplinary) domains. An introduction to essential concepts in machine learning (ML) and deep learning (DL) for understanding the core part of the review (i.e., Section 3) is provided in the Appendix A.

Figure 2.
The pool-based active learning cycle (adapted based on [26]).
Figure 2.
The pool-based active learning cycle (adapted based on [26]).

Figure 3.
Review highlight for the pool-based active learning cycle (adapted based on [26]).
Figure 3.
Review highlight for the pool-based active learning cycle (adapted based on [26]).
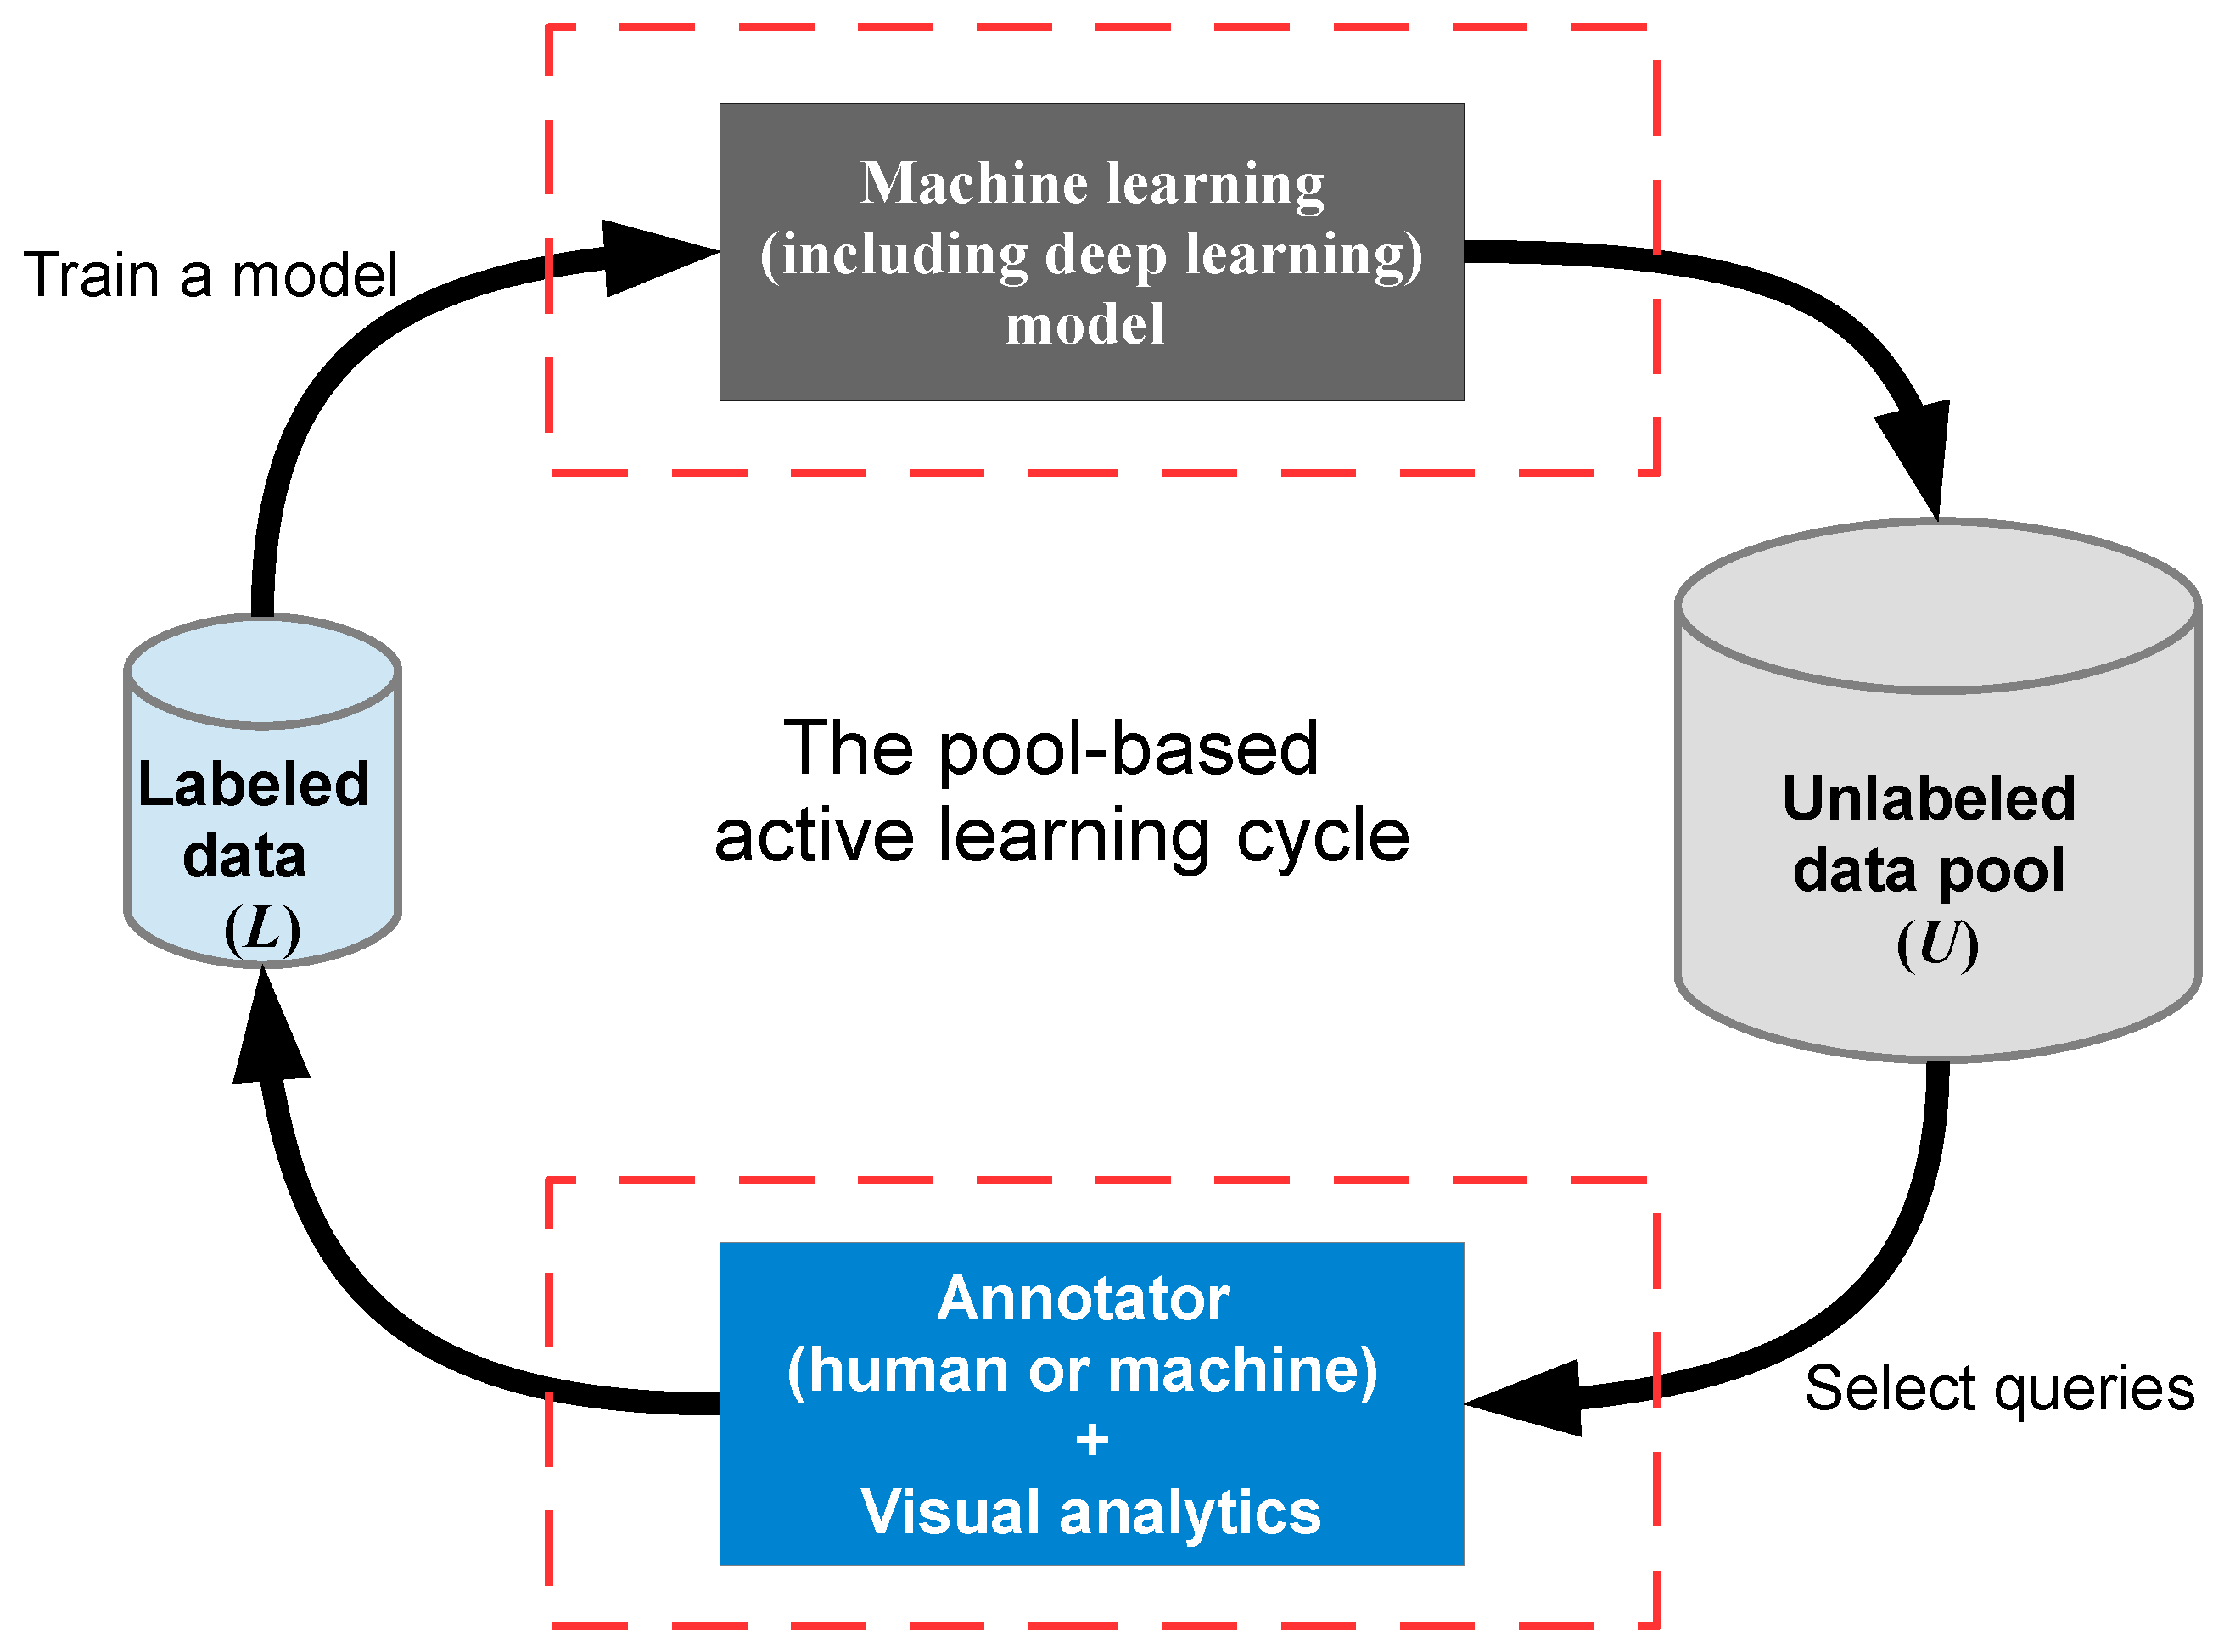
Figure 4.
An illustration of the three main active learning scenarios (adapted based on [26]). Each starts from the set of all possible observations (the instance space at left) and applies a query strategy (light blue box) for selecting which instance to ask the human or machine annotator to label (dark blue box).

© 2018 by the authors. Licensee MDPI, Basel, Switzerland. This article is an open access article distributed under the terms and conditions of the Creative Commons Attribution (CC BY) license (http://creativecommons.org/licenses/by/4.0/).
Share and Cite
MDPI and ACS Style
Yang, L.; MacEachren, A.M.; Mitra, P.; Onorati, T. Visually-Enabled Active Deep Learning for (Geo) Text and Image Classification: A Review. ISPRS Int. J. Geo-Inf. 2018, 7, 65. https://doi.org/10.3390/ijgi7020065
AMA Style
Yang L, MacEachren AM, Mitra P, Onorati T. Visually-Enabled Active Deep Learning for (Geo) Text and Image Classification: A Review. ISPRS International Journal of Geo-Information. 2018; 7(2):65. https://doi.org/10.3390/ijgi7020065
Chicago/Turabian StyleYang, Liping, Alan M. MacEachren, Prasenjit Mitra, and Teresa Onorati. 2018. "Visually-Enabled Active Deep Learning for (Geo) Text and Image Classification: A Review" ISPRS International Journal of Geo-Information 7, no. 2: 65. https://doi.org/10.3390/ijgi7020065
Note that from the first issue of 2016, this journal uses article numbers instead of page numbers. See further details here.