Digital Story Mapping to Advance Educational Atlas Design and Enable Student Engagement

1
Wyoming Geographic Information Science Center, University of Wyoming, Laramie, WY 82071, USA
2
Department of Geography, University of Wyoming, Laramie, WY 82071, USA
*
Author to whom correspondence should be addressed.
ISPRS Int. J. Geo-Inf. 2018, 7(3), 125; https://doi.org/10.3390/ijgi7030125
Submission received: 15 January 2018
/
Revised: 8 March 2018
/
Accepted: 14 March 2018
/
Published: 19 March 2018
(This article belongs to the Special Issue Storytelling with Geographic Data)
Abstract
:Storytelling is recognized as a valid and important method of communicating information and knowledge gleaned from volumes of ever-accumulating data. Practices of data-driven storytelling in journalism and geovisual analytics have contributed to the development of geovisual stories; also called story maps. The benefits of student-focused multi-thematic atlases and digital storytelling methods in education can also be realized in story maps. An online, interactive version of the original paper version of the Wyoming Student Atlas was developed using story mapping technology. Studies on best practices for data-driven storytelling and web map interaction were used to inform the transition of the atlas from a traditional paper format to a collection of story maps. Evaluation of the atlas story maps for educational purposes was conducted by observing students from multiple classrooms as they used the story maps in a lesson. The students and educators responded to a survey after using the story maps. Results of the survey show positive responses to the atlas story maps, including ease of use and preference over a traditional paper atlas. However, certain types of interaction with the map resulted in increased negative or uncertain responses from students concerning their perception of the atlas story maps.
1. Introduction
The ability to process data, extract value from it and communicate the results in a meaningful way is extremely important in data journalism [1], geovisual analytics [2], geomarketing [3], and many scientific fields. The terms “data storytelling” or “data-driven storytelling” have been used to refer to how insights are uncovered from data and communicated to others effectively so that they can be translated into actions or changes [4]. In the field of journalism, the best way to relay stories with a spatial component is often through the use of maps [5]; in geovisual analytics, the maps and supporting visualizations used to describe multivariate data are sometimes best understood through a story telling process [2]. As such, data journalism and geovisual analytics have contributed to the rise of geovisual stories or story maps, a type of data storytelling using maps, texts, photos, and graphs [6,7,8]. A rise in geographic and multimedia tools on the web has expanded the ability and audience for storytelling through maps, and there are multiple platforms available for experts and non-experts alike [7]. The explosive popularity of story maps is underscored in the recent release of a web-based version of Google Earth that features “Voyager”, a collection of map-based stories written by Google Earth partners, updated weekly. The Voyager platform will eventually be made available to the public for building custom story maps, with the aim of bringing a storytelling aspect to Google’s popular mapping service [9].
Although story mapping has seen a rise in popularity due to the accessibility and ease-of-use of web-based tools for creating maps and associated text, story maps have long existed in the form of annotated maps and atlases. Atlases tell stories through a collection of themes that are illustrated with maps, charts, graphs, and images, along with explanatory text [10]. Buckley [10] suggests that atlases engage the reader with characters (such as themes or locations or regions), and with plots (such as the historical settlement of a place or the boom and bust economic cycles of a region). Given the natural storytelling role of atlases, it is not surprising to find that web-based story mapping platforms have been used to deliver electronic versions of atlases. Roth [11] identifies digital atlases as a means of visual storytelling. Numerous commercial and non-commercial entities are currently providing tools for creating and interacting with story maps as well as collecting examples of story maps and story map atlases.
Education is another significant area where story mapping is increasingly being used. Strachan [12] has studied teacher’s perceptions of story maps as effective teaching tools. Story mapping is often listed among educational technology resources [13] and is starting to appear in the programs of education technology conferences. ESRI (Redlands, CA, USA), a company providing a tool for creating and hosting web-based story mapping, reported in 2015 that they had provided over 1000 accounts to schools to facilitate the use of web maps and story mapping in education [14]. There are numerous examples of story maps created by educators and students, including both a national competition [15] and an international competition [16] for student-created story maps. Story mapping platforms have been used to create atlases specifically as educational resources. Examples include a story map atlas for teaching the state history of Louisiana [17]; the California Atlas 2.0, a series of story maps for students developed by the California Geographic Alliance [18]; and an educational story map atlas detailing the geographic expansion of the Black Death in Europe [6].
Despite the history of telling stories with maps in atlases and in journalism, and the recent popularity of data-driven storytelling and web-based story mapping, there are not yet many studies specifically addressing story mapping. This study focuses on digital story mapping to advance educational atlas design and enable student engagement. Using a survey and classroom observation, this study explores what practices are best for story mapping in this capacity and what challenges arise with its use in the classroom. The study also aims to evaluate student engagement with a story map atlas in comparison to a traditional paper student atlas. Is the capability for a student to zoom in on a map and explore familiar, local context or zoom out to explore larger contexts at a regional or even global scale an advantage in engaging the student with specific themes in the story map? Are there certain types of tools for interacting with a map that are more engaging for students as they explore content in a familiar, local context?
The remainder of this introduction will discuss relevant research in data-driven storytelling in business and journalism, storytelling in geovisual analytics, storytelling in atlases, digital storytelling in education, and key technologies in web mapping and interactive cartography that have particular relevance to story mapping. This broader understanding of how digital storytelling is being used in different fields will then be related to the development of an online, interactive student atlas using a story mapping platform.
1.1. Storytelling in Business and Journalism
Data-driven storytelling, or presenting data in a way to influence business decisions or to highlight a journalistic investigation, has its roots in data visualization [1,19]. The distinction between exploratory analysis and explanatory analysis illustrates the importance of data-driven storytelling [19]. Exploratory analysis involves exploring and analyzing data to find out what might be noteworthy or applicable to solving a problem. In contrast, explanatory analysis is taking the time to turn the data into information that can be consumed by an audience, and includes storytelling. It involves understanding the audience and the context, filtering the data to address the audience and context, finding the most effective visualization of the filtered data, and finally highlighting the conclusion, often with recommendations for action. In short, these different steps mimic a story with a beginning (context), middle (uncovering and communicating evidence of a situation or problem), and ending (what can be done about it).
In narrative visualization (the term for data-driven storytelling in the field of data visualization) studies have focused on different genres, design patterns, types of visualizations, and rhetorical devices used in narrative visualizations [1]. Similar to story mapping technology, a number of systems and tools for telling data-driven stories exist, but little research has been conducted in the design and effectiveness of these tools. Interaction in stories is identified as needing more research, as one study concludes there is “no guarantee that interaction inherently increases reader engagement” [20] but another contends that “authors can utilize well-designed interaction to make reader experiences more effective and, simply, more fun” [1].
Popular techniques were identified in a survey of 45 data-driven stories [1], some of which may be applicable to story mapping (in fact, seven of the 45 stories included maps). Annotation of visualizations (as distinct from labels) are considered to be an important technique in effective data-driven storytelling. One data journalist specializing in maps places very high importance on annotations [5], likening them to “a museum docent, politely explaining the complicated parts of the story”. Visualizations with simple interaction like tooltips were also common, but interactions such as brushing, linking, and filtering were less common. Brushing, linking, and filtering are quite common in exploratory visualizations, so it is noteworthy that they are used less frequently in explanatory visualizations. Another key difference of storytelling from open-ended exploration is that authors impose an ordered structure to a story with a conclusion and frequently provide aids for navigation.
1.2. Storytelling in Geovisual Analytics
Geovisual analytics refers to the science of analytical reasoning with spatial information as facilitated by interactive visual interfaces. It is related to the fields of data visualization and visual analytics but focuses on geospatial data sources [21]. Geovisual analytics develops interactive mapping systems that allow users to explore spatial data, detect patterns, and predict future outcomes. Research has been primarily focused on tools that explore data, but as the field of geovisual analytics evolves, there is a need for methods that efficiently communicate gained knowledge, such as storytelling [22]. There is also recognition in the related field of geovisualization that the ability to look at data from different perspectives—such as alternative map views in combination with diagrams, graphs, photographs, and videos—can facilitate the transformation of data into information and ultimately into knowledge [23].
Van Ho [22] relates a method for telling a story about the analytic reasoning processes used to obtain knowledge on demographic statistics. The geovisual story is created as a series of visual snapshots, annotated with metadata for explanation, highlighting important discoveries during the process of geovisual analysis. The story is then made accessible to policy and decision makers, teachers, and informed citizens, to “enable a leap in understanding by the user in order to grasp how statistical indicators may influence society”.
1.3. Storytelling in Atlases
The text, maps, photographs, and other graphics associated with atlases tell stories about the area or themes they portray. Buckley [10] emphasizes that an atlas is not just a collection of maps, but is also a communication device. Atlases are typically organized by theme (e.g., climate, politics, history, energy), by chronology (according to a linear progression of events, as in the case of historical atlases), or by region (such as state maps in a national road atlas). Atlases that are organized by theme or chronology or some combination of theme/chronology allow a narrative reading to unfold implicitly as the reader makes connections and comparisons between patterns on the maps and enriching text, photographs, and other information. But little research has been done on organizational structures or the intentional arrangement of maps and other content to shape a story or produce an argument [24]. Bentley [24] describes one such historical atlas with a narrative designed to engage and connect the reader to places, events, and processes. Kraak [25] envisioned an interactive school atlas of Sweden, engaging students with an overarching narrative of migrating geese flying over the country to introduce a broad overview of the geography with stopovers at places of interest or adventure.
1.4. Digital Storytelling in Education
Story mapping is a method often seen in literacy education in a context related to fostering comprehension of narrative texts. Story maps in this educational context do not refer to geographic space, but rather to narrative content. They are usually a graphic organizer or visual tool that delineates the most important ideas of a narrative text and reflects the linkages of concepts or facts [26]. More closely related to geovisual stories (stories in a geographical context) is “digital storytelling”, which combines digital content/media and the art of storytelling for educational purposes [27]. Geovisual stories would likely be a subcategory of digital storytelling in this context.
The Center for Digital Storytelling (renamed StoryCenter) [28] developed seven elements of digital storytelling that have been widely adopted in practice [29]. The main elements are as follows: identifying the main point of the story and the perspective of the author; using a dramatic question that gets the viewer’s attention and will be answered by the end of the story; emotional content which personalizes the story or connects the audience to the story; using just enough content to tell the story without overloading the viewer; and attention to pacing. The sixth and seventh elements are ways to further personalize and dramatize the story by the use of audio narration and music or others sounds used to embellish the story.
A common factor between storytelling in education and storytelling in business, journalism, geovisual analytics, and atlases is the desire for a point to be made or a conclusion to be drawn; sometimes even a call to action. Another common factor is the use of various media (photographs, charts, maps, video, etc.) to support the story. However, a major difference in digital storytelling for education is that the value of the storytelling lies as much in the creation of the story as the presentation of the story. Research is ongoing as to how the creative practice of digital storytelling can promote critical thinking, communication, digital literacy, and civic engagement [27]. Other studies have shown positive outcomes such as learning and reinforcing understanding of content, facilitating discussion, comprehending difficult material [30], and development of twenty-first century literacy skills like research, writing, technology, and teamwork [29]. Also noted as being of importance is the ease with which digital stories can now be created and distributed to a broad audience; similar claims have been made by companies advertising web mapping and story mapping tools, as ease-of-use and accessibility are critical for the adoption of educational technologies [12].
1.5. Web Mapping and Interactive Cartography
Web-based geovisual stories/story maps at minimum provide text and maps, though they may also include images, graphs, videos, animations, and other media. Web maps however are a crucial distinguishing factor of story maps. The rapid rise of mobile and real-time location-based and mapping services such as Google Maps and Apple Maps has resulted in widespread use of digital maps, and it has been argued that “the web is the new medium of maps” [31]. Because of the change from paper as a medium to the web as a medium, web mapping is a new frontier in cartographic research, transforming the design principles of map-making and the scope of map use [31].
Key technologies that have recently emerged in web mapping that have particular relevance to story mapping are cloud computing, rich Internet applications, and crowdsourcing [31]. Cloud computing delivers applications, software, and infrastructures as services to many users over the Internet. Rich Internet applications (such as Java Script) provide very user friendly, high performance, and responsive web applications with powerful user interface tools. Crowdsourcing is the collection of data by amateurs and volunteers, who contribute their local knowledge and effort to mapping information by GPS, mobile sensors, and web mapping tools. Because of extensive commercial development in these areas, web mapping technology and mapped information has become easily accessible. Likewise, story mapping tools have become very accessible and are designed to help non-expert users quickly find or create their own web maps and combine them with text and other media.
A major aspect in the design of web map interfaces and mapping functions is the type and amount of interaction with a web map. It is evident that maps providing some degree of interactivity are growing in popularity. The ability to interact with a map (e.g., zoom in for greater detail, zoom out for context, add or change map symbols) allows users to explore spatial patterns and trends and leads to understanding about the true nature of a geographic phenomenon or process [11]. In short, “insight is formed through interaction” [32]. However, there is also evidence that too many options for interaction may act to inhibit use of an interactive map or may confuse the point of a visualization or map [5,11].
Research in web mapping has also looked at its relevance to education, with many studies affirming the effectiveness of web GIS and mapping as a tool for enhancing student learning, including improving data analysis, increasing cultural awareness, and improving spatial thinking [33]. All of this affirms the potential of story mapping for educational purposes.
2. Methods
The online Wyoming Student Atlas [34] was developed as a series of digital story maps based on the following considerations: studies on data-driven storytelling, digital storytelling, place-based learning in education, interaction with web maps, and an evaluation of existing story map technologies for creating and hosting story maps. ESRI’s Story Map platform was ultimately chosen to develop the atlas, after assessing the system frameworks of seven story map platforms. The following sections detail the atlas design and development in these areas: (1) transitioning from a paper atlas to an interactive, web-based atlas; (2) choosing an appropriate story map technology for creating and hosting the atlas and the story map system framework; (3) organization of the atlas; (4) types of interaction; (5) geovisual storytelling methods for education; and (6) evaluation methodology of the atlas story maps.
2.1. Transitioning from a Paper Atlas to an Interactive, Web-Based Atlas
The Wyoming Student Atlas [35] was first published in 2014 as a paper atlas with 55 full color pages. The dimensions of the paper atlas are 9 × 12 inches (22.8 × 30.5 cm), large enough so that a page could include one large map at a scale of 1:3,200,000, along with a legend, one or two paragraphs of text, one or two photographs or graphs, and sometimes a smaller map for comparison. Nearly thirty large-format maps and many other smaller maps cover thematic topics related to the natural environment, history, socioeconomics, and culture of Wyoming. The purpose of creating a student atlas for a specific region (Wyoming, a state in the USA), was twofold. The atlas was developed as a resource for Wyoming classrooms in the teaching of the natural environment, history, economics, and culture particular to the state of Wyoming. The atlas was also developed to achieve the goal of national geography standards [36] for educators and students: to recognize the central importance of maps to the discipline of geography and to be able to construct arguments about the effects of spatial context. While maps or atlases from anywhere in the world can be used for this second goal, maps of the region where the students live are particularly relevant in linking local and regional context to national and global contexts [37,38]. The Wyoming Student Atlas is currently in its 3rd printing, with more than 12,000 copies distributed to classrooms across the state of Wyoming.
A paper atlas is immediately available for teachable moments, and does not require technology, Internet access, or technology skills [37]. Additional benefits can be realized with an interactive, digital atlas. A digital atlas does not wear out with regular use like paper materials. Updates to the content (especially important with changing economic and political conditions) are less expensive in a web-published format than a paper format. Interaction with digital maps and material provides the users with the possibility of engaging with special themes of the landscape in different and more in-depth ways [39]. For instance, the ability to zoom in provides more detail than can be seen on a 1:3,200,000 scale printed map. Pop ups that appear when parts of the map are clicked on provide more textual information than can be provided via labels on a paper map, as well as more photographs and charts. Additional maps can be included without extra printing cost, allowing more connections to be made between thematic maps at the regional level with maps at the national or even global scale.
An important consideration in transitioning the paper atlas to an online, interactive atlas was preserving the high cartographic quality of the original paper maps. Careful consideration went into the amount of generalization and selection of color for both the background and foreground of the maps for the paper publication, as well as labelling, types of symbolization, and types of classification. Consideration was also given to the readability of the maps and associated images and text with respect to the age range of the students primarily targeted for this publication, ages 9–14 (USA grades 4 through 8).
2.2. Story Map Technology for Creating and Hosting the Atlas
Several online, interactive student atlases have already been created using story map technology [17,18]. Story map web platforms allow users to upload data, make maps, and integrate them in an ordered format with accompanying text, photographs, and other types of graphics. Story map templates provide a range of different layouts and options such as timelines. Organizations providing tools for creating and interacting with story maps include ESRI Story Maps, Knight Labs StoryMap.js, CartoDB Odyssey, Open Knowledge Lab TimeMapper, MapMe.com, and MapStory.org [40,41,42,43,44,45].
We focused on three criteria for choosing a story map provider: (1) an option to share maps and data as well as stories; (2) high quality web cartography with the ability to re-create the wide range of symbols and thematic techniques used in the paper version of the atlas; and (3) ability to build and customize maps and story maps without programming, so that more time could be focused on content instead of delivery.
Two of the organizations providing story map tools, MapStory.org and ESRI Story Maps, also provided an option to share maps and data. This was considered a top priority pertaining to story mapping for educational purposes, because educational research has shown that the value of the storytelling lies as much in the creation of the story as the presentation of the story. We wanted educators and students to not only have access to a high quality atlas, but also have access to all the data and maps used in the atlas so that they could create stories of their own. MapStory.org provides a repository of geospatial data (“story layers”) that can be added to or modified and then used to build map stories. Because anyone can contribute to this geospatial data repository, similar to the principles of Wikipedia, MapStory.org calls itself “the free atlas of change that everyone can edit” [45]. MapStory.org is a non-profit foundation; ESRI is a commercial vendor providing a similar repository of shared data and maps. ESRI’s ArcGIS Online, which includes their tools for story mapping, has been described as an “atlas in a box” solution, where users “just add data and stir” [46]. ESRI provides ArcGIS Online organizational accounts free to USA schools and to schools worldwide through a network of international distributors [14]. ESRI’s Story Map platform is free for anyone to use, but access to the ArcGIS Online organizational structure (free for schools) extends many more advantages, such as hosting larger sets of data as web map services. However, one potential disadvantage to using a commercial platform for development is the possibility of the company imposing changes to pricing or their hosting structure in the future.
ESRI’s Story Maps product was chosen for the delivery of the online version of the atlas because it met the three priorities for development. Because the atlas was developed for schools, all the advantages of ArcGIS Online were free with a school license. This included the ability to publish complex cartographic representations to web map services that users can then interact with (zoom into or click on for more detail). Many of the maps from the paper version of the atlas, created with ESRI’s ArcGIS desktop software, could be published directly as an ArcGIS Online web map without having to change or simplify their cartographic representations. An example of a complex cartographic representation in an atlas story map is shown in Figure 1.
Other commercial services (such as Mapbox, which provides web maps for Knight Labs’ StoryMap.js, and CartoDB, which provides web maps for Odyssey story maps) provide excellent web-based cartographic representations which can used to build story maps, but they lacked organizational structure for sharing data and maps similar to ESRI or MapStory.org. One notable exception to cartographic quality is the Web Mercator map projection used by most web mapping services. The Web Mercator projection has advantages specific to web mapping, but is not as accurate as the Lambert Conformal Conic projection in portraying the shape and area of mid-latitude regions like the state of Wyoming, which we considered to be a disadvantage with using current web mapping technology for publishing an atlas.
All of the thematic elements of the story maps were converted from maps created in ArcGIS Desktop for the paper atlas to ArcGIS Online web map format. The base maps (including topography, shaded relief, and reference features such as roads and boundaries) used in the story maps were provided by ArcGIS Online. Using ArcGIS Online base maps allowed seamless movement from Wyoming-specific areas to adjacent states and zooming out to a national or global context.
The atlas story maps were tested on desktop and laptop computers, iPad and Android tablets, and iPhone and Android smartphones. Navigation of the maps is slightly different with touch screens than with computers using a mouse, but with the widespread use of touch screens in recent years, most users are familiar with the differences. Several changes in functionality were noted on smartphones as a result of the smaller screen size, most notably the text appearing on a separate screen, so that a user has to click a “back” link to return to the map. A study on the efficacy of using school atlases on smartphones noted challenges pertaining to thematic maps, because the spatial relation between the represented areas or phenomena can become harder to appreciate simultaneously due to the small screen size. In addition, other methods of thematic representation (e.g., charts) are not easy to read on maps viewed in these displays [47]. Due to the changes in functionality and challenges of interpretation with a smaller screen size, it is recommended that the atlas story maps be used on a screen size no smaller than a diagonal measurement of 9.7 inches (24.6 cm).
2.3. Organization of the Atlas Story Maps
A story map typically consists of 5–6 pages/slides in order to hold a reader’s interest. Knight Labs StoryMapJS [41] recommends no more than 20 slides for a reader to navigate through. With the original paper atlas at 55 pages and over 100 maps, several ways of organizing the atlas into story map format were considered. Examples of story maps with more than 20 pages do exist, often with a hyperlinked table of contents to allow users to choose pages of interest to look at, similar to a paper atlas. Another form of a story map atlas is a collection of separate story maps. The California Atlas 2.0, first produced as a paper atlas, now has eight story maps corresponding to selected themes from the paper atlas [18].
Keeping all the pages in a single, ordered story map may have some advantages for a historical atlas with an ordered chronological narrative [24]. Chronological history is one of the four major themes in the Wyoming Student Atlas, but the maps pertaining to the natural environment, socioeconomics, and culture are not in any sort of chronological order. Another consideration is that educators commonly use only one or two pages of the atlas per lesson. Therefore, the online atlas was created as multiple story maps, each linked to a table of contents. Twelve story maps correspond to different themes related to the natural environment and twenty-four story maps correspond to human geography (history, socioeconomics, culture). Each story map is from four to eight pages and most follow a narrative progression within the story map (rather than the atlas as a whole), with connections drawn between the text and maps on different pages. For example, on the first page of the land cover and ecoregions story map, text and pop ups on a map allow users to explore the relation between precipitation and ecoregions. The second page follows with connections between precipitation and vegetation types shown on a land cover map. The third page reinforces and expands on this relationship by zooming out from Wyoming to the United States to illustrate even more dramatic changes in precipitation and corresponding ecoregions and land cover.
A table of contents web page and an online digital book version of the Wyoming Student Atlas contains links to all the story maps in the atlas, as well as links to data details and a help document. The data details for each story map include metadata about sources of data used and links to all the web maps used in each story map. These web maps can be used independently of the atlas for more exploration and learning opportunities. For instance, students and educators can copy a web map, add other spatial data, add annotations, or change symbology in the web maps. They can save their personalized copy to their own educational account and use them to build their own story maps. The atlas web maps are shared in the ArcGIS Online repository for use by other web mappers. The spatial data used to create the maps in the atlas is also stored via ArcGIS Online and can be accessed in a downloadable format for use in other software such as Google Earth or desktop GIS.
2.4. Types of Interaction in the Atlas Story Maps
Maps on the web that can be used within story maps may be either static, interactive, or dynamic. Static maps are images that do not change. Interactive maps are changed by a user, whereas dynamic maps reflect changes evoked by the system, such as animations or updates to the map’s content. The atlas uses several static maps within the story maps, scanned images of models of paleogeography and original historical maps. However, the bulk of the web maps are interactive, for the advantages of being able to zoom into the map to reveal more detail and to pop up additional information by clicking on the map. In order to adapt to zooming in and out, labels and annotation on the web maps (both base maps and thematic overlays) were adjusted to be readable at different zoom levels, and different layers of data were made visible at different zoom levels to make the level of generalization appropriate to the map scale. The atlas also uses several animations to show changes in patterns over time.
The ESRI story map “journal template” was used for all the atlas story maps to provide consistency in layout (such as the text and the legend always appearing in the same place) and simplicity in navigation between pages. In addition to offering various story map templates, ESRI’s Web AppBuilder [48] offers many web app templates that can be embedded within a story map. These templates allow specialized interactions such as animated or manual timelines; the ability to swipe or slide across two maps to compare changes before and after an event; and an option to divide the map space into two, three, or four viewing areas for comparing different maps. These last two templates were particularly useful for creating a story map page similar to an atlas page that has more than one map to illustrate a comparison, such as temperature variation across the state in four different seasons. However, the embedding of such apps into the story map structure does involve loss of some screen space, possibly crowding or cluttering the layout or making it more difficult to interact with the map.
2.5. Geovisual Storytelling for Education
The storytelling structure of the atlas story maps for educational purposes was informed by three areas of study: (1) use of geospatial technologies such as digital globes and web maps in education; (2) data-driven storytelling in journalism, particularly insights from data journalists that specialize in maps; and (3) place-based learning strategies.
A review found that virtually all studies of middle school learning through inquiry with geospatial technology have found improved achievement, attitudes, and self-efficacy [49]. Using examples of lesson plans developed for use with geospatial technologies, such as “Geoinquiries” [50], the story map text includes instructions for interacting with the map in order to explore spatial patterns and questions to prompt thought about possible explanations.
Second, insights from journalists that specialize in maps indicate that personalization and localization are two important aspects of storytelling [5]. Interactive maps that can change based on specific input from a person (personalization) are sometimes used in journalism to engage the reader. A connection from journalism to education can be drawn here, as personalization is one of the key aspects of digital storytelling in education. In digital storytelling, students are encouraged to share their perspective (and sometimes even their voice) to personalize the story they are creating [31]. Localization is another cartographic journalism technique that assumes in some stories that the most important place on a map is the location of the reader [5]. An example of localization in a story is the reader selecting their location, or another location of interest to them, resulting in a map with a theme and annotation related to their selected location. Both personalization and localization are based on the idea that readers want to know about what is happening around them and how a story relates to their lives and surroundings; they want to know how their location or demographic fits together with the whole. Some of the atlas story maps were developed with this idea of localization in order to explore whether this aspect of storytelling would increase student engagement with the lesson content. Some of the story maps were also developed for students to personalize, prompting them to add their own annotations to the map.
Research in place-based learning also informed the development of the atlas story maps. A trend in developing school atlases specific to a region or country has been noted [38], in particular a remarkable number of local atlases produced for education in Brazil. Studies have confirmed the efficacy of using local atlases, including a web-based prototype, as educational resources [38]. Benefits were also found in teaching from the students’ reality in a local context and working up to a global scale. Research in place-based learning in the geosciences demonstrates that local context—what is familiar to students and instructors—gives relevance to global concepts and practices that might otherwise appear disjointed to students [51]. These place-based learning strategies were implemented in two ways in the atlas story maps.
The interactive maps in the atlas allow students to zoom into places that are familiar or meaningful to them, such as their home neighborhood, school neighborhood, or locations their class has visited together during a field trip. A page was included in some of the atlas story maps, shown in Figure 2, that prompts students to locate a place of interest to them on the map (by entering a name or address of a location) along with instructions to explore features near their location that are related to the story map theme (such as earthquake events).
In addition to emphasizing connections with local areas, a second place-based learning strategy was implemented in some of the atlas story maps. Following a page with a thematic map of Wyoming, a subsequent page in the story map, shown in Figure 3, included the same or similar theme at a national or even global scale (such as locations of major earthquakes). Providing a progression of maps at different scales allows students to make connections between their region (and sometimes their locality) with much larger regions, and hypothesize about differences in patterns seen at different scales.
2.6. Evaluating the Atlas Story Maps
Two stages of evaluation were undertaken to assess the atlas story maps. The first stage was a preliminary assessment of the design of the story maps in order to fix any obvious problems and to measure how long students needed to complete required tasks. The second stage focused on assessing student engagement with the story maps in a learning environment. The Institutional Review Board of the University of Wyoming approved all the materials and methods for use in the classrooms. The requirement for parental permission was waived because the research methodology was based on normal educational practices and did not involve manipulation of the students’ behavior.
In the first stage, 14 students age 9–10 years (fourth grade) used iPads to interact with several atlas story maps pertaining to energy resources in Wyoming. Students were given specific tasks to perform and questions to answer. The researcher observed the students completing the tasks in order to find out how long it took them to complete certain tasks. Observation also helped identify problems with the understanding of the content of the text and the maps and difficulties interacting with the maps. Students used several types of interactions: zooming, panning, clicking to pop up more information, “swiping” to view differences between two maps, using a “near me” tool to find features near a specified location, and using a measuring tool to measure distances between features on a map. As a result of these observations, adjustments were made to all the story maps to improve understanding and interaction. For instance, some interactions like swiping worked well for aerial photographs showing change in the landscape from one time period to another, but students had difficulty answering questions when swiping between two thematic maps, so an adjustment was made to place the two thematic maps side by side for more direct comparison.
The second stage was an evaluation of student engagement with the adjusted atlas story maps. The goal of the evaluation was to test two hypotheses: (1) Students will be more engaged interacting with maps in an atlas story map than with non-interactive maps in a traditional atlas, and (2) Students will be more engaged with thematic content in an atlas if they can explore the content in a familiar, local context or at a broader, global context than if they can only explore the thematic content at one pre-defined scale. The evaluation was also designed to answer a research question related to the second hypothesis: which type of interaction, a “near me” tool or a measuring tool, is more engaging for students exploring content in a familiar, local context?
Student engagement, for the purposes of this study, is specific to the level of engagement within a single activity (as opposed to engagement with a whole class or school). Engaged learners are intensively and extensively involved in their learning tasks, and there are behavioral, emotional, and cognitive aspects of engagement [52]. This study does not attempt to identify these different aspects of engagement, but is based on theory that student engagement includes both self-perception and behavior, therefore self-reported and observable indicators are appropriate [53]. Helping students engage in learning is an important issue for research in instructional technology, and there is ongoing research on measures of student engagement to evaluate the efficacy of instructional interventions [53]. Measures of engagement can be in the form of scaled surveys, open-ended question surveys, interviews, and observations. Due to time limitations for evaluation within the classrooms, a survey was the most efficient method of measurement for this study. The survey was developed to assess student engagement with the atlas story maps using an ordinal Likert-type scale. Examples of surveys to assess student engagement with instructional technology [53] were used to inform the development of the survey.
Other types of instruments have been used to determine if student engagement with instructional technology has a positive effect on content acquisition, or a student’s ability to recall learned factual information. Instruments such as pretests, posttests, and interviews can be used to evaluate content acquisition, but this study focused only on the aspect of student engagement.
The methodology for the evaluation of student engagement with the atlas story maps was as follows. The researcher provided a short demonstration of how to navigate through the story map pages and how to interact with the web maps (zooming, panning, clicking for more information, referencing the legend, and using the “near me tool” and “measuring tool” interactions). Then students worked in pairs for 20 minutes on laptops and followed prompts in a story map. Seven questions in the text of the story map prompted students to explore the maps in order to respond with answers. The time estimated for the students to complete the prompts was based on observation of students interacting with the story maps in the first stage of evaluation of the story maps. Time allocated for each task varied from one minute to two minutes. Two additional prompts were provided for students who advanced through the story map faster than average.
Two classes with students aged 9 to 10 years (fourth grade) participated in the study. Students had some previous instruction with mapping using Google Earth and previous experience using traditional, paper student atlases. One class used a story map about earthquakes and faults and the other class used a story map on the history of exploration in Wyoming. Ideally, the same story maps used in the preliminary assessment should have been used again in subsequent assessments but teachers preferred to use story maps with content related to what their classes were currently learning. While the theme and content was different, all story maps used in these assessments had the same number of pages, the same layout, and the same types of interactions with the maps. The teachers reviewed the story map content to make sure it was appropriate and understandable for the students. Both story maps contained three prompts to explore patterns of events by comparing different maps and legends, zooming and panning, and clicking on the map for more information. These three prompts were provided in order to test the hypothesis that students will be more engaged interacting with maps in an atlas story map than with non-interactive maps in a traditional atlas. Both story maps contained a prompt to explore earthquakes and historical events in a local, familiar context using a “near me” tool, to determine if exploring thematic content at a local, familiar context is engaging to students. The earthquakes story map also contained a prompt to zoom out to a national scale to compare patterns. These prompts were provided in order to test the hypothesis that students will be more engaged with thematic content in an atlas if they can explore the content at familiar, local context or at a broader, national or global context than if they can only explore the thematic content at one pre-defined scale.
Six classes with students of ages 11 to 12 years (sixth grade) also participated in the study. The instructor had not provided any previous instruction about mapping although most of the students said they were familiar with Google Earth and/or Google Maps. These students also had previous experience using traditional, paper student atlases. The six classes used the story map about earthquakes with the same prompts as the two classes described above. Four of the six classes used a version of the story map with a “near me” tool to locate earthquakes in a local, familiar context; two of the classes used an identical version of the story map except that the “near me” tool was replaced with a measuring tool for students to explore earthquakes in a local, familiar context. These two different types of interaction were provided to evaluate the research question: which type of interaction, a “near me” tool or a measuring tool, is more engaging for students to explore content in a familiar, local context? For instance, will the potential engagement a student experiences from zooming in and seeing local, familiar places on a map (a neighborhood park, playground, school, store, etc.) be extended to other nearby features that are related to theme of the story map, such as earthquake events that have happened within 50 miles? These specific tools were chosen because both tools could be used at a local, familiar context to make connections with nearby features related to the theme of the story map.
The methodology to test the two hypotheses was to have students and educators fill out a survey after using the atlas story maps. The survey instrument required responses to eight statements: five statements specific to how the story map prompted students to explore the content, and three general statements about interacting with maps, including one comparing it to non-interactive maps in a traditional atlas. Responses were recorded using an ordinal Likert-type scale, where students could choose between five options to express how much they agreed or disagreed with each statement (absolutely no, no, not sure, yes, absolutely yes). The survey is provided in Appendix A.
The methodology to test which type of interaction is more engaging for students exploring content in a familiar, local context was based on observation of students, their answers to the prompts recorded on worksheets, and their responses to the survey. Observations of the students were recorded by the researcher with notes, such as “student needed help using the measuring tool” or “student did not refer to the legend until prompted”. Students’ recorded answers to prompts were used to identify possible issues, with a high percentage of incorrect or unanswered questions indicating that the interaction was difficult or confusing and therefore less likely to engage the student. Students’ responses to survey statements were also evaluated. For instance, if a large percentage of students needed help with an interaction, or answered questions incorrectly or not all, was there a corresponding lower scale selected in the survey?
3. Results
The results are organized first by the preliminary assessment of the design of the story maps, and second by the evaluation of student engagement with the story maps in a learning environment.
3.1. Preliminary Assessment of Atlas Story Map Design
The purpose of the preliminary assessment of the atlas story map design was to identify how long students needed to complete specific tasks; to identify any problems with understanding the text or maps; and to identify any difficulties interacting with the maps. Table 1 summarizes some issues encountered with the elements of the story maps and methods that were used to resolve the issues. Some issues could be resolved by an adjustment to the design of the story map as in the case of repositioning photographs embedded in the story map text. Other issues were resolved by adjusting the web maps, such as adding boundary boxes to help students locate specific areas again if they zoomed out too far. Limits could have been set to prevent students from zooming in or zooming out too far, but this would also limit students in engaging with the story map content by exploring local, familiar areas. Some issues specific to interactive tools could not be adjusted because these are “out of the box” tools provided by ESRI’s Web AppBuilder for ArcGIS and would require significant programming to adjust. In these cases, a demonstration in the correct use of the tool was necessary before the activity.
3.2. Assessing Student Engagement with the Story Maps in a Learning Environment
The results in this section are organized by the following research questions related to the two hypotheses:
- Is an interactive atlas story map more engaging than a non-interactive, traditional atlas?
- Is interaction at multiple scales in an atlas more engaging than interaction at one pre-defined scale?
- Which type of interaction is more engaging for students exploring content in a familiar, local context, a “near me” tool or a measuring tool?
- Do teachers feel that their students are engaged by interacting with the atlas story maps?
3.2.1. Is an Interactive Atlas More Engaging Than a Non-Interactive, Traditional Atlas?
The first three statements in the survey addressed student engagement with the atlas story maps. A high percentage (86.7%, n = 15) of students using the earthquakes atlas story map responded positively (“yes” or “absolutely yes”, scales 4 and 5) to the statement “I liked being able to interact (zoom, pan, and click for more information) with the maps in the atlas”, with a median scale of 4 (a mean was not calculated since this was an ordinal scale). For the statement “It was easy for me to learn how to use the atlas”, 93.3% responded positively with a median scale of 5. For the statement “I would rather use the interactive version of the atlas instead of paper maps or a paper atlas”, 86.7% responded positively with a median scale of 5. Percentage of students’ responses, medians, and frequencies are shown in Table 2.
Percentages of positive responses were similar with older students (ages 11–12) using the earthquakes and story map for the first two statements (see Table 2). This larger sample size had very similar medians. However, a somewhat lower percentage of the students (69.6%, n = 69) responded positively to the statement “I would rather use the interactive version of the atlas instead of paper maps or a paper atlas”. This sample of students ages 11–12 did not include the two classes that used the earthquakes story map with a different tool for interacting with the map at a local, familiar context (results from these students are provided in Section 3.2.3).
Results were also very positive for the class of students ages 9–10 that used the historical exploration story map (n = 15). For the statement, “I liked being able to interact with the maps”, 86.7% of the students responded positively. For the statement “It was easy for me to learn to use the atlas”, 80.0% responded positively. A somewhat lower percent (66.7%) of the students using the historical exploration story map responded positively when asked if they preferred the atlas story map to a traditional paper atlas.
3.2.2. Is Interaction at Multiple Scales in an Atlas More Engaging Than Interaction at One Pre-Defined Scale?
Three of the survey statements addressed whether students were interested in exploring areas local or familiar to them (such as their neighborhoods or field trip locations). These statements were as follows: (1) I liked using the atlas story map to find my town (or a place within my town, like my school or neighborhood); (2) I liked using the atlas story maps to find another place that I’ve been to, will be going to, or that I am interested in (like a field trip or vacation); (3) Once I have found an area of interest to me using the atlas story map, I am likely to continue exploring that area and identifying other interesting features nearby. (Abbreviated versions of these statements are used in Table 3).
Students were prompted to locate the town where they lived on the map and find out what earthquakes had occurred nearby. They were also prompted to find another town where they had gone on a field trip to compare how many earthquakes had occurred there.
Younger students using the earthquakes story map had a high percentage of positive response (“yes” and “absolutely yes”) to the statements about local context. For the first statement, 86.7% responded positively, followed by 80.0% and 73.3% for the next two statements. Older students (ages 11–12) had lower but still mostly positive responses to the statements about local context. Percentages of positive responses (‘yes” or “absolutely yes”) were 63.9%, 71.1%, and 55.2% respectively for these same statements, as shown in Table 3.
The last two survey statements evaluated engagement with local and global context in relation to content. Students were prompted to use the “near me” interactive tool to find events (earthquakes in the first class, historical events in the second class) near their town and a familiar location where the class had gone together on a field trip. On the survey, the students were asked to respond to the statement “I think seeing earthquakes near my town will help me remember what faults are and how they cause earthquakes”.
Students were also prompted to zoom out and view earthquake events at a national and global scale and then asked to respond to the statement “I think seeing where earthquakes have occurred in Wyoming in comparison to where they have occurred in the rest of the United States or the world will help me remember why earthquakes happen more frequently in some places”.
Younger students (ages 9–10) responded positively to the statement relating local context to the content of the lesson, with 80.0% answering “yes” or “absolutely yes”. For the statement relating local patterns to national and global patterns of earthquakes, 86.7% answered “yes” or “absolutely yes. The older students had somewhat lower positive responses, with 62.2% responding “yes” or “absolutely yes” to the statement relating local context to the content of the lesson, and 53.4% responding positively to the statement relating local patterns to national and global patterns, as shown in Table 3.
For the class of younger students (ages 9–10) that used an atlas story map about historical exploration in Wyoming, the statement in the survey relating to this context was changed to “I think seeing what historical events have occurred near my town will help me remember some of Wyoming’s history about early explorers and fur traders”. Sixty percent of the students responded either “yes” or “absolutely yes” to this statement. Since this class focused on history specific to Wyoming, they were not asked to compare local patterns to national or global patterns or to respond to a statement about such patterns in their survey.
3.2.3. Which Type of Interaction Is More Engaging for Students Exploring Content in a Familiar, Local Context?
Four classes of older students (n = 83) used a version of the earthquakes story map with a “near me” interactive tool that listed earthquakes within a 5-mile to 50-mile radius of a location chosen by the student. Two classes (n = 35) used the same version of the earthquakes story map except that the “near me” interactive tool was removed and students were given instructions to zoom to a familiar, local area and then use an interactive measuring tool to find distances of nearby earthquakes.
The Mann–Whitney test for median comparison was used to determine if there was a significant difference between the two groups in responses to all survey statements. The Mann–Whitney test is a nonparametric test that allows two groups to be compared without making the assumption that values are normally distributed. The test is appropriate for ordinal data such as the Likert-type ranked scales used in this study. A two-tailed hypothesis was used with 0.05 significance level, and results are shown as p-values for each survey statement in Table 4.
The Mann–Whitney test showed significant differences in responses between the two groups for six of the eight questions, indicating that the type of interactive tool used to explore content at a local, familiar context can significantly affect students’ perceptions. This significance is also seen in the answers students gave to seven questions while using the earthquakes story map. While 74% of the students using the “near me” interactive tool were able to answer the prompt to find out how close earthquakes were to their location, only 52% of the students using the measuring tool were able to answer the same prompt, implying that the students found the required interaction more difficult or confusing to use. This may have contributed to the lower percentage of positive responses to survey statements, as only 55.9% responded positively to the statement “I liked interacting with the maps in the atlas” compared to 80.3% of students using the “near me” tool. Similarly, only 58.8% students using the measuring tool responded positively to the statement “It was easy for me to learn to use the atlas” compared to 82.9% students using the “near me” tool. For the statement “I would rather use the interactive atlas instead of paper maps or paper atlases”, 55.9% of the students using the measuring tool responded positively, compared to 69.6% of students using the “near me” tool.
Percentages of students using the measuring tool interaction were mostly negative or uncertain to the statements about local context. Only 42.9% responded positively (“yes” or “absolutely yes”) to liking to use the atlas to find their town, 45.7% responded positively to liking to use the atlas to find another familiar place, and 37.1% answered positively to continuing to explore a familiar place. Only 34.3% responded positively to the statement, “I think seeing earthquakes near my town will help me remember what faults are and how they cause earthquakes”. Only 35.3% responded positively to the statement, “I think seeing where earthquakes have occurred in Wyoming in comparison to where they have occurred in the rest of the United States or the world will help me remember why earthquakes happen more frequently in some places”.
While 100% of the students ages 11–12 finished the first six prompts and answered the questions, 51% of the students did not complete the last prompt, which appeared in the story map after the students were asked to zoom into their local area or another area familiar to them and find out how many earthquakes had occurred nearby. Based on observation, students became preoccupied with zooming into their neighborhoods, looking for their homes or friends’ homes. Clearly, providing this personalized place context was interesting to the students, but in some cases also distracting from the content of the material.
3.2.4. Do Teachers Feel That Their Students Are Engaged by Interacting with the Atlas Story Maps?
The teachers of the classrooms involved in this study all expressed positive viewpoints of the atlas story maps as an educational resource. One of the teachers developed an interdisciplinary curriculum using the energy resources story maps and shared the curriculum with other teachers at a curriculum development workshop. All four teachers said they would use the atlas story maps again in their classes. Three of the teachers responded to the same survey as the students in their classes, but were asked to respond to the statements with respect to their opinion of their students’ engagement. Responses to all the statements were either “yes” or “absolutely yes” with one exception: one fourth grade (ages 9–10) teacher responded with “not sure” regarding the statement about local context resulting in student engagement and understanding of content.
4. Discussion
One of the primary differences between a story map atlas and a traditional paper atlas is interaction with maps, given that both story map atlases and paper atlases provide text alongside the maps in some manner to clarify or expand on the themes displayed in the maps. Thus interaction was a major consideration in evaluating student engagement with atlas story maps.
Studies have shown both positive and negative aspects relating to interaction, both with maps and stories. Too many options for interaction may act to inhibit use of an interactive map or may confuse the point of a visualization or map [5,11]. Kosara [54] states that stories are traditionally told without interaction and are meant to be delivered in their entirety. Thus, there is a tradeoff between interaction and focus: interaction tends to distract from the story. To avoid losing focus, one suggestion is to provide interaction at the story’s end to open the way for continued exploration in the topic.
When students were presented with the opportunity to locate their town or neighborhood within the story maps, many continued exploring their local area instead of proceeding with the final prompt in the story map. Placing the opportunity near the end of the story map helped retain the students’ focus on the content, though a few students skipped straight to this part. One of the teachers noted that an instructional method with specific time limits for each page of the story map would also help keep students more focused. However, not all interaction appears to distract from focus. The text alongside the map provides a clear, straightforward way to prompt students to interact with a map in order to find the answer to a question, in effect combining the ease of a guided tour with the engagement of a scavenger hunt game. Very simple instructions and interactions (e.g., “zoom to this location to find _______” or “click on these pins to find which one is _____”) keep focus. More complicated multi-step instructions and multi-step interactions tend to result in distraction or confusion. Thus, carefully designed and constrained interaction in story maps confirms the advantages to interaction noted by Roth [11]: “the ability to interact with a map… allows users to explore spatial patterns and trends and leads to understanding about the true nature of a geographic phenomenon or process”.
Results from the surveyed students showed that the measuring tool interaction resulted in less positive responses to story maps, though additional research in usability and user experience is needed to determine more specifics about why this particular interaction resulted in negative responses. It was not clear from observation whether the students found the measuring tool more difficult to use, more confusing, more time-consuming, or simply less enjoyable. Students who used the measuring tool interaction had a lower percentage of positive responses to interactivity and ease-of-use, whereas students using the “near me” tool responded more positively to statements indicating that they liked interacting with the story map and that they preferred an interactive atlas to a paper atlas. There is certainly a place for more complicated (and therefore potentially more powerful and revealing) types of interaction, as evidenced by considerable research in the use of geographic information systems in educational situations [49]. But in the specific case of a digital atlas, which students are likely to use as a reference or explore with minimal guidance, the best practice is to limit interactivity to a small range. Roth [55] points out that tools and technology that have seen popular uptake make use of a small range of the interactive functionality available for maps and visualization, which serves as a good model for atlas story maps.
Another difference between a story map atlas and a traditional paper atlas is the potential for users to explore the maps in more detail at different scales. The story map text prompted students to explore a map theme at a local scale by asking them to find out how many earthquakes had occurred near their town and how many earthquakes had occurred near a town most had visited on a field trip (areas local or familiar to the students). The story map text also prompted students to zoom out to national or global scale to compare the locations of earthquakes at different scales. Younger students (ages 9–10) had the highest positive response to local context in the atlas story map. Older students (ages 11–12) who reported positive responses to interacting with the atlas story map also had more positive responses to local context than negative or uncertain responses. Both of these groups also had a majority of positive responses to statements relating local context to the content in the story map and the value of relating local and global context to content. This supports evidence found from other studies. Da Silva Ramos [38] found advantages in teaching from the students’ reality in a local context and working up to a global scale. Semken’s [51] research on place-based learning in the geosciences demonstrated that local context—what is familiar to students and instructors—gives relevance to global concepts and practices that might otherwise appear disjointed to students. However, the group of students who had been asked to use a potentially more difficult or confusing type of interaction had more negative or uncertain responses to these statements. The mixed results indicate the need for more research in this area. Future study should also use different instruments, such as pretests and posttests, for evaluating the use of local context to increase content acquisition. The same is also true for evaluating the effectiveness of comparing different scales (local to global) to increase content acquisition.
In addition to interaction with the map, interaction with the text is also important in story mapping. Graves [56] notes that users are more likely to engage in a story that sustains their interest, so a variety of text, maps, graphs, and video or audio clips maximizes its overall content. However, careful attention must be given to placement of photographs with the text. Some students stopped reading the text after encountering a photograph, especially when additional text below the photograph was not visible unless they scrolled down past the photograph. In Grave’s [56] study involving user assessment of a story map, users also identified not being able to see all the content due to overflow as an issue. The addition of scrollbars to indicate the need to continue scrolling down to read more may alleviate some of this problem, or a more strategic placement of photos where they do not interrupt the text. A recent solution to the issue of fitting text, photographs, or other images into the story map schema has been implemented by Google Earth’s Voyager [57], where photographs and images are given their own “panel” in the story map, close to the text but not interrupting the text. This photograph panel can be set up as a slide show to show multiple photos, images, videos, and animations.
This study provided some insight into students’ interaction with maps and text in atlas story maps, but more research is needed pertaining to the content of the text. The text in the story maps was adapted from the paper version of the Wyoming Student Atlas with modifications to prompt students to explore the maps by zooming, panning, and clicking for more information. Digital text was written using inquiry-based lesson plans and data-driven storytelling techniques as models. The role of the text in the story map was to provide definitions, background, and supporting details to the maps, and to guide students in exploring the map to find patterns and connections between locations in order to highlight conclusions. Future research opportunities expanding on this work could focus on evaluating the text in story maps used for educational purposes. One study has already found that teachers view story maps as a tool to better present material that meets academic standards [12], and this indicates the importance of evaluating story maps—both maps and text—as an academic resource.
This study used surveys to evaluate student engagement with story maps, but future research should expand to look at other measures of effectiveness in using story maps for educational purposes. A weakness with surveys (both children and adults) is the tendency of respondents to give more or less superficial responses that appear reasonable or acceptable, without going through all the cognitive steps involved in an optimal question-answering process. Low motivation, low cognitive ability, and difficult or poorly worded questions or statements are the main causes for respondents providing a merely satisfactory response instead of a carefully considered optimal one [58]. To minimize the possibility of too difficult or poorly worded statements, the survey statements were given to the educators in charge of the classes ahead of time to assess their appropriateness. Another consideration with regard to surveys of children is the variability in the still-developing cognitive, communicative, and social skills of children. These differences can lead to the use of different strategies in answering statements and therefore to differences in the reliability of responses obtained in surveys [58]. Given these weaknesses associated with surveys, future work with educators and students in this area should use other instruments for evaluating student engagement with the story maps, such as tracing user activity [20] and interviews to measuring user experience [59]. Future research should also be directed towards comparing students’ use of story maps with other content delivery methods. One of the weaknesses of this study was that students were asked if they preferred using an interactive atlas to a traditional paper-based atlas, but students were not given an opportunity to use a traditional paper-based atlas for comparison.
An important criterion for selecting the story map technology for the digital version of the atlas was the option for educators and students to build their own story maps from the same web maps used to create the atlas story maps. The existence of several national and international story mapping competitions for students indicates a rising trend in students creating their own story maps, and the related practice of digital storytelling in education has already demonstrated significant benefits in students creating their own stories for learning purposes [29]. We see future research related to students creating their own story maps for educational purposes as a natural extension to this study.
5. Conclusions
The goal of this study was to use digital story mapping to advance educational atlas design and to enable student engagement. Buckley [10] notes that perhaps one of the biggest challenges atlas makers face is that of “the conditioning of (younger) people to technology in modern times”. Flashy presentation and high-quality graphics are ever-escalating in movies, TV, video games, and even commercials, raising the standard for other media, including maps and atlases. Moving from a paper atlas to an online, interactive atlas provides an opportunity for a more engaging, interactive, and exploratory environment for learning, but also raises several challenges. One of these challenges is achieving a high quality digital product using the web as medium rather than paper as a medium. Online atlases should continue to play a role as premier collections of geographic information that meet the highest standards in order to bring together a coherent representation of an area [10]. Fortunately, current web mapping technology provides the means to develop high quality thematic maps and base maps, and research in web map cartography is addressing many issues that have arisen in the transition from paper maps to digital interactive maps [60].
Another challenge is determining an appropriate amount and type of interaction in an online atlas that engages students without distracting them from the purpose of the lesson. During observation of students interacting with the story maps, problems were noted with students getting distracted by the ability to zoom anywhere in the world, or zooming in and exploring their local area extensively instead of continuing to follow prompts in the story map. As a result of the survey and classroom observations, it was concluded that carefully designed and constrained interaction in story maps is important for student engagement. The results of the survey also indicate that interaction with the story maps allowing connections to local, familiar areas is likely to engage and interest students and potentially help them understand and remember content better; however, more research in this area using additional instruments of evaluation is needed to confirm this potential.
The transition from a paper atlas to an interactive atlas based on story map technology offers several benefits. First, more maps at different scales can be included for students to explore and make connections between patterns at a local or regional scale up to a national or global scale. Second, the atlas can be updated more frequently and cost-effectively through electronic publication rather than paper publication, and links to more materials can be incorporated. Finally, the web maps used in the atlas story maps can also be used by educators and students to create their own story maps, which will surely provide additional educational advantages.
Acknowledgments
Funding for this project was provided by the University of Wyoming President’s Office, the University of Wyoming Berry Excellence Fund, and the University of Wyoming School of Energy Resources. Additional support came from the University of Wyoming’s Department of Geography and the Wyoming Geographic Information Science Center, which provided funds for publishing in open access. The authors appreciate the many educators and students who provided feedback on the atlas. Approval was given for research conducted in classrooms by the University of Wyoming Institutional Review Board (IRB protocol #20171219JH01810). The authors also acknowledge the anonymous reviewers whose valuable comments and suggestions significantly improved this article.
Author Contributions
Margo Berendsen designed the atlas story maps, conducted the demonstrations of the atlas in classrooms and collected the surveys and observations on how students used the atlas. Jeffrey Hamerlinck and Gerald Webster provided intensive input and guidance on the development of the atlas. Margo Berendsen provided the first draft of this article; Jeffrey Hamerlinck and Gerald Webster contributed significantly to the revisions and finalizing of the article. Jeffrey Hamerlinck, Gerald Webster and Margo Berendsen jointly co-authored the print version of the Wyoming Student Atlas.
Conflicts of Interest
The authors declare no conflict of interest.
Appendix A
The following survey was provided to educators and students after using the earthquakes atlas story map. Alternative statements regarding different themes (e.g., history, energy resources) may be substituted for #4 and #5 depending on which story map from the Wyoming Student Atlas the class used.
Please take the following survey to let us know about your experience using the interactive Wyoming Student Atlas. For each statement, circle the answer that best describes your experience.
- I liked being able to interact with the maps in the online Wyoming Student Atlas (zooming, panning, clicking for more information).1. Absolutely no 2. No 3. Not Sure 4. Yes 5. Absolutely yes
- It was easy for me to learn how to zoom, pan, and click for more information in the online Wyoming Student Atlas.1. Absolutely no 2. No 3. Not Sure 4. Yes 5. Absolutely yes
- I would rather use the interactive computer version of the Wyoming Student Atlas in class instead of paper maps or paper atlases of Wyoming or the United States.1. Absolutely no 2. No 3. Not Sure 4. Yes 5. Absolutely yes
- I liked using the online atlas to find my town (or a place within my town, like my school or neighborhood).1. Absolutely no 2. No 3. Not Sure 4. Yes 5. Absolutely yes
- I liked using the online atlas to find another place that I’ve been to, will be going to, or that I am interested in (like a place our class visited for a field trip).1. Absolutely no 2. No 3. Not Sure 4. Yes 5. Absolutely yes
- Once I have found an area of interest to me using the online atlas, I am likely to continue exploring that area and identifying other interesting features nearby.1. Absolutely no 2. No 3. Not Sure 4. Yes 5. Absolutely yes
- I think seeing the earthquakes and faults near my town will help me remember what faults are and how they cause earthquakes.1. Absolutely no 2. No 3. Not Sure 4. Yes 5. Absolutely yes
- I think seeing where earthquakes have occurred in Wyoming in comparison to where they have occurred in the rest of the United States or the world will help me remember locations where earthquakes happen more frequently.1. Absolutely no 2. No 3. Not Sure 4. Yes 5. Absolutely yes
References
- Emerging and Recurring Data-Driven Storytelling Techniques: Analysis of a Curated Collection of Recent Stories (Microsoft Technical Report). Available online: https://www.microsoft.com/en-us/research/wp-content/uploads/2016/04/MSR-TR-2016-14-Storytelling-Techniques.pdf (accessed on 2 February 2017).
- Ho, Q.; Lundblad, P.; Jern, M. Geovisual Analytics Framework Integrated with Storytelling Applied to HTML5. In Proceedings of the 16th AGILE Conference on Geographic Information Science (AGILE), Leuven, Belgium, 14–17 May 2013. [Google Scholar]
- Cliquet, G. Spatial Marketing. In Geomarketing: Methods and Strategies in Spatial Marketing; Cliquet, G., Ed.; John Wiley & Sons, Inc.: Hoboken, NJ, USA, 2013. [Google Scholar]
- Data Storytelling: The Essential Data Science Skill Everyone Needs. Available online: https://www.forbes.com/sites/brentdykes/2016/03/31/data-storytelling-the-essential-data-science-skill-everyone-needs/#3bce6c5152ad (accessed on 12 November 2017).
- Wallace, T.R. Cartographic Journalism: Situating Modern News Mapping in a History of Map-User Interaction. Ph.D. Thesis, University of Wisconsin-Madison, Madison, WI, USA, 2016. [Google Scholar]
- Iturrioz, T.; Fernandez, C.R.; Gomez Barron Sierra, J.P. Creating Story Maps for Learning Purposes: The Black Death Atlas. In Proceedings of the 6th International Conference on Cartography and GIS, Albena, Bulgaria, 13–17 June 2016; pp. 221–231. [Google Scholar]
- Kerski, J. Geo-awareness, Geo-enablement, Geotechnologies, Citizen Science, and Storytelling: Geography on the World Stage. Geogr. Compass 2015, 9, 14–26. [Google Scholar] [CrossRef]
- Seven Ways to Create a Storymap. Available online: https://schoolofdata.org/2014/08/25/seven-ways-to-create-a-storymap/ (accessed on 12 November 2017).
- Google Earth Could Become the Next Great Social Network. Available online: http://mashable.com/2017/07/13/google-earth-voyager-social-network/ (accessed on 5 September 2017).
- Buckley, A. Atlas Mapping in the 21st Century. Cartogr. Geogr. Inform. 2003, 30, 149–158. [Google Scholar] [CrossRef]
- Roth, R.E. Interactive maps: What we know and what we need to know. J. Spat. Inf. Sci. 2013, 6, 59–115. [Google Scholar] [CrossRef]
- Strachan, C.; Mitchell, J. Teachers’ Perceptions of ESRI Story Maps as Effective Teaching Tools. Ph.D. Thesis, University of South Carolina, Columbia, SC, USA, 2014. [Google Scholar]
- A Great Tool for Creating Stories with Maps, 2017. Available online: http://www.educatorstechnology.com/2017/03/a-great-tool-for-creating-stories-using.html (accessed on 10 December 2017).
- Success in the First Year of ConnectEd (ArcUser Summer 2015). Available online: http://www.esri.com/esri-news/arcuser/summer-2015/success-in-the-first-year-of-connected (accessed on 10 December 2017).
- 2018 ArcGIS Online Competition for US HS + MS Students. Available online: https://community.esri.com/thread/201531-2018-arcgis-online-competition-for-us-hsms-students (accessed on 10 December 2017).
- The International Year of Global Understanding (IYGU) Story Maps Competition. Available online: http://go.esri.com/IYGU-Competition (accessed on 10 December 2017).
- Duke, B.A. Louisiana State Story-Utilizing Story Maps to Teach State History. In Proceedings of the ESRI Education GIS Conference, San Diego, CA, USA, 25–28 June 2016. [Google Scholar]
- California Geographic Alliance, California Atlas 2.0 (Geo-Quest). Available online: http://calgeography.sdsu.edu/geo-quest/ (accessed on 10 December 2017).
- Knaflic, C.N. Storytelling with Data: A Data Visualization Guide for Business Professionals; John Wiley & Sons, Inc.: Hoboken, NJ, USA, 2015. [Google Scholar]
- Boy, J.; Detienne, F.; Fekete, J.D. Storytelling in Information Visualizations: Does it Engage Users to Explore Data? In Proceedings of the 33rd Annual ACM Conference on Human Factors in Computing Systems, Chicago, IL, USA, 18–23 April 2015; pp. 1449–1458. [Google Scholar]
- Robinson, A. Geovisual Analytics. In The Geographic Information Science & Technology Body of Knowledge (3rd Quarter 2017 Edition); Wilson, J.P., Ed.; University Consortium for Geographic Information Science: Ithaca, NY, USA, 2017. [Google Scholar]
- Van Ho, Q.; Lundblad, P.; Astrom, T.; Jern, M. A web-enabled visualization toolkit for geovisual analytics. Inf. Vis. 2012, 11, 22–42. [Google Scholar] [CrossRef]
- Kraak, M.J. Geovisualization illustrated. ISPRS J. Photogramm. Remote Sens. 2003, 57, 390–399. [Google Scholar] [CrossRef]
- Bentley, E. A Historical Atlas in Narrative Form. Cartogr. Geogr. Inf. Sci. 2012, 39, 219–231. [Google Scholar] [CrossRef]
- Kraak, M.J.; Ormeling, F.J. Cartography: Visualization of Spatial Data; Addison Wesley Longman Limited: Toronto, ON, USA, 1996. [Google Scholar]
- Reutzel, R.D. Story Maps Improve Comprehension. Read. Teach. 1985, 38, 400–404. [Google Scholar]
- Barber, J.F. Digital storytelling: New opportunities for humanities scholarship and pedagogy. Cogent Arts Humanit. 2016, 3, 1181037. [Google Scholar] [CrossRef]
- Story Center. Available online: https://www.storycenter.org/ (accessed on 18 December 2017).
- Robin, B.R. Digital Storytelling: A Powerful Technology Tool for the 21st Century Classroom. Theory Pract. 2008, 47, 220–228. [Google Scholar] [CrossRef]
- Wang, S.; Zhan, H. Enhancing Teaching and Learning with Digital Storytelling. In Advancing Education with Information Communication Technologies; Tomei, A.L., Ed.; IGI Global: Hershey, PA, USA, 2012; pp. 179–191. [Google Scholar]
- Tsou, M. Revisiting web cartography in the United States: the Rise of User-Centered Design. Cartogr. Geogr. Inform. 2011, 38, 250–257. [Google Scholar] [CrossRef]
- Roberts, J.C. Coordinated Multiple Views for Exploratory Geovisualization. In Geographic Visualization: Concepts, Tools, and Applications; Dodge, M., McDerby, M., Turner, M., Eds.; John Wiley & Sons: West Sussex, UK, 2008; pp. 25–48. [Google Scholar]
- Baker, T.R. WebGIS in Education. In Geospatial Technologies and Geography Education in a Changing World: Geospatial Practices and Lessons Learned; Solari, O.M., Demirci, A., van der Schee, J., Eds.; Springer: Tokyo, Japan, 2015; pp. 105–115. [Google Scholar]
- The Wyoming Atlas Project. Available online: http://atlas.wygisc.org (accessed on 11 December 2017).
- Hamerlinck, J.D.; Webster, G.R.; Berendsen, M.E. Wyoming Student Atlas: Exploring Our Geography; University of Wyoming: Laramie, WY, USA, 2014. [Google Scholar]
- Geography for Life: National Geography Standards, Second Edition. Available online: http://ncge.org/geography-for-life (accessed on 24 October 2017).
- Mitchell, J.; Caughman, M.; Wise, S. Improving Geographic Understanding with a State Atlas. Geogr. Teach. 2007, 4, 4–8. [Google Scholar]
- Da Silva Ramos, C.; Cartwright, W.; Doin de Almeida, R. Issues in School Web Atlas Use: The prototype atlas of Rio Claro-Brazil. In International Perspectives on Maps and the Internet; Peterson, M.P., Ed.; Springer: Berlin/Heidelberg, Germany; New York, NY, USA, 2008; pp. 239–250. [Google Scholar]
- Moser, J.; Koslitz, S. Pins or Points?—Challenges in Producing Cartographically Appealing Webmaps Within an Editorial Environment for LiD Online. In Progress in Cartography; Gartner, G., Jobst, M., Huang, H., Eds.; Springer International Publishing: Basel, Switzerland, 2016; pp. 83–98. [Google Scholar]
- ESRI Story Maps. Available online: https://storymaps.arcgis.com/en/ (accessed on 11 December 2017).
- Knight Labs StoryMapJS. Available online: https://storymap.knightlab.com (accessed on 11 December 2017).
- MapMe. Available online: http://mapme.com (accessed on 11 December 2017).
- CartoDB Odyssey. Available online: https://cartodb.github.io/odyssey.js/ (accessed on 11 December 2017).
- Open Knowledge TimeMapper. Available online: http://timemapper.okfnlabs.org/ (accessed on 11 December 2017).
- MapStory. Available online: http://mapstory.org (accessed on 11 December 2017).
- Wright, D. ESRI Living Atlas Concept. In Proceedings of the 6th International Coastal Atlas Network Workshop (ICAN 6), Victoria, BC, Canada, 16–17 June 2013. [Google Scholar]
- Nunez, J.J.R. Smartphone-based School Atlases? Cartographica 2013, 48, 126–133. [Google Scholar] [CrossRef]
- Web AppBuilder for ArcGIS. Available online: https://doc.arcgis.com/en/web-appbuilder/ (accessed on 11 December 2017).
- Alibriandi, M.; Goldstein, D. Integrating GIS and Other Geospatial Technologies in Middle Schools. In Geospatial Technologies and Geography Education in a Changing World; Solari, O.M., Demirci, A., van der Schee, J., Eds.; Springer: Tokyo, Japan, 2015; pp. 53–65. [Google Scholar]
- Geoinquiries. Available online: https://community.esri.com/groups/k12-instruction/projects/geoinquiries (accessed on 5 September 2017).
- Semken, S.; Ward, E.M.; Moosavi, S.; Chinn, P.W.U. Place-Based Education in Geoscience: Theory, Research, Practice, and Assessment. J. Geosci. Educ. 2017, 65, 542–562. [Google Scholar] [CrossRef]
- Bangert-Drowns, R.L.; Pyke, C. Teacher ratings of student engagement with educational software: An exploratory study. Educ. Technol. Res. Dev. 2002, 50, 23–37. [Google Scholar] [CrossRef]
- Henrie, C.R.; Halverson, L.R.; Graham, C.R. Measuring student engagement in technology-mediated learning: A review. Comput. Educ. 2015, 90, 36–53. [Google Scholar] [CrossRef]
- Kosara, R.; Mackinlay, J. Storytelling: The Next Step for Visualization. Computer 2013, 46, 44–50. [Google Scholar] [CrossRef]
- Roth, R.E.; Çöltekin, A.; Delazari, L.; Filho, H.F.; Griffin, A.; Hall, A.; Korpi, J.; Kokka, I.; Mendonça, A.; Ooms, K.; et al. User studies in cartography: Opportunities for empirical research on interactive maps and visualizations. Int. J. Cartogr. 2017, 3, 61–89. [Google Scholar] [CrossRef]
- Graves, M.E. Spatial Narratives of Struggle and Activism in the Del Amo and Montrose Superfund Cleanups: A Community-Engaged Web GIS Story Map. Master’s Thesis, University of Southern California, Los Angeles, CA, USA, 2015. [Google Scholar]
- Google Earth. Available online: https://www.google.com/earth/ (accessed on 10 January 2018).
- Borgers, N.; Hox, J.; Sikkel, D. Response Effects in Surveys on Children and Adolescents: The Effect of Number of Response Options, Negative Wording, and Neutral Mid-Point. Qual. Quant. 2004, 38, 17–33. [Google Scholar] [CrossRef]
- Rodden, K.; Hutchinson, H.; Fu, X. Measuring the User Experience on a Large Scale: User-Centered Metrics for Web Applications. In Proceedings of the CHI 2010, Atlanta, GA, USA, 10–15 April 2010. [Google Scholar]
- Veenendaal, B.; Brovelli, M.A.; Li, S. Review of Web Mapping: Eras, Trends and Directions. ISPRS Int. J. Geo-Inf. 2017, 6, 317. [Google Scholar] [CrossRef]
Figure 1.
An example of a complex cartographic representation (charts as proportional symbols) in a web map embedded within an atlas story map.
Figure 1.
An example of a complex cartographic representation (charts as proportional symbols) in a web map embedded within an atlas story map.
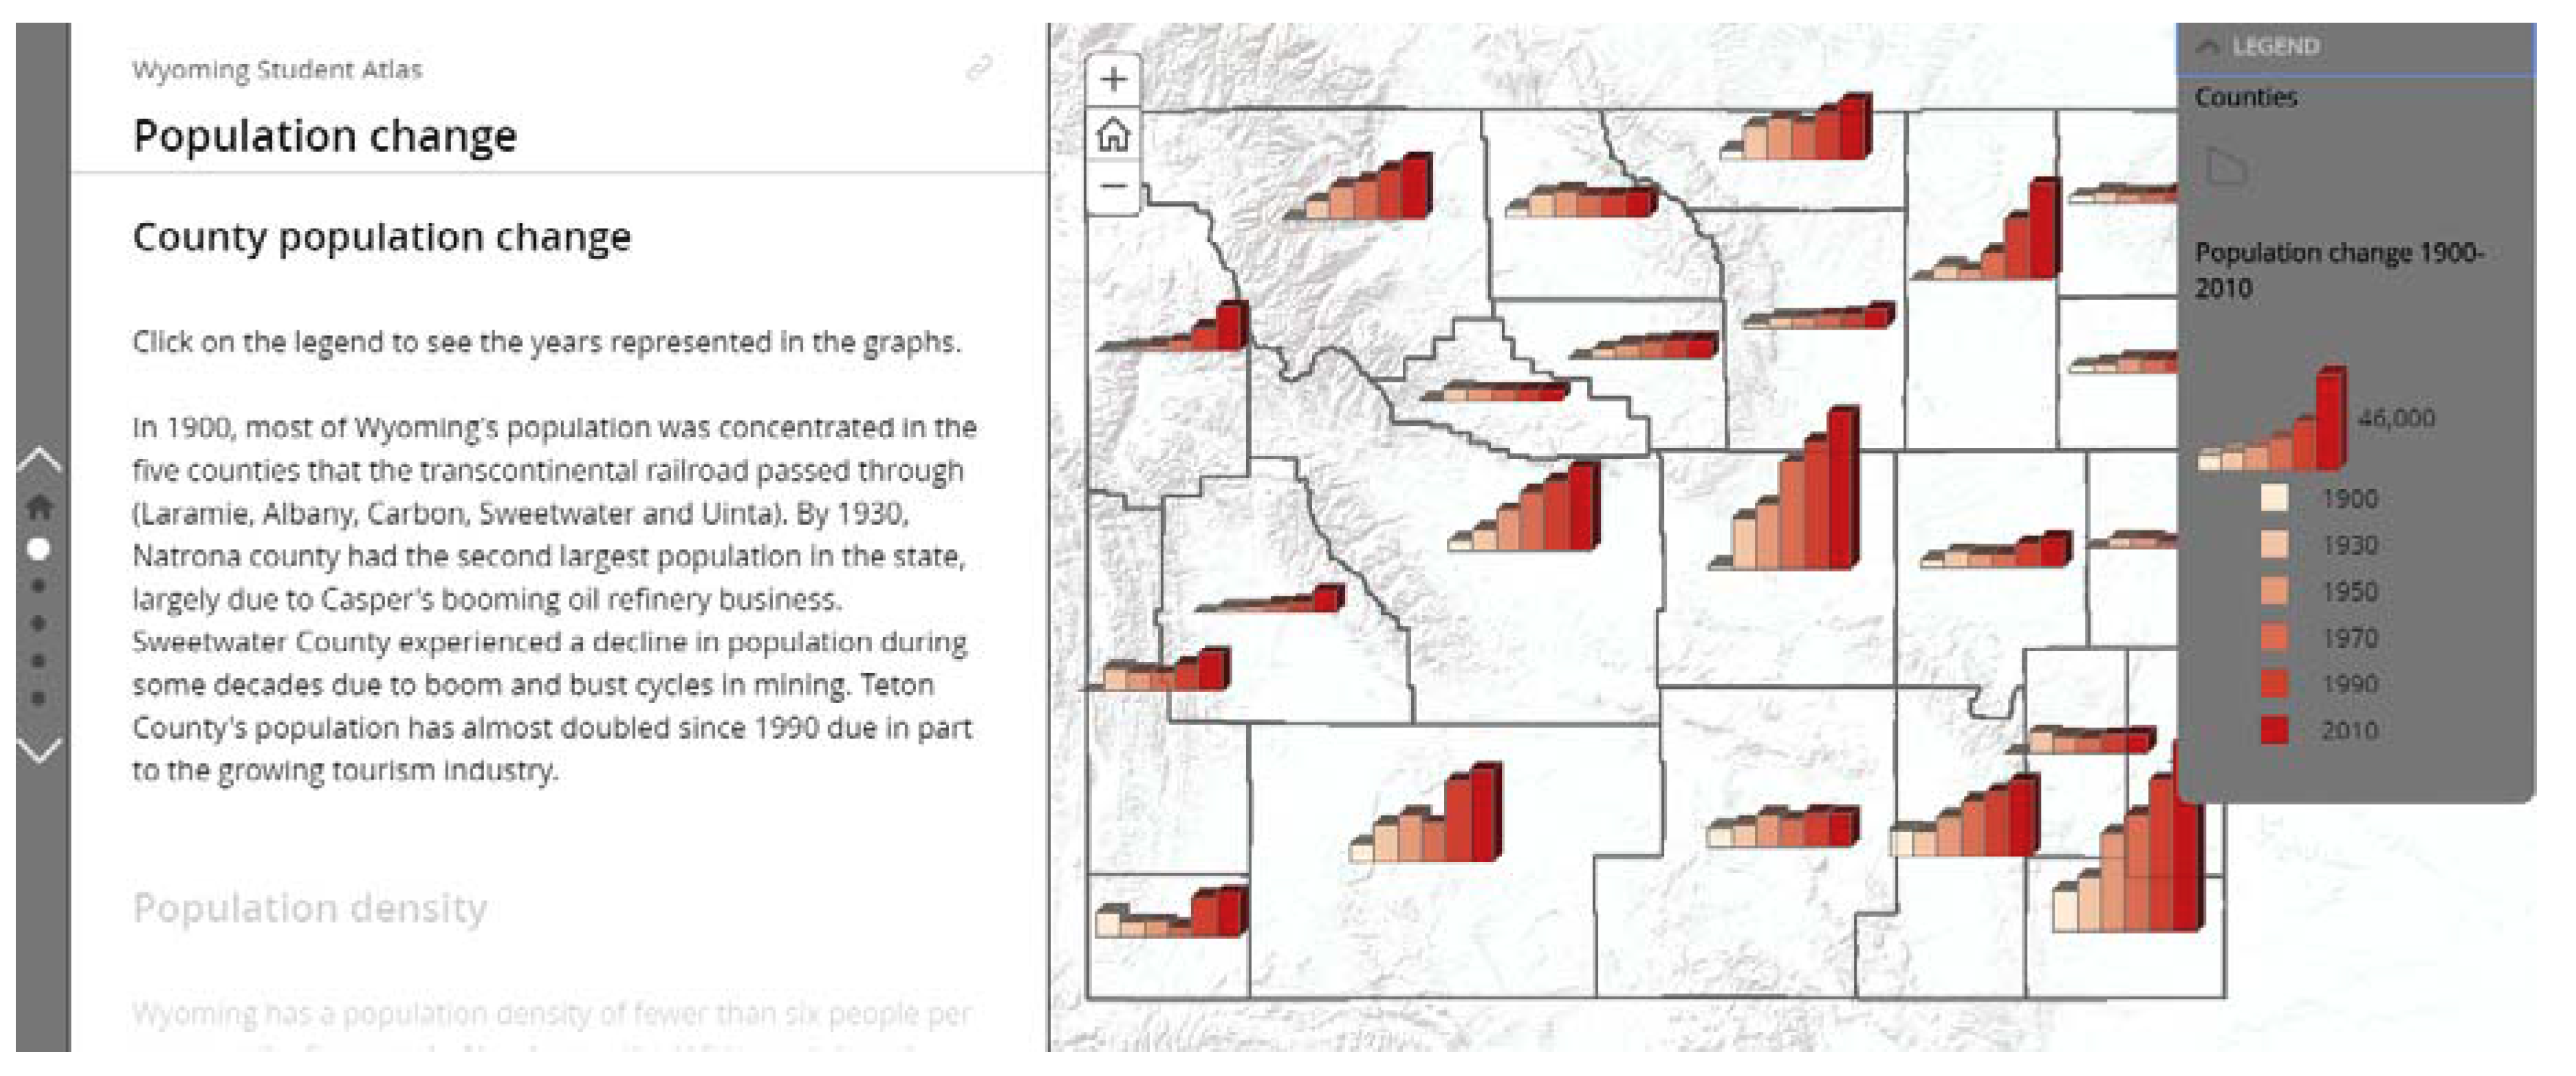
Figure 2.
Screenshot of a page from an atlas story map prompting students to locate a place of interest to them on the map and explore features near their location that are related to the story map theme.
Figure 2.
Screenshot of a page from an atlas story map prompting students to locate a place of interest to them on the map and explore features near their location that are related to the story map theme.

Figure 3.
Screenshot of a page from an atlas story map prompting students to explore a theme at a national or even global scale after first seeing a local or regional pattern.
Figure 3.
Screenshot of a page from an atlas story map prompting students to explore a theme at a national or even global scale after first seeing a local or regional pattern.
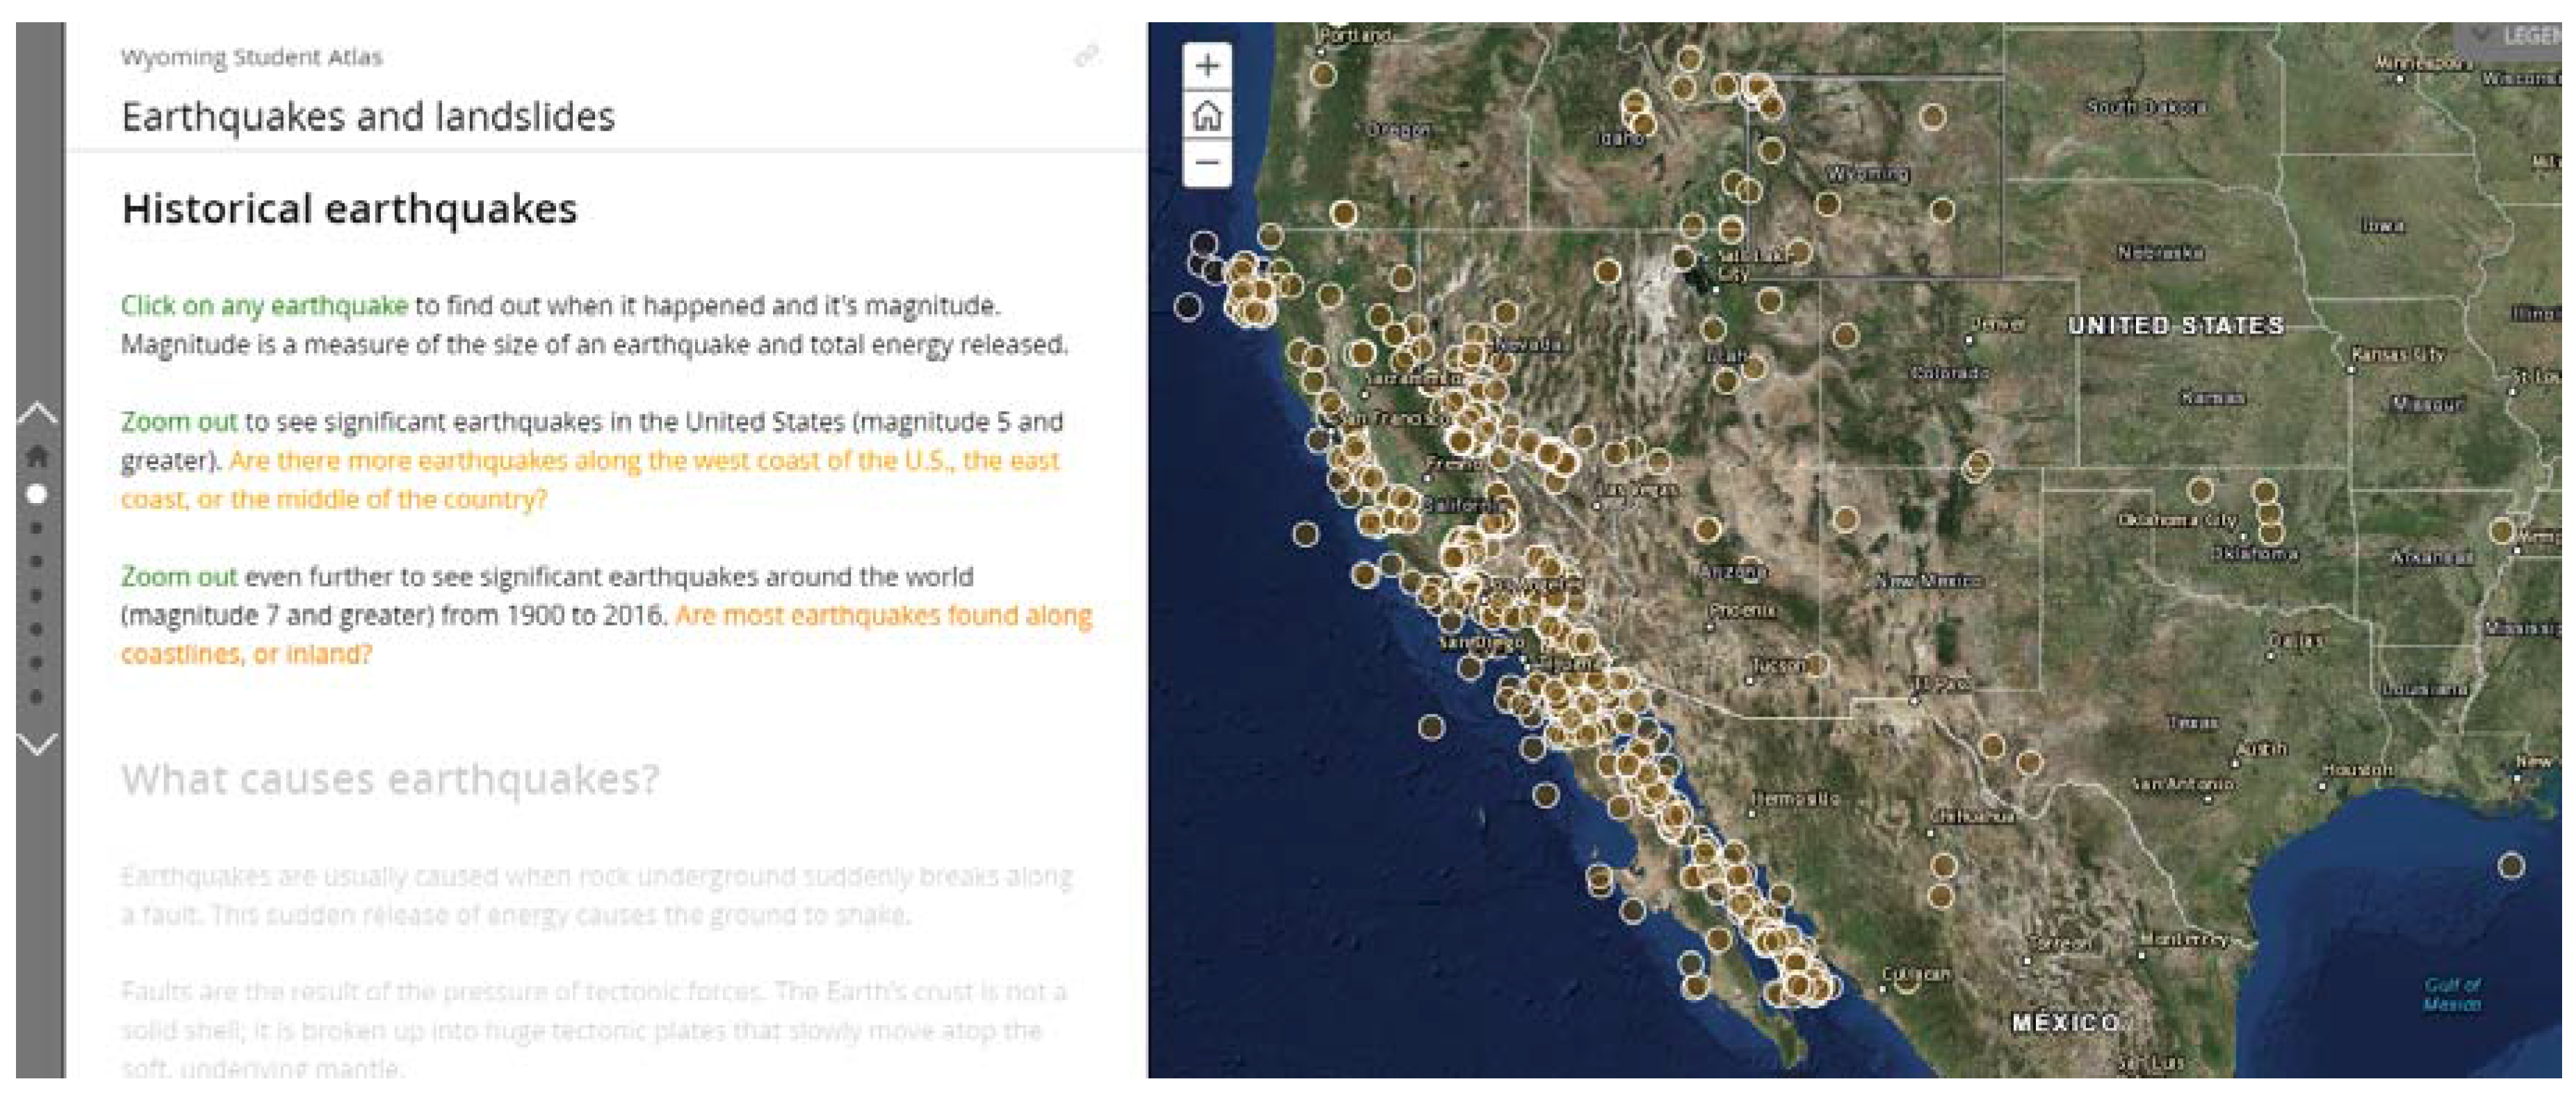

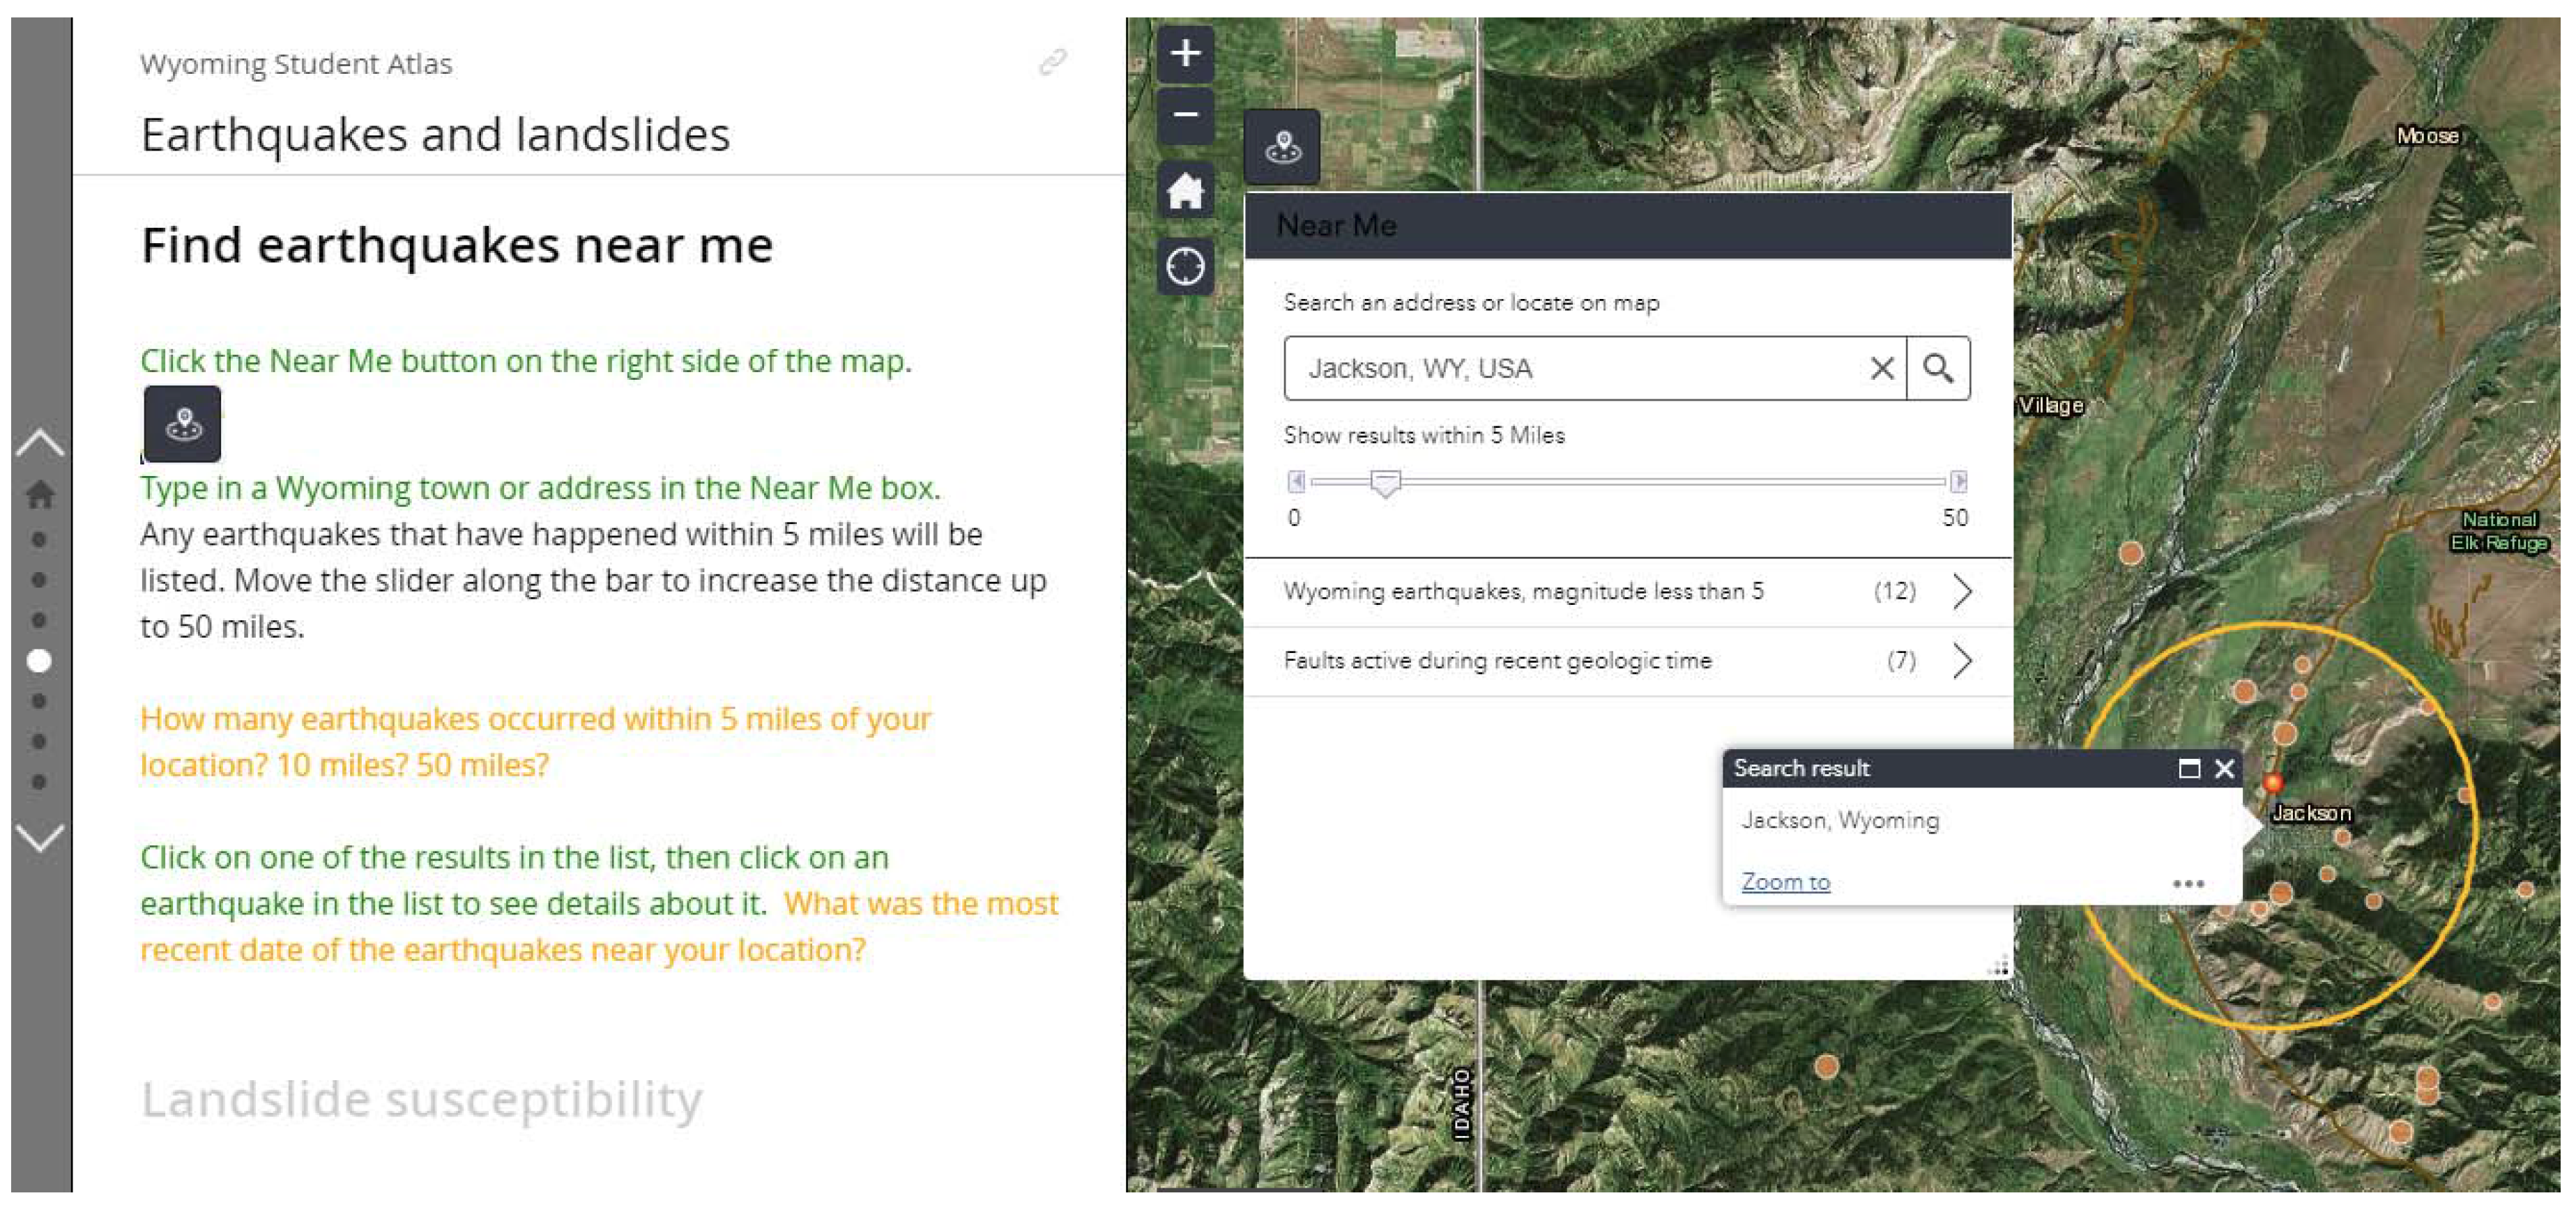
Table 1.
Issues with story map design identified during preliminary assessment and methods used to resolve issues.
Table 1.
Issues with story map design identified during preliminary assessment and methods used to resolve issues.
| Story Map Element | Issue Encountered | Method to Resolve Issue |
|---|---|---|
| Text and images | Some students stopped reading the column of text next to the map because additional text below an embedded photograph was not visible unless they scrolled down past the photograph. | Text was kept short enough in length so that scrolling was not necessary. Photographs were moved below the text in the story maps. |
| Zooming in | Some students zoomed in so close that they lost context and would pan around trying to figure out where they were. | This interaction was demonstrated before the exercise with the reminder to zoom back out for context. |
| Zooming out | Some students zoomed out so far that they had difficulty finding areas needed for completing tasks. | Boundary boxes were added to the map to identify areas needed for completing tasks. |
| Panning | None | None |
| Clicking to pop up more information on the map | Photographs embedded into the pop ups were limited to the size of the pop-up, with no option to expand the photograph to see it in more detail. | A story map "tour" template was embedded into the main story map. The "tour" template displays photographs and images much larger than pop ups. |
| "Swiping" to view differences between two maps | Students found it difficult to compare thematic maps because the screen is split by the swipe bar. | Thematic maps were placed side by side for non-interactive comparison. |
| "Near me" tool to find features near a specific location | While this tool is active, it returns new results every time the map is clicked; students confused this with the default action of clicking on a map to pop up more information. | This interaction was demonstrated before the exercise with instructions for how to deactivate the "near me" tool. |
| Measuring tool to measure distances between features | While this tool is active, a large pop-up window showing the measurement results obscures part of the map. | This interaction was demonstrated before the exercise with instructions to move the pop up window if needed. |
Table 2.
Responses of students ages 9–10 and 11–12 to statements about engagement with the earthquakes story map.
Table 2.
Responses of students ages 9–10 and 11–12 to statements about engagement with the earthquakes story map.
| Abbreviated Survey Statement 1 | Students | Abs. No (1) | No (2) | Not Sure (3) | Yes (4) | Abs. Yes (5) | Yes and Abs. Yes | Num. of Students | Median (Range 1 to 5) |
|---|---|---|---|---|---|---|---|---|---|
| Percentage of Students and Frequency in () | |||||||||
| I liked interacting with the maps in the atlas… | Ages 9–10 | 0.0 (0) | 0.00 (0) | 15.3 (2) | 53.3 (8) | 33.3 (5) | 86.7 (13) | 15 | 4.0 |
| Ages 11–12 | 2.8 (2) | 4.2 (3) | 12.7 (9) | 39.4 (28) | 40.9 (29) | 80.3 (57) | 71 | 4.0 | |
| Both ages | 2.3 (2) | 3.5 (3) | 12.8 (11) | 41.9 (36) | 39.5 (34) | 81.4 (70) | 86 | 4.0 | |
| It was easy for me to learn to use… | Ages 9–10 | 0.0 (0) | 0.0 (0) | 6.7 (1) | 40.0 (6) | 53.3 (8) | 93.3 (14) | 15 | 5.0 |
| Ages 11–12 | 2.9 (2) | 8.6 (6) | 5.7 (4) | 37.1 (26) | 45.7 (32) | 82.9 (58) | 70 | 4.0 | |
| Both ages | 2.3 (2) | 7.1 (6) | 5.9 (5) | 37.7 (32) | 47.1 (40) | 84.7 (72) | 85 | 4.0 | |
| I would rather use the interactive version… | Ages 9–10 | 0.0 (0) | 6.7 (1) | 6.7 (1) | 20.0 (3) | 66.7 (10) | 86.7 (13) | 15 | 5.0 |
| Ages 11–12 | 4.4 (3) | 7.3 (5) | 18.8 (13) | 23.2 (16) | 46.4 (32) | 69.6 (48) | 69 | 4.0 | |
| Both ages | 3.6 (3) | 7.1 (6) | 16.7 (14) | 22.6 (19) | 50.0 (42) | 72.6 (61) | 84 | 4.5 | |
1. The full text of the statements is in Appendix A.
Table 3.
Responses of students ages 9–10 and 11–12 to statements related to local and familiar context and broader national or global context.
Table 3.
Responses of students ages 9–10 and 11–12 to statements related to local and familiar context and broader national or global context.
| Abbreviated Survey Statement 1 | Students | Abs. No (1) | No (2) | Not Sure (3) | Yes (4) | Abs. Yes (5) | Yes and Abs. Yes | Num. of Students | Median (Range 1 to 5) |
|---|---|---|---|---|---|---|---|---|---|
| Percentage of Students and Frequency in () | |||||||||
| I liked using the atlas to find my town … | Ages 9–10 | 13.3 (2) | 0.0 (0) | 0.0 (0) | 40.0 (6) | 46.7 (7) | 86.7 (13) | 15 | 4.0 |
| Ages 11–12 | 6.1 (5) | 2.4 (2) | 27.7 (23) | 44.6 (37) | 19.3 (16) | 63.9 (53) | 83 | 4.0 | |
| Both ages | 7.1 (7) | 2.0 (2) | 23.5 (23) | 43.9 (43) | 23.5 (23) | 67.4 (66) | 98 | 4.0 | |
| I liked finding another familiar place… | Ages 9–10 | 0.0 (0) | 6.7 (1) | 13.3 (2) | 20.0 (3) | 60.0 (9) | 80.0 (12) | 15 | 5.0 |
| Ages 11–12 | 2.4 (2) | 8.4 (7) | 18.1 (15) | 43.4 (36) | 27.7 (23) | 71.1 (59) | 83 | 5.0 | |
| Both ages | 2.0 (2) | 8.2 (8) | 17.3 (17) | 39.8 (39) | 32.7 (32) | 72.5 (71) | 98 | 4.0 | |
| I am likely to continue exploring a familiar place… | Ages 9–10 | 0.0 (0) | 0.0 (0) | 26.7 (4) | 53.3 (8) | 20.0 (3) | 73.3 (11) | 15 | 4.0 |
| Ages 11–12 | 3.6 (3) | 14.5 (12) | 27.7 (23) | 38.5 (32) | 15.7 (13) | 52.2 (45) | 83 | 4.0 | |
| Both ages | 3.1 (3) | 12.3 (12) | 27.6 (27) | 40.8 (40) | 16.3 (16) | 57.1 (56) | 98 | 4.0 | |
| Seeing earthquakes near my town will help me remember… | Ages 9–10 | 0.0 (0) | 6.7 (1) | 13.3 (2) | 26.7 (4) | 53.3 (8) | 80.0 (12) | 15 | 5.0 |
| Ages 11–12 | 2.4 (2) | 14.6 (12) | 20.7 (17) | 36.6 (30) | 25.6 (21) | 62.2 (51) | 82 | 4.0 | |
| Both ages | 2.1 (3) | 13.4 (13) | 19.6 (19) | 35.1 (34) | 29.9 (29) | 64.9 (63) | 97 | 4.0 | |
| Seeing earthquakes across the country will help me remember… | Ages 9–10 | 0.0 (0) | 0.0 (0) | 13.3 (2) | 13.3 (2) | 73.3 (11) | 86.7 (13) | 15 | 5.0 |
| Ages 11–12 | 2.8 (2) | 4.2 (3) | 26.4 (19) | 50.0 (36) | 16.7 (12) | 53.4 (58) | 72 | 4.0 | |
| Both ages | 3.4 (2) | 6.8 (3) | 30.7 (21) | 32.9 (38) | 26.1 (23) | 59.1 (61) | 87 | 4.5 | |
1. The full text of the statements is in Appendix A.
Table 4.
Responses of two groups of students ages 11–12 to survey statements. The first group used a “near me” interactive tool and the second group used a measuring tool.
Table 4.
Responses of two groups of students ages 11–12 to survey statements. The first group used a “near me” interactive tool and the second group used a measuring tool.
| Abbreviated Survey Statement 1 | Type of interaction | Abs. No (1) | No (2) | Not sure (3) | Yes (4) | Abs. Yes (5) | Yes and Abs. Yes | Number of students | Median (Range 1 to 5) | p Value |
|---|---|---|---|---|---|---|---|---|---|---|
| Percentage of students | ||||||||||
| I liked finding my town… | near me | 2.8 | 4.2 | 12.7 | 39.4 | 40.9 | 80.3 | 71 | 4.0 | 0.0047 |
| measuring | 17.7 | 14.7 | 11.8 | 35.3 | 20.6 | 55.9 | 34 | 4.0 | ||
| It was easy for me to learn to use… | near me | 2.3 | 7.1 | 5.9 | 37.7 | 47.1 | 82.9 | 70 | 4.0 | 0.029 |
| measuring | 11.8 | 11.8 | 17.7 | 29.4 | 29.4 | 58.8 | 34 | 4.0 | ||
| I would rather use the interactive version… | near me | 4.4 | 7.3 | 18.8 | 23.2 | 46.4 | 69.6 | 69 | 4.0 | 0.0549 |
| measuring | 14.7 | 14.7 | 14.7 | 26.5 | 29.4 | 55.9 | 34 | 4.0 | ||
| I liked using the atlas to find my town… | near me | 6.0 | 2.4 | 27.7 | 44.6 | 19.3 | 63.9 | 83 | 4.0 | 0.0135 |
| measuring | 17.1 | 17.1 | 22.9 | 31.4 | 11.4 | 42.9 | 35 | 3.0 | ||
| I liked finding another familiar place… | near me | 2.4 | 8.4 | 18.1 | 43.4 | 27.7 | 71.1 | 83 | 4.0 | 0.0549 |
| measuring | 14.3 | 20.0 | 20.0 | 17.1 | 28.6 | 45.7 | 35 | 3.0 | ||
| I am likely to continue exploring a familiar area… | near me | 3.6 | 14.5 | 27.7 | 38.6 | 15.7 | 52.2 | 83 | 4.0 | 0.0080 |
| measuring | 28.6 | 20.0 | 14.3 | 25.7 | 11.4 | 37.1 | 35 | 3.0 | ||
| Seeing earthquakes near my town will help me remember… | near me | 2.4 | 14.6 | 20.7 | 36.6 | 25.6 | 62.2 | 82 | 4.0 | 0.0026 |
| measuring | 11.4 | 25.7 | 28.6 | 25.7 | 8.6 | 34.3 | 35 | 3.0 | ||
| Seeing earthquakes across the country will help me remember… | near me | 2.8 | 4.2 | 26.4 | 50.0 | 16.7 | 53.4 | 72 | 4.0 | 0.0022 |
| measuring | 17.7 | 17.7 | 29.4 | 23.5 | 11.8 | 35.3 | 35 | 3.0 | ||
1. The full text of the statements is in Appendix A.
© 2018 by the authors. Licensee MDPI, Basel, Switzerland. This article is an open access article distributed under the terms and conditions of the Creative Commons Attribution (CC BY) license (http://creativecommons.org/licenses/by/4.0/).
Share and Cite
MDPI and ACS Style
Berendsen, M.E.; Hamerlinck, J.D.; Webster, G.R. Digital Story Mapping to Advance Educational Atlas Design and Enable Student Engagement. ISPRS Int. J. Geo-Inf. 2018, 7, 125. https://doi.org/10.3390/ijgi7030125
AMA Style
Berendsen ME, Hamerlinck JD, Webster GR. Digital Story Mapping to Advance Educational Atlas Design and Enable Student Engagement. ISPRS International Journal of Geo-Information. 2018; 7(3):125. https://doi.org/10.3390/ijgi7030125
Chicago/Turabian StyleBerendsen, Margo E., Jeffrey D. Hamerlinck, and Gerald R. Webster. 2018. "Digital Story Mapping to Advance Educational Atlas Design and Enable Student Engagement" ISPRS International Journal of Geo-Information 7, no. 3: 125. https://doi.org/10.3390/ijgi7030125
Note that from the first issue of 2016, this journal uses article numbers instead of page numbers. See further details here.