Article

Extraction of Tourist Destinations and Comparative Analysis of Preferences Between Foreign Tourists and Domestic Tourists on the Basis of Geotagged Social Media Data

1
Graduate School of Engineering, The University of Tokyo, 7-3-1, Hongo, Bunkyo, Tokyo 113-8656, Japan
2
Department of Computer Science and Engineering, Toyohashi University of Technology, 1-1 Hibarigaoka, Tempaku-cho, Toyohashi, Aichi 441-8580, Japan
*
Author to whom correspondence should be addressed.
ISPRS Int. J. Geo-Inf. 2018, 7(3), 99; https://doi.org/10.3390/ijgi7030099
Submission received: 29 January 2018 / Revised: 28 February 2018 / Accepted: 12 March 2018 / Published: 13 March 2018
(This article belongs to the Special Issue Geospatial Big Data and Urban Studies)

Abstract

:
Inbound tourism plays an important role in local economies. To stimulate local economies, it is necessary to attract foreign tourists to various areas of a country. This research aims to develop a method of extracting the locations of tourist destinations in a country and to understand what characteristics foreign tourists expect of areas near tourist attractions compared with what domestic tourists expect. In this paper, a tourist destination is defined as a small area that has places of interests for tourists such as historic sites, theme parks, hotels, and restaurants. The methods proposed in this paper are applied to data acquired from Twitter and Foursquare in Japan. The proposed method successfully extracts the locations of tourist destinations and characterizes those locations based on the points of interest in the neighborhood. The results indicate that foreign tourists who come to Japan expect nightlife spots (bars, nightclubs, etc.) to be located in the neighborhood of tourist destinations, in contrast to the expectations of domestic tourists. The proposed methods are applicable to not only Japan, but to any country.

1. Introduction

Along with globalization and the growth of emerging countries, international tourism has been increasing. Inbound tourism is of growing importance in many countries. This paper seeks a method of obtaining knowledge to enhance inbound tourism by extending our previous research presented at an international conference [1].
According to a report from the United Nations World Tourism Organization (UNWTO) [2], the number of international tourist arrivals in 2015 reached 1.2 billion.
The important effect of tourist visits on regional economic growth has been demonstrated in the field of tourism economics [3,4]. In many countries, it is important to increase the total number of tourists. However, foreign tourist visits usually concentrate in fewer areas than those of domestic tourists. Therefore, to stimulate local economies, it is important to avoid such concentration of foreign tourist visits and to draw some of those tourists to other places that have valuable touristic sites.
To attract inbound tourists, stakeholders related to tourism (such as national and local governments as well as the restaurant and hotel industries) must grasp two important points. The first is the locations of tourist destinations in the country. In this paper, a tourist destination is defined as a small area that has places of interest for tourists such as historic sites, theme parks, hotels, and restaurants. It is difficult to know the locations of all the tourist destinations in a country, and many sites become newly popularized in a short period of time. To attract foreign tourists to various areas around a country, it is important to compile a list of tourist destinations in that country. The second point is the differences in the preferences of foreign tourists and those of domestic tourists. If certain tourist attractions attract domestic tourists but not foreign tourists, those locations might have the potential to attract foreign visitors. Therefore, it is necessary to grasp the demands of foreign tourists.
Recently, the potential of location-based social networks (LBSNs) to promote the tourism industry has been demonstrated. For example, Twitter and Foursquare enable users to post text messages and pictures with locational information, including latitude and longitude. Since it has been expensive to investigate tourist preferences by survey, data from LBSNs may be useful for understanding the preferences and behaviors of tourists.
In this study, we propose a method of extracting the locations of tourist destinations on the basis of data obtained from Twitter and Foursquare and to compare the preferences of foreign tourists with those of domestic tourists. The research questions we addresses are the following:
  • (RQ1): How can the locations of tourist destinations be extracted?
  • (RQ2): How can the preferences of foreign tourists and those of domestic tourists be compared?
For the first research question, it is difficult to define and formulate what type of locations are tourist destinations. If we extract locations with high popularity, we obtain not only tourist attractions but also locations that do not have tourist attractions, such as the locations of huge shopping centers. On the other hand, if we classify locations by focusing on text data from social media, it is difficult to obtain a cluster that is composed of tourist attractions. For example, famous bridges such as the Golden Gate Bridge would be included in a cluster composed of locations with bridges. Thus, this type of tourist attraction cannot be extracted on the basis of only text data.
As for the second question, to determine what factors increase the number of inbound visitors, we focus on the points of interest (POIs) surrounding each tourist destination.
Many studies attempt to research tourist mobility based on geotagged social media data; for example, the extraction of the locations of popular touristic sites [5,6,7], the extraction of popular routes for tourists [8], and recommendations of touristic sites and routes [9,10,11]. Other studies compare inbound tourist mobility and domestic tourist mobility [12,13]. Outbound tourist mobility has also been studied [14]. Compared to previous studies, our study is important because it is the first attempt to propose a method of understanding the differences in preferences of foreign tourists and domestic tourists. This study is made possible by using tourist mobility data from geotagged Twitter data and POI data from Foursquare. The present study is also significant for practical reasons. Governments and the tourism industry can activate inbound tourism by using our proposed method. Our proposed method can identify why an area can attract domestic tourists but not foreign tourists.
There are many types of social media, including social networking sites (e.g., Facebook, LinkedIn), microblogs (e.g., Twitter, Weibo), community media sites (e.g., Flickr, Instagram), location-based social networks (e.g., Foursquare), and messaging platforms (e.g., Snapchat, Messenger, WhatsApp, WeChat). The advantages and disadvantages of each type of social media for analyzing human mobility have been discussed [15]. In the present paper, geotagged Twitter data are used to analyze tourist mobility, and Foursquare data are used to characterize each area. Twitter data are advantageous for the analysis of human mobility because many Twitter users post messages at various locations, including school, home, restaurants, and touristic sites. Foursquare data are advantageous for characterizing each area because the data contain information about POIs. The ratios of users of each type of social media vary by country. Additionally, our proposed method can be applied to other types of social media.
The contributions of this paper are summarized below:
  • We propose a method to extract the locations of tourist destinations by using geotagged data from Twitter. This method infers the attractiveness of each location by applying a gravity model to locational data and infers the originality of each location by analyzing text data from Twitter. It then extracts locations that have both high attractiveness and originality, and the extracted locations are regarded as tourist destinations.
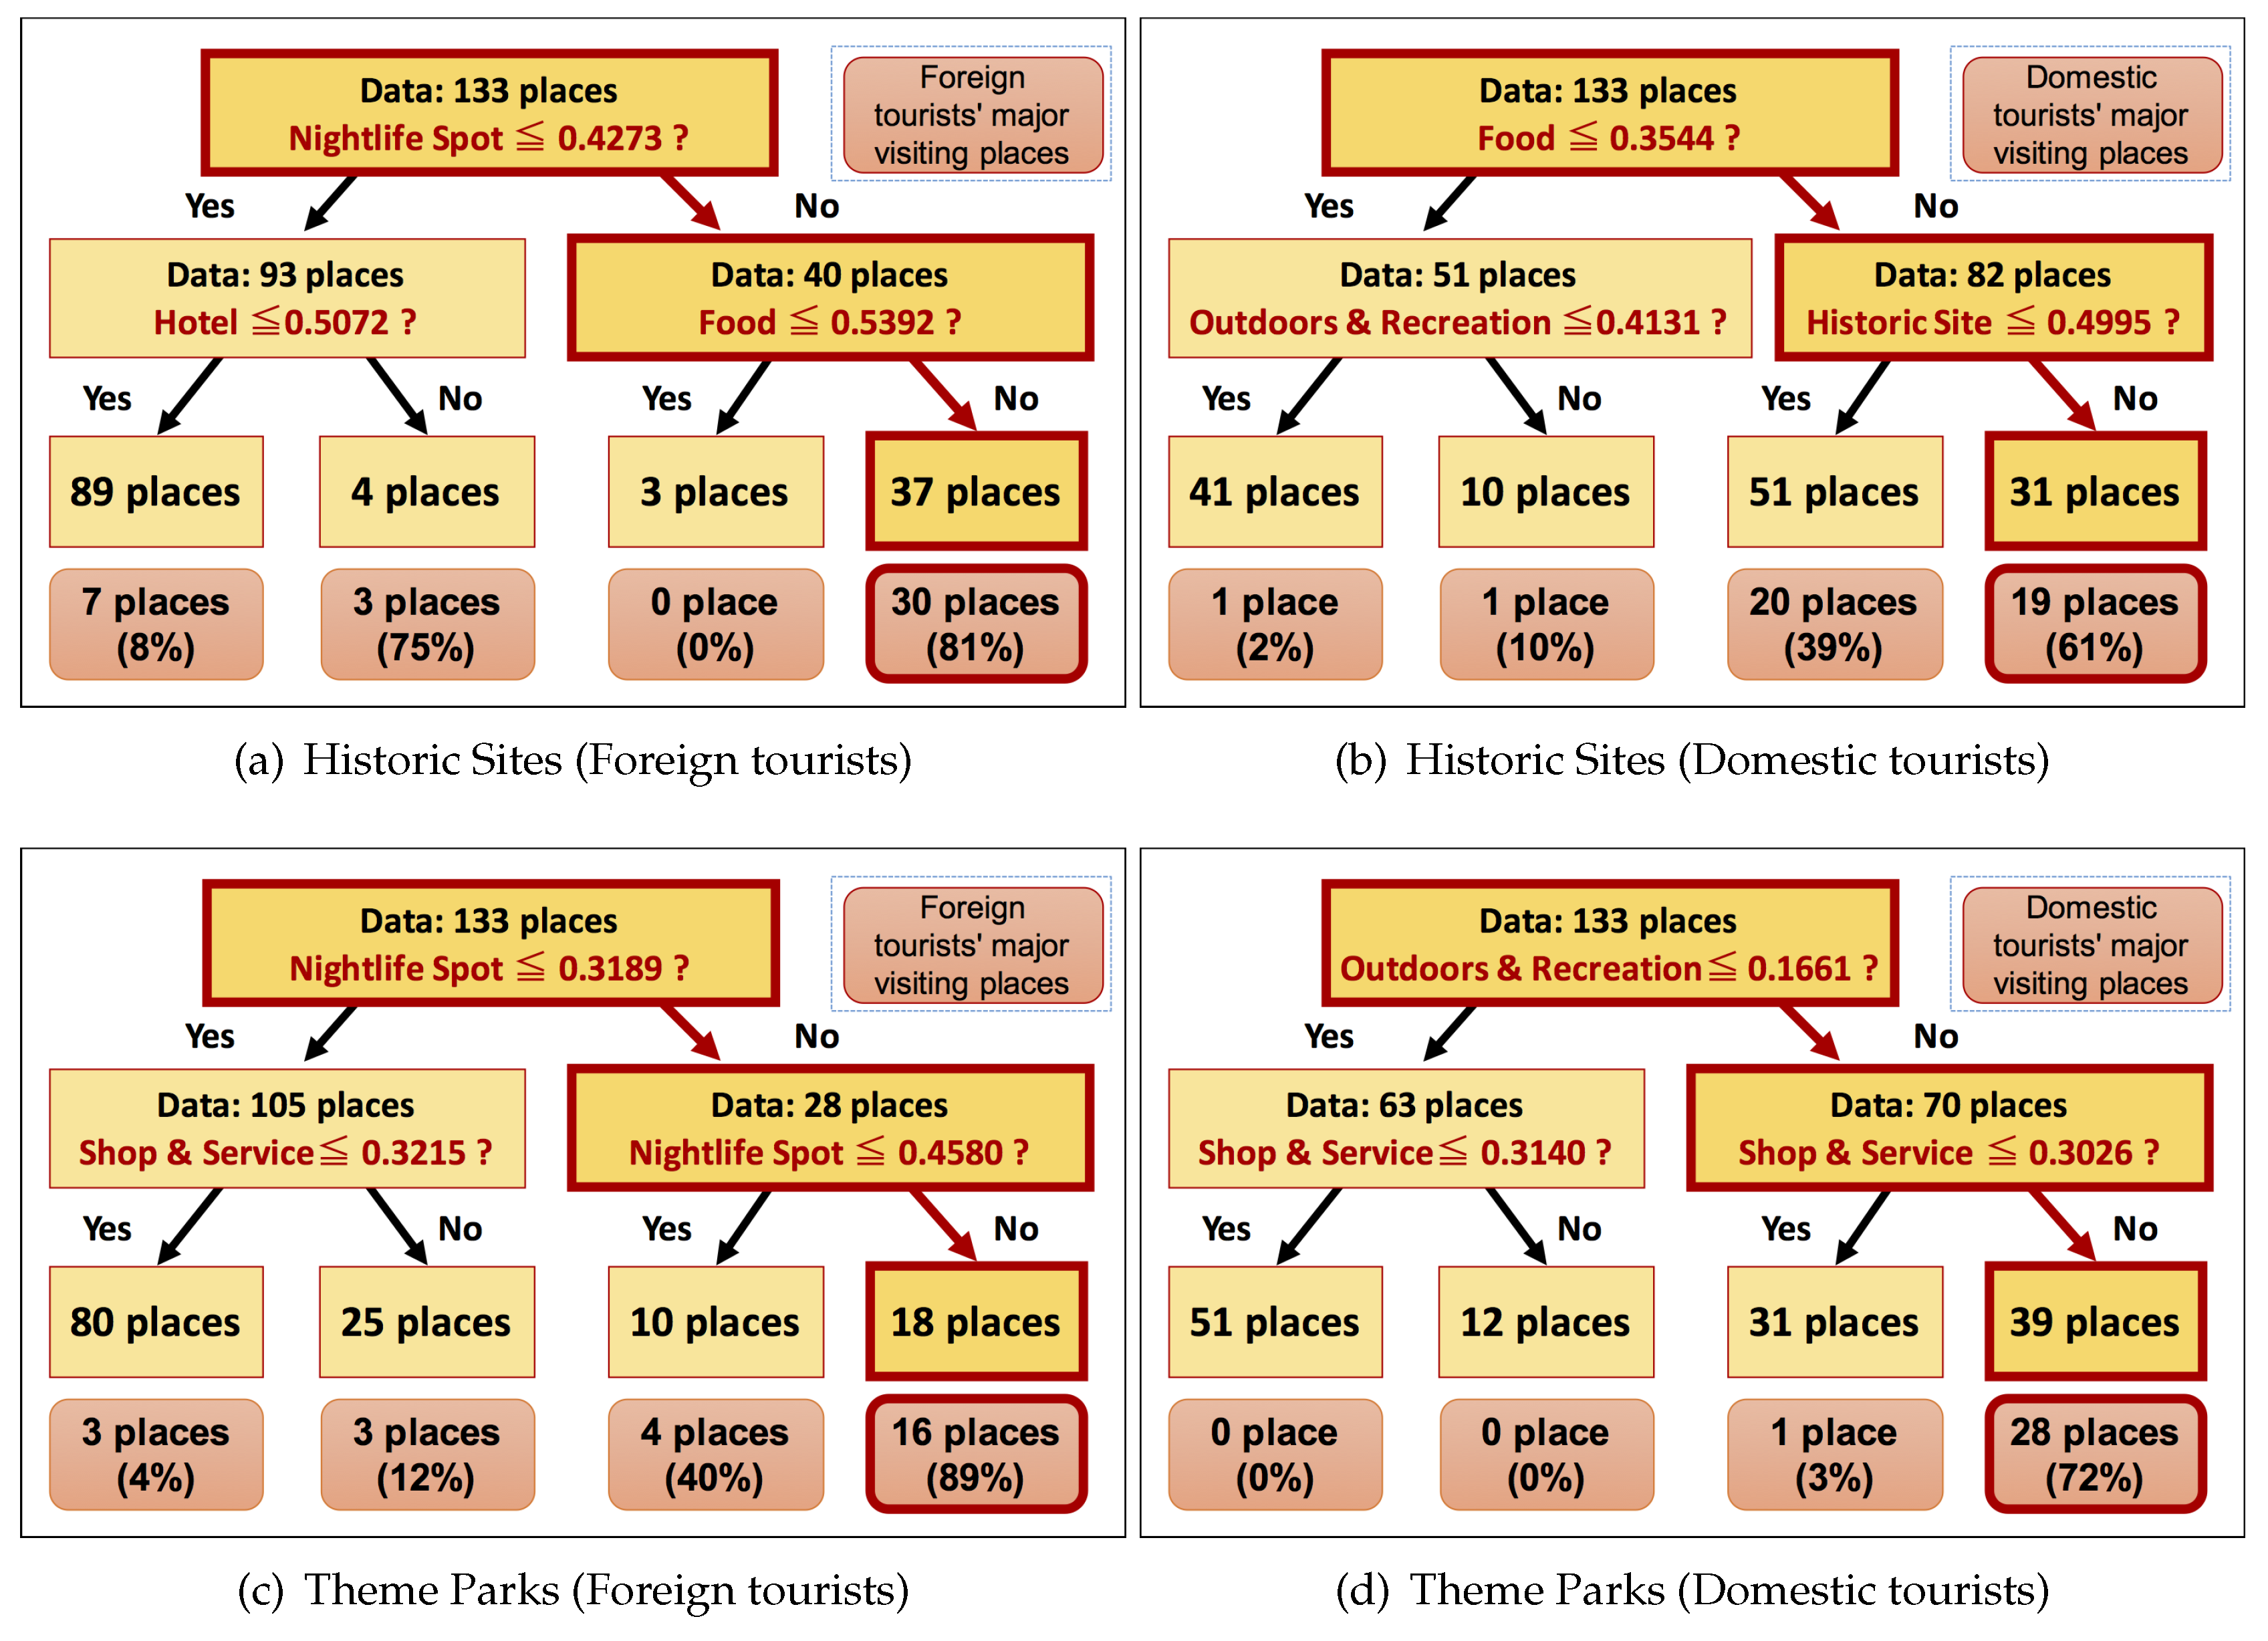
  • We propose a method of identifying the differences in the preferences of foreign tourists and those of domestic tourists by using data from Twitter and Foursquare. The data from Foursquare have information about POIs. These data are utilized to characterize each location. The characterization results indicate that compared to domestic tourists, foreign tourists in Japan expect night-life spots such as pubs and clubs to be located near tourist attractions.
This study extends our previous research presented at an international conference [1]. It focuses on a comparative analysis of the preferences of foreign tourists and domestic tourists. This paper further addresses the research question of how tourist destinations can be extracted. This extended research broadens the findings obtained in previous work.
The rest of this paper is organized as follows: Section 2 introduces related studies. Section 3 describes the proposed method for extracting the locations of tourist destinations and presents the extraction results. Section 4 describes the proposed method for determining the differences in preferences of foreign tourists and domestic tourists. Section 5 discusses the results and presents the conclusions of this study.

2. Related Works

This section introduces previous research that focuses on tourist behavior using geotagged data from social media. Those data are not only considered as an alternative to traditional surveys, but are also expected to reveal information that traditional surveys could not.
Data from social media make it possible to analyze the mobility of tourists around the world. Hawelka et al. [16] analyze global human mobility on the basis of worldwide geolocation data from Twitter. The analysis results show that the number of visitors to each country estimated from Twitter data is in line with the official statistics on international tourism.
The extraction of popular touristic sites and routes from social media data is one of the most commonly studied topics. Crandall et al. [5], Yang et al. [6], and Zhou et al. [7] propose methods for extracting landmarks by clustering locations where photos are taken based on data from Flickr. Wei et al. [8] propose a method to construct popular routes from uncertain trajectories on the basis of data obtained from Foursquare.
Some research makes an attempt to evaluate the attractiveness of each touristic site based on tourist mobility. Bassolas et al. [17] assess the attractiveness of 20 worldwide touristic sites. The research assesses attractiveness on the basis of two metrics: average distance between the location of residence and the touristic site, and the area covered by the visitors’ places of residence computed as the number of countries of residence. Sobolevsky et al. [18] also quantify a city’s attractiveness to foreign visitors on the basis of the total activity in the data obtained from Flickr, Twitter, and bank card transactions.
Some research utilizes worldwide geotagged data from social media to compare the mobilities of foreign tourists and domestic tourists. Vu et al. [12] analyze the differences in the popular locations and routes in Hong Kong of Western tourists and Asian tourists. They apply the Markov chain to mine travel patterns in geotagged photo data from Flickr. Paldino et al. [13] analyze geotagged photo data in American cities and European cities from Flickr. This research shows that the spatial convergence of foreign tourist activity in each city is higher than that of domestic tourists.
Tourist preferences have also been researched on the basis of data obtained from social media. Hausmann et al. [19] explore tourist preferences for biodiversity in protected areas on the basis of data obtained from Flickr and Instagram. Keeler et al. [20] assess the relationship between lake visitation and selected lake attributes for more than 1000 lakes in the Midwestern US states of Minnesota and Iowa. The research shows that recreational lake users visit clear lakes more often than less-clear lakes.
Recommending touristic sites and routes is among the most popular topics of research. Zheng et al. [9], Kurashima et al. [10], and Majid et al. [11] propose methods for recommending touristic sites and routes on the basis of users’ location histories. Kurashima et al. [21] and Hu et al. [22] propose geographical topic models to characterize each location based on text data from social media for personalized location recommendations.
The analysis of tourist sentiment is also drawing attention as a novel research topic. Philander et al. [23] demonstrate the application of sentiment analysis using Twitter data to measure customers’ perceptions of hospitality. Shi et al. [24] apply sentiment analysis to data obtained from Weibo to understand tourist opinions about crowdedness. Zhu et al. [25] detect sentiment hotspots in space and time via deep learning with geotagged photo data from Flickr.
Miah et al. [26] propose a comprehensive method to support strategic decisions by combining four computational techniques (text processing, geographical data clustering, visual content processing, and time series modeling) on the basis of Flickr data. This method enables decision makers to easily grasp tourist interests, trends, and seasonal patterns.
Georgiev et al. [27] analyze data from Foursquare to identify the factors determining whether local facilities increased the number of customers during the London Olympic Games in 2012. Foursquare includes categorical information about each facility, such as food, hotel, and airport, and this information is successfully utilized in the analysis.
Although various methods for analyzing tourist behavior have been developed, methods of performing the following tasks have not been reported:
  • Separating the locations of tourist destinations from those of merely popular locations (e.g., shopping centers).
  • Evaluating the attractiveness of destinations on the basis of both the number of tourist arrivals and the distance from tourists’ places of residence.
  • Understanding what characteristics of each location contribute to the number of domestic tourist arrivals and that of foreign tourist arrivals.
To the best of our knowledge, there has been no attempt to propose a method for understanding the differences in the preferences of foreign tourists and domestic tourists. This study is made possible by using tourist mobility data from geotagged Twitter data and data of POIs from Foursquare. Our research aims to fill the gaps by developing methods to perform the above tasks by using geotagged data obtained from Twitter and Foursquare.

3. Extraction of Tourist Destinations

In this section, we propose a method of extracting the locations of tourist destinations. A tourist destination is believed to have unique attractive features that other locations do not have. Therefore, we assume that the locations of tourist destinations have both high attractiveness and high originality. We evaluate the attractiveness of each location on the basis of both the number of visitor arrivals and the distance from visitors’ places of residence. We evaluate the originality of each location by analyzing the ratio of area-specific words on the basis of text data. We apply this method to geotagged data collected from Twitter in Japan.

3.1. Identifying Hotspots of Touristic Destinations

To extract the locations of tourist destinations, we first distinguish each individual’s personally important locations (home, workplace, school) from places rarely visited by the person by using DBSCAN (Density-Based Spatial Clustering Algorithm with Noise), which was proposed by Ester [28]. This algorithm infers places where a person’s locational traces are densely located as personally important places. This algorithm is applicable to traces that are continuously recorded. However, it cannot be applied to geotagged tweet data because Twitter users do not post tweets continuously, and they tend to post many tweets on special occasions. Therefore, we modify DBSCAN for geotagged tweet data. The ordinary DBSCAN classifies points when each point has at least the given minimum number of points in the neighborhood of a given radius. Our modified DBSCAN requires each cluster to have points from a given minimum number of days in the neighborhood.The detailed algorithm is below:
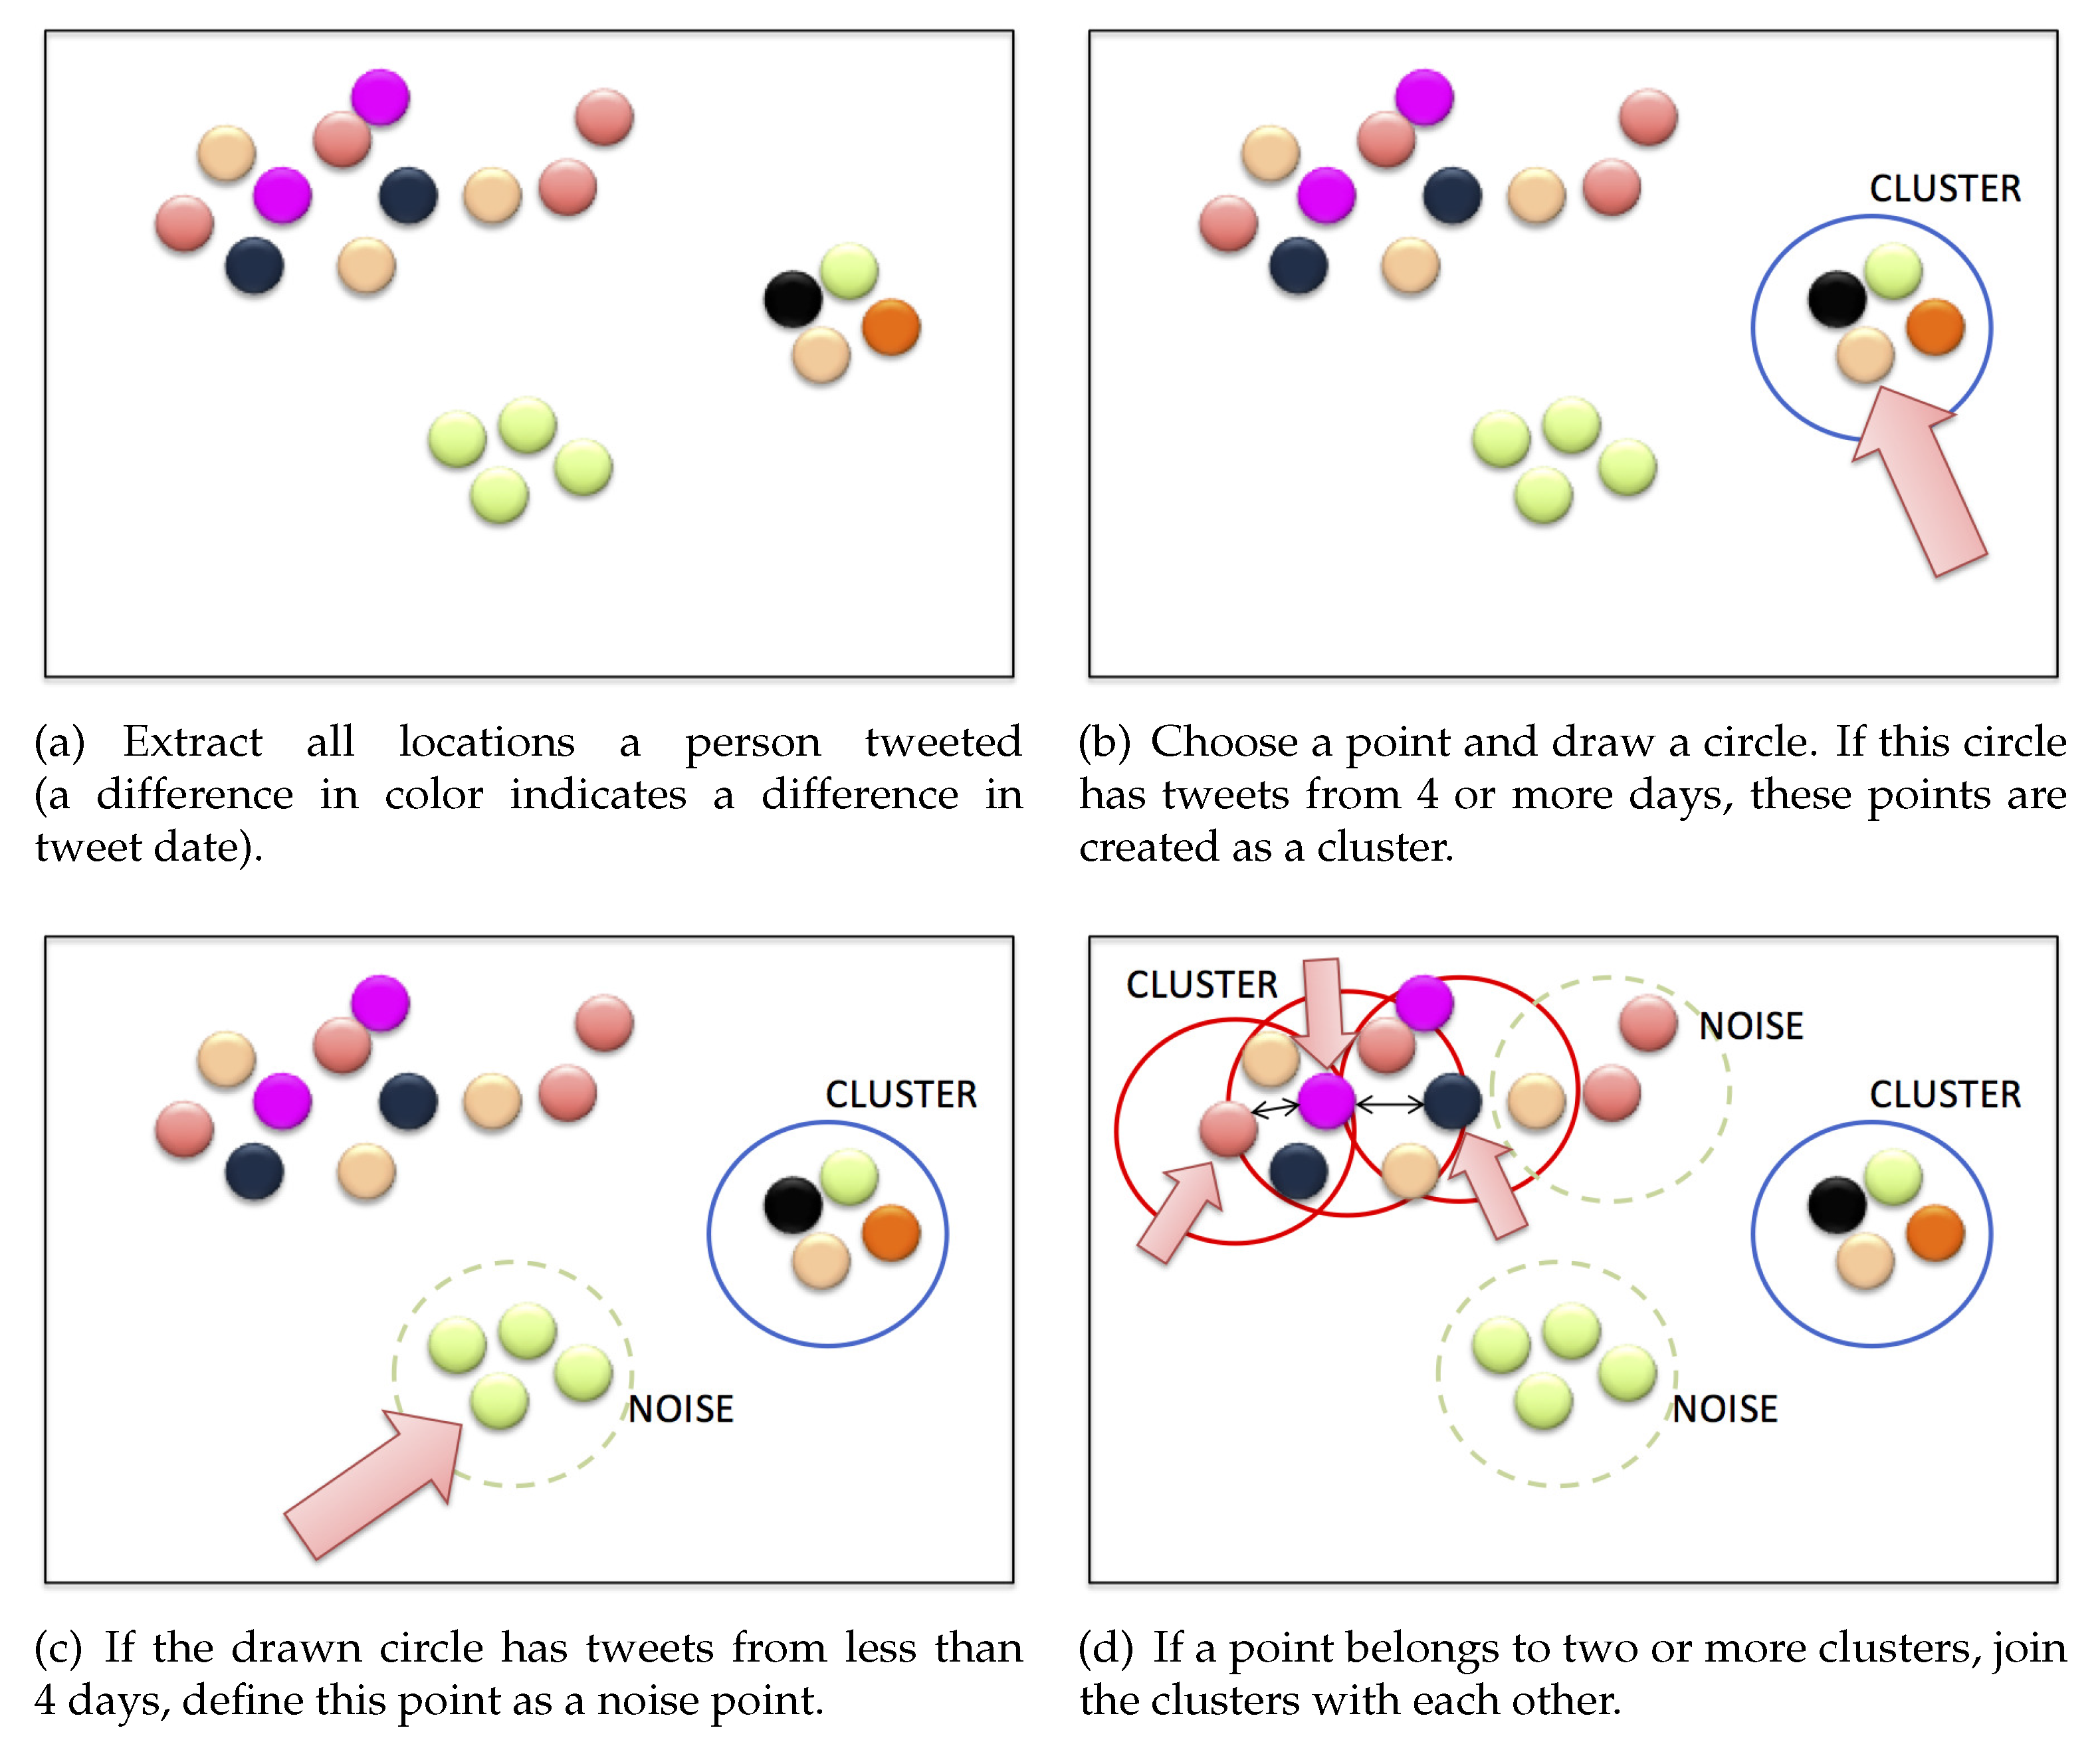
  • Extract all locations where a person tweeted. Figure 1a illustrates a person’s tweet locations. A difference in color indicates a difference in tweet date.
  • Choose a tweet and draw a circle centered on the tweet’s location. The radius can be set to an arbitrary length; here, we set the radius to 4 km. If this circle contains tweets of 4 days or more, we define the group of these tweets in this circle as a cluster. The numbers of days can also be set arbitrarily. In Figure 1b, a circle is drawn around a point indicated by an arrow. This circle contains tweets from 4 days, so these points are created as a new cluster.
  • Choose another tweet that has not previously been chosen and draw a circle centered on the tweet’s location. If this circle does not contain tweets from 4 days, the tweet is defined as a noise point. In Figure 1c, a circle is drawn around a point indicated by an arrow. This circle contains tweets from only 1 day, so this point is regarded as a noise point.
  • When a point belongs to two or more clusters, the clusters are combined. In Figure 1d, three circles are drawn around the points indicated by the arrows, and the points within each circle form a cluster. Since the points indicated by the arrows are reachable from each other, these three clusters form a single cluster.
  • Finally, we obtain the person’s noise points and clusters. The clusters extracted from the person’s tweet data are the person’s personally important places (home, workplace, school). The noise points are locations that are rarely visited by the person. We infer the cluster with tweets on the greatest number of days as this person’s home location. If the person has no cluster, we ignore this person’s data.
After extracting all users’ noise points, locations with high densities of noise points are identified via mean-shift clustering. Crandall et al. [5] use this clustering method to extract landmarks from geotagged photo collections. Mean-shift clustering uses an iterative procedure to cluster densely located points. In each step, every point moves toward the center of gravity of the points located in the neighborhood. These steps are continued until convergence. The radius of the neighborhood can be set to an arbitrary length; here, we set the radius to 2 km. Regarding the convergence rule, the iterative procedure ends when all the points in a cluster are in a smaller circle with a given radius. In the present study, we set the radius to 300 m. Finally, the gravity point of each cluster is regarded as the representative point of the cluster. In this way, we classify all noise points and identify each cluster’s center of gravity as its representative location. By classifying noise points, our method avoids double-counting tweets that are posted multiple times in nearby locations by a user.

3.2. Evaluation of the Attractiveness of Each Location Using the Gravity Model

Tourist destinations are thought to attract many visitors who live in distant locations. The proposed method calculates the attractiveness of each location using a gravity model, which is the prevailing framework for explaining population movement (e.g., Zipf [29]; Jung et al. [30]; Simini et al. [31]), and is described by the following equation:
I i , j = G P i P j D i j α .
In this equation, I i , j denotes the amount of human flow between locations i and j. P i and P j denote the populations of locations i and j. G denotes a constant. α denotes the distance coefficient.
Our research modifies this equation to calculate the attractiveness of each location. Equation (2) is used to define the probability that a person who is currently at location s chooses to move to location e.
P ( s e | s ) = A e D s e α / E s
  • A e : Attractiveness of destination e (unknown variable)
  • D s e : Distance between origin s and destination e (known variable)
  • α 
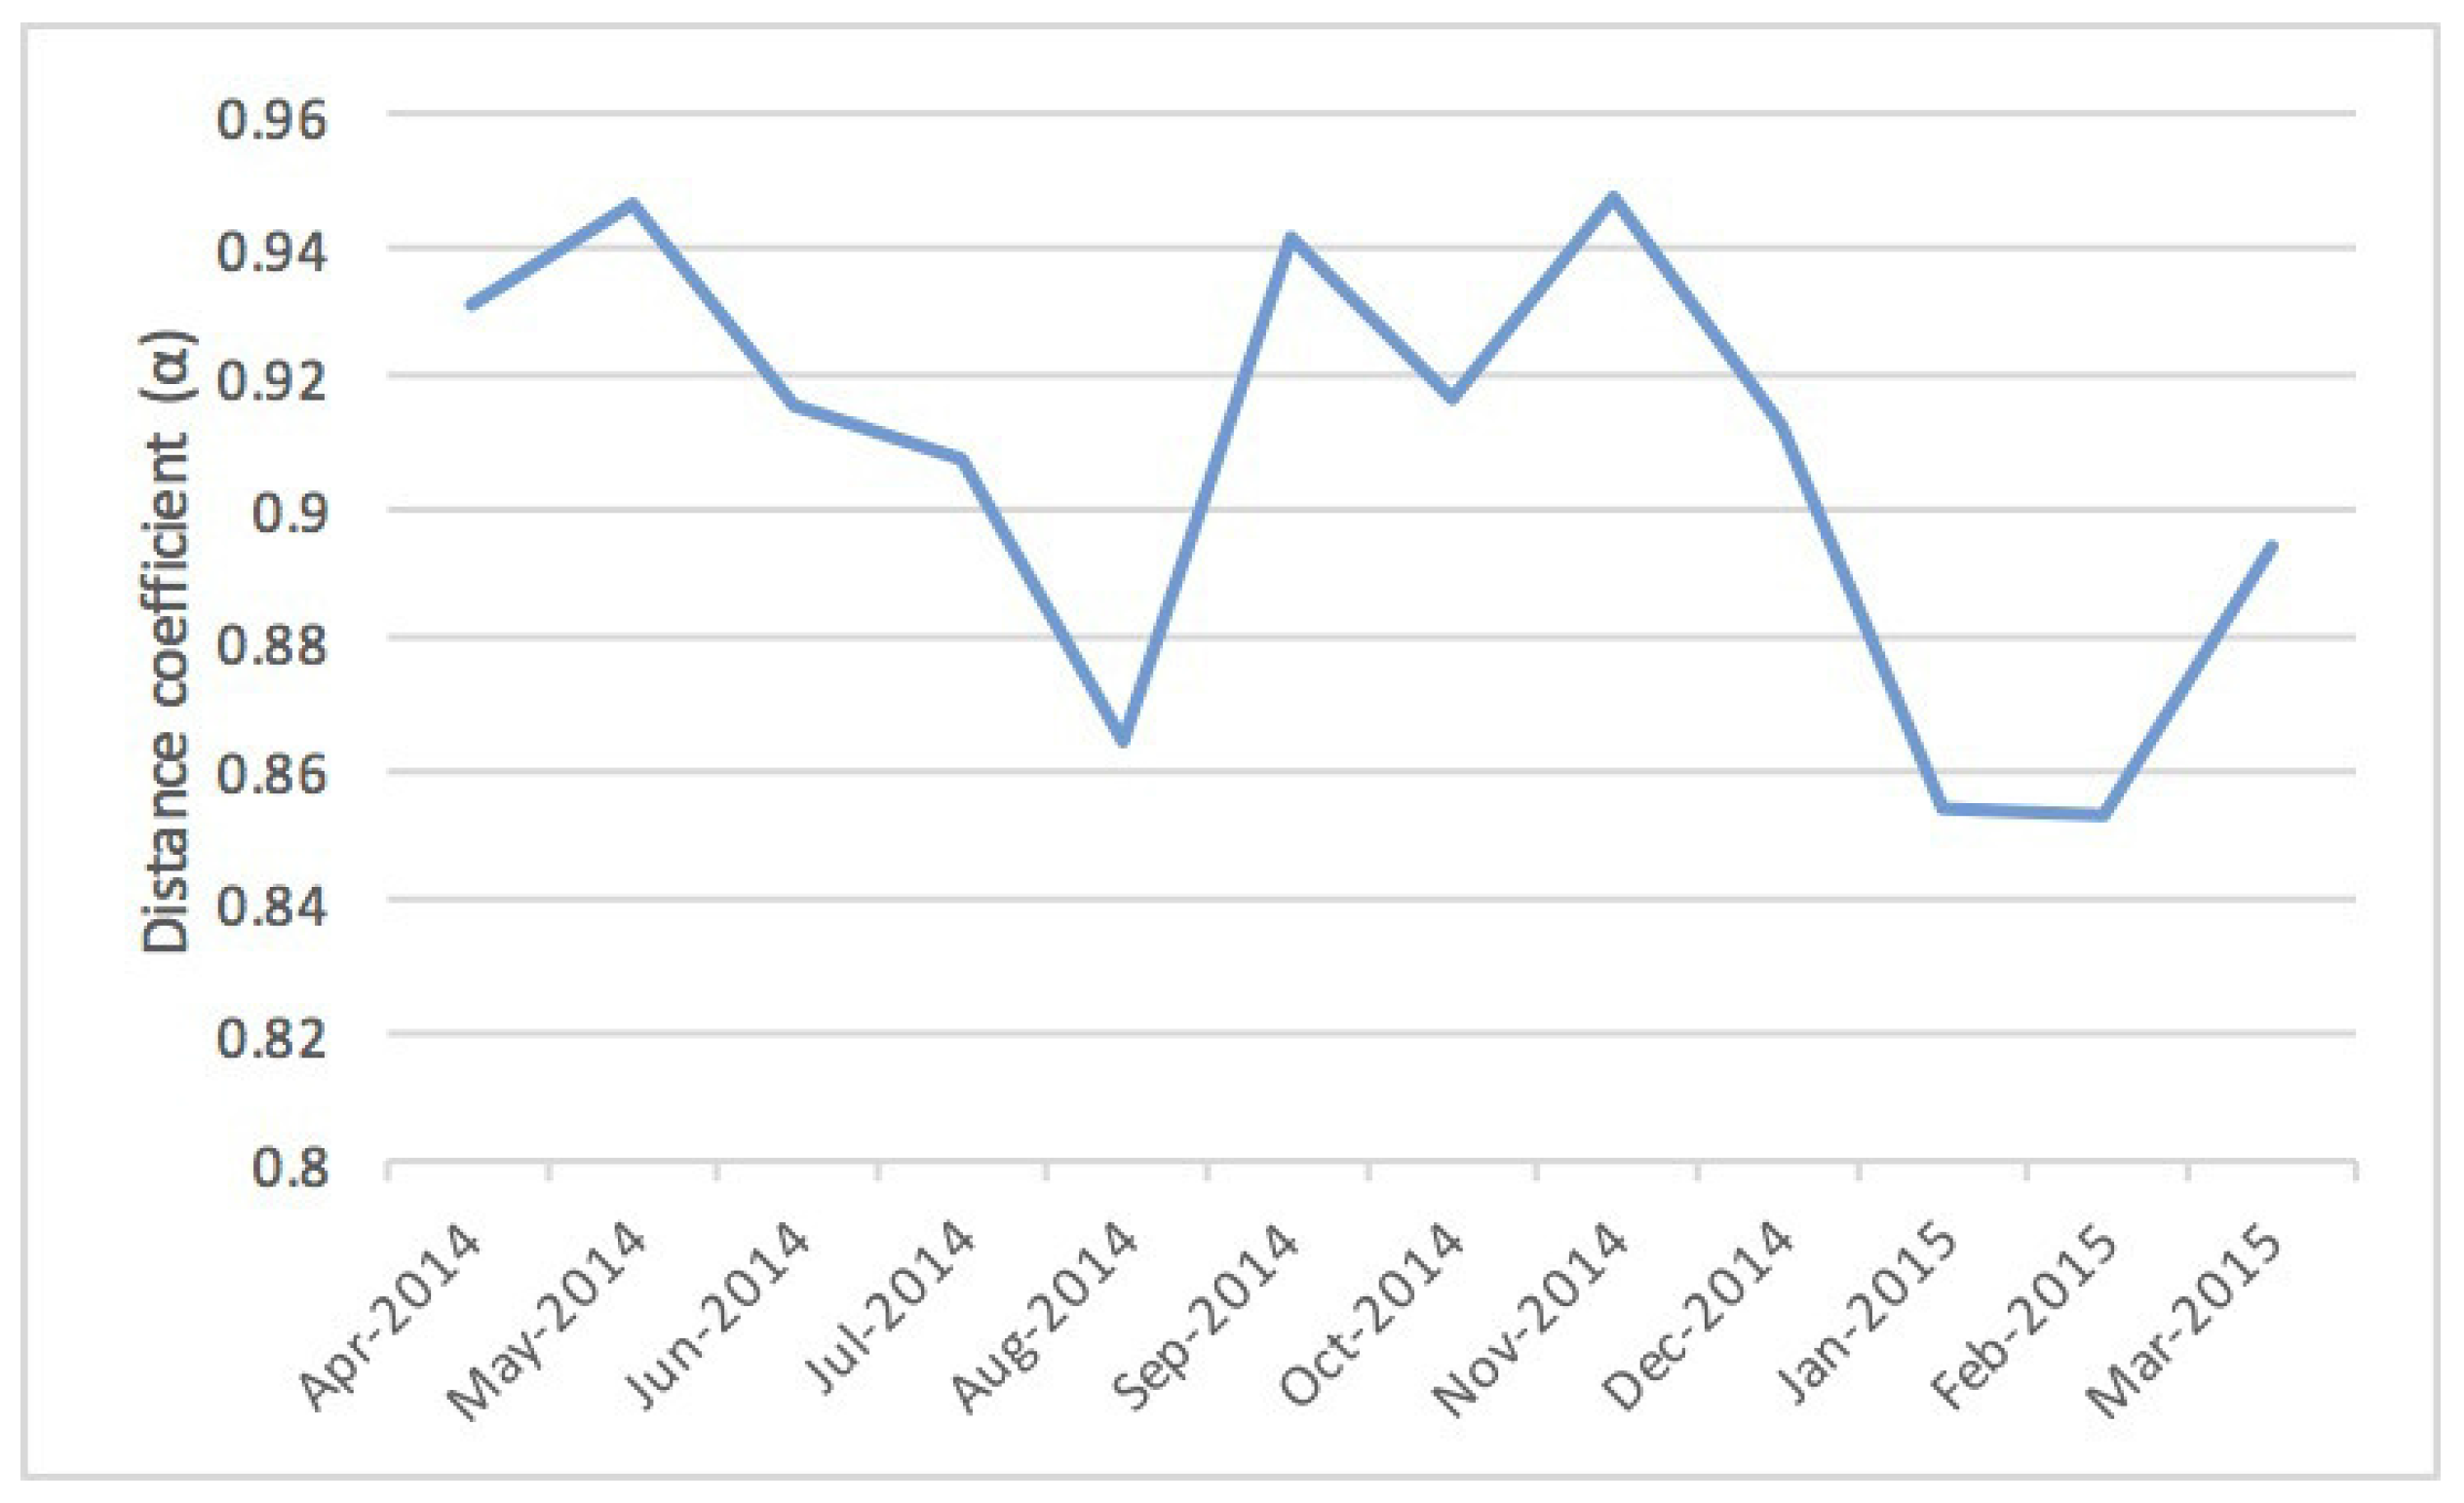
: Distance coefficient (unknown variable)
  • E s : Sum of the attractiveness of all points divided by the distance to the origin s (unknown variable)
    E s = j L A j D s j α
  • K: A set of all origins
  • L: A set of all destinations
The problem here is to find the values of all the unknown variables; namely, E i ( i K ) , A j ( j L ) , and α .
The probability that a user who is at origin s chooses to visit destination e out of all destinations is calculated on the basis of Twitter data. The calculated probability P ^ is described as below:
P ^ ( s e | s ) = T s e j L T s j
  • T s e : The number of visits from origin s to destination e based on the Twitter data (known variable)
The following equation is derived from Equations (2) and (4):
T s e j L T s j = A e D s e α / E s .
In order to put the all unknown variables (namely, E i ( i K ) , A j ( j L ) , and α ) in one equation, we use indicator functions x i and y j .
T s e j L T s j = j L ( y j × A j ) D s e α / i K ( x i × E i )
x i = 1 ( i = s ) 0 ( i s ) , y j = 1 ( j = e ) 0 ( j e )
The natural log of both sides of Equation (6) is then taken and used for multiple linear regression analysis.
log T s e j L T s j = j L ( y j × log A j ) α × log D s e i K ( x i × log E i ) + c
The left side is the explained variable that can be obtained from Twitter data. The explanatory variables are x i ( i K ) , D s e , y j ( j L ) , and the coefficients are log A j ( j L ) , α , log E i ( i K ) . Finally, c is a constant.
The attractiveness of each destination A e , the destination coefficient α , and the total attractiveness E s around each origin are calculated via multiple linear regression analysis.

3.3. Evaluation of the Originality of Each Location Using Term Frequency-Inverse Document Frequency  (TF-IDF)

We use the text data of tweets that users post at rarely visited locations to evaluate the originality of each place. The words of all tweets posted at each location are integrated to form a single document. If the document contains words that appear more frequently in that document than in other documents, the document is thought to have high originality. The users who have visited the location are thus thought to have written area-specific words many times, so the location is believed to have attracted visitors due to its area-specific attractive features that other locations do not have. In this way, we evaluate the originality of each location. For example, Mt. Fuji is thought to have high originality. The three most frequently posted words near Mt. Fuji are a Japanese word that means Mt. Fuji, a Japanese word that means sunrise viewed from the top of a high mountain, and a Japanese word that means the fifth station of Mt. Fuji. Those words are rarely used at other locations, so it can be inferred that Mt. Fuji has high originality. On the other hand, the most frequently posted words near shopping centers are a Japanese word that means shopping, a Japanese word that means parking lot, and the name of Japan’s largest shopping mall developer. These words also appear frequently in other places, so the location has low originality.
The originality of each location is inferred by using an indicator, TF-IDF [32]. The TF-IDF of a word in a document indicates how the word characterizes the document. This indicator is used to extract the characteristic keywords of each document. TF-IDF is the product of TF (term frequency) and IDF (inverse document frequency). The TF-IDF of a word w i and a document d is defined as below:
TFIDF w i , d = TF w i , d × IDF w i , d ,
TF w i , d = N w i , d k N w k , d ,
IDF w i , d = log | D | | d : d w i | ,
where N w i , d is the number of times that the word w i appears in document d. | D | is the number of all documents.
Users at locations with high originality frequently add region-specific words to their tweets, whereas users in areas with low originality do the opposite. As for locations with high originality such as Mt. Fuji, a few words have extremely high TF-IDFs compared to those of other words in the same document. In regard to locations with low originality, no words have extremely high TF-IDF; therefore, the originality of each location is defined by Equation (12):
O d = w i W TFIDF w i , d
  • W : A set of w i whose TF-IDF indicates the word is in the top 10% of the words in document d.
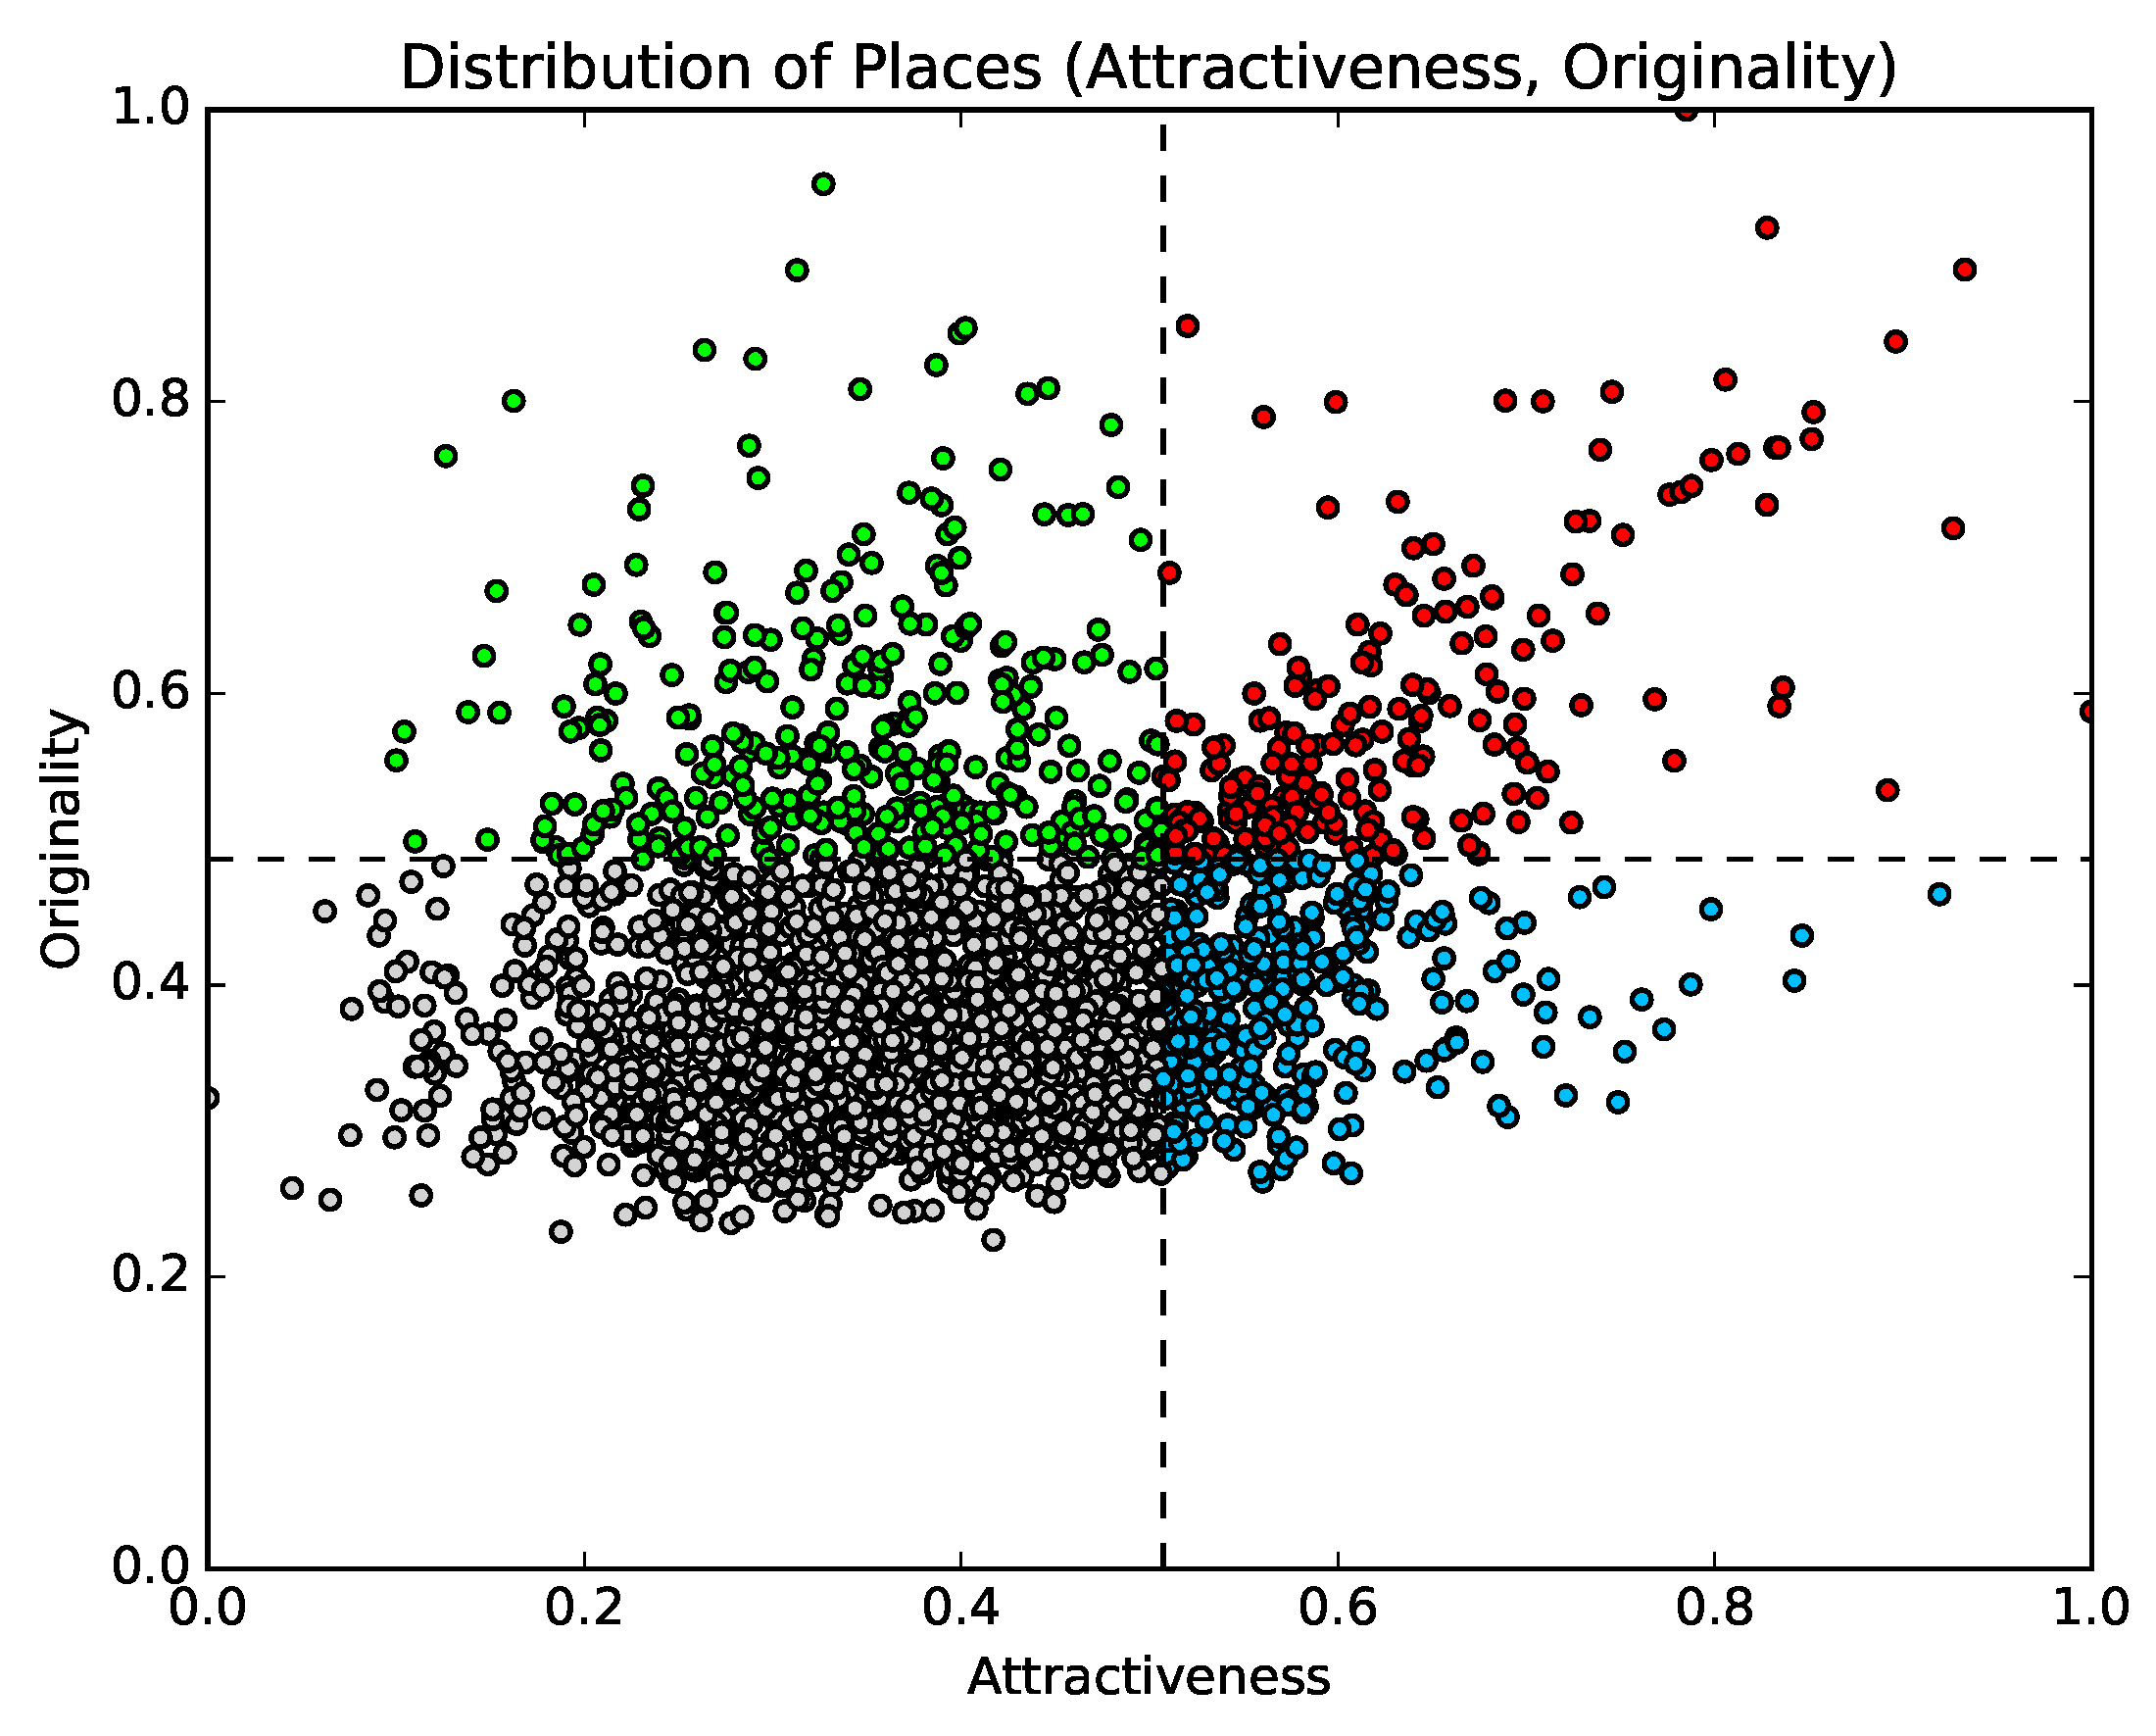
3.4. Results

To extract the locations of tourist destinations, we utilize Twitter data posted in Japan each month from April 2014 to March 2015.
The following variables are listed in Table 1:
  • Number of users whose home locations can be inferred by DBSCAN and who have posted tweets from at least one rarely visited location.
  • Coefficient of determination ( R 2 ) for Equation (8).
  • Distance coefficient ( α ) calculated from Equation (8).
As shown in Table 1, each coefficient of determination is greater than 0.72, so Equation (8) is regarded as suitable for the data. The distance coefficients are between 0.68 and 0.95. Figure 2 shows a time series graph of the distance coefficient. The distance coefficient is low during August, January and February, presumably because those months are holiday seasons in Japan when tourists tend to travel to far destinations.
In this paper, locations are classified into four groups based on tweet data from August 2014. Figure 3 shows how our method classifies the locations. The horizontal axis indicates attractiveness, and the vertical axis indicates originality. Both attractiveness and originality are regularized by the maximum values. The dashed line parallel to the vertical axis divides the locations into a group of locations with top-20% attractiveness and a group of locations with bottom-80% attractiveness. The dashed line parallel to the horizontal axis divides locations into a group of locations with top-20% originality and a group of locations with bottom-80% originality. The locations colored red and shown in the upper right of the figure have both top-20% attractiveness and top-20% originality. Those locations are defined as the locations of tourist destinations. The thresholds are set arbitrarily in this study, so the problem of determining the most suitable thresholds requires further study.
The spatial distributions of the locations in each group are shown in Figure 4. We examine the types of locations included in each group.
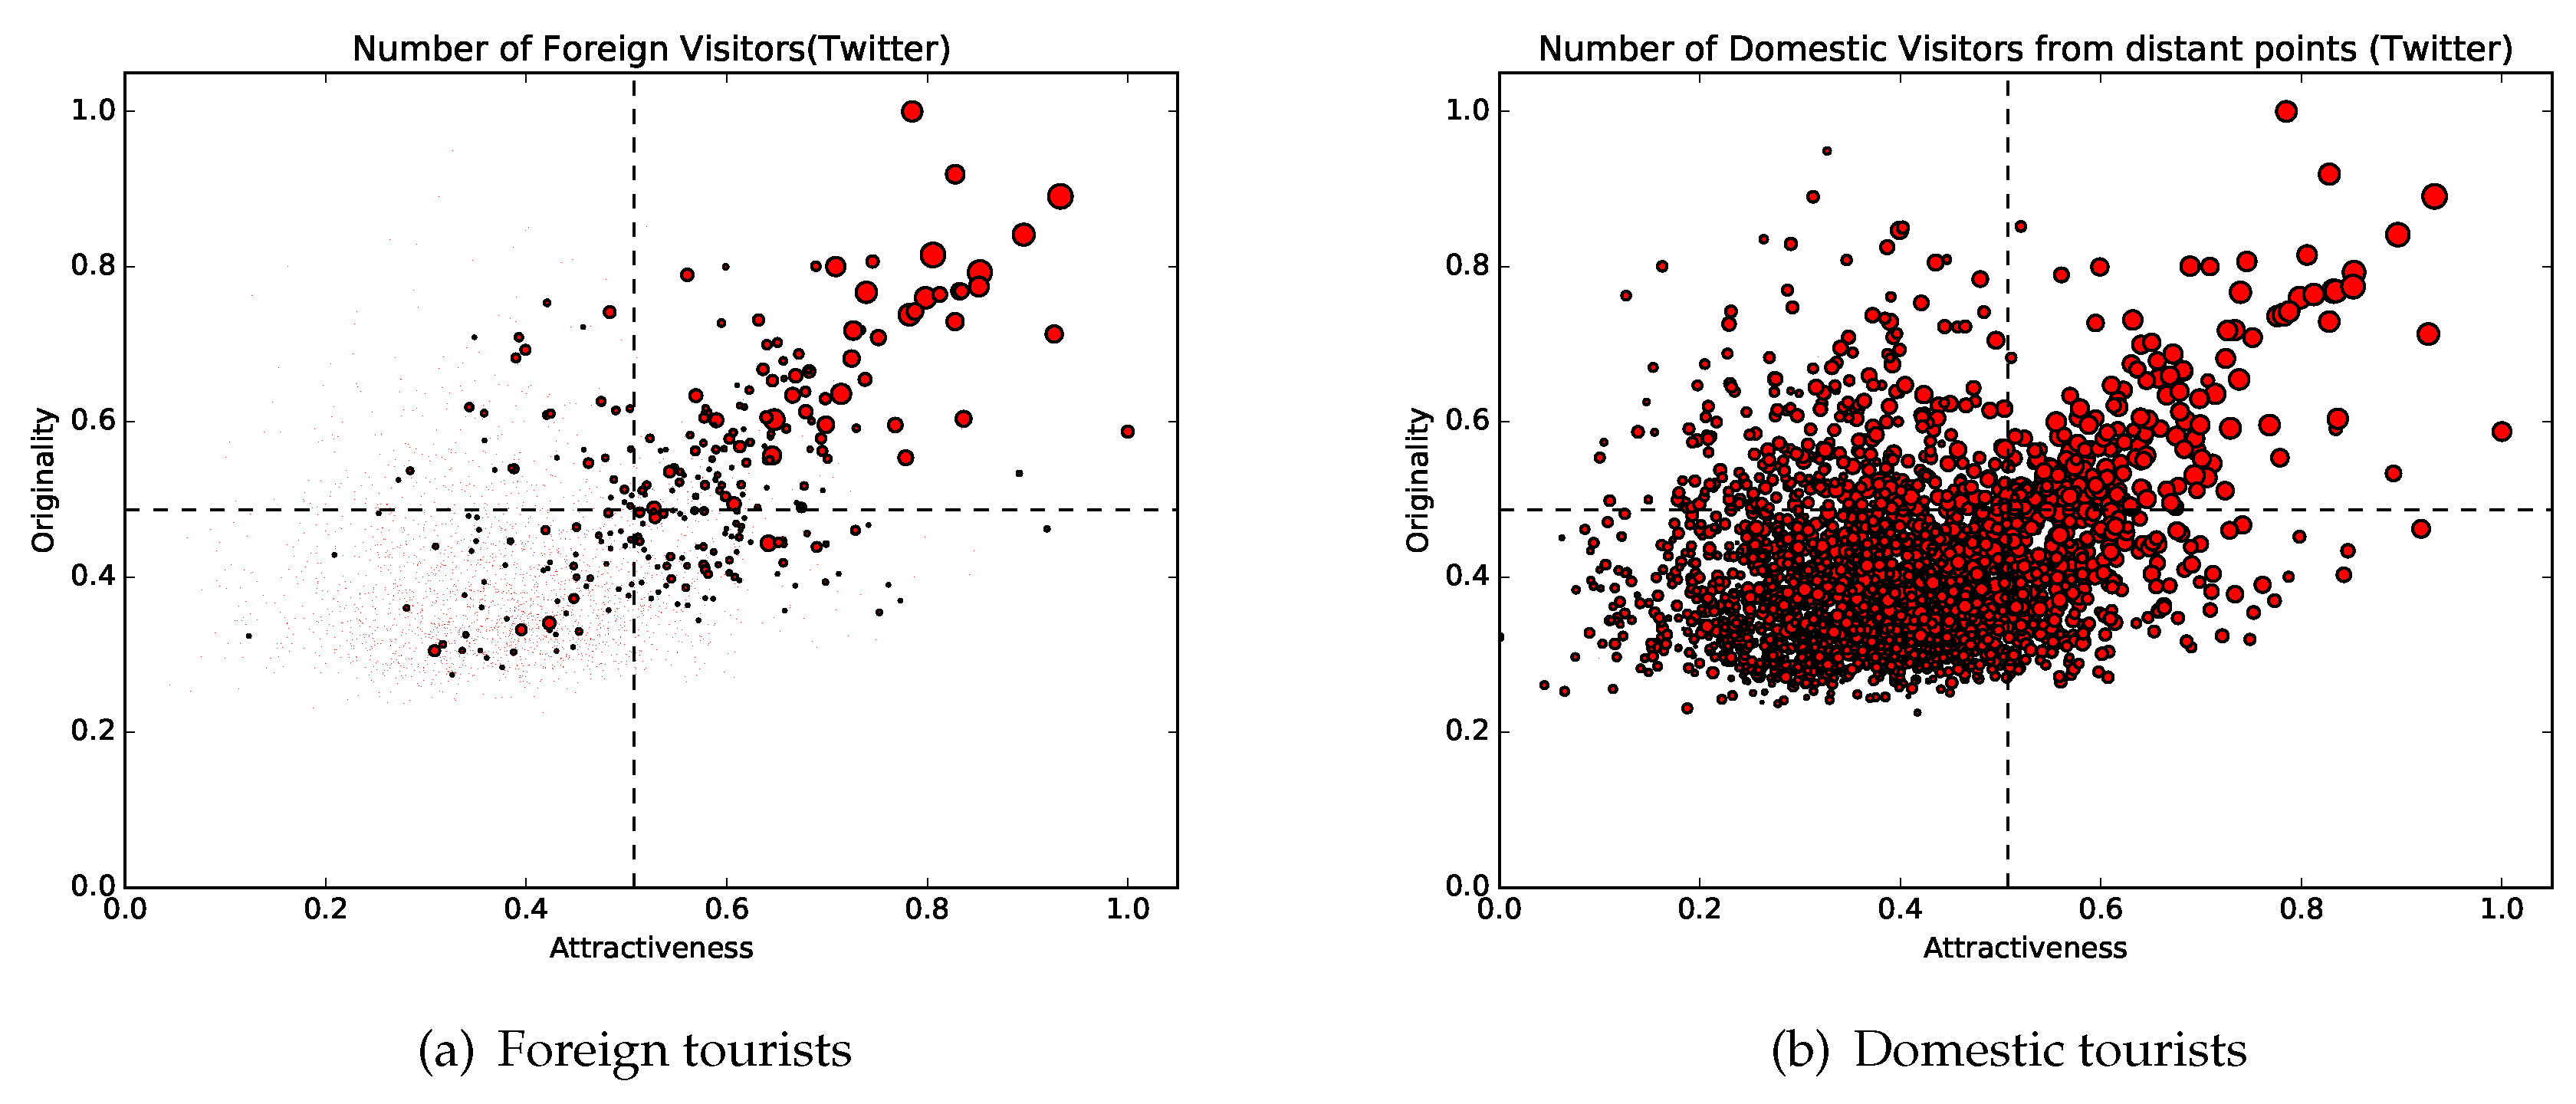
  • Red points (attractiveness: top 20%; originality: top 20%)
    This group includes various types of tourist destinations, such as amusement parks, famous mountains, bustling shopping and entertainment districts, and historic sites. Moreover, this cluster contains locations where seasonal events, such as summer rock festivals, are held. On the other hand, the cluster also includes airports, which cannot be recognized as tourist destinations. Airports are included in the group because many people visit airports from distant locations and stay for a brief duration. However, as a whole, most of the locations in this group are regarded as tourist destinations. Twenty-eight of the locations listed on Trip Advisor’s list of the thirty best places in Japan are included in this group [33].
  • Blue points (attractiveness: top 20%; originality: bottom 80%)
    This group includes locations in urban areas with few touristic attractions and many shopping centers.
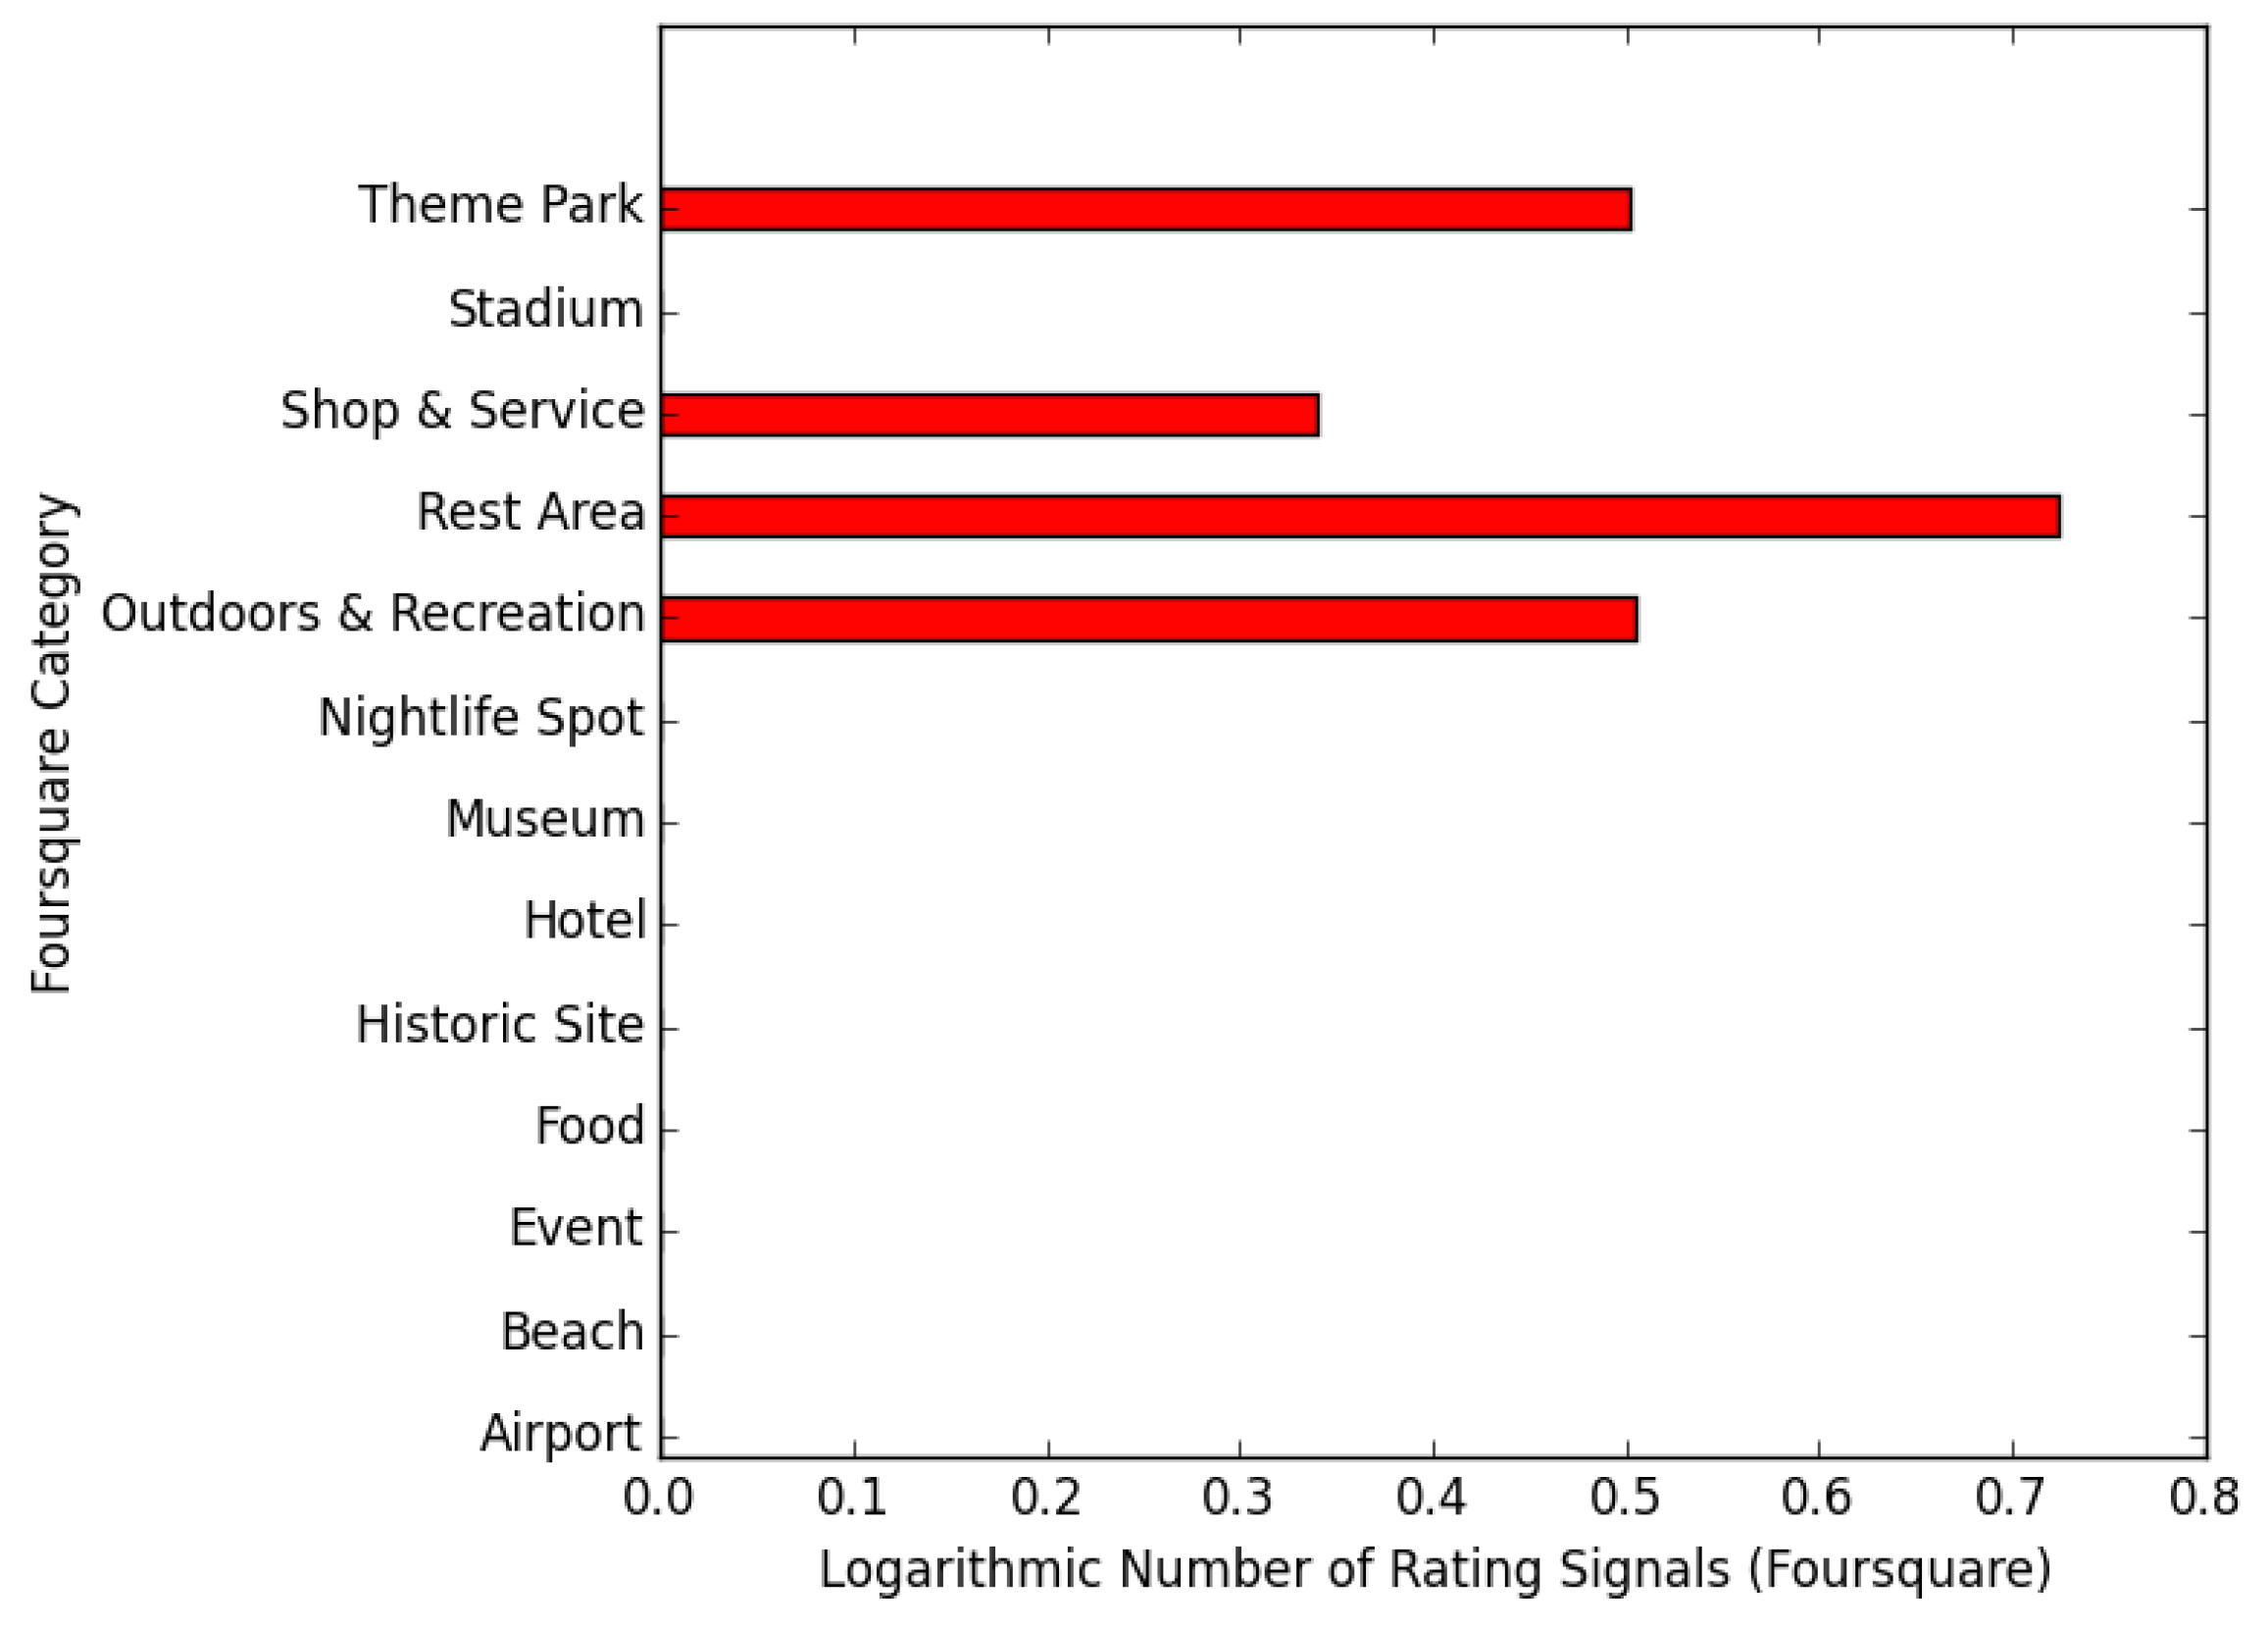
  • Green points (attractiveness: bottom 80%; originality: top 20%)
    This group includes transit points, such as rest areas and ferry stands. The reason these locations have high originality is that topics the users post are very limited (since people do not stay at these locations for long periods of time).

4. Comparison of the Preferences of Domestic Tourists and Foreign Tourists

In this section, we propose a method of assessing the differences in the preferences of domestic tourists and foreign tourists. We characterize each location by what type of POIs are located nearby. To characterize each location, we use data from Foursquare, which include POI information. After characterizing locations, we use the decision tree method to identify the main factors determining the numbers of domestic tourists and foreign tourists.

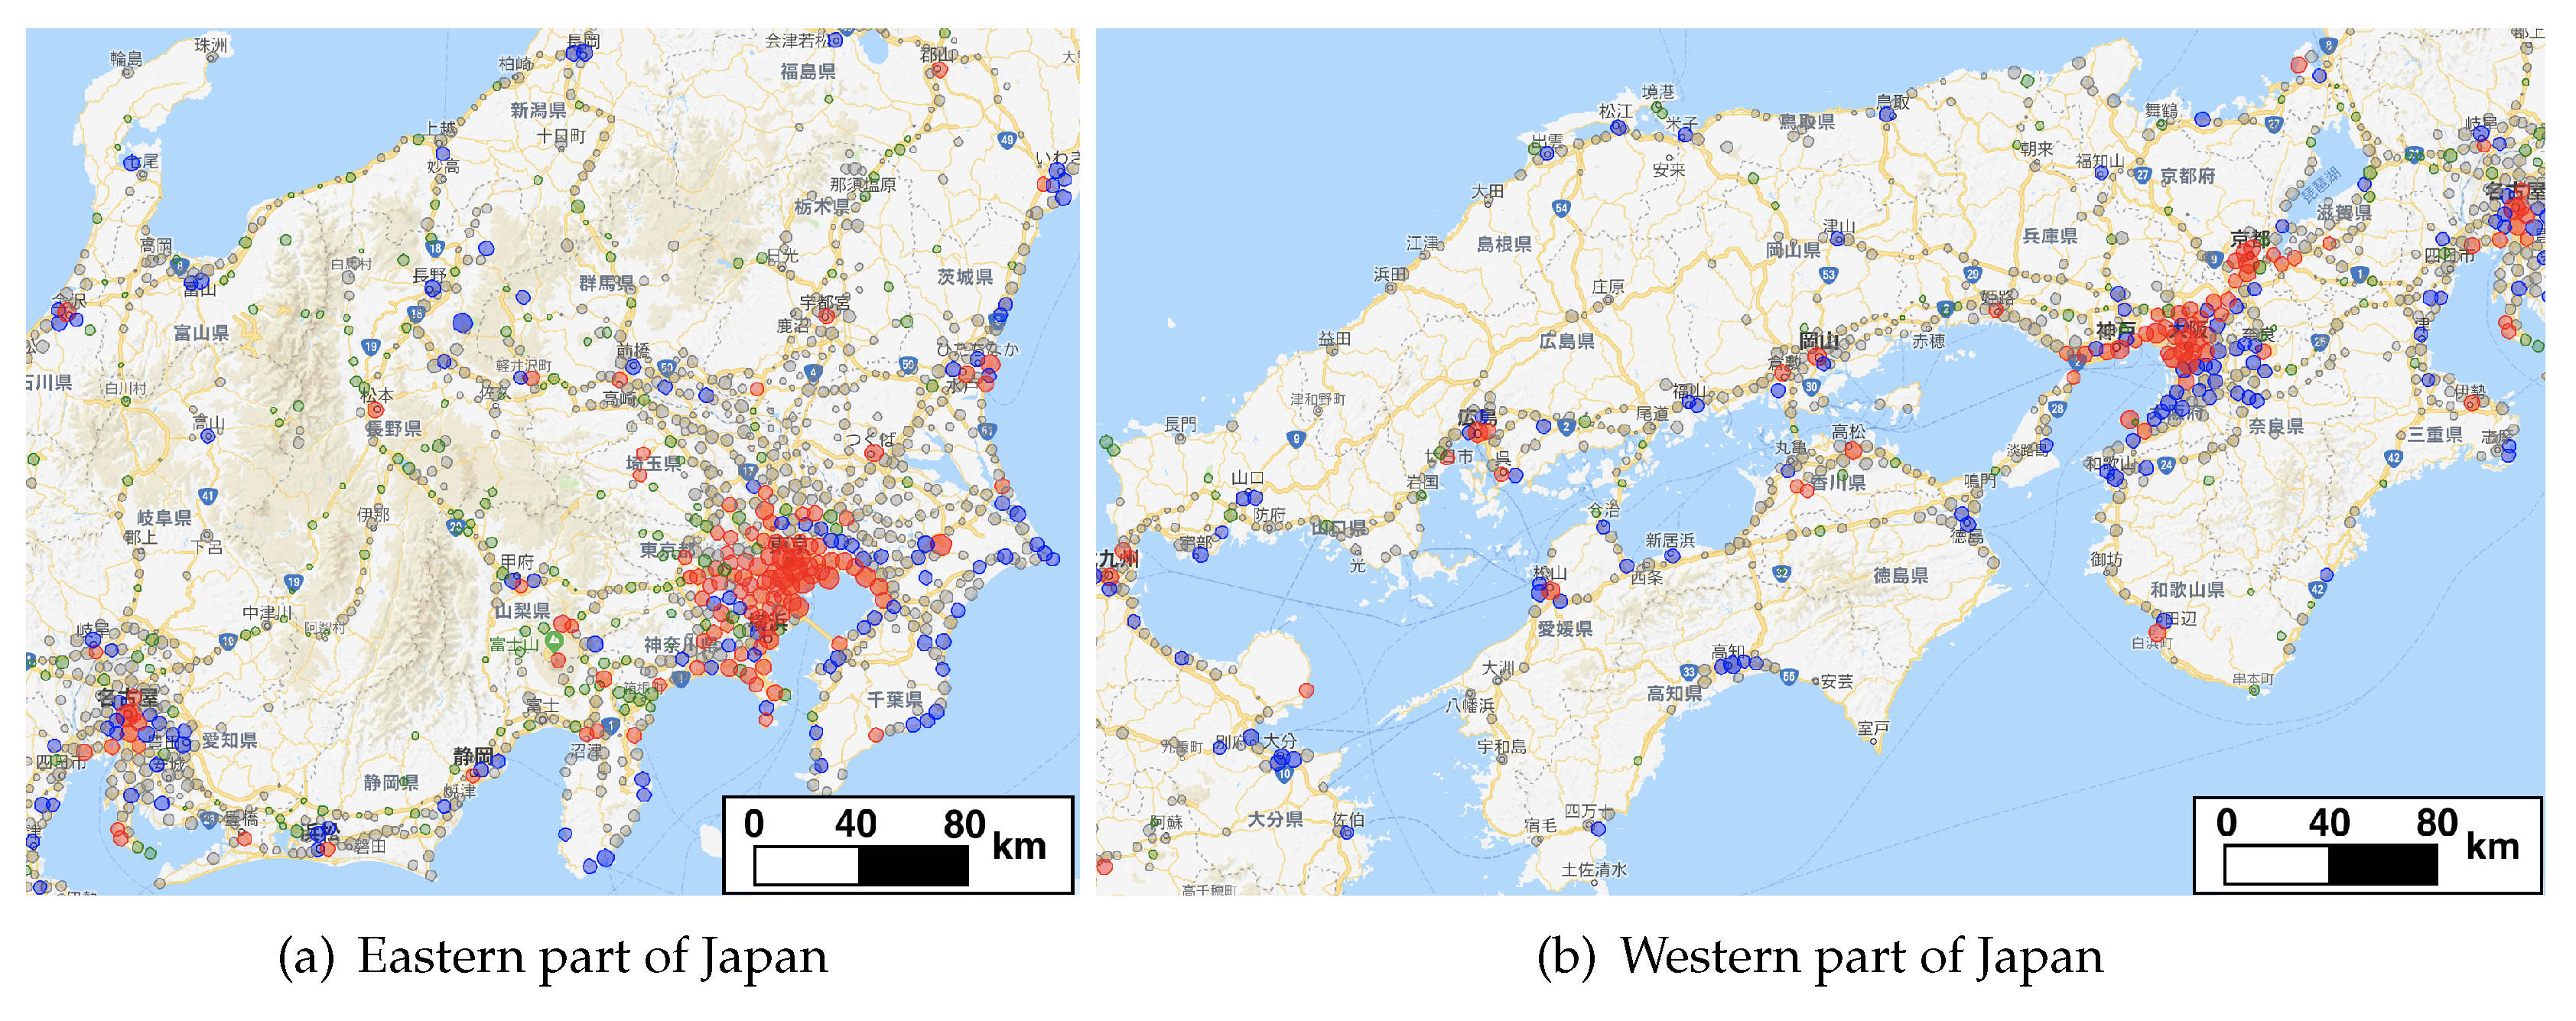
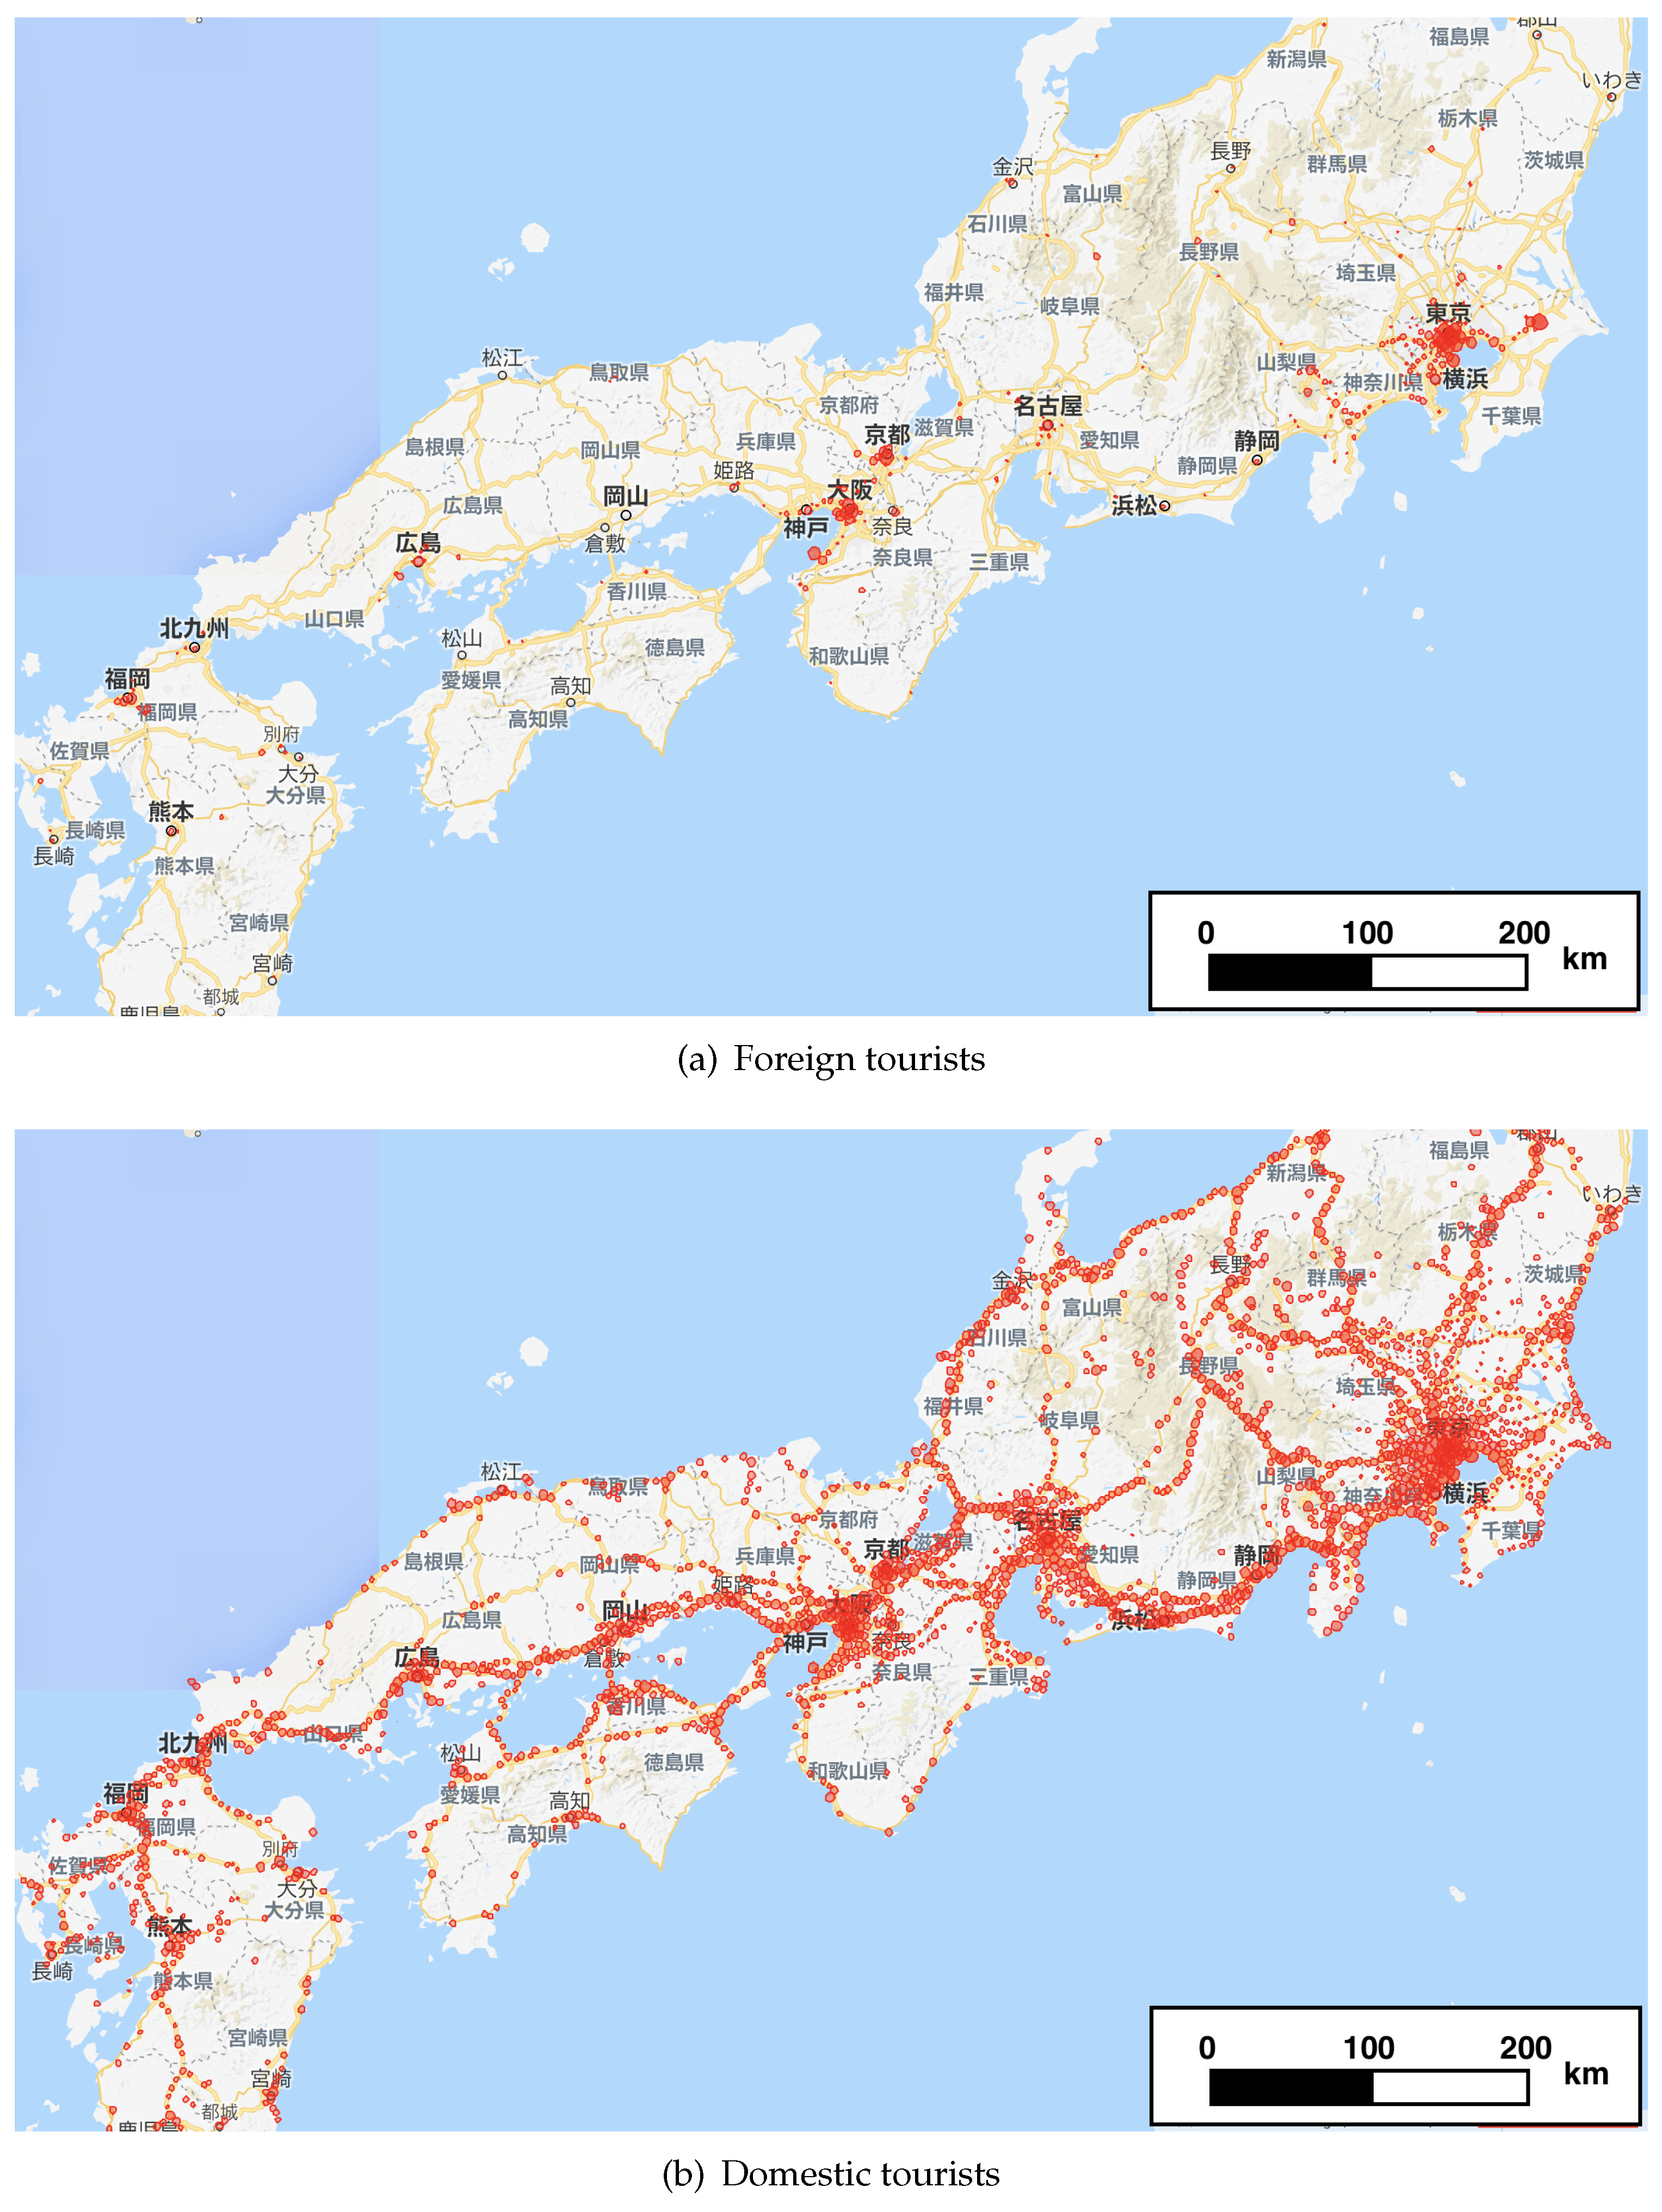
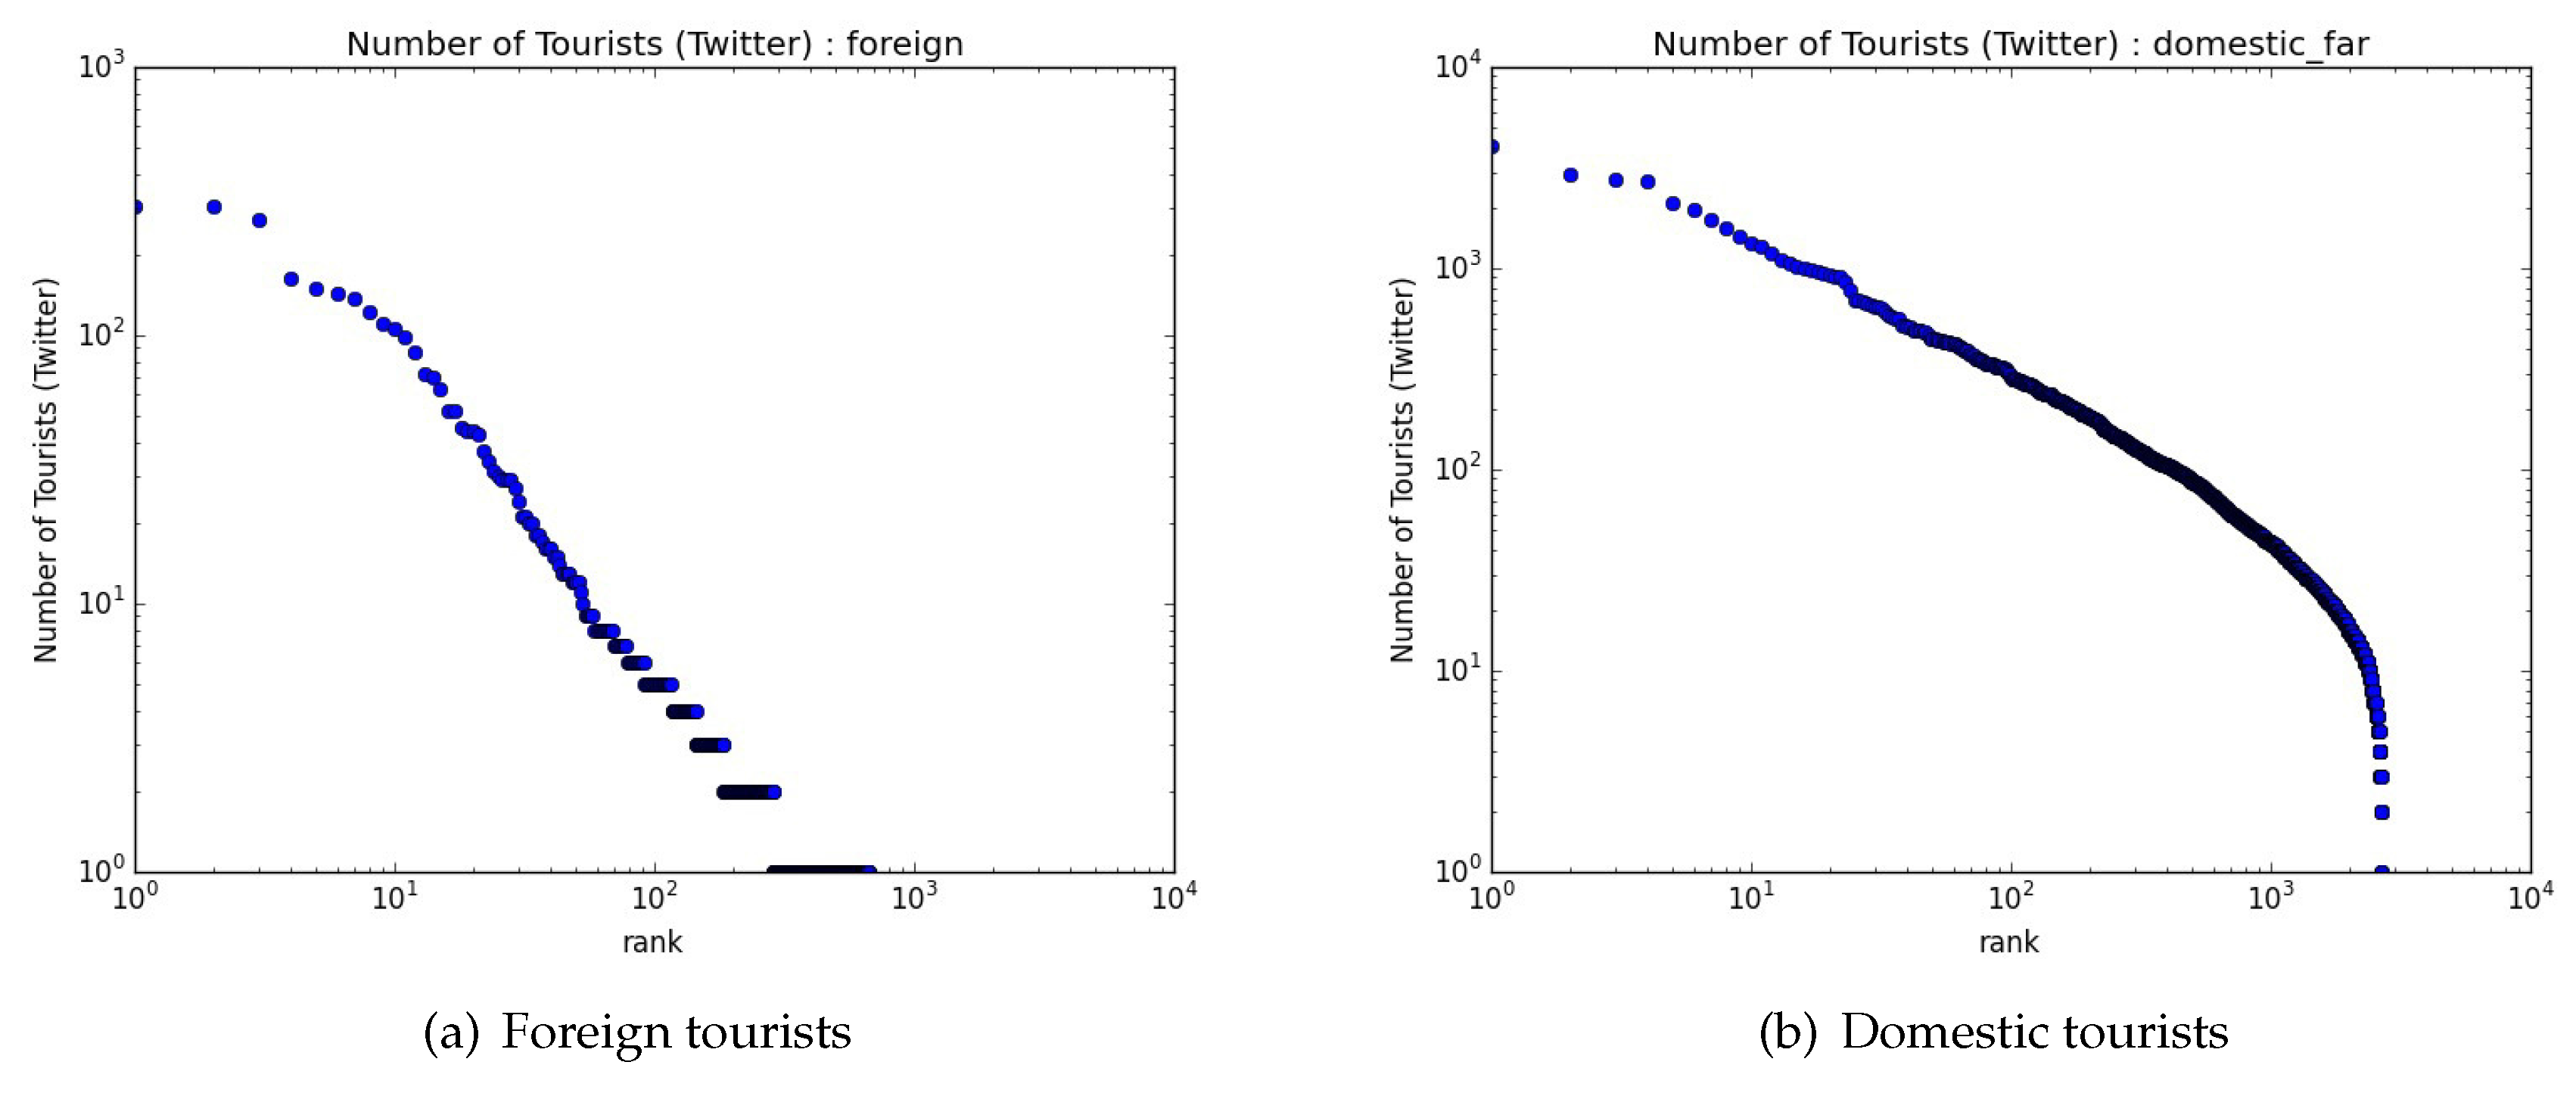
4.1. Distribution of Places Visited by Tourists

To identify foreign tourists, we use worldwide geotagged data collected from Twitter. Geotagged tweet data include the names of countries where tweets have been posted. Based on these data, people who posted tweets in chronological order of Foreign Country A, Japan, Foreign Country A are considered to be foreign tourists. As for domestic tourists, we do not consider an individual to be a tourist if the distance between their inferred home place and a destination is less than 100 km. In this paper, we use tweet data posted in August 2014.
Figure 5a illustrates the spatial distribution of places visited by foreign tourists, and Figure 5b illustrates the distribution of locations visited by domestic tourists. The circles’ radii are proportional to the logarithm of the number of tourists. Figure 6a shows the distribution of the numbers of foreign tourists in each place. Figure 6b shows the distribution of domestic tourists. The vertical axes indicate the number of tourists, and the horizontal axes indicate the ranks of places according to the number of tourists. These two distributions follow a power law, but the slope for foreign tourists is steeper than that for domestic tourists. These four figures show that the spatial convergence of foreign tourists is much higher than that of domestic tourists.
The numbers of foreign tourists and domestic tourists and their relationships with attractiveness and originality are shown in Figure 7a,b. The radius of each circle is proportional to the logarithm of the number of tourists. The figures show that both foreign tourists and domestic tourists visit mostly locations in the upper-right region of the graphs. However, the figures also show that only a few locations attract foreign tourists, while many locations attract domestic tourists.

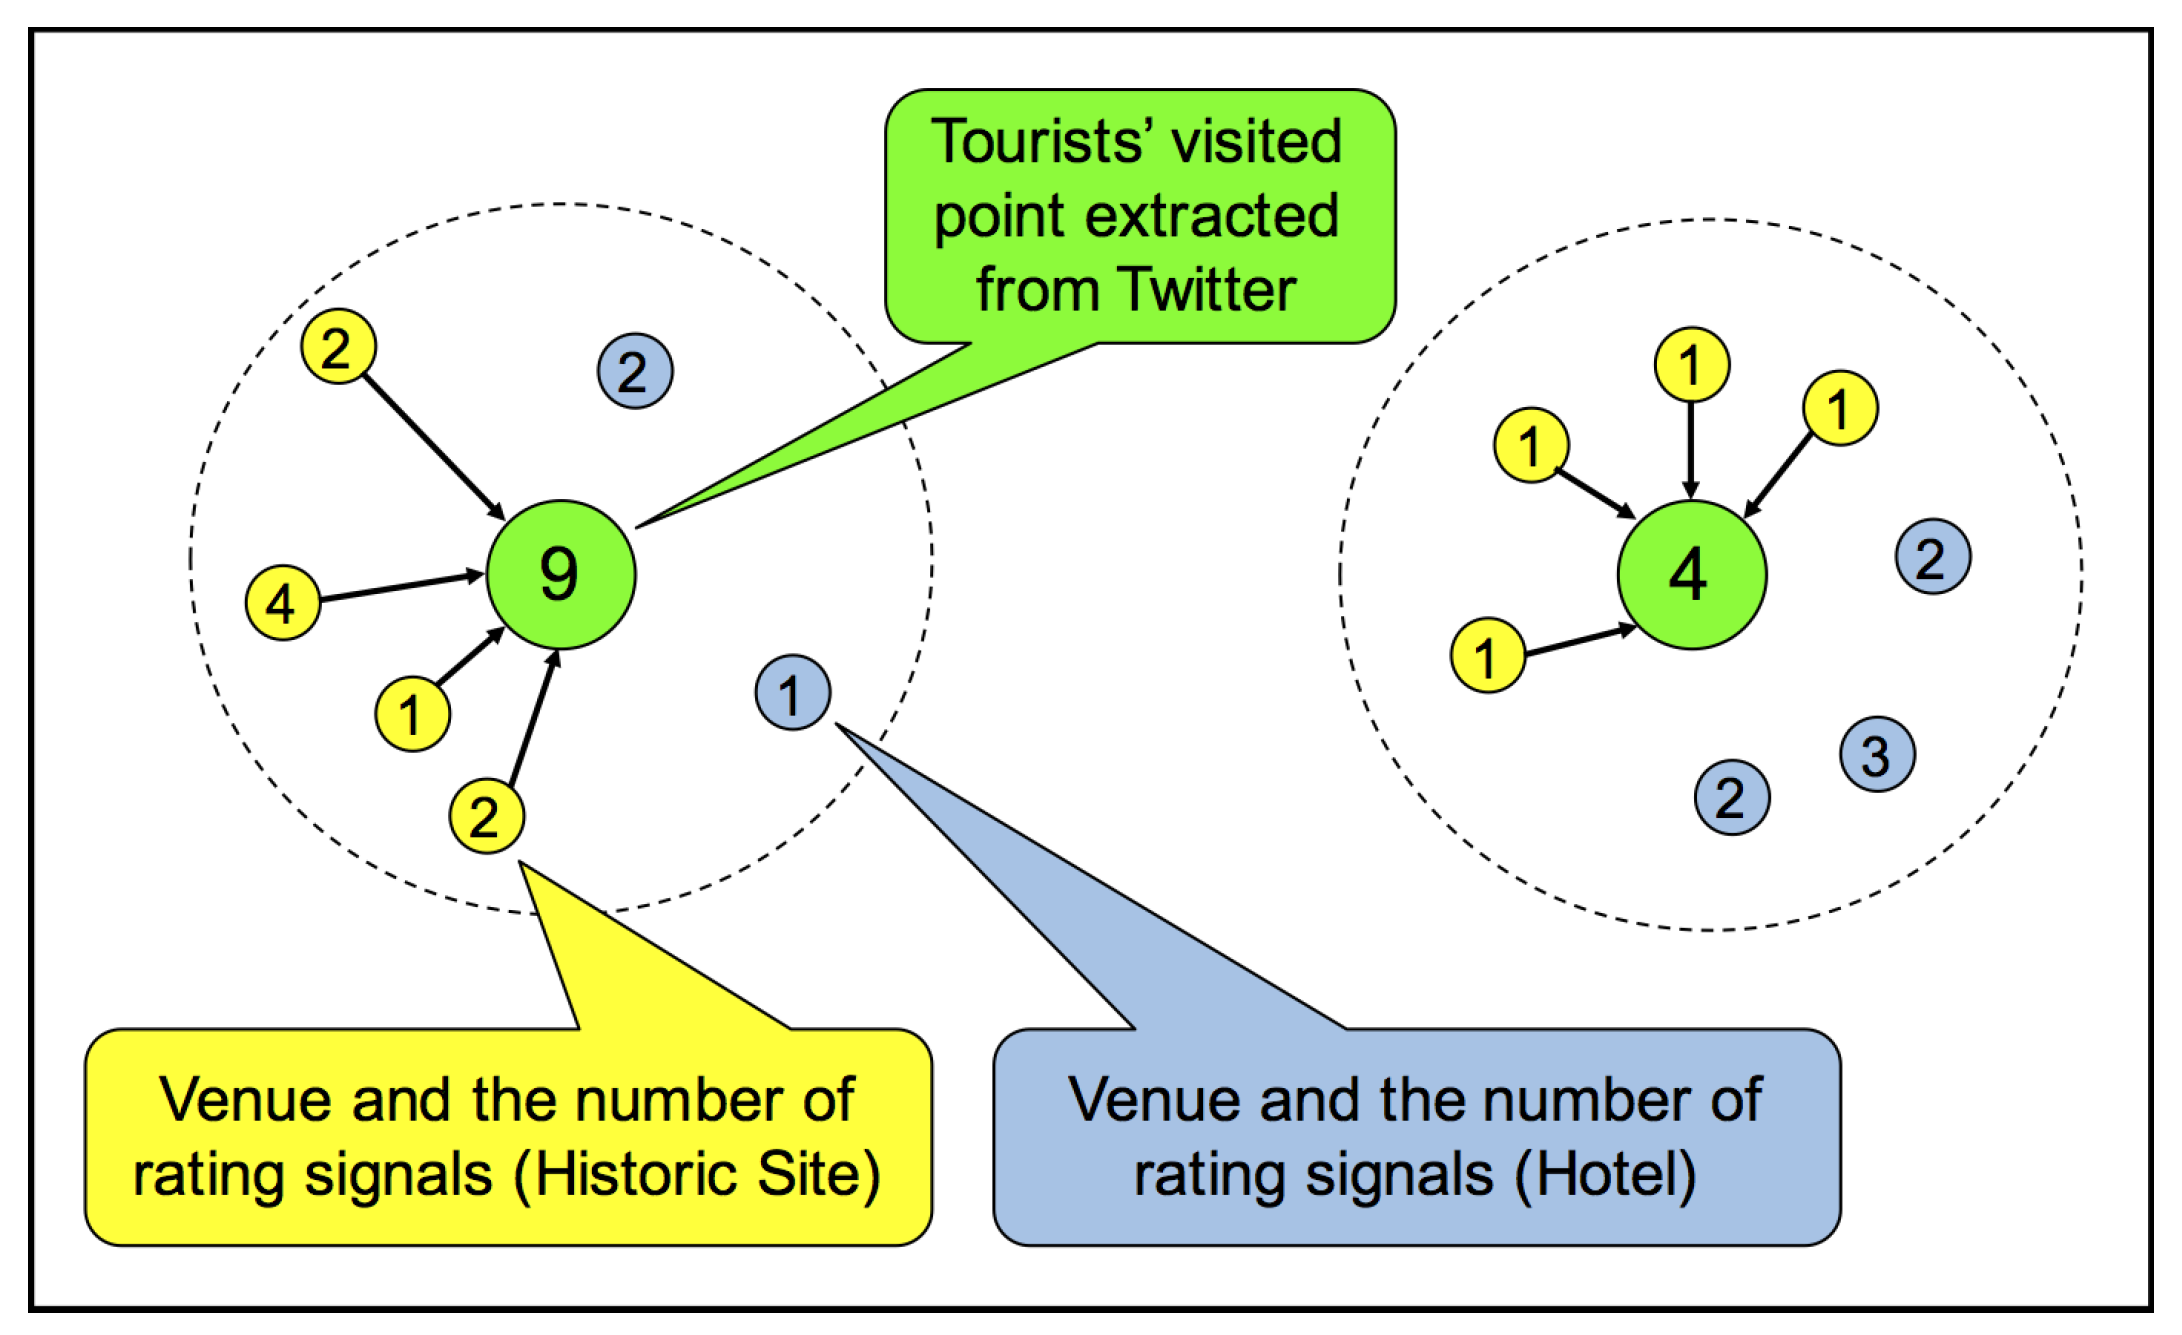
4.2. Characterization of Each Location
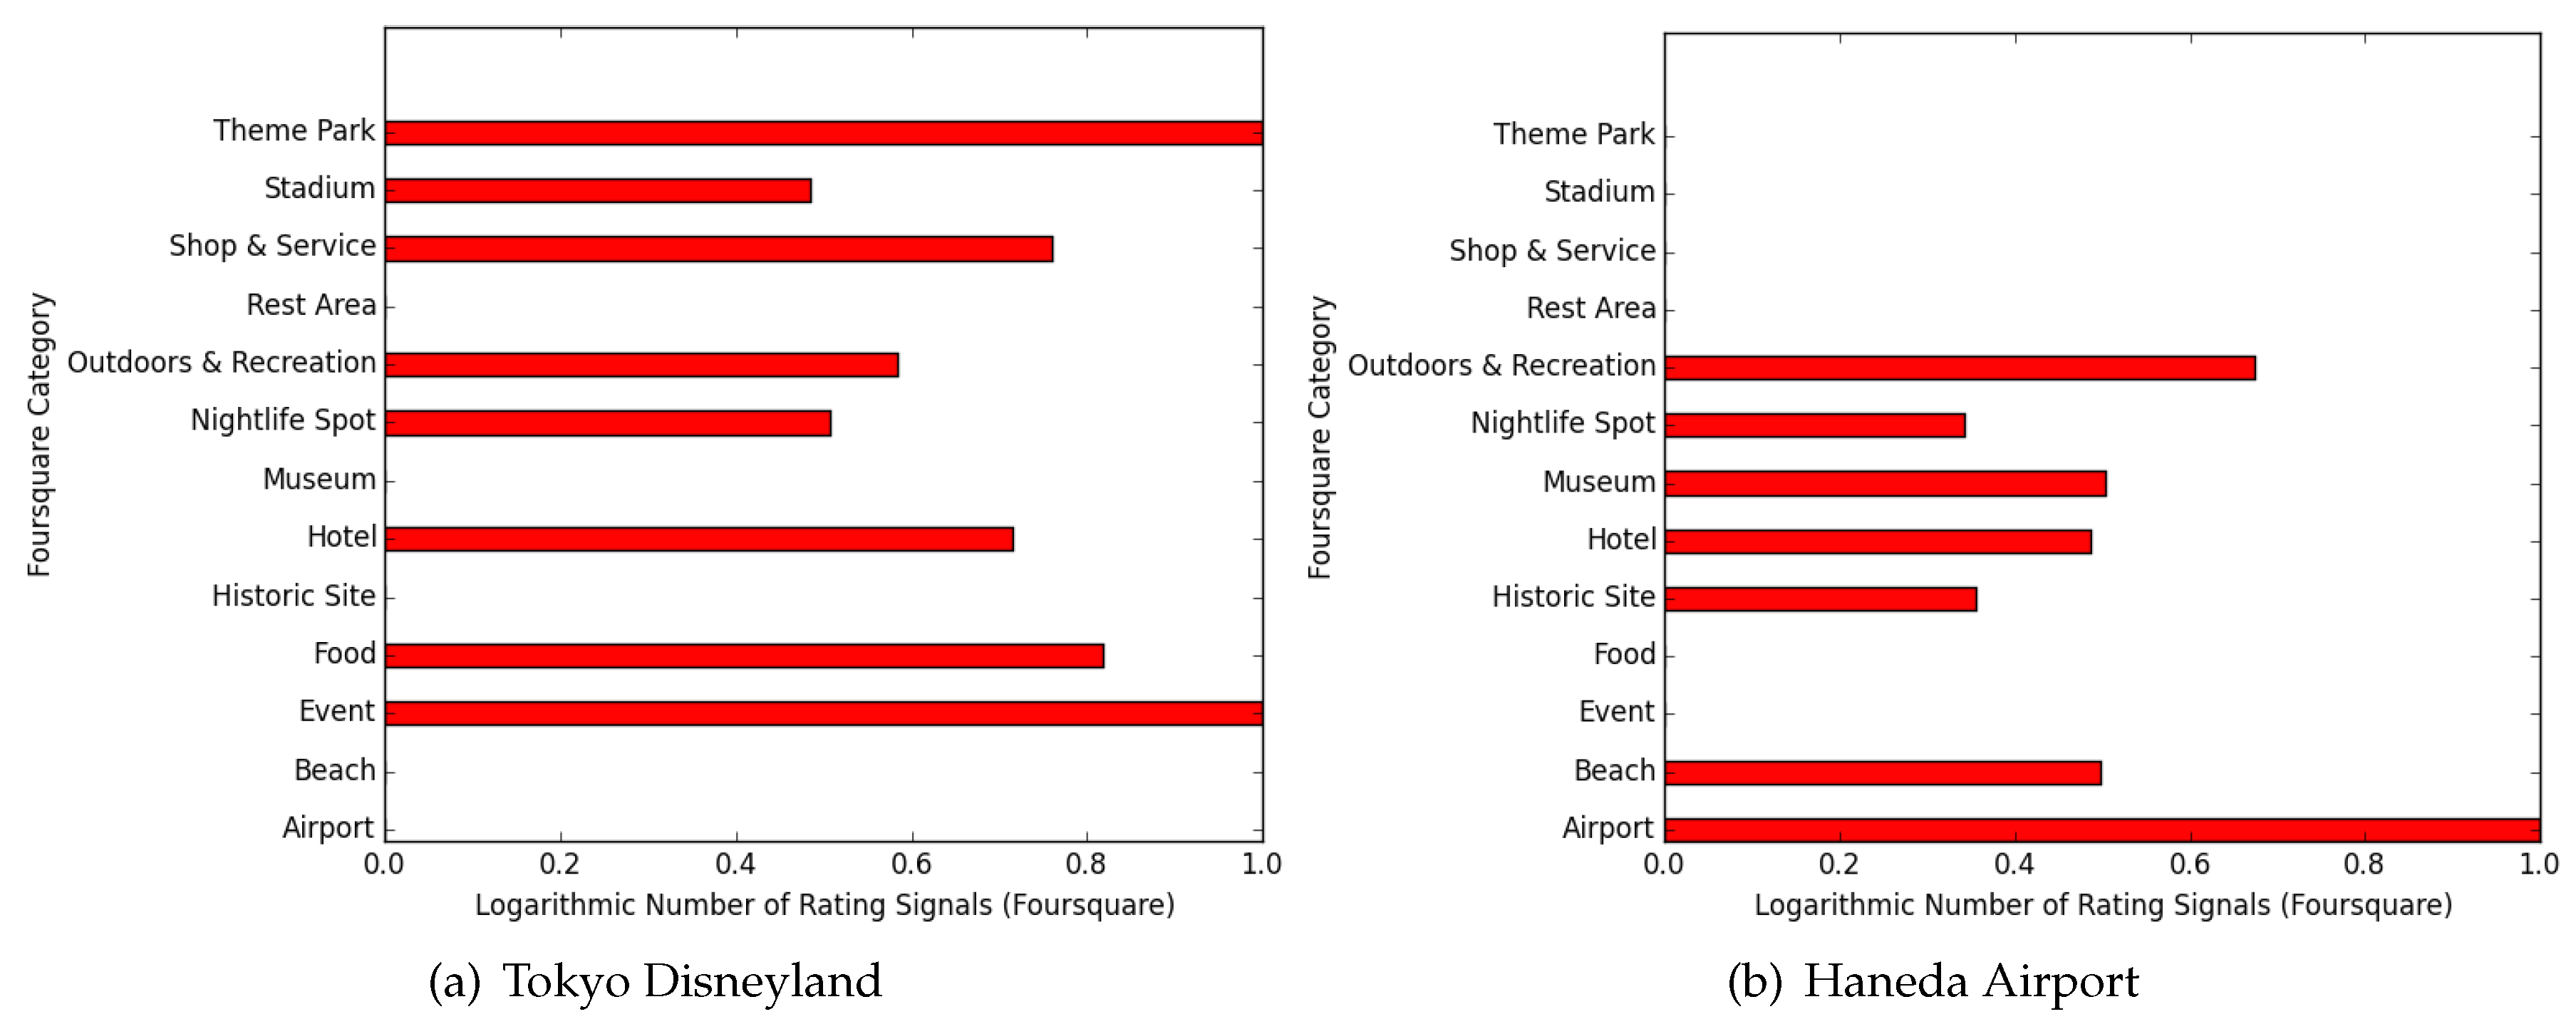
To understand the preferences of tourists, the characteristics of each tourist destination must be determined. Lee et al. [34] use data from Japanese location-based social media, Yahoo! Loco, to determine each area’s characteristics. In the present study, we use data from Foursquare to define each location’s characteristics. Foursquare is a local search-and-discovery service that users use to rate POIs (restaurants, shops, theme parks, beaches, etc.) they visit. A POI is called a “venue” in Foursquare, and each venue has category information. Although Foursquare has many categories, the categories included here are Airport, Beach, Event, Food, Historic Site, Hotel, Museum, Nightlife Spot, Outdoors & Recreation, Rest Area, Shop & Service, Stadium, and Theme Park.
Figure 8 shows the characterization procedure. In this figure, green points represent classified tourist destinations of domestic Twitter users. The other points represent the locations of venues. Yellow points are historic sites, and blue points are hotels. The number of each point represents the number of rating signals. The characterization algorithm is explained in detail below.
First, signal points in the same category within a circle are summed. In Figure 8, the total number of historic sites’ rating signals within the left circle is “9”, and that of the right circle is “4”. Each point’s categorical characteristics are defined as the logarithm of the total number of rating signals normalized by the maximum number of rating signals.
As an example, the characterization result for the neighborhood of Tokyo Disneyland is shown in Figure 9a. In this figure, the characteristics of Theme Park and Event are the highest. Figure 9b shows the characterization result of the neighborhood of Haneda Airport. In this figure, the characteristics of Airport are the highest. Therefore, the characterization successfully captures these areas.

4.3. Results

To evaluate how the combinations of characteristics determine the number of tourists, we use the decision tree method proposed by Breiman et al. [35]. In the evaluation, the values of the characteristics are set as explanatory variables and the logarithm of the number of tourists is set as the explained variable.
In this paper, we consider cases of historic sites and theme parks for a comparative analysis of the preferences of foreign tourists and domestic tourists. The tweet data posted in August 2014 were used to make four decision trees (see Table 2). The first and second trees analyze the tourist destinations with the top 5% Historic Site feature values. The third and fourth trees analyze the tourist destinations with the top 5% Theme Park feature values. The explained values of the first and third trees are the logarithm of the numbers of foreign tourists, and those of the second and fourth trees are the logarithm of the numbers of domestic tourists.
Figure 10 is the result of the four decision tree analyses. In each decision tree, the tourist destinations are divided into four groups. The four squares under each decision tree contain information about the numbers of the top-5% places for the numbers of tourists. In each tree, the rightmost group on the bottom layer of the decision tree has the biggest ratio of tourist-visited places.
The feature value of Nightlife Spot (bars, nightclubs, night markets) is confirmed to be important to foreign tourists by comparing Figure 10a,b. Therefore, foreign tourists consider nightlife spots to be an important feature near historic sites, in contrast to domestic tourists. Additionally, the comparison of Figure 10c,d indicates that foreign tourists consider nightlife spots to be an important feature near theme parks, in contrast to domestic tourists.
A famous theme park in Japan—Nagashima Spa Land—is taken as an example of a theme park that is popular among domestic tourists but not among foreign tourists. According to a report by the Themed Entertainment Association [36], Nagashima Spa Land had 5.63 million visitors in 2014, which was the 19th-highest attendance in the world in 2014. However, according to Twitter data, it is not in the top-5% of places visited by foreign tourists.
Because of the location of Nagashima Spa Land, it is difficult to access without a car. However, a huge outlet mall and a rest area are located near the theme park, so it attracts many people from a large area of Japan.
Figure 11 shows the characteristics of the area near Nagashima Spa Land. There are no Nightlife Spots, which may be the main reason why this theme park does not attract foreign tourists. Therefore, adding nightlife spots to this area and improving the convenience of access by train may help this theme park to attract foreign tourists.
Previous studies on the trends of inbound tourism in Japan use survey data collected by the Japan Tourism Agency [37] or survey data collected in tourists’ countries [38,39]. However, these data do not include the element of nightlife activity, so it is impossible to know whether the preference for nightlife activity affects tourists’ choices of destinations. On the other hand, the importance of nightlife spots for inbound tourism has recently been argued by journalists and governments. In 2015, a leading Japanese newspaper reported the problem of the lack of nightlife spots for inbound tourism and that the tourism industry has succeeded in satisfying this demand by offering nightlife attractions [40]. The ruling Liberal Democratic Party has proposed an increase in the number of entertainment and cultural events held late at night [41]. The Japan Tourism Agency has said that it is particularly important to satisfy the demand for more nighttime activities [42]. The Cabinet Office of Japan has also decided to develop night entertainment content aimed at international visitors [43]. Although the importance of nightlife spots has not been statistically examined in previous studies, the importance of nightlife spots has been recognized by journalists, the tourism industry, and governments. The findings of the present paper are consistent with their views. It is expected that the same conclusion will be derived if questionnaires and surveys included the element of nightlife. Thus, the advantages of our method compared to previous studies are as follows. First, our proposed method identifies the important factors affecting the numbers of inbound tourists without relying on the subjectivity of tourists or researchers. Second, our proposed method avoids the difficulty of designing questionnaires.

5. Conclusions

In this paper, we have proposed a method of extracting the locations of tourist destinations and a method of understanding the differences in the preferences of domestic tourists and foreign tourists.
The first method evaluates the attractiveness of each location using a gravity model and the originality of each place based on TF-IDF. We extract locations with both high attractiveness and high originality and regard them as the locations of tourist attractions. The extracted locations successfully include most of the famous Japanese tourist attractions. However, the extracted locations erroneously include the locations of airports. Overall, this method overcomes the two limitations of previous studies. First, our proposed method successfully excludes merely popular locations with no tourist attractions, such as shopping centers. Second, our proposed method successfully includes the locations of tourist destinations whose original function is not as a tourist destination, such as famous bridges and famous universities.
The second method compares the differences in the distributions of foreign tourists and domestic tourists. The main destinations of both foreign tourists and domestic tourists are included in the locations regarded as tourist destinations. Additionally, the method has found that the spatial convergence of foreign tourists is much higher than that of domestic tourists.
The method characterizes each location on the basis of POIs in the neighborhood. Then, it analyzes the combinations of characteristics that determine the number of foreign tourists and domestic tourists. The analysis results show that foreign tourists consider nightlife spots to be important around both historic sites and theme parks, whereas domestic tourists do not. Therefore, it is necessary to locate nightlife spots (bars, nightclubs, and night markets) around historic sites and theme park to increase the number of foreign tourists’ visits at a location that is popular among domestic tourists. The limitation of this method is that the results show a correlation between the characteristics of locations and the numbers of tourists rather than a causal relationship. Therefore, further research is needed to develop a method to understand the causal relationships.
The proposed methods can contribute to boosting inbound tourism. The outcome of the application of this method may differ in other countries or in other seasons. In this paper, we have applied our method to data collected in Japan in August. By changing the country and the period, interesting findings may be obtained. Those results are expected to help regional economic growth.

Acknowledgments

This study was supported by the Leading Graduates Schools Program “Global Leader Program for Social Design and Management (GSDM)” run by the Ministry of Education, Culture, Sports, Science and Technology, Japan.

Author Contributions

All authors discussed and designed the experiments and contributed to writing the paper. Takashi Nicholas Maeda, Fujio Toriumi, and Hirotada Ohashi defined the research agenda. Takashi Nicholas Maeda implemented the experiments and wrote the manuscript. Mitsuo Yoshida acquired the data. All authors read and approved the final manuscript.

Conflicts of Interest

The authors declare no conflicts of interest. The funding source had no role in the design of the study; in the collection, analyses, or interpretation of data; in the writing of the manuscript; or in the decision to publish the results.

Abbreviations

The following abbreviations are used in this manuscript:
DBSCANdensity-based spatial clustering algorithm with noise
IDFinverse document frequency
LBSNlocation-based social networks
POIpoint of interest
TFterm frequency
UNWTOUnited Nations World Tourism Organization

References

  1. Maeda, T.N.; Yoshida, M.; Toriumi, F.; Ohashi, H. Decision Tree Analysis of Tourists’ Preferences Regarding Tourist Attractions Using Geotag Data from Social Media. In Proceedings of the Second International Conference on IoT in Urban Space, Tokyo, Japan, 24–25 May 2016. [Google Scholar]
  2. United Nations World Tourism Organization. UNWTO Tourism Highlights 2016 Edition; United Nations World Tourism Organization: Madrid, Spain, 2016. [Google Scholar]
  3. Paci, R.; Marrocu, E. Tourism and regional growth in Europe. Pap. Reg. Sci. 2013, 93, S25–S50. [Google Scholar] [CrossRef]
  4. Kostakis, I.; Theodoropoulou, E. Spatial analysis of the nexus between tourism–human capital–economic growth. Tourism Economics 2017, 23, 1523–1534. [Google Scholar] [CrossRef]
  5. Crandall, D.J.; Backstrom, L.; Huttenlocher, D.; Kleinberg, J. Mapping the World’s Photos. In Proceedings of the 18th International Conference on World Wide Web, Madrid, Spain, 20–24 April 2009. [Google Scholar]
  6. Yang, Y.; Gong, Z.; Hou U, L. Identifying Points of Interest by Self-tuning Clustering. In Proceedings of the 34th International ACM SIGIR Conference on Research and Development in Information Retrieval, Beijing, China, 24–28 July 2011. [Google Scholar]
  7. Zhou, X.; Xu, C.; Kimmons, B. Detecting tourism destinations using scalable geospatial analysis based on cloud computing platform. Comput. Environ. Urban Syst. 2015, 54, 144–153. [Google Scholar] [CrossRef]
  8. Wei, L.Y.; Zheng, Y.; Peng, W.C. Constructing Popular Routes from Uncertain Trajectories. In Proceedings of the 18th ACM SIGKDD International Conference on Knowledge Discovery and Data Mining, Beijing, China, 12–16 August 2012. [Google Scholar]
  9. Zheng, Y.; Zhang, L.; Xie, X.; Ma, W.Y. Mining Interesting Locations and Travel Sequences from GPS Trajectories. In Proceedings of the 18th International Conference on World Wide Web, Madrid, Spain, 20–24 April 2009. [Google Scholar]
  10. Kurashima, T.; Iwata, T.; Irie, G.; Fujimura, K. Travel Route Recommendation Using Geotags in Photo Sharing Sites. In Proceedings of the 19th ACM International Conference on Information and Knowledge Management, Toronto, ON, Canada, 26–30 October 2010. [Google Scholar]
  11. Majid, A.; Chen, L.; Chen, G.; Mirza, H.T.; Hussain, I.; Woodward, J. A context-aware personalized travel recommendation system based on geotagged social media data mining. Int. J. Geogr. Inf. Sci. 2013, 27, 662–684. [Google Scholar] [CrossRef]
  12. Vu, H.Q.; Li, G.; Law, R.; Ye, B.H. Exploring the travel behaviors of inbound tourists to Hong Kong using geotagged photos. Tour. Manag. 2015, 46, 222–232. [Google Scholar] [CrossRef]
  13. Paldino, S.; Bojic, I.; Sobolevsky, S.; Ratti, C.; González, M.C. Urban magnetism through the lens of geo-tagged photography. EPJ Data Sci. 2015, 4, 5. [Google Scholar] [CrossRef]
  14. Vu, H.Q.; Li, G.; Law, R.; Zhang, Y. Travel Diaries Analysis by Sequential Rule Mining. J. Travel Res. 2018, 57, 399–413. [Google Scholar] [CrossRef]
  15. Spinsanti, L.; Berlingerio, M.; Pappalardo, L. Mobility and Geo-Social Networks. In Mobility Data: Modeling, Management, and Understanding; Renso, C., Spaccapietra, S., Zimányi, E., Eds.; Cambridge University Press: Cambridge, UK, 2013; pp. 315–333. [Google Scholar]
  16. Hawelka, B.; Sitko, I.; Beinat, E.; Sobolevsky, S.; Kazakopoulos, P.; Ratti, C. Geo-located Twitter as proxy for global mobility patterns. Cartogr. Geogr. Inf. Sci. 2014, 41, 260–271. [Google Scholar] [CrossRef] [PubMed]
  17. Bassolas, A.; Lenormand, M.; Tugores, A.; Gonçalves, B.; Ramasco, J.J. Touristic site attractiveness seen through Twitter. EPJ Data Sci. 2016, 5, 12. [Google Scholar] [CrossRef]
  18. Sobolevsky, S.; Bojic, I.; Belyi, A.; Sitko, I.; Hawelka, B.; Arias, J.M.; Ratti, C. Scaling of City Attractiveness for Foreign Visitors through Big Data of Human Economical and Social Media Activity. In Proceedings of the 2015 IEEE International Congress on Big Data, Santa Clara, CA, USA, 29 October–1 November 2015. [Google Scholar]
  19. Hausmann, A.; Toivonen, T.; Slotow, R.; Tenkanen, H.; Moilanen, A.; Heikinheimo, V.; Di Minin, E. Social Media Data Can Be Used to Understand Tourists’ Preferences for Nature-Based Experiences in Protected Areas. Conserv. Lett. 2017, 11, e12343. [Google Scholar] [CrossRef]
  20. Keeler, B.L.; Wood, S.A.; Polasky, S.; Kling, C.; Filstrup, C.T.; Downing, J.A. Recreational demand for clean water: Evidence from geotagged photographs by visitors to lakes. Front. Ecol. Environ. 2015, 13, 76–81. [Google Scholar] [CrossRef]
  21. Kurashima, T.; Iwata, T.; Hoshide, T. Geo topic model: Joint modeling of user’s activity area and interests for location recommendation. In Proceedings of the Sixth ACM International Conference on Web Search and Data Mining, Rome, Italy, 4–8 February 2013. [Google Scholar]
  22. Hu, B.; Ester, M. Spatial Topic Modeling in Online Social Media for Location Recommendation. In Proceedings of the 7th ACM Conference on Recommender Systems, Hong Kong, China, 12–16 October 2013. [Google Scholar]
  23. Philander, K.; Zhong, Y.Y. Twitter sentiment analysis: Capturing sentiment from integrated resort tweets. Int. J. Hosp. Manag. 2016, 55, 16–24. [Google Scholar] [CrossRef]
  24. Shi, B.; Zhao, J.; Chen, P.J. Exploring urban tourism crowding in Shanghai via crowdsourcing geospatial data. Curr. Issues Tour. 2017, 20, 1186–1209. [Google Scholar] [CrossRef]
  25. Zhu, Y.; Newsam, S. Spatio-temporal Sentiment Hotspot Detection Using Geotagged Photos. In Proceedings of the 24th ACM SIGSPATIAL International Conference on Advances in Geographic Information Systems, San Francisco Bay Area, CA, USA, 31 October–3 November 2016. [Google Scholar]
  26. Miah, S.J.; Vu, H.Q.; Gammack, J.; McGrath, M. A Big Data Analytics Method for Tourist Behaviour Analysis. Inf. Manag. 2016, 54, 771–785. [Google Scholar] [CrossRef]
  27. Georgiev, P.; Noulas, A.; Mascolo, C. Where businesses thrive: Predicting the impact of the Olympic games on local retailers through location-based services data. In Proceedings of the 8th International AAAI Conference on Weblogs and Social Media, Ann Arbor, MI, USA, 1–4 June 2014. [Google Scholar]
  28. Ester, M.; Kriegel, H.P.; Sander, J.; Xu, X. A density-based algorithm for discovering clusters in large spatial databases with noise. In Proceedings of the Second International Conference on Knowledge Discovery and Data Mining, Portland, Oregon, 2–4 August 1996; pp. 226–231. [Google Scholar]
  29. Zipf, G.K. The P1P2/D Hypothesis: On the Intercity Movement of Persons. Am. Sociol. Rev. 1946, 11, 677–686. [Google Scholar] [CrossRef]
  30. Jung, W.S.; Wang, F.; Stanley, H.E. Gravity model in the Korean highway. EPL (Europhys. Lett.) 2008, 81, 48005. [Google Scholar] [CrossRef]
  31. Simini, F.; Gonzalez, M.C.; Maritan, A.; Barabasi, A.L. A universal model for mobility and migration patterns. Nature 2012, 484, 96–100. [Google Scholar] [CrossRef] [PubMed] [Green Version]
  32. Salton, G.; Buckley, C. Term-weighting approaches in automatic text retrieval. Inf. Process. Manag. 1988, 24, 513–523. [Google Scholar] [CrossRef]
  33. TripAdvisor. Trip Advisor’s List of the Thirty Best Places in Japan (Written in Japanese). Available online: https://www.tripadvisor.jp/pages/InboundAttraction_2014.html (accessed on 28 January 2018).
  34. Lee, R.; Wakamiya, S.; Sumiya, K. Urban area characterization based on crowd behavioral lifelogs over Twitter. Pers. Ubiquitous Comput. 2013, 17, 605–620. [Google Scholar] [CrossRef]
  35. Breiman, L.; Friedman, J.; Stone, C.J.; Olshen, R. Classification and Regression Trees; Chapman and Hall/CRC: Oxfordshire, UK, 1984. [Google Scholar]
  36. The Themed Entertainment Association. TEA/AECOM 2014 Theme Index and Museum Index. 2014. Available online: http://www.teaconnect.org/images/files/TEA_103_49736_150603.pdf (accessed on 13 March 2018).
  37. Japan Tourism Agency. Statistical Information. Available online: http://www.mlit.go.jp/kankocho/en/siryou/toukei/index.html (accessed on 28 January 2018).
  38. Henderson, J.C. Destination Development: Trends in Japan’s Inbound Tourism. Int. J. Tour. Res. 2017, 19, 89–98. [Google Scholar] [CrossRef]
  39. Ishida, Y.; Miyaki, M.; Fujisawa, Y.; Iwasaki, K. How does tourism differ among generations? Tourists from the United States and their willingness to visit Japan. Int. J. Tour. Sci. 2017, 17, 49–60. [Google Scholar] [CrossRef]
  40. Nikkei Shimbun. Inbound Tourists Enjoy Nightlife Attractions (Written in Japanese). Available online: https://www.nikkei.com/article/DGXMZO94100130X11C15A1H11A00/ (accessed on 28 January 2018).
  41. Japan Times. LDP Panel Eyes Extended Nightlife Hours to Boost Japan’s Economy. Available online: https://www.japantimes.co.jp/news/2017/12/19/business/economy-business/ldp-panel-eyes-extended-nightlife-hours-boost-japans-economy/ (accessed on 28 January 2018).
  42. NHK (Japan Broadcasting Corporation). Tourist Spending Exceeds US$40 Billion. Available online: https://www3.nhk.or.jp/nhkworld/nhknewsline/backstories/touristspendingexceeds/ (accessed on 28 January 2018).
  43. Cabinet Office, Government of Japan. Basic Policy on Economic and Fiscal Management and Reform 2017. Available online: http://www5.cao.go.jp/keizai-shimon/kaigi/cabinet/2017/2017_basicpolicies_en.pdf (accessed on 28 January 2018).
Figure 1. Modified DBSCAN (Density-Based Spatial Clustering Algorithm with Noise) for geotagged tweet data.
Ijgi 07 00099 g001
Figure 2. Time-series variation of the distance coefficient: The distance coefficient is low during August, January, and February because those months are holiday seasons in Japan. Therefore, tourists tend to take trips to distant destinations during those months.
Ijgi 07 00099 g002
Figure 3. Distribution of attractiveness and originality: The proposed method extracts locations with both top 20% originality and top 20% attractiveness and regards them as tourist destinations.
Ijgi 07 00099 g003
Figure 4. Spatial distribution of locations in each group: Red points are locations with top-20% attractiveness and top-20% originality. Blue points are locations with top-20% attractiveness and bottom-80% originality. Green points are locations with bottom-80% attractiveness and top-20% originality.
Ijgi 07 00099 g004
Figure 5. Spatial distributions of the numbers of tourists: The spatial convergence of foreign tourists is much higher than that of domestic tourists.
Ijgi 07 00099 g005
Figure 6. Distributions of the numbers of tourists: Both distributions follow a power law, but the slope for foreign tourists is steeper than that for domestic tourists.
Ijgi 07 00099 g006
Figure 7. Number of tourists and its relationships with attractiveness and originality: The radius of each circle is proportional to the logarithm of the number of tourists.
Ijgi 07 00099 g007
Figure 8. Characterization procedure: Each point’s characteristics are defined by the total number of rating signals.
Ijgi 07 00099 g008
Figure 9. Examples of characteristics calculated on the basis of information about points of interest (POIs) in the neighborhood.
Ijgi 07 00099 g009
Figure 10. Decision trees of the logarithmic number of tourists: Foreign tourists consider nightlife spots (bars, nightclubs, and night markets) to be important factors around both historic sites and theme parks, whereas domestic tourists do not.
Ijgi 07 00099 g010
Figure 11. Characteristics of a neighborhood (Nagashima Spa Land): One of the biggest theme parks in the world fails to attract foreign tourists because it lacks Nightlife Spots.
Ijgi 07 00099 g011
Table 1. Number of valid users and the results of the multi-regression analysis: Each coefficient of determination is greater than 0.72, so the multiple regression model fits the data well.
PeriodNumber of Valid Users R 2 Distance Coefficient ( α )
April 201481,1150.754120.93051
May 201479,8700.754310.94589
June 201486,1670.779790.91594
July 201493,8090.774490.90771
August 2014107,4180.728440.86430
September 201495,7230.737480.94081
October 201485,0120.753260.91642
November 201483,7430.742580.94743
December 2014106,9510.742480.91262
January 2015105,4440.743800.85424
February 201599,8460.761830.85350
March 2015124,9540.737150.89403
Table 2. The four decision trees to be analyzed.
Foreign TouristsDomestic Tourists
Historic SiteThe first treeThe second tree
Theme parkThe third treeThe fourth tree

