Article

A Multivariate Approach to Study Drivers of Land-Cover Changes through Remote Sensing in the Dry Chaco of Argentina

Instituto Multidisciplinario de Biología Vegetal, Universidad Nacional de Córdoba-CONICET, POB 495, Córdoba 5000, Argentina
*
Author to whom correspondence should be addressed.
ISPRS Int. J. Geo-Inf. 2018, 7(5), 170; https://doi.org/10.3390/ijgi7050170
Submission received: 20 March 2018 / Revised: 7 April 2018 / Accepted: 23 April 2018 / Published: 4 May 2018

Abstract

:
Land-cover changes are driven by different combinations of biophysical, economic, and cultural drivers that are acting at different scales. We aimed to (1) analyze trends in land use and land cover changes (conversion, abandonment, forest persistence) in the dry Chaco in central Argentina (1979 to 2010), and (2) examine how physical and socio-economic drivers have influenced those changes. Based on Landsat data, we obtained the proportion of 16 classes of land cover changes for 81 individual circular samples. We performed a Principal Component Analysis (PCA) to identify the main trends of change across the whole region. To explore the relationships between the changes in land cover and drivers, we developed a GIS comprising thematic maps representing the different drivers. The drivers were first correlated with the two first PCA axes, and in a second approximation were subjected to multiple regression analyses. We obtained in this way the best model to explain each PCA axis. The highest conversion, as indicated by PCA axis 1, was experienced by flat areas close to roads and with the highest annual rainfall. Besides agricultural expansion that was triggered by precipitation increase as a major driver of forest conversion, changes that were observed during the period 1979–2010, may have also been influenced by several other driving forces acting at different spatial scales and contexts.

1. Introduction

Land use and land cover changes, and, more specifically, deforestation, may be the result of a complex set of driving forces, ranging from external (demand from international markets, environmental policies, etc.) to local (population increase, infrastructure development, biophysical variables, etc.) drivers [1,2,3,4]. Several authors have reported the difficulty of disentangling underlying and proximal driving forces, and often the discussion concerning the causes of deforestation confuses issues across spatial and temporal scales [5]. Although a consensus has emerged that attributes deforestation to underlying economic, political, and social driving forces acting at the national, regional, and global levels [6,7,8], these drivers alone may be insufficient to understand how deforestation is occurring at the local scale.
According to Geist and Lambin [1] proximate drivers are human activities at the local and immediate level that directly impact land cover. Agricultural clearing and timber extraction, both authorized and illegal, together with forest wildfires are perhaps the proximate drivers more frequently reported in the literature [1,5,8]. The proximate drivers of deforestation have consistently been associated to population growth, accessibility, topography, and other physical and socio-economic factors that are acting at local scale [4,9,10,11]. Demographic dynamics have often been identified as an important driver of deforestation, especially in developing tropical countries [2,12,13,14,15,16], while the recovery of forests after crop abandonment (i.e., “forest transition”) has been linked to regional population decline [17,18,19], besides other drivers [20,21]. Although, in many regions the relationship between population and land-cover change is straightforward, some studies have shown that the type of change can be modified by socioeconomic and environmental driving forces, independently of population tendencies [1,6,20]. Another driver that is affecting deforestation at local to regional scales is accessibility [12]. Road construction increases accessibility to remote areas facilitating the expansion of agriculture, logging and deforestation [10,12,22,23], which leads to the conversion of forests into other cover types. Therefore, roads are often seen as agents of deforestation, accelerating fragmentation, and slowing down the recovery of forests [24,25,26]. Also, physical variables such as topography and precipitation usually play an important role in the deforestation process because of related variations in accessibility, soil properties, temperature, and water availability may promote or prevent changes in land use [27,28,29]. Additionally, government regulations may restrict deforestation above certain altitudes or in steep terrain. Furthermore, it is presumed that those areas with soils suitable for agriculture and a gentle topography permitting tilling, show high rates of forest conversion, when compared to areas with opposite conditions. In this way, it is presumed that sites without limitations for agriculture tend to be more rapidly converted into a more deforested and more fragmented landscape [30].
The Gran Chaco is one of the largest seasonally dry subtropical forest in South America, comprising an area of ca. 1,200,000 km2 in Argentina, Paraguay, and Bolivia [31,32]. Formerly, an almost continuous forest, during the last decades the Chaco has been converted into agriculture at high rates [33,34,35], and nowadays land cover is dominated by a mosaic of secondary and fragmented forests, shrublands and cultural vegetation, mainly annual crops. Before the Spanish occupation, the Chaco region was covered by primary forests and woodlands, alternating with patches of grasslands that were maintained through traditional management by Amerindians, who used fire in their hunting practices [31,36,37]. This balance between woody and herbaceous vegetation was disrupted when Europeans occupied the region, and, after exhausting the forage in grassland, selectively cleared the forest for extensive livestock raising, a practice that has continued for more than four centuries [38,39,40,41]. The construction of the railway towards the interior of the Chaco region during the early 20th century was accompanied by intense logging [40,42,43]. More recently, agricultural expansion, including intensified cattle raising and annual crops, has further accelerated deforestation. During the last three decades, the main proximate driver of deforestation in the Gran Chaco has been the expansion of agriculture [32,35,44], which was driven by global trends in technology and soybean markets [44], which was facilitated by a rainfall increase reported for some territories of the argentine Chaco [32,45,46]. However, recent results that were reported by Gasparri et al. [47] suggest that in the northern Chaco rainfall has not been a major restriction to cropland expansion, and that the main limitations are imposed by infrastructure and services provided from towns.
A number of studies have been conducted to describe the patterns of deforestation in the southern and more arid extreme of the Gran Chaco, in Córdoba Province, central Argentina [32,45,48]. These studies describe dramatic land cover changes that imply an annual deforestation rate of about 2.75% for the period 1969–2000. Besides rainfall increase, which has been proposed as a primary driver that is promoting deforestation through the expansion of agriculture, other drivers should also be considered to interpret local variations in land use and cover changes. While driving forces that were acting at global scales (international crop prices and demand, technological advances, market trends, etc.) affect the whole area in the same way, a series of physical (topography, soil types) and socio-economic (proximity to roads and to human settlements) drivers could also be influential at the local scale. This could determine, in turn, local variations in the way in which forest conversion has occurred in the past and will proceed in the future.
Previous studies reporting land cover changes in the southern Chaco have emphasized forest conversion into agriculture [32,45], but processes such as forest conversion into other non-agricultural cover types, forest and crop persistence, and crop abandonment, have rarely been explored despite some results of those same studies suggesting they might be important. All of these processes may occur spatially associated or dissociated across the region, depending on how the drivers are influencing at the local scale. Because of the interdependence of the different processes, it is important to consider their spatial association when analyzing drivers, which may be achieved through multivariate analysis. The main objectives of this study were to (1) analyze the main trends in the land use and land cover changes (conversion, abandonment, forest persistence) in the southern extreme of the dry Chaco through multivariate analysis of remote sensing data, and (2) examine how physical drivers (precipitation, topography, soil type, and agricultural suitability of soils) and indicators of socio-economic driving forces (distance to roads and human settlements) have influenced those trends.

2. Materials and Methods
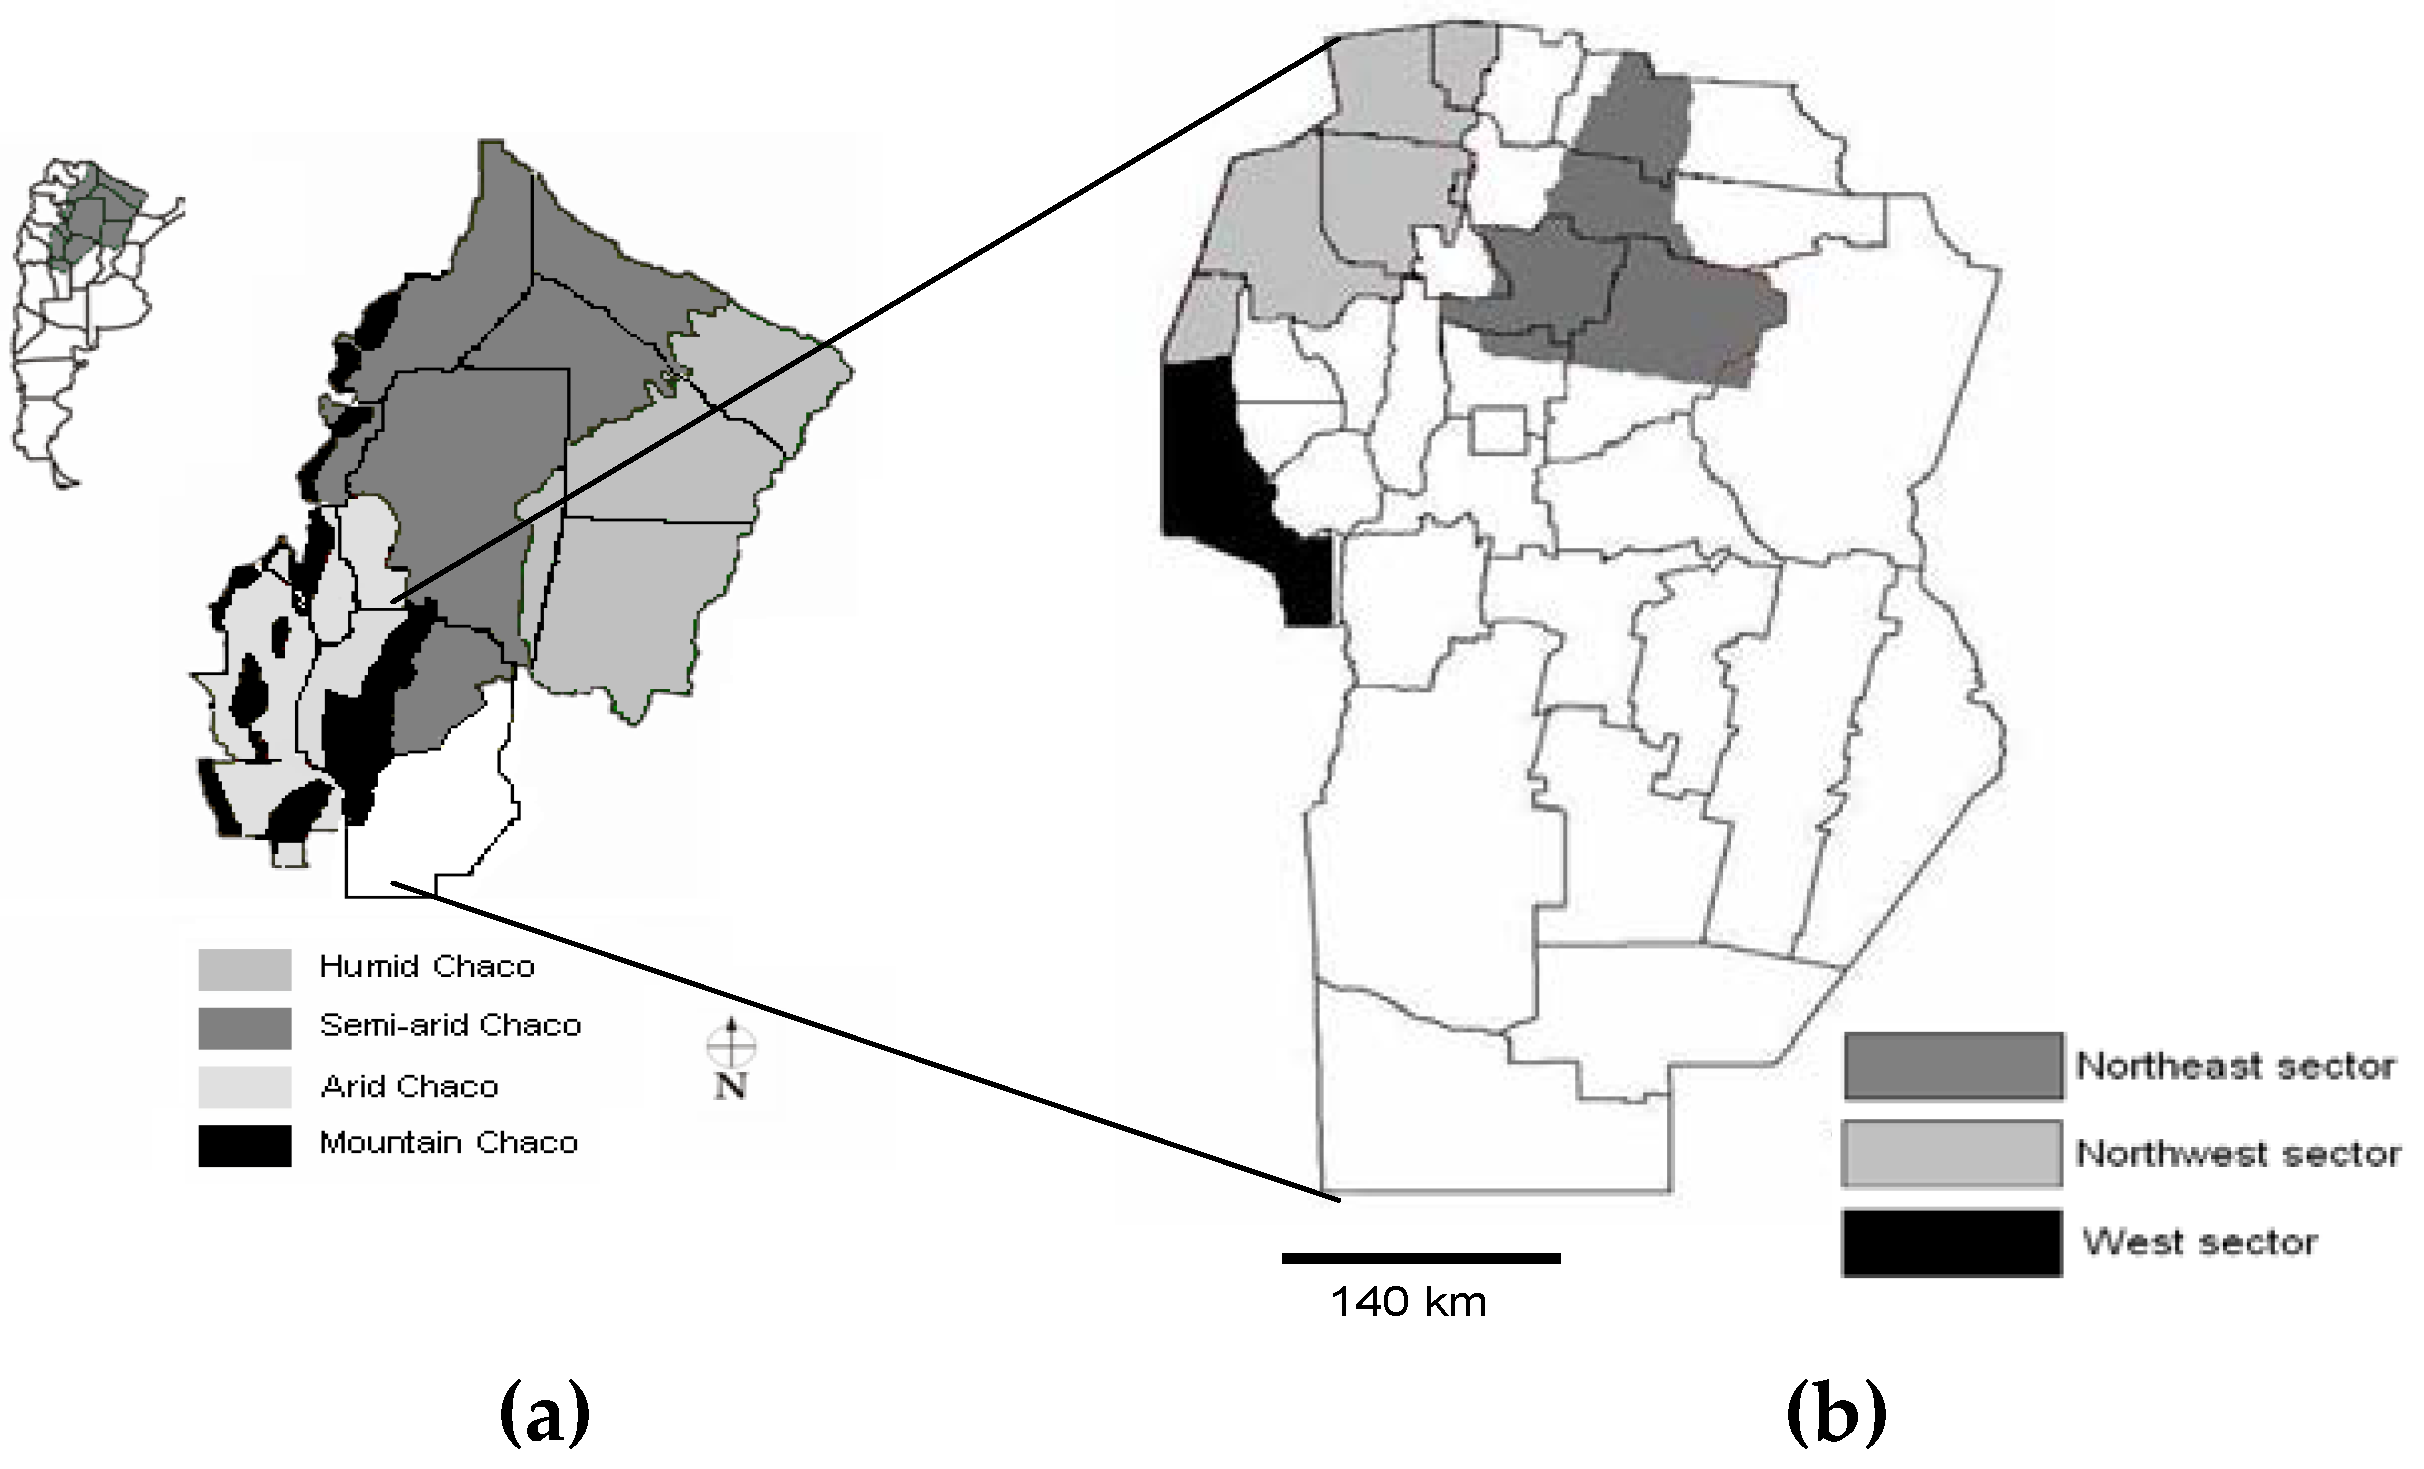
2.1. Study Area

The study area is located at the southern extreme of the dry Chaco, to the northeast and northwest of Cordoba Province (Argentina) (Figure 1a), and belongs to the Chaco Phytogeographical Province [49]. Our study was focused in the lowlands, which were formerly dominated by Aspidosperma quebracho-blanco (white quebracho) and Schinopsis marginata (red quebracho) subtropical seasonally dry forests [42,50,51]. At present, the non-cultivated area is covered mostly with secondary semi-deciduous forests and shrublands, alternating with patches of old-growth forests. To both the northwest and the northeast of the area saline depressions occur, where succulent shrublands dominate. The plant communities in the arid and semi-arid Chaco of Cordoba are known in detail from the works of Sayago [42], Cabido et al. [52,53], and Zak and Cabido [50]. In 1979, old growth closed forests occupied 29% of the area under study, but forest cover was reduced to 5% of the surface by 2010. These changes were concomitant with an increase in cultural vegetation from 27% to 48% of the area during the same period. In contrast, open forests and shrublands cover did not change substantially in the landscape, but their location in space was modified since closed forests were transformed into open forests or shrublands in some areas, while in some other locations shrublands, and at a lesser extent, open forests, were converted into cultural vegetation [45] (see Figure S1 in Supplementary Material).
In the dry Chaco, water shortages have been a major constraint to agricultural development in the past [42,54,55]. Precipitation in the study area occurs mainly in the warm season, between November and March. According to two series of climatic data (1930–1950 local meteorological stations data; 1950–2000 Wordclim data), annual and growth period precipitation decreases from east to west [32,45]. Available data also show that precipitation increased from 1960 [46], and that this increase was statistically significant in the northeast sector of the study area, but only subtle in the northwest and west areas [45]. In the case of the northeast area the increase in annual precipitation, and specifically during the growth period, made crop production more profitable, while this was not the case in the western sector where crop production is not possible without irrigation (Hoyos et al., 2013). Consequently, Zak et al. [32] and Hoyos et al. [45] have reported more intense deforestation in the northeastern sector.

2.2. Evaluation of the Main Trends in Land Cover Changes

The changes in land cover that occurred during the last three decades were estimated in a previous study by comparing 1979, 1999, 2004, and 2010 digital maps that were based on Landsat MSS and TM data, and fieldwork [45], Figure S1. Maps were obtained through the classification of three Landsat MSS or TM images for each year (Path/Row: 229/081, 230/081, and 230/082), and showed an overall accuracy of about 89% (Kappa statistic = 0.87) for the 2010 images (see Hoyos et al. [45] for further details on the construction of the digital maps and accuracy assessments). Four land-cover units were defined in Hoyos et al. [45] for the whole area: closed forest, open forest, shrubland, and cultural vegetation (croplands plus urban areas), besides two classes for saline environments that were not considered for the analyses. An image of change [56] between 1979 and 2010 was generated, with 16 (4 × 4) classes of land cover changes (e.g., proportion of forest that remained as such, proportion of forest that became cultural vegetation, etc.).
We selected a total of 81 circular samples (hereafter “circles” for simplicity) of 5 km in diameter (20 km2) distributed in the study area. To obtain a representative distribution of the circles along the whole study area, we stratified the sampling by considering the same three sectors used in Hoyos et al. [45]: northeast, northwest, and west (Figure 1b). We randomly selected 28 samples in the northeast and northwest sectors, and 25 samples in the west sector (81 in total). Based in the image of change between 1979 and 2010 [45], we obtained the proportion of each of the 16 classes of change for all the individual circles. In this way, each circle represents a sample of the changes that were experienced by the land at the local level. This procedure resulted in a data matrix of 81 samples × 16 classes of change which was subjected to Principal Component Analysis (PCA) to identify the main trends of change across the whole region. This multivariate method has been widely used in ecological studies to summarize large data sets and vegetation trajectories under different land management. Additionally, for each sample, we calculated the conversion rate into agriculture through the following equation [57]:
r = 1 − {1 − [(A1 − A2)/A1]}1/t × 100
where r is the annual conversion rate into agriculture (%) during the period under study (recent conversion), A1 is the area covered by woody vegetation (forest and shrubland) at the beginning of the period, A2 is the area covered by woody vegetation at the end of the period, and t is the duration of the period under study (31 years in our case). Then, we used the first and second axes of the PCA, as well as the conversion rate into agriculture, as three synthetic variables, indicating the main trends of change. We used this methodological approach because circles represent small samples of the landscapes, which we considered better reflect (in comparison of using pixels as samples) the processes of change and the spatial associations among changes at the actual scale at which they occur. Additionally, we decided to sample the image instead of using it entirely, to minimize spatial autocorrelation [58,59].

2.3. Driving Forces Affecting Land Cover Change

To explore the relationships between changes in land cover and the possible active drivers of change, we developed a GIS comprising the following thematic maps: roads, human settlements (towns and cities), annual precipitation, topographic position, altitude, slope, latitude, longitude, soil types, and a soil productivity index (See Figure S2 in Supplementary Material). The road maps were provided by the National Secretary for Planning and Environmental Policy (Subsecretaría de Planificación y Política Ambiental de la Nación) at the 1:100,000 scale, and were digitized on screen using the software ArcView GIS 3.2, differentiating two road types, according to their characteristics and their intensity of use: highways and roads. The location of human settlements was digitized on screen using the software ERDAS 8.2 (1993), based on maps of the study area provided by the National Geographic Institute (IGN) at the scale 1:100,000. Topographic variables (topographic position, slope, and altitude) were obtained from a digital elevation model at the 90 × 90 m resolution (CGIAR-CSI http://srtm.csi.cgiar.org/). Topographic position (%) vary from 0 to 100 for the lowest to the highest topographic positions, respectively (see details in Cingolani et al. [60]). Soil types and a Soil Productivity Index were obtained from a digital map provided by the National Institute of Agricultural Technology (Instituto Nacional de Tecnología Agropecuaria-INTA Manfredi) (2003) at a scale 1:500,000. Soil types were classified into three orders (Aridisols, Entisols, and Mollisols), following the Comprehensive Soil Classification System that was developed by the U.S. Department of Agriculture, with Mollisols being the most productive soils in the study area. The Soil Productivity Index indicates the productive capacity of the different soil types present in an area, and its value ranges between 1 and 100, the maximum values corresponding to the soils with the highest potential productivity. Precipitation data incorporated into the GIS corresponded to a series of data from Worldclim (http://www.worldclim.org) for the period 1950–2000 with a resolution of 1 km2 [61].
We then obtained from the GIS data of the possible local driving forces for each of the 81 circles previously selected. Distances to roads and human settlements were measured as the distance (km) from the central point of each circle to the nearest road (highway and road) or human settlement, respectively. Mean annual precipitation (mm) and altitude (m a.s.l.), slope (%), topographic position (%), and soil productivity index(dimensionless) for all of the pixels that fell within the circles were computed and averaged. For latitude and longitude data, Gauss-Kruger metric coordinates of the central point were used, where the highest longitude indicates areas to the east and the highest latitude to the north. Finally, for each circle, we assigned the soil type that was occupying the largest area.
In a first approximation, we performed Pearson correlations of the different possible driving forces with the axes of the PCA and with the conversion rate into agriculture (synthetic variables reflecting the main trends of changes). In the case of soil type, which is a qualitative variable, the scores on the PCA axes and the conversion rate into agriculture of the 81 circles were compared among soil types through one-factor ANOVA.
In a second approximation, we used general linear models to analyze the combined effects of the drivers on land cover changes. The two first axes of the PCA and the conversion rate into agriculture were the dependent variables, while socioeconomic indicators (distance to roads and human settlements) and local physical variables (precipitation, topographic position, altitude, slope, soil productivity index, and soil type as a categorical variable) were the independent variables. A manual forward stepwise procedure was used to select the variables to be included in each model. During the selection procedure, we discarded independent variables that were highly correlated (Pearson r > 0.7) with another already selected.

3. Results

3.1. Main Trends of Land Cover Change

The most common changes in land-use were the transformation of Closed Forest into Shrubland (CF-Sh) and the persistence of Cultural Vegetation (i.e., Cultural Vegetation, which remained as such, CV-CV, Table 1). Not all of the 16 classes of changes occurred in all circles, as shown by the minimum values of zero or near zero in all cases. Changes showing the highest maximum values were CV-CV (cultural vegetation remaining as such), which can reach values as high as 90% in some circles, followed by CF-Sh (closed forest that became shrubland), CF-CV (Closed Forest that became Cultural Vegetation), and CV-Sh (cultural vegetation that became shrubland). At the other extreme, among the changes that were less represented in the circular samples were CV-CF and CV-OF (proportion of Cultural Vegetation that became Closed Forest or Open Forest, respectively), with maximum values near 8% in both cases. Also, low was the transformation of shrubland or open forest into closed forest (Sh-CF and OF-CF).
The PCA applied to the 81 circles × 16 classes of changes matrix reflects the main trends of change in land cover recorded between 1979 and 2010 in the southern extreme of the dry Chaco (Córdoba, Argentina) (Figure 2a), with axes 1 and 2 explaining 27% and 16% of the variance, respectively. The contribution of the variables (classes of changes) to the first two PCA axes is shown in Figure 2b. Circles that in 1979 already had a proportion of the area that was occupied by cultural vegetation and that remained as such in 2010 (CV-CV), are located at the positive side of axis 1. These same circles have other areas which were occupied by forests or shrublands in 1979, that have been converted into cultural vegetation during the 1979–2010 period, as indicated by the positive contribution of the CF-CV, OF-CV, and Sh-CV changes to axis 1. Circles that were occupied by woody vegetation (i.e., forests or shrublands) in 1979 and still remain as woody vegetation, either unchanged or converted into other woody types, are located on the negative side of axis 1. Based on these patterns, we can interpret axis 1 as a gradient of conversion to crops, either prior or subsequent to 1979, which means that it represents a present land cover gradient. Many of the circles located in the positive end of axis 1 belong to the northeast sector, where agricultural activity started earlier than in the other two sectors. Circles belonging to the northwest and west sectors are located at the opposite end of this axis and were less converted into crops. Circular samples that show intense agricultural activity at present (those located at the positive side of axis 1), are discriminated along axis 2. Those that have experienced an old (before 1979) and permanent conversion are located towards the positive side (as indicated by the contribution of the CV-CV variable to axis 2), while circles that have suffered a recent and more intense conversion are distributed towards the negative end (Figure 2a). Circles that were located at the negative extreme of axis 1 are also discriminated along the second axis: circles with positive values correspond to areas that have started a process of land conversion into agriculture before 1979 (i.e., they had cultural vegetation), but have subsequently been abandoned to progressively recover woody vegetation cover (for example some areas in the northeast and northwest sectors), while circles that were located at the negative extreme still show woody vegetation. Altogether, these results mean that axis 2 may be interpreted as an “old conversion” gradient (Figure 2a).
In short, axis 1 represents the trends in present land cover, while axis 2 may be interpreted as an old conversion gradient. Thus, according to the position along both axes, circular samples could be discriminated into four groups (Figure 2a). The two upper groups reveal old conversion, with abandonment occurring in the circles to the left and crop persistence in those to the right. Groups at the lower part of the ordination graph comprise circles with woody vegetation in 1979, which were still persisting in those to the left, but recently converted in circles to the right.

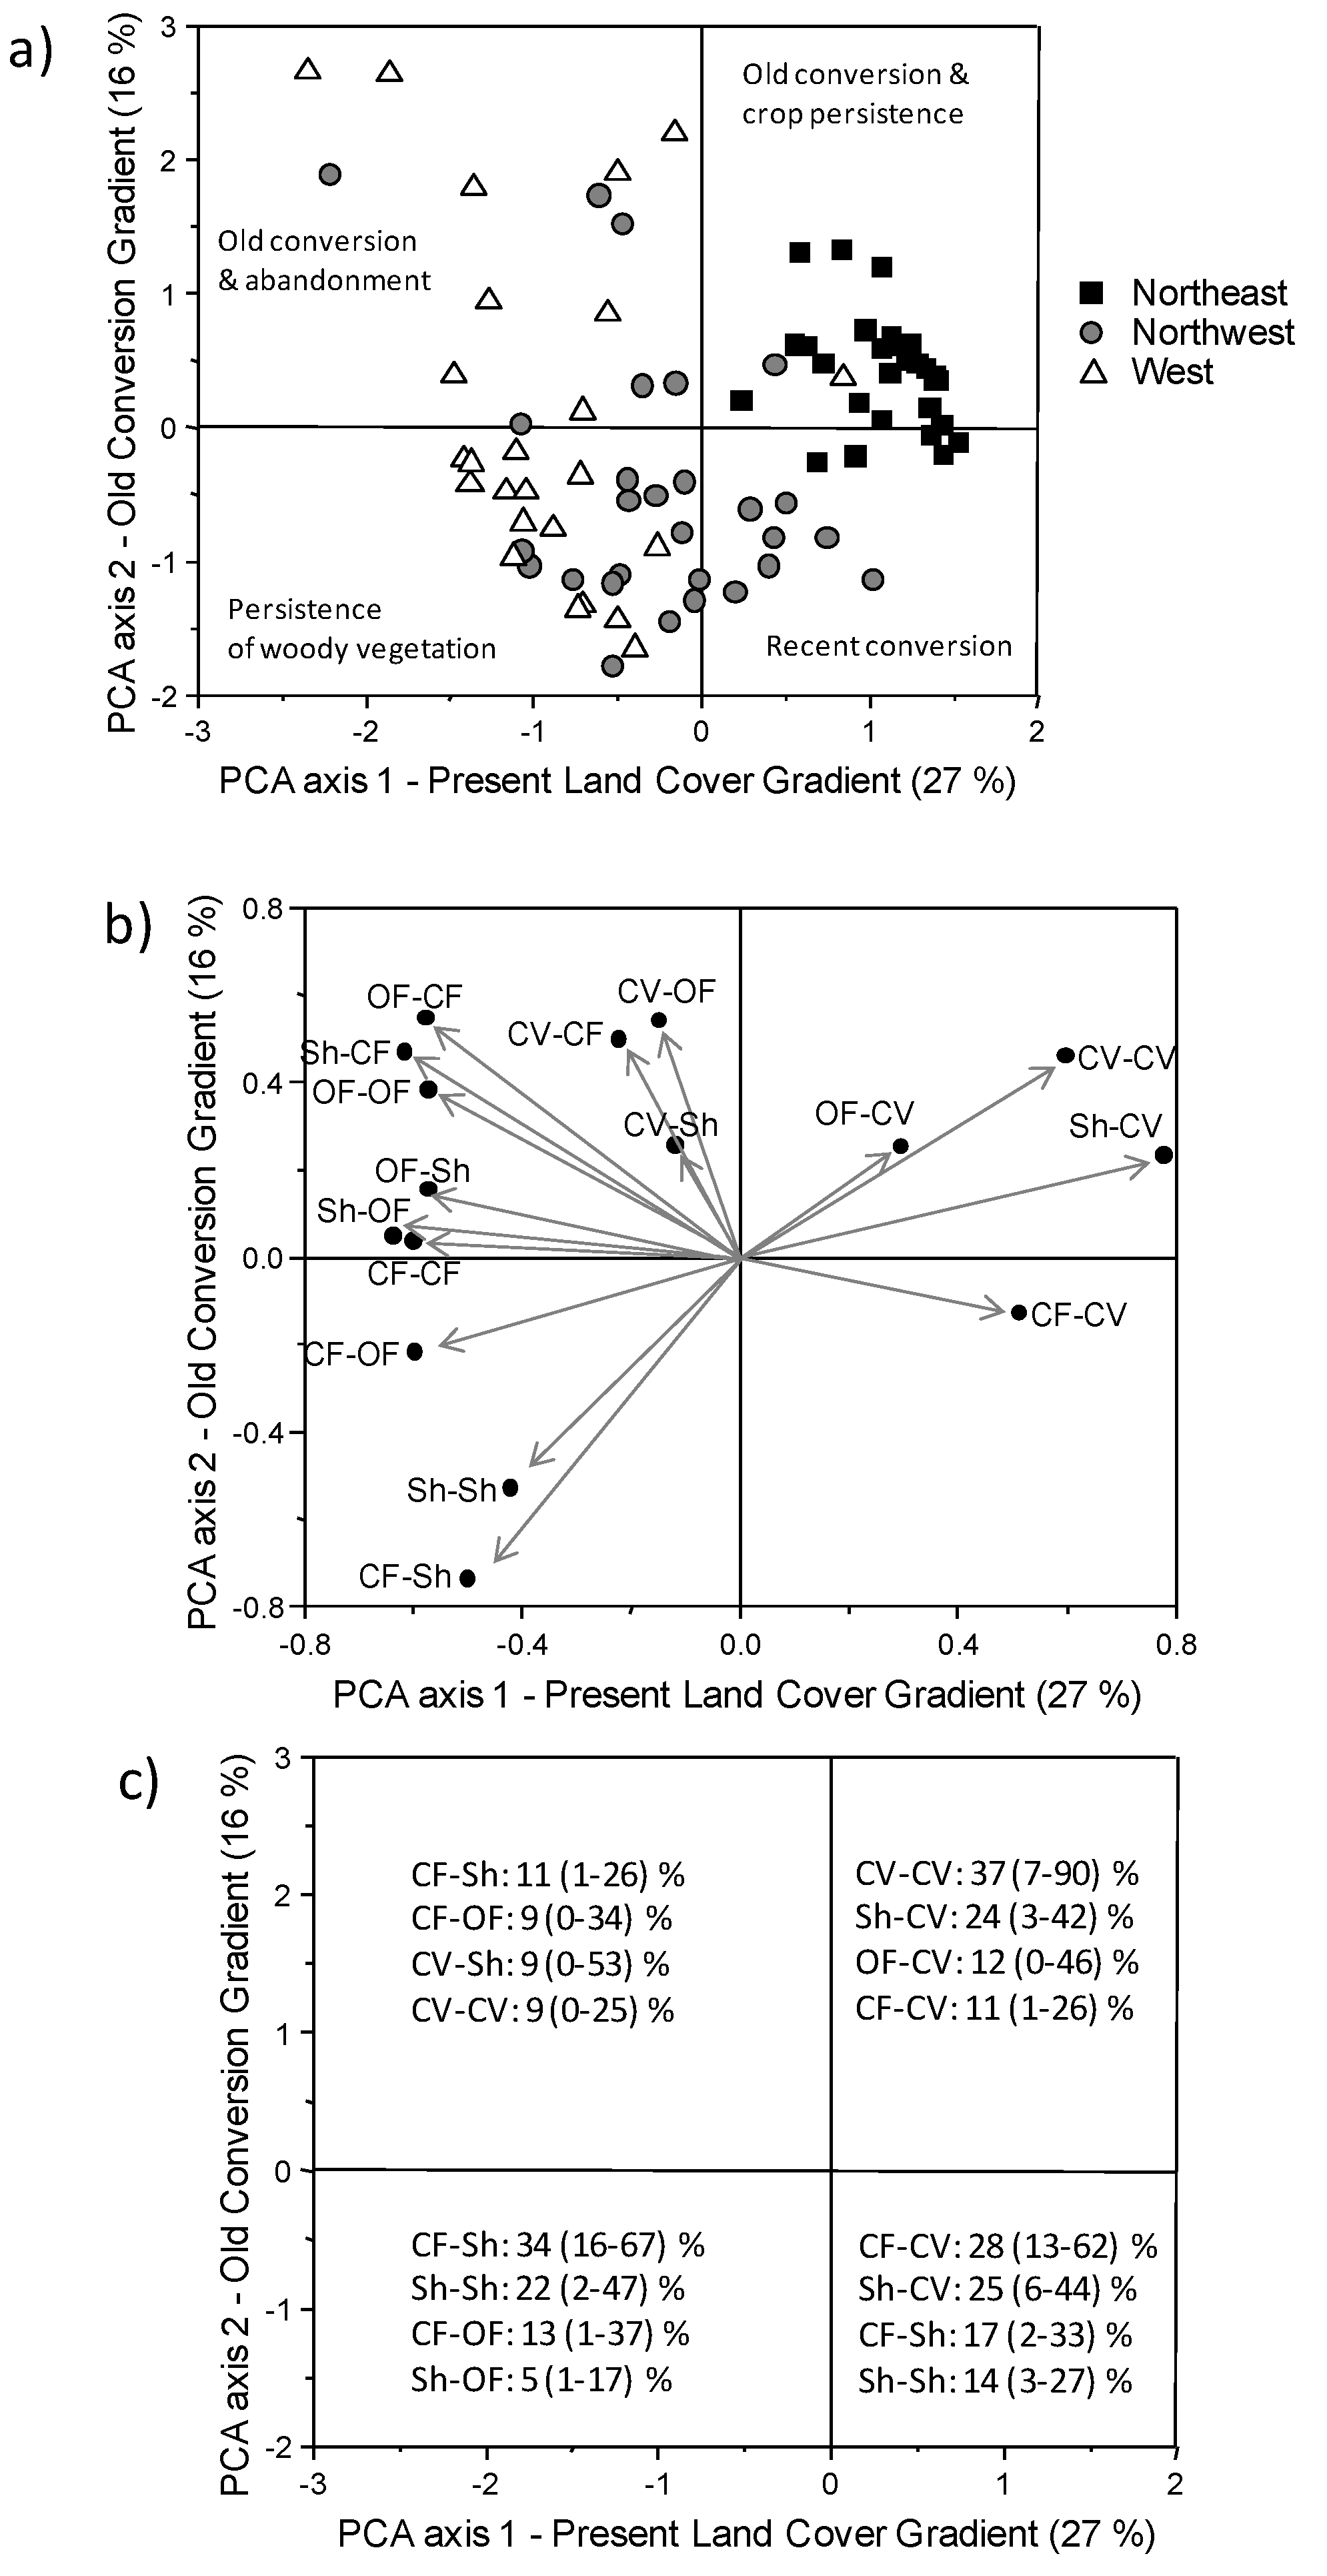
3.2. Drivers of Land Cover Change

The mean precipitation (1950–2000 period) varied between 479 and 843 mm across the 81 circles, while altitude varied from 90 to 635 m a.s.l. The range of distances to roads varied between 0 and 17 km, while distance to human settlements varied from 1 to 63 km (Table 2).
Annual precipitation (1950–2000 period), soil productivity index, and latitude and longitude were positively correlated with PCA axis 1, indicating that the highest conversion into agriculture (either old or more recent) occurred in the rainiest sites with better soils, at the northeast of the study area, while at the driest sites at the southwest of the study area the woody cover still remains, or recovered after an unsuccessful attempt (Table 3). Additionally, distances to human settlements and roads, as well as the mean altitude, were negatively correlated with PCA axis 1 (Table 3), indicating that areas covered by forests or other woody cover types at present are located at higher altitudes and far away from roads and human settlements, when compared with areas that were permanently converted into agriculture. PCA axis 2 was positively correlated with annual precipitation, and was negatively correlated with human settlements and latitude, but correlations of drivers with axis 2 were far weaker than correlations with axis 1 (Table 3). This indicates that the old conversion tended to occur at sites with more precipitation, towards the southern sector of the study area, and close to human settlements. Conversion rate into agriculture was positively correlated with PCA axis 1 (r = 0.77, p < 0.001) and with mean annual precipitation, longitude and latitude, and negatively correlated with distance to human settlements and roads. This indicates that recent conversion to agriculture occurred in more rainy sites at the northeast part of the study area and close to human settlements and roads.
According to the multiple regression outputs, the linear combination of distance to roads, slope, and longitude explained 69% of the variation that was observed along axis 1 (Table 4a). This indicates that the circles located further east (and with higher precipitations), with low slope and close to the roads, experienced the highest conversion before and after 1979. Mean precipitation (1950–2000) was not included in this model, because variations in precipitation are contemplated by the variable longitude, since both of the variables are highly correlated among them (Pearson correlation = 0.935; p < 0.01). To obtain a model more biologically sound, we replaced the variable longitude by precipitation and this alternative model explained 62% of the variation that was observed along axis 1 (R2 = 0.617, p < 0.05).
The 35% of the variation along axis 2 was explained by the linear combination of the distance to human settlements, mean precipitation, and latitude (Table 4). This result shows the same pattern than the one observed with simple Pearson correlations, indicating that the samples located further south, with more precipitations and closer to human settlements experienced early conversion.
The variation in the conversion rate into agriculture (dependent variable) was explained by the linear combination of the variables distance to roads and mean precipitation (R2 = 0.552, Table 4). These results showed that the sites with higher annual precipitation and closer to roads experienced the highest conversion from 1979 to 2010.

4. Discussion

The first broad trend reported in this study for the southern extreme of the Great Chaco is a conversion of forests (both closed and open forests) into cultural vegetation and shrublands, both before and after the beginning of our study period. Our data report that abandonment (cultivated areas that became shrublands and/or forests) may reach high proportions in some areas, since some of the circular samples exhibit more than 50% of their surface affected by this type of process (Table 1 and Figure 2c). This paper also shows that, even when precipitation is a major driver of forest conversion in the southern Chaco, changes in land use and land cover that were observed before and after 1979, may have also been influenced by several other factors acting at different scales. Additionally, we show how multivariate analyses can be used to analyze trends in local land cover changes and their spatial associations across a region, and how these trends can be related to the potential local drivers of change.
The dry Chaco has a long tradition of land use: until the 1970’s production was centered in extensive cattle ranching, selective logging, and charcoal, with great impact in the domestic market [62,63]. After technological advances and the mechanization of agriculture, strong efforts were devoted to improve agriculture production. This resulted in effective conversion of the most suitable lands within the study area (the eastern sector). However, the lack of good soils and several other factors, such as reduced precipitations, restricted the development of agriculture in the western areas, where the abandonment and persistence of woody vegetation predominated during the study period. Consequently, shrublands and forests that were converted into cultural vegetation in the south-western part of the area, are now back under cattle grazing activities. Our data show that the main trend of variation along axis 1 of the PCA ordination discriminates samples located at the northeast sector of the study area that were converted into cultural vegetation both before and after 1979, from samples that have at present woody vegetation, either because they never were converted, or because they were converted and then abandoned (at the west of the study area). Caldas et al. [64] reported that in the western Paraguayan dry Chaco cattle ranching is a major driver of forest loss, while in the more suitable eastern Chaco, soybean expansion is the main driver of land cover change, as also stated by Fehlenberg et al. [35].
Agriculture expansion has been repeatedly reported as the major cause of deforestation in subtropical areas of South America [14,23], and a similar trend has been described for the Argentine dry Chaco, where soybean cultivation has rapidly expanded during the last two decades following precipitation increase and technological developments [32,33,44,45,55,65].
As shown by PCA axis 1 (Figure 2) and its correlation with the conversion rate, the conversion of woody to cultural vegetation in the southern Chaco during the study period was spatially associated to places that had already been cultivated before 1979. This means that the increase in precipitation that was reported by different authors during the last decades [32,55] only intensified the activity in adjacent areas to those that were already converted, but hardly produced an advance of the agriculture frontier.
The pattern described in this study is consistent with previous results reported for the study area [32,45], as well as for other areas from north western Argentina [44,46,55], where the loss of forests has been more intense in areas with higher rainfall. However, our results also suggest that even when deforestation in the southern extreme of the Great Chaco is associated with precipitation (Table 3 and Table 4), which follows an east-west gradient, other drivers that were related to accessibility and/or favorable environments (mainly productive soils and gentle slopes/lower altitudes) are also important at the local scale. In agreement with our results, Gasparri et al. [47] report that the main variables explaining the spatial patterns of cultivated areas in the northern Chaco of Argentina are the distance to main towns and soil suitability.
Despite the effect of rainfall, at the local scale the drivers of land cover changes may be complex and vary with context [5,11,64]. The intensity of forest loss appears to be significantly related to some of the bio-physical conditions of the area, different than precipitation. Our data showed a significant positive correlation of PCA axis 1 (reflecting old and recent forest conversion) with soil quality (Table 3), indicating that the likelihood of forest loss is greater at most suitable lands, with better soils and higher soil productivity indexes. Such biophysical control on the expansion of agriculture has been observed in many places of the world, in which soil quality, elevation, and slope gradient were found to be important predictors of deforestation [47,66,67,68]. The impacts of human activities on forest loss have more frequently been reported in flat lands and at low elevations, both because of more suitable physical conditions and the proximity to towns and infrastructure. In agreement with our results, numerous studies in different parts of the world have reported the higher likelihood of deforestation in low elevation areas and in flat landscapes with gentle slopes [2,67,69,70,71,72] (but see some exceptions in Mon et al. [67], Htun et al. [73], and Rojas et al. [74]).
Another finding of this study is that forest conversion was negatively correlated with human settlements and the distance to roads, which may indicate that the high rates of deforestation occur along roads and in the proximity to towns, probably due to the better accessibility and market availability. Infrastructure development has been repeatedly mentioned as a socio-economic factor that promotes deforestation [10,68,71] and/or agriculture expansion [47]. Our results confirm that the distance to human settlements has a significant effect on land use and cover changes, as reported previously for different places of the world [13,71,73,75]. Distance to roads appears with a significant effect in the multiple regression models, which means that this variable influences land cover changes, when the effect of precipitation and physical setting (slope) is controlled. The results that were published so far for different ecosystems of the world, especially tropical forests, show contrasting effects of the distance to roads on deforestation: while some authors report a significant effect [13,23,71,76], other studies indicate no evidence that roads contributed to deforestation [77].
Another pattern claiming for further explanations is the abandonment of cultivated lands and the old conversion of natural vegetation into agriculture. Sites showing old conversion into cultivated lands correspond mostly to circles that are located in the eastern part of the study area. These sites had more suitable conditions even before the recorded increase in precipitations during the second half of the past century, and are still under cultivation. On the other hand, some circles located in the western part of the study area show either the persistence of woody vegetation (without conversion during the study period) towards the north, or the abandonment of previously converted sites towards the south. As pointed out above, the sites of the study area with less rainfall and poorer soil quality are less suitable for agriculture (Table 2 and Table 3). All of these factors determine that crops are not profitable in the western sectors and fail to provide the expected benefits, and after a short period of cultivation, the land is abandoned. As a result, some sites that were deforested previously to 1979 were soon abandoned and were generally devoted again to cattle grazing. Human migration from rural to urban centers, with the consequent abandonment of agricultural land, is another mechanism explaining abandonment [78,79]. Our results suggest that sites closer to human settlements showing temporary increases in precipitation may undergo opportunistic conversion of natural vegetation to agriculture, but once precipitation decreases, these sites are abandoned. As pointed out in previous studies that were carried on in the southern extreme of the dry Chaco [32], the area has also been subjected to migration of rural population to towns and cities as a consequence of both, lack of profitable crops and changes in land tenure regime. This may, in turn, favor land abandonment and reduce land-pressure [71], resulting in the recovery of woody vegetation [79,80]. Unlikely, sites with low precipitation and far from settlements have never undergone conversion (Figure 2, Table 4)

5. Conclusions

We detected two main local trends in land-cover change along the southern extreme of the Great Chaco through multivariate analysis. The primary local trend was permanent conversion, either old or recent, of the land into agriculture; and, the secondary trend was old conversion, whether permanent or not. On the basis of the combination of both trends, we identified four alternative types of processes that were experienced by local landscapes along our study area: (1) conversion into agriculture before 1979 and persistence as agricultural land until present; (2) persistence of woody vegetation until 1979 and later conversion into agriculture; (3) conversion into agriculture before 1979, but later abandonment; and, (4) persistence of woody vegetation until present.
Geographical, biophysical, and socio-economic drivers determined which of the identified processes predominate in a given area. Increasing precipitation towards the east was the major driver of conversion into agriculture both before and after 1979, and precipitation shortage was the main driver of agriculture abandonment. Additionally, conversion has been more likely to occur in landscapes with better and more productive soils, and at the proximity to human settlements and roads. These results show that even when precipitation seems to be a determinant driver of woody vegetation loss in the Chaco, other factors that are controlling patterns of conversion into agriculture may vary at different spatial scales and contexts, and should also be taken into account in order to understand local causes and to establish general frameworks that are concerning the drivers of land cover change.

Supplementary Materials

The following are available online at https://www.mdpi.com/2220-9964/7/5/170/s1, Figure S1: Land cover of the study area in 1979 and 2010 (modified from Hoyos et al. 2013). The location of the study area within Córdoba Province and in South America is indicated. Figure S2: Study area (a) and possible driving forces of land cover change: (b) altitude, (c) slope, (d) topographic position, (e) annual precipitation, (f) soil type/soil productivity index, (g) human settlements, (h) roads.

Author Contributions

L.E.H., M.R.C. and A.M.C. designed the study, classified satellite data, planned the data analysis, performed field control and wrote the article.

Acknowledgments

Authors wish to acknowledge the assistance of the following institutions: the National Scientific & Technological Research Council (CONICET), the National University of Córdoba (SECyT-UNC), and the Córdoba Province Ministry of Science and Technology (MINCyT) (Projects PICTO and PIODO). M.R.C. and A.M.C. are researchers of CONICET, Argentina. We are grateful to Natalia Perez-Harguindegy and Daniel Renison for helping with the English version.

Conflicts of Interest

The authors declare no conflict of interest.

References

  1. Lambin, E.F.; Turner, B.L.; Geist, H.J.; Agbola, S.B.; Angelsen, A.; Bruce, J.W.; Coomes, O.T.; Dirzo, R.; Fischer, G.; Folke, C.; et al. The causes of land-use and land-cover change: Moving beyond the myths. Glob. Environ. Chang. 2001, 11, 261–269. [Google Scholar] [CrossRef]
  2. Geist, H.J.; Lambin, E.F. Proximate causes and underlying driving forces of tropical deforestation. BioScience 2002, 52, 143–150. [Google Scholar] [CrossRef]
  3. Bürgi, M.; Hersperger, A.M.; Schneeberger, N. Driving forces of landscape change–current and new directions. Landsc. Ecol. 2004, 19, 857–868. [Google Scholar] [CrossRef]
  4. Patarasuk, R.; Binford, M.W. Longitudinal analysis of the road network development and land-cover change in Lop Buri province, Thailand, 1989–2006. Appl. Geogr. 2012, 32, 228–239. [Google Scholar] [CrossRef]
  5. Honey-Rosés, J. Disentangling the proximate factors of deforestation: The case of the Monarch butterfly Biosphere Reserve in Mexico. Land Degrad. Dev. 2009, 20, 22–32. [Google Scholar] [CrossRef]
  6. Angelsen, A.; Kaimowitz, D. Rethinking the causes of deforestation: Lessons from economic models. World Bank Res. Obs. 1999, 14, 73–98. [Google Scholar] [CrossRef] [PubMed]
  7. Acheson, J.M.; McCloskey, J. Causes of deforestation: The Maine case. Hum. Ecol. 2008, 36, 909–922. [Google Scholar] [CrossRef]
  8. Sassen, M.; Sheil, D.; Giller, K.E.; Ter Braak, C.J.F. Complex context and dynamic drivers: Understanding four decades of forest loss and recovery in an East African protected area. Biol. Conserv. 2013, 159, 257–268. [Google Scholar] [CrossRef]
  9. Nolte, C.; le Polain de Waroux, Y.; Munger, J.; Reis, T.N.P.; Lambin, E.F. Conditions influencing the adoption of effective anti-deforestation policies in South America´s commodity frontiers. Glob. Environ. Chang. 2017, 43, 1–14. [Google Scholar] [CrossRef]
  10. Freitas, S.R.; Hawbaker, T.J.; Metzger, J.P. Effects of roads, topography, and land use on forest cover dynamics in the Brazilian Atlantic Forest. For. Ecol. Manag. 2010, 259, 410–417. [Google Scholar] [CrossRef]
  11. Lele, N.; Nagendra, H.; Southworth, J. Accessibility, demography and protection: Drivers of forest stability and change at multiple scales in the Cauvery Basin, India. Remote Sens. 2010, 2, 306–332. [Google Scholar] [CrossRef]
  12. Southworth, J.; Tucker, C. The influence of accessibility, local institutions, and socioeconomic factors on forest cover change in the mountains of Western Honduras. Mt. Res. Dev. 2001, 21, 276–283. [Google Scholar] [CrossRef]
  13. Laurance, W.F.; Albernaz, A.K.M.; Schroth, G.; Fearnside, P.M.; Bergen, S.; Venticinque, E.M.; Da Costa, C. Predictors of deforestation in the Brazilian Amazon. J. Biogeogr. 2002, 29, 737–748. [Google Scholar] [CrossRef]
  14. Lambin, E.F.; Helmut, J.; Geist, H.J.; Lepers, E. Dynamics of land-use and land-cover change in tropical regions. Annu. Rev. Environ. Resour. 2003, 28, 205–241. [Google Scholar] [CrossRef]
  15. Carr, D.L. Proximate population factors and deforestation in tropical agricultural frontiers. Popul. Environ. 2004, 25, 585–612. [Google Scholar] [CrossRef] [PubMed]
  16. Carr, D.L.; López, A.C.; Bilsborrow, R.E. The population, agriculture, and environment nexus in Latin America: Country-level evidence from the latter half of the twentieth century. Popul. Environ. 2009, 30, 222–246. [Google Scholar] [CrossRef]
  17. Rudel, T.K. Is there a forest transition? Deforestation, reforestation and development. Rural Sociol. 1998, 63, 533–552. [Google Scholar] [CrossRef]
  18. Rudel, T.K.; Coomes, O.T.; Moran, E.; Achard, F.; Angelsen, A.; Xu, J.; Lambin, E.F. Forest transitions: Towards a global understanding of land use change. Glob. Environ. Chang. 2005, 15, 23–31. [Google Scholar] [CrossRef]
  19. Uriarte, M.; Swenson, N.G.; Chazdon, R.L.; Comita, L.S.; John Kress, W.; Erickson, D.; Forero-Montaña, J.; Zimmerman, J.K.; Thompson, J. Trait similarity, shared ancestry and the structure of neighbourhood interactions in a subtropical wet forest: implications for community assembly. Ecol. Lett. 2010, 13, 1503–1514. [Google Scholar] [CrossRef] [PubMed] [Green Version]
  20. Hecth, S. The new rurality: Globalization, peasants and the paradoxes of lanscapes. Land Use Policy 2010, 27, 161–169. [Google Scholar]
  21. Hecth, S.; Kandel, S.; Gomes, I.; Cuellar, N.; Herman, R.P. Globalization, Forest Resurgence, and Environmental Politics in El Salvador. World Dev. 2006, 34, 308–323. [Google Scholar]
  22. Soares-Filho, B.; Alencar, A.; Nepstad, D.; Cerqueira, G.; Díaz, M.C.V.; Rivero, S.; Solórzano, L.; Voll, E. Simulating the response of land-cover changes to road paving and governance along a major Amazon highway: The Santarém-Cuiabá corridor. Glob. Chang. Biol. 2004, 10, 745–764. [Google Scholar] [CrossRef]
  23. Van Gils, H.A.M.J.; Loza Armand Ugon, A.V. What Drives Conversion of Tropical Forest in Carrasco Province, Bolivia? Ambio 2006, 35, 81–85. [Google Scholar] [CrossRef]
  24. Young, K.R. Roads and the Environmental Degradation of Tropical Montane Forests. Conserv. Biol. 1994, 8, 972–976. [Google Scholar] [CrossRef]
  25. Fearnside, P.M. Brazil´s Cuiabá-Santarém (BR-163) highway: The environmental cost of paving a soybean corridor through the Amazon. Environ. Manag. 2007, 39, 601–614. [Google Scholar] [CrossRef] [PubMed]
  26. Fearnside, P.M. The roles and movements of actors in the deforestation of Brazilian Amazonia. Ecol. Soc. 2008, 13, 23. [Google Scholar] [CrossRef]
  27. Thomlinson, J.R.; Serrano, M.I.; López, T.M.; Aide, T.M.; Zimmerman, J.K. Land-use dynamics in a post-agricultural Puerto Rican landscape (1936–1988). Biotropica 1996, 28, 525–536. [Google Scholar] [CrossRef]
  28. Kebrom, T.; Backéus, I.; Skoglund, J.; Zerihun, W. Vegetation on hill slopes in southern Wello, Ethiopia: Degradation and regeneration. Nordic J. Bot. 1997, 17, 483–493. [Google Scholar]
  29. Paruelo, J.M.; Guerschman, J.P.; Piñeiro, G.; Jobbagy, E.G.; Veron, S.R.; Baldi, G.; Baeza, S. Cambios en el uso de la tierra en Argentina y Uruguay: Marcos conceptuales para su análisis. Agrociences 2006, 10, 47–64. [Google Scholar]
  30. Gasparri, N.I.; Grau, H.R. Deforestation and fragmentation of Chaco dry forest in NW Argentina (1972–2007). For. Ecol. Manag. 2009, 258, 913–921. [Google Scholar] [CrossRef]
  31. Bucher, E.H. Chaco and Caatinga—South American arid savannas. Woodlans and tickets. In Ecology of Tropical Savannas; Huntley, B.J., Walker, B.H., Eds.; Springer: Berlin, Germany, 1982; pp. 48–79. ISBN 978-3-642-68786-0. [Google Scholar]
  32. Zak, M.R.; Cabido, M.R.; Cáceres, D.; Díaz, S. What drives accelerated land cover change in central Argentina? Synergistic consequences of climatic, socioeconomic, and technological factors. Environ. Manag. 2008, 42, 181–189. [Google Scholar] [CrossRef] [PubMed]
  33. Boletta, P.E.; Ravelo, A.C.; Planchuelo, A.M.; Grilli, M. Assessing deforestation in the Argentine Chaco. For. Ecol. Manag. 2006, 228, 108–114. [Google Scholar] [CrossRef]
  34. Gasparri, N.I.; Grau, H.R. Patrones regionales de deforestación en el subtrópico argentino y su contexto ecológico y socioeconómico. In Situación Ambiental Argentina 2005; Brown, A.D., Martinez Ortiz, U., Acerbi, M., Corchera, J., Eds.; Fundación Vida Silvestre Argentina: Buenos Aires, Argentina, 2006; pp. 442–446. ISBN 950-9427-14-4. [Google Scholar]
  35. Fehlenberg, V.; Baumann, M.; Gasparri, N.I.; Piquer-Rodriguez, M.; Gavier-Pizarro, G.; Kuemmerle, T. The role of soybean productionas an underlying driver of deforestation in the South American Chaco. Glob. Environ. Chang. 2017, 45, 24–34. [Google Scholar] [CrossRef]
  36. Adamoli, J.; Torrela, S.; Ginzburg, R. Diagnóstico ambiental del Chaco Argentino. Gestión integrada y desarrollo Sostenible Para Reducir la Degradación Social, Económica y ambiental en el Gran Chaco Americano; Dirección de Conservación del Suelo y Lucha contra la Desertificación, Secretaría de Ambiente y Desarrollo Sustentable: Buenos Aires, Argentina, 2004. [Google Scholar]
  37. Grau, H.R.; Torres, R.; Gasparri, N.I.; Blendinger, P.G.; Marinaro, S.; Macchi, L. Natural grasslands in the Chaco. A neglected ecosystem under threat by agriculture expansion and forest-oriented conservation policies. J. Arid Environ. 2015, 123, 40–46. [Google Scholar] [CrossRef]
  38. Morello, J.; Saravia Toledo, C. El bosque chaqueño: Paisaje primitivo, paisaje natural y paisaje cultural en el oriente de Salta. Rev. Agron. Noroeste Argent 1959, 3, 5–81. [Google Scholar]
  39. Schofield, C.J.; Bucher, E.H. Industrial contributions to desertification in South America. Trends Ecol. Evol. 1986, 1, 78–80. [Google Scholar] [CrossRef]
  40. Díaz, S.; Acosta, A.T.R.; Cabido, M. Community structure in montane grasslands of central Argentina in relation to land use. J. Veg. Sci. 1994, 5, 483–488. [Google Scholar] [CrossRef]
  41. Argañaraz, J.P.; Gavier Pizarro, G.; Zak, M.; Bellis, L.M. Fire regime, climate, and vegetation in the Sierras de Córdoba, Argentina. Fire Ecol. 2015, 11, 55–73. [Google Scholar] [CrossRef]
  42. Sayago, M. Estudio fitogeográfico del norte de Córdoba. Bol. Acad. Nac. Cienc. Córdoba 1969, 46, 123–427. [Google Scholar]
  43. Natenzon, C.E.; Olivera, C. La tala del bosque en los llanos de La Rioja (1900–1960). Desarro. Econ. 1994, 34, 263–284. [Google Scholar] [CrossRef]
  44. Grau, H.R.; Gasparri, N.I.; Aide, T.M. Agriculture expansion and deforestation in seasonally dry forest of north-west Argentina. Environ. Conserv. 2005, 32, 140–148. [Google Scholar] [CrossRef]
  45. Hoyos, L.E.; Cingolani, A.M.; Zak, M.R.; Vaieretti, M.V.; Gorla, D.E.; Cabido, M.R. Deforestation and precipitation patterns in the arid Chaco forest of central Argentina. Appl. Veg. Sci. 2013, 16, 260–271. [Google Scholar] [CrossRef]
  46. Minetti, J.L.; Vargas, W.M. Trends and jumps in the annual precipitation in South America, south of the 15° S. Atmós 1997, 11, 205–221. [Google Scholar]
  47. Gasparri, N.I.; Grau, H.R.; Sacchi, L.V. Determinants of the spatial distribution of cultivated land in the North Argentine Dry Chaco in a multi-decadal study. J. Arid Environ. 2015, 123, 31–39. [Google Scholar] [CrossRef]
  48. Zak, M.R.; Cabido, M.R.; Hodgson, J.G. Do subtropical seasonal forest in the Gran Chaco, Argentina, have a future? Biol. Conserv. 2004, 120, 589–598. [Google Scholar] [CrossRef]
  49. Cabrera, A.L. Regiones Fitogeográficas de Argentina; Enciclopedia Argentina de Agricultura y Jardinería. Buenos Aires, ACME Agency: Buenos Aires, Argentina, 1976; p. 85. ISBN 950-566-127-4. [Google Scholar]
  50. Zak, M.R.; Cabido, M.R. Spatial patterns of the Chaco vegetation of central Argentina: Integration of remote sensing and phytosociology. Appl. Veg. Sci. 2002, 5, 213–226. [Google Scholar] [CrossRef]
  51. Bonino, E.E.; Araujo, P. Structural differences between a primary and a secondary forest in the Argentine Dry Chaco and management implications. For. Ecol. Manag. 2005, 206, 407–412. [Google Scholar] [CrossRef]
  52. Cabido, M.R.; Acosta, A.T.R.; Carranza, M.L.; Díaz, S. La vegetación del Chaco Árido en el W de la provincia de Córdoba, Argentina. Doc. Phytosociol. 1992, 14, 447–459. [Google Scholar]
  53. Cabido, M.R.; González, C.; Díaz, S. Vegetation changes along a precipitation gradient in Central Argentina. Vegetatio 1993, 109, 5–14. [Google Scholar] [CrossRef]
  54. Steininger, M.K.; Tucker, C.J.; Ersts, P.; Killen, T.J.; Villegas, Z.; Hecht, S.B. Clearance and fragmentation of tropical deciduous forest in de Tierras bajas, Santa Cruz, Bolivia. Conserv. Biol. 2001, 15, 856–866. [Google Scholar] [CrossRef]
  55. Minetti, J.L.; Lamelas, C.M. Respuesta regional de la soja en Tucumán a la variabilidad climática. Rev. Ind. Agríc. Tucumán 1997, 72, 63–68. [Google Scholar]
  56. Singh, A. Digital change detection techniques using remotely-sensed data. Int. J. Remote Sens. 1989, 6, 989–1003. [Google Scholar] [CrossRef]
  57. Viña, A.; Echavarría, F.R.; Rundquist, D.C. Satellite change detection analisis of deforestation rates and patterns along the Colombia-Ecuador Border. Ambio 2004, 33, 118–125. [Google Scholar] [CrossRef] [PubMed]
  58. Diniz-Filho, J.A.F.; Bini, L.M.; Hawkins, B. Spatial autocorrelation and red herrings in geographical ecology. Glob. Ecol. Biogeogr. 2003, 12, 53–64. [Google Scholar] [CrossRef]
  59. Cingolani, A.M.; Renison, D.; Tecco, P.; Gurvich, D.E.; Cabido, M. Predicting cover types in a mountain range with long evolutionary grazing history: A GIS approach. J. Biogeogr. 2008, 35, 538–551. [Google Scholar] [CrossRef]
  60. Cingolani, A.M.; Cabido, M.; Renison, D.; Solís-Neffa, V. Combined effects of environment and grazing on vegetation structure in Argentine granite grassland. J. Veg. Sci. 2003, 14, 223–232. [Google Scholar] [CrossRef]
  61. Hijmans, R.J.; Cameron, S.E.; Parra, J.L.; Jones, P.G.; Jarvis, A. Very high resolution interpolated climate surface for global land areas. Int. J. Climatol. 2005, 25, 1965–1978. [Google Scholar] [CrossRef]
  62. Morello, J. El Gran Chaco: Proceso de expansión de la frontera agrícola desde el punto de vista ecológico-ambiental. In Expansión de la Frontera Agropecuaria y Medio Ambiente en América Latina; CEPAL-PNUMA-CIFCA: Madrid, Spain, 1983; pp. 341–396. [Google Scholar]
  63. Morello, J.; Pengue, W.; Rodríguez, A. Un Siglo de Cambios de Diseño del Paisaje: El Chaco Argentino; Primeras Jornadas Argentinas de Ecología del Paisaje: Buenos Aires, Argentina, 2005. [Google Scholar]
  64. Caldas, M.M.; Goodin, D.; Sherwood, S.; Campos Krauer, J.M.; Wisely, S.M. Land cover change in Paraguay Chaco: 2000–2011. J. Land Use Sci. 2013, 10, 1–18. [Google Scholar] [CrossRef]
  65. Macchi, L.; Grau, H.R.; Zelaya, P.V.; Marinaro, S. Trade-offs betweem land use intensity and avian biodiversity in the dry Chaco of Argentina: A tale of two gradients. Agric. Ecosyst. Environ. 2013, 174, 11–20. [Google Scholar] [CrossRef]
  66. Mottet, A.; Ladet, S.; Coqué, N.; Gibon, A. Agricultural land-use change and its drivers in mountain landscapes: A case study in the Pyrenees. Agric. Ecosyst. Environ. 2006, 114, 296–310. [Google Scholar] [CrossRef]
  67. Mon, M.S.; Mizoue, N.; Htun, N.Z.; Kajisa, T.; Yoshida, S. Factors affecting deforestation and forest degradation in selective logged production forest: A case study in Myanmar. For. Ecol. Manag. 2012, 267, 190–198. [Google Scholar] [CrossRef]
  68. Getahun, K.; Van Rompaey, A.; Van Turnhout, P.; Poesen, J. Factors controlling patterns of deforestation in moist evergreen Afromontane forests of Southwest Ethiopia. For. Ecol. Manag. 2013, 304, 171–181. [Google Scholar] [CrossRef]
  69. Chowdhury, R.R. Driving forces of tropical deforestation: The role of remote sensing and spatial models. Singap. J. Trop. Geogr. 2006, 27, 82–101. [Google Scholar] [CrossRef]
  70. Lele, N.; Joshi, P.K. Analyzing deforestation rates, spatial forest cover changes and identifying critical areas of forest cover changes in North-East India during 1972–1999. Environ. Monit. Assess. 2009, 156, 159–170. [Google Scholar] [CrossRef] [PubMed]
  71. Schulz, J.J.; Cayuela, L.; Rey-Benayas, J.M.; Schröder, B. Factors influencing vegetation cover change in Mediterranean Central Chile (1975–2008). Appl. Veg. Sci. 2011, 14, 571–582. [Google Scholar] [CrossRef]
  72. Teka, D.; Van Wesemael, B.; Vanacker, V.; Poesen, J.; Hallet, V.; Taye, G.; Deckers, J.; Haregeweyn, N. Evaluating the performance of reservoirs in semi-arid catchments of Tigray: Tradeoff between water harvesting and soil and water conservation. Catena 2013, 110, 146–154. [Google Scholar] [CrossRef]
  73. Htun, N.Z.; Mizoue, N.; Yoshida, S. Changes in determinants of deforestation and Forest degradation in Popa Mountain Park, Central Myanmar. Environ. Manag. 2013, 51, 423–434. [Google Scholar] [CrossRef] [PubMed]
  74. Rojas, C.; Pino, J.; Basnou, C.; Vivanco, M. Assesing land-use and cover changes in relation to geographic factors and urban planning in the metropolitan area of Concepción (Chile). Implications for biodiversity conservation. Appl. Geogr. 2013, 39, 93–103. [Google Scholar] [CrossRef]
  75. McDonald, R.I.; Urban, D.L. Spatially varying rules of landscape change: Lessons from a case study. Landsc. Urban Plan. 2006, 74, 7–20. [Google Scholar] [CrossRef]
  76. Steininger, M.K.; Tucker, C.J.; Townshend, J.R.G.; Killeen, T.J.; Desch, A.; Bell, V.; Ersts, P. Tropical deforestation in the Bolivian Amazon. Environ. Conserv. 2001, 28, 127–134. [Google Scholar] [CrossRef]
  77. Deng, X.; Huang, J.; Uchida, E.; Rozelle, S.; Gibson, J. Pressure cookers or pressure valves: Do roads lead to deforestation in China. J. Environ. Econ. Manag. 2011, 61, 79–94. [Google Scholar] [CrossRef]
  78. Grau, H.R.; Aide, T.M.; Zimmerman, J.K.; Thomlinson, J.R.; Helmer, F.; Zou, X. The ecological consequences of socioeconomic and land-use changes in postagricultural Puerto Rico. Bioscience 2003, 53, 1159–1168. [Google Scholar] [CrossRef]
  79. Pares-Ramos, I.K.; Gould, W.A.; Aide, T.M. Agricultural abandonment, suburban growth, and forest expansion in Puerto Rico between 1991 and 2000. Ecol. Soc. 2008, 13, 1. [Google Scholar] [CrossRef]
  80. Aide, T.M.; Zimmerman, J.K.; Pascarella, J.; Marcano-Vega, J.; Rivera, L. Forest regeneration in a chronosequence of tropical abandoned pastures: Implications for restoration ecology. Rest. Ecol. 2000, 8, 328–338. [Google Scholar] [CrossRef]
Figure 1. (a) Location of the Gran Chaco and Cordoba Province in Argentina, and different eco-regions within the Gran Chaco; and, (b) Study area in the Cordoba Province; different grey tones indicate the three sectors used to stratify the sampling.
Ijgi 07 00170 g001
Figure 2. (a) Ordination of circles in the plane defined by the first two Principal Component Analysis (PCA) axes. Different symbols represent the three sectors of the study area used to stratify sampling; (b) Contribution of the variables (classes of land cover changes between 1979 and 2010) to the two axes of the PCA ordination; (c) Average (and range between brackets) of the four major land cover changes between 1979 and 2010 for circles positioned in each PCA quadrant. For b and c, the first two letters indicate the land cover in 1979 and the second pair indicates the land cover in 2010: cultural vegetation (CV), shrubland (Sh), closed forest (CF), open forest (OF).
Ijgi 07 00170 g002
Table 1. Descriptive statistics (quartiles, maximum values and mean) 1 of the variables (proportion, expressed in%, of land cover change classes between 1979 and 2010) for the 81 circular samples. The first two letters indicate the land cover in 1979 and the second pair indicates the land cover in 2010. Cultural vegetation (CV), Closed forest (CF), Open forest (OF), and Shrubland (Sh). Non-zero values lower than 0.5% were indicated by a “+”.
Quartiles
Variables25%50%75%MaximumMean
CV-CV16229015
CV-Sh134534
CV-OF++181
CV-CF0+181
Sh-CV29244414
Sh-Sh310194713
Sh-OF126174
Sh-CF01291
OF-CV+14465
OF-Sh+25193
OF-OF++3132
OF-CF0++91
CF-CV37156211
CF-Sh215286717
CF-OF+38377
CF-CF+13182
1 Minimum values were zero for almost all cases, except for CF-Sh and Sh-Sh which had minimum values lower than 1%.
Table 2. Descriptive statistics of the possible driving forces for the 81 circles.
Possible DriversMinimunMaximunMean
Mean precipitation (1950–2000) (mm)479843627
Mean altitude (m a.s.l.)90635306
Mean slope (%)031
Mean topographic position (%)465250
Soil productivity index (dimensionless)99556
Distance to roads (highways and roads) (km)0172
Distance to human settlements (km)16322
Longitude (Gauss Kruger metric coordinate) 14,238,0874,495,7804,347,734
Latitude (Gauss Kruger metric coordinate) 26,430,7846,725,8196,600,888
1 Higher values indicate a more eastward position; 2 Higher values indicate a more northward position.
Table 3. Pearson correlations between possible drivers of change and the first two axes of the PCA ordination and the conversion rate into agriculture.
Possible DriversPCA Axis1PCA Axis2Conversion Rate
Mean precipitation (1950–2000)0.769 **0.336 **0.722 **
Mean altitude−0.325 **0.164−0.168
Mean slope−0.0210.0740.057
Mean topographic position−0.0140.1060.090
Soil productivity index0.227 *0.2740.245 *
Soil types 1*NS*
Distance to roads (highways and roads)−0.332 **−0.154−0.254 *
Distance to human settlements−0.454 **−0.380 **−0.449 **
Longitude (Gauss Kruger metric coordinate) ²0.799 **0.1980.634 **
Latitude (Gauss Kruger metric coordinate) ³0.502 **−0.252 *0.280 *
* p ≤ 0.05; ** p ≤ 0.01. 1 For this qualitative variable a one-factor ANOVA was performed; ² Higher values indicate a more eastward position; ³ Higher values indicate a more northward position.
Table 4. Linear combination of the variables that were selected (p ≤ 0.05) through a forward multiple regression procedure to explain (a) PCA axis 1, (b) PCA axis 2, and (c) conversion rate into agriculture.
VariablesBtp
(a)
Intercept−47.389−13.062<0.001
Distance to roads −0.051−2.0670.042
Mean slope−0.388−3.2020.002
Longitude (Gauss Kruger metric coordinate)1.1 × 10−513.061<0.001
Dependent variable: PCA axis 1 (present land cover gradient), R2 = 0.690.
(b)
Intercept37.7284.606<0.001
Distance to human settlements−0.020−2.8600.005
Mean annual precipitation0.0033.0690.003
Latitude (Gauss Kruger metric coordinate)−5.9 × 10⁻⁶−4.6760.000
Dependent variable: PCA axis 2 (old conversion gradient), R2 = 0.353.
(c)
Intercept−6.845−7.439<0.001
Distance to roads−0.173−2.3290.022
Mean annual precipitation0.0149.8020.000
Dependent variable: Conversion rate into agriculture between 1979 and 2010, R2 = 0.552.

