Article

Coupling Traditional Monitoring and Citizen Science to Disentangle the Invasion of Halyomorpha halys

1
Department of Civil, Environmental and Mechanical Engineering, University of Trento, 38123 Trento, Italy
2
Research and Innovation Center, Edmund Mach Foundation, 38010 San Michele all’Adige, Italy
3
Technology Transfer Center, Edmund Mach Foundation, 38010 San Michele all’Adige, Italy
4
Department of Agricultural, Food, Environmental and Animal Sciences, University of Udine, 33100 Udine, Italy
5
Center for Agriculture, Food and Environment, University of Trento, 38010 San Michele all’Adige, Italy
*
Author to whom correspondence should be addressed.
ISPRS Int. J. Geo-Inf. 2018, 7(5), 171; https://doi.org/10.3390/ijgi7050171
Submission received: 28 March 2018 / Revised: 19 April 2018 / Accepted: 30 April 2018 / Published: 4 May 2018
(This article belongs to the Special Issue Geoinformatics in Citizen Science)

Abstract

:
The brown marmorated stink bug, Halyomorpha halys Stål (Hemiptera: Pentatomidae), is an invasive pest that has expanded its range outside of its original confinements in Eastern Asia, spreading through the United States, Canada and most of the European and Eurasian countries. The invasiveness of this agricultural and public nuisance pest is facilitated by the availability of an array of suitable hosts, an r-selected life history and the release from natural enemies in the invaded zones. Traditional monitoring methods are usually impeded by the lack of time and resources to sufficiently cover large geographical ranges. Therefore, the citizen science initiative “BugMap” was conceived to complement and assist researchers in breaking down the behavior of this invasive pest via a user-friendly, freely available mobile application. The collected data were employed to forecast its predicted distribution and to identify the areas at risk in Trentino, Northern Italy. Moreover, they permitted the uncovering of the seasonal invasion dynamics of this insect, besides providing insight into its phenological patterns, life cycle and potential management methods. Hence, the outcomes of this work emphasize the need to further integrate citizens in scientific endeavors to resolve ecological complications and reduce the gap between the public and science.

1. Introduction

As defined by the Oxford Dictionary [1], citizen science (CS) is ‘the collection and analysis of data relating to the natural world by members of the general public, typically as part of a collaborative project with professional scientists’. Oftentimes in ecological studies, there is a large amount of data to process or an extensive geographic range to cover. This poses a problem for a single researcher or even a small team of researchers [2]. Citizen scientists could help fill this role if provided with the capabilities to effectively assemble and share data.
Having citizens participate in gathering scientific data has several benefits, including improved science and technology literacy among participants and reduced costs [3]. Studies also suggest that engaging citizen volunteers makes it more likely that programs collect data relevant to local conservation and management issues [3,4]. Such data may improve professional predictions on species’ future distributions, allowing the timely dissemination of these results to an educated public [5]. Volunteering citizens may also have access to lands that may not be accessible to professional scientists, allowing them to discover invasive species not yet detected elsewhere [6].
The field of ornithology has the longest history of CS [7], with thousands of amateur and professional ornithologists worldwide. One would assume that arthropods might not be as alluring for the ordinary citizen as much as birds are. Nevertheless, some of the more colorful insects have indeed caught the public’s eye. The North American Butterfly Association (NABA) has initiated a program to monitor butterflies, in order to better quantify their range and abundance. Moreover, crowdsourced records on the periodical cicada, Magicicada spp., through the website www.magicicada.org, have been used to build mapped distributions of this insect to detect its range changes [8]. Mosquito Alert is another CS project developed in recent years to assist in the monitoring and management of disease carrying mosquitoes, Aedes albopictus Skuse (1894) and Aedes aegypti Linnaeus (1762). Citizens are invited to report sightings of the insects or of potential breeding sites; this information is communicated to public health managers to monitor and control the spread and damage caused by these “urban Aedes” [9].
One of the most documented expressions of global anthropogenic forcing is the human-induced movement of non-native species [10]. This phenomenon usually refers to the voluntary or accidental introduction of taxa or genotypes far from their historical distributional areas as a result of trade, tourism, agriculture or biological control programs [11,12].
The brown marmorated stink bug (BMSB), Halyomorpha halys Stål (Hemiptera: Pentatomidae) is an invasive pest that was introduced into the United States from Asia in the mid-1990s [13]. It has spread throughout most of the United States, as well as into Canada [14]. In Europe, BMSB was first detected in 2007 in Zurich, Switzerland [15]; its range has now expanded to include most of the European and Eurasian countries [16]. It was first detected in Italy in 2012 in the province of Modena [17]. BMSB feeding on pome fruits results in deformed, symptomatic produce with indents on the surface and corky spots in the flesh, debilitating their marketability [18].
Over $21 billion worth of crops in the United States alone have been estimated to be threatened by H. halys feeding damage [19]. Additional irritation by this pest lies in its overwintering behavior where it tends to aggregate in man-made structures [20], rendering it a pervasive residential nuisance.
Some of the most severe agricultural and annoyance problems have been recorded in Italy [17]. In the fall of 2017, the Friuli-Venezia Giulia region in North Eastern Italy, witnessed one of the gravest anthropogenic aggregations of the bug in recent years (http://www.udinetoday.it/cronaca/invasione-cimici-marmorata-asiatica-talmassons-medio-basso-friuli.html). In Trentino Alto Adige region in Northern Italy, BMSB was first detected in the spring of 2016 [21]. Its presence in this region poses an imminent threat to vineyards and especially to the apple industry, which accounts for 65% of the Italian apple production [22].
The recording, mapping and monitoring of invasive species are prerequisites for successful biological invasion risk management [23]. Thus BugMap, a mobile application, was designed with this purpose in mind. It is a CS approach that aims at collecting crowdsourced data on the occurrence of the alien BMSB in a newly invaded range. Obtained reports allow species distribution modelling (SDM), which aims to predict the areas where environmental conditions are suitable for the survival and establishment of the pest [24]. For invasive species management, habitat suitability maps identify areas where invasive species (1) may actually be present but are not yet detected and (2) may disperse to in the future, thus providing assistance for planning and prioritizing areas for surveillance. Such information can also assist in determining the extent, cost and likelihood of the success of a control program [25].
However, invasive species distribution models (iSDMs) face special challenges because (1) they typically violate SDM assumption that the organism is in equilibrium with its environment; and (2) species absence data are often unavailable or believed to be too difficult to interpret [26]. In general, these modelling methods combine species locality data (geo-referenced coordinates of latitude and longitude from confirmed presence) with environmental variables to create a model of species requirements for the examined variables [25].
Geographic information system (GIS) technologies are enhancing our ability to study and understand the large-scale spatial structure and dynamics of insect populations, as influenced by heterogeneous environments. In the past 20 years, advancements in mapping technology and access to tools that allow us to geo-reference our location have allowed for increased acquisition and accuracy of data [27]. The ubiquity of the internet, cell phones and wireless technology has led to increasing importance of mobile GIS as a mode of data acquisition, which promoted increased interest in CS and crowdsourcing data [28]. These technologies offer great potential in entomological research and contribute to the refining of monitoring and management methods of invasive alien pests [29,30].
The scope of this study was to evaluate whether the contribution of volunteers would improve the existing monitoring strategies of an alien stink bug, freshly invading their territory and menacing their agricultural production. The effect of user training on the accuracy of citizen reports was evaluated and the amount of crowdsourced data was quantified and compared to reports obtained through traditional monitoring methods. Moreover, we used the collective data registered by both parties through BugMap to disentangle the invasion dynamics and phenology of BMSB in Trentino, Northern Italy. In addition, we mapped the potential distribution of this invasive pest based on the integration of both citizen monitoring and traditional methods. We expect this work to provide insight into the importance of such projects and the utility of combining crowdsourced and traditional survey data, for the improvement of ecological monitoring, species distribution mapping and invasive species management programs.

2. Materials and Methods

2.1. Data Acquisition
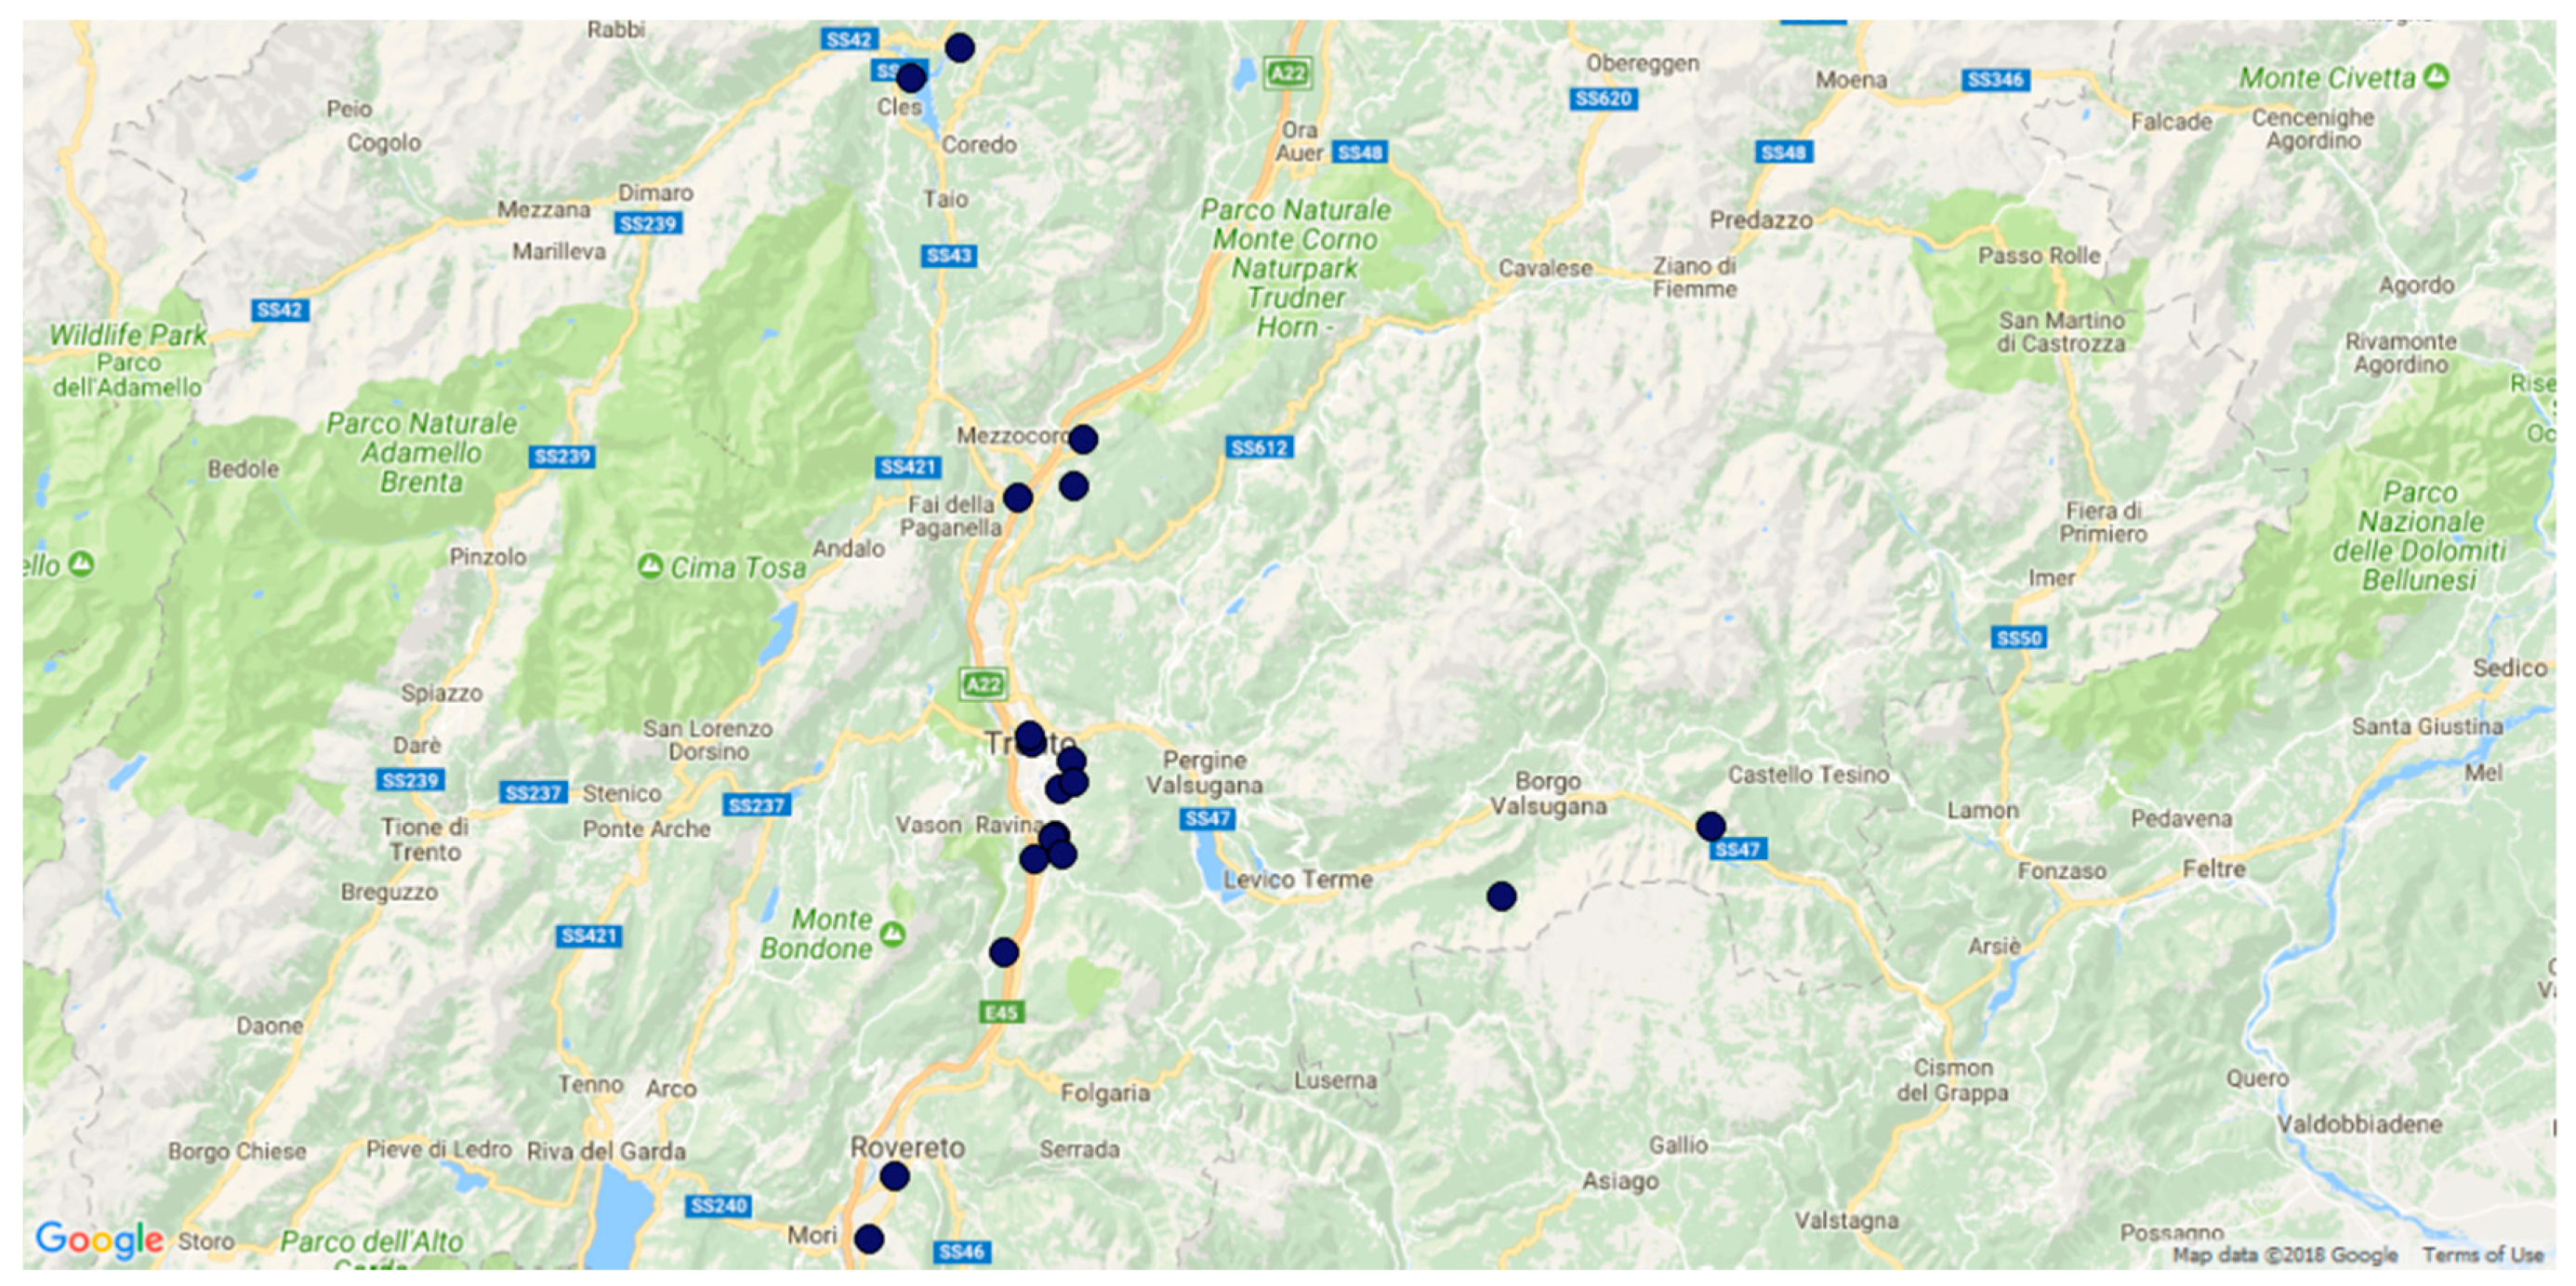
2.1.1. Study Area

The study area is located in Trentino, North Eastern Italy, covering 6214 km2 of land south of the Alps. It is a mountainous region influenced by a continental climate, with most of the territory lying 1000 m above sea level and around 55% covered by coniferous and deciduous forests. Trentino includes developed touristic, agricultural, industrial and commercial areas that are connected by main roads and railway transport infrastructures, with a population of 537,000 inhabitants concentrated in the plain areas and in the valley floors [31]. Despite its mountainous nature, agriculture remains one of the most important contributors to this region’s economy with over €800 million of agricultural produce sold in 2013 [32]. A significant proportion of this agricultural production is at risk from the establishment and spread of BMSB.

2.1.2. BugMap, a Mobile-Based Application for Crowdsourced BMSB Reports

BugMap is a free mobile application that was designed by Edmund Mach Foundation bio-informaticians, initiated in autumn 2016 and compatible with both iPhone (Apple Inc., Cupertino, CA, USA) and Android (Google LLC., San Francisco, CA, USA) operating systems. It is a user-friendly platform that allows citizens to report the presence of this pest whenever encountered. A guidance section was added to familiarize the users with the morphological features of the different life stages of the bug. Notes on its invasive history, potential hosts, overwintering behavior and induced symptoms on host plants caused by BMSB feeding are also included. BugMap allows the gathering of information regarding how (trap, beating or visual), when (date) and where (location) the insect was observed.
Reporting users start by (1) either indicating their location on the map in the application or by allowing their geographical coordinates to be automatically registered by BugMap. Next, a simple form must be filled out with respect to (2) the date of the sighting. Mandatory segments also include (3) the number of specimens, (4) the phenological stage (adult, nymph, both or unknown), (5) type of sighting (visual, trap or beating methods) and (6) location (inside or outside buildings, garden-hedges, green urban areas, means of transport, bushes, wild areas or agricultural settings). Most importantly, the form needs to be accompanied by (7) a photograph of the suspected insect.
Five experts swiftly assess the reports once submitted, as valid, invalid or unsure (in the case of unclear photographs). To reduce the evaluation bias, each validation is double-checked and amended in case of any doubt by the other experts. Additionally, a feedback section allows experts to send back a message through the application to the users, thanking them for their contribution, explaining the differences between the reported species and BMSB in the case of invalidity and in some instances requesting a clearer photograph when diagnosis cannot be made on the basis of the current one.

2.1.3. BugMap Campaign

An advertisement campaign was initiated for BugMap shortly after the final design of the platform. Talks were delivered at the University of Trento to Bachelor and Masters’ students of applied ecology. In the school of Edmund Mach Foundation, technical days were planned to involve students and technicians in the identification and reporting process of BMSB. An exposition in the Museum of Science of Trento (MUSE) was organized during the “notte dei ricercatori”, where the application was introduced to scientists from various fields and to the general public. Presentations and abstracts in conferences (IPM 3.0, First Italian Citizen Science conference) allowed the international community of citizen science and integrated pest management to familiarize themselves with BugMap and understand its significance from an ecological and a social perspective. The appearances of co-authors on Italian television channels helped the dissemination of BugMap to a larger audience outside of the study region.
Various social media platforms such as Instagram (#bugmap) and Facebook (https://www.facebook.com/Bugmap-1926843807640177/) were also employed in order to further the spread of the initiative, with pages created and managed to facilitate the learning of citizens about this ecological monitoring method and the menace posed by the invasive bug in question. Moreover, flyers (Figure S1) depicting the identification and reporting process of BMSB were designed and spread in all of the above-mentioned locations.

2.1.4. Pheromone Traps

When the insect was detected in Trentino alto-Adige in the spring of 2016, phytosanitary services of the Trento province, along with Edmund Mach Foundation placed pheromone traps (RESCUE!®, Sterling International, Inc., Spokane, WA, USA) in different areas of the province. The traps (n = 18) were positioned in various green urban areas, apple and pear orchards and large parking spaces, in an attempt to elucidate the insect’s hitchhiking behavior (Figure 1). They were used for capturing the stink bug starting from May–June 2016 until September–October 2017, with bi-weekly control. Traps are amended with BMSB aggregation pheromone components, along with a synergist that improves the attraction properties of the mixture, and functions in a 30 m radius. These traps have a non-toxic mode of action, capturing males, females and all stages of BMSB life cycle from nymphs to adults.

2.2. Modeling Current and Potential Distribution of BMSB in Trentino

2.2.1. Environmental Predictors

A distinct set of environmental parameters with potential effects on BMSB distribution was selected, as described by Capinha and Anastácio [33]. Digital Elevation Model, land-use, hydrography, road network and forest tracks were employed (Table 1) and are all freely available from the PAT cartographic portal of the Autonomous Province of Trento [34].

2.2.2. BMSB MaxEnt Distribution Modeling

For modeling the species’ distribution, the software MaxEnt was used (MaxEnt version 3.3.3; http://www.cs.princeton.edu/wschapire/maxent/), which is a machine learning algorithm that applies the principle of maximum entropy to predict the potential distribution of species from presence only (PO) data and environmental variables [26,35]. PO data collected from BugMap and pheromone traps were input into MaxEnt, as well as the set of environmental predictors across the Trentino landscape. The program attempts to estimate a probability distribution of species occurrence that is closest to uniform while still subject to environmental constraints [36]. All data were resampled at 100 m resolution to increase the speed of calculation in MaxEnt using the jackknife test for determining variables that reduce the model reliability when omitted. Previous models assessing the potential distribution of BMSB worldwide also utilized MaxEnt, using a resolution of 4.5 Km at the equator and strictly employing bioclimatic variables [37].

2.2.3. Accounting for BugMap Sampling Bias

According to Fourcade et al. [38], the best methods to increase overall model performance with a travel-time biased data set were (1) Systematic Sampling and (2) providing a bias file to MaxEnt as recommended by the manual [36]. The bias file was calculated in GRASS (Geographic Resources Analysis Support System) GIS version 7 [39], using the module for computing a Gaussian kernel from data points with a radius of 500 m and then rescaled to a range of 1 to 20 [40]. This raster file represents the sampling effort, and it is an input for MaxEnt utilized to weigh the random background data [36].
The subsampling grids of 500 m and 1000 m were generated by the QGIS (version 2.18.16) vector toolbox, and then a single point for each square was randomly sampled and used as input. Four different MaxEnt models were run with default parameters settings, using 30% of data for training as follows: (1) full dataset with no bias file, (2) full dataset with bias file, (3) systematic sampling over a grid of 500 m, (4) systematic sampling over a grid of 1000 m. Receiver operating characteristics analysis (ROC) was performed in R [41] to compare the Area Under the Curve (AUC) of all the models in order to identify the best bias treatment solution for our case study [42].

2.2.4. Setting the Threshold of BMSB Distribution Model

The output from the MaxEnt models is a map of logistic values ranging from 0 to 1; however, the interpretation of this continuous output is not straightforward, so it is a common practice to reclassify the map in a binary format according to a cut-off value. The use of the default 0.5 cut-off value is not recommended [36], especially when presence and background data are unbalanced as in our case [42]. The ROC plot-based approach was adopted, as suggested by [42,43]. The analysis of the ROC curve allows us to identify the point that maximizes the sensitivity against 1- specificity and that is considered the best classifier for the data [43].

3. Results and Discussion

3.1. Citizens’ Impact

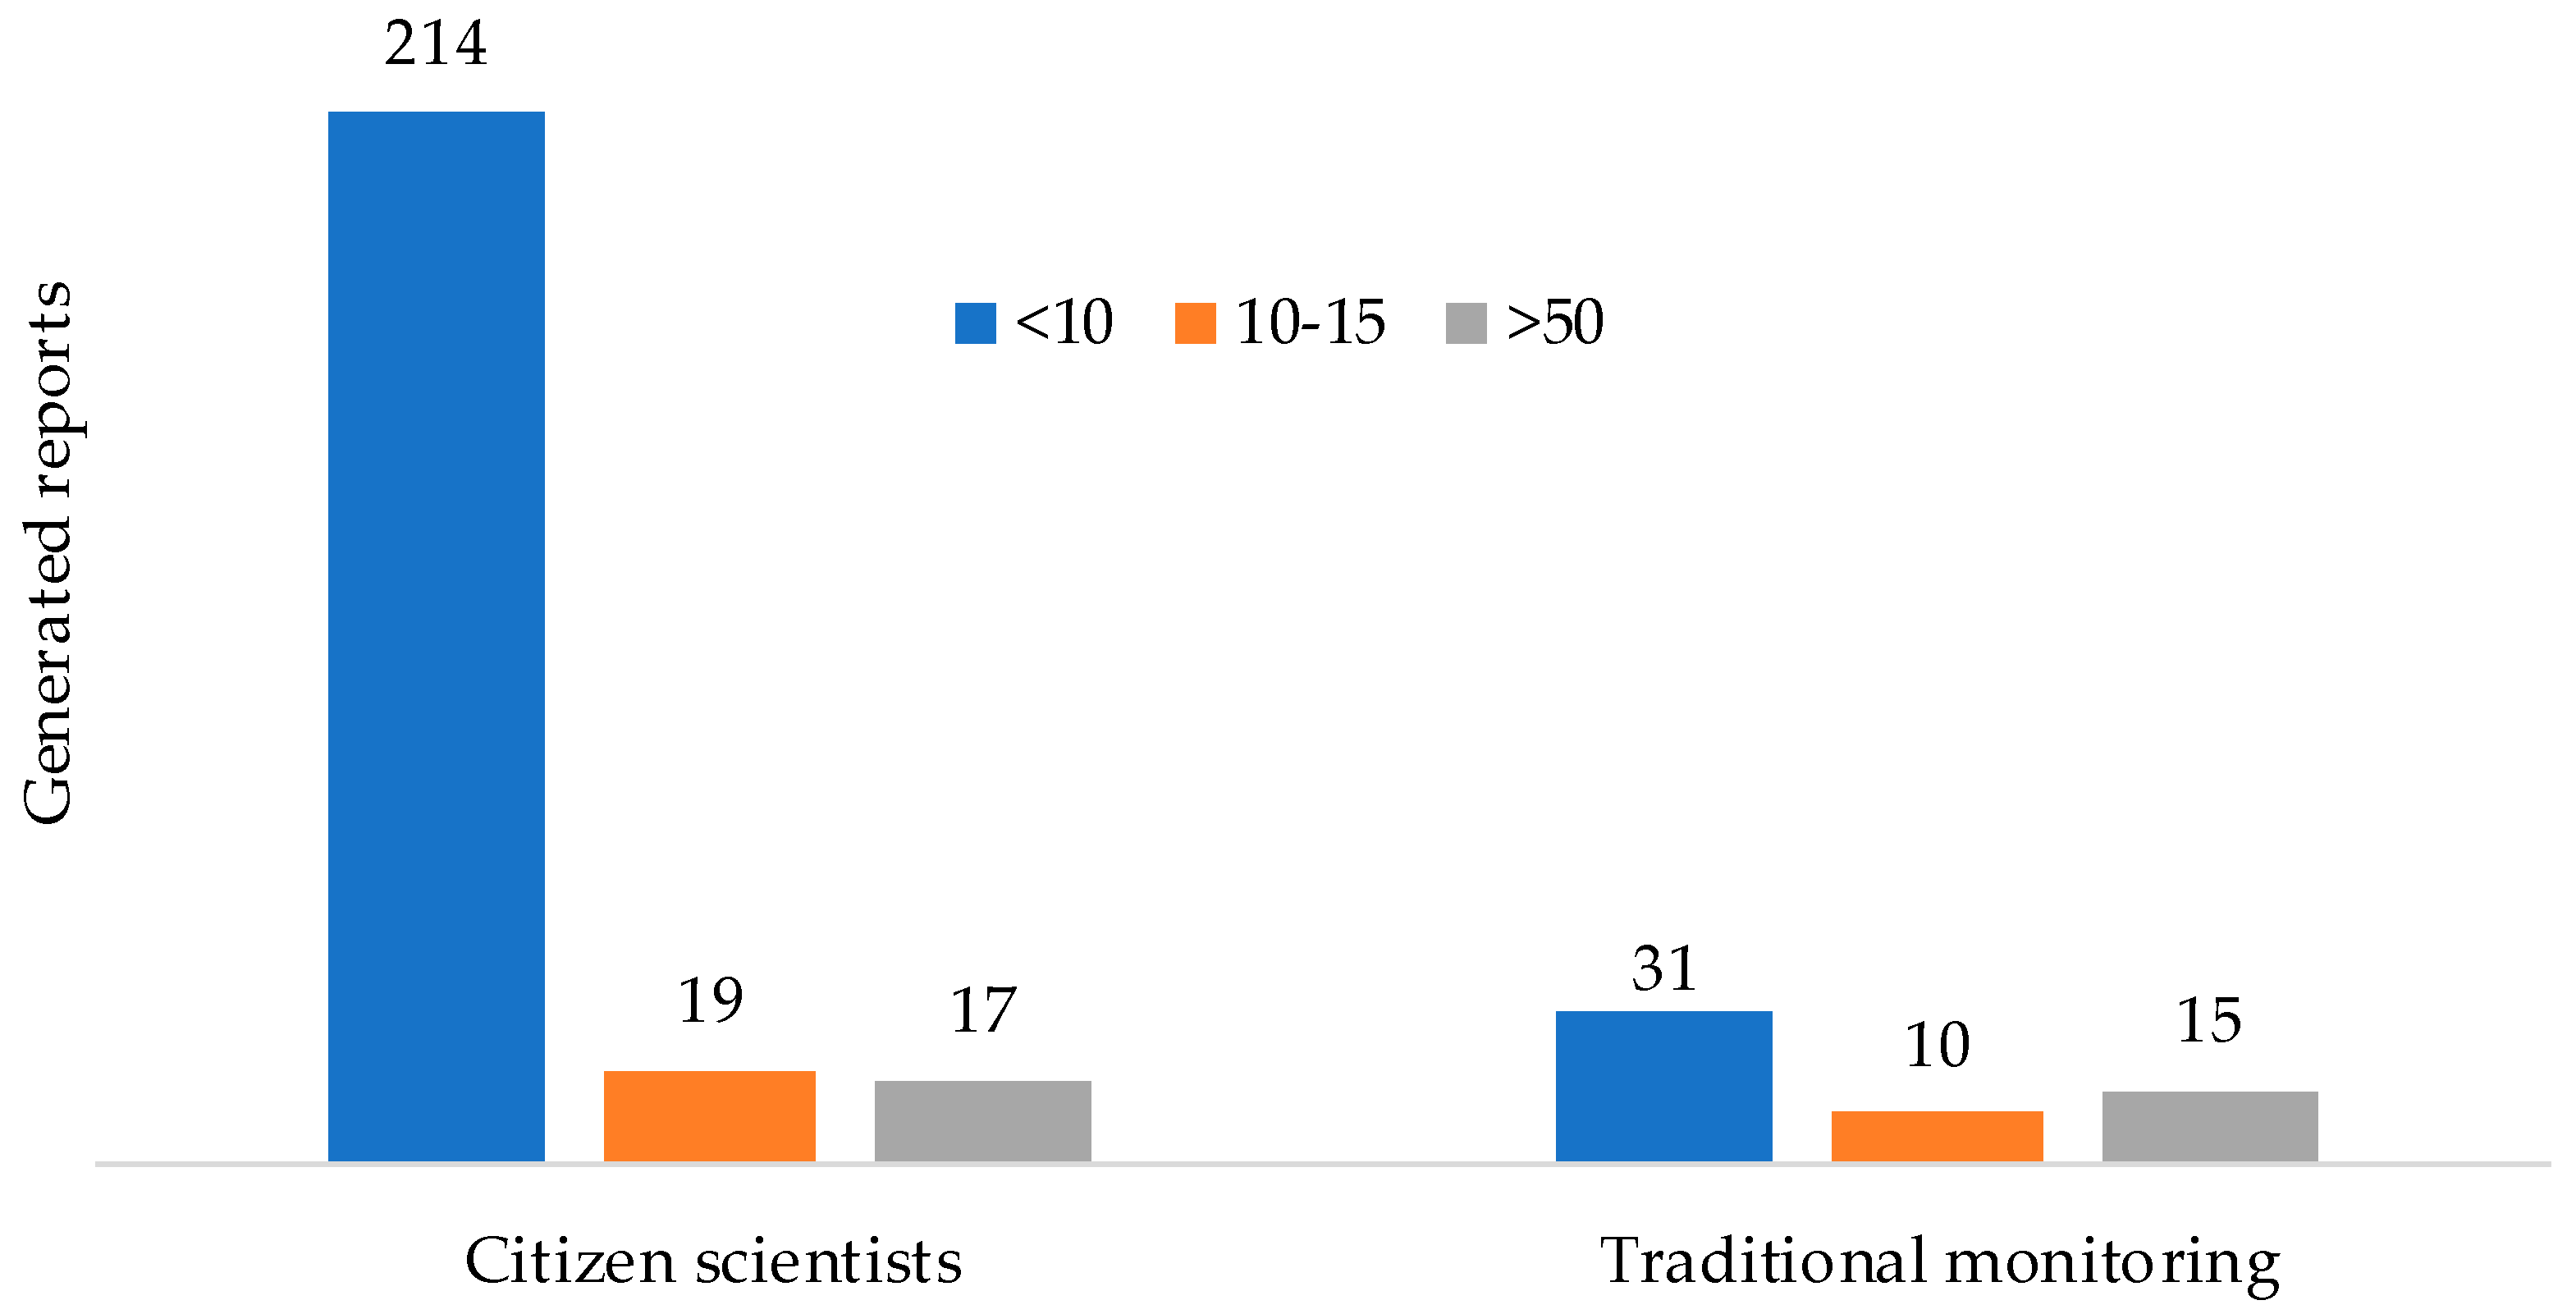
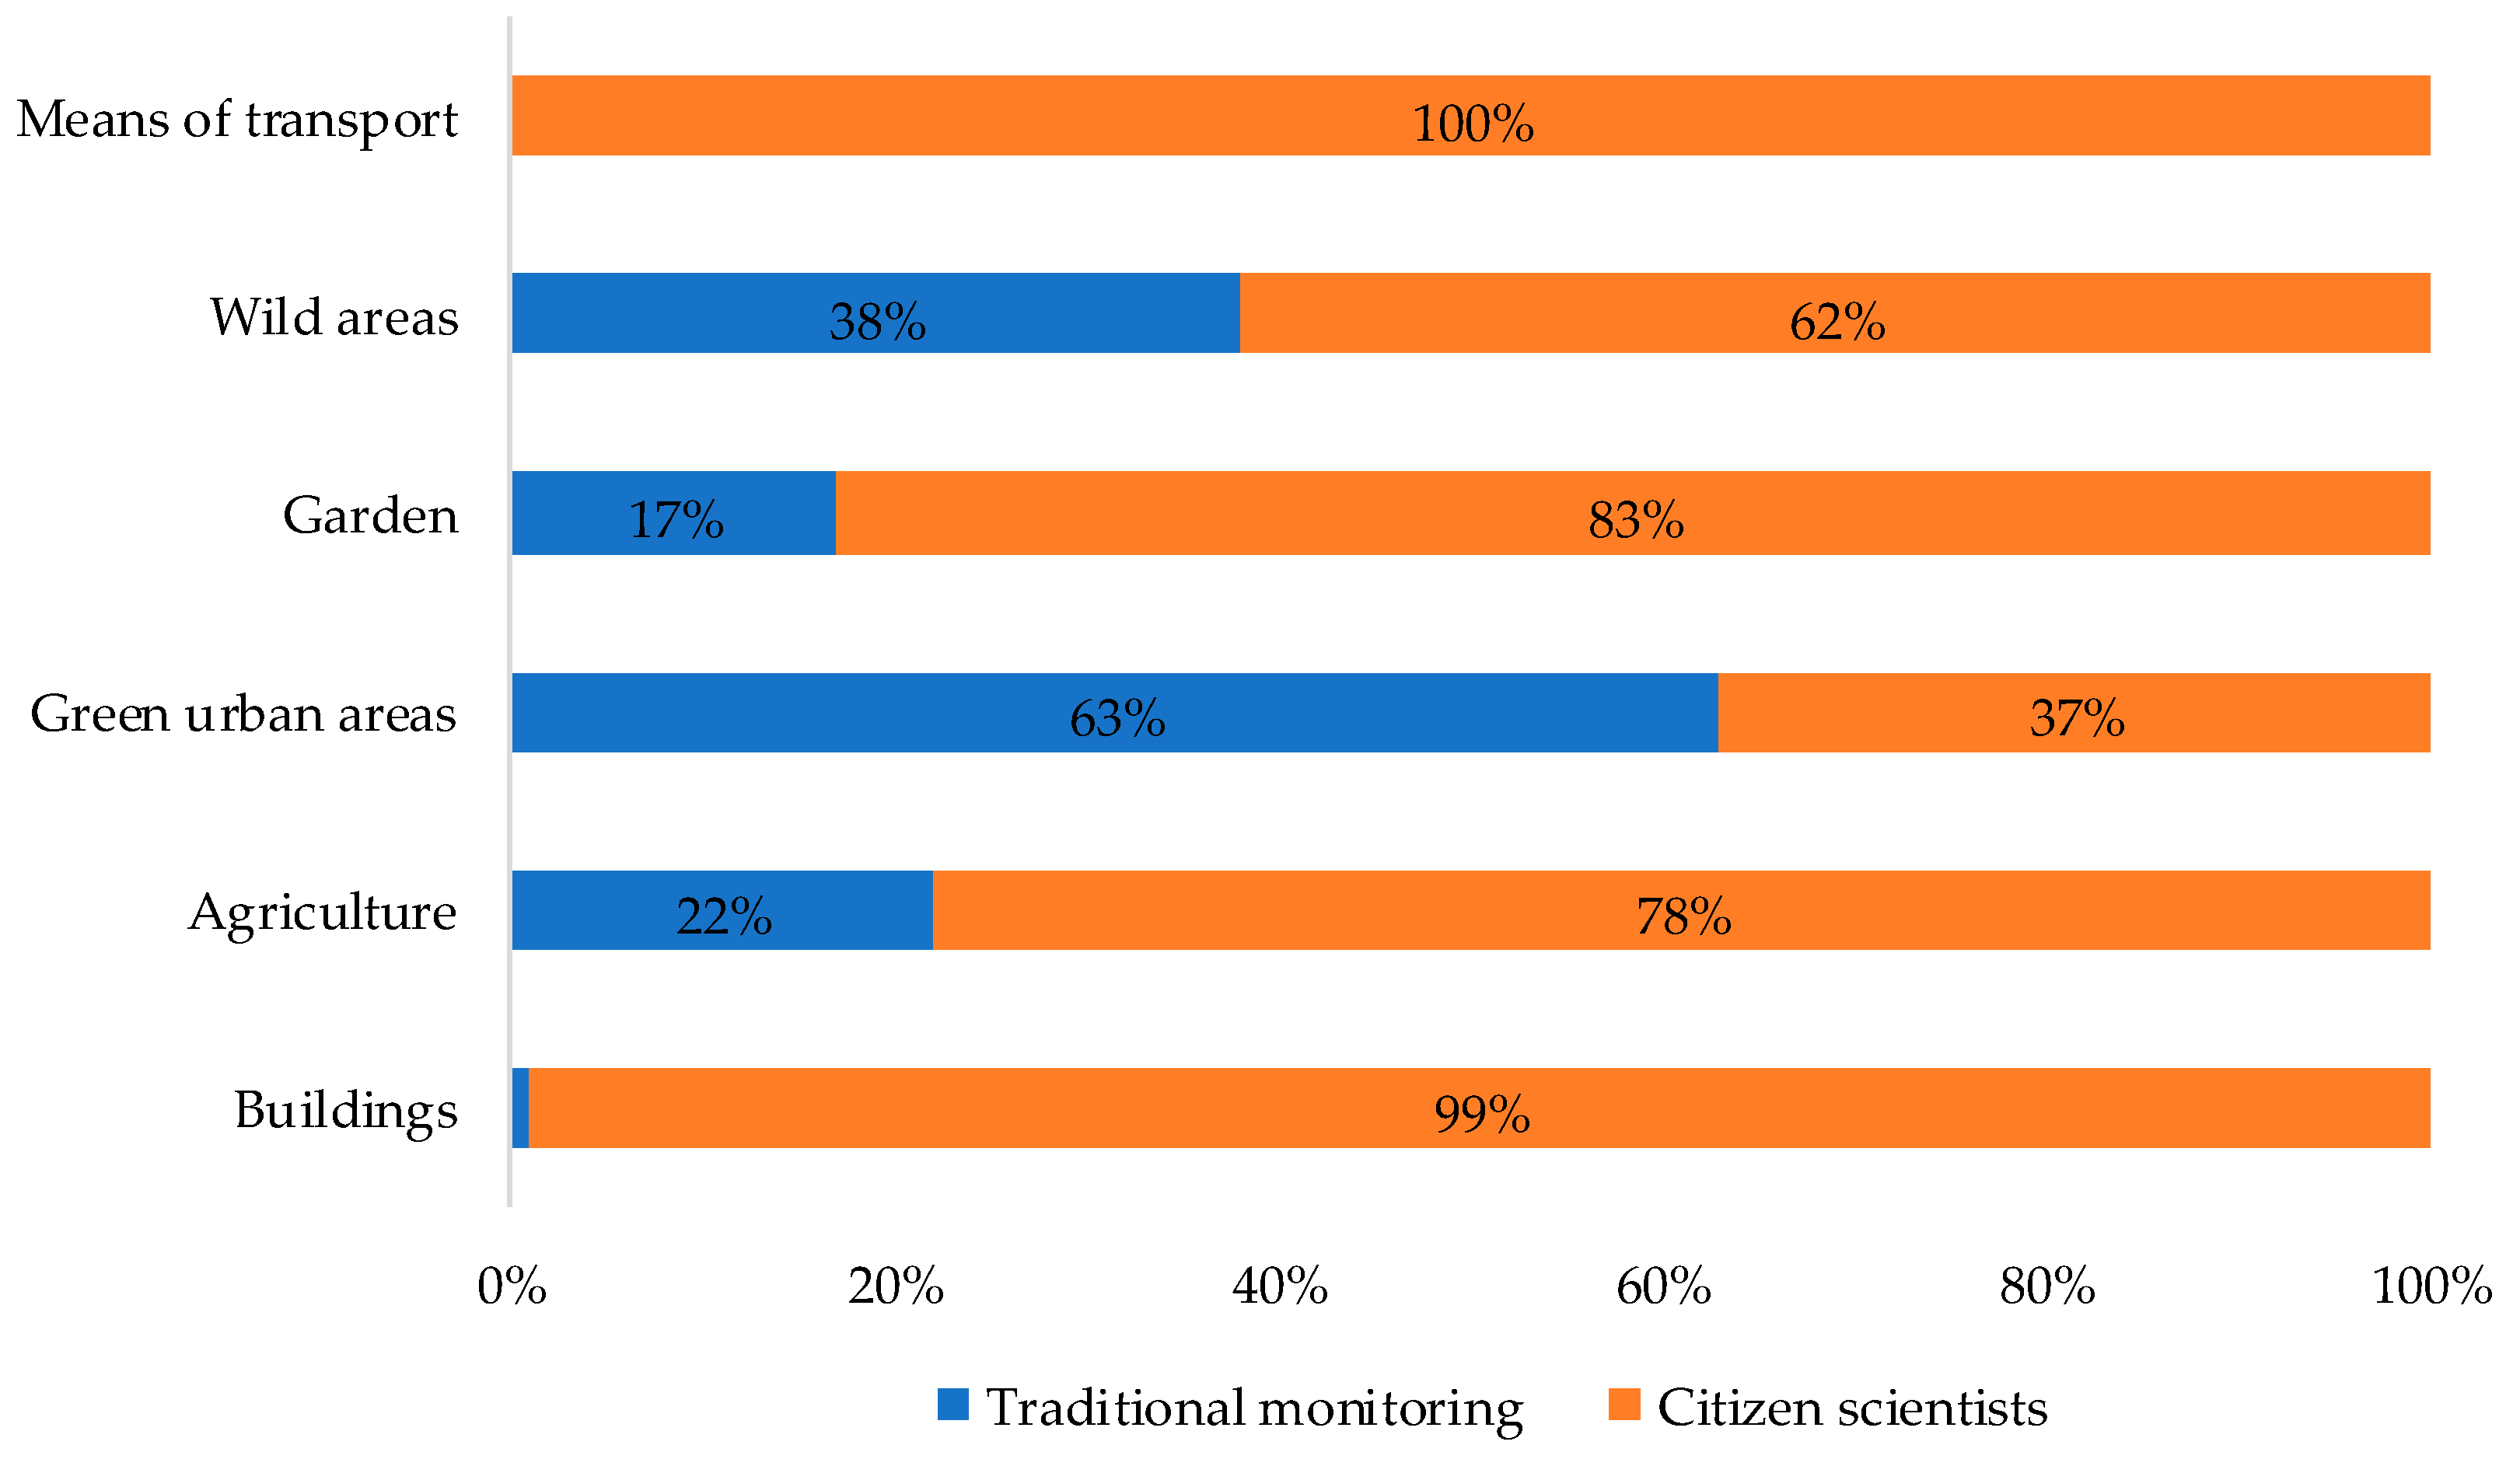
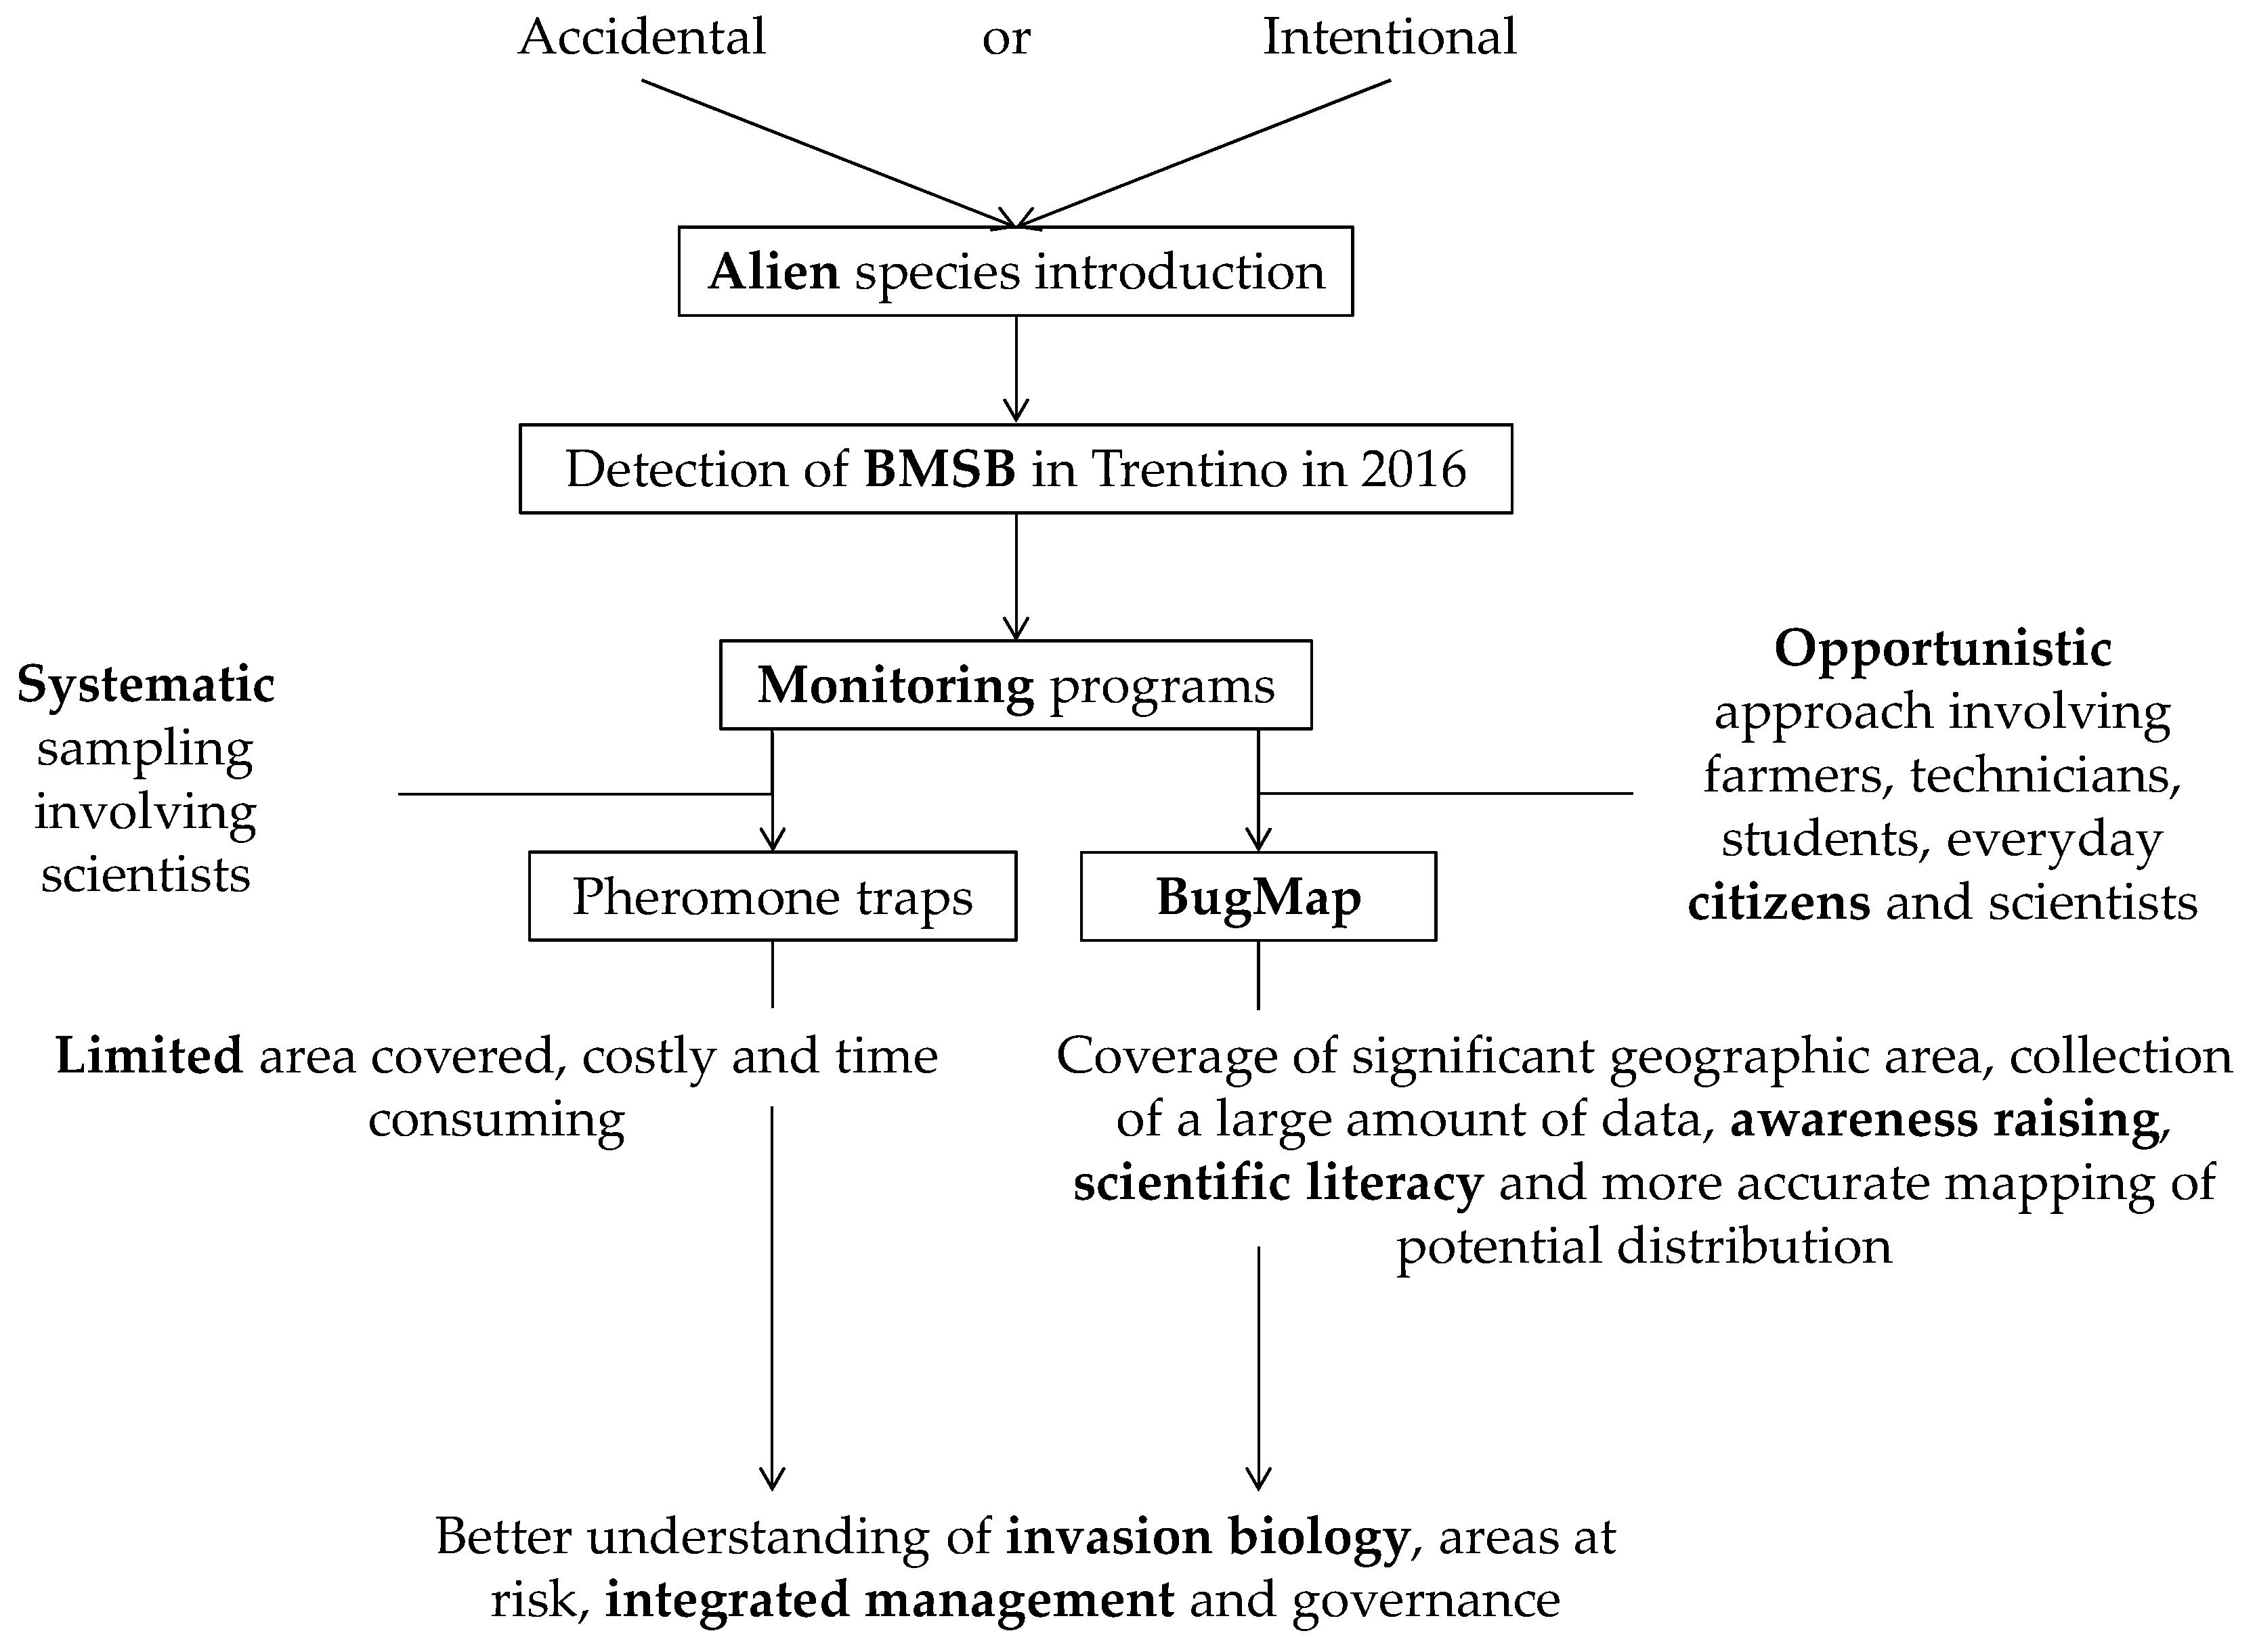
3.1.1. Citizen Science VS. Traditional Monitoring

A total of 306 valid BMSB registrations were split between those done visually by citizens and those obtained by traditional monitoring activities such as installment of pheromone traps and tree-beating methods. Volunteers contributed to the monitoring with 250 reports, compared to 56 by technicians (Figure 2). The majority of citizen-sightings (214) reported <10 BMSB, compared to 31 by technicians. Large aggregations of the insect (>50) were reported by both citizens and technicians.
Valid BMSB reports were also classified according to the location of the sighting and to the reporting entity: in our case, citizen scientists and technicians (traditional monitoring). All the reports from means of transport and almost all reports from buildings (99%) were performed by citizens (Figure 3). Similarly, citizen reports far exceeded those registered by technicians in gardens, agricultural and wild areas. On the other hand, traditional monitoring methods reported 63% of the total sightings from green urban areas.
These results highlight the differences between the two contributing parties, with citizens generating a larger number of reports from more diversified geographical areas. Reports from the general public allowed the identification of a heavily infested nucleus in a public park “Parco Gocciadoro”, outside the city of Trento. This knowledge puts forward the possibility to either treat this zone with selective insecticides, or increase trap density to maximize catches, thus reducing the risk of diffusion to nearby agricultural settings. The real-time tracking of the spread and distribution of insects is usually impeded by technical hitches (lack of time, traps and technicians). Acquainted citizens provided insight on the presence of the insect by performing a more intensive sampling of premises that are difficult to reach by a team of scientists. Thus, the complications aforementioned have been alleviated thanks to the involvement of citizens in the monitoring activity (Figures S2 and S3). These outcomes are in alignment with the proposition of Dickinson et al. [2], who stated that properly trained volunteers could help fill the role of professional scientists regarding the prediction of species distribution.
The highest number of registrations originated from buildings (157), which might be due to the possibility that citizens are far more likely to encounter the bug in their lodgings during the colder months of the year, and to the association between urban development and the initial phase of BMSB establishment and dispersal [44]. A total of 64 reports were registered in agricultural areas, followed by green urban areas (52), gardens (23), wild areas (8) and means of transport (2). Of the 52 registrations from green urban areas, 20 reported large aggregations of insects (>50), along with 11 sightings of 10–15 insects. This can be explained by the availability of an array of desired host plants in public parks that serve as feeding and breeding grounds for BMSB, i.e., Robinia pseudoacacia, Fraxinus sp., Acer sp., Cornus sp., and Corylus avellana, as well as by the proximity of these hosts to overwintering shelters [45].
A possible means for reducing BMSB populations is to have citizen volunteers deploy small, pyramid-style pheromone traps to maximize the insect catches in nearby urban settings [46]. These preventive control measures should be diapause-aware, meaning that they could be executed in spring and late-fall, to gradually reduce the pest population and minimize the damage caused to sensitive crops throughout the season [47]. BMSB is an adept hitchhiker, often detected in vehicles and freight shipment [48,49]. Although BugMap reports from means of transportation were low (1%), the first detection of BMSB in Trentino can be traced back to a family entering via an infested rental car from the neighboring, pest-ridden Veneto region [50]. This illustrates how the stowaway behavior of BMSB can generate a cascade of social, economic and ecological losses.

3.1.2. The Effect of Training on User Performance

BugMap users can register through Facebook (Fcb), the Edmund Mach Foundation (FEM) or remain anonymous. A total of 125 users were registered to the application, 73 of them were active and participated in reporting the insect, while the other 52 were inactive. In order to compare the effect of training on the accuracy of reporting the target insect, users were split between those registered through FEM and those through Fcb. FEM users produced 174 reports, 79% of which were accurate, compared to 71 reports by Fcb users, of which 64% correctly identified BMSB. The higher accuracy and performance of FEM users could be due to the hands-on training they received and to their familiarity in dealing with arthropods, which stems from working in a scientific and agricultural environment. Our results are in accordance with the study of Crall et al. [51], who noticed that in-person training improved the data collected on invasive species by volunteers. Facebook users performed fairly well, with a reporting accuracy of 64%, meaning that they are generally aware of the alien invasion and that BugMap-based educational tools are helpful, but may need further refining.
BMSB adults were often confused with native pentatomids i.e., Raphigaster nebulosa Poda, Dolycoris baccarum Linnaeus, both phytophagous species that may be competing with the invasive pest for the occupation of similar ecological niches. In addition, Troilus luridus Fabricius, Arma custos Fabricius and Pentatoma rufipes Linnaeus, also caused confusion; however, these species are predators of eggs and juvenile plant pests and may contribute to the biological control of BMSB. All the latter organisms look alike to the untrained eye; therefore, it comes as no surprise that both FEM and Fcb users generated false reports, corresponding to (21%) and (36%), respectively. This outcome is similar to what was observed by Maistrello et al. [45], through their citizen science initiative to track BMSB via the website of the University of Modena and Reggio Emilia.

3.2. BMSB Invasion

3.2.1. Invasion Dynamics in Trentino

The valid BugMap reports were classified seasonally (Figure 4), based on the locality of the sighting. A total of 306 valid reports were received during the two-year period since the initiation of BugMap until mid-February 2018. Few reports (n = 17) were registered in 2016, the first year of the application release and local invasion, compared to 289 registrations in 2017. This might be due to the rising familiarity of the public with both the insects’ invasion and BugMap, or an increasing population of the pest. BMSB possesses biological characteristics that are common among successful colonists across taxa, including an r-selected life history and association with human-modified ecosystems [52]. Its population growth can also be due to successful establishment and spread in Trentino by benefiting from host availability and being released from natural enemy pressure, leading to increased population density and fitness [53]. Similar observations in New Jersey, USA, concluded that BMSB underwent a population increase of 75% each year, during the period spanning from 2004 to 2011 [54]. An alternative mechanism in invasion ecology that could be linked to BMSB success is the Evolution of Increased Competitive Ability (EICA). This hypothesis states that a reduction in natural enemies could result in the selection for invasive populations that invest less in defense mechanisms and shift resources towards improving growth and fecundity, thereby achieving a competitive advantage over native species [55,56].
The first sightings in 2017 were registered in February-March, with individuals and small aggregations of adults being reported in buildings. Such registrations kept increasing (n = 20) until spring 2017. Afterwards, a decline in reports from anthropogenic structures coincided with an increase of sightings in agricultural areas (n = 25) in the summer of 2017, indicating a possible exit from overwintering sites and dispersal onto host plants for feeding and mating. During late-summer and early-fall, there was an upsurge of reports from buildings (n = 128) and green urban areas (n = 31). This trend can be explained by the possibility that woody ornamental plants in public parks and in the vicinity of man-made shelters provide early-and late-season resources for adults emerging from and returning to overwintering sites [57].
These findings are analogous with the knowledge on the dynamics of BMSB, being a landscape-level pest that moves across habitats throughout the season [58]. It aggregates, enters in diapause and spends the winter in dead or standing trees and prevalently in anthropogenic structures, a behavior which may result in reduced overwintering mortality [20]. Rising temperatures in spring are believed to be responsible for breaking diapause, whereby insects start moving out of man-made structures into adjacent fields in search for nutritive hosts [59]. During fall, declining temperatures and shorter days trigger the shelter-seeking behavior of the insects [60], which could explain the peak of reports from buildings and green urban areas.

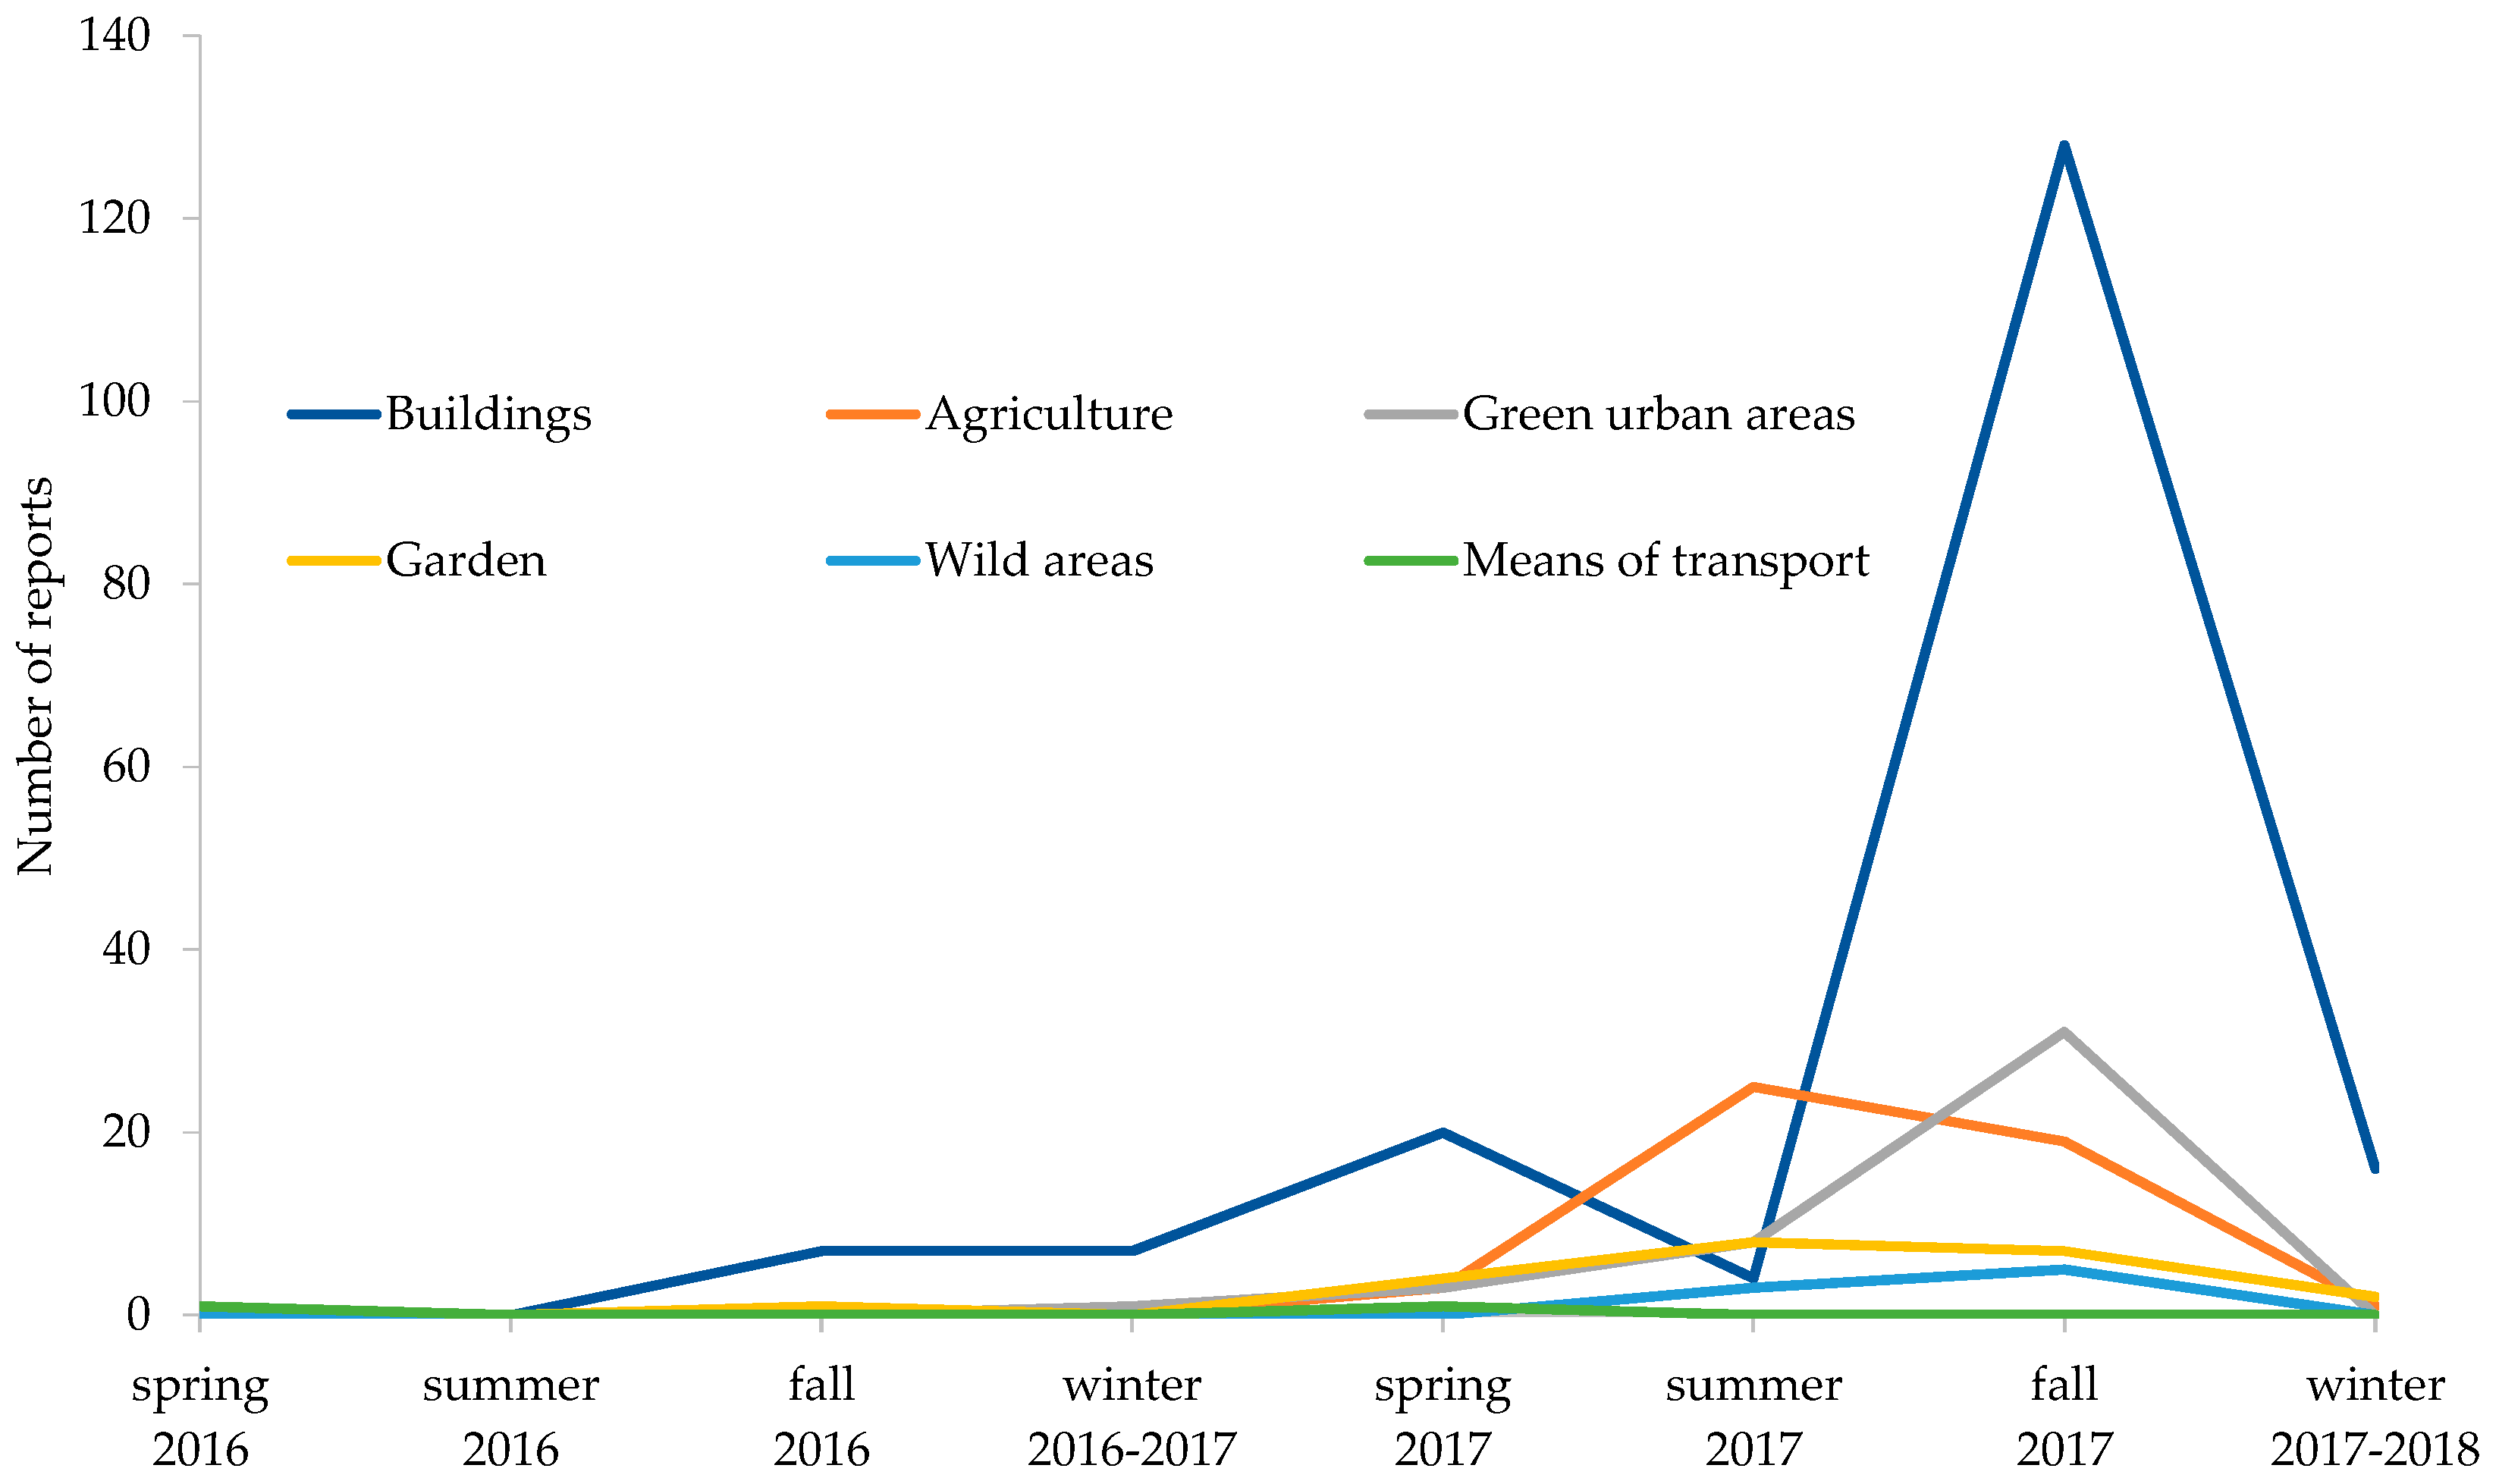
3.2.2. Seasonal Phenology of BMSB

BMSB adults were consistently reported year-long; however, their density dramatically increased during fall 2017, with 102 generated reports (Figure 5). The first appearance of nymphs happened in June 2017, with 13 reports during summer, increasing in fall to 38 and disappearing in winter. Reports of both life stages occurred in summer (16) and their incidence increased in fall (34). The number and density of adults from trap catches during fall (13 reports; 5 were >50 insects) were far greater than those generated in spring (3 reports of individual insects) and summer (5 reports; none were >50 insects). It has been previously noted that all BMSB life stages are attracted to the pheromone season-long [61]. Our observations of increasing numbers and catch density during fall can probably be explained either by a rising population, or that BMSB sensitivity might be higher during this season, given that their ability to aggregate in suitable shelters during that period directly affects their winter survival.
Our results are in accordance with other observations on the phenology of BMSB, in the climatically similar mid-Atlantic region in the United States, where spring-adults also emerge from overwintering sites in late-spring [62]. Females are believed to be reproductively immature in early-spring, resulting in a delay in reproduction [18], hence the first appearance of nymphs in Trentino followed in summer. The decrease of adult observations during summer is probably due to their dispersion onto host plants within the forest edge for early-season feeding and perhaps oviposition [13]. Sightings of fall-adults peaked in the period of September to November; this can be related to a seasonal population increase [44], with spring-and summer-adults mating and laying eggs that in turn develop into mature stages. The occurrence and overlapping of adults and nymphal stages during summer and fall hint at a bi-voltine life cycle in Trentino, which is consistent with biological studies in other Italian regions that characterized two BMSB generations per year [45]. Based on this data, BugMap can accurately estimate the emergence of the 1st and 2nd generation adults. The rapid decline of nymphal populations in late fall is probably due to fifth instars molting to the adult stage or mortality due to frost [18].

3.2.3. Menace in Agricultural Areas

In 2016, there were no reports of the bug from cultivated zones; BMSB was first sighted in agricultural areas in the spring of 2017, representing the first Trentino case of an open field crop infestation. A total of 64 reports were registered from cultivated areas. Apple orchards constitute the zones with the highest number of BMSB sightings (Figure 6). Other crops include cherry, peaches and small fruits (17%), vegetable crops (5%) and vineyards (4%). All life stages of the stink bug (adults and nymphs) were found in orchards, vegetable crops and vineyards.
Most reports (79%) from agricultural areas were registered during late-summer and early-fall (September and October). This can be related to the fact that this period, with temperatures ranging between 17 and 19 °C, represents the most preferable feeding time of the year for BMSB [63]. Studies on the severity and damage inflicted on key crops found that late-season apple is more susceptible to economic injury caused by BMSB feeding [64,65]. The overlap between these two notions is particularly alarming, given the ubiquity of late-season apple orchards throughout the Trentino territory, raising the need to control this pest before harvest time to minimize losses. A possible means of control would be the exploitation of the behavioral ecology of this insect, through the adoption of a border-based attract-and-kill technique [61]. The latter enhances the strong ‘edge-effect’ exhibited by BMSB (the tendency to inhabit trees at the orchard perimeter), by baiting select border row trees with pheromone traps, and subsequently treating them with effective insecticides. This method was found efficient in arresting BMSB in a 2.5 m radius around baited trees, and damage to fruit was significantly reduced in the remainder of the apple orchard.

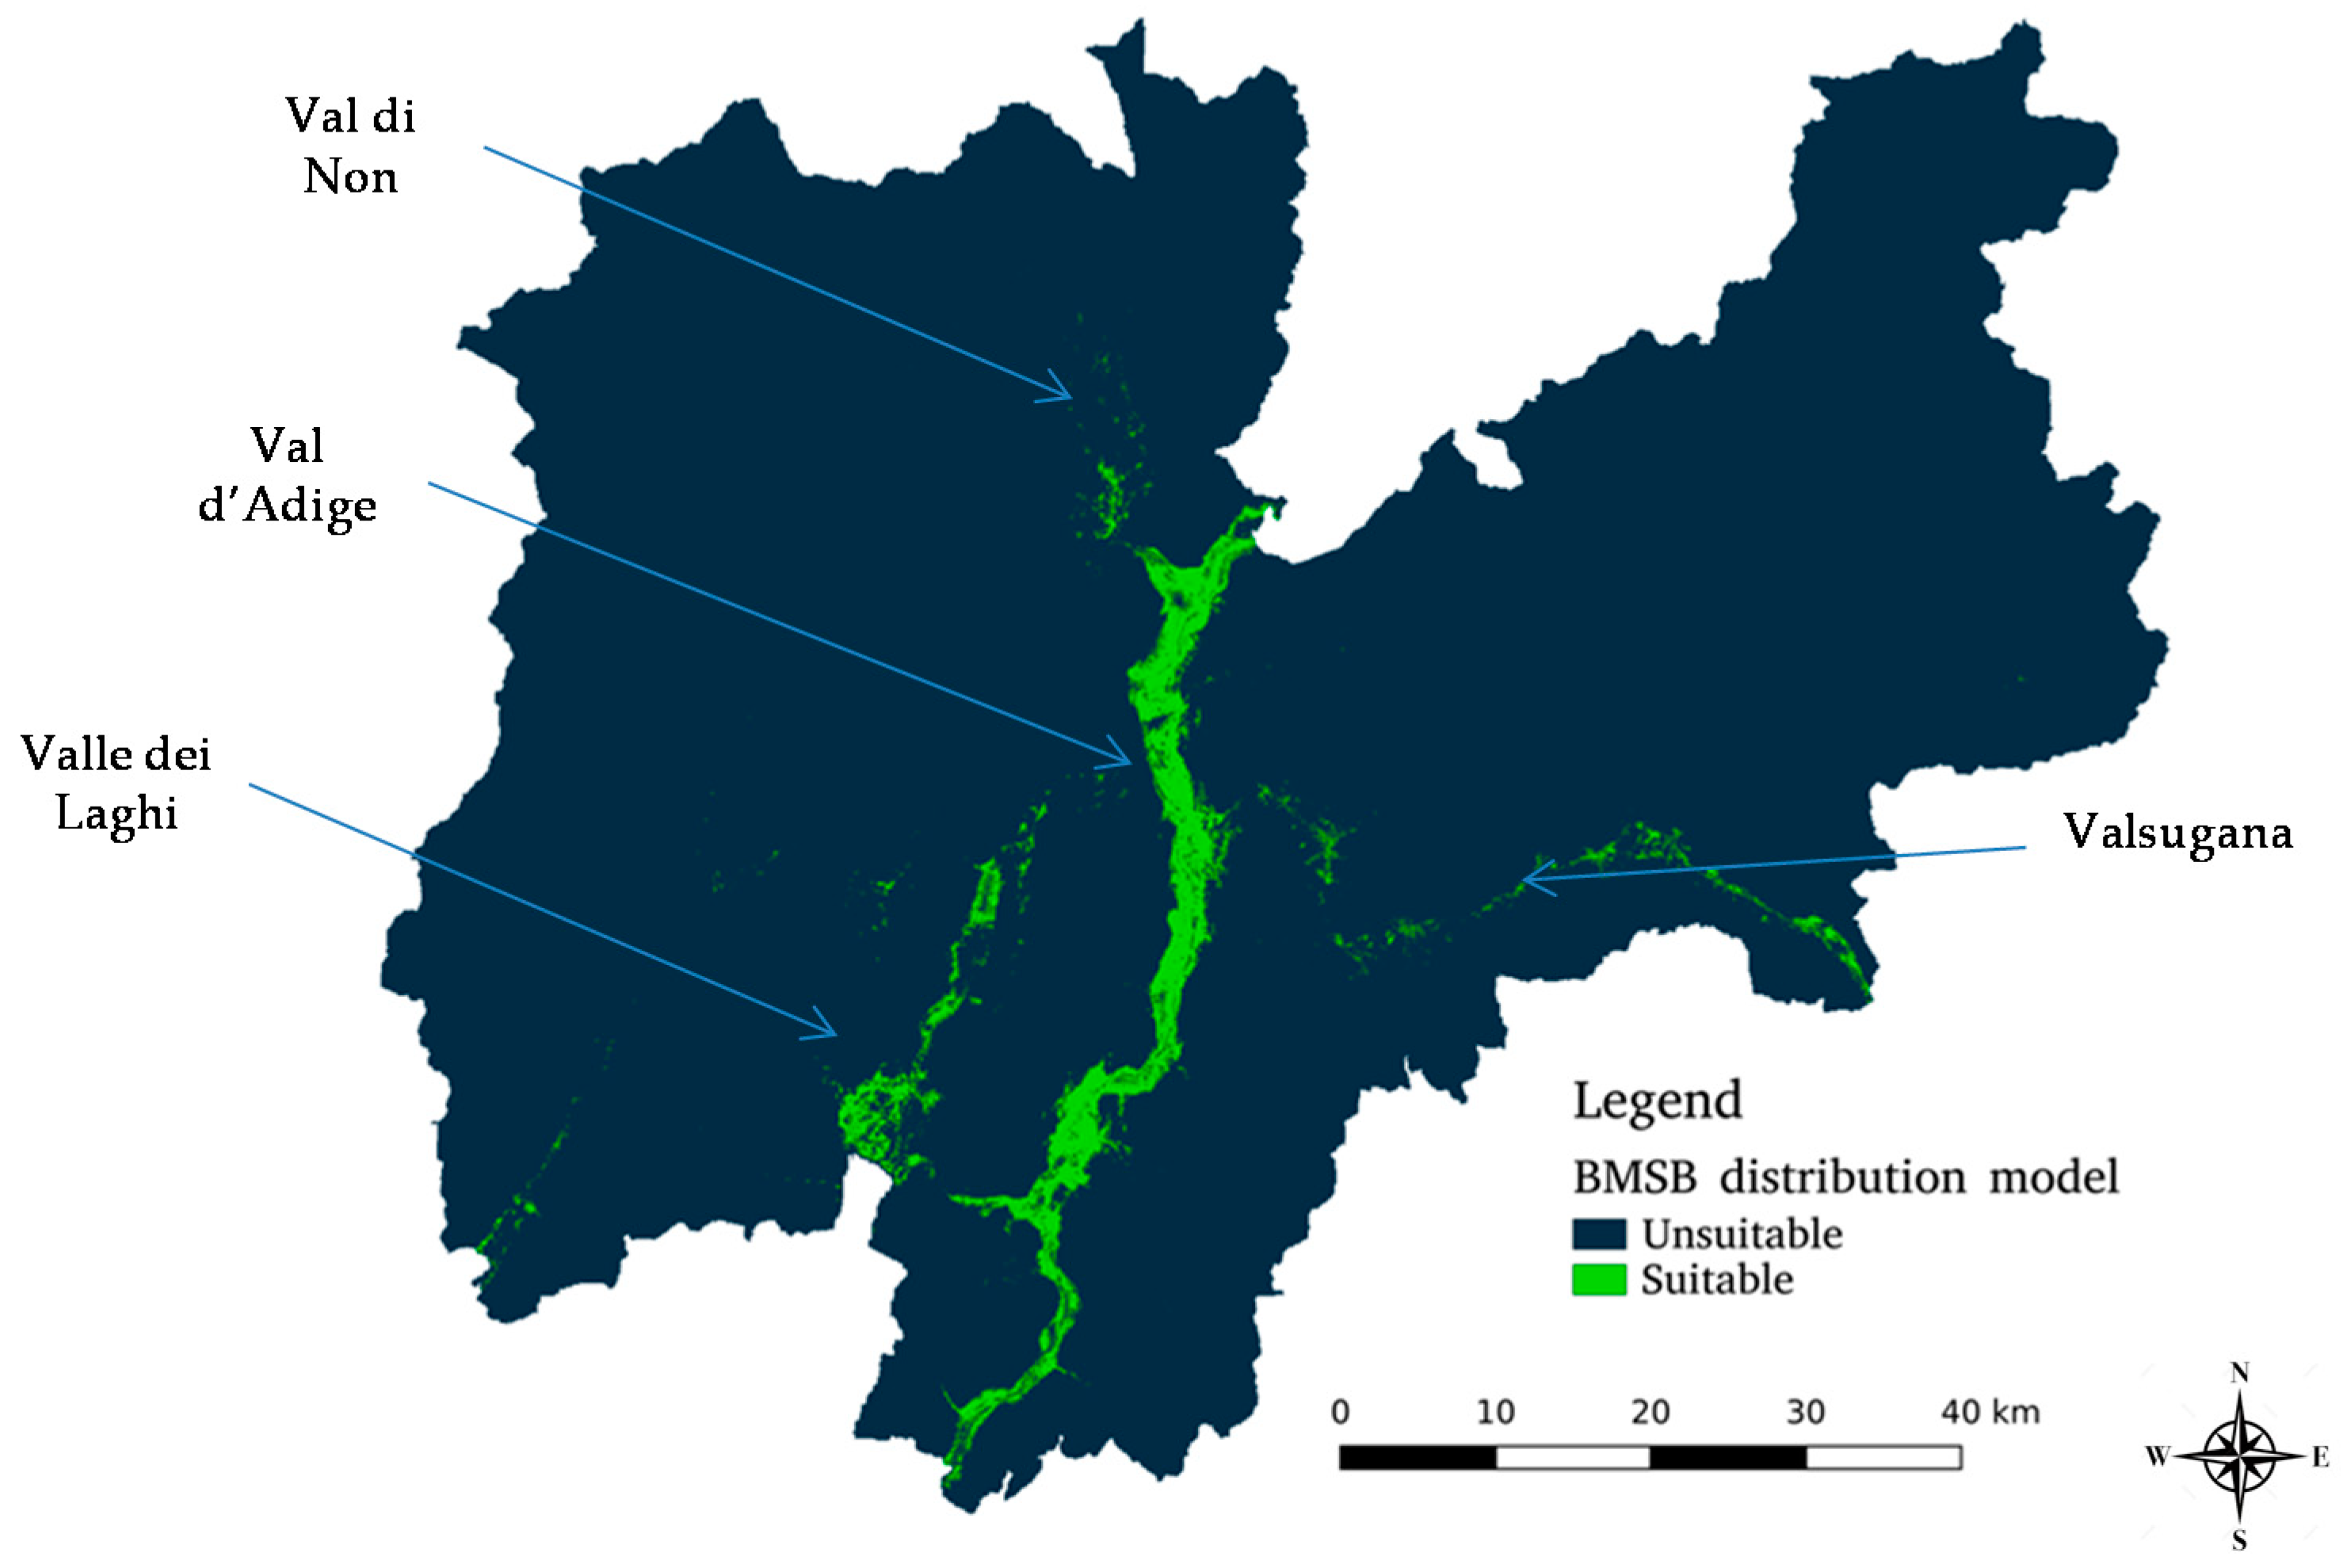
3.3. BMSB Projected Distribution in Trentino

3.3.1. MaxEnt-Generated Suitability Map

The occurrence data collected on BugMap platform exhibit a well-known geographical bias pattern termed travel-time bias (Table S2) [38,66]. Reports are especially concentrated in the urban area of Trento and in the neighboring villages, while records from open field are rare. After trials with different bias treatment methods, the best performing MaxEnt model corresponded to systematic sampling over a grid of 500 m, utilizing 144 valid reports that were used to train (70%) and to test (30%) the model. The aforementioned model had the highest AUC value for training data with 0.982, AUC test data: 0.970 (full dataset AUC training: 0.980, AUC test: 0.974; full dataset with bias file AUC training: 0.976, AUC test: 0.970; systematic sampling 1000 m AUC training: 0.982, AUC test: 0.963). The Jackknife test for assessing variable contribution revealed that the parameters that most affected the dispersal of the bug are the digital terrain model, urban land use and distance from houses and from streets (Figure S4). Therefore, the high suitability of the Adige valley across Trentino can probably be explained by its appropriate elevation, as well as by the prevalent agricultural-urban interfaces in Trento (Figure 7). For a polyphagous species that browses across landscapes tracking crop phenology, these diverse rural boundaries may facilitate BMSB population growth by offering diverse host plants that meet its nutritional requirements, in addition to natural and human-made overwintering structures [18,44,64,67]. Studies on BMSB haplotype diversity in North America and Europe revealed that Italy housed the second most diverse population of the bug, with 2–8 haplotypes represented in Emilia-Romagna, Piemonte and Veneto regions. This suggests that there is an ongoing invasion in Italy, with frequent re-introductions of the bug from several localities [68]. Through the Adige valley passes one of the main traffic corridors (Brennero) linking Italy to the rest of Europe, thus BMSB populations in this valley are thought to be periodically augmented by stratified diffusion via human transportation (i.e., movement of plants, goods and contaminated cargo) from the heavily infested Central Italian regions.
To the West of the Adige, lies another suitable area which is Valle dei Laghi, nearby Garda Lake. This is a predominantly touristic zone characterized by a unique Mediterranean climate; aspects that constitute major driving forces for the passive flow and establishment of BMSB.
North of the map, a scattered suitability is projected for Val di Non, one of the most important apple growing regions of Trentino. Given that BMSB is a chill-intolerant species and mortality due to cold stress commences at temperatures as high as 4 °C [69], the ascending altitudinal gradient in Val di Non might be hampering the capacity of BMSB to spend the winter and overcome cumulative cold temperatures in this region. This might explain the unsuitability for BMSB establishment in this critical zone for the time being. On another note, the registration of several valid BugMap reports from this area may be due to a possible source to sink population dynamic, with Val di Non populations being replaced each spring by migrants from the southern, highly suitable Adige valley. Such a behavior has been previously observed in Alberta for the diamondback moth Plutella xylostella Linnaeus [70]. Therefore, we propose intensification of the monitoring activities in this region and appeal for citizens and farmers to stay on guard for early-season inoculations, as spring-adults are easier to manage than late-season populations [71]. The impacts of climate change on the distribution of BMSB have been assessed and a northward expansion of its suitable range is projected for Europe, as well as an increase of the number of annual generations [72]. These predictions indicate that in the absence of adequate control measures and lack of co-evolved natural enemies, BMSB will increasingly jeopardize agricultural areas around the world.
The suitable Eastern strip in Trentino corresponds to Valsugana. This area might be appropriate for BMSB establishment due to its richness in small fruit production and various horticultural crops. In addition, its confinement to the East by the BMSB infested Friuli and Veneto regions poses a ceaseless re-introduction risk of new individuals.
The global model produced by Zhu et al. [37] is helpful in understanding the suitable areas for BMSB establishment. They indicated that the whole Italian peninsula is suitable for setting up breeding populations, whereas our regional fine-scale model accounts for the extreme altitudinal variation and land morphology in Trentino, while offering monitoring and management support for affected areas.

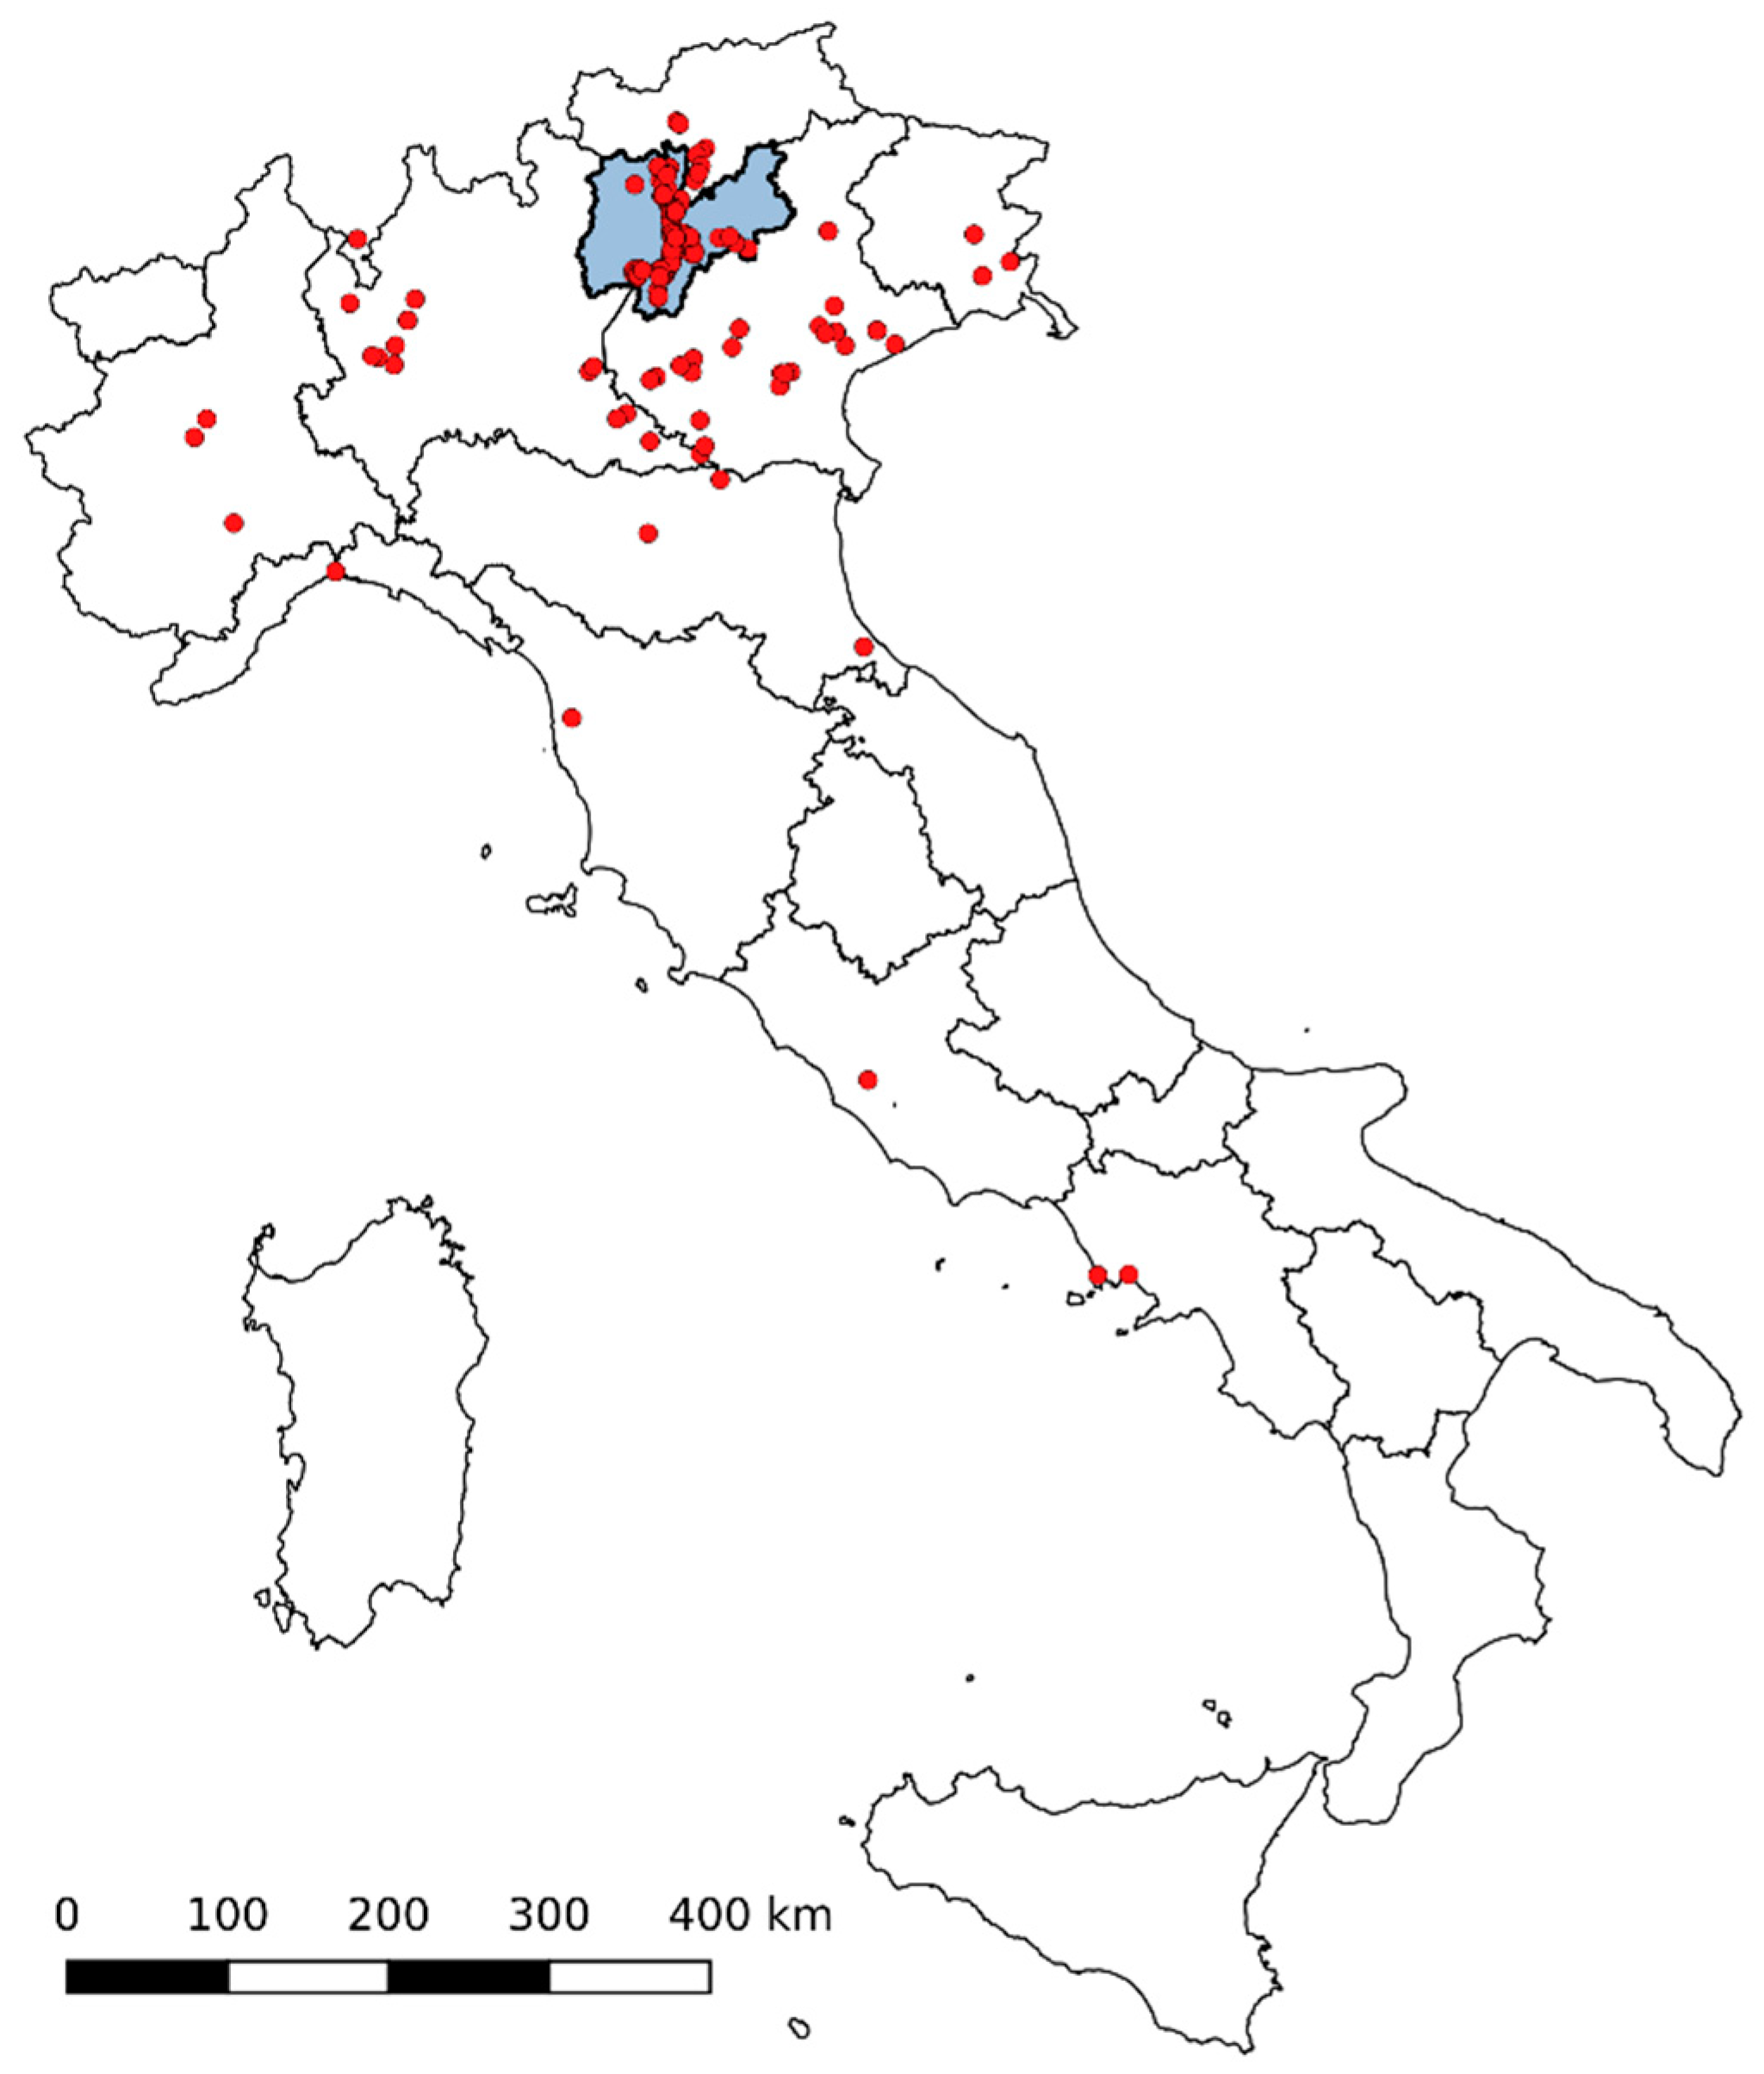
3.3.2. Nationwide Involvement

A total of 431 reports were obtained from the whole of Italy, of which 306 were validated as accurate sightings of BMSB. Traditional monitoring methods were only employed in Trentino, and the contribution of citizens was also mostly focused in this same freshly invaded North Italian region. Therefore, 244 reports originated from Trentino, while the remaining 62 sightings were registered via BugMap in the other Italian regions (Figure 8) namely: Veneto, Lombardia, Friuli, Piemonte, Liguria, Emilia Romagna, Toscana, Lazio and Basilicata.
The serendipitous reports from different parts of Italy indicate that although the application was not advertised there, protagonists from the general public exhibited awareness, excitement and motivation for addressing national ecological issues. This behavior suggests a rising environmental democracy, the notion of making science more accessible to the public and scientists more aware of local knowledge and public enthusiasm [73]. Moreover, the registration of BMSB in regions where it has not been previously detected represents an early warning that can be communicated to phytosanitary services and collaborators. The latter entities are then advised to establish monitoring strategies and start the employment of preventive methods to limit the spread and potential damage that can be inflicted by this pest.

4. Conclusions

This study demonstrated that the coupling of volunteer-collected data with traditional ecological surveys is indeed instrumental for the improvement of existing and future monitoring programs and is worthy of the term ‘monitoring 2.0’ (Figure 9). Harnessing the capabilities of citizens helped uncover the invasion pattern and potential dissemination of the brown marmorated stink bug in Trentino. Although young and in its early stages, BugMap has proven efficient in stimulating scientific literacy and aided in raising public awareness regarding local ecological and economic endeavors; a cornerstone towards a more active scientific citizenship. Future activities will aim at (1) elucidating the nutritional requirements of BMSB by projecting BugMap reports onto GIS layers of plant species in the urban area of Trento; (2) refining the MaxEnt models by including abiotic parameters such as temperature and humidity; (3) expanding the BugMap domain to farther geographical boundaries and other invasive species; (4) utilizing BugMap data to assess the accuracy of the different invasive species modeling approaches currently employed and (5) developing an image recognition algorithm for identifying and validating the increasing flux of BugMap reports.

Supplementary Materials

The following are available online at https://www.mdpi.com/2220-9964/7/5/171/s1, Figure S1: BugMap flyer, Figure S2: BugMap real time tracking, Figure S3: Citizen monitoring and traditional monitoring, Figure S4: Jackknife test for variable contribution, Table S1: land use classes, Table S2: Travel-time bias.

Author Contributions

R.M., C.T., V.M., G.A. and M.C. conceived and designed the experiments; R.M. and C.T. performed the experiments, analyzed the data and generated the MaxEnt models; S.C. and D.A. designed the mobile application. R.M., C.T. and A.I. wrote the manuscript; A.E. managed the science communication campaign.

Acknowledgments

The authors wish to extend their gratitude to all the citizens who participated in this inquiry; their collaboration was essential for shaping and completing this project. We also thank all the technicians who took part in the monitoring activities and the BugMap validating experts. This work has been partly funded by E-STaR, Bando “I comunicatori STAR della scienza”-legge provinciale 2 agosto 2005, n. 14, art 22, the Autonomous Province of Trento and by APOT, Associazione Produttori Orto-Frutticoli Provincia di Trento.

Conflicts of Interest

The authors declare no conflict of interest. The funding sponsors had no role in the design of the study; in the collection, analyses, or interpretation of data; in the writing of the manuscript, and in the decision to publish the results.

References

  1. Oxford English Dictionary. “Art, n.1.” OED Online. Oxford University Press: Oxford, UK, January 2018. Available online: www.oed.com/viewdictionaryentry/Entry/11125 (accessed on 21 January 2018).
  2. Dickinson, J.L.; Zuckerberg, B.; Bonter, D.N. Citizen Science as an ecological research tool: Challenges and benefits. Annu. Rev. Ecol. Evol. Syst. 2010, 41, 149–172. [Google Scholar] [CrossRef]
  3. Danielsen, F.; Burgess, N.D.; Balmford, A. Monitoring matters: Examining the potential of locally-based approaches. Biodivers. Conserv. 2005, 14, 2507–2542. [Google Scholar] [CrossRef]
  4. Measham, T.G. Building Capacity for Environmental Management: Local knowledge and rehabilitation on the Gippsland Red Gum Plains. Aust. Geogr. 2007, 38, 145–159. [Google Scholar] [CrossRef]
  5. Brossard, D.; Lewenstein, B.; Bonney, R. Scientific knowledge and attitude change: The impact of a citizen science project. Int. J. Sci. Educ. 2005, 27, 1099–1121. [Google Scholar] [CrossRef]
  6. Lepczyk, C.A. Integrating published data and citizen science to describe bird diversity across a landscape. J. Appl. Ecol. 2005, 42, 672–677. [Google Scholar] [CrossRef]
  7. Greenwood, J.J.D. Citizens, science and bird conservation. J. Ornithol. 2007, 148, 77–124. [Google Scholar] [CrossRef]
  8. Cooley, J. The distribution of periodical cicada (Magicicada) Brood I in 2012 with previously unreported disjunct populations (Hemiptera: Cicadadae, Magicicada). Bull. Entomol. Soc. Am. 2015, 61, 51–56. [Google Scholar] [CrossRef]
  9. Palmer, J.R.B.; Oltra, A.; Collantes, F.; Delgado, J.A.; Lucientes, J.; Delacour, S.; Bengoa, M.; Eritja, R.; Bartumeus, F. Citizen science provides a reliable and scalable tool to track disease-carrying mosquitoes. Nat. Commun. 2017, 8. [Google Scholar] [CrossRef] [PubMed]
  10. Hulme, P.E.; Bacher, S.; Kenis, M.; Klotz, S.; Kuhn, I.; Minchin, D.; Nentwig, W.; Olenin, S.; Panov, V.; Pergl, J.; et al. Grasping at the routes of biological invasions: A framework for integrating pathways into policy. J. Appl. Ecol. 2008, 45, 403–414. [Google Scholar] [CrossRef]
  11. Cini, A.; Anfora, G.; Escudero-Colomar, L.A.; Grassi, A.; Santosuosso, U.; Seljak, G.; Papini, A. Tracking the invasion of the alien fruit pest Drosophila suzukii in Europe. J. Pest Sci. 2014, 87, 559–566. [Google Scholar] [CrossRef]
  12. Geslin, B.; Gauzens, B.; Baude, M.; Dajoz, I.; Fontaine, C.; Henry, M.; Ropars, L.; Rollin, O.; Thébault, E.; Vereecken, N.J. Massively introduced managed species and their consequences for plant-pollinator interactions. In Networks of Invasion: Empirical Evidence and Case Studies, 1st ed.; Bohan, D.A., Dumbrell, A.J., Massol, F., Eds.; Academic Press: Cambridge, MA, USA, 2017; Volume 57, pp. 147–199. [Google Scholar]
  13. Leskey, T.C.; Nielsen, A.L. Impact of the invasive brown marmorated stink bug in North America and Europe: History, biology, ecology, and management. Annu. Rev. Entomol. 2018, 63, 599–618. [Google Scholar] [CrossRef] [PubMed]
  14. Fogain, R.; Graff, S. First records of the invasive pest, Halyomorpha halys (Hemiptera: Pentatomidae), in Ontario and Quebec. J. Entomol. Soc. Ont. 2011, 142, 45–48. [Google Scholar]
  15. Wermelinger, B.; Wyniger, D.; Forster, B. First records of an invasive bug in Europe: Halyomorpha halys Stål (Heteroptera: Pentatomidae), a new pest on woody ornamentals and fruit trees? Bull. Soc. Entomol. Suiss. 2008, 81, 1–8. [Google Scholar]
  16. EPPO Global Database. Available online: https://gd.eppo.int (accessed on 13 January 2018).
  17. Bariselli, M.; Bugiani, R.; Maistrello, L. Distribution and damage caused by Halyomorpha halys in Italy. Bull. OEPP 2016, 46, 332–334. [Google Scholar] [CrossRef]
  18. Nielsen, A.L.; Hamilton, G.C. Life history of the invasive species Halyomorpha halys (Hemiptera: Pentatomidae) in northeastern United States. Ann. Entomol. Soc. Am. 2009, 102, 608–616. [Google Scholar] [CrossRef]
  19. Oregon Department of Agriculture: Pest Alert: Brown Marmorated Stink Bug Halyomorpha halys. Available online: http://www.oregon.gov/ODA/Pages/default.aspx (accessed on 4 December 2017).
  20. Inkley, D. Characteristics of home invasion by the brown marmorated stink bug (Hemiptera: Pentatomidae). J. Entomol. Sci. 2012, 47, 125–130. [Google Scholar] [CrossRef]
  21. Cesari, M.; Maistrello, L.; Piemontese, L.; Bonini, R.; Dioli, P.; Lee, W.; Park, C.G.; Partsinevelos, G.K.; Rebecchi, L.; Guidetti, R. Genetic diversity of the brown marmorated stink bug Halyomorpha halys in the invaded territories of Europe and its patterns of diffusion in Italy. Biol. Invasions 2017, 1–20. [Google Scholar] [CrossRef]
  22. Trentino Agricoltura. Available online: http://www.trentinoagricoltura.it/Trentino-Agricoltura/Settori2/Ortofrutticoltura/Mela (accessed on 9 January 2018).
  23. Roura-Pascual, N.; Krug, R.M.; Richardson, D.M.; Hui, C. Spatially-explicit sensitivity analysis for conservation management exploring the influence of decisions in invasive alien plant management. Divers. Distrib. 2010, 16, 426–438. [Google Scholar] [CrossRef]
  24. Jackson, S.T.; Overpeck, J.T. Responses of plant populations and communities to environmental changes of the late Quaternary. Paleobiology 2000, 26, 194–220. [Google Scholar] [CrossRef]
  25. Anderson, R.P.; Lew, D.; Peterson, A.T. Evaluating predictive models of species’ distributions: Criteria for selecting optimal models. Ecol. Model. 2003, 162, 211–232. [Google Scholar] [CrossRef]
  26. Merow, C.; Smith, M.J.; Silander, J.A., Jr. A practical guide to MaxEnt for modeling species’ distributions: What it does, and why inputs and settings matter. Ecocraphy 2013, 36, 1058–1069. [Google Scholar] [CrossRef]
  27. Hahn, N.G.; Kaufman, A.J.; Rodriguez-Saona, C.; Nielsen, A.L.; Laforest, J.; Hamilton, G.C. Exploring the spread of the brown marmorated stink bug in New Jersey through the use of crowdsourced reports. Am. Entomol. 2016, 62, 36–45. [Google Scholar] [CrossRef]
  28. Silverton, J. A new dawn for citizen science. Trends Ecol. Evolut. 2009, 24, 467–471. [Google Scholar] [CrossRef] [PubMed]
  29. Hamilton, R.M. Remote Sensing and GIS Studies on the Spatial Distribution and Management of Japanese Beetle Adults and Grubs. Ph.D. Dissertation, Purdue University, West Lafayette, IN, USA, 2003. [Google Scholar]
  30. Dminić, I.; Kozina, A.; Bažok, R.; Barčić, J.I. Geographic information system (GIS) and entomological research: A Review. J. Food Agric. Environ. 2010, 8, 1193–1198. [Google Scholar]
  31. Istat-Istituto Nazionale di Statistica. Available online: http://www.istat.it/en/ (accessed on 16 February 2018).
  32. Provincia di Trento. Available online: http://www.statweb.provincia.tn.it/ (accessed on 20 February 2018).
  33. Capinha, C.; Anastácio, P. Assessing the environmental requirements of invaders using ensembles of distribution models. Divers. Distrib. 2011, 17, 13–24. [Google Scholar] [CrossRef]
  34. Autonomous Province of Trento. Available online: http://www.territorio.provincia.tn.it/portal/server.pt/community/cartografia_di_base/260/cartografia_di_base/19024 (accessed on 6 August 2017).
  35. Philips, S.J.; Anderson, R.P.; Schapire, R.E. Maximum entropy modeling of species geographic distributions. Ecol. Model. 2006, 190, 231–359. [Google Scholar] [CrossRef]
  36. Elith, J.; Philips, S.J.; Hastie, T.; Dudík, M.; Chee, Y.E.; Yates, C.J. A statistical explanation of MaxEnt for ecologists. Divers. Distrib. 2011, 17, 43–57. [Google Scholar] [CrossRef]
  37. Zhu, G.; Bu, W.; Gao, Y.; Liu, G. Potential geographic distribution of brown marmorated stink bug invasion (Halyomorpha halys). PLoS ONE 2012, 7, e31246. [Google Scholar] [CrossRef] [PubMed]
  38. Fourcade, Y.; Engler, J.O.; Rödder, D.; Secondi, J. Mapping Species Distributions with MAXENT Using a Geographically Biased Sample of Presence Data: A Performance Assessment of Methods for Correcting Sampling Bias. PLoS ONE 2014, 9, e97122. [Google Scholar] [CrossRef] [PubMed]
  39. GRASS Development Team. Geographic Resources Analysis Support System (GRASS) Software, Version 7.0; Open Source Geospatial Foundation: Chicago, IL, USA, 2015. [Google Scholar]
  40. Phillips, S.J.; Dudík, M.; Elith, J.; Graham, C.H.; Lehmann, A.; Leathwick, J.; Ferrier, S. Sample selection bias and presence-only distribution models: Implications for background and pseudo-absence data. Ecol. Appl. 2009, 19, 181–197. [Google Scholar] [CrossRef] [PubMed]
  41. R Core Team. R: A Language and Environment for Statistical Computing; R Foundation for Statistical Computing: Vienna, Austria, 2015. [Google Scholar]
  42. Cantor, S.B.; Sun, C.C.; Tortolero-Luna, G.; Richards-Kortum, R.; Follen, M. A comparison of C/B ratios from studies using receiver operating characteristic curve analysis. J. Clin. Epidemiol. 1999, 52, 885–892. [Google Scholar] [CrossRef]
  43. Liu, C.; Berry, P.; Dawson, T.; Pearson, R. Selecting thresholds of occurrence in the prediction of species distributions. Ecography 2005, 28, 385–393. [Google Scholar] [CrossRef]
  44. Wallner, A.M.; Hamilton, G.C.; Nielsen, A.L.; Hahn, N.; Green, E.J.; Rodriguez-Saona, C.R. Landscape factors facilitating the invasive dynamics and distribution of the brown marmorated stink bug, Halyomorpha halys (Hemiptera: Pentatomidae), after arrival in the United States. PLoS ONE 2014, 9, e95691. [Google Scholar] [CrossRef] [PubMed]
  45. Maistrello, L.; Dioli, P.; Bariselli, M.; Mazzoli, G.L.; Giacalone-Forini, I. Citizen science and early detection of invasive species: Phenology of first occurrences of Halyomorpha halys in Southern Europe. Biol. Invasions 2016, 18, 3109–3116. [Google Scholar] [CrossRef]
  46. Sargent, C.; Martinson, H.M.; Raupp, M.J. Traps and trap placement may affect location of brown marmorated stink bug (Hemiptera: Pentatomidae) and increase injury to tomato fruits in home gardens. Environ. Entomol. 2014, 43, 432–438. [Google Scholar] [CrossRef] [PubMed]
  47. Rossi-Stacconi, M.V.; Rupinder, K.; Mazzoni, V.; Ometto, L.; Grassi, A.; Gottardello, A.; Rota-Stabelli, O.; Anfora, G. Multiple lines of evidence for reproductive winter diapause in the invasive pest Drosophila suzukii: Useful clues for control strategies. J. Pest Sci. 2016, 89, 689–700. [Google Scholar] [CrossRef]
  48. Holtz, T.; Kamminga, K. Qualitative Analysis of the Pest Risk Potential of the Brown Marmorated Stink Bug (BMSB), Halyomorpha halys (Stål), in the United States. United States Department of Agriculture: APHIS 2010. Available online: https://www.michigan.gov/documents/mda/BMSB_Pest_Risk_Potential_-_USDA_APHIS_Nov_2011_344862_7.pdf (accessed on 6 January 2018).
  49. Tindall, K.V.; Fothergill, K.; McCormack, B. Halyomorpha halys (Hemiptera: Pentatomidae): A first Kansas record. J. Kansas Entomol. Soc. 2012, 85, 169. [Google Scholar] [CrossRef]
  50. Anfora, G.; Trento University, Trento, Trentino, Italy. Personal Communication, 2018.
  51. Crall, A.W.; Newman, G.J.; Jarnevich, C.S.; Stohlgren, T.J.; Waller, D.M.; Graham, J. Improving and integrating data on invasive species collected by citizen scientists. Biol. Invasions 2010, 12, 3419–3428. [Google Scholar] [CrossRef]
  52. Kolar, C.S.; Lodge, D.M. Progress in invasion biology: Predicting invaders. Trends Ecol. Evolut. 2001, 16, 199–204. [Google Scholar] [CrossRef]
  53. Keane, R.M.; Crawley, M.J. Exotic plant invasions and the enemy release hypothesis. Trends Ecol. Evol. 2002, 17, 164–170. [Google Scholar] [CrossRef]
  54. Nielsen, A.L.; Holmstrom, K.; Hamilton, G.C.; Cambridge, J.; Ingerson–Mahar, J. Use of black light traps to monitor the abundance, spread, and flight behavior of Halyomorpha halys (Hemiptera: Pentatomidae). J. Econ. Entomol. 2013, 106, 1495–1502. [Google Scholar] [CrossRef] [PubMed]
  55. Blossey, B.; Notzold, R. Evolution of increased competitive ability in invasive nonindigenous plants: A hypothesis. J. Ecol. 1995, 83, 887–889. [Google Scholar] [CrossRef]
  56. Lee, K.A.; Klasing, K.C. A role for immunology in invasion biology. Trends Ecol. Evolut. 2004, 19, 523–529. [Google Scholar] [CrossRef] [PubMed]
  57. Bergmann, E.J.; Venugopal, P.D.; Martinson, H.M.; Raupp, M.J.; Shrewsbury, P.M. Host plant use by the invasive Halyomorpha halys (Stål) on woody ornamental trees and shrubs. PLoS ONE 2016, 11, e0149975. [Google Scholar] [CrossRef] [PubMed]
  58. Philips, C.R.; Kuhar, T.P.; Dively, G.P.; Hamilton, G.; Whalen, J.; Kamminga, K. Seasonal abundance and phenology of Halyomorpha halys (Hemiptera: Pentatomidae) on different pepper cultivars in the Mid-Atlantic (United States). J. Econ. Entomol. 2016, 110, 192–200. [Google Scholar] [CrossRef]
  59. Nielsen, A.L.; Fleischer, S.; Hamilton, G.C.; Hancock, T.; Krawczyk, G.; Lee, J.C.; Ogburn, E.; Pote, J.M.; Raudenbush, A.; Rucker, A.; et al. Phenology of brown marmorated stink bug described using female reproductive development. Ecol. Evol. 2017, 7, 6680–6690. [Google Scholar] [CrossRef] [PubMed]
  60. Haye, T.; Abdallah, S.; Gariepy, T.; Wyniger, D. Phenology, life table analysis and temperature requirements of the invasive brown marmorated stink bug, Halyomorpha halys, in Europe. J. Pest Sci. 2014, 87, 407–418. [Google Scholar] [CrossRef]
  61. Morrison, W.R.; Lee, D.H.; Short, B.D.; Khrimian, A.; Leskey, T.C. Establishing the behavioral basis for an attract-and-kill strategy to manage the invasive Halyomorpha halys in apple orchards. J. Pest Sci. 2016, 89, 81–96. [Google Scholar] [CrossRef]
  62. Bergh, J.C.; Morrison, W.R.; Joseph, S.V.; Leskey, T.C. Characterizing spring emergence of adult Halyomorpha halys using experimental overwintering shelters and commercial pheromone traps. Entomol. Exp. Appl. 2017, 162, 336–345. [Google Scholar] [CrossRef]
  63. Wiman, N.G.; Walton, V.M.; Shearer, P.W.; Rondon, S.I. Electronically monitored labial dabbing and stylet ‘probing’ behaviors of brown marmorated stink bug, Halyomorpha halys, in simulated environments. PLoS ONE 2014, 9, e113514. [Google Scholar] [CrossRef] [PubMed]
  64. Acebes-Doria, A.L.; Leskey, T.C.; Bergh, J.C. Host plant effects on Halyomorpha halys (Hemiptera: Pentatomidae) nymphal development and survivorship. Environ. Entomol. 2016, 45, 663–670. [Google Scholar] [CrossRef] [PubMed]
  65. Joseph, S.V.; Nita, M.; Leskey, T.C.; Bergh, J.C. Temporal effects on the incidence and severity of brown marmorated stink bug (Hemiptera: Pentatomidae) feeding injury to peaches and apples during the fruiting period in Virginia. J. Econ. Entomol. 2015, 108, 592–599. [Google Scholar] [CrossRef] [PubMed]
  66. McCarthy, K.P.; Fletcher, R.J.; Rota, C.T.; Hutto, R.L. Predicting species distributions from samples collected along roadsides. Conserv. Biol. 2012, 26, 68–77. [Google Scholar] [CrossRef] [PubMed]
  67. Venugopal, P.D.; Coffey, P.L.; Dively, G.P.; Lamp, W.O. Adjacent habitat influence on stink bug (Hemiptera: Pentatomidae) densities and the associated damage at field corn and soybean edges. PLoS ONE 2014, 9, e109917. [Google Scholar] [CrossRef] [PubMed]
  68. Morrison, W.R.; Milonas, P.; Kapantaidaki, D.E.; Cesari, M.; Bella, E.; Guidetti, R.; Haye, T.; Maistrello, L.; Moraglio, S.T.; Piemontese, L.; et al. Attraction of Halyomorpha halys (Hemiptera: Pentatomidae) haplotypes in North America and Europe to baited traps. Sci. Rep. 2017, 7, 16941. [Google Scholar] [CrossRef] [PubMed]
  69. Cira, T.M.; Venette, R.C.; Aigner, J.; Kuhar, T.; Mullins, D.E.; Gabbert, S.E.; Hutchison, W.D. Cold tolerance of Halyomorpha halys (Hemiptera: Pentatomidae) across geographic and temporal scales. Environ. Entomol. 2016, 45, 484–491. [Google Scholar] [CrossRef] [PubMed]
  70. Dosdall, L.M. Evidence for successful overwintering of diamondback moth, Plutella xylostella (L.) (Lepidoptera: Plutellidae), in Alberta. Can. Entomol. 1994, 126, 183–185. [Google Scholar] [CrossRef]
  71. Leskey, T.C.; Short, B.D.; Lee, D.H. Efficacy of insecticide residues on adult Halyomorpha halys (Stål) (Hemiptera: Pentatomidae) mortality and injury in apple and peach orchards. Pest Manag. Sci. 2014, 70, 1097–1104. [Google Scholar] [CrossRef] [PubMed]
  72. Kistner, E.J. Climate Change Impacts on the Potential Distribution and Abundance of the Brown Marmorated Stink Bug (Hemiptera: Pentatomidae) with Special Reference to North America and Europe. Environ. Entomol. 2017, 46, 1212–1224. [Google Scholar] [CrossRef] [PubMed]
  73. Conrad, C.C.; Hilchey, K.G. A review of citizen science and community-based environmental monitoring: Issues and opportunities. Environ. Monit. Assess. 2011, 176, 273–291. [Google Scholar] [CrossRef] [PubMed]
Figure 1. An Open Street Map of the area monitored by pheromone traps, with dark-blue dots representing the coordinates of the traps placed in orchards, field crops, public parks, outdoor parking spaces, bushes and anthropogenic settings.
Ijgi 07 00171 g001
Figure 2. A representation of the different BugMap reports registered by citizens and those registered by technicians, adopting traditional monitoring methods (Pheromone traps, tree-beating). Blue bars: <10 specimens; orange bars: 10–15 specimens; grey bars: >50 specimens.
Ijgi 07 00171 g002
Figure 3. A comparison between traditional monitoring and citizen contribution, taking into account the percentage of reports generated by the two parties from various sighting locations.
Ijgi 07 00171 g003
Figure 4. A representation of the varying number of valid BMSB reports in different localities since the initiation of BugMap in spring 2016 up until February 2018.
Ijgi 07 00171 g004
Figure 5. The number of sightings of different BMSB life stages is showcased with respect to the date of the report. Life stages are classified according to the original reports; “unknowns” are specimens that users were unable to classify.
Ijgi 07 00171 g005
Figure 6. A display of the proportion of reports from different agricultural cultivations, with n = 64 reports from agricultural cultivations.
Ijgi 07 00171 g006
Figure 7. A suitability map of Trentino generated by MaxEnt, illustrating the areas suitable for the establishment of BMSB. ROC analysis was performed on the results of the 500 m sub-sampled model allowing the identification of the best cut-off value at 0.26 with a classification accuracy of 0.92. The logistic output of the map from MaxEnt was reclassified according to the best cut-off in two classes: unsuitable habitat below 0.26 of the logistic output and suitable habitat above that value.
Ijgi 07 00171 g007
Figure 8. A map of Italy showcasing BMSB reports from the targeted Trentino (light blue) along with scattered registrations (red dots) from various Italian regions, offering an early warning for unsuspecting communities.
Ijgi 07 00171 g008
Figure 9. A summary of the workflow adopted in Trentino for tracking the spread of the invasive BMSB, termed “Monitoring 2.0”, that potentially constitutes a model for future programs.
Ijgi 07 00171 g009
Table 1. List of the environmental GIS layers included in the analysis.
IndexSpatial ResolutionParameter
Digital elevation model (DEM) a10 mSlope
Aspect
Average hours of sun per season
Land use b10 mContinuous urban fabric
Green urban areas
Fruit trees and berry plantations
Hydrography10 mDistance from rivers
Distance from lakes
a From the digital elevation model the slope, aspect and hours of sun were calculated and derived using GRASS GIS version 7. These three variables are a good proxy for temperature in a mountainous environment. b Land use was classified by GRASS GIS into 30 classes (Table S1) to avoid co-linearity and account for the species’ ecology.

