POI Information Enhancement Using Crowdsourcing Vehicle Trace Data and Social Media Data: A Case Study of Gas Station


School of Resource and Environmental Sciences, Wuhan University, 129 Luoyu Road, Wuhan 430079, China
*
Author to whom correspondence should be addressed.
ISPRS Int. J. Geo-Inf. 2018, 7(5), 178; https://doi.org/10.3390/ijgi7050178
Submission received: 26 March 2018
/
Revised: 30 April 2018
/
Accepted: 7 May 2018
/
Published: 8 May 2018
(This article belongs to the Special Issue Geospatial Big Data and Urban Studies)
Abstract
:Points of interest (POIs) such as stores, gas stations, and parking lots are particularly important for maps. Using gas station as a case study, this paper proposed a novel approach to enhance POI information using low-frequency vehicle trajectory data and social media data. First, the proposed method extracted spatial information of the gas station from sparse vehicle trace data in two steps. The first step proposed the velocity sequence linear clustering algorithm to extract refueling stop tracks from the individual trace line after modeling the vehicle refueling stop behavior using movement features. The second step used the Delaunay triangulation to extract the spatial information of gas stations from the collective refueling stop tracks. Second, attribute information and dimension sentiment semantic information of the gas station were extracted from social media data using the text mining method and tripartite graph model. Third, the gas station information was enhanced by fusing the extracted spatial data and semantic data using a matching method. Experiments were conducted using the 15-day vehicle trajectories of 12,000 taxis and social media data from the Dazhongdianping in Beijing, China, and the results showed that the proposed method could extract the spatial information, attribute information, and review information of gas stations simultaneously. Compared with ground truth data, the automatically enhanced gas station was proved to be of higher quality in terms of the correctness, completeness, and real-time.
1. Introduction
Points of interest are an indispensable component in basic geographic information and play an important role in a variety of fields, including Location Based Service (LBS), scientific research, and commercial applications [1,2,3]. Keeping point of interest (POI) data up-to-date, correct, and complete in a short updating cycle and low cost way is extremely important [1,2,3]. However, POI data such as gas stations and parking lots are mainly traditionally obtained from field surveys, remote sensing, and manual annotation [4,5,6]. These methods are costly, have a long update cycle, and are time-consuming, leading to limiting POI data services [5,6]. Consequently, using a low cost and fast method to enhance and update POI data automatically is very significant.
In the era of big data, Volunteer Geography Information (VGI) data (e.g., trajectory) and User-Generated Content (UGC) data (e.g., social media data) are available and provide a new direction in which to enhance and update POI data in three ways. One is through collaborative mapping programs [5,6], such as OpenStreetMap, which are constructed manually from crowdsourcing. However, these sources are limited (e.g., focused on a single domain, limited spatial coverage) and are updated slowly due to insufficient user participation [5,6]. Another option is to extract POI data from global positioning system (GPS) trajectory data [7,8,9,10,11]. At present, extracting and updating spatial data using collections of GPS traces is a relatively new area of research, and these works include map updates [8], data extraction such as road data [9,10], POI data [4,7], and activity behavior analysis [7,11]. Compared with collaborative mapping programs, this method is real-time, low-cost, updates quickly, and can monitor the temporal and spatial change of activity patterns in the POI place. Nevertheless, the GPS trajectory only embodies spatial information and cannot provide attribute information (e.g., name, descriptions) necessary for POI. The last option is to extract POI from social media data [1,3,12,13,14]. Many stores use web sites such as the Yellows Pages, Dianping [15], to advertise their services and publish attribute information such as telephone numbers and addresses. Meanwhile, comment text data containing user reviews about POIs are posted on websites. The geotagged UGC data have opened a new way of acquiring POI semantic information but cannot be obtained from GPS traces [12,13]. However, POI information from social media also has problems such as outdated, poor geometry information (only point), redundant POI due to the frequent opening, moving, or closing of a business, and web map data update lag [12]. Moreover, social media data are sparse in space and time compared with GPS trace [16], which makes it difficult to sense the dynamic change of spatial information (e.g., the area of POI, subsidy facility of POI, infrastructure, etc.) and activity behavior in the POI place [17].
Based on the above analysis, it is difficult to obtain high quality, up-to-date, rich semantic POI information using only one type of VGI data (GPS trace data or social media data). To accomplish this, the POI data must be enhanced by coupling multi-sourced data [14,16]. In this work, using the case of the gas station, a big data-driven method was developed for enhancing POI data coupling sparse vehicle GPS trace and geo-tagged social media data. Unfortunately, there are many challenges using multisource data to enhance POI information, they are as follows:
- First, using sparse vehicle GPS trace to extract the spatial information of gas stations has two key points to be solved: one is to extract the refueling stop sub-track from each trace. However, vehicle trace contains various stop behaviors and there is no model and algorithm to identity and extract refueling stop behavior sub-tracks. Therefore, it needs to establish a refueling stop behavior model to distinguish the refueling behavior from other stop behaviors and propose an efficient algorithm to extract refueling stop tracks by coupling the model. The other problem is that it requires a new way to extract the spatial information accurately from the collective refueling tracks.
- Second, social media data not only contains attribute data of gas stations (e.g., name, address), but also contains review information of different dimensions (e.g., service, product). Therefore, it is necessary to present a new method to mine the attribute and dimensional sentiment semantic information from the unstructured comment text data simultaneously.
- Third, an efficient method should be proposed to enhance the POI information by fusing the two kinds of different dimension information from different sources.
To overcome the above challenges, a novel method for enhancing POI data coupling vehicle GPS trace data and social media data is presented. The main contributions of this article as follows:
- The vehicle refueling stop behavior model and the velocity sequence linear clustering algorithm (VSLC) are proposed to identity and extract refueling stop sub-tracks from each trace. Then, the spatial information of gas stations is extracted from collective refueling stop tracks by the Delaunay triangulation.
- A new way of coupling the text mining method and tripartite graph model is presented to extract the attribute information and dimension sentiment semantic of gas stations from the social media data of www.dazhongdianping.com (Dianping) [15].
- The POI information is enhanced using a matching method by fusing the spatial and attribute information extracted from different VGI data.
- An experiment using 15-day taxi GPS traces and social media data from Dianping in Beijing, China verifies the novel method.
The remainder of the paper is as follows: A review of the related work is introduced in Section 2. Section 3 outlines the procedure of the gas station information extraction method. Section 4 describes the experiments on real GPS traces and social media datasets and evaluates the proposed method. The conclusions and directions of future research are discussed in Section 5.
2. Related Work
2.1. Activity Stop Behavior Detection from GPS Trajectory for Extracting POI Information
A trajectory, according to the Stop/Move model [18,19], is composed of a series of stops and moves. Stop detection is important for recognizing significant locations or place, such as POI extraction from the GPS trajectory. There is a rich body of research on how to detect stops from the trajectory data, which can be divided into two categories: static methods [19,20,21] and dynamic methods [22]. For the static approach [19,20,21], significant places such as gas stations are defined in advance, then the stop location is detected by computing their spatial intersections with trajectories and the stay duration. However, the static algorithm is not suitable for extracting gas stations without well-defined POI data.
More studies have investigated the dynamic approaches, where no prior knowledge regarding stops is given and stops can only be discovered by considering the trajectory’s spatial-temporal features such as velocity, distance, and direction [22,23,24,25,26,27,28,29,30], etc. Several classical clustering algorithms have been introduced to extract stops from trajectory, such as the modified K-Means methods that have been adopted to detect stops [22]. The DBSCAN [23], the modified DBSCAN algorithm, and the density and join-based clustering algorithm (DJ-Cluster) [24] have been proposed to detect meaningful places. However, there are only a few stop points in the refueling process due to the low sampling rate of trajectory data. These density-based clustering algorithms only consider spatial characteristics, which are not suitable for the low-frequency trajectory in this work. Many studies have taken both the spatial and temporal characteristics into consideration. Based on the Stop/Move model, the CB_SmoT [25] and DB_SmoT algorithm [26] have been presented to extract stop tracks considering temporal, speed, and spatial features. Reference [27] improved the CB-SMoT algorithm by proposing an alternative for calculating the Eps parameter. Unfortunately, there are many missing track points and drifts in vehicle traces due to signal loss caused by buildings, trees, and other shelters in the gas station. These algorithms are not robust enough to signal missing and data drifts. To solve the data loss problem, some stop extraction approaches have been proposed [28,29,30] by taking different trajectory features. However, these methods cannot be used directly to detect vehicle refueling stop events and extract the spatial information of the gas station. There have been some works to model and analyze vehicle refueling stop behavior [17,21,31], but these methods are also unable to extract the gas station spatial information automatically without other data. Therefore, it is necessary to propose a method to detect refueling stop behavior and extract refueling tracks for the extraction of gas station spatial information from sparse vehicle traces.
2.2. Extracting POIs’ Semantic Information from Social Media Data
A POI database that contains spatial information and attribute semantic information (e.g., names, addresses, review descriptions) to support user queries is especially useful. However, the absence of semantic attribute content (e.g., name, address, sentiment) in GPS tracks hampers the integrity of data extraction and deeper analysis such as user preferences [16,32]. Social media data are generated when people post, comment or check-in on social networking sites such as Foursquare, Twitter, Weibo, and Dianping [13]. Social media data not only contains the attribute information of POIs, but also contains opinions about the services and POIs by sharing users’ photos, comments, videos, etc. Consequently, extracting POI attribute semantic information from social media data has drawn much attention [33]. For example, the attribute information of POI, including the address and store name, is extracted from the Yellow Pages [1,3]. The authors in paper [6] proposed a method to enhance POI data (improve the coverage and diversity of POIs) by integrating crowdsourced POIs from different Web sources. These works only extracted the attribute information of POIs, while these methods did not extract semantic information such as the sentimental evaluation of POIs nor paid attention to the users’ emotional perception of POI place or service. For semantic extraction, the term frequency-inverse document frequency (TF-IDF) approach and semantic annotation techniques have been used to infer semantic tags of POIs using flick geo-tagged photos and Twitter check-in data [34,35]. The work in [36] proposed a method and interest measures to discover important locations that considered historical user data and each user’s preferences. Although these works consider semantic information and the user’s preferences, the overall sentiment sensing was only analyzed and the users’ evaluation of different dimensions of POIs was not considered.
2.3. POI Informationen Ehancement Using Multisourced VGI Data
Keeping POI data up-to-date, of a high quality, and richly semantic in a short updating cycle and low cost way is significant. However, it is difficult to achieve this goal only using a single data (trajectory data or social media data). For example, the POI data extracted from social media data [16] (e.g., Yellow Pages, Dianping) have drawbacks such as low accuracy, redundancy, duplicates, and outdated [1,3,6], while GPS trace data lacks attributesemantic information. Therefore, multisourced VGI data should be fused to enhance POI information. Compared with social media data, trajectory data has a high temporal and spatial resolution, and can dynamically sense the change of facilities and human activity [4,7,17]. Particularly, for extracting the change of geometric features of POI, such as expansion of POI, change of subsidiary facilities (e.g., road, infrastructure) of POI, as well as analyzing the temporal and spatial change of activity behavior including space-time distribution of activity and activity patterns [8,17], trajectory data have more advantages than social media data. Compared with GPS trace data, social media data provides rich attribute semantic information. Therefore, it is necessary to combine the real-time of the GPS trajectory with the semantic richness of the web data to obtain updated, accurate, and rich semantic POI information. Currently, there have been some studies on integrating multisource data, including GPS trajectories, mobile phone data, and remote sensing to construct road maps and better understand urban functions [16,32,37]. To the best of our knowledge, no existing work has extracted both the spatial and semantic information of POI using GPS trajectory data and social media data in an automated manner to enhance POI information.
3. Methodology
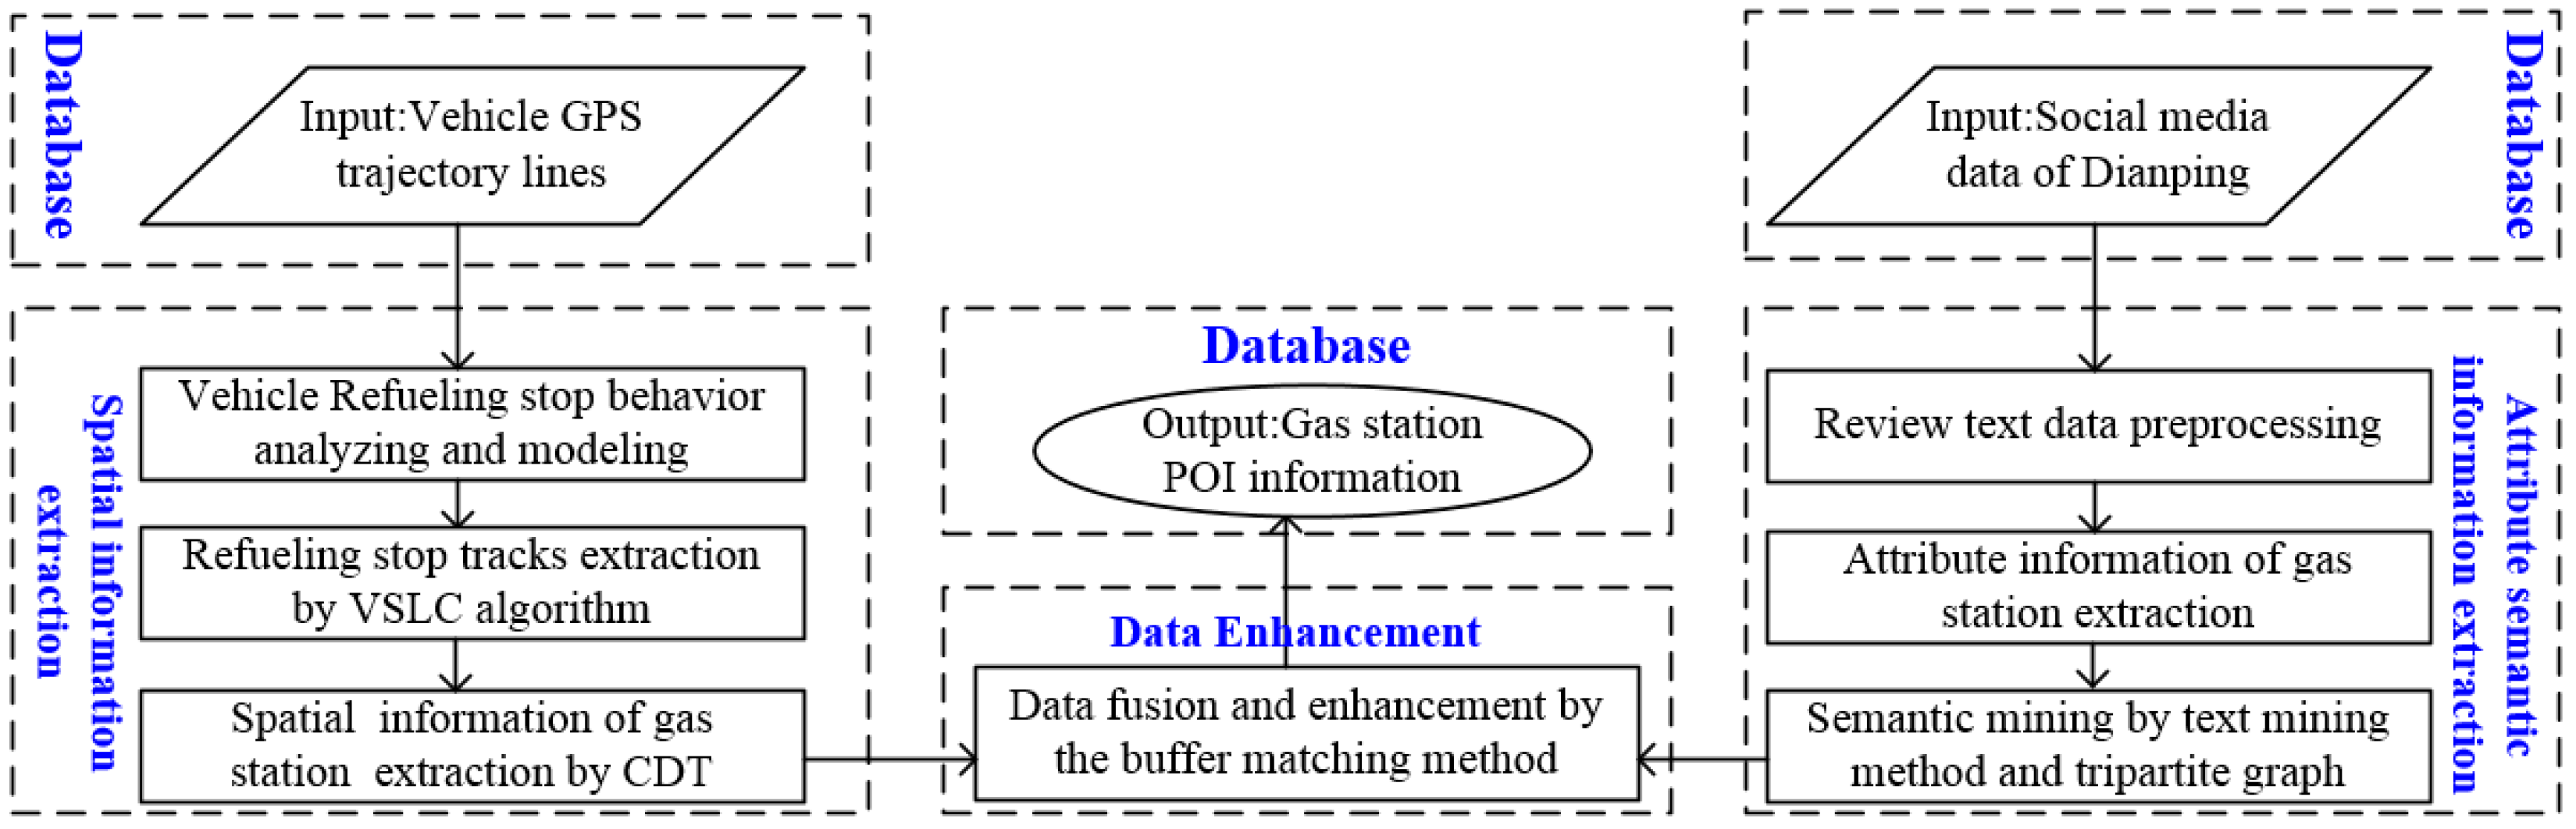
A method for enhancing the gas station POI information using low-frequency vehicle GPS traces and social media data is shown in the Figure 1, and the method includes three key steps:
- First, after modeling the refueling stop behavior using trajectory movement parameters, the vehicle refueling stop sub-trajectories are extracted by the proposed VSLC, and then the gas station spatial information is extracted from collective stop tracks by the Delaunay triangulation.
- Second, attribute information and each dimension sentiment evaluation of the gas station are extracted by the text mining method and tripartite graph model.
- Third, the spatial information, attribute information and review semantic information of the gas station are integrated to enhance the POI information by using the buffer matching method.
3.1. Spatial Information of Gas Station Extraction from Sparse Vehicle Trajectory Data
3.1.1. Refueling Stop Behavior Analyzing and Modeling Using Movement Parameters
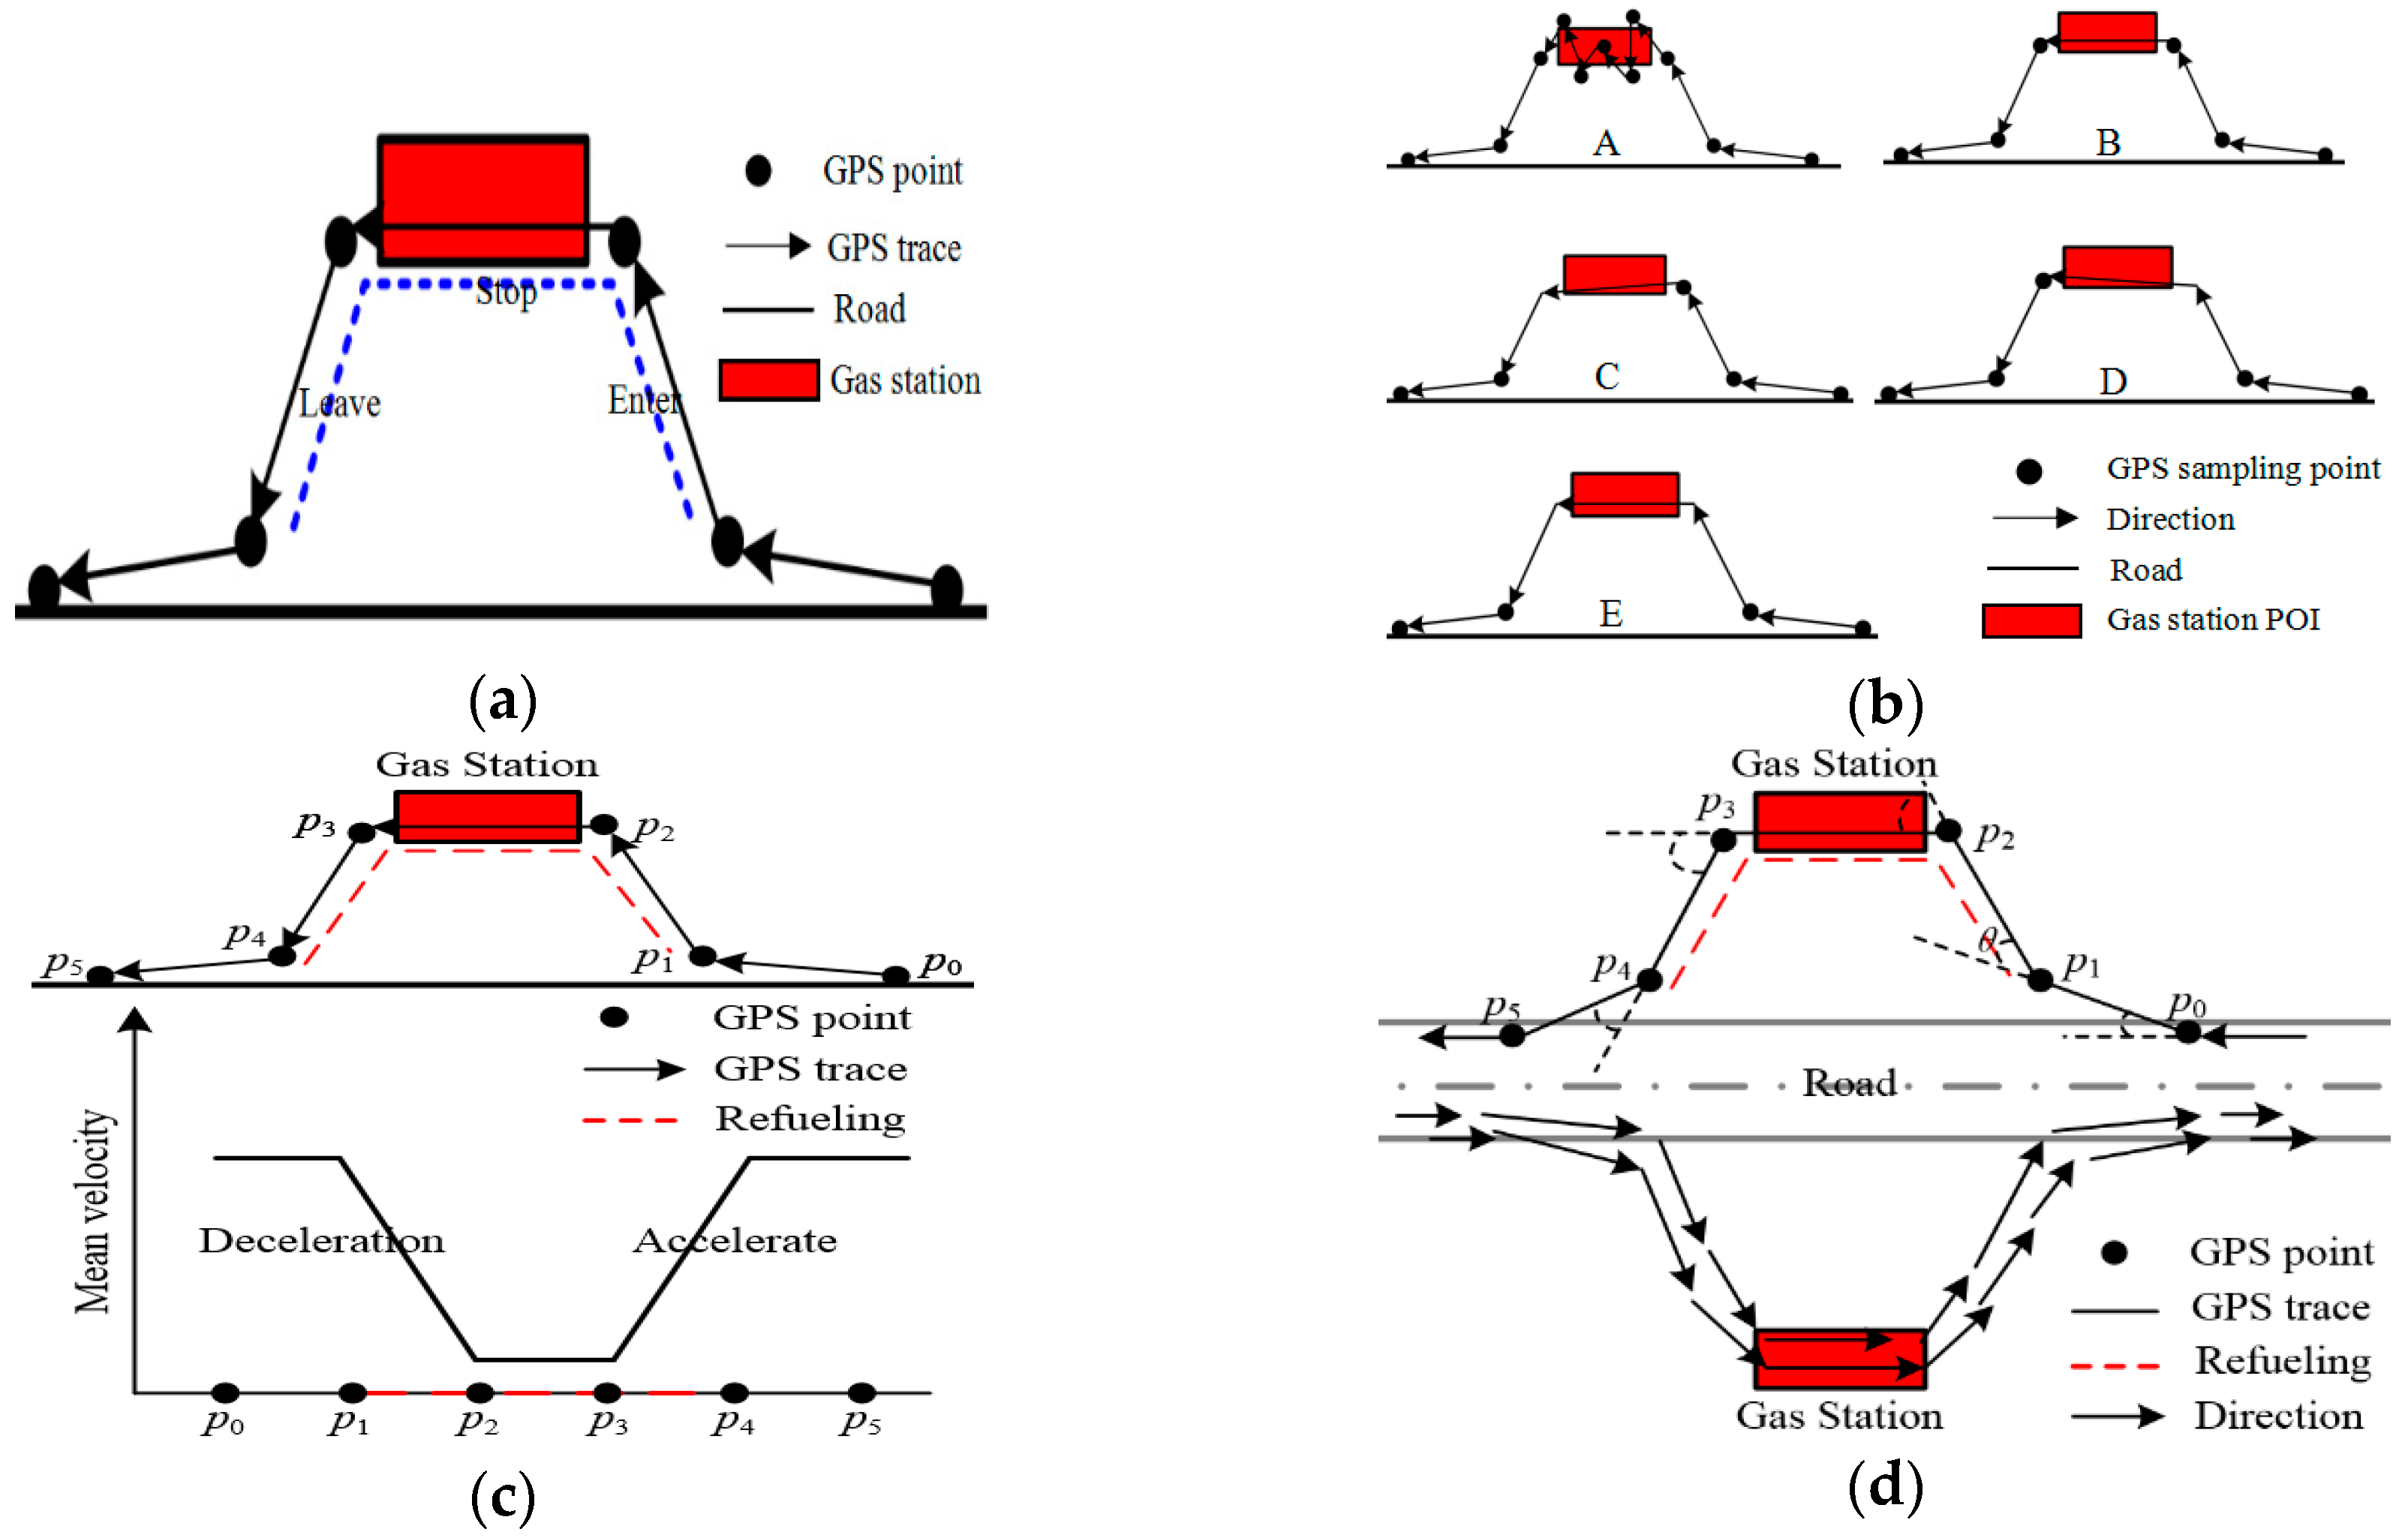
The vehicle refueling stop event took place in a gas station area, and the vehicle refueling behavior included the vehicle driving off the road, entering the gas station, staying for refueling, leaving the gas station, and returning to driving on the road, which is a typical Stop/Move pattern [18,19], as shown in Figure 2a. According to the relationship between the location of the stop track points and the gas station, the refueling stop track can be divided into the five types seen in Figure 2b. Type A in Figure 2b shows that vehicles leave a large number of stop points in the process of waiting for refueling and these GPS points may contain many more drifts and noises. Types B, C, and D in Figure 2b indicate that vehicles leave few stop track points due to sparse trajectory sampling. Type E in Figure 2b shows that the refueling stop points are missing and the vehicle leaves no stop trace points. Unfortunately, most of the refueling trajectories belong to types B, C, and D.
Movement parameters [38], including velocity, time, direction and its change, can describe and model a refueling stop behavior. In Figure 2c, due to the vehicle speed first decelerating and then accelerating in the process of refueling, the average velocity variation of the refueling trajectory presents a V shape by calculating the average velocity of the trace [17]. A refueling stop is embodied by a track sequence with a velocity of zero or a low speed at a short distance. Although a refueling track has a few stop points, the average speed (represented by Av) of the refueling stop track is much lower than the normal speed [17,21]. Therefore, the stop tracks can be extracted from each vehicle trace by giving a velocity threshold (represented by MaxAv, which is 6km/h in this work). Naturally, it is necessary to integrate other features to separate refueling from other types of stops. In Figure 2d, the range of direction change (the direction change of the track point is called the turning angle [38], which is represented by TurnAng) of each refueling track point ranged from 0 to 90° (e.g., the TurnAng of point p1 is θ in Figure 2d). Commonly, there are four consecutive obvious direction changes in the process of refueling, as shown in Figure 2d. Due to sparse trajectory sampling, it was not obvious that the direction change continued when the stop was type C or D, but there should be at least one change. When the stop was type E in Figure 2b, it disturbed the refueling event detection. So, for a refueling stop track, the number of the direction changes (represented by Dcnum) was greater than or equal to one. Moreover, the time of the refueling stop (represented by Tstop) was generally between 3 min to 15 min [17,21]. Therefore, the refueling event (RE) of the individual track line can be modeled using movement parameters:
In addition, collective refueling track features and gas station geometric features can also help to identify the gas station. As vehicles travel in one direction in the gas station, the move direction of the collective refueling tracks (represented by Dircoll) of each gas station is one-way, as shown in Figure 2d. The area of the gas station polygon extracted from the collective refueling tracks should meet the construction standard of the gas station (represented by Area, in this work) [39]. Therefore, the extracted gas station is constrained by the GS model:
3.1.2. Refueling Stop Tracks Extraction Using Velocity Sequence Linear Clustering Algorithm
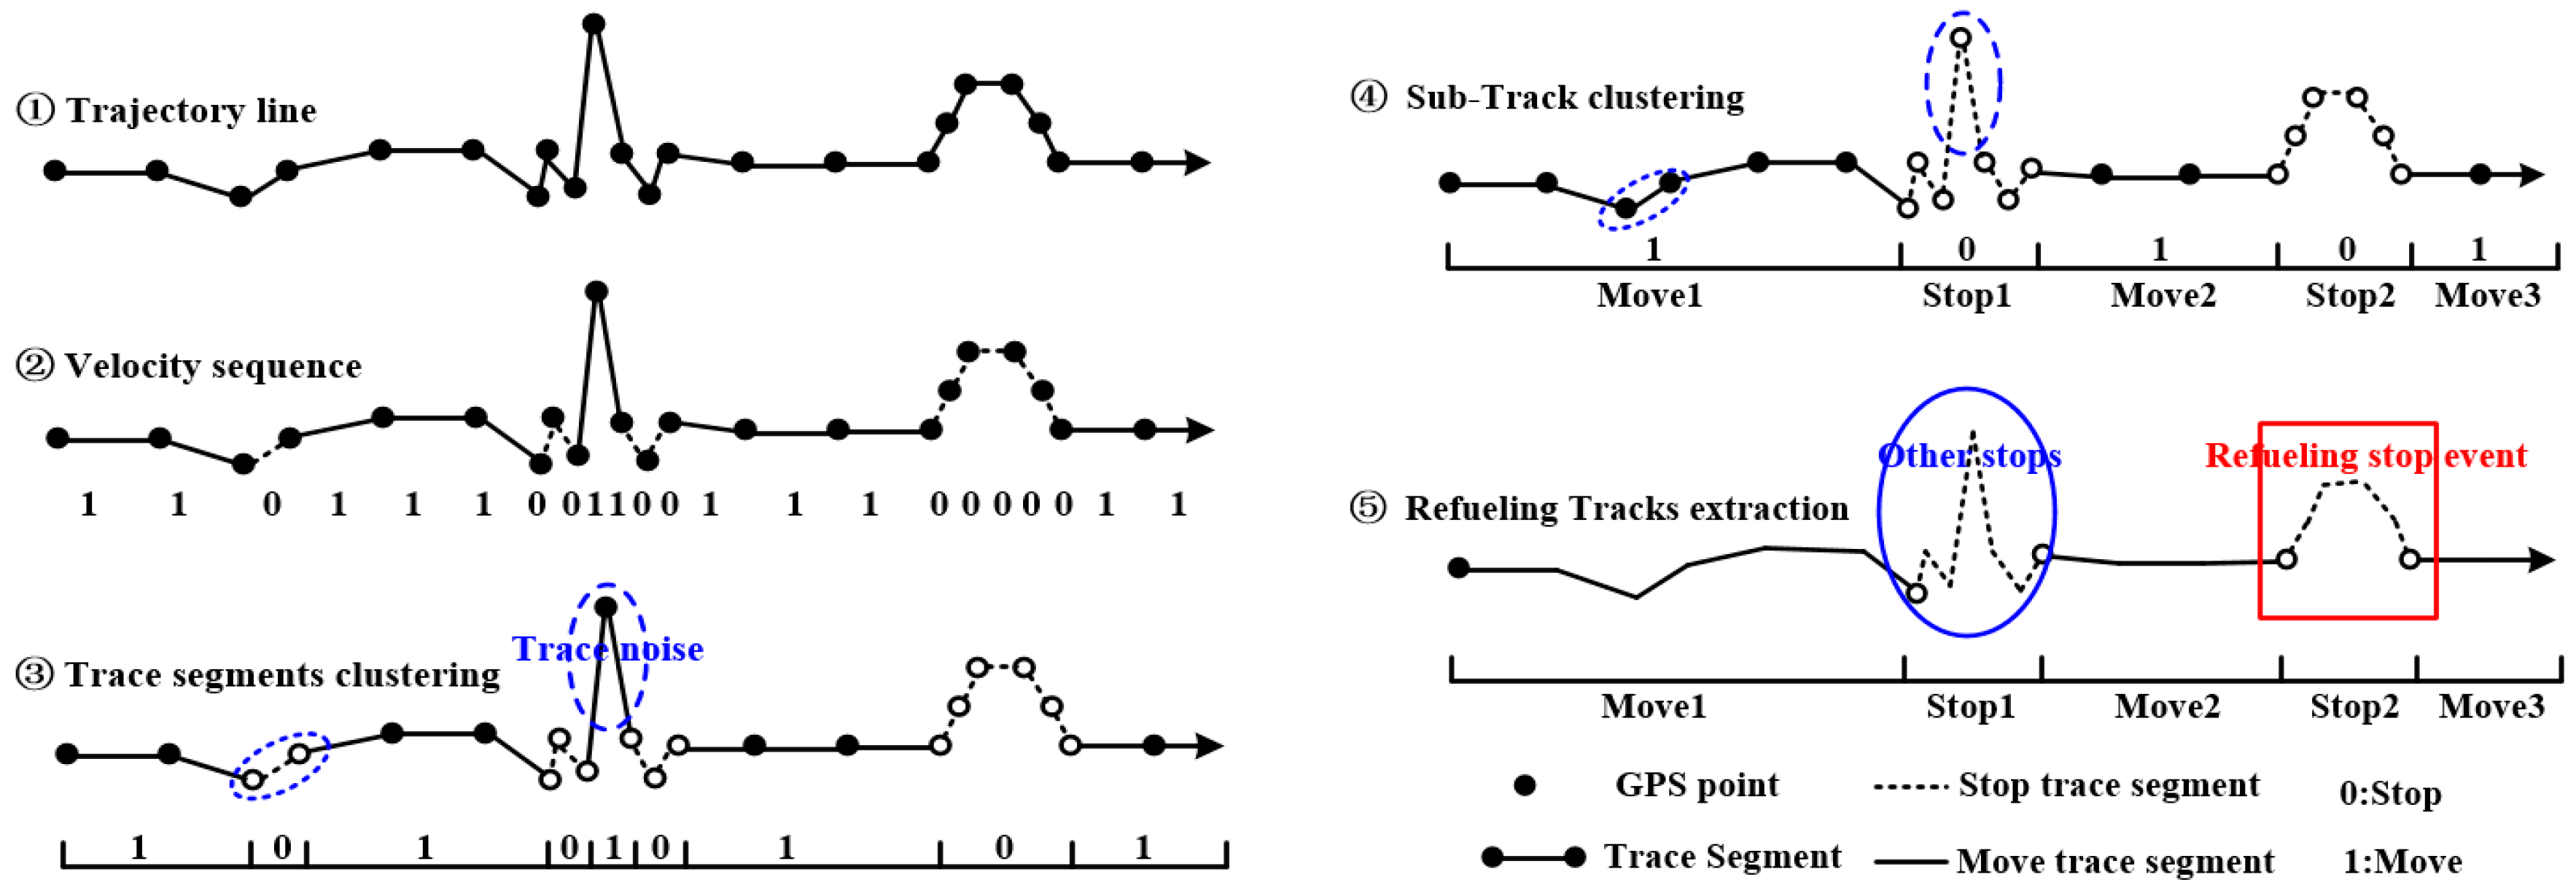
As the Section 3.1.1 analysis showed, the refueling stop sub-trajectory could be extracted from each trace by giving a velocity threshold of MaxAv. Meanwhile, stop and moving behavior should last for a certain time in reality. For example, let S1 be a stop sub-track, if the time duration (S1.last, S1.first) ≤ MinStop, the S1 is a moving sub-track. Let S2 be a moving sub-track, if the time duration (S2.last, S2.first) ≤ MinMove, then S2 is a stop sub-track. Here, MinMove is the minimum duration that a normal moving behavior should last and MinStop is the minimum duration that a normal stop behavior should last. Based on the above analysis, the VSLC algorithm was developed to extract refueling stop sub-tracks from each trace line. For each trace line, the stop and move state of the trajectory segments are serialized according to the velocity threshold MaxAv taking the trace segment as the basic unit (the trace segment is a line segment formed by two adjacent points on time). Extracting the sub-tracks through clustering the same state trace segments following the time linear sequence. Then the sub-tracks are clustered again to extract the stop sub-tracks according to the threshold MinStop and MinMove. Last, the refueling stop sub-tracks are extracted by removing the non-refueling stop sub-tracks according to the refueling behavior features (the RE model in Section 3.1.1). The VSLC algorithm consists of the following steps:
- Step 1, parameters values are defined. Determine the average speed threshold MaxAv, minimum movement duration threshold MinMove, and minimum stop duration threshold MinStop.
- Step 2, trajectory segments speed serialization. For each trace, the average velocity of each trace segment as represented by TSAv is calculated. The trace segment is considered in the stop state when TSAv ≤ MaxAv, and the state is represented by 0; conversely, the trajectory segment is considered in the move state, and the state is represented by 1, as per Step 2 in Figure 3.
- Step 3, clustering trajectory segments. Sub-tracks are generated by merging trajectory segments with the same state in accordance with the direction of time, as per Step 3 in Figure 3.
- Step 4, extracting stop sub-tracks. For each sub-track generated in Step 3, if the time duration of the sub-track is lower than MinMove or MinStop, the sub-track is changed into opposite state as trajectory noise. Then, extract the stop sub-tracks by direction clustering sub-tracks again according to the state, as per Step 4 in Figure 3.
- Step 5, extracting refueling stop sub-tracks. For each stop sub-track, the stop sub-track can be considered as refueling stop tracks when the trajectory features accord with the RE model in Section 3.1.1, as per Step 5 in Figure 3.
- Step 6, collective refueling stop tracks extraction. When all vehicle traces are processed repeat the above steps, the extraction results are the collective refueling stop tracks.
3.1.3. Spatial Geometric Information Extraction Using Collective Refueling Stop Tracks
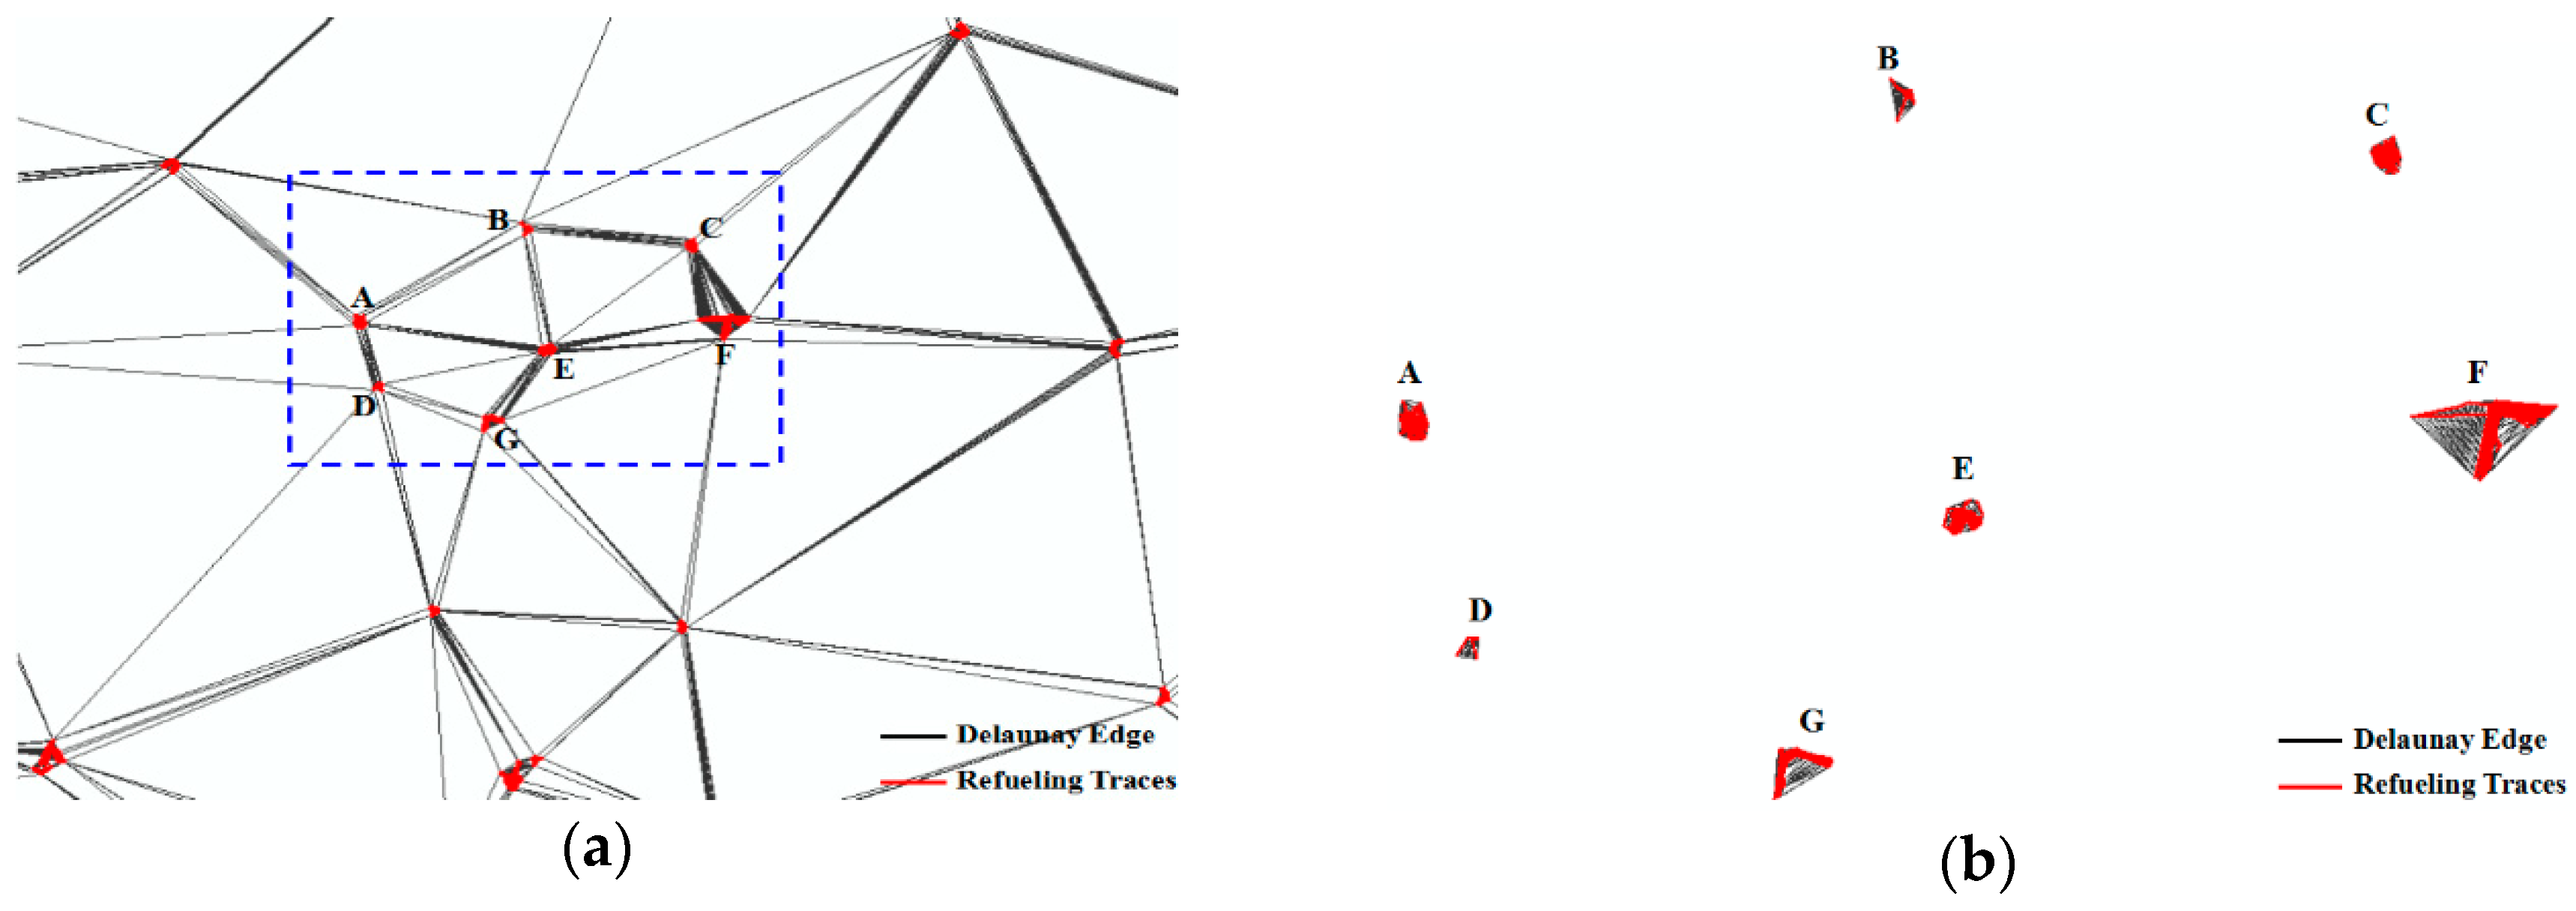
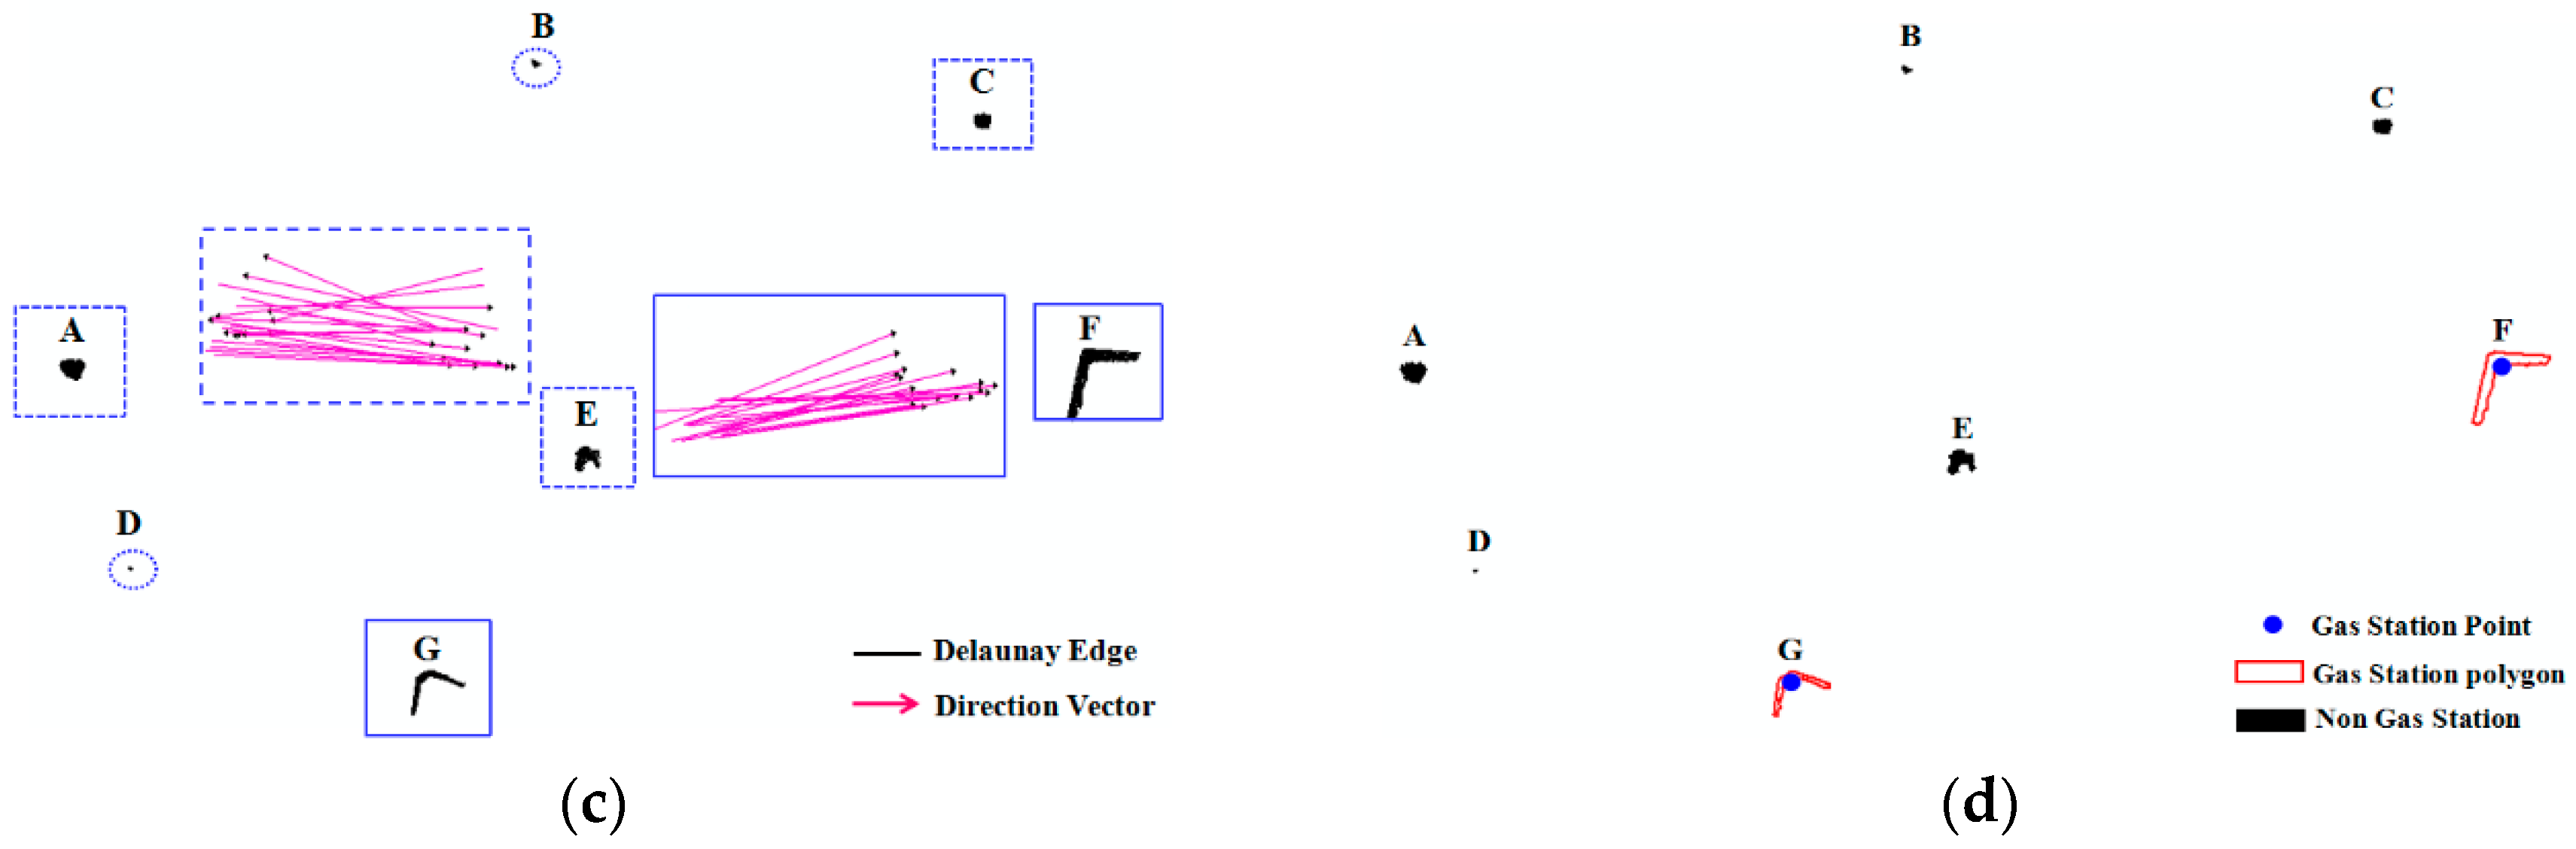
Collective refueling track lines are interpolated by the linear interpolation method [40] first, then constructing the constraint Delaunay triangulation (DT) within interpolation track lines in Figure 4a. Refueling tracks of each gas station are clustered by removing the global long edge of the Delaunay triangulation, and the global long edge threshold is calculated as follows [40,41]:
where, Mean(DT) is the mean length of all edges in DT; Variation(DT) is the standard deviation of the length of all edges in DT; and α is the adjustment factor and is set to 1 by default. The triangle edge will be deleted when the length of the edge is bigger than the GlobalLength. Then, it still needs to delete local long edges in each cluster to extract the gas station polygon accurately, as shown in Figure 4b. The local long edge threshold is calculated as follows [41]:
where, Mean2Gj(pi) is the mean length of the edges formed by the points in the second-order neighbors of pi in the cluster Gj; β is a control factor that is used to control the sensitiveness of the LocalLength(pi); and β is set to 1.5 by default in the work [41]. The triangle edge in a cluster will be deleted when the length of the edge is bigger than the LocalLength. In Figure 4c, the gas station polygons can be extracted by deleting the local long edges.
For a gas station polygon (or a cluster), if it can meet the GS model in Section 3.1.1, the gas station polygon can be used as the gas station, otherwise, the gas station polygon is filtered. In Figure 4c, clusters A, E and C were removed as these clusters could not be used as the gas station according to the track direction (the direction of the collective refueling tracks was not one-way), and the area of polygons B and D was too small to be the gas station. Last, the center point of the gas station polygon was extracted as the gas station point in Figure 4d.
3.2. Attribute and Semantic Information of Gas Station Extraction from Social Media Data
3.2.1. Social Media Data from Dianping
Dianping (www.dazhongdianping.com) [15] is one of the most popular Chinese web forums and service platforms. It provides information based on users’ feedback on the POI such as restaurants, hotels, gas stations, and tourism, etc. Social media data from Dianping includes attribute information (e.g., location, name, address, telephone) and review information (e.g., comments, photographs, videos) of the gas station. Such review data offer good opportunities for researchers to study how humans perceive, experience, and describe the POI point, and consequently to represent place semantics [12]. In particular, the unstructured review text not only includes the overall evaluation of the POI, but also the evaluation of different dimensions (e.g., service, product, etc.) of the POI. The attribute and sentiment semantic information of the POI can provide suggestions for users and managers based on many characters, such as the style of flavor or quality of service.
3.2.2. Attribute and Semantic Information Extraction Using the Text Mining Method
The gas station attribute information includes names, addresses, locations, telephone numbers, and opening times that are extracted from the web pages [15] by a web crawler [1,3]. Meanwhile, the user’s comment text data of each gas station is crawled from Dianping. We aimed to mine the dimensions, along with their sentiments, referred by reviews. Therefore, gas station features were divided into four dimensions: service (e.g., service attitude, management, coupon); environment (e.g., convenient, queuing, area); products (e.g., diesel oil, gas, charge); and subsidiary function (e.g., car washing shop, restroom). The dimension feature dictionary and the sentiment dictionary were constructed using prior knowledge [17,21] and HowNet [42]. Dimensional sentiment information was extracted using the python NLP library, and the steps were as follows:
- Step 1, text reprocessing. Review text reprocessing including sentence segmentation, tokenization, removing stop words, and POS tagging by the NLP module of Python [43].
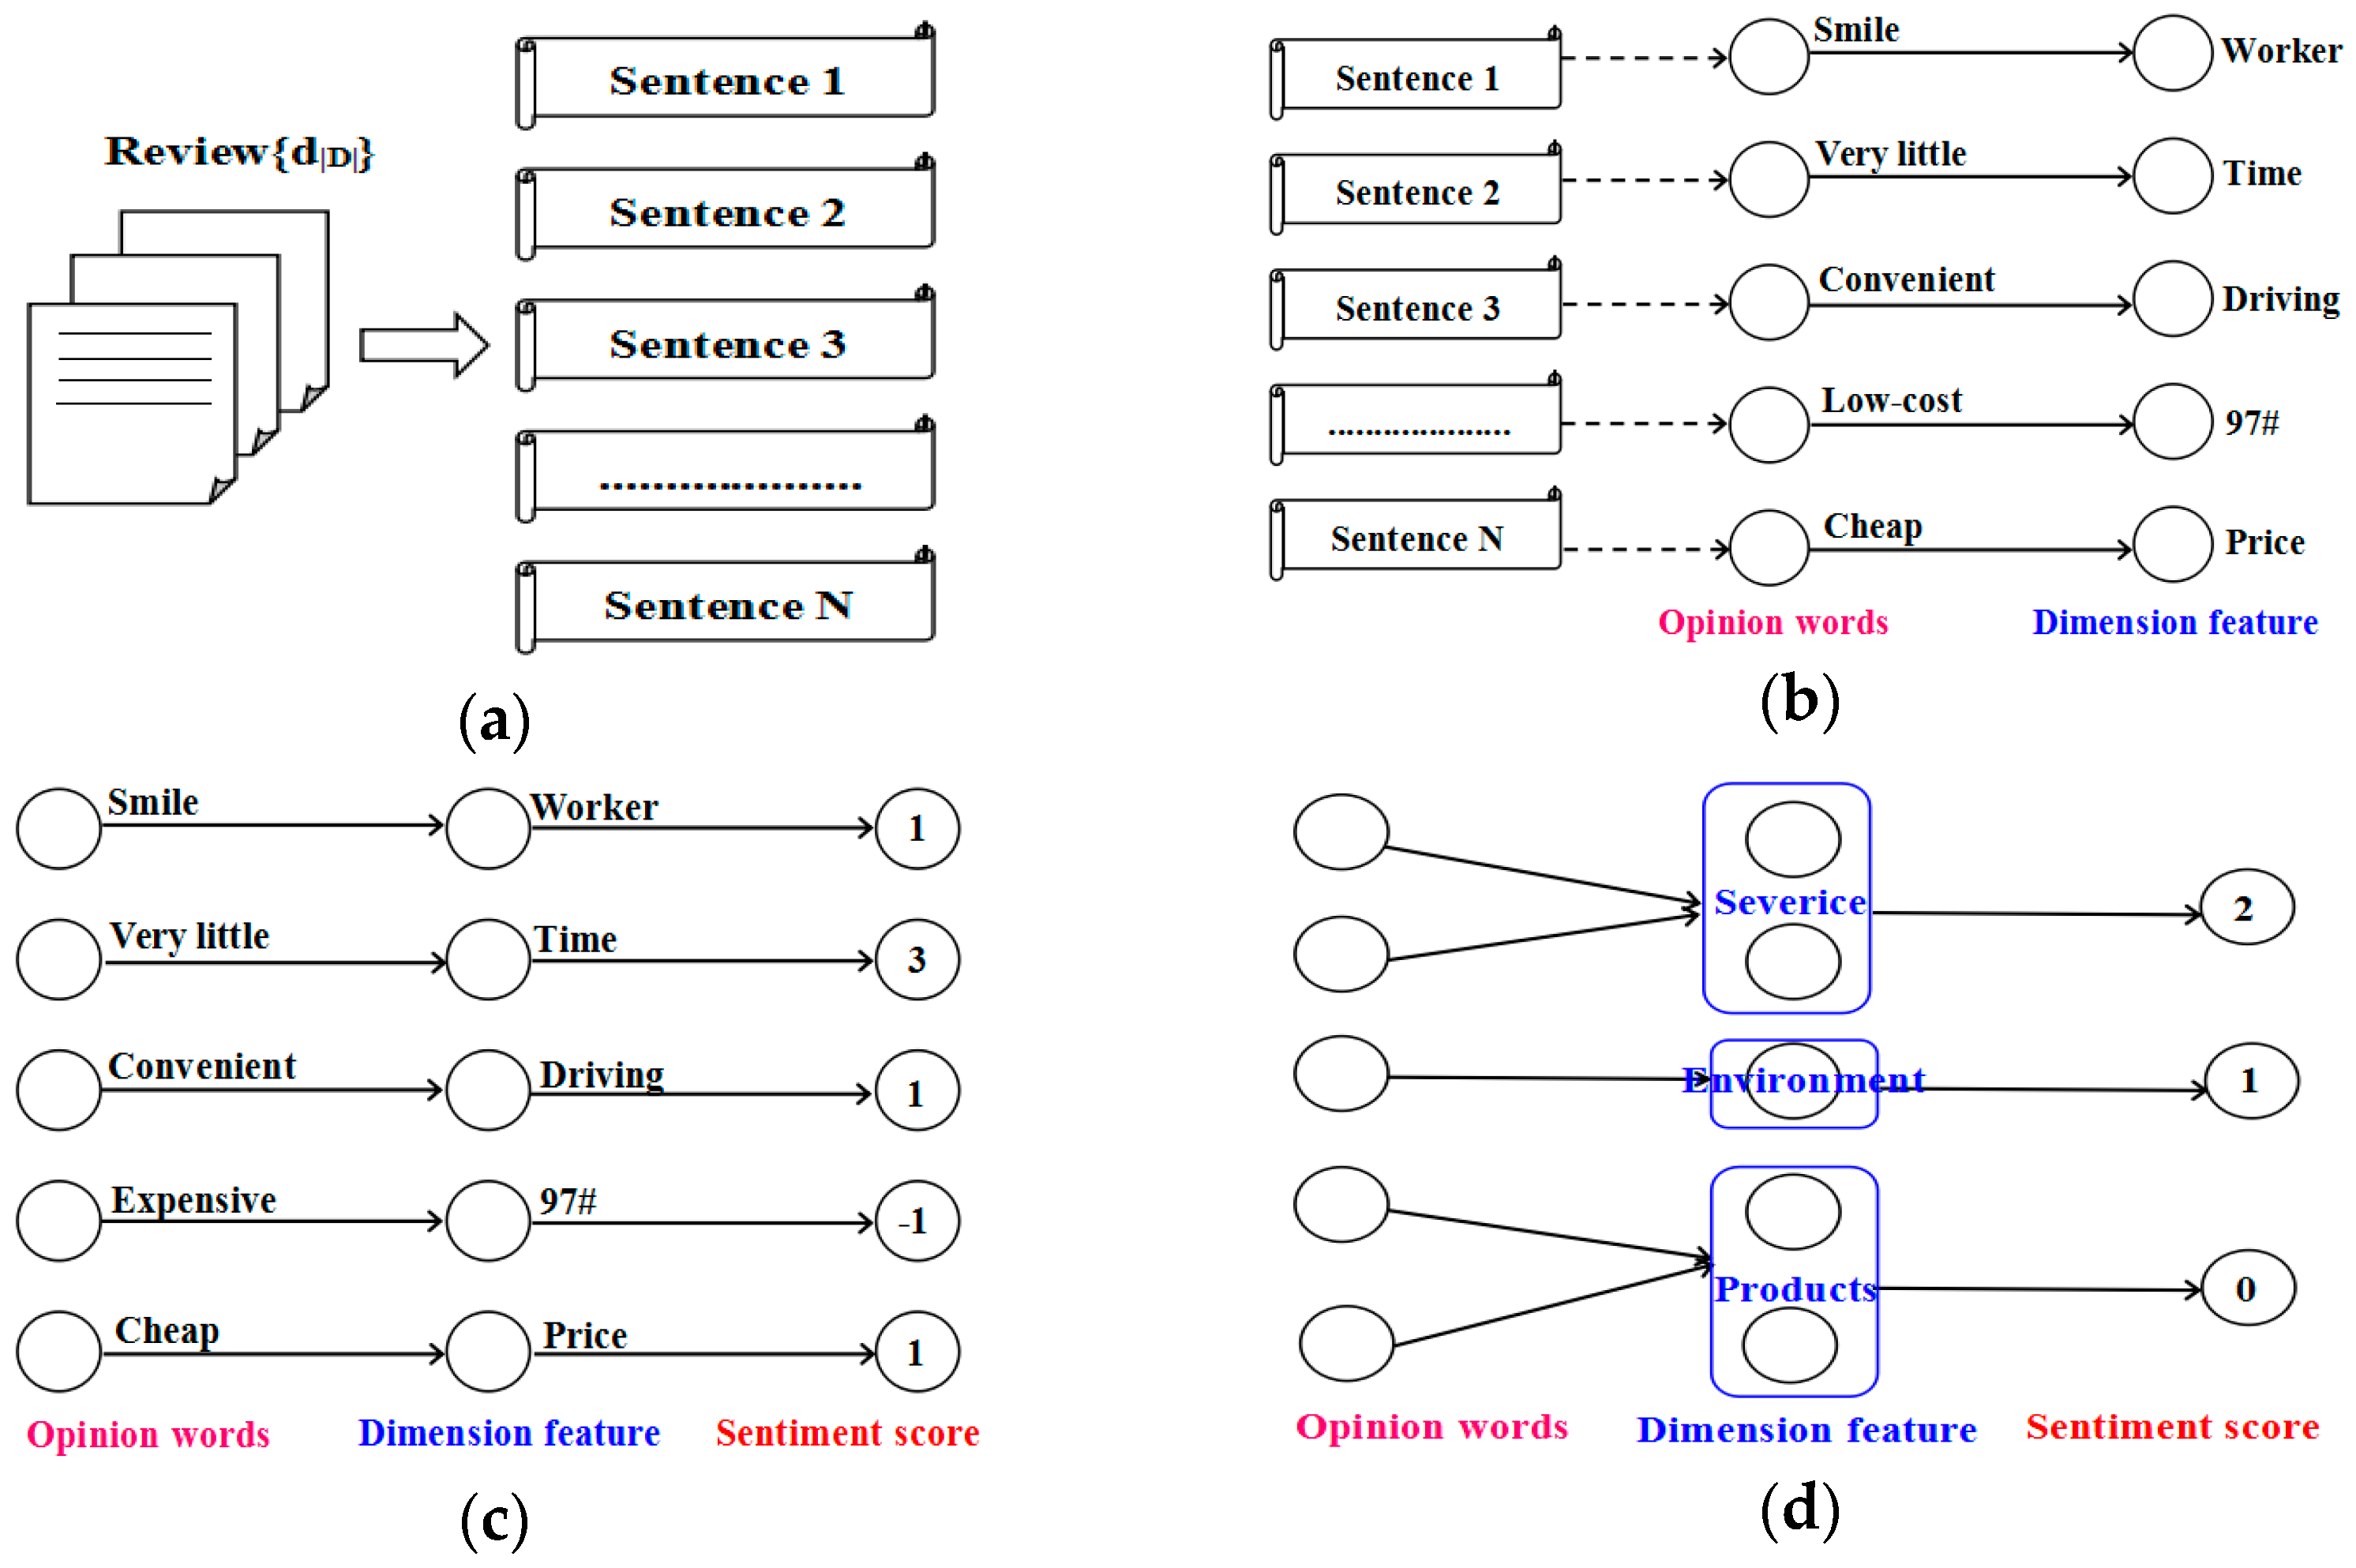
- Step 2, extracting feature-opinion word pairs. The assumption was that each sentence was an evaluation of a dimension of the feature object [44]. The direct links of opinion words (sentiment) and noun words (feature) in a clause, e.g., co-occurrence, were extracted according to syntactic structure and the sentiment dictionary. This step collected all the co-occurrence pairs between noun words and opinion words in sentences and modeled the problem as a bipartite graph, as shown in Figure 5b.
- Step 3, sentiment scores calculation. Each sentence was a sentiment unit, the sentiment values of feature were calculated by considering the effect of opinion words, negative words, and degree words. The sentiment value can be calculated as follows:n is the number of opinion words of the sentence; pi is the sentiment polarity of the sentiment word i; and wi is the degree of the sentiment word i. The sentiment polarity including positive, neutral, and negative [43] and using 1, 0, and −1 to indicate them. The degree words were classified into three grades: strong, middle, and weak, which are presented by 3, 2, and 1 respectively. Then, a tripartite graph was constructed by incorporating the sentiment scores, as shown in Figure 5c.
- Step 4, feature word merging. Considering that different sentences may be the evaluation of the same feature of the gas station, and indirect links between the opinion words and noun words are links through inter-sentences, the feature words of the tripartite graph were merged into four dimensions according to the dimensional dictionary defined previously. In Figure 5d, the dimension sentiment information of the gas station extraction by tripartite graph.
- Step 5, dimension sentiment scores calculation. Dimension sentiment scores were calculated for each dimension in a gas station. Calculation scores in the k dimension of document d as follows:m is the number of sentences in the document d marked with the k dimension. The dimension score of each gas station was obtained, as shown in Figure 5d.
- Step 6, the algorithm was stopped when all the documents of the gas station were processed.
3.3. POI Information Fusion and Enhancement
After removing or fusing the duplicate POI from Dianping (D-POI) by considering both the spatial and attribute information [6], the POI from trace data (T-POI) and D-POI were enhanced by the matching method [6,45]. The buffer zone (the buffer radius was 50m in this work) was established for the T-POI points, and the D-POI falling into the buffer were fused. For the one to zero case, the T-POI data was inserted into the database directly. For the one to one, the center point of the line, which was connected by the two point as the new POI point, and the attribute data were inserted into the database. For the one to many, the center point of the polygon that was constructed by the points as the new POI point, and one of the most complete attribute data was written into the database. The zero to one case was divided into two situations, one was that the D-POI has been dismantled or changed to other types of POI, but the web data have not been updated [6]. Another was that the T-POI has not been extracted, but the D-POI exists in the real world. Therefore, the two situations were separated by deleting the outdated D-POI when no comments of this POI had been made by users in two months.
4. Experimental and Evaluation
4.1. Experimental Data
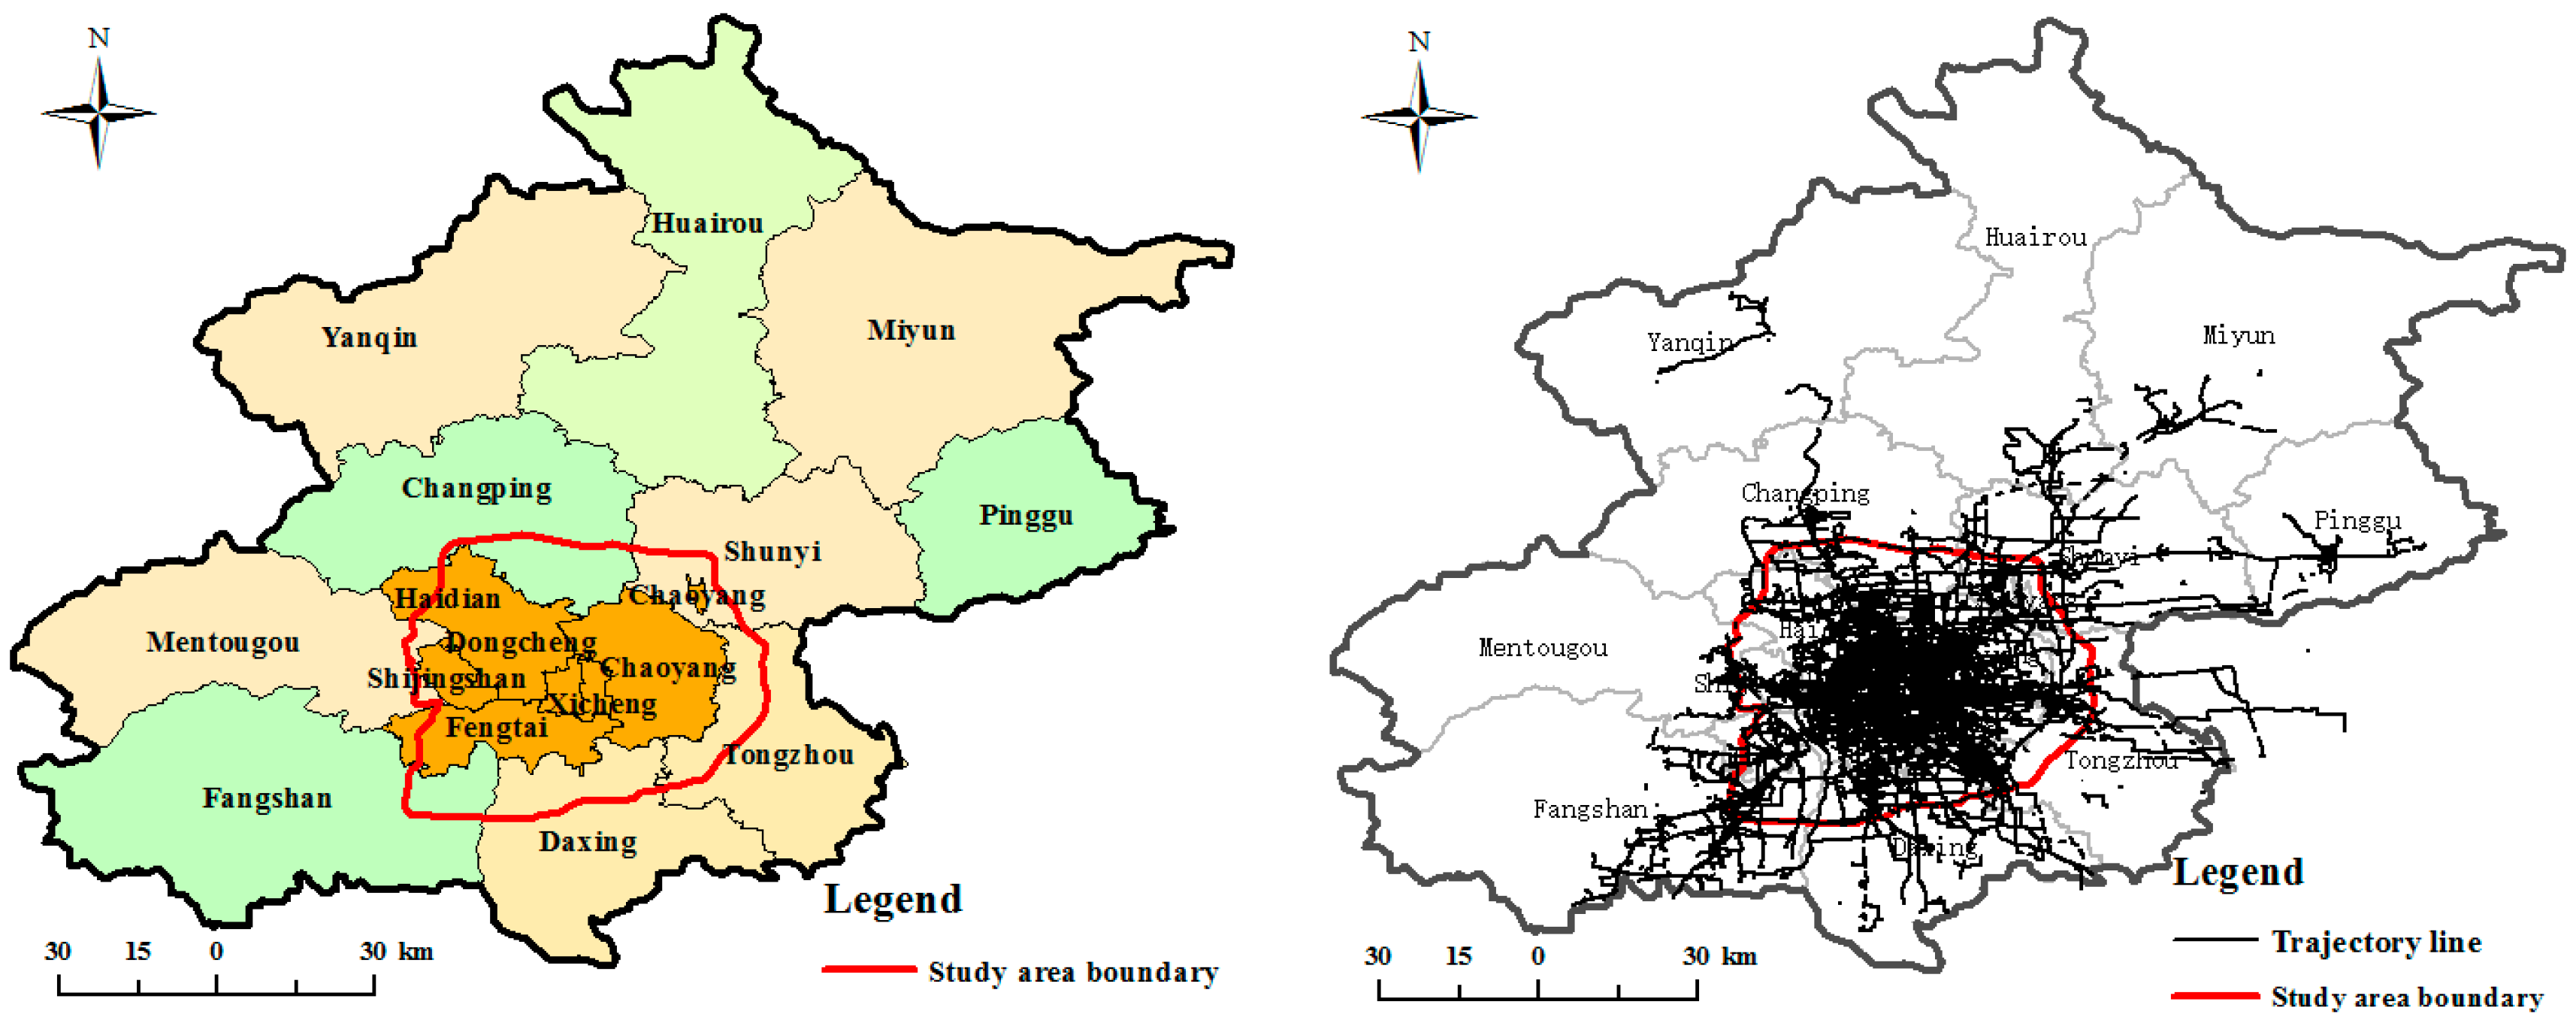
To verify the validity of the proposed approach, taxi GPS trajectory data and social media data from Dianping [15] in Beijing, China were tested. The trajectory data was obtained from the database of the Beijing City government data resources [46], which provided access to trajectory information in Beijing. Taxi GPS trajectory data came from 12,000 taxis that had been equipped with GPS devices for approximately 15 days of daily travel in Beijing. The taxi trajectory dataset contained the following fields: taxi number, latitude, longitude, travel speed, travel direction, and time. The trajectory sampling interval was 10 s–120 s, the average sampling interval was 40 s, the standard deviation was 8.28 s and device positioning accuracy of the data was 10–30 m. In Figure 6, we selected part of Beijing City as our study area, and the trajectory data within this area during the period from 1–15 November 2015 were gathered to detect refueling events and extract the gas station. The social media data, including basic information and review text of the gas station stated in Section 3.2.1, were uploaded by users and is chosen as our second study dataset. For the ground truth data, we selected gas station POI data obtained from the National Geomatics Center of China. There were 820 gas stations in our study area, and the data included location, name, address, type, and telephone.
4.2. Refueling Stop Events Extraction Experimental and Evaluation
In this section, two groups of experiments were designed to test the performance of the VSLC through a comparison to the three other algorithms: K-Medoids, DJ-Cluster [24], and CB-SMoT [25]. The details of the two trajectory datasets are presented in Table 1, where the “stops” column gives the number of manually labeled stops in each dataset. Dataset 1 contained 50 taxis’ data over seven days. The trajectory data was relatively complete, which had a large amount of data. Datasets 2 was selected from Dataset 1, which only contained a day’s trajectory data from five taxis. To evaluate the result correctness and parameter sensitivity, the Precision (P), Recall (R), and F_Measure (F) [25] of the results were calculated by using manually extraction as the evaluation reference.
4.2.1. Evaluation of Refueling Stop Extraction Algorithm
The parameters of the VSLC were determined by the discussion in Section 4.2.2, while the other three algorithms selected parameters according to the optimal value of the Precision, Recall, and F_Measure. Refueling stops of the other three algorithms were obtained from extracted stops by visual approach as these methods cannot automatically extract. The results of the first experiment are listed in Table 2. From the table, K-Medoids, DJ-Cluster and CB-SMoT were more time-consuming than the VSLC algorithm due to their complex computation. In terms of precision, the VSLC was over 0.8, which was significantly larger than the other algorithms. In terms of recall, when compared with the others, the VSLC was slightly improved.
Table 3 shows the second experiment’s results from Dataset 2. As shown in Table 3, the results of the different algorithms were generally in accordance with the results of the first experiment. The VSLC had high precision and recall. The reason for this is that the VSLC algorithm can extract stops from sparse sampling trajectory, while the other three algorithms are suitable for dense sampling trajectories. In addition, the other three algorithms could not extract the refueling stops from trajectory directly, which is the main purpose of the proposed algorithm.
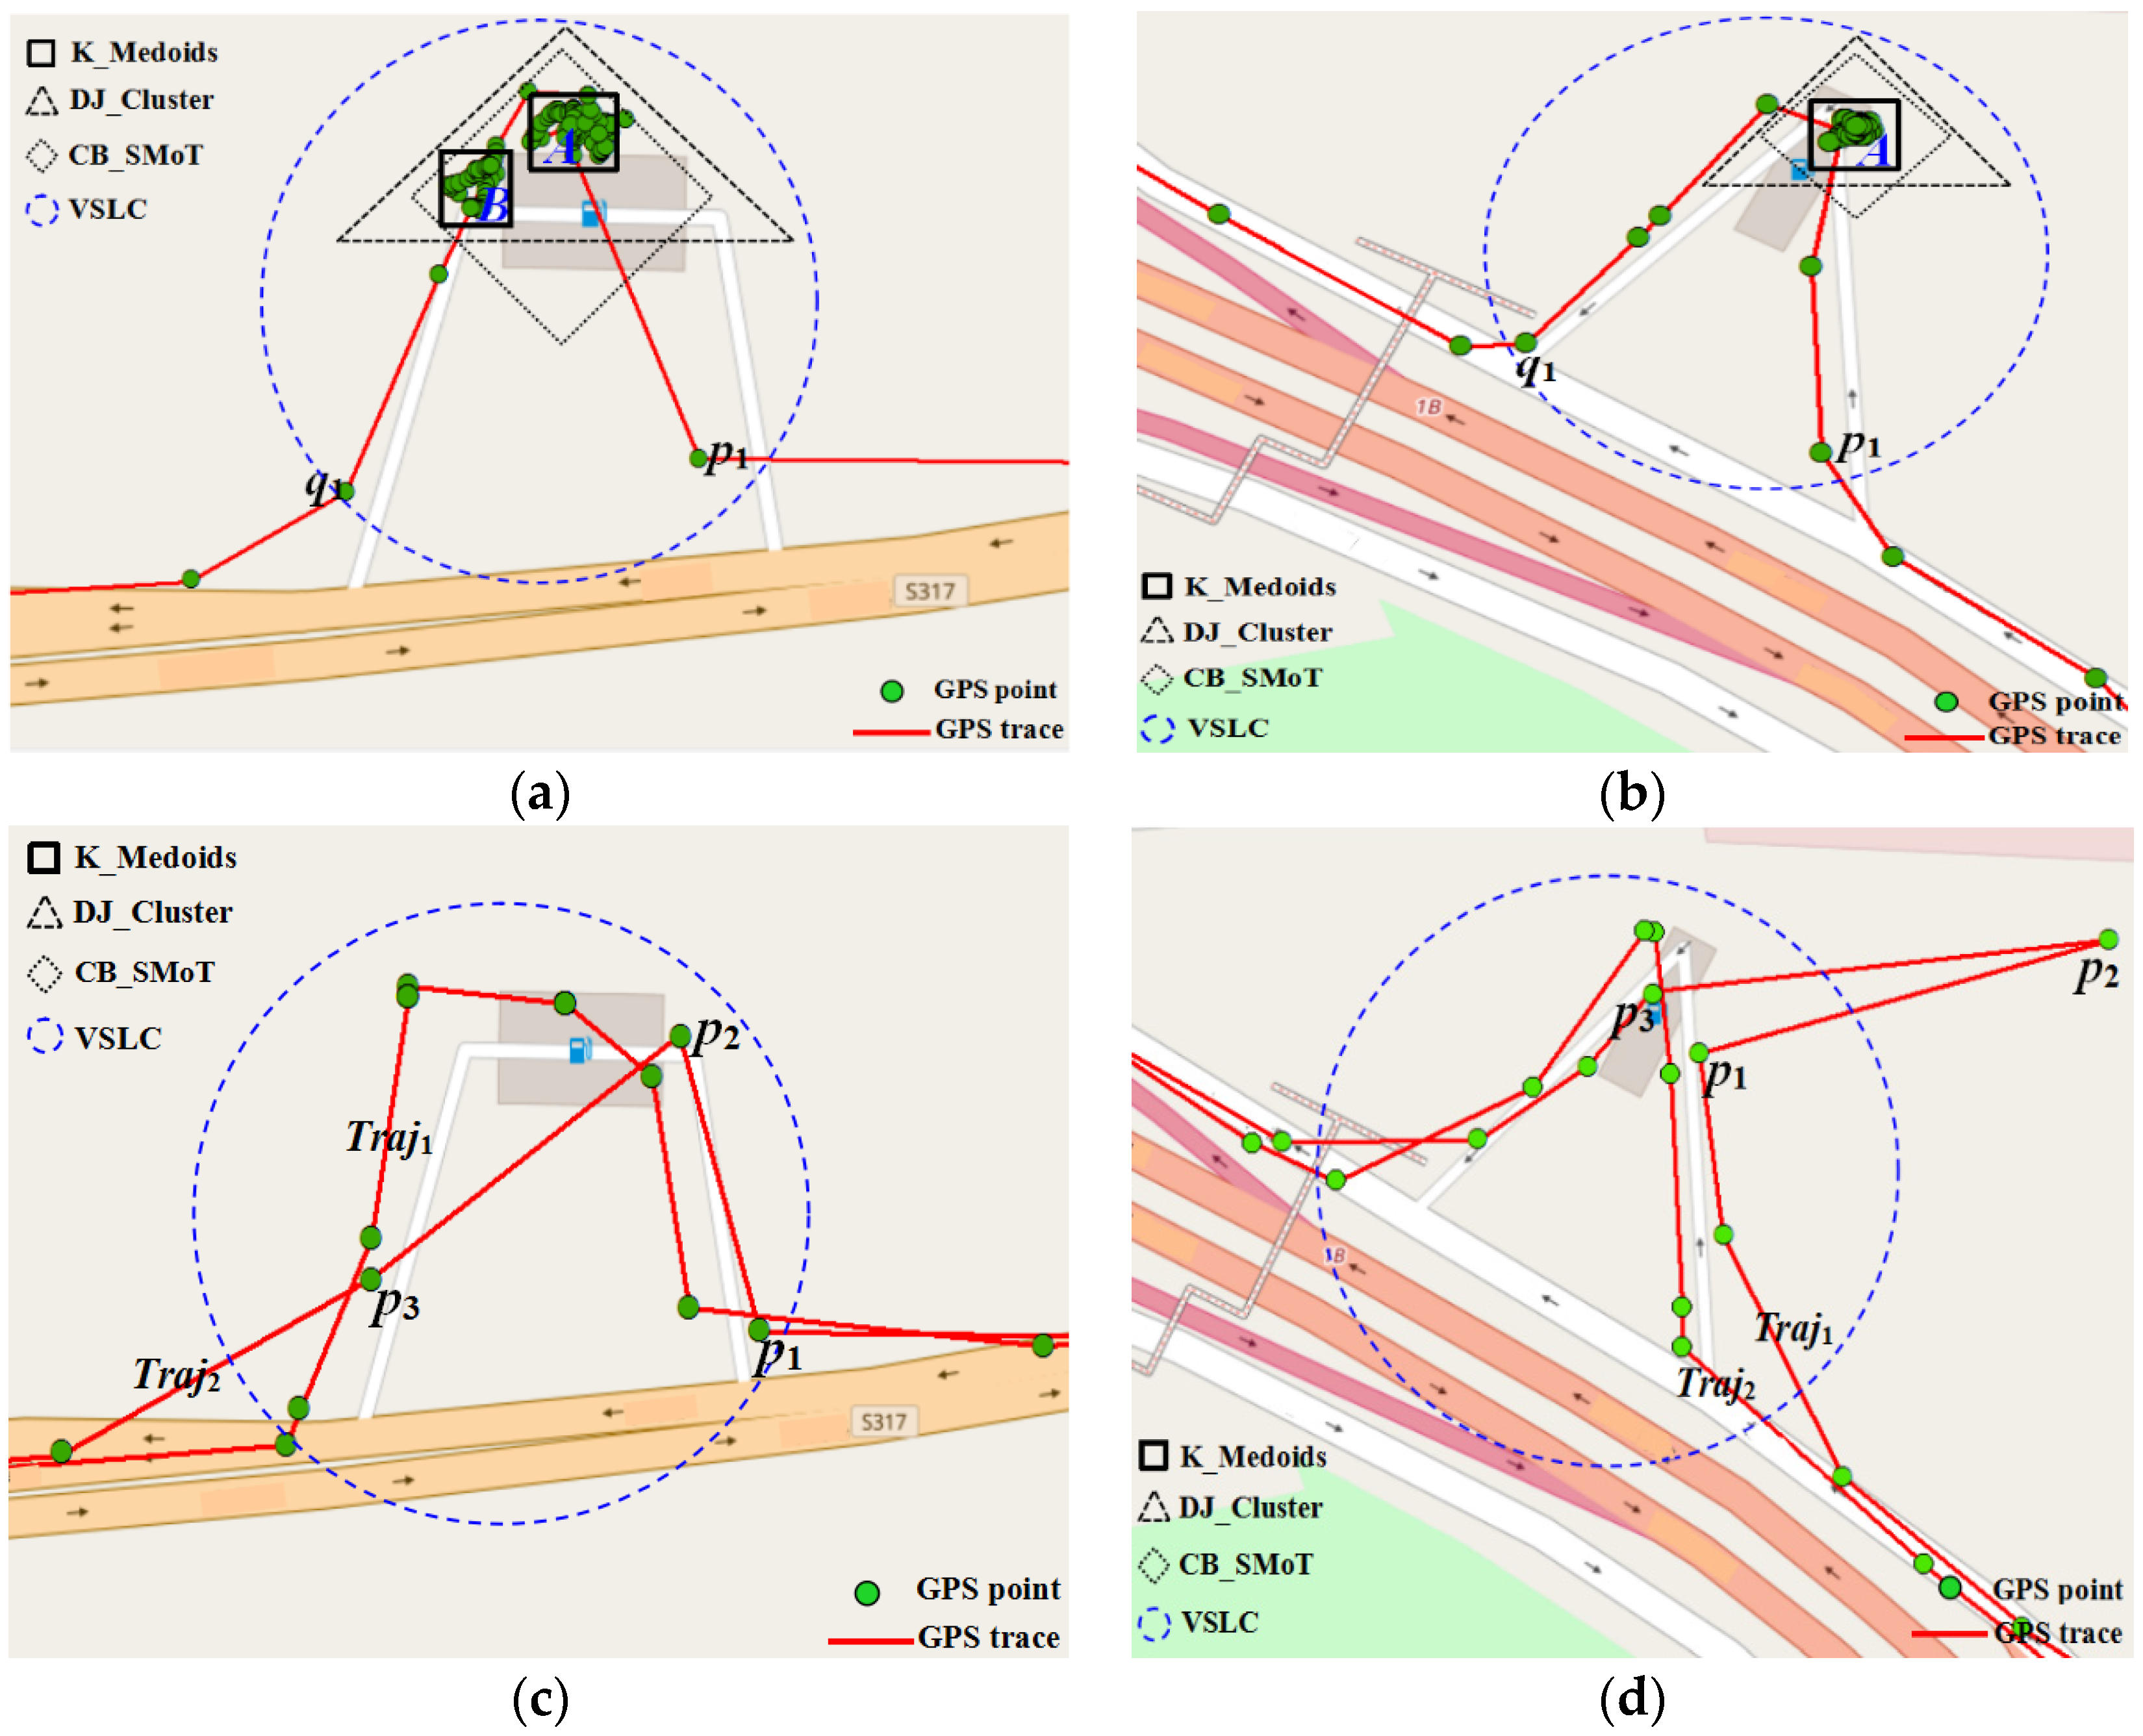
Based on the experimental analysis on different refueling stop models, the results of the comparison between the VSLC and the other three algorithms are shown in Figure 7. In Figure 7a, as the vehicle leaves a large number of stop points in the gas station, the VSLC, CB_SMoT, and DJ_Cluster algorithm could identify this kind of stop, but the K-Medoids algorithm may separate one stay into two stops. Figure 7b shows that many stop points are left when the vehicle enters the gas station, but leaves few stop points when the vehicle is leaving. The four algorithms could identify the type of stop. In Figure 7c–d, the vehicle left few stop points in the gas station, and the K-Medoids and DJ_Cluster algorithm could not extract this kind of stop as the two algorithms are based on density clustering. Although there are only three stop points of traj2 in Figure 7c, this kind of stop could be identified and the stop trajectory could be extracted by the VSLC. The CB_SMoT algorithm could also partially identify the kind of stop, but the method is very sensitive to noise, and GPS points are missing as the method considers only speed when generating stops. Luckily, the VSLC algorithm is adaptable to the noise and missing trajectory points when compared with the CB_SMoT due to considering the stop and move duration. For example, the p2 in Figure 7d was a GPS noise, the trajectory segments p1p2, p2p3 were correctly identified as a stop trajectory segment by the VSLC considering a time duration of p1p3 less than MinMove. Naturally, the refueling event cannot be detected by the four methods when no stop track points are left but the vehicle has a refueling event.
4.2.2. Parameters Setting and Evaluation
A set of experiments were conducted to evaluate the influence of three key parameters on the performance of the VSLC. The first experiments tried to evaluate the influence of MaxAv when MinMove and MinStop were fixed to the default. In Figure 8a, it was very likely to cause more undetected stops when the threshold decreased as the low speed track segments are identified as moving trajectory. Conversely, there were more false positive stops when the threshold increased. In the following two experiments, MinMove and MinStop varied but MaxAv/MinStop and MaxAv/MinMove were fixed to the default. In Figure 8b, the one stop was divided into multiple stops causing a reduction in the accuracy when the MinStop was too short; and some stops could not be extracted leading to a reduced integrity rate when the MinStop was too long. As the MinMove decreased, it was more likely to cause more separated stops and was difficult to process the track noises. In Figure 8b, as the MinMove increased, and the MinMove was larger than 120s, the parameters have little influence on the algorithm results. To summarize, MaxAv and MinStop had a greater influence on the detection results than the MinMove. According to our experiments, the VSLC achieved a desired result when the MaxAv was 1~2 m/s, the MinStop was 240~320 s, and the MinMove was 80~120 s.
4.3. Gas Station Information Enhancement and Evaluation
4.3.1. Gas Station Spatial Information Extraction from Vehicle GPS Trajectories
After preprocessing the raw vehicle traces including range out of bounds, speed anomalies, etc. [29], there were about 77,028,505 trajectory lines in 15 days. According to the described in Section 4.2.2, the threshold of the parameters of the VSLC set included the speed threshold MaxAv at 6 km/h, the MinStop was 300 s and the MinMove was 120 s. Figure 9a shows that about 132,529 stops were extracted from one day trajectory lines by step 4 of the VSLC, and then about 18,686 refueling stop tracks were extracted by step 5 of the VSLC, as shown in Figure 9b–c. The extracted stop tracks have two patterns: a clustering distribution pattern and a single track line scattered distribution in Figure 9c. Gas station polygons were extracted by the constraint Delaunay triangulation in Figure 9d. Non gas station polygons including polygon area were small and the refueling tracks that did not have the same direction were eliminated according to the GS model in Section 3.1.2, as shown in Figure 9e. Finally, 664 gas stations were extracted from 15 days of taxi GPS trajectory lines in Beijing, as shown in Figure 9f. The extracted gas station POI points were distributed between the Fourth ring road and sixth ring road and along the road in Figure 9f, while a few gas stations were extracted in the suburbs (out of the study area) of Beijing.
4.3.2. Gas Station Attribute Semantic Information Extraction from Dianping
Figure 10a shows that the gas station point and the attribute information of the gas station, including name, address, telephone number, and opening time, were extracted from Dianping. A total of 702 gas stations were extracted from the Dianping website, and these gas stations had names and addresses. However, only 392 had a telephone number and only 168 had opening times. Then, all the text comments data of each gas station was crawled from Dianping and taken as the text corpus of the gas station. According to Section 3.3, after preprocessing the review text, we extracted feature-opinion word pairs, merged feature dimensions, and constructed a tripartite graph to calculate the dimension sentiment scores using sentences as analysis units, using the Python NLP tool. In Figure 10b, the different dimension sentiment scores of each gas station are visualized by the bar graph, which is also a good response to the user’s emotion and experience perception of a place. The sentiment semantic information in Figure 10b can provide suggestions and recommendations for gas station management. However, some gas stations did not have or have had only part of the dimension emotional information due to sparse and incomplete comment text (Figure 10b). Although the total number of gas stations extracted from social media data is more than that extracted by the taxi tracks, the correctness was not high, and included some duplicate points (Figure 10b) and outdated points as stated in Section 4.3.3.
4.3.3. Final Gas Station POI Map and Evaluation
The spatial and the attribute semantic information extracted from the different sources were fused by constructing the 50 m buffer for the extracted gas station point. After 86 gas stations included duplicate points and the outdated points were filtered using matching detection, the POI data of 742 gas stations was enhanced to construct the gas station POI map by the vehicle GPS trajectory and the social media data, as shown in Figure 11a. The enhanced POI information included both spatial and attribute semantic information (name, address, telephone, opening time, and dimension evaluation). Attribute information of the gas station, such as names, are displayed in Figure 11b. However, a small number of gas stations had no names due to the limitations of the data. We could see the user’s perception difference of different dimension features of gas station, shown in Figure 11c–d. The gas stations can be classified according to dimension sentiment score. Taking the service dimension as an example in Figure 11d, we discovered the spatial distribution of the worst or the best service of gas stations, which can provide suggestions and recommendations for management. Moreover, gas stations can be divided into diesel oil, gasoline (includes 90#, 92#, 95#, 93#, 97#, 98#), charge and mixing type, according to the extracted product feature words.
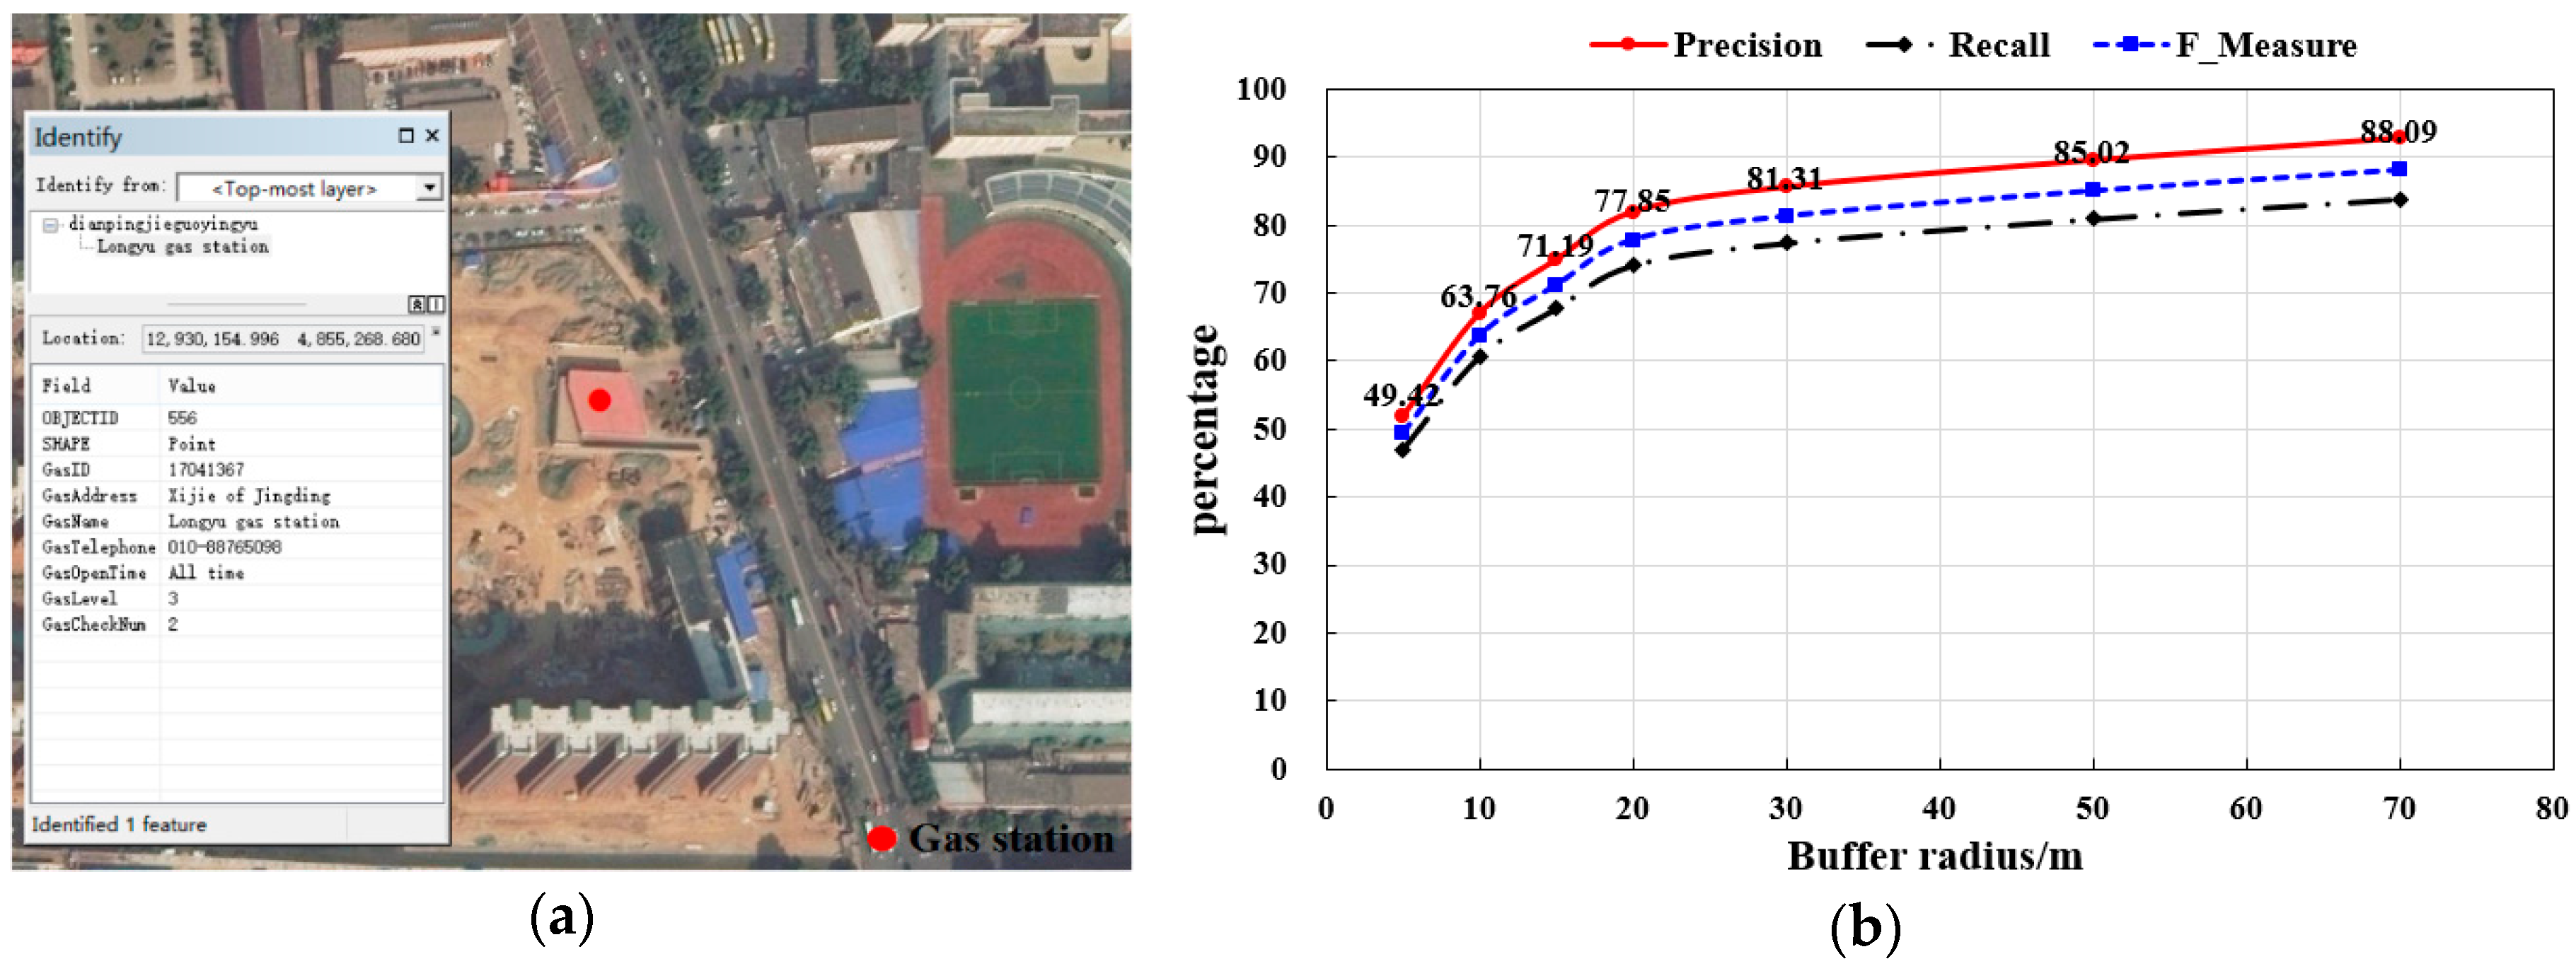
As a qualitative evaluation of the results, the generated gas station point was overlaid on a GoogleEarth image of the corresponding area to check its correctness by visual inspection, as shown in Figure 12a. Of the 742 extracted gas stations, 694 were correct, 48 were wrong, and the accuracy was 93.5%. There were 820 gas stations in the study area. 126 gas stations were not extracted and the integrity rate of the results was 84.6%. Part of the gas station was wrong or un-extracted for two reasons: First, the limitations of GPS trace data. The gas station that can be extracted requires a certain amount of trace. In this work, we only used 15 days of taxi GPS trace, and some gas stations could not be extracted. By using long time series vehicle tracks or multi-type vehicle traces, this problem can be solved in future research. Second, the method for mining social media data should be improved. The POI data of one website were not complete and up to date. Meanwhile, there were a few duplicate points and outdated points that could not be detected by our method. Therefore, the future works including multi-web data fusion and deeply mining comment text data to perceive dynamic changes of POIs need to further study.
To quantitatively evaluate the location accuracy of gas station points, buffer zones with different buffer radiuses were established to match the extraction results based on ground truth data. The number of gas stations that fell into the buffer zone were counted and the statistical results are shown in Figure 12b. The number of gas stations in the high precision range of 5 m reached 52.02%, and the number of gas stations within the range of 30 m precision reached 85.58%. The accuracy of some gas stations was less than 30 m, which was due to the influence of the GPS positioning errors, including trajectory drift or noises and the amount of track data. Few gas stations could not match the reference data, which may have been caused by the POI demolition or the incompleteness of the reference data, but this indicates that the result can be used for POI data update.
The extracted attribute data was compared with the reference data to detect its correctness, as shown in Table 4. We could see that the accuracy of the attribute information extracted by our method had a higher accuracy but lower integrity from Table 4. Moreover, the opening time and sentiment semantic information were extracted by our method, which was difficult to obtain from the traditional authority data. However, partial attribute data and sentiment information could not be extracted, resulting in incomplete data for two reasons: One was that the new POI from GPS trace were added but were without attribute data, as the social media data had not been updated. Although data were incomplete, it could tell where there were new POIs and make field surveys. Another was that few gas stations were unable to extract semantic information without a review text.
4.4. Discussion
As our evaluation results indicated, this novel method of taking vehicle tracks and social media data as input for enhancing gas station information, including spatial, attribute, and sentiment semantic information, was validated as an effective approach. Compared with collaborative mapping programs, our method required less manual work for contributors. However, it was clear that as both the trajectory data and text data are complicated, the following problems are worth discussing:
- First, some gas stations were not extracted due to only using taxi GPS traces. It needs to use multiple sources of trajectory data (e.g., car, electric vehicle GPS trace) to detect more refueling stop events. How to accurately detect refueling events and extract gas stations from different sources of trace data, since the positioning accuracy or sampling frequency might be variable in different datasets, is still a challenge [32].
- Second, mining unstructured comment data is a significant challenge. In this work, mining sentiment information by constructing an emotion and feature dictionary that used sentences as a unit. However, it needs prior knowledge and manual operation. Further work needs to improve the sentiment semantic mining method, such as using a Deep Learning [33] technology.
- Third, the attribute semantic information of the experimental results was still incomplete. As social UGC data are added by non-professional volunteers, some gas stations did not have attributes, comments or only part of attributes, which resulted in the extraction attribute semantic information being incomplete and inaccurate. Multi-web sources and multimodal data (such as video, photos) need to be fused to extract more detailed attribute data [6,33].
- Four, mining hidden information, such as the detection of outdated POI, POI demolition, POI temporary maintenance, and POI change relations [6], etc. In this paper, it was far from enough to use the time information of the comments and vehicle tracks to detect outdated POI. Identifying outdated or emerging POI relations is an important future work to enhance the POI data quality. Moreover, UGC review data and other VGI data should be integrated to perceive the temporal dynamic change of the POI place attribute semantic in the future.
5. Conclusions and Future Work
A POI database that contains spatial (such as locations) and attribute semantic information (such as names, addresses, descriptions) to support user queries is especially useful. However, using a low cost and fast method to obtain up-to-date, high quality, and rich semantics of POI data is very challenging. Currently, VGI data (e.g., GPS trace data, social media data, etc.) open a new horizon for POI data extraction, updating and enhancement. However, a single type of VGI data has its own drawbacks. For example, GPS track data lack semantic information, while social media data have problems, such as being outdated and varying significantly in quality and accuracy. Multisourced VGI data should be fused to enhance POI information. Therefore, this article developed a new approach to enhance and update gas station data by coupling sparse trajectory data and social media data. The method was validated and evaluated using taxi GPS trace data and social media data from Dianping in Beijing. The results showed that the proposed method improved the coverage and richness of gas station information when compared with the authority data. It was demonstrated to be useful for data enhancement and data updating when handling the VGI data in a feasible way.
Furthermore, there are still some problems that should be tackled to improve the usability of the proposed method. First, the complexity of social media text data requires more new technology, such as machine learning and deep learning to improve accuracy. Second, how to evaluate and analyze the data quality of different sources to provide decisions for multi-source data fusion is an important future task. Although much more work needs to be conducted, this work lays the foundation for automatically enhancing POI information from VGI data and can also be applied in POI map updating.
Author Contributions
W.Y. and T.A. together conceived and designed the study; W.Y. collected the data, designed the experiments, and wrote the manuscript; W.Y. and T.A. read and approved the manuscript.
Acknowledgments
This research was supported by the National Key Research and Development Program of China (Grant No. 2017YFB0503500), and the National Natural Science Foundation of China (Grant No. 41531180).
Conflicts of Interest
The authors declare no conflict of interest.
References
- Chuang, H.M.; Chang, C.H.; Kao, T.Y.; Cheng, C.T.; Huang, Y.Y.; Cheong, K.P. Enabling maps/location searches on mobile devices: Constructing a POI database via focused crawling and information extraction. Int. J. Geogr. Inf. Sci. 2016, 30, 1405–1425. [Google Scholar] [CrossRef]
- Liu, Y.; Seah, H.S. Points of interest recommendation from GPS trajectories. Int. J. Geogr. Inf. Sci. 2015, 29, 953–979. [Google Scholar] [CrossRef]
- Chang, C.H.; Chuang, H.M.; Huang, C.Y.; Su, Y.S.; Li, S.Y. Enhancing POI search on maps via online address extraction and associated information segmentation. Appl. Intell. 2016, 44, 539–556. [Google Scholar] [CrossRef]
- Wang, J.; Wang, C.; Song, X.; Raghavan, V. Automatic intersection and traffic rule detection by mining motor-vehicle GPS trajectories. Comput. Environ. Urban Syst. 2017, 64, 19–29. [Google Scholar] [CrossRef]
- Touya, G.; Antoniou, V.; Olteanu-Raimond, A.M.; Van Damme, M.D. Assessing crowdsourced POI quality: Combining methods based on reference data, history, and spatial relations. ISPRS Int. J. Geo-Inf. 2017, 6, 80. [Google Scholar] [CrossRef]
- Lamprianidis, G.; Skoutas, D.; Papatheodorou, G.; Pfoser, D. Extraction, integration and analysis of crowdsourced points of interest from multiple web sources. In Proceedings of the 3rd ACM SIGSPATIAL International Workshop on Crowdsourced and Volunteered Geographic Information, Dallas, TX, USA, 4–8 November 2014; pp. 16–23. [Google Scholar]
- Mazimpaka, J.D.; Timpf, S. Trajectory data mining: A review of methods and applications. J. Spat. Inf. Sci. 2016, 13, 61–99. [Google Scholar] [CrossRef]
- Shan, Z.; Wu, H.; Sun, W.; Zheng, B. COBWEB: A robust map update system using GPS trajectories. In Proceedings of the 2015 ACM International Joint Conference on Pervasive and Ubiquitous Computing, Grand Front Osaka, Umeda, Japan, 7–11 September 2015; pp. 927–937. [Google Scholar]
- Reinoso, F.; Ariza-López, J.; Barrera, D. A fitted B-spline method to derive a representative 3D axis from a set of multiple road traces. Geocarto Int. 2016, 31, 832–844. [Google Scholar] [CrossRef]
- Yang, W.; Ai, T.; Lu, W. A Method for Extracting Road Boundary Information from Crowdsourcing Vehicle GPS Trajectories. Sensors 2018, 18, 1261. [Google Scholar] [CrossRef] [PubMed]
- Siła-Nowicka, K.; Vandrol, J.; Oshan, T. Analysis of human mobility patterns from GPS trajectories and contextual information. Int. J. Geogr. Inf. Sci. 2016, 30, 881–906. [Google Scholar] [CrossRef]
- Chuang, H.M.; Chang, C.H. Verification of poi and location pairs via weakly labeled web data. In Proceedings of the 24th International Conference on World Wide Web, Florence, Italy, 18–22 May 2015; pp. 743–748. [Google Scholar]
- Rattenbury, T.; Naaman, M. Methods for extracting place semantics from Flickr tags. ACM Trans. Web 2009, 3, 1. [Google Scholar] [CrossRef]
- Steiger, E.; Albuquerque, J.P.; Zipf, A. An advanced systematic literature review on spatiotemporal analyses of Twitter data. Trans. GIS 2015, 19, 809–834. [Google Scholar] [CrossRef]
- DianPing. Available online: htpp://www.dianping.com (accessed on 5 May 2018).
- Tu, W.; Cao, J.; Yue, Y.; Shaw, S.-L.; Zhou, M.; Wang, Z.; Chang, X.; Xu, Y.; Li, Q. Coupling mobile phone and social media data: A new approach to understanding urban functions and diurnal patterns. Int. J. Geogr. Inf. Sci. 2017, 31, 2331–2358. [Google Scholar] [CrossRef]
- Liu, H.; Kan, Z.; Wu, H.; Tang, L. Vehicle’ Refueling Activity Modeling and Space-time Distribution Analysis. Bull. Surv. Mapp. 2016, 9, 29–34. [Google Scholar]
- Spaccapietra, S.; Parent, C.; Damiani, M.L.; Macedo, J.A.D.; Porto, F.; Vangenot, C. A conceptual view on trajectories. Data Knowl. Eng. 2008, 65, 126–146. [Google Scholar] [CrossRef] [Green Version]
- Alvares, L.O.; Bogorny, V.; Kuijpers, B.; de Macedo, J.A.F.; Moelans, B.; Vaisman, A. A model for enriching trajectories with semantic geographical information. In Proceedings of the 15th annual ACM international symposium on Advances in geographic information systems, Seattle, WA, USA, 7–9 November 2007; p. 22. [Google Scholar]
- Xie, K.; Deng, K.; Zhou, X. From trajectories to activities: A spatio-temporal join approach. In Proceedings of the 2009 ACM International Workshop on Location Based Social Networks, Seattle, WA, USA, 3 November 2009; pp. 25–32. [Google Scholar]
- Niu, H.; Liu, J.; Fu, Y.; Liu, Y.; Lang, B. Exploiting human mobility patterns for gas station site selection. In Proceedings of the International Conference on Database Systems for Advanced Applications, Dallas, TX, USA, 16–19 April 2016. [Google Scholar]
- Ashbrook, D.; Starner, T. Using GPS to learn significant locations and predict movement across multiple users. Pers. Ubiquitous Comput. 2003, 7, 275–286. [Google Scholar] [CrossRef]
- Ester, M.; Kriegel, H.-P.; Sander, J.; Xu, X. A Density-Based Algorithm for Discovering Clusters in Large Spatial Databases with Noise; KDD: Portland, OR, USA, 1996; pp. 226–231. [Google Scholar]
- Zhou, C.; Frankowski, D.; Ludford, P.; Shekhar, S.; Terveen, L. Discovering personally meaningful places: An interactive clustering approach. ACM Trans. Inf. Syst. 2007, 25, 12. [Google Scholar] [CrossRef]
- Palma, A.T.; Bogorny, V.; Kuijpers, B.; Alvares, L.O. A clustering-based approach for discovering interesting places in trajectories. In Proceedings of the 2008 ACM Symposium on Applied Computing, Fortaleza, Brazil, 16–20 March 2008; pp. 863–868. [Google Scholar]
- Rocha, J.A.M.; Times, V.C.; Oliveira, G.; Alvares, L.O.; Bogorny, V. DB-SMoT: A direction-based spatio-temporal clustering method. In Proceedings of the 2010 5th IEEE International Conference Intelligent Systems, London, UK, 7–9 July 2010; pp. 114–119. [Google Scholar]
- Zhao, X.-L.; Xu, W.-X. A clustering-based approach for discovering interesting places in a single trajectory. In Proceedings of the 2009 IEEE Second International Conference on Intelligent Computation Technology and Automation, ICICTA 2009, Zhangjiajie, China, 10–11 October 2009; pp. 429–432. [Google Scholar]
- Luo, T.; Zheng, X.; Xu, G.; Fu, K.; Ren, W. An improved DBSCAN algorithm to detect stops in individual trajectories. ISPRS Int. J. Geo-Inf. 2017, 6, 63. [Google Scholar] [CrossRef]
- Xiang, L.; Gao, M.; Wu, T. Extracting stops from noisy trajectories: A sequence oriented clustering approach. ISPRS Int. J. Geo-Inf. 2016, 5, 29. [Google Scholar] [CrossRef]
- Fu, Z.; Tian, Z.; Xu, Y.; Qiao, C. A two-step clustering approach to extract locations from individual GPS trajectory data. ISPRS Int. J. Geo-Inf. 2016, 5, 166–183. [Google Scholar] [CrossRef]
- Zhang, F.; Yuan, N.J.; Wilkie, D.; Zheng, Y.; Xie, X. Sensing the Pulse of Urban Refueling Behavior: A Perspective from Taxi Mobility. ACM Trans. Intell. Syst. Technol. 2015, 6, 37. [Google Scholar] [CrossRef]
- Li, J.; Qin, Q.; Han, J.; Tang, L.A.; Lei, K.H. Mining trajectory data and geotagged data in social media for road map inference. Trans. GIS 2015, 19, 1–18. [Google Scholar] [CrossRef]
- Qian, X.; Lu, X.; Han, J.; Du, B.; Li, X. On Combining Social Media and Spatial Technology for POI Cognition and Image Localization. Proc. IEEE 2017, 105, 1937–1952. [Google Scholar] [CrossRef]
- Spyrou, E.; Korakakis, M.; Charalampidis, V.; Psallas, A.; Mylonas, P. A Geo-Clustering Approach for the Detection of Areas-of-Interest and Their Underlying Semantics. Algorithms 2017, 10, 35. [Google Scholar] [CrossRef]
- Liu, J.; Huang, Z.; Chen, L.; Shen, H.; Yan, Z. Discovering areas of interest with geo-tagged images and check-ins. In Proceedings of the 20th ACM international conference on Multimedia, Nara, Japan, 29 October–2 November 2012; pp. 589–598. [Google Scholar]
- Dokuz, A.S.; Celik, M. Discovering socially important locations of social media users. Expert Syst. Appl. 2017, 86, 113–124. [Google Scholar] [CrossRef]
- Liu, X.; He, J.; Yao, Y.; Zhang, J.; Liang, H.; Wang, H.; Hong, Y. Classifying urban land use by integrating remote sensing and social media data. Int. J. Geogr. Inf. Sci. 2017, 31, 1675–1696. [Google Scholar] [CrossRef]
- Dodge, S.; Weibel, R.; Forootan, E. Revealing the physics of movement: Comparing the similarity of movement characteristics of different types of moving objects. Comput. Environ. Urban Syst. 2009, 33, 419–434. [Google Scholar] [CrossRef] [Green Version]
- Ministry of Housing and Urban and Rural Construction in People’s Republic of China; State Administration of Quality Supervision, Inspection and Quarantine of People’s Republic of China. Code for Design and Construction of Filling Station: GB 50156-2012; China Planning Press: Beijing, China, 2012.
- Yang, W.; AI, T. Road centerline rxtraction from crowdsoucing trajectory data. Geogr. Geo-Inf. Sci. 2016, 32, 1–7. [Google Scholar]
- Deng, M.; Liu, Q.; Cheng, T.; Shi, Y. An adaptive spatial clustering algorithm based on Delaunay triangulation. Comput. Environ. Urban Syst. 2011, 35, 320–332. [Google Scholar] [CrossRef]
- Peng, H.; Cambria, E.; Hussain, A. A review of sentiment analysis research in Chinese language. Cogn. Comput. 2017, 9, 423–435. [Google Scholar] [CrossRef]
- Resch, B.; Usländer, F.; Havas, C. Combining machine-learning topic models and spatiotemporal analysis of social media data for disaster footprint and damage assessment. Cartogr. Geogr. Inf. Sci. 2017, 45, 362–376. [Google Scholar] [CrossRef]
- Yang, L.; Liu, B.; Lin, H.; Lin, Y. Combining local and global information for product feature extraction in opinion documents. Inf. Process. Lett. 2016, 116, 623–627. [Google Scholar] [CrossRef]
- McKenzie, G.; Janowicz, K.; Adams, B. A weighted multi-attribute method for matching user-generated points of interest. Cartogr. Geogr. Inf. Sci. 2014, 41, 125–137. [Google Scholar] [CrossRef]
- Database of Beijing City Government Data Resources. Available online: http://www.bjdata.gov.cn/ (accessed on 5 May 2018).
Figure 1.
General workflow of gas station information enhancement.

Figure 2.
Analysis of trajectory features of an individual refueling stop track. (a) Refueling stop track of individual vehicle; (b) Stop/Move pattern of refueling stops; (c) Average velocity and velocity change; (d) Direction and direction change.
Figure 2.
Analysis of trajectory features of an individual refueling stop track. (a) Refueling stop track of individual vehicle; (b) Stop/Move pattern of refueling stops; (c) Average velocity and velocity change; (d) Direction and direction change.

Figure 3.
Refueling stop sub-tracks extraction by the Velocity Sequence Linear Clustering (VSLC) algorithm.
Figure 3.
Refueling stop sub-tracks extraction by the Velocity Sequence Linear Clustering (VSLC) algorithm.

Figure 4.
Refueling stop track lines clustering and gas station information extraction. (a) Constructing a Delaunay triangulation (DT) within interpolated stop tracks; (b) Removing global long edge of DT; (c) Non gas station deleting by gas station model; (d) Gas station polygon and point extraction.


Figure 5.
Dimension semantic information of gas station extraction. (a) Review text of a gas station; (b) Extracts feature-opinion word pairs; (c) Sentiment scores of each sentence calculation; and (d) Construct tripartite graph of dimension sentiment.
Figure 5.
Dimension semantic information of gas station extraction. (a) Review text of a gas station; (b) Extracts feature-opinion word pairs; (c) Sentiment scores of each sentence calculation; and (d) Construct tripartite graph of dimension sentiment.

Figure 6.
Experimental area (left) and vehicle GPS trajectory data (right).

Figure 7.
Comparison analysis of the refueling stops extraction results of the different algorithm. (a) Vehicle leaves many stop points; (b) Vehicle leaves many stop points only when entering gas station; (c) Few stop points and track points missing; and (d) Trajectory noises.
Figure 7.
Comparison analysis of the refueling stops extraction results of the different algorithm. (a) Vehicle leaves many stop points; (b) Vehicle leaves many stop points only when entering gas station; (c) Few stop points and track points missing; and (d) Trajectory noises.

Figure 8.
The precision and recall of different parameter thresholds. (a) Analysis of the MaxAv parameter; (b) Analysis of the MinStop and MinMove parameters.
Figure 8.
The precision and recall of different parameter thresholds. (a) Analysis of the MaxAv parameter; (b) Analysis of the MinStop and MinMove parameters.

Figure 9.
The process of gas station extraction and the results. (a) Extracting stops from one day vehicle traces by step 4 of the VSLC; (b) Refueling stops extraction from Figure 9a by step 5 of the VSLC; (c) Extracting refueling stops (part); (d) Constructing the Delaunay triangulation using collective stop tracks; (e) Gas station polygon extraction; (f) Experimental results.

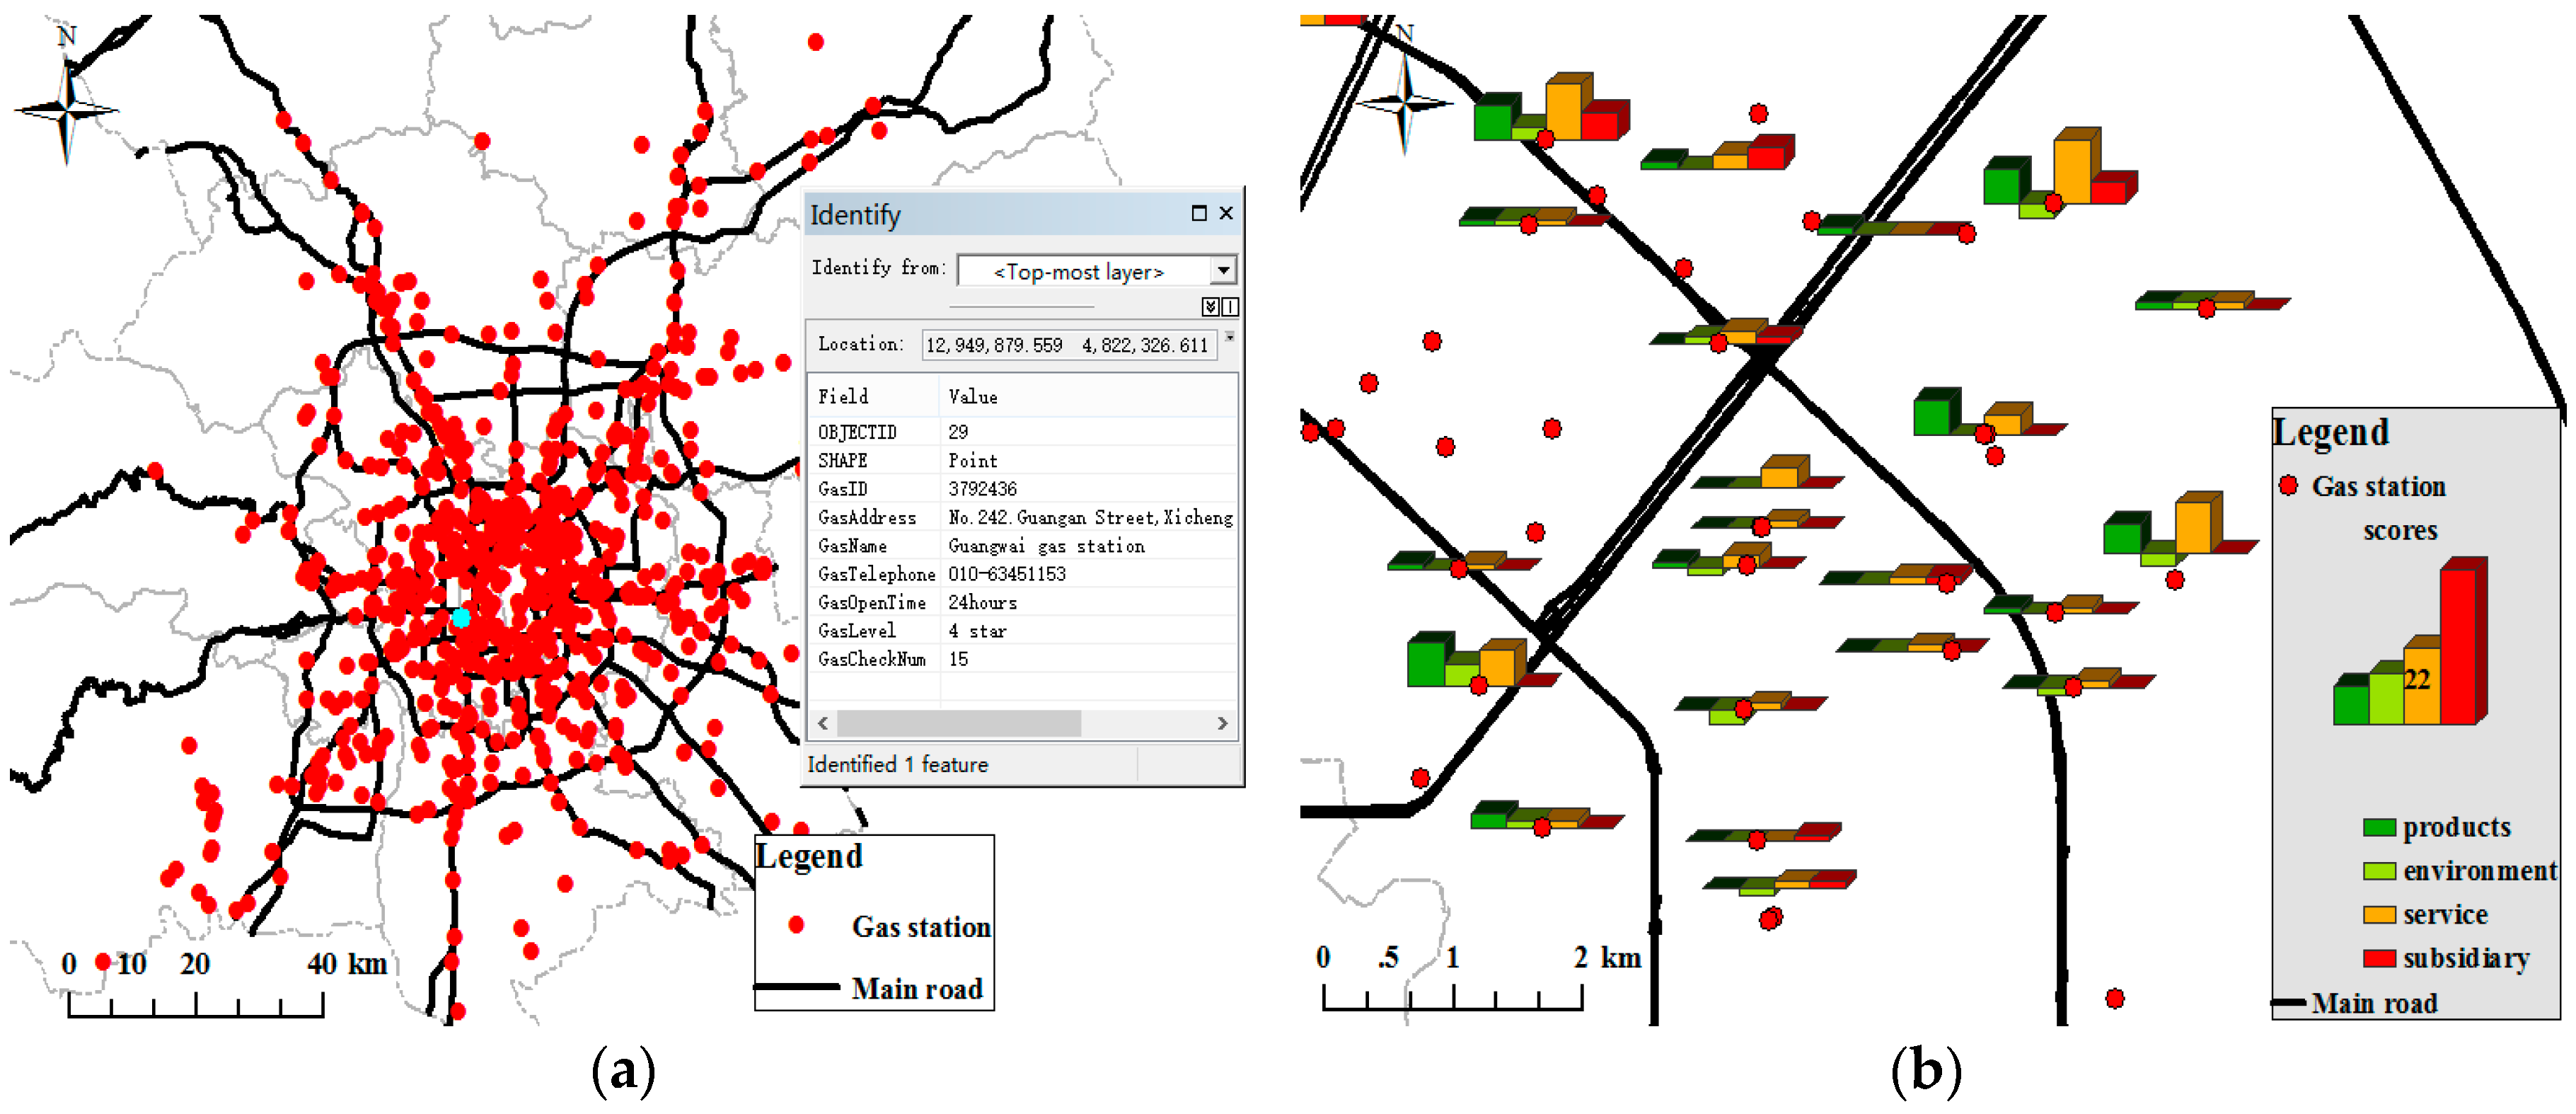
Figure 10.
The results of the attribute and sentiment semantic information extraction from Dianping. (a) Gas station point of interest (POI) and attribute information extracted from Dianping; (b) Dimension sentiment scores visualization using Bar graph (part).
Figure 10.
The results of the attribute and sentiment semantic information extraction from Dianping. (a) Gas station point of interest (POI) and attribute information extracted from Dianping; (b) Dimension sentiment scores visualization using Bar graph (part).

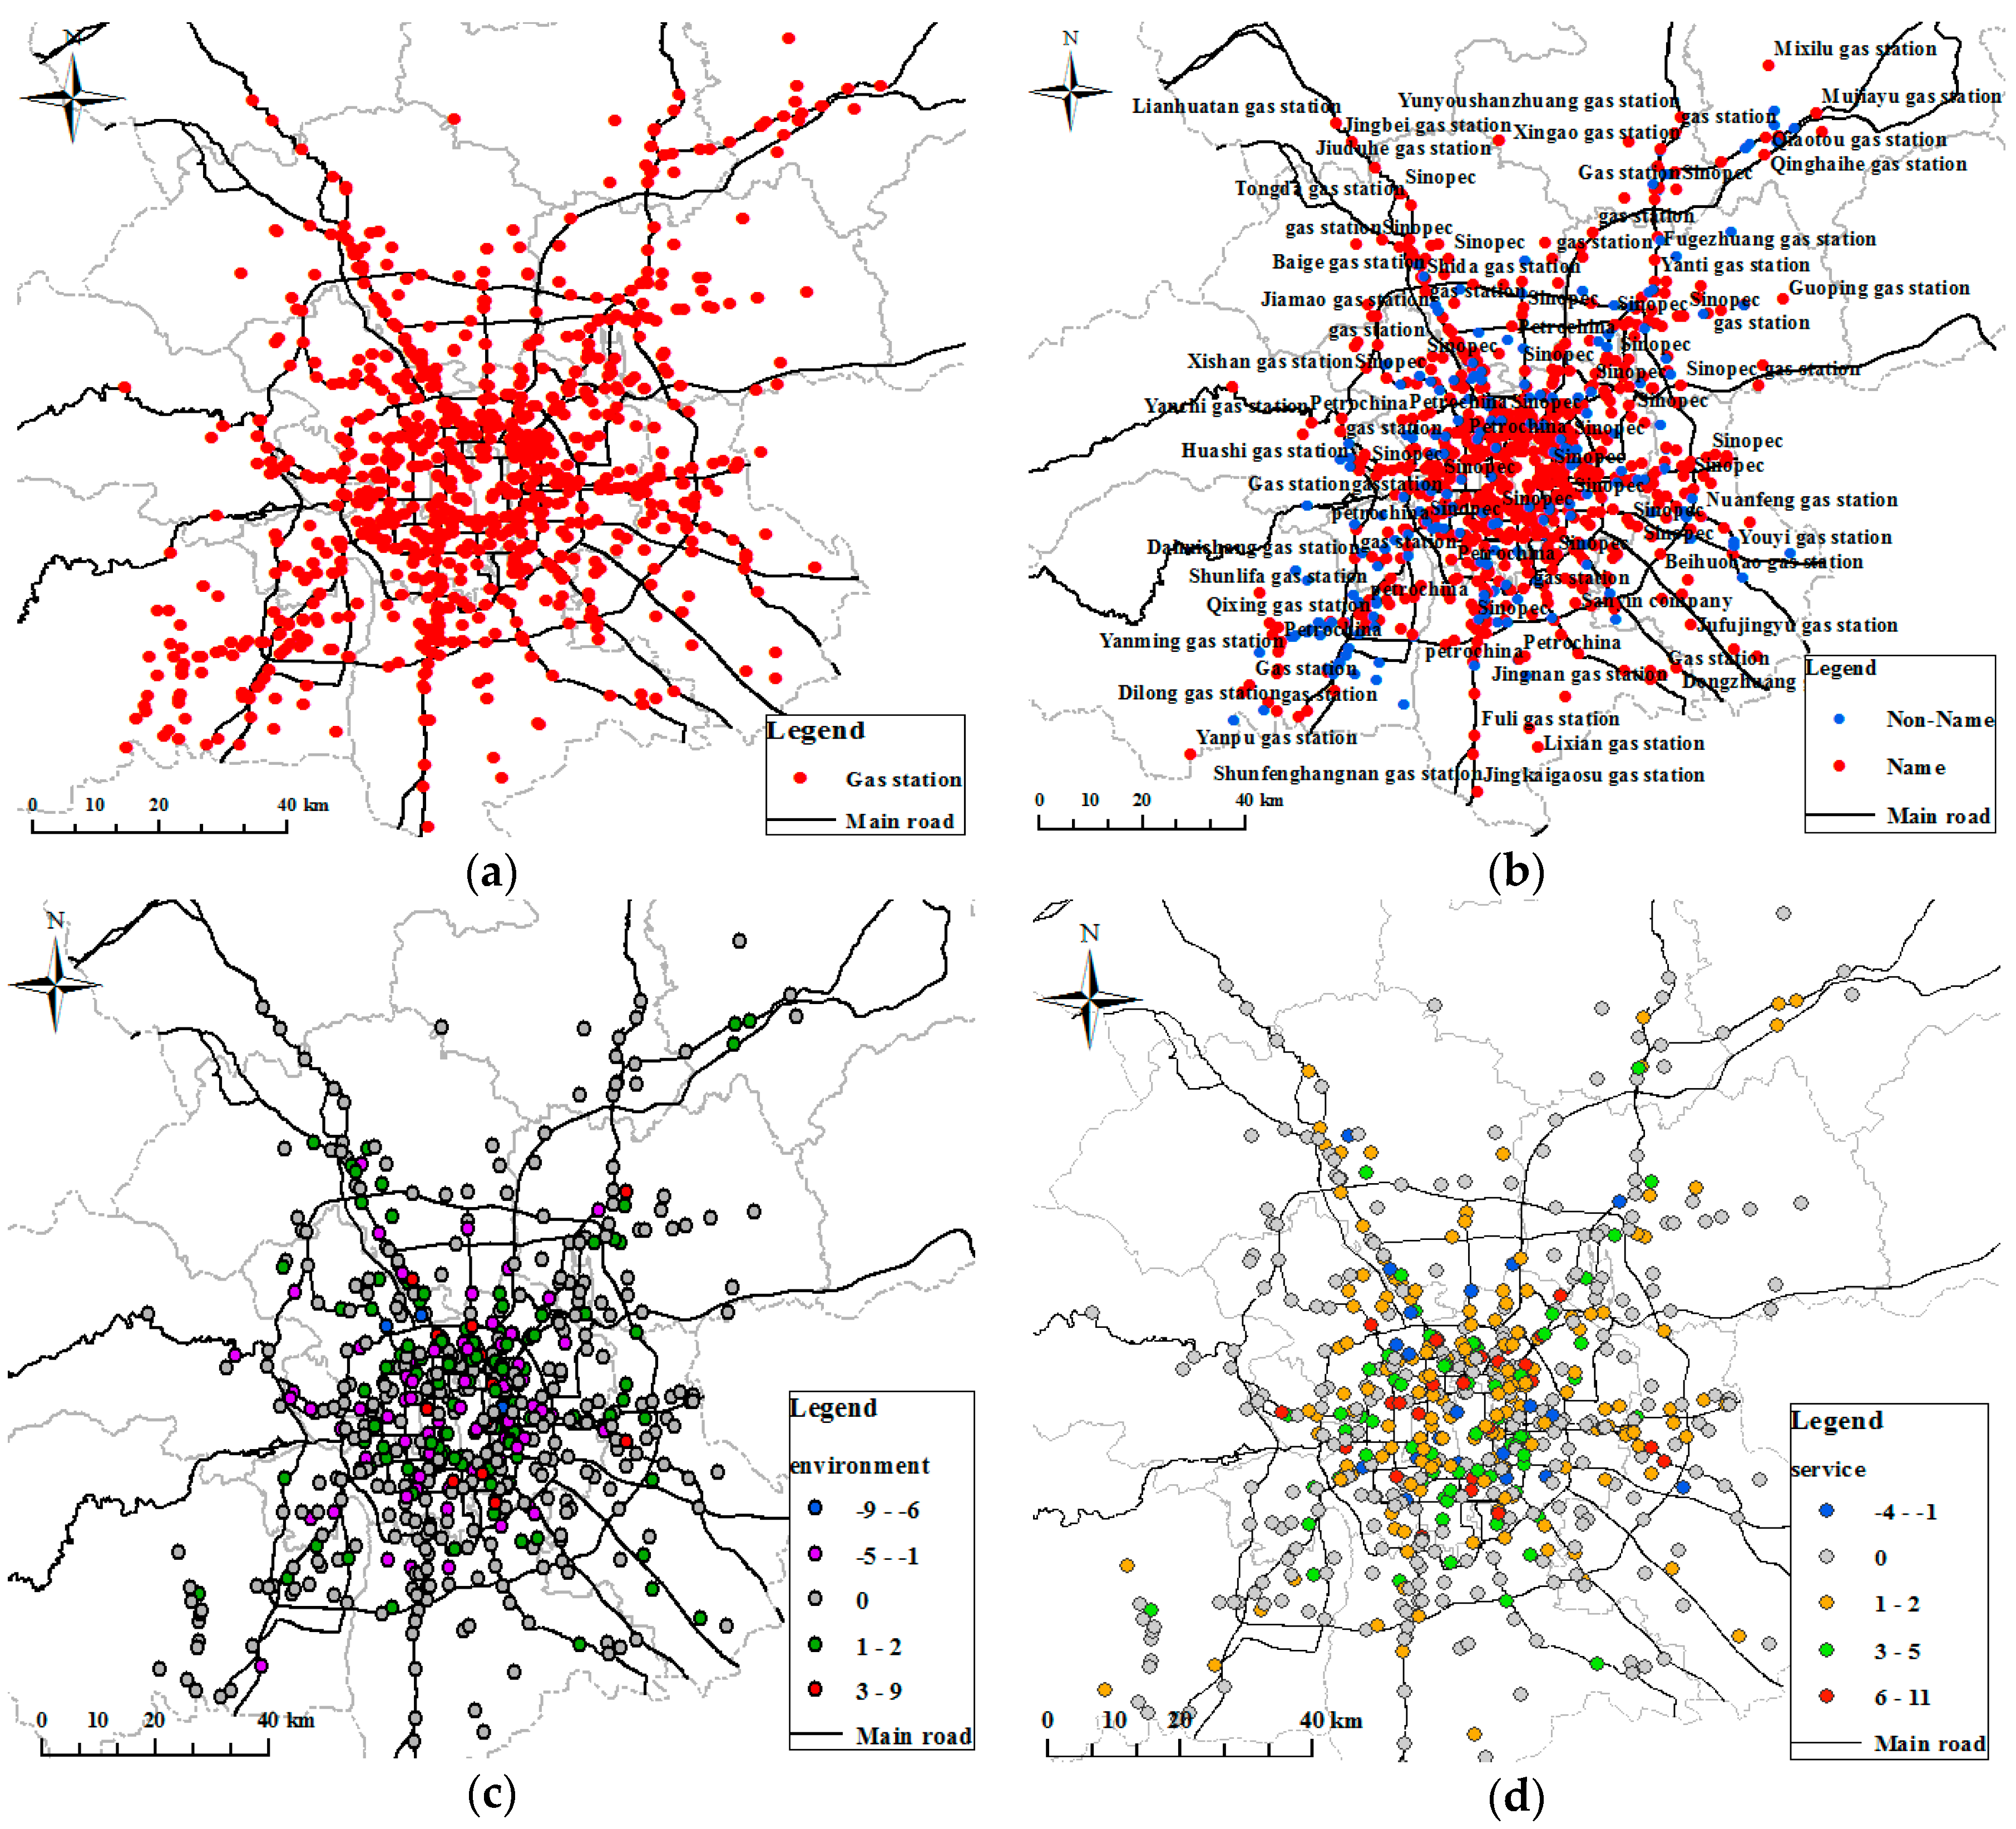
Figure 11.
Final gas station POI point map. (a) The overall results after fusion; (b) Attribute information of gas station after fusion; (c) Classification gas station by environment score (only for POIs with score information); (d) Classification gas station by service score.
Figure 11.
Final gas station POI point map. (a) The overall results after fusion; (b) Attribute information of gas station after fusion; (c) Classification gas station by environment score (only for POIs with score information); (d) Classification gas station by service score.

Figure 12.
The experimental results analysis and evaluation. (a) Gas station point overlaid on remote sensing images (ID = 556); (b) Accuracy evaluation result of gas station.
Figure 12.
The experimental results analysis and evaluation. (a) Gas station point overlaid on remote sensing images (ID = 556); (b) Accuracy evaluation result of gas station.


Table 1.
Details of different datasets.
| Dataset No. | Trajectory Amount | Trajectory Points | Sampling Rate | Time Duration | Labeled Stops | Refueling Stops |
|---|---|---|---|---|---|---|
| 1 | 350 | 87,780 | irregular (10–120 s) | 7 days | 1886 | 286 |
| 2 | 5 | 9815 | irregular (10–120 s) | 1 days | 64 | 6 |
Table 2.
Results of different stop extraction algorithms for Dataset 1.
| K_Medoids | DJ-Cluster | CB_SMoT | VSLC | |
|---|---|---|---|---|
| Parameters | K = 7 | eps = 60 m minPoint = 8 | area = 0.3 time = 300 s | MaxAv = 6 km/h MinStop = 300 s MinMove = 120 s |
| Time complexity | O(t(n − k)2) | O(tnlogn) | O(n2) | O(n) |
| Elapsed Time(s) | 208.9 | 197.2 | 98.1 | 8.72 |
| Precision | 0.46 | 0.71 | 0.78 | 0.83 |
| Recall | 0.57 | 0.68 | 0.72 | 0.76 |
| F_Measure | 0.51 | 0.69 | 0.75 | 0.79 |
Table 3.
Results of different stop extraction algorithms for Dataset 2.
| K_Medoids | DJ-Cluster | CB_SMoT | VSLC | |
|---|---|---|---|---|
| Parameters | K = 9 | eps = 60 m minPoint = 8 | area = 0.3 time = 300 s | MaxAv = 6 km/h MinStop = 300 s MinMove = 120 s |
| Extracted Stops | 54 | 56 | 68 | 66 |
| Correct Stops | 24 | 47 | 48 | 53 |
| Refueling stops | 1 | 2 | 2 | 5 |
| Precision | 0.45 | 0.83 | 0.71 | 0.81 |
| Recall | 0.38 | 0.73 | 0.75 | 0.83 |
| F_Measure | 0.41 | 0.78 | 0.73 | 0.82 |
Table 4.
Evaluation of attribute and semantic information of the gas station.
| Attribute Information | Sentiment Semantic Information | |||||||
|---|---|---|---|---|---|---|---|---|
| Name | Address | Tele | Open | Products | Environment | Service | Subsidy | |
| Extracted | 616 | 616 | 363 | 112 | 383 | 351 | 467 | 266 |
| Correct | 608 | 598 | 327 | |||||
| Reference | 820 | 786 | 368 | no 1 | no | no | no | no |
1 no means no data.
© 2018 by the authors. Licensee MDPI, Basel, Switzerland. This article is an open access article distributed under the terms and conditions of the Creative Commons Attribution (CC BY) license (http://creativecommons.org/licenses/by/4.0/).
Share and Cite
MDPI and ACS Style
Yang, W.; Ai, T. POI Information Enhancement Using Crowdsourcing Vehicle Trace Data and Social Media Data: A Case Study of Gas Station. ISPRS Int. J. Geo-Inf. 2018, 7, 178. https://doi.org/10.3390/ijgi7050178
AMA Style
Yang W, Ai T. POI Information Enhancement Using Crowdsourcing Vehicle Trace Data and Social Media Data: A Case Study of Gas Station. ISPRS International Journal of Geo-Information. 2018; 7(5):178. https://doi.org/10.3390/ijgi7050178
Chicago/Turabian StyleYang, Wei, and Tinghua Ai. 2018. "POI Information Enhancement Using Crowdsourcing Vehicle Trace Data and Social Media Data: A Case Study of Gas Station" ISPRS International Journal of Geo-Information 7, no. 5: 178. https://doi.org/10.3390/ijgi7050178
Note that from the first issue of 2016, this journal uses article numbers instead of page numbers. See further details here.