1. Introduction
At present, air pollution is one of the most significant factors posing a threat to health worldwide. According to the World Health Organization [
1], ambient air pollution was responsible for the premature deaths of 3.7 million people under the age of 60 in 2016. Europe’s most problematic air pollutant in terms of human health is particulate matter [
2].
Particulate matter (PM) can have significant effects on human health including asthma, lung cancer, and cardiovascular issues. Particulate matter up to 10 micrometers in diameter (PM
10) is able to penetrate the bronchi, while particulate matter with diameter up to 2.5 micrometers (PM
2.5) can penetrate the lungs and enter the circulatory system [
3]. The International Agency for Research on Cancer (IARC) concluded in 2013 that particulate matter is carcinogenic to humans [
4]. PM is also harmful to the environment, and its effects include increased acidity of lakes and streams, nutrient balance changes in coastal waters and river basins, reduced levels of nutrients in soil, damage to forests and crops, reduced diversity in ecosystems, damage to stone and other materials, and reduced visibility (haze) [
2].
Although there is a general consensus that air pollution is affecting human life and well-being worldwide, there is little awareness of the role that each one of us can play to mitigate this problem. Awareness primarily requires access to information, which should be widely available and easily understandable, as required by the Aarhus Convention (which provides for the right of everyone to receive environmental information that is held by public authorities), and by the Air Quality Directives (2004/107/EC and 2008/50/EC). However, although such information is available, it is generally not easily accessible by citizens. Common problems reported are [
5]
Even when people are aware of the issue, they usually do not associate their own individual behavior with these outcomes. However, the air is a public good [
6]. Particularly for air pollution, it is collective, rather than individual action which is necessary to mitigate the problem, as the air we breathe is a resource common to everybody.
The hackAIR project (
www.hackair.eu) aims to develop an air quality data hub by developing an open platform that enables communities of citizens to easily set up low-cost air quality monitoring networks and engage their members in measuring and publishing outdoor air pollution levels. By combining official data with air quality estimates from sky-depicting images and from sensing devices that citizens can build on their own, hackAIR provides citizens with improved and easily accessible information about localized air pollution levels. In order to also provide information in areas where no air quality monitoring stations exist, a data fusion algorithm for merging air quality information from various sources has been developed and air-quality-aware personalized services (e.g., outdoor activity recommendations) are provided to the public.
The general issue of raising awareness of the air pollution problem and its impacts on health has received considerable attention by several initiatives in the past. The official database of the European Environment Agency (
www.eea.europa.eu/themes/air/air-quality-index/index), Air Pollution in World (
http://aqicn.org/map/world), AirNow (
www.airnow.gov) in the US and Canada, and the London Air Quality Network (
www.londonair.org.uk) are some of the existing websites providing information on air pollution levels. In addition to independent initiatives, several projects funded by the European Commission, such as ObsAIRve (
www.obsairveyourbusiness.eu), CITEAIR (
www.citeair.eu) and PASODOBLE (
http://cordis.europa.eu/project/rcn/94372_en.html), have dealt with the issue of air pollution. The majority of these solutions are available only in regions with existing monitoring stations because they require official measurements as input. To overcome this issue, hackAIR acquires air pollution data from various sources and offers tools to citizens to contribute their own measurements. Thus, it offers much richer information on air pollution levels—whether official monitoring stations are available or not—accompanied by activity recommendations adjusted to each user’s personal profile. These recommendations enable citizens to identify areas with better air quality within the city and safeguard their health.
Citizen observatories for air pollution monitoring with sensors are increasingly viewed as an essential tool for better observing and understanding our environment [
7]. CITI-SENSE (
www.citi-sense.eu) and EveryAware (
www.everyaware.eu) are two of the existing EU funded projects aiming to empower citizens to participate in air pollution monitoring, enhancing their awareness of the problem and promoting behavioral change. Under the same concept, many commercial solutions have also been developed. The Envi4All mobile application (
http://envi4all.com/) provides real-time and forecast air quality data and enables users to report how they perceive the quality of the outdoor air at that specific moment. PlumeLabs (
https://plumelabs.com/) also offers this information and gives the opportunity to citizens to track and report air pollution data with a PlumeLabs sensor. The Air Quality Egg (
http://airqualityegg.com) promotes the creation of a sensing device that could be used by hobbyists and can monitor NO
2, CO, CO
2, SO
2, PM
2.5, and VOCs in the atmosphere. Several do-it-yourself initiatives have been also organized as part of recent efforts to democratize air quality monitoring. Indicatively, step-by-step instructions can be found for a wide variety of projects via ExploreInstructables.com, SparkFun.com, and PublicLab.org. The main limitation of such approaches is their failure to attract the interest of a critical mass of users that would provide them with a sufficient amount of air quality information. In order to overcome this limitation, hackAIR addresses the issue of data collection by including additional sources of data which do not necessarily require action by volunteers. These include the estimation of approximate air quality from sky-depicting images from social media and open data on air quality.
There have been various research efforts aiming at developing alternative, easy-to-produce, and inexpensive instruments for air pollution monitoring. Such an approach was introduced by Wang et al. [
8] aiming to quantify the loading of black carbon on quartz fiber filters with digital photographic methods. Field results demonstrated that this approach provides measurements as precise and accurate as the ones acquired with expensive instruments, while it exhibits short analysis time and easy operation. Ramanathan et al. [
9] introduced a similar approach, integrating an aerosol filter in a cellphone to collect filter images. The images are analyzed in real time to determine the current concentrations of black carbon.
From the different components of hackAIR, air pollution estimation from sky-depicting photos has been scarcely used in commercial offerings. This approach has been explored in previous research works. For example, Babari et al. [
10] developed model-driven approaches to monitor and estimate atmospheric visibility distance and air pollution levels through the use of ordinary cameras. Another approach is iSPEX (
http://ispex-eu.org/), a low-cost mass-producible optical add-on for smartphones with a corresponding app, which turns a smartphone camera into a spectropolarimeter [
11]. However, the aforementioned approaches remained in the state of a prototype and did not achieve commercial realization nor acquisition of a critical mass of data.
2. The hackAIR Methodology
The hackAIR solution has the primary goal of enabling communities of citizens to easily set up air quality monitoring networks and to engage their members in measuring and publishing outdoor air pollution levels, leveraging the power of online social networks, mobile and open hardware technologies, and engagement strategies. hackAIR allows for the collection of data from publicly available sources (measurements from ground-based stations, open data, and sky-depicting images uploaded to social media) and contributions from the hackAIR community (sky-depicting photos taken with the hackAIR app and measurements from low-cost sensing devices). Besides the platform, a social media monitoring tool has been developed to enable the discovery of social media accounts that belong to users or organizations interested in air quality issues and thus help with user engagement in the hackAIR activities.
In the following, we provide an overview of the various methodological elements which, in combination, represent the hackAIR solution. In summary, hackAIR collects readily available air quality measurements from the web and publicly available images of the sky from social media and webcams. For these images, machine learning algorithms automatically detect and extract clear sky regions that can be used for air quality estimation. Then, an algorithm that estimates the levels of air pollution based on the color of the extracted sky regions is applied. In parallel, the hackAIR solution offers guidelines to users on how they can build their own low-cost sensing devices to monitor their local air pollution and contribute actual measurements. All the above data are combined with official air pollution measurements from ground-based stations and satellite observations and feed a data fusion system which offers estimates of air quality even in areas with no measurements. Finally, based on each user’s preferences and sensitivities, hackAIR provides recommendations on how they can protect themselves from air pollution. All these services are offered through an integrated platform available as a web and mobile application that contributes to the creation of an improved knowledge base for air quality data in Europe and a change towards more proactive and environmentally friendly behavior.
2.1. Environmental Data Discovery and Indexing
Data discovery and collection in hackAIR focuses on two data types: (a) readily available air quality measurements and (b) publicly available images of the sky that can be used for image-based air quality estimation using the techniques described in
Section 2.2 and
Section 2.3. As mentioned above, with respect to readily available air quality measurements, the collection includes both measurements from official air quality stations (e.g., established by governmental organizations) and measurements from low-cost sensor networks. With respect to publicly available images of the sky, two sources are explored: a) social media images and b) images from public webcams.
The collection of official air quality measurements in hackAIR relies on the OpenAQ (
https://openaq.org) open data platform. OpenAQ aggregates and shares (via an open Application Programming Interface (API)) high-quality data about air quality from multiple official sources around the world (e.g., the European Environmental Agency) including more than 30 countries in Europe, which is currently the focus of the hackAIR framework. Importantly, the OpenAQ system checks each data source for updated information every 10 min, which guarantees that the data will be available from the platform almost immediately after they are published by the original data providers. In Europe, OpenAQ currently provides PM
10 and PM
2.5 data from about 1800 and 800 locations, respectively. The hackAIR data collection framework retrieves up-to-date information from each location by regularly performing appropriate queries to the Representation State Transfer (REST) API provided by OpenAQ.
Besides measurements from official air quality stations, the hackAIR solution involves the collection of measurements from personal low-cost air quality stations established by citizens and promoted by a number of air quality initiatives, similar to hackAIR. One such initiative is luftdaten.info which currently comprises more than 4000 sensors in Europe. The sensors of the luftdaten.info network constitute an ideal data source for hackAIR as they measure both PM10 and PM2.5 concentrations and their latest data are always available through an open API. The hackAIR data collection framework uses relevant APIs to retrieve up-to-date information from each sensor on an hourly basis.
As far as the collection of publicly available sky images is concerned, hackAIR explores the possibility of using publicly shared geotagged images from social media platforms. According to the KPCB Internet Trends Reports 2016 (
www.kpcb.com/blog/2016-internet-trends-report), which provides an overview of the trends related to image sharing for 2005–2015, the most popular image sharing platforms are Snapchat, Facebook Messenger, Instagram, WhatsApp, and Facebook. Unfortunately, all these platforms either do not distribute user-contributed images through a free API, or pose very strict limitations that prohibit their practical usage. Therefore, hackAIR uses Flickr, the next most popular image sharing platform that also provides a free open API.
To collect images from Flickr, the hackAIR data collection framework implements a collector that periodically calls the appropriate Flickr API endpoints to retrieve the URLs, timestamps, and geolocations of all images captured within the last 24 h in Europe. This leads to the collection of about 5000 geotagged images on a daily basis.
In addition to Flickr images, the hackAIR data collection component incorporates images from public webcams. Webcams offer the advantage of a continuous image stream from fixed known locations. To this end, two large webcam repositories are considered—AMOS [
12,
13] and webcams.travel [
14]. Combined, the two repositories provide access to about 3500 webcams in Europe: about 2500 come from AMOS and 1000 from webcams.travel (the latter source actually provides access to a significantly larger number of webcams (>20,000) but limitations of their free API prohibit the regular collection of images from more than 1000 webcams per day). In the case of AMOS, a customized web data extraction framework was developed, while in the case of webcams.travel, data is retrieved through a client application for the provided API. In both cases, data collection is performed 4 times per day during daytime.
Efficient indexing and storage of the information retrieved from all the previously described sources relies on a MongoDB instance. This offers efficient mechanisms for handling geographical data and performing geospatial queries.
2.2. Image Processing for Sky Detection
As soon as the Flickr and webcam images are retrieved, a number of automated image processing operations are launched in order to (a) determine whether sky is depicted in the image and (b) localize the clear (of non-sky elements, clouds, or humidity) sky area and compute the color statistics that are used as input to the air quality estimation method described in
Section 2.3.
To automatically detect the presence of sky in an image, we build a visual concept detection model using Deep Convolutional Neural Networks (DCNNs). In particular, we finetune a state-of-the-art pretrained DCNN model (Inception-v3 [
15]) by replacing the last layer of the network with a new layer trained on a manually annotated (for the sky concept) set of 2500 Flickr and webcam images. This model achieves an accuracy of 96.2% when evaluated on an independent test set.
In the next processing step, all images recognized as sky-depicting are further processed in order to determine the exact location of sky. To this end, two alternative sky localization approaches are considered: one that applies deep learning for image segmentation and one that is based on simple image processing heuristics.
The first approach that we apply is the Fully Convolutional Network (FCN) [
16]. Building upon the recent advances in deep and transfer learning, FCN applies fully convolutional finetuning using whole-image inputs and per-pixel ground truth labels to adapt deep networks pretrained for image classification to image segmentation tasks. In hackAIR, we use a publicly available FCN model (
https://github.com/shelhamer/fcn.berkeleyvision.org/tree/master/siftflow-fcn16s) (FCN-16) pretrained on the SIFT Flow dataset [
17] (which includes annotations for the sky class) that was found to achieve an average pixel precision of 94.3%.
The second approach for sky localization consists of a set of heuristic rules that aim to identify pixels that meet certain criteria with respect to their color values and the color values of neighboring pixels. In rough terms (a more detailed description of this algorithm can be found in [
18]), if
R,
G, and
B denote the Red, Green, and Blue values of each pixel, sky pixels must satisfy the following three conditions:
and, moreover, occupy large contiguous areas in the upper part of the image.
To compare the two approaches, we first evaluated their performance on the SUN benchmark database [
19] and found that the FCN approach performs significantly better in recognizing the sky regions, obtaining a pixel precision of 91.77% versus 82.45% for the heuristic approach. However, we noticed that the ground truth annotations of the SUN database (as well as those of the SIFT Flow database on which the FCN model is trained) are noisy, in the sense that the regions annotated as sky often contain non-sky areas (e.g., clouds, the sun, or small objects). The presence of such areas is problematic as it may result in noisy pixel color statistics and consequently compromise the validity of the air quality estimations that rely on these statistics.
Therefore, we conducted an additional evaluation of the two methods, tailored to assessing their performance on the more specific task of identifying sky regions that are suitable for air quality estimation (i.e., do not contain non-sky elements). In particular, we performed sky localization with each approach on 200 randomly selected Flickr and webcam images and manually assessed through inspection the validity of the sky regions detected by each approach. Note that in this type of evaluation, it is expected that both approaches will achieve significantly lower performance scores as even a small non-sky area within the detected sky region deems the whole region usable. Indeed, we found that the sky regions extracted by FCN are suitable in only 24.8% of the cases versus 47.9% for the heuristic approach.
A careful examination of the extracted regions suggests that the heuristic approach owes its superior performance to the extraction of more fine-grained regions and, therefore, more cases where the detected region consists only of sky pixels. More importantly, the visual examination also revealed that the two approaches can work in a complementary way. We found that the FCN approach is better at avoiding significant errors (e.g., sea or building windows recognized as sky), while the heuristic approach can successfully filter out small non-sky elements such as small objects and text overlays that are particularly common in webcam images. Motivated by this complementarity, we tested a hybrid sky localization approach that first extracts the sky region using the FCN approach and then refines it by applying the heuristic approach considering only the pixels recognized as sky by the FCN approach. This hybrid approach manages to extract suitable sky regions in 80.3% of the images and is the method of choice for the hackAIR solution.
The final processing step consists of computing the mean red-to-green (R/G) and green-to-blue (G/B) ratios from the parts of the images identified as sky and providing them as input to the air quality estimation method described in the following section. Since images commonly undergo various types of transformations by users (e.g., artistic filters, color enhancements) before being uploaded to social media platforms such as Flickr, we studied how such transformations affect the results of the image analysis (i.e., the calculated R/G and G/B ratios). To this end, we selected a set of 87 sky-depicting (untransformed) Flickr images and applied 24 popular image transformations (resizing, color level effects, artistic filters, etc.) on each image using the image manipulation API of Cloudinary (
http://cloudinary.com). Original images and their transformed versions were then processed independently for sky detection and localization, and R/G and G/B ratios were extracted from all images with a usable sky region. By measuring the Pearson correlation between the R/G and G/B ratios of original and transformed images, we found that both ratios are very robust against most transformations (Pearson correlation > 0.9 for 18 out of 24 transformations), with only 2 very intense transformations (brightness increase ≥ 50%, red-rock artistic filter) causing a significant distortion on the calculated ratios and 2 transformations rendering all images unusable for air quality estimation. These results (the interested reader is referred to [
20] for more details on the experimental setup and the detailed results of this analysis) suggest that image transformations are expected to have a negligible impact on image-based air quality estimations and this pertains only to a small fraction of the images used by the hackAIR framework since webcam images and images captured with the hackAIR app are typically untransformed.
2.3. Estimation of Air Quality from User-Generated Sky Photos
Atmospheric visibility is a very useful indicator of the so-called aerosol optical depth (AOD: a measure of the extinction of radiation due to scattering and absorption by aerosols) and, subsequently, of air pollution resulting from suspended particulates, especially in drier climates [
21,
22]. Passive remote sensing instruments (e.g., sunphotometers, spectrophotometers) retrieve aerosol optical properties, such as AOD, by measuring the incident radiation on the ground at specific wavelengths. To assign the light intensities measured by the instruments to AOD values, a Look-Up Table (LUT) approach is usually followed. LUTs are produced with the use of a radiative transfer model (RTM). RTMs allow for the calculation of the intensity of the light transferred in the atmosphere under different user-specified scenarios. These scenarios may include information about the position of sun relative to Earth (solar zenith angle) and atmospheric parameters which are related to clouds, aerosols, water vapor, ozone, surface albedo, etc. This way, one knows what light intensity should be expected under specific atmospheric conditions. Comparison of the measured spectral light intensities with those from a LUT allows for retrieval of the AOD.
The color (Red–Green–Blue) of the sky is partly determined by atmospheric aerosols (amount and type). Several scientific efforts around the world to retrieve atmospheric aerosol-related properties from images taken from digital cameras and paintings [
21] have returned promising results so far. Previous employments of similar methods, i.e., using digital cameras, have shown that the comparison of AOD derived from sky images with those retrieved with sunphotometers operated side by side showed differences similar to the nominal error claimed in the AOD sunphotometer networks [
23]. A relevant field experiment showed that AOD from sky images is highly correlated with AOD from sunphotometers, with a correlation coefficient of 0.95 and an average retrieval error of around 7% [
24]. Furthermore, sky radiances obtained by digital cameras were compared with CIMEL sunphotometer radiances, finding mean absolute differences between 2% and 15% except for pixels near the sun and high scattering angles [
25]. The method used in hackAIR is based on the comparison of the R/G and G/B ratios from images and precalculated LUTs to retrieve AOD [
18].
2.4. Design of Guidelines for Low-Cost Air Quality Sensing Devices
In order to increase air pollution awareness and attract open software and hardware communities to provide added value to the hackAIR project, low-cost sensing devices were developed. The sensing devices consist of three main elements: a sensor, a processing unit, and a communication module. Sensors selected for the current project are based on the optical determination of particles by means of a light scattering method. A typical sensor includes a light source (IR LED or diode laser), a photo-sensing device (photodiode or phototransistor), and a focusing lens. The particles pass through the light beam, and scatter and absorb the light. The detected light intensity is directly correlated with the concentration of particles. Air flow is ensured by forced flow using mini blowers or heated elements. Two classes of sensors were tested and selected: LED based (Shinyei PPD42NS) and Laser based (DFRobot SEN0177, Inonafit SDS011, and Plantower PMS5003).
The communication capabilities of the proposed devices dictate the selection of appropriate processing units that usually fall into two categories: For distributed networking solutions (Ethernet, WiFi), we adopt the Arduino ecosystem in typical implementations (Arduino UNO with Ethernet shield or with a dedicated hackAIR WiFi shield, Wemos, and compatible NodeMCU implementations). For personal networking, we adopt the Bluetooth low-energy (BLE) protocol, which is implemented by means of Cypress® Progrannable System-on-Chip (PSoc)/Programmed Random occurrence (PRoc) modules. Arduino and Wemos solutions are designed to be placed in closed cases at predefined places while their locations are provided during the registration at the hackAIR portal. The PSoC/PRoC sensing device is designed to be portable and implemented using the BLE protocol in beacon format packets while additional information like the geolocation and user credentials are attached in the submitted network packet from the mobile device that is responsible for sending the data over the internet to the hackAIR portal. The portability of the proposed devices is further extended since the power supply can be provided by portable power banks.
Recently, temperature and humidity measurement capability was included on the designed hardware and software. Specifically, DHT11 and DHT22 sensor boards were used in order to increase the measurement reliability, and software code was added in the provided libraries accordingly. Detailed hardware descriptions (i.e., schematics and printed circuit boards (PCBs)) of all the above sensors and the corresponding software (open access codes and libraries) are available on the project’s GitHub site (
https://hackair-project.github.io/hackAir-Arduino/general/,
https://github.com/hackair-project/hackAIR-PSoC/wiki).
All designs incorporate power saving algorithms and the sensors are shut down during the time intervals between measurements in order to reduce power consumption and increase the expected lifetime of the sensors’ laser system.
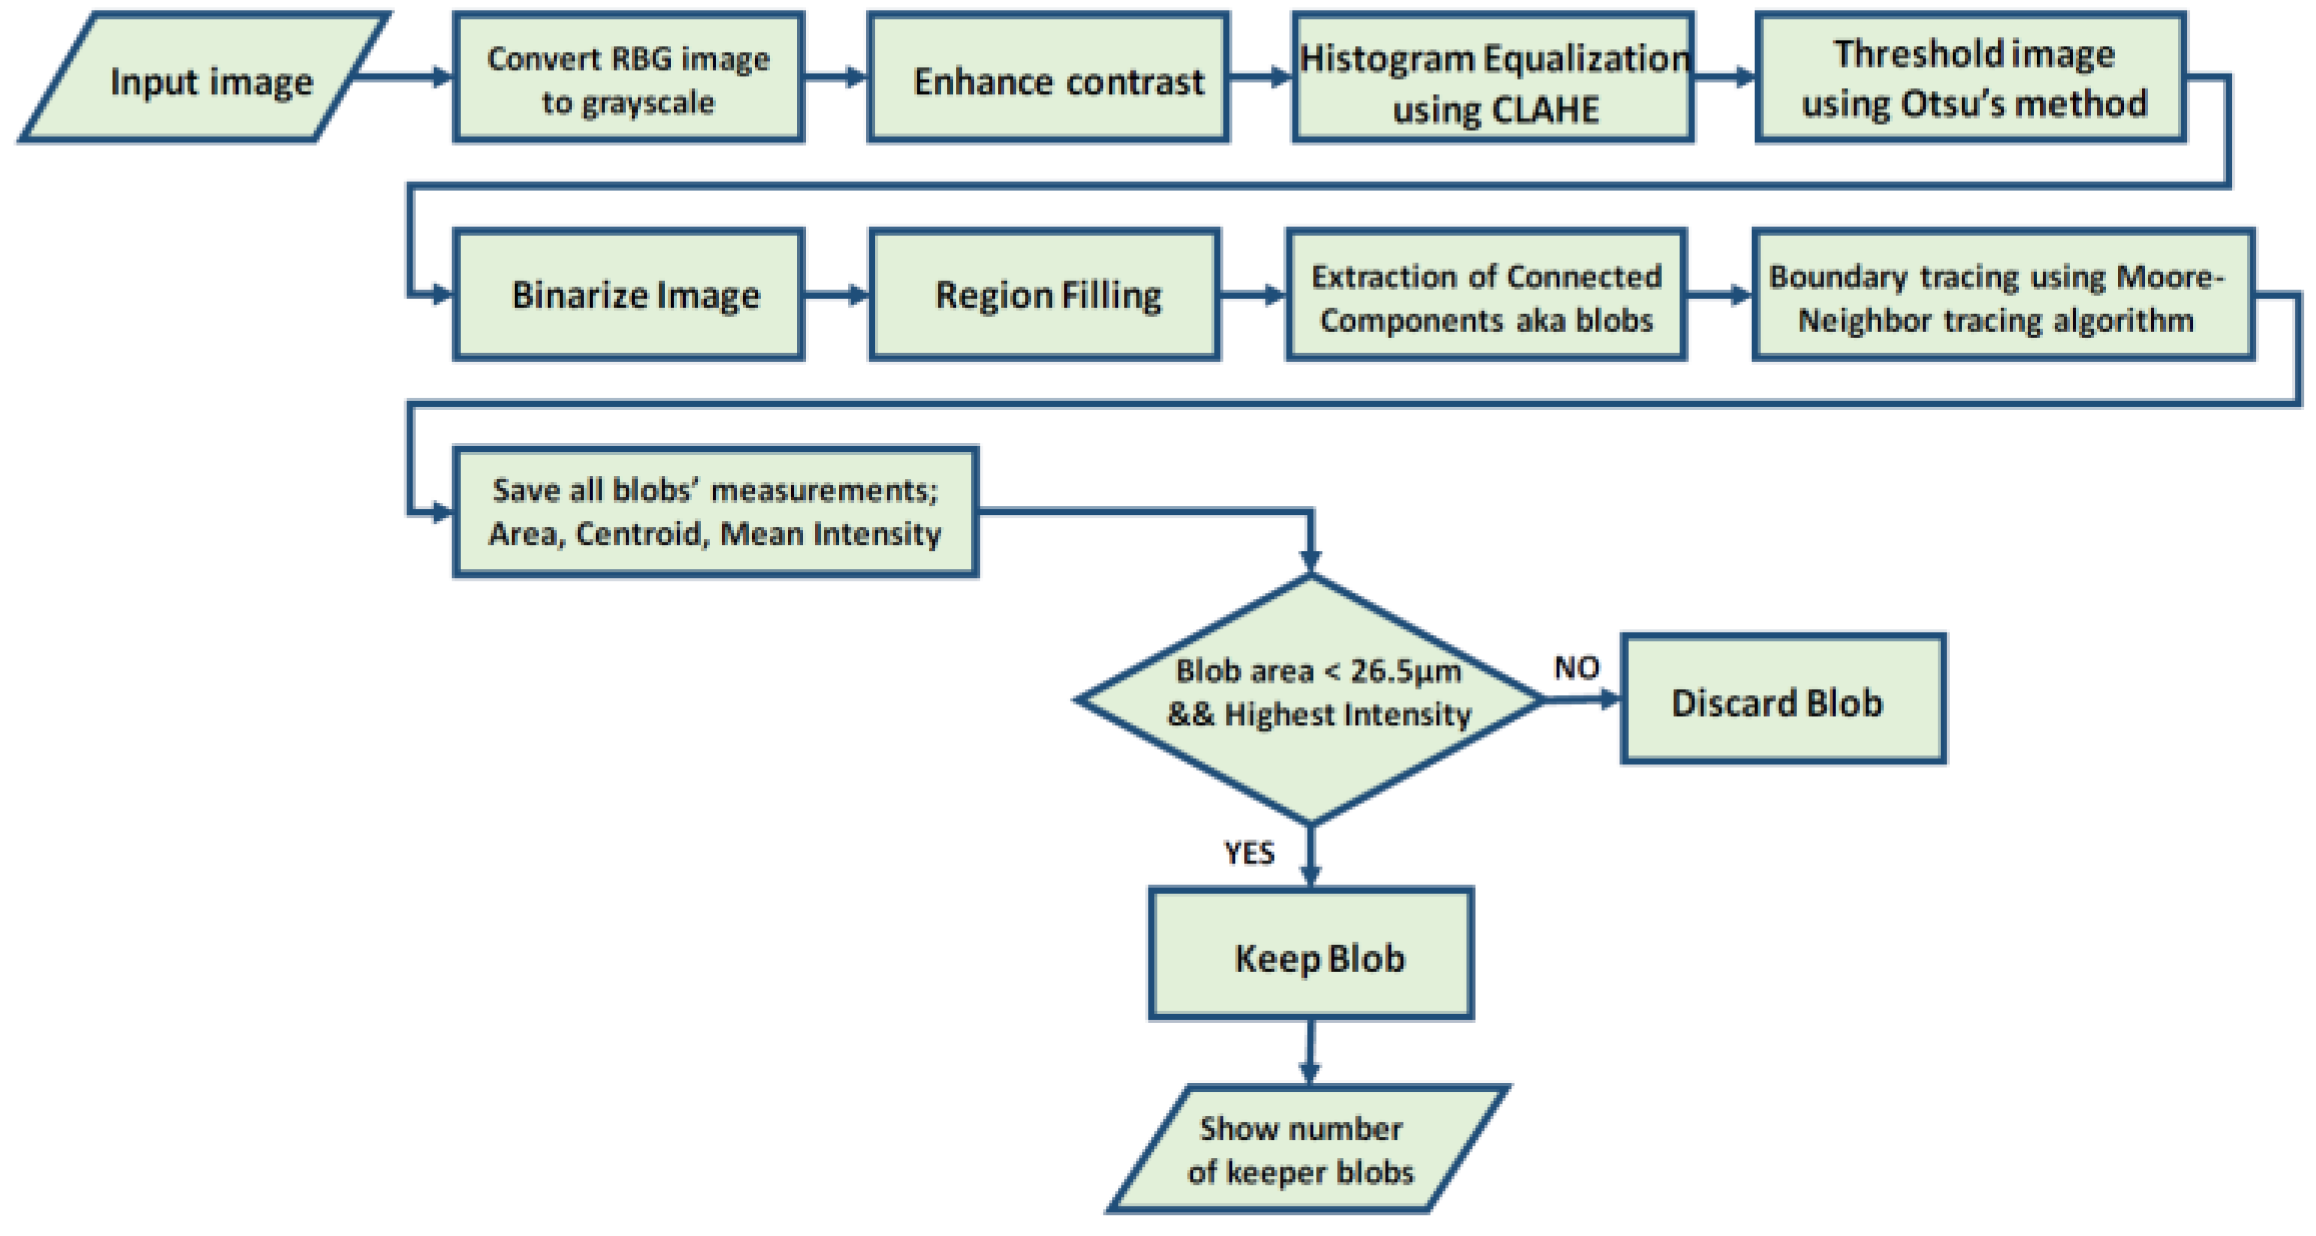
Furthermore, an air quality characterization sensor made of Commercial Off-the-Shelf (COTS) materials based on well-established image processing and computer vision techniques aiming to provide qualitative PM concentrations was developed. The sensor comprises a test surface where the PMs are collected. For this purpose, a 5 cm square piece of the aluminium side of a Tetra Pak food packaging carton is used. Along the diagonal axis of the user’s choice, two small dots are made using a 0.7 mm mechanical pencil, near the center of the test surface.
Subsequently, a thin layer of petroleum jelly is applied in order to trap the PMs. The hackAIR cardboard sensor is then exposed outdoors for 24 h. Afterwards, the cardboard sensor is retrieved and a set of five images of the area of interest is captured using a cell phone camera and a macro lens of at least ×12 magnification. For the characterization of the air quality, the hackAIR cardboard sensor implements an algorithm that is described in the flowchart depicted in
Figure 1. To estimate the number of blobs which correspond to PM
10 or greater air particles trapped on the petroleum jelly layer of the test surface, well-established image processing and computer vision techniques are run. Such algorithms involve Otsu’s method for thresholding [
26], Contrast Limited Adaptive Histogram Equalization—CLAHE [
27], and Moore’s tracing algorithm for extracting.
2.5. Data Fusion Tools
In order to add value to the hackAIR observations and to provide the platform users with estimates of the air quality at any given location, even if no measurements were made there, a data fusion system was developed. This system has the primary objective of interpolating the point-based observations in space such that air quality estimates are available at any point within the domain. Data fusion is a subset of data assimilation [
28] and when used with observations and a model, it allows for spatially interpolating point observations in a mathematically objective way while at the same time constraining the model. Data fusion has been successfully applied in such a fashion for real-time urban-scale air quality mapping by combining observations from a low-cost sensor network [
29] with information from a high-resolution local-scale dispersion model [
30,
31]. We use data fusion here primarily with the goal of spatially interpolating the observations, which are often subject to significant uncertainty, in a meaningful way. As such, the model is used as auxiliary information to guide the interpolation in areas where no observations are available.
The input data to the data fusion system are hereby twofold: the observational data is primarily composed of the measurements made by the participants, e.g., aerosol optical depth estimates from sky-depicting images and particulate matter observations using optical particle counters mounted in open platforms. As model information, we use the operationally available data from the Copernicus Atmosphere Monitoring System (CAMS). More specifically, we use the daily ensemble forecast of the CAMS regional modelling system, representing the median of the ensemble of seven participating models [
32].
The data fusion system used here is conceptually similar to the one described in [
30] and is based on geostatistics [
33,
34,
35]. More specifically, the technique uses universal kriging for interpolating the observations in space using model information as a spatial proxy to guide the interpolation. The interpolation is carried out at a country level with a spatial resolution of 5 km by 5 km. Currently, the focus lies on the two study sites—Germany and Norway—but the method can be readily extended to larger regions. The resulting fused maps are updated once every hour using observations and model information averaged over a period which can be adjusted based on the number of available observations. One of the major advantages of using a geostatistical framework as a data fusion technique is that the underlying kriging methods by default provide pixel-level uncertainty estimates. This can be important for propagating sensor-level uncertainties all the way to the end users. Given the availability of urban-scale modelling output with spatial resolutions of 100 m × 100 m and less, the methodology can also be applied for street-level maps of air quality [
30,
31] and experiments along these lines with the observations collected as part of hackAIR are planned for the second part of the project.
2.6. Personalized Recommendations Based on Environmental Data
Several initiatives, including projects (PESCaDO (
http://pescado-project.upf.edu/) [
36]) and applications (AirForU (
http://newsroom.ucla.edu/releases/new-app-lets-you-check-air-quality-as-easily-as-checking-the-weather), Clean Air Nation (
https://play.google.com/store/apps/details?id=io.gonative.android.robzl&hl=en), Air Visual (
https://airvisual.com/app), Breezometer (
https://breezometer.com), etc.), demonstrate the added value of up-to-date, spatiotemporally defined air-quality-related information and recommendation provision [
37]. However, the above applications produce recommendations that generally apply to sensitive people, without any specialization to specific individuals’ needs. Our aim is to implement a user-driven decision support (DS) framework that takes into account variations in people’s air-quality-related vulnerabilities, as well as the environmental dynamics and relations, and produces recommendations, either in the form of general tips on how to reduce their ecological footprint or of personalized advice on how individuals may respond to existing atmospheric conditions, upon request for decision support.
The preferences that each user reported in the hackAIR system are classified according to age, cardiovascular or respiratory diseases (e.g., asthma), the performance of outdoor activities that cause breathing extension (e.g., jogging), and some other states (e.g., pregnancy, working outdoors). For each of the above user types and air pollution levels, specific messages with fixed content were defined by the hackAIR environmental experts based on a review of the literature on individuals’ susceptibility. Therefore, the problem of providing personalized inferences is transformed into a classification task where different recommendations are given to the users according to a specific set of classes in the ontology that they belong to.
For the common representation and orchestration of heterogeneous information (environmental-, health-, user-profile-related data) and their existing relations, as those were defined by environmental and health experts of the project, we make use of ontologies—the state-of-the-art Semantic Web technology for structuring and semantically integrating data [
38]. Ontologies have been extensively adopted in separate parts of the decision-making process [
39,
40,
41], mostly for the formal representation of the domain of interest. On the contrary, our developed framework demonstrates the extensive use of ontologies and of relevant reasoning technologies for handling both the static (representation) and dynamic (realization, inference) processes of a DS system.
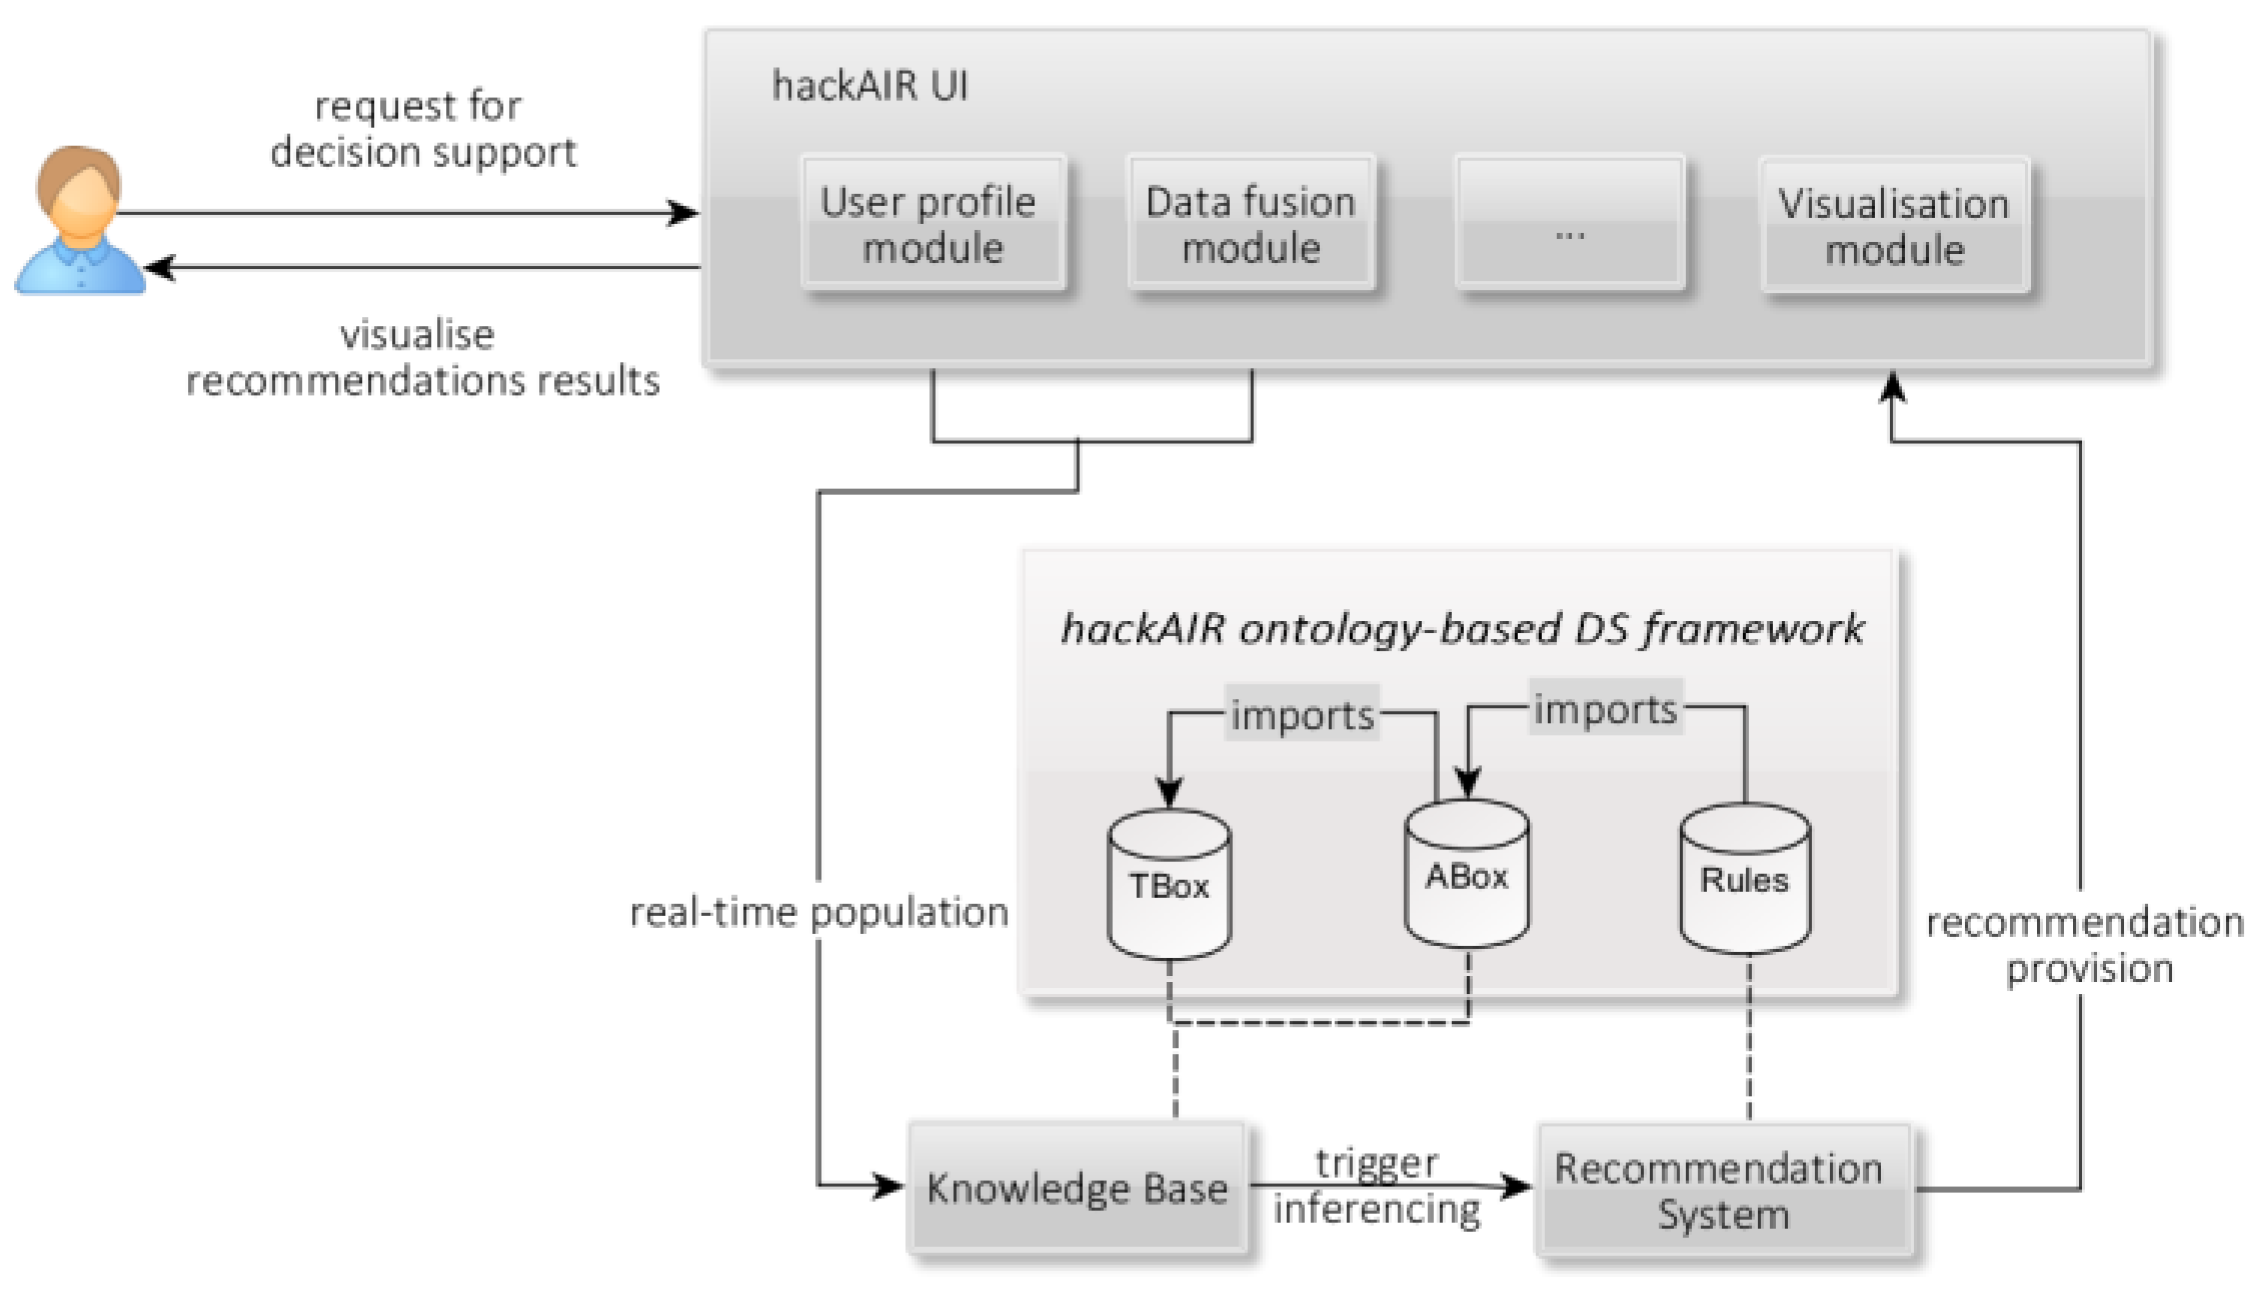
More specifically, we implemented a multilayered, ontology-based DS framework that comprises the following components [
42] (
Figure 2):
The knowledge base (KB)—A set of interconnected ontologies which define the abstract schema (TBox layer) and actual assertions (ABox layer). It serves as a formulation and storage module of involved data, represented by the following main concepts: Person, Health_Sensitivity, Activity, Location, Environmental_Data, Request, and Recommendation, and their related subclasses and relationships.
The recommendation module (rules layer)—a rule-based inference mechanism, implemented by fully exploiting the SPIN (SPARQL Inferencing Notation) -rules framework [
43] (
http://spinrdf.org/). It runs on top of the above ontological definitions, so as to interpret the existing data, produce new knowledge, and thus infer appropriate recommendations for the users, with respect to the existing air quality conditions and specific profile characteristics (age, health status, preferred outdoor activities) which implicitly define the different levels of individuals’ vulnerability under severe atmospheric conditions, according to the project’s experts.
Representative scenarios defined within the hackAIR project, with the support of the project partners and environmental experts, are analyzed in depth in project deliverable D4.2 [
44]. Here, for demonstration purposes, we consider the following hackAIR users: (1) a pregnant woman with respiratory diseases who likes to take long walks; and (2) a 65-year-old person who daily performs some outdoor work. Both live in an area supported by the hackAIR platform and request personalized recommendations through the hackAIR app. The KB receives via the implemented web service each request and stores the involved data (user profile details and fused air quality data) in the form of triples, conforming to the developed ontology schema. Appropriate ontology rules are triggered automatically, classifying (i) users in relevant basic or complex user profile classes; e.g.,
User1 as Pregnant_and_SensitiveHealth_Person and Pregnant_and_SportsWalking_Person, and User2 as Elderly_and_Outdoor Job_Person; and (ii) air quality measurements in relevant Air Quality Index (AQI) values. The above inferences feed the second level of ontology rules responsible for the proper matching between user profiles and defined recommendations. Thus, each user receives one or more recommendations according to his/her classification results and also to existing air quality conditions; e.g., User1 receives the suggestion: “You should go for a walk in an area with cleaner air.”, while User2 receives: “You should consider with your supervisor (if any) the possibility of changing your working environment for today” when atmospheric pollution is extremely high.
The proposed ontology-based implementation facilitates the extensibility (enriching the KB with new concepts, rules, and recommendation messages per case), modularity (customizing existing schema and rules), and adoptability of the system (well-established, formal representation of data, seamless communication with third-party modules).
2.7. Development of the Integrated HackAIR Platform
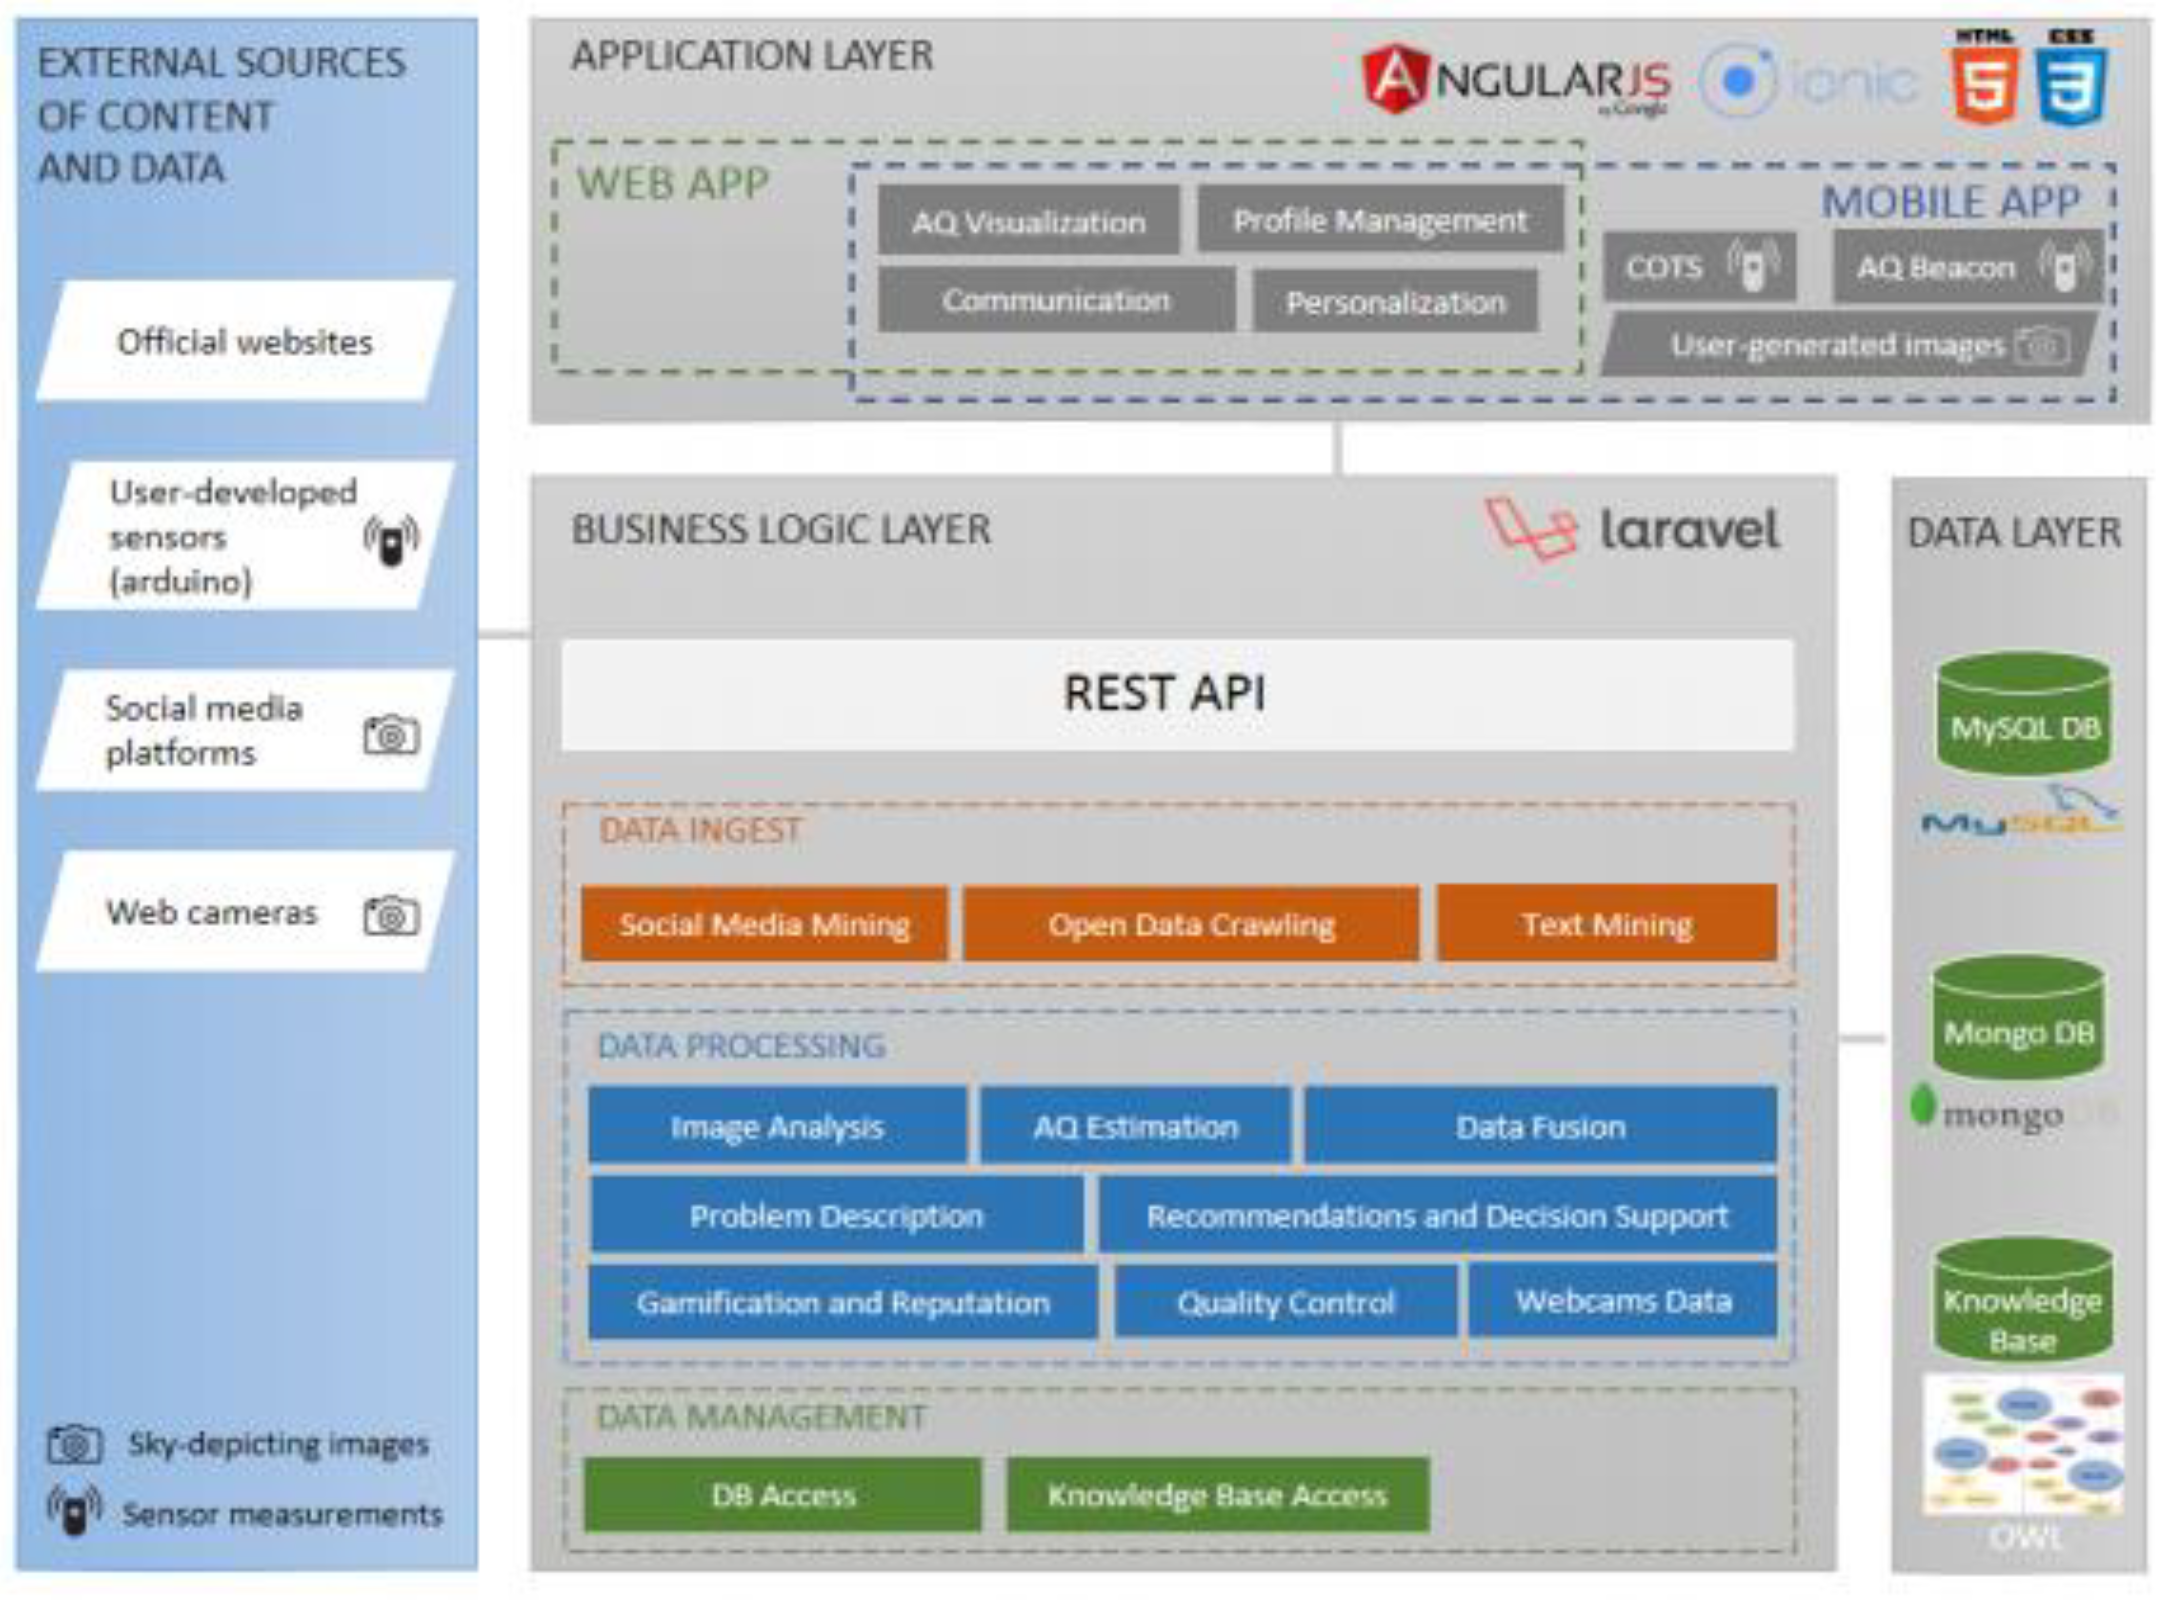
The hackAIR platform follows a Service-Oriented Architecture (SOA) for the integration of all platform components. The principles of service orientation are independent of any vendor, product, or technology. Services are unassociated, loosely coupled units of functionality that are self-contained and each service implements at least one action. This makes it possible to reuse the code in different ways throughout the application by changing only the way an individual service interoperates with other services that make up the application, versus making code changes to the service itself. Furthermore, the hackAIR Platform implements a REST Web Services design approach to sustain integration among subcomponents and other integrations like mobile devices.
The hackAIR platform’s architecture is composed of the following three layers: Data, Business Logic, and Application. The communication between these layers is bi-directional and always passes through the business logic layer. The communication between the Application and the business logic layers is handled through a RESTful API presented in
Figure 3, where AQ represents air quality and COTS the hackAIR Commercial Off-the-Shelf solution.
Data layer
The data layer includes the data persistence mechanisms that are responsible for storing and retrieving the data used by the hackAIR platform. It comprises a database for storing the basic hackAIR data entities and a Knowledge Base for storing semantically enriched information.
Business Logic layer
The business logic layer handles the requests coming from the application layer by applying the business logic rules and replying securely with proper content to the client applications (web and mobile applications). In addition to that, it receives measurements taken by the Arduino devices through the API and routes them to the appropriate module. Finally, the business logic layer communicates with external components including official websites, social media platforms, and webcams to retrieve air quality data.
The business logic layer includes various modules of the hackAIR platform, which all fall under the following three categories:
Data ingest (responsible for acquiring data from various sources);
Data processing (responsible for information transformation, processing, and implementation of business rules);
Data access (responsible for communicating with the hackAIR platform’s database systems).
Application layer
The application layer hosts the user’s interaction interface available for access via the web and mobile and also via a community portal. The applications provided through this layer were developed using the Angular JS framework, HTML5, and CSS3. The mobile application was built and wrapped using the Ionic framework in order to provide all features required for the Android and iOS platforms, offering full end-user access to all hackAIR services. Users not only consume data, but can also provide data like personal information and air quality estimations (through photos and air quality measurements coming from hardware devices).
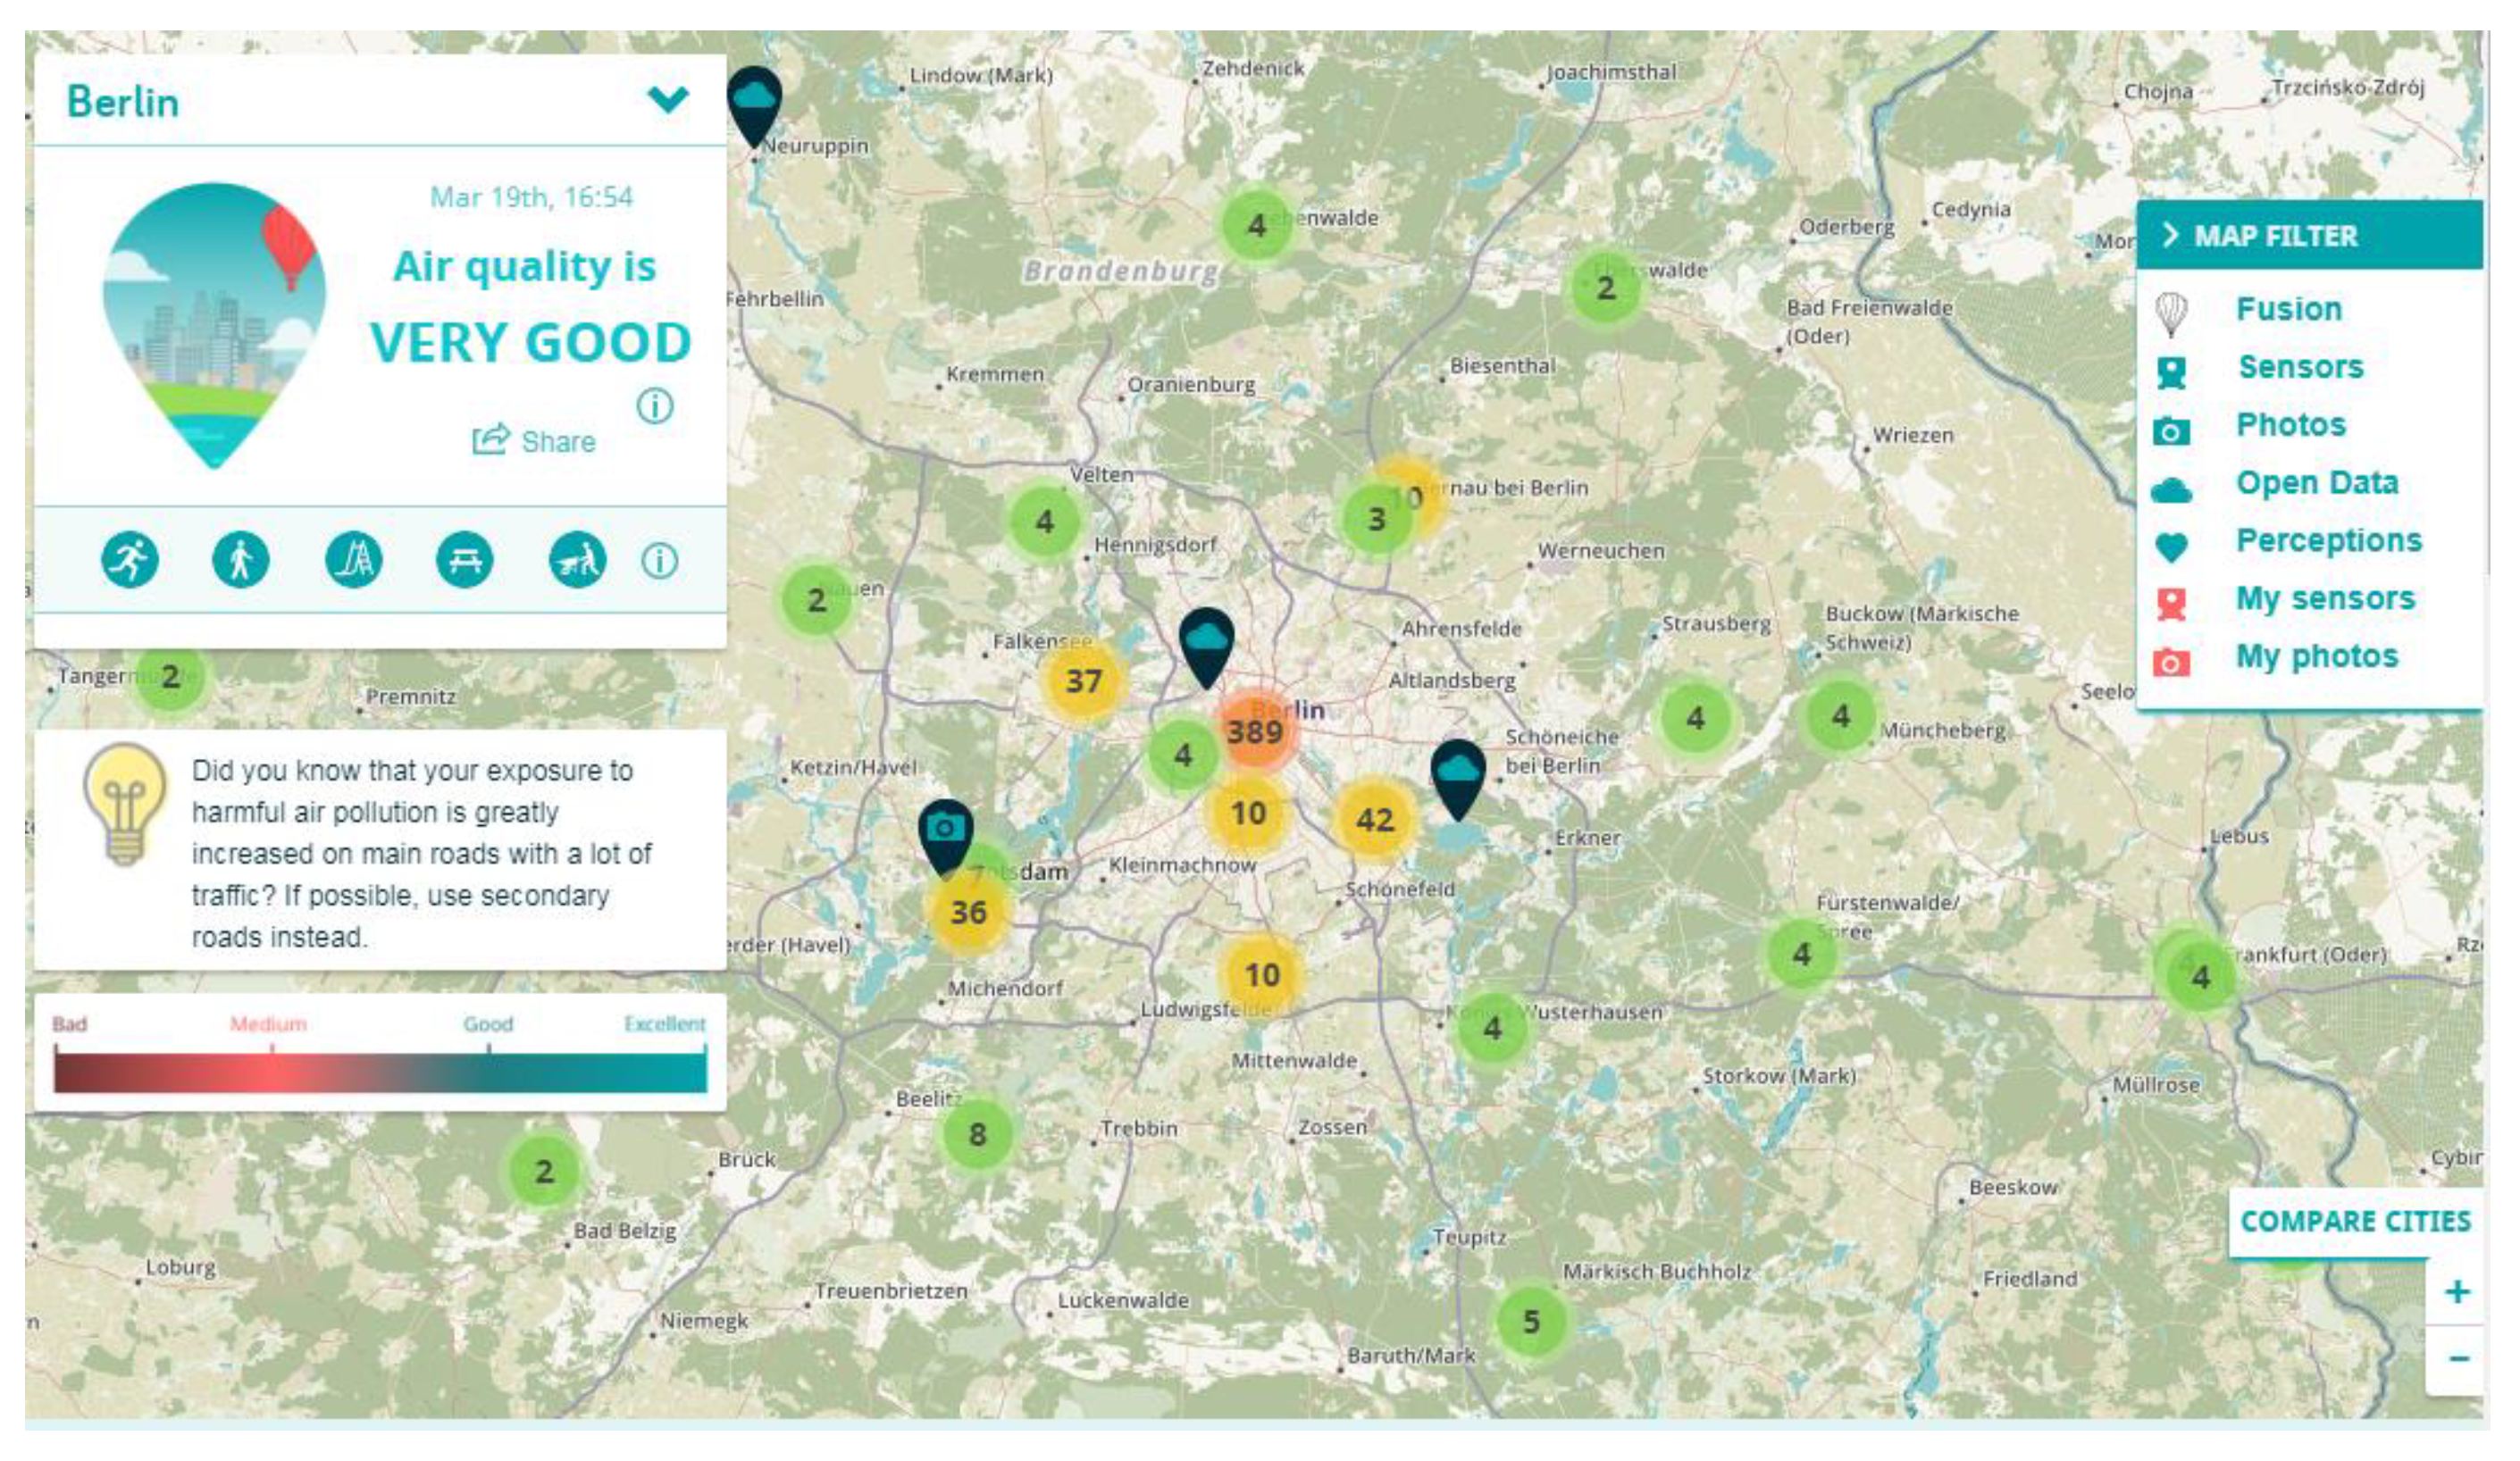
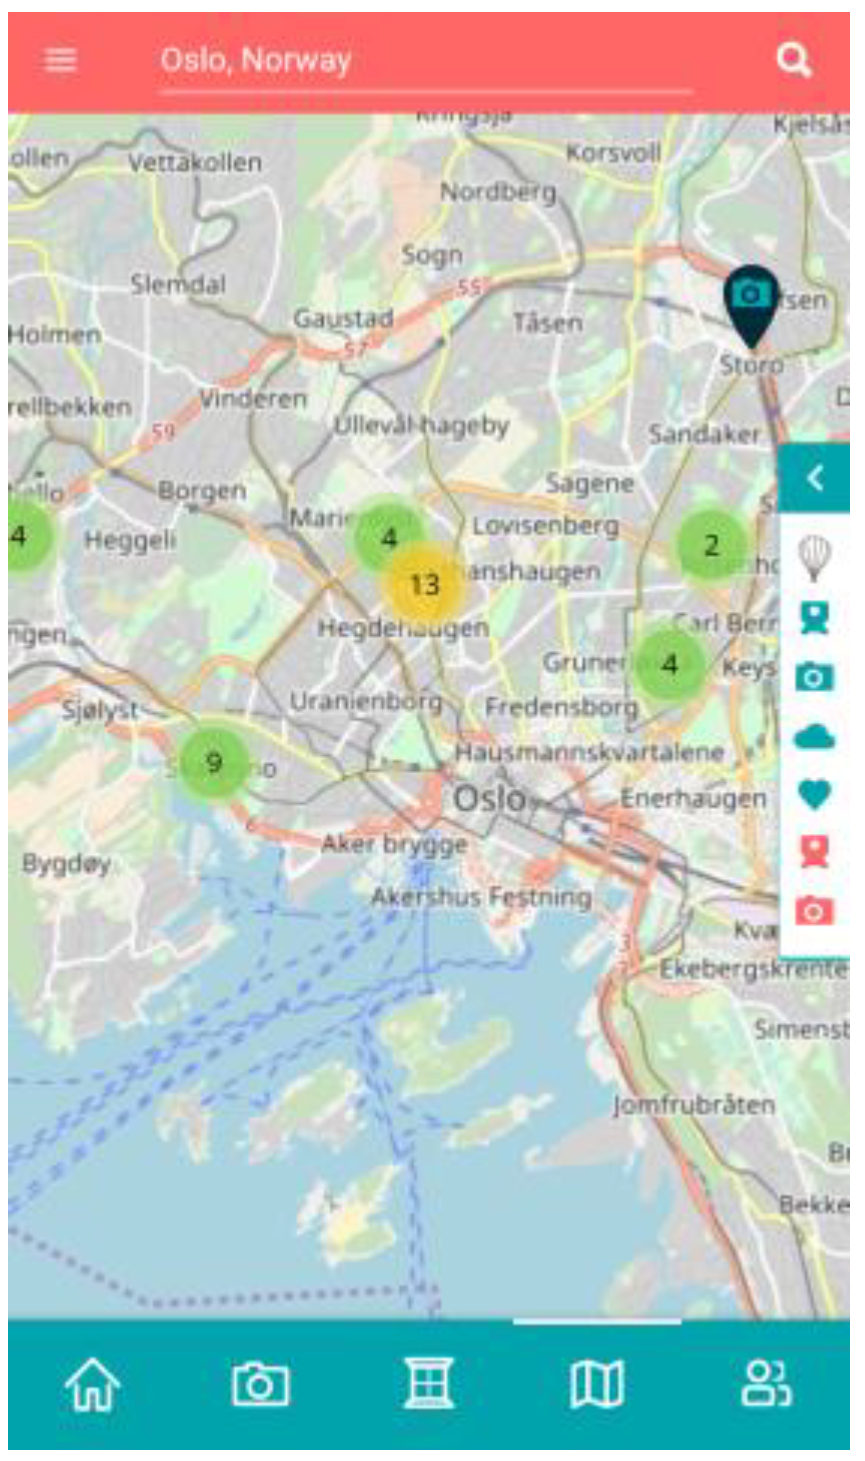
The interface of the platform was designed by User Interface/User Experience (UI/UX) experts to ensure the best experience of users (
Figure 4 and
Figure 5).
2.8. Social Media Monitoring Tools for Relevant User Discovery
Besides the integrated hackAIR platform which implements all the core hackAIR technologies, a standalone social media monitoring tool has also been developed within hackAIR with the aim of increasing the outreach and adoption of the platform. This tool aims to support the discovery of social media accounts that belong to users or organizations that are interested in air quality issues and could therefore be approached and engaged.
The tool builds upon and extends an open-source software framework (
https://github.com/MKLab-ITI/mmdemo-dockerized) [
45] for monitoring, analysis, and search over multiple social media platforms. The framework offers powerful tools for (a) tracking social media discussions around keywords and user accounts of interest; (b) obtaining real-time analytics over the tracked keywords/accounts; (c) identifying new accounts; and (d) analyzing the structure of communities. Within hackAIR, two important extensions of the framework are implemented to cover the needs of the project with respect to (a) account discovery and (b) audience analysis.
The first extension is the development of a sophisticated methodology for discovering hackAIR-relevant accounts on different social media channels. The methodology is based on the collection of a large initial set of candidate user accounts from different social media platforms, and then on the application of automatic classifiers to separate between relevant and irrelevant accounts. The collection of candidate accounts is based on querying the respective platform APIs with a list of air-quality-related keywords, while additional candidate accounts are discovered with the help of an iterative exploration process based on Twitter lists and by monitoring air-quality-related streams of tweets. The classification of accounts into relevant and irrelevant is based on classification models trained on text features extracted from the accounts’ profile metadata (description) and their posts.
The second extension concerns the development of a solid methodology for analyzing the social media audience of hackAIR. Moving beyond the existing analytics tools of social media platforms, this methodology leverages social network analysis methods to create a more structured view of the hackAIR social media audience. Specifically, the network of hackAIR followers and their followers is analyzed with the help of a community detection algorithm to extract groups of Twitter accounts that are more densely connected to each other, and therefore correspond to topically and geographically focused communities. This result combined with the analysis of network connectivity of Twitter accounts leads to the discovery of influencers, i.e., accounts that are followed by many other accounts and that have an important role in their community.
Approaching and engaging with such accounts is expected to contribute significantly in increasing the outreach and adoption of hackAIR.

 ,
, 


