The Influence of Geographic Factors on Information Dissemination in Mobile Social Networks in China: Evidence from WeChat

 ,
,
Abstract
:1. Introduction
2. Datasets and Methods
2.1. WeChat Datasets
2.2. Geographic Location and Distance
- (i)
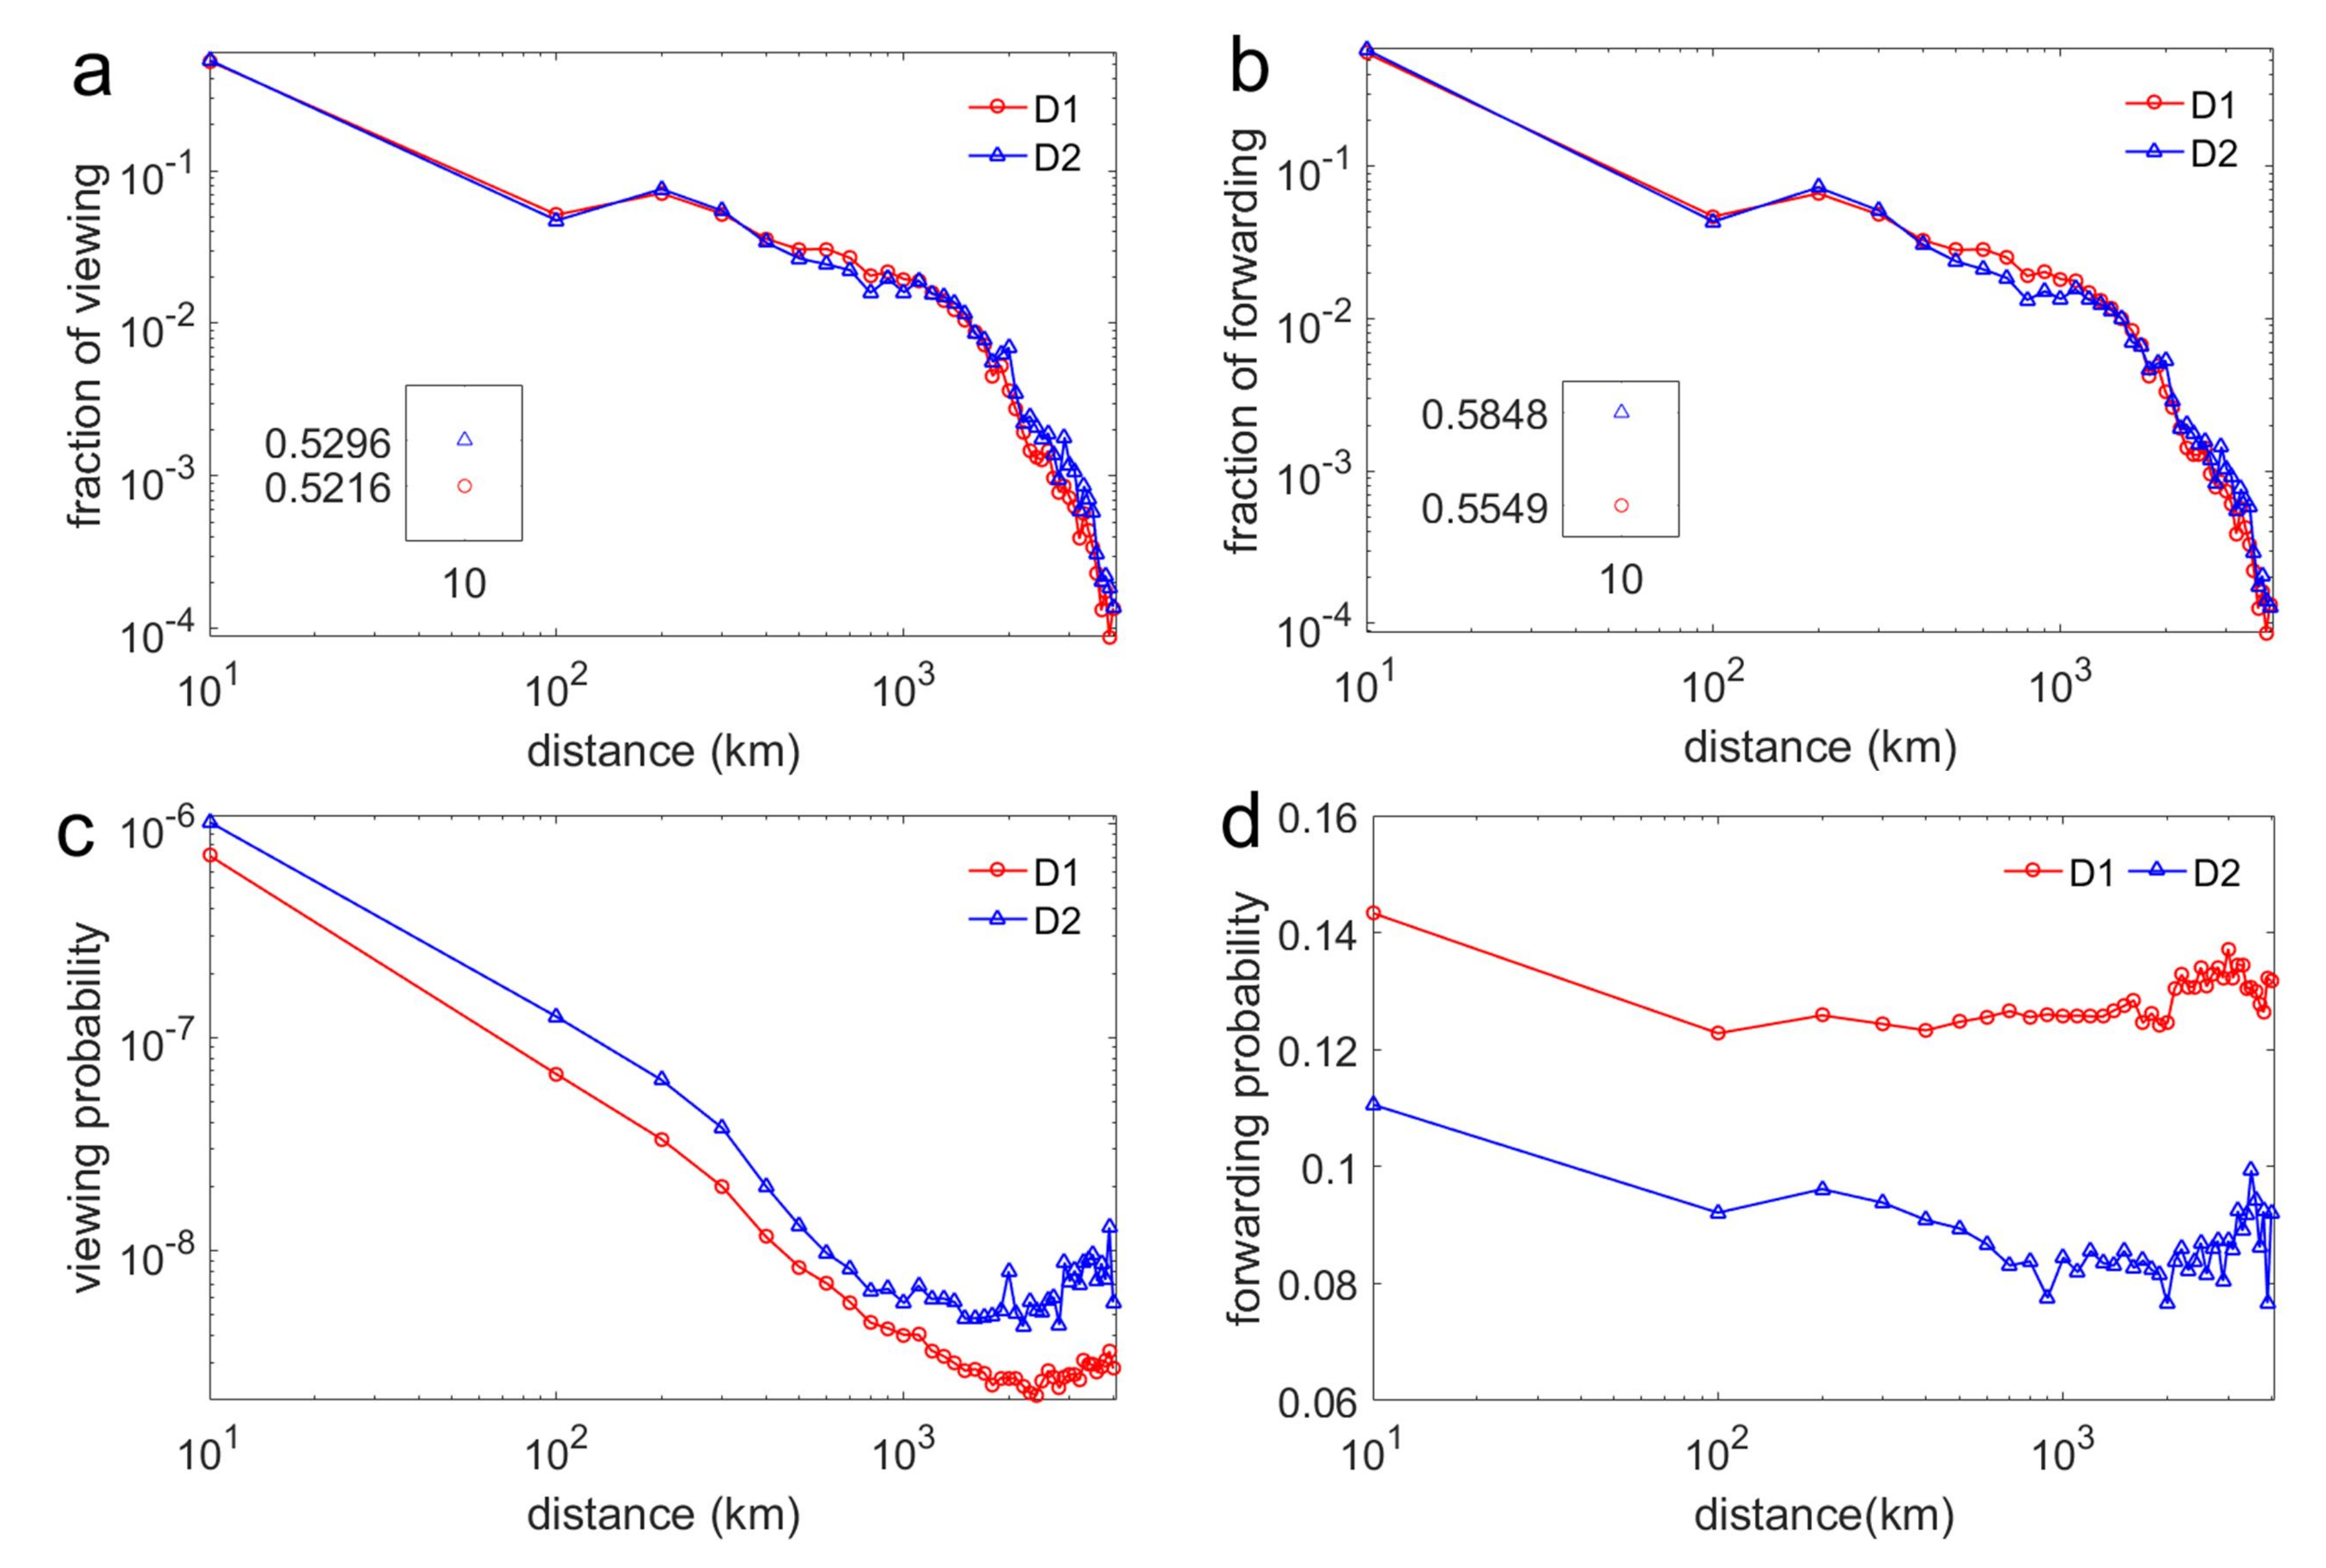
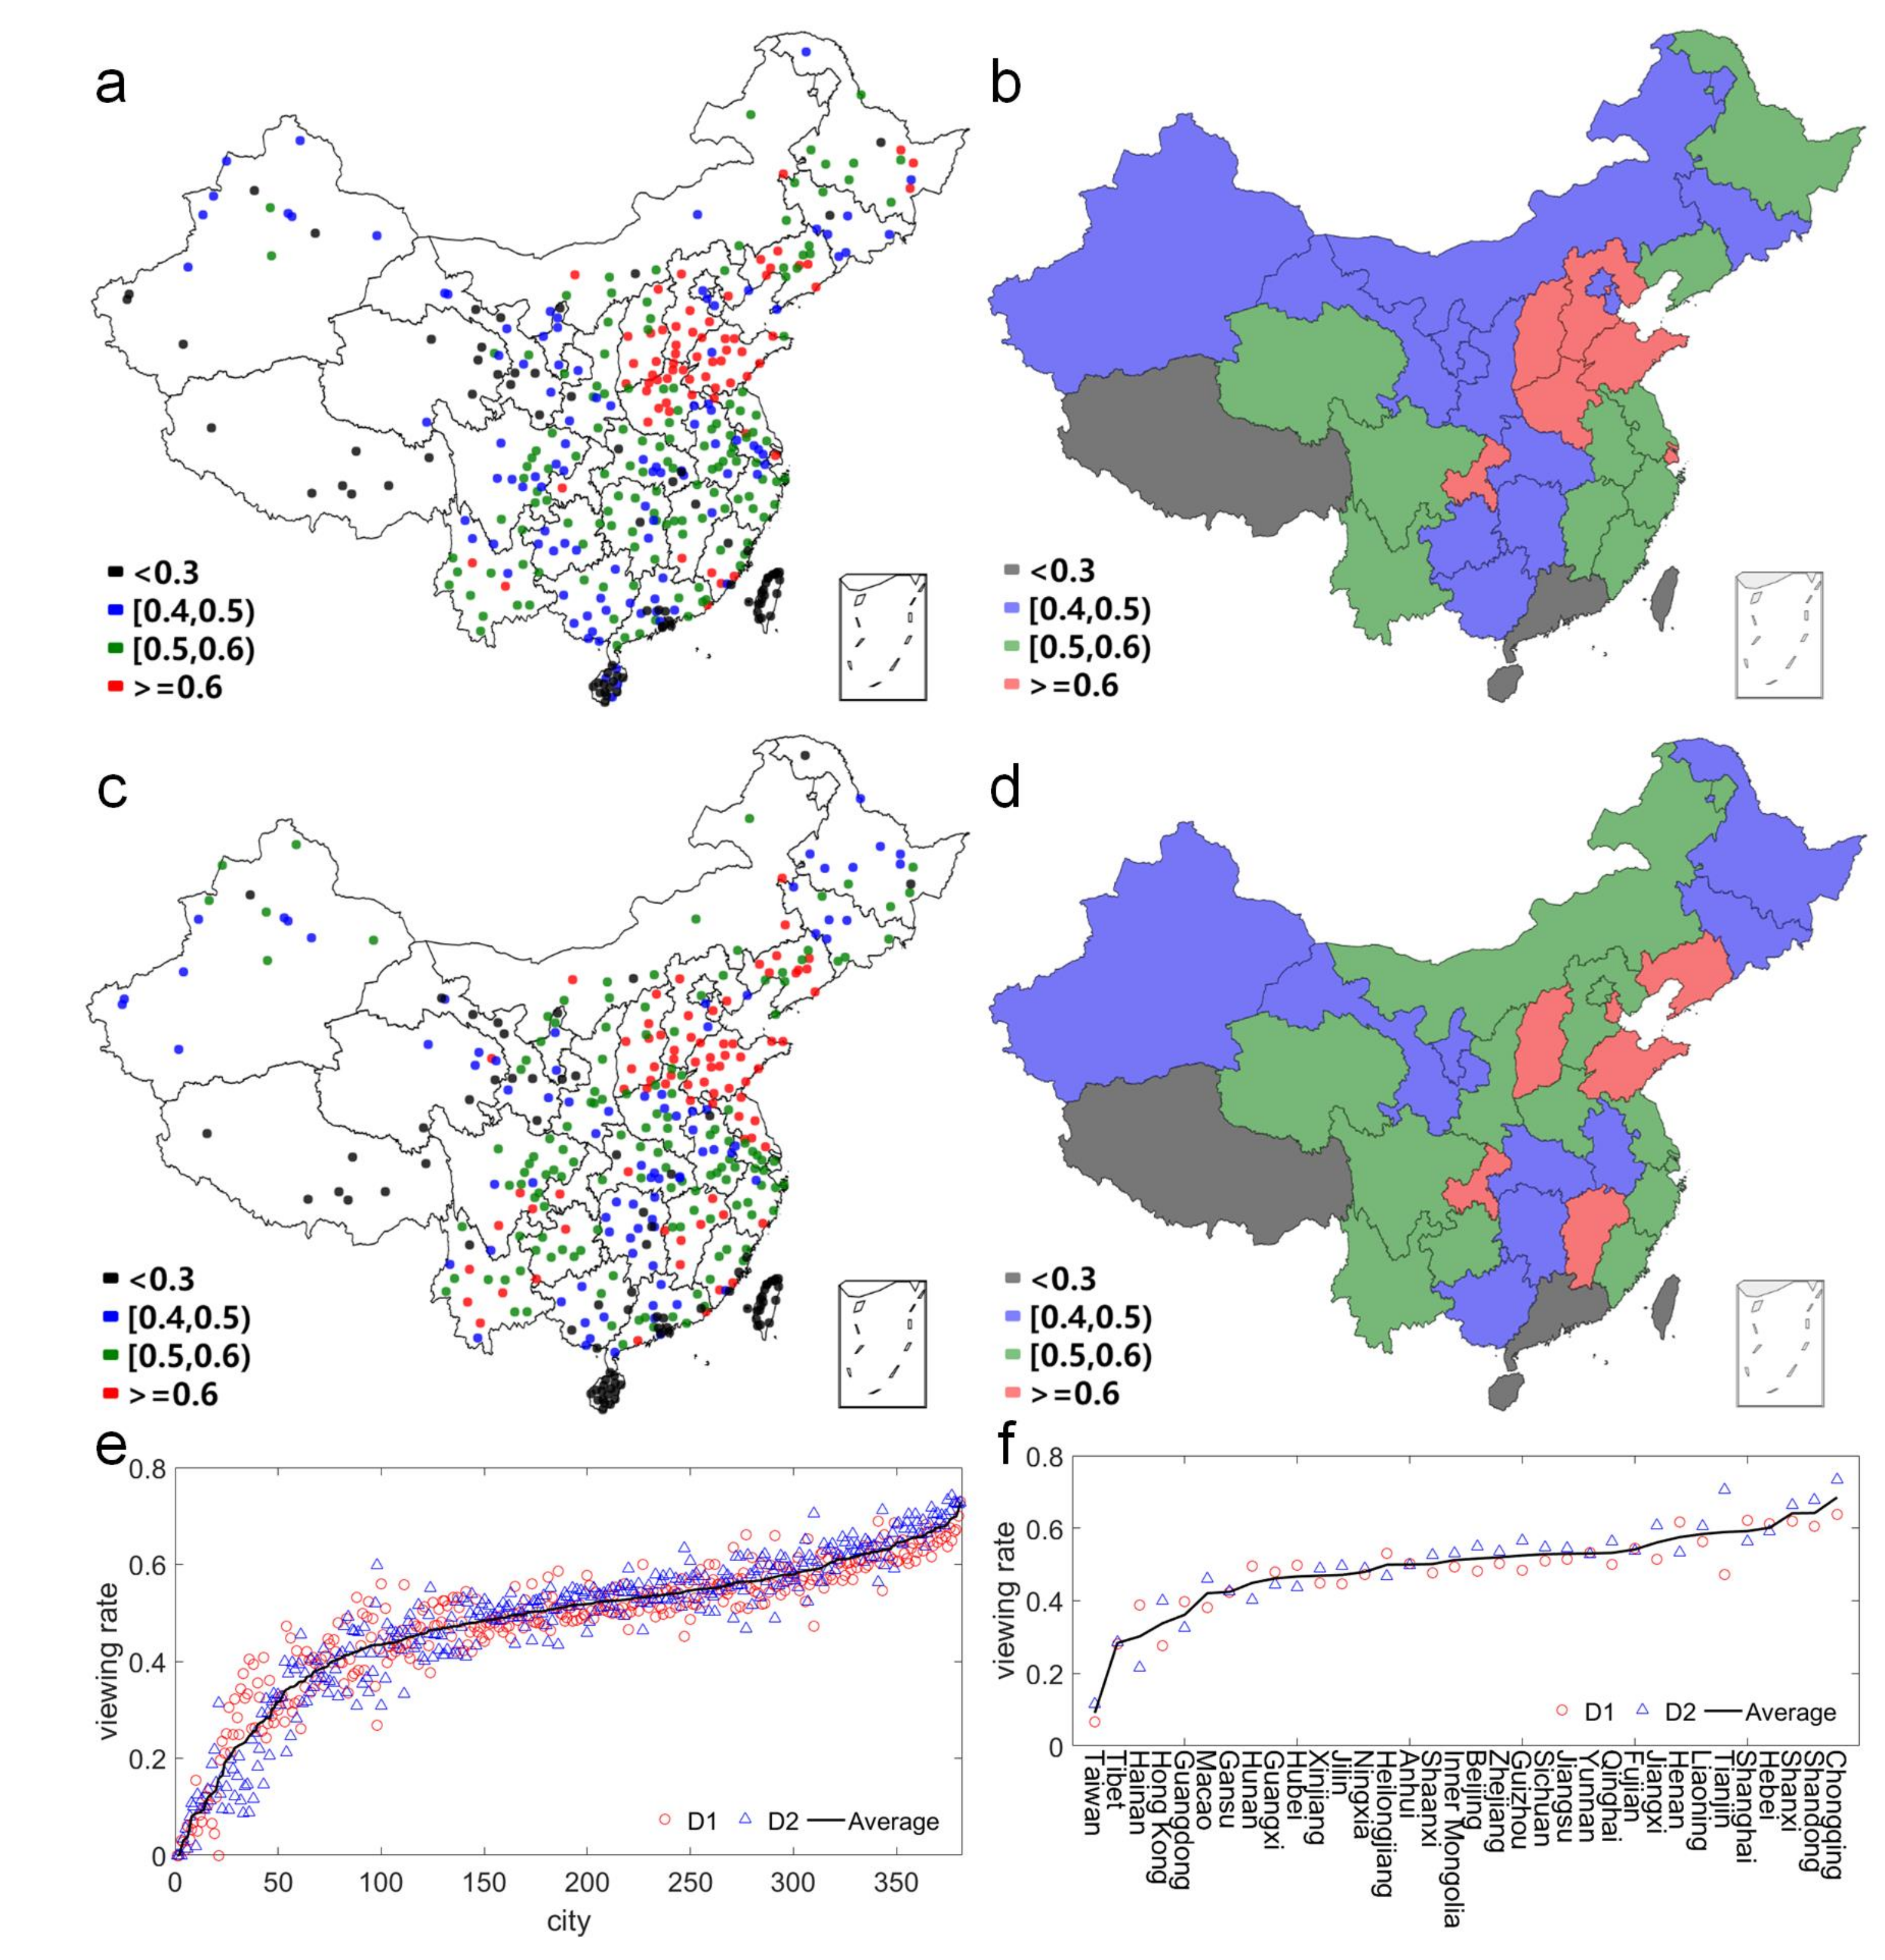
- The viewing probabilitywhere and denote the number of actual viewing action and possible viewing action in group d, respectively. It characterizes the availability or possibility of obtaining information. It is usually limited by the links of its social network.
- (ii)
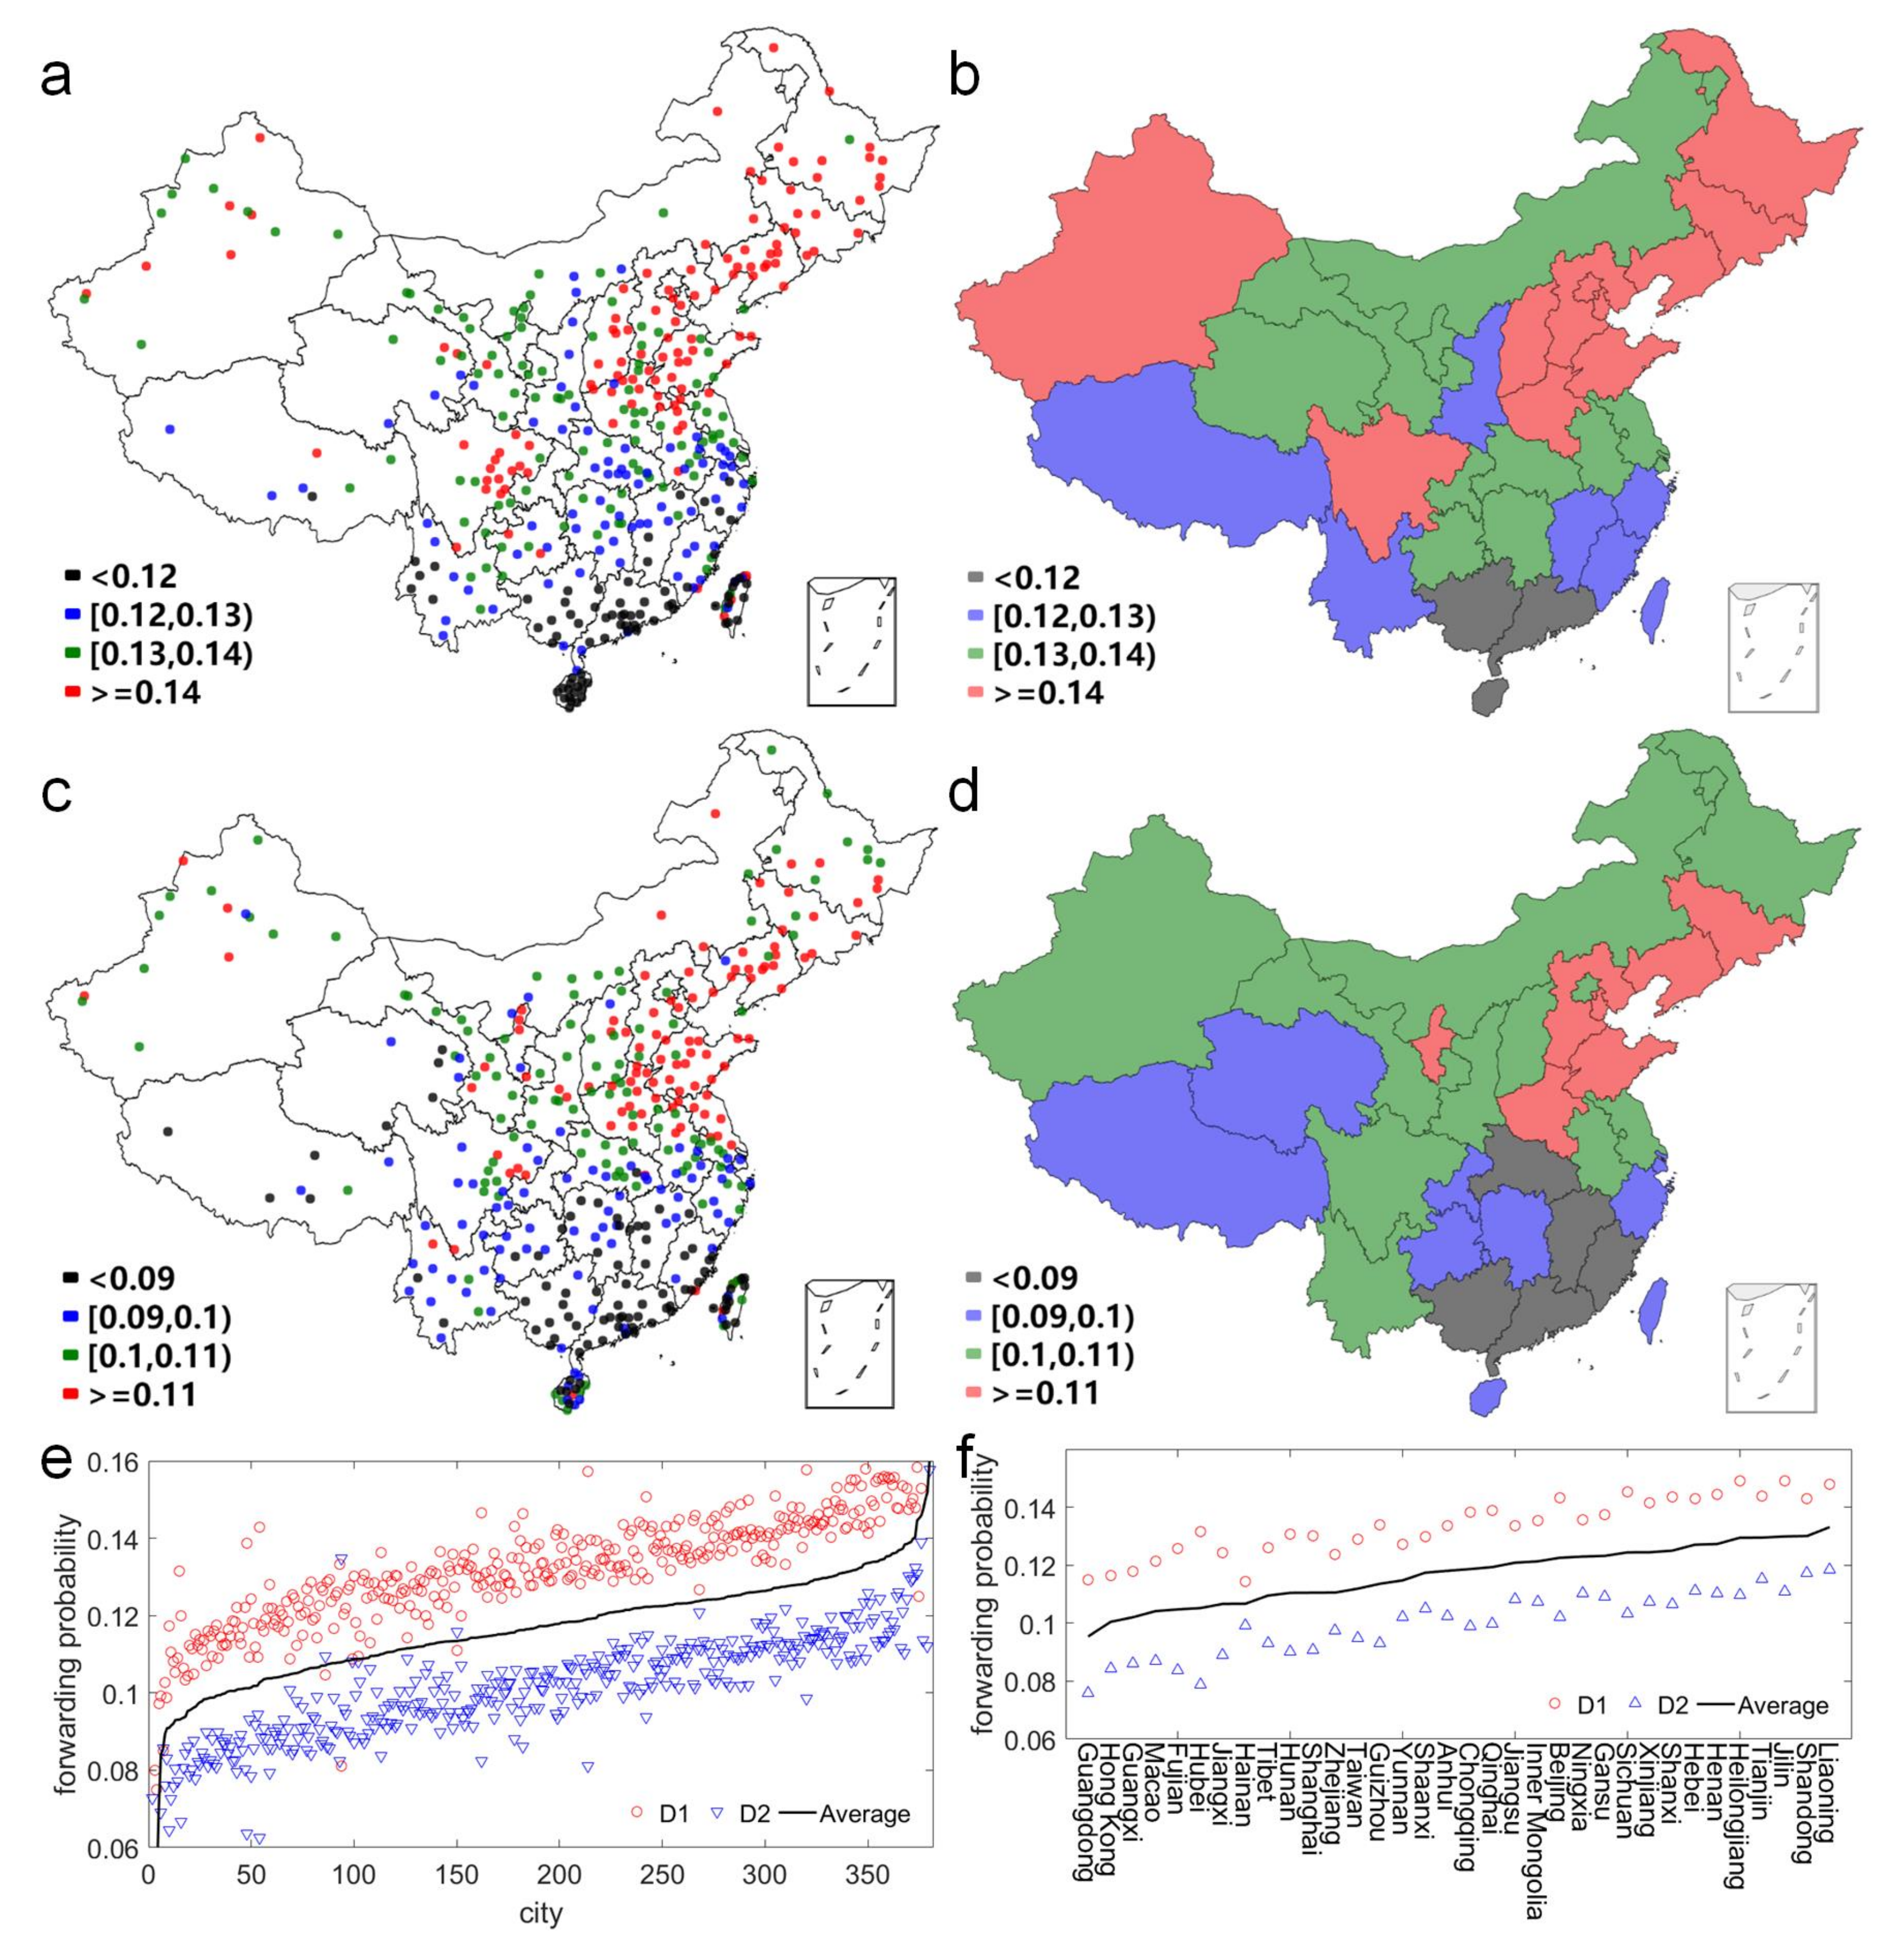
- The forwarding probabilitywhere and denote the number of actual forwarding action and viewing action in group d or l, respectively. It measures the value or possibility of spreading the information. It is generally determined by the correlation between information content and user’s preference.
- (iii)
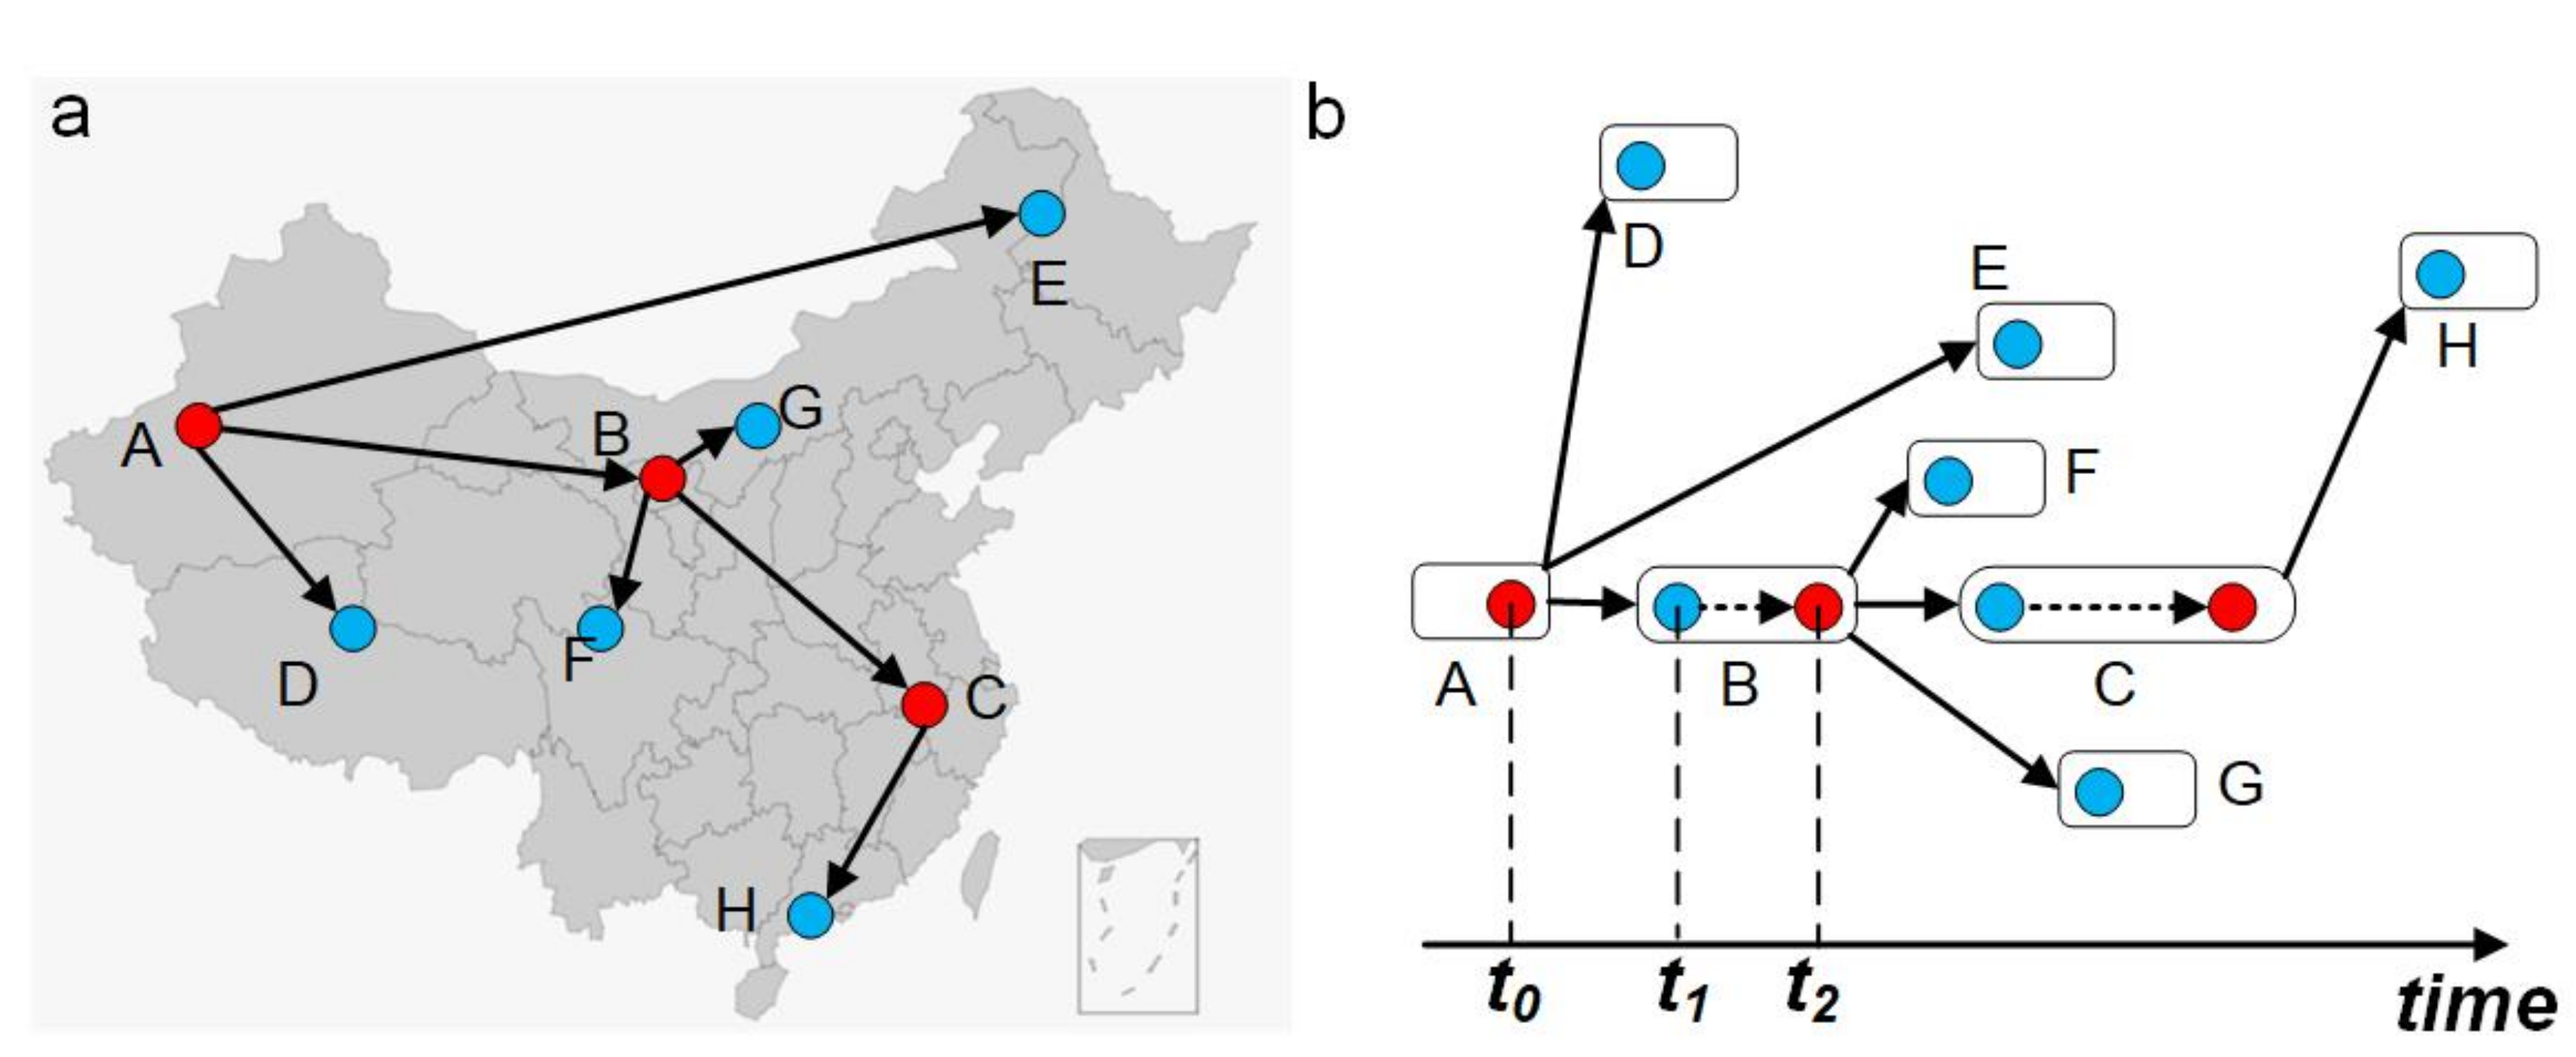
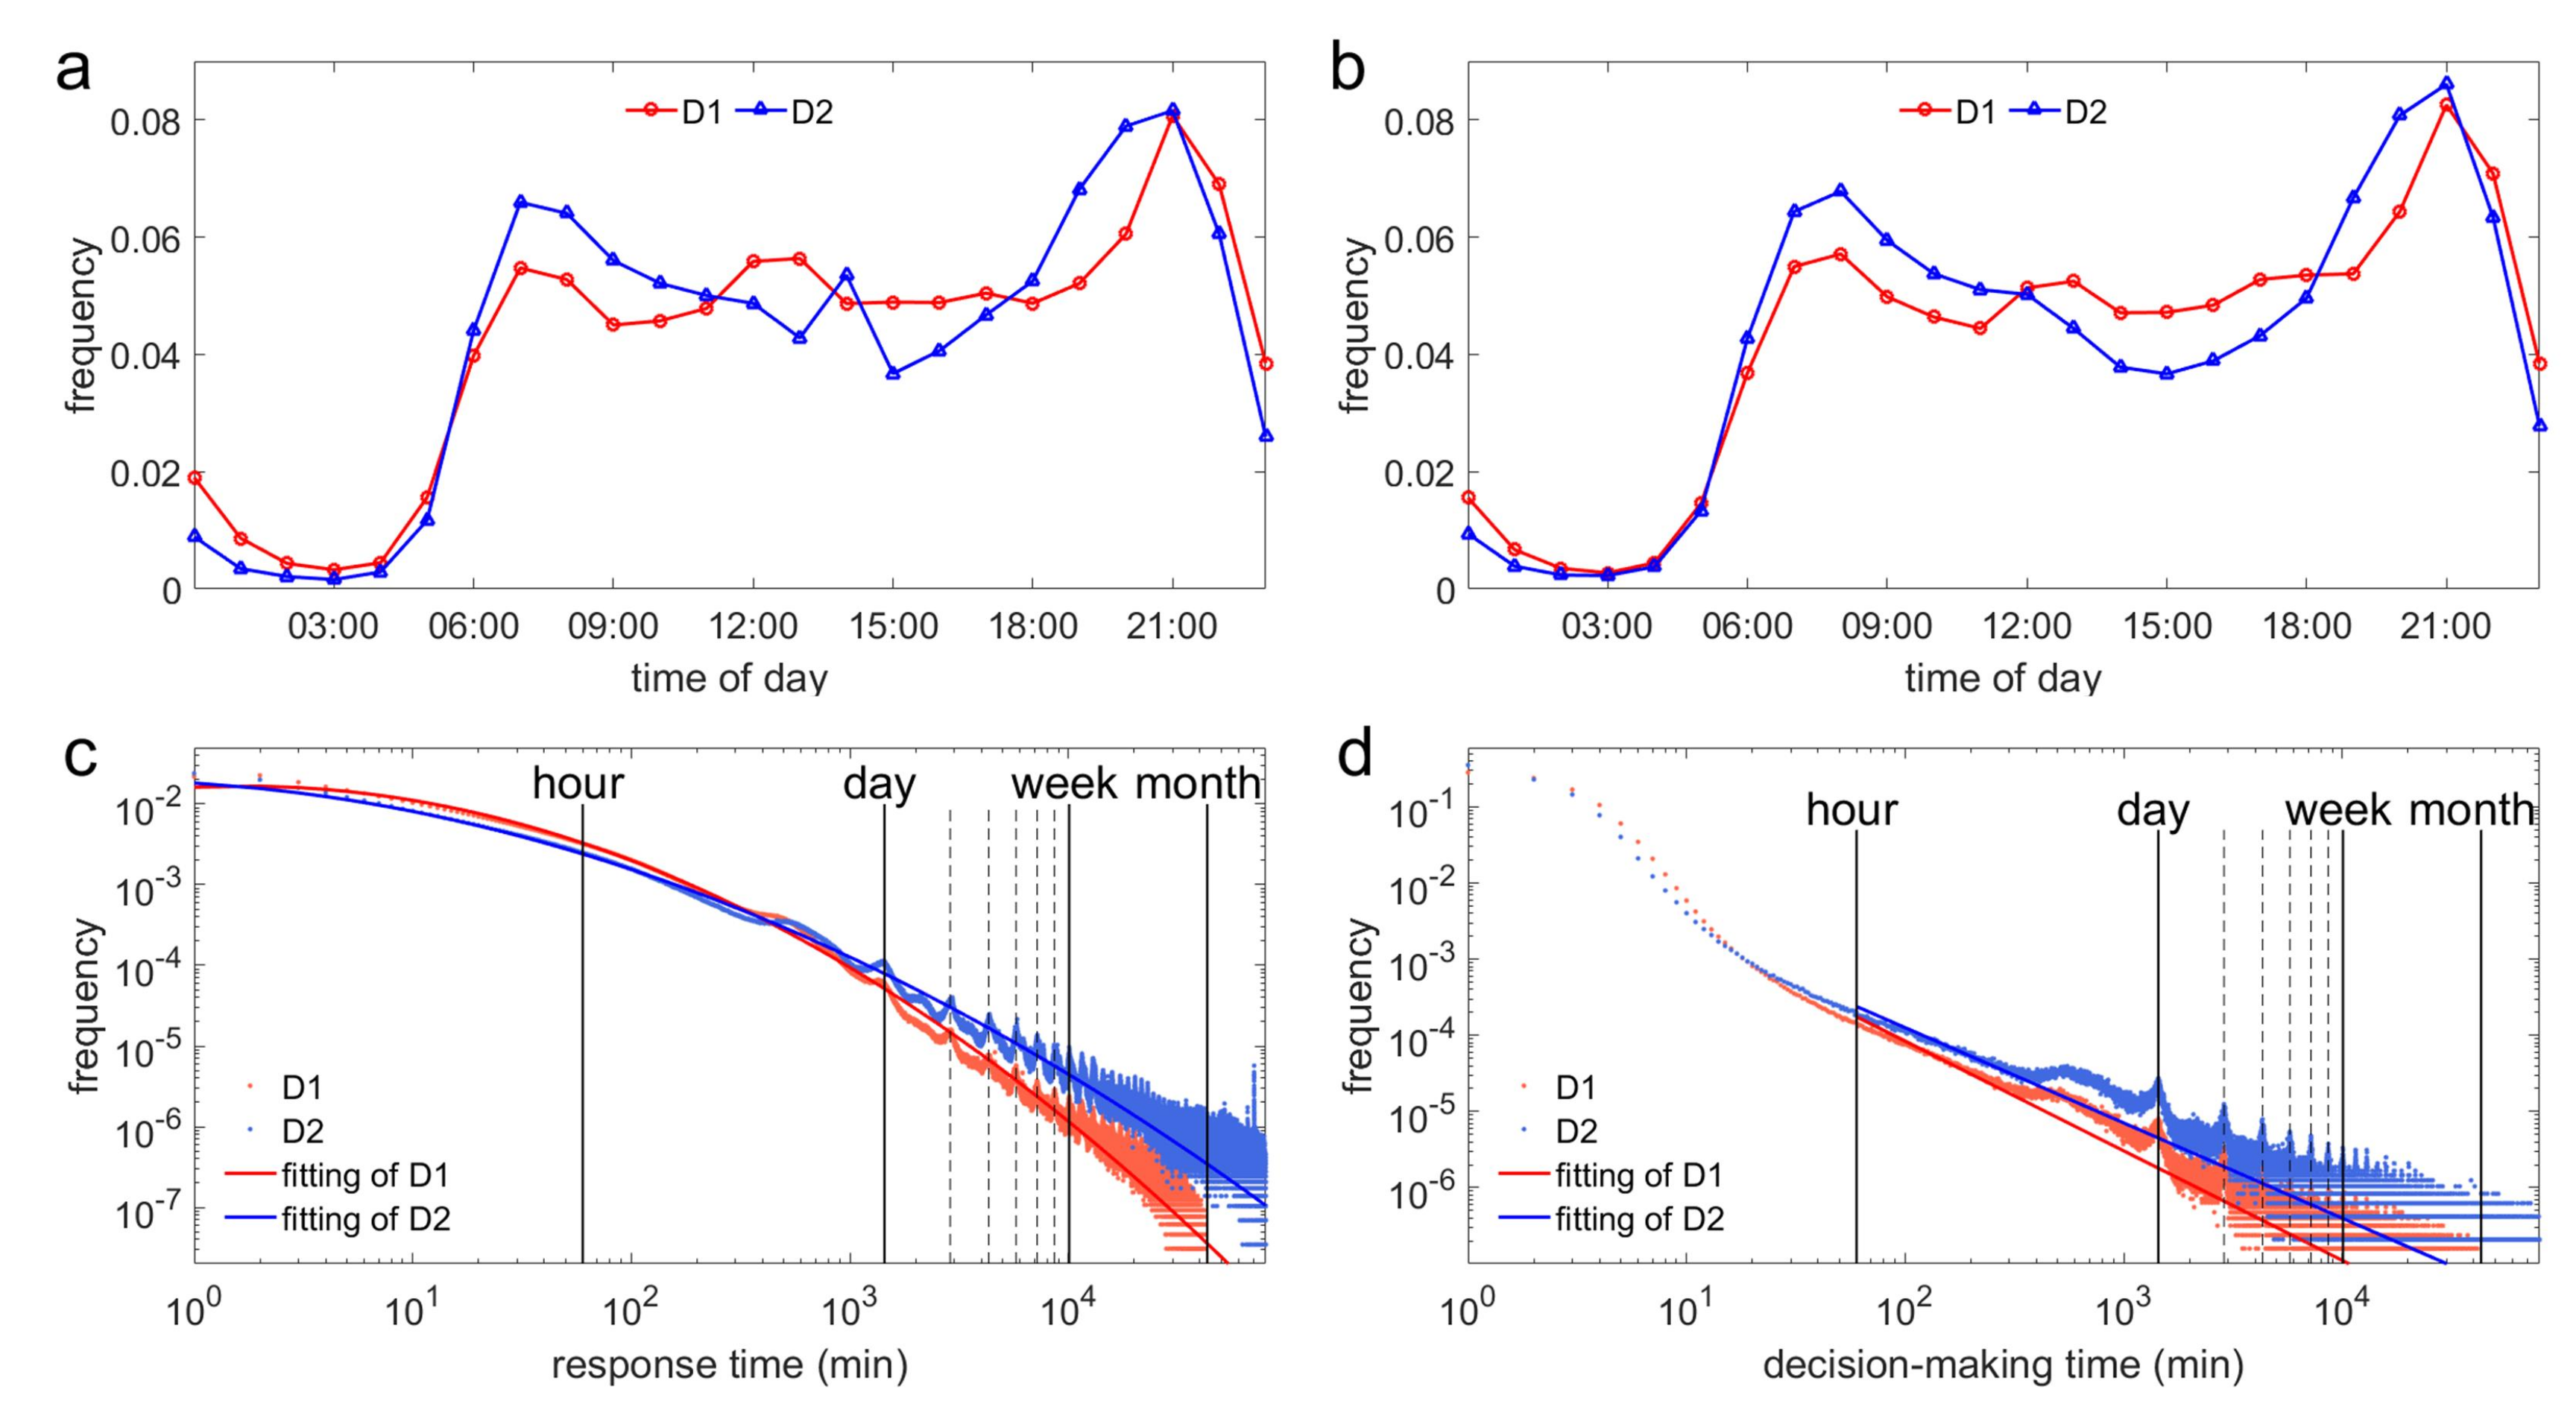
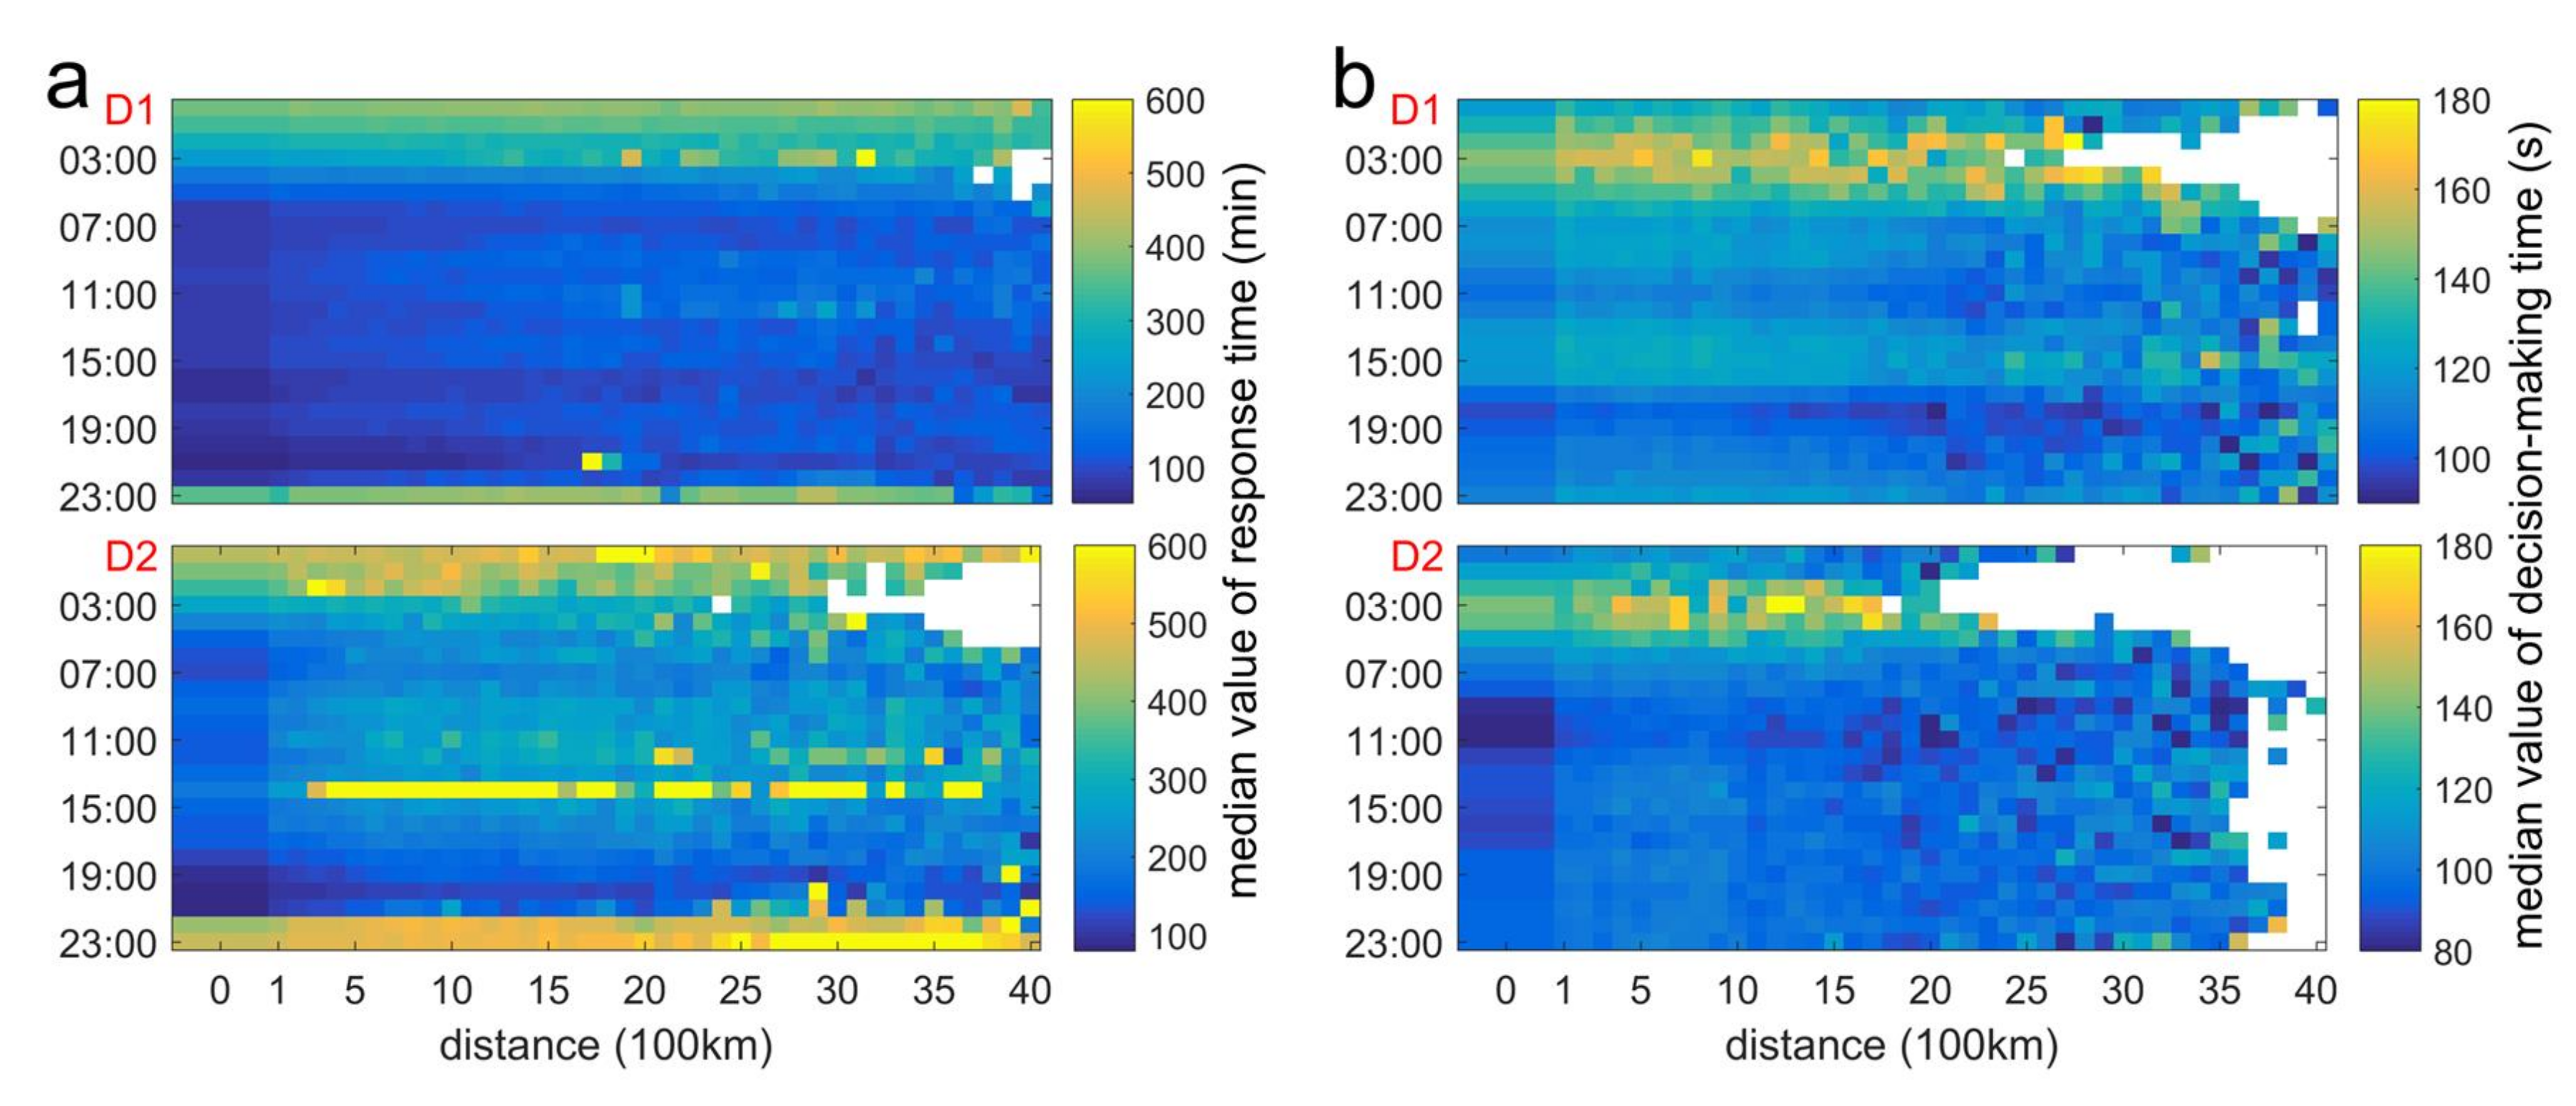
- The response timewhere denotes the time when the message was forwarded by others and denotes the time when the user views the message. It is a set of the time periods all users in group d take for viewing the information forwarded by others. It is usually determined by users’ habits and preferences of using social networking platforms.
- (iv)
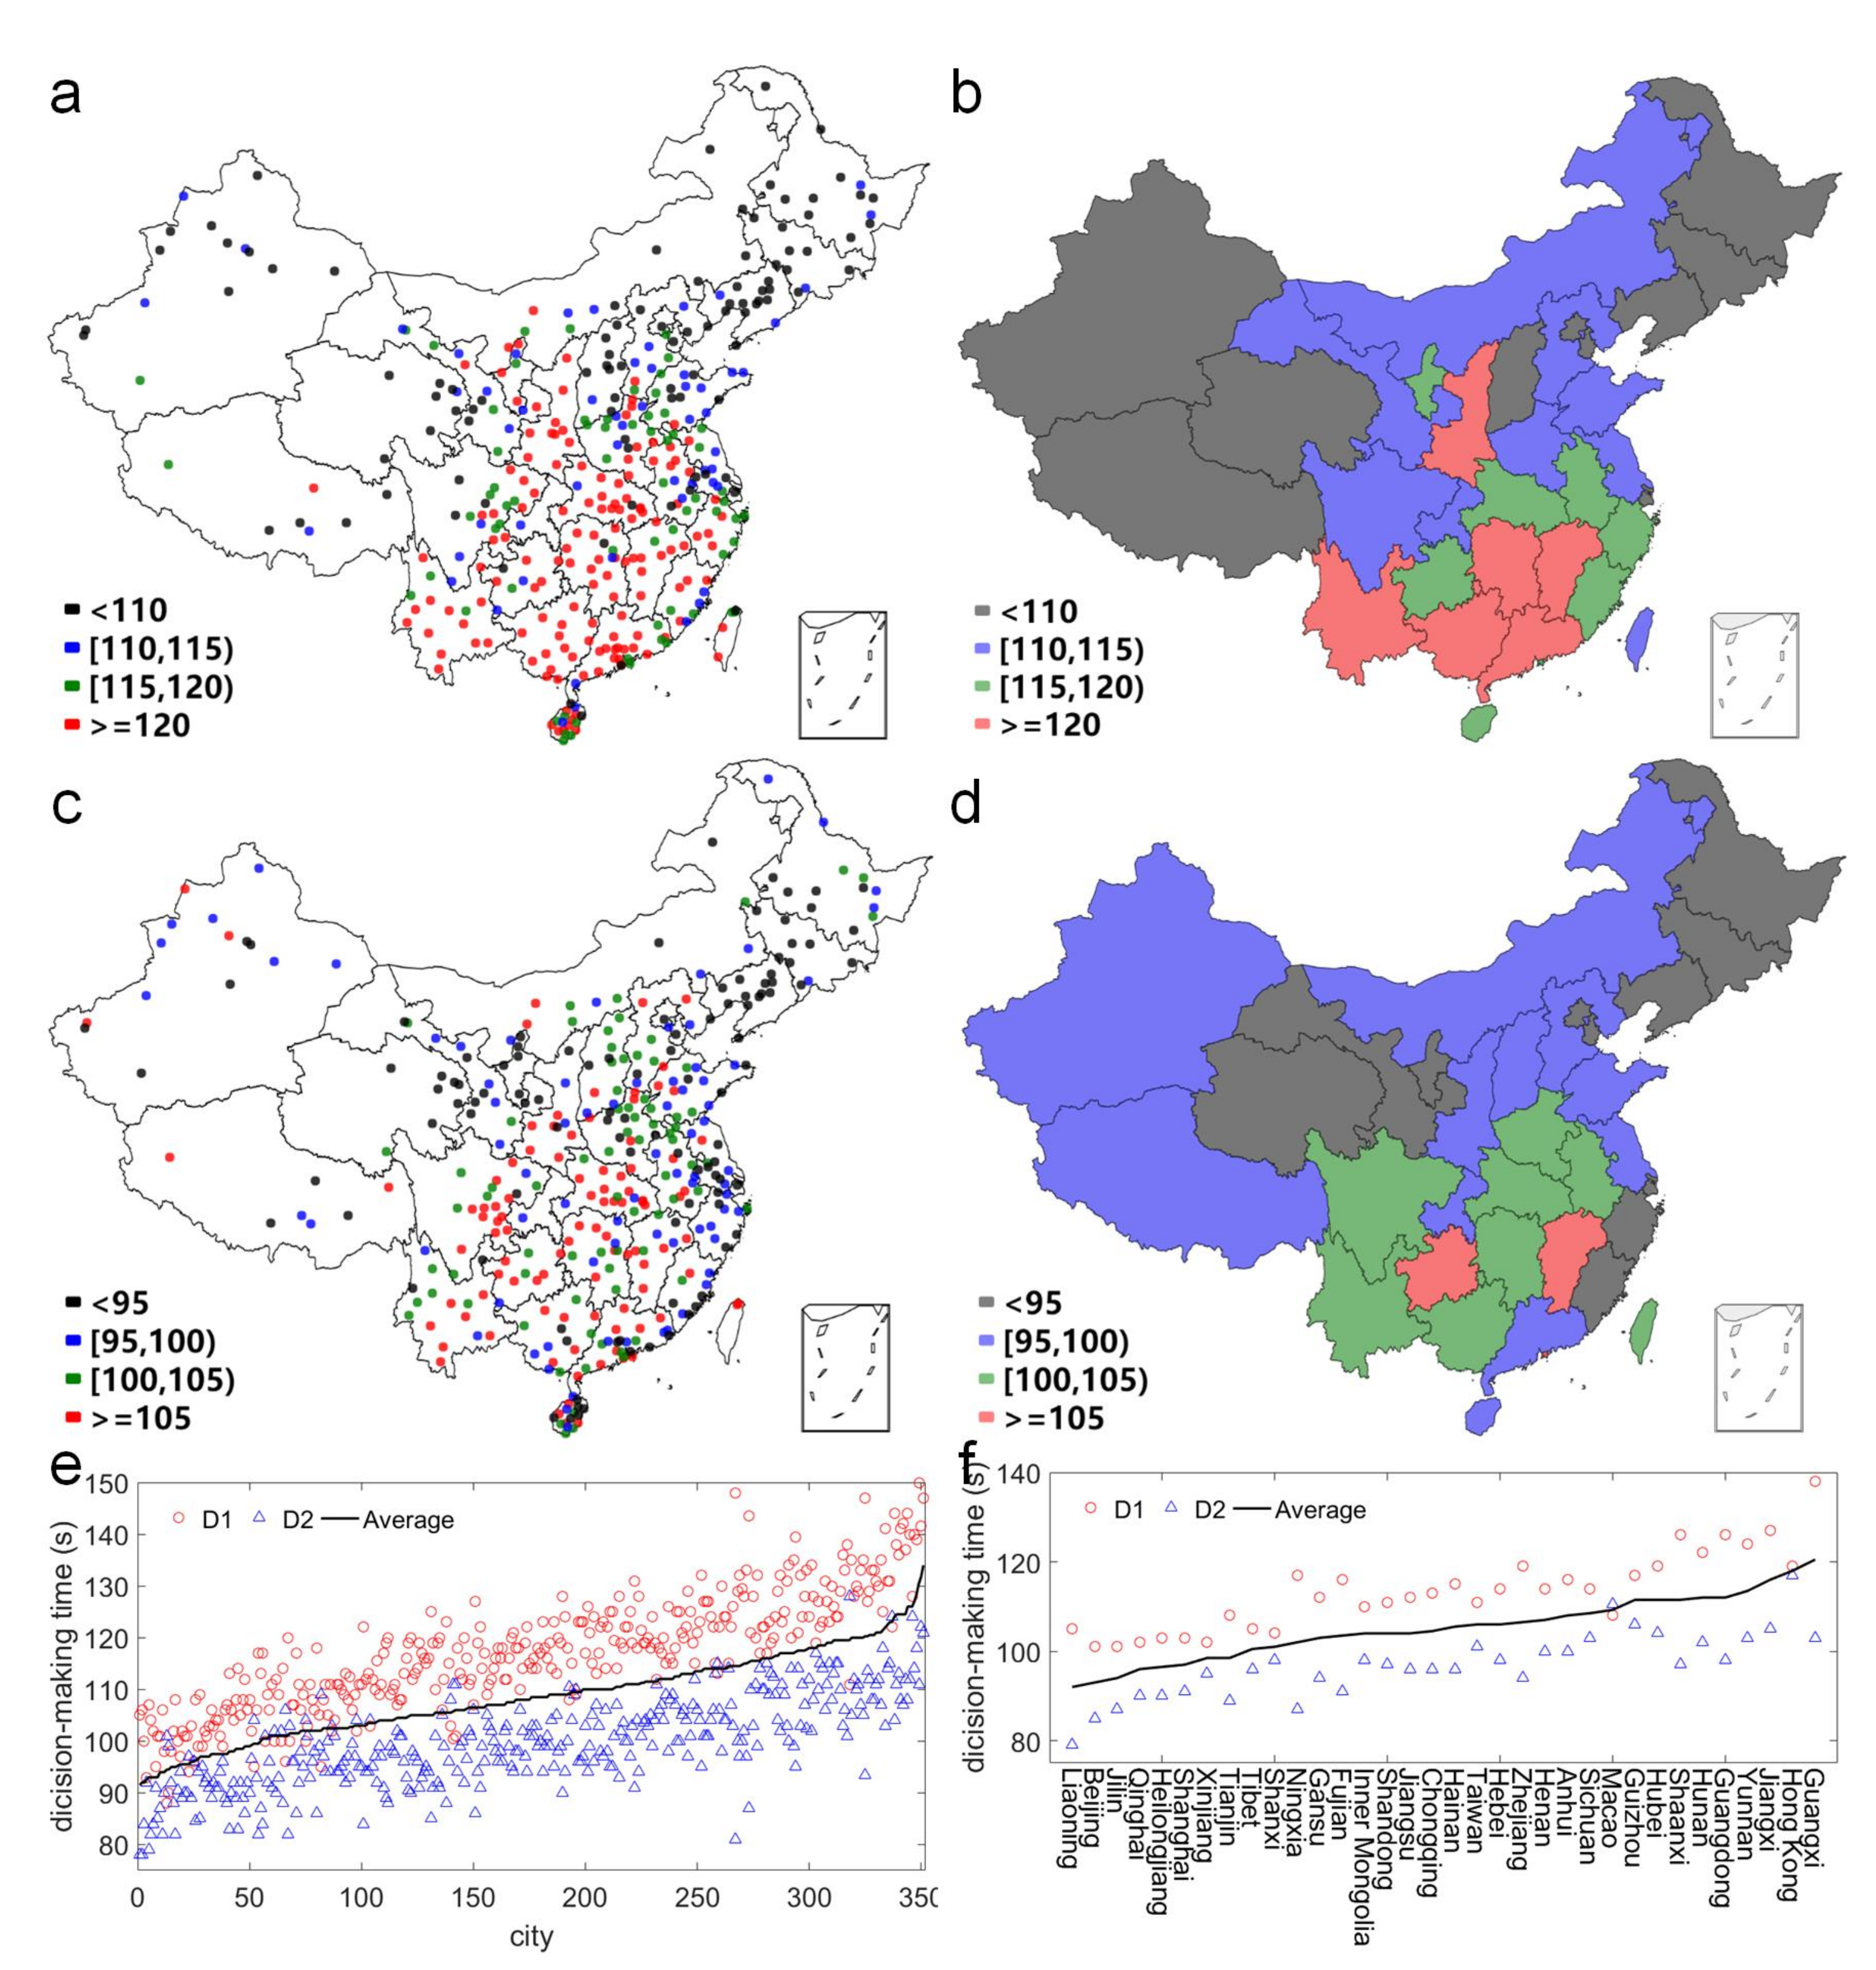
- The decision-making timewhere denotes the viewing time and denotes the forwarding time of the same user. It is a set of the time periods all users in group d or l take for forwarding the information after viewing. It often depends on the attraction of information content.
3. Results
3.1. Distance and Probability
3.2. Location and Probability
3.3. Distance and Velocity
3.4. Location and Velocity
4. Discussion and Conclusions
Supplementary Materials
Author Contributions
Acknowledgments
Conflicts of Interest
References
- York, S.N. Mobile Social Network; Springer: New York, NY, USA, 2016; 950p. [Google Scholar]
- Kwak, H.; Lee, C.; Park, H.; Moon, S. What is Twitter, a social network or a news media? In Proceedings of the 19th International Conference on World Wide Web, Raleigh, NC, USA, 26–30 April 2010; ACM: New York, NY, USA, 2010; pp. 591–600.
- Condessa, F.; Marculescu, R. From Ideas to Social Signals: Spatiotemporal Analysis of Social Media Dynamics. In Proceedings of the 2nd International Workshop on Social Sensing, Pittsburgh, PA, USA, 18–21 April 2017; ACM: New York, NY, USA, 2017; pp. 29–34. [Google Scholar]
- Guille, A.; Hacid, H.; Favre, C.; Zighed, D.A. Information diffusion in online social networks: A survey. ACM SIGMOD Rec. 2013, 42, 17–28. [Google Scholar] [CrossRef]
- Kietzmann, J.H.; Hermkens, K.; McCarthy, I.P.; Silvestre, B.S. Social media? Get serious! Understanding the functional building blocks of social media. Bus. Horiz. 2011, 54, 241–251. [Google Scholar] [CrossRef]
- Liu, L.; Chen, B.; Jiang, W.; He, L.; Qiu, X. Spatio-temporal dynamics of web pages diffused in WeChat. Inf. Discov. Deliv. 2017, 45, 139–148. [Google Scholar] [CrossRef]
- Liu, L.; Qu, B.; Chen, B.; Hanjalic, A.; Wang, H. Modeling of information diffusion on social networks with applications to WeChat. Phys. A Stat. Mech. Appl. 2018, 496, 318–329. [Google Scholar] [CrossRef]
- Mascolo, C. The Power of Mobile Computing in a Social Era. IEEE Internet Comput. 2010, 14, 76–79. [Google Scholar] [CrossRef]
- Barabási, A.L.; Albert, R. Emergence of scaling in random networks. Science 1999, 286, 509–512. [Google Scholar] [PubMed]
- Watts, D.J. A simple model of global cascades on random networks. Proc. Natl. Acad. Sci. USA 2002, 99, 5766–5771. [Google Scholar] [CrossRef] [PubMed]
- Hethcote, H.W. The mathematics of infectious diseases. SIAM Rev. 2000, 42, 599–653. [Google Scholar] [CrossRef]
- Barabási, A. The origin of bursts and heavy tails in human dynamics. Nature 2005, 435, 207–211. [Google Scholar] [CrossRef] [PubMed]
- Yang, J.; Leskovec, J. Modeling information diffusion in implicit networks. In Proceedings of the 2010 IEEE International Conference on Data Mining, Washington, DC, USA, 13–17 December 2010; pp. 599–608. [Google Scholar]
- Zhou, T.; Han, X.P.; Yan, X.Y.; Yang, Z.M.; Zhao, Z.D.; Wang, B.H.; Center, W.S. Statistical Mechanics on Temporal and Spatial Activities of Human. Dianzi Keji Daxue Xuebao/J. Univ. Electron. Sci. Technol. China 2013, 4, 481–540. [Google Scholar]
- Feng, L.; Hu, Y.; Li, B.; Stanley, H.E.; Havlin, S.; Braunstein, L.A. Competing for attention in social media under information overload conditions. PLoS ONE 2015, 10, e0126090. [Google Scholar] [CrossRef] [PubMed]
- Qu, B.; Li, Q.; Havlin, S.; Stanley, H.E.; Wang, H. Nonconsensus opinion model on directed networks. Phys. Rev. E 2014, 90, 052811. [Google Scholar] [CrossRef] [PubMed]
- Bakshy, E.; Rosenn, I.; Marlow, C.; Adamic, L. The role of social networks in information diffusion. In Proceedings of the 21st international conference on World Wide Web, Lyon, France, 16–20 April 2012; ACM: New York, NY, USA, 2012; pp. 519–528. [Google Scholar]
- Baños, R.A.; Borge-Holthoefer, J.; Moreno, Y. The role of hidden influentials in the diffusion of online information cascades. EPJ Data Sci. 2013, 2, 1. [Google Scholar] [CrossRef]
- Laniado, D.; Volkovich, Y.; Scellato, S.; Mascolo, C.; Kaltenbrunner, A. The Impact of Geographic Distance on Online Social Interactions. Inf. Syst. Front. 2017. [Google Scholar] [CrossRef]
- Deville, P.; Song, C.; Eagle, N.; Blondel, V.D.; Barabãsi, A.L.; Wang, D. Scaling identity connects human mobility and social interactions. Proc. Natl. Acad. Sci. USA 2016, 113, 7047–7052. [Google Scholar] [CrossRef] [PubMed]
- Song, C.; Koren, T.; Wang, P.; Barabási, A. Modelling the scaling properties of human mobility. Nat. Phys. 2010, 6, 818–823. [Google Scholar] [CrossRef]
- Barthélemy, M. Spatial networks. Phys. Rep. 2011, 499, 1–101. [Google Scholar] [CrossRef]
- Scellato, S.; Noulas, A.; Lambiotte, R.; Mascolo, C. Socio-spatial properties of online location-based social networks. ICWSM 2011, 11, 329–336. [Google Scholar]
- Cho, E.; Myers, S.A.; Leskovec, J. Friendship and mobility: User movement in location-based social networks. In Proceedings of the 17th ACM SIGKDD International Conference on Knowledge Discovery and Data Mining, San Diego, CA, USA, 21–24 August 2011; ACM: New York, NY, USA, 2011; pp. 1082–1090. [Google Scholar]
- Illenberger, J.; Kai, N.; Flötteröd, G. The Role of Spatial Interaction in Social Networks. Netw. Spat. Econ. 2013, 13, 255–282. [Google Scholar] [CrossRef]
- Scellato, S.; Mascolo, C.; Musolesi, M.; Latora, V. Distance matters: Geo-social metrics for online social networks. In Proceedings of the WOSN 2010: 3rd Conference on Online social networks, Boston, MA, USA, 22–25 June 2010; p. 8. [Google Scholar]
- Erlander, S.; Stewart, N.F. The Gravity Model in Transportation Analysis—Theory and Extensions; CRC Press: Boca Raton, FL, USA, 1990. [Google Scholar]
- Barabási, A.L.; Maritan, A.; Simini, F.; González, M.C. A universal model for mobility and migration patterns. Nature 2012, 484, 96. [Google Scholar]
- Goldenberg, J.; Levy, M. Distance is not dead: Social interaction and geographical distance in the internet era. arXiv, 2009; arXiv:0906.3202. [Google Scholar]
- Mok, D.; Wellman, B.; Carrasco, J. Does distance matter in the age of the Internet? Urban Stud. 2010, 47, 2747–2783. [Google Scholar] [CrossRef]
- Leskovec, J.; Horvitz, E. Planetary-scale views on a large instant-messaging network. In Proceedings of the 17th International Conference on World Wide Web, Beijing, China, 21–25 April 2008; ACM: New York, NY, USA, 2008; pp. 915–924. [Google Scholar]
- Spiro, E.S.; Almquist, Z.W.; Butts, C.T. The Persistence of Division: Geography, Institutions, and Online Friendship Ties. Socius 2016, 2, 2378023116634340. [Google Scholar] [CrossRef]
- Brockmann, D.; Hufnagel, L.; Geisel, T. The scaling laws of human travel. Nature 2006, 439, 462–465. [Google Scholar] [CrossRef] [PubMed]
- Ugander, J.; Karrer, B.; Backstrom, L.; Marlow, C. The Anatomy of the Facebook Social Graph. arXiv Preprint, 2011; arXiv:1111.4503. [Google Scholar]
- Glassman, C.C.N.R. Location-Based Services: Foursquare and Gowalla, Should Libraries Play? J. Electron. Resour. Med. Libr. 2010, 7, 336–343. [Google Scholar]
- Lee, K.; Ganti, R.K.; Srivatsa, M.; Liu, L. When twitter meets foursquare: Tweet location prediction using foursquare. In Proceedings of the International Conference on Mobile and Ubiquitous Systems: Computing, Networking and Services, London, UK, 2–5 December 2014; pp. 198–207. [Google Scholar]
- Jurgens, D.; Finethy, T.; Mccorriston, J.; Xu, Y.T.; Ruths, D. Geolocation Prediction in Twitter Using Social Networks: A Critical Analysis and Review of Current Practice. In Proceedings of the The International Conference on Weblogs and Social Media, Oxford, UK, 26–29 May 2015. [Google Scholar]
- Tencent. Tencent Announces 2017 Fourth Quarter and Annual Results. Available online: https://www.tencent.com/en-us/investor.htm (accessed on 21 March 2018).
- Song, J.; Ke, X.U.; Song, M.; Zhan, X. Credibility evaluation method of domestic IP address database. J. Comput. Appl. 2014, 34, 4–6. [Google Scholar]
- Ai, C.; Chen, B.; He, L.; Lai, K.; Qiu, X. The national geographic characteristics of online public opinion propagation in China based on WeChat network. Geoinformatica 2018, 22, 311–334. [Google Scholar] [CrossRef]
- Chen, X. China City Statistical Yearbook 2016; China Statistic Press: Beijing, China, 2017. [Google Scholar]
- Libennowell, D.; Novak, J.; Kumar, R.; Raghavan, P.; Tomkins, A. Geographic routing in social networks. Proc. Natl. Acad. Sci. USA 2005, 102, 11623. [Google Scholar] [CrossRef] [PubMed]


| Datasets | Start | End | # Days | # Users | # Web Pages | # Viewing | # Forwarding |
|---|---|---|---|---|---|---|---|
| D1 | 1 July 2016 | 30 July 2016 | 30 | 155,596,910 | 2947 | 190,279,798 | 25,638,628 |
| D2 | 1 March 2017 | 30 April 2017 | 61 | 109,696,332 | 2688 | 101,152,500 | 10,130,554 |
| PADs | Beijing | Tianjin | Hebei | Shanxi | Inner Mongolia | Liaoning | Jilin | Heilongjiang | Shanghai |
| # cities | 1 | 1 | 11 | 11 | 12 | 14 | 9 | 13 | 1 |
| PADs | Jiangsu | Zhejiang | Anhui | Fujian | Jiangxi | Shandong | Henan | Hubei | Hunan |
| # cities | 13 | 11 | 16 | 9 | 11 | 17 | 18(1) | 17(4) | 14 |
| PADs | Guangdong | Guangxi | Hainan | Chongqing | Sichuan | Guizhou | Yunnan | Tibet | Shaanxi |
| # cities | 21 | 14 | 18(15) | 1 | 21 | 9 | 16 | 7 | 10 |
| PADs | Gansu | Qinghai | Ningxia | Xinjiang | Taiwan | Hong Kong | Macao | ||
| # cities | 14 | 8 | 5 | 15(1) | 22(*) | 1 | 1 |
© 2018 by the authors. Licensee MDPI, Basel, Switzerland. This article is an open access article distributed under the terms and conditions of the Creative Commons Attribution (CC BY) license (http://creativecommons.org/licenses/by/4.0/).
Share and Cite
Liu, L.; Chen, B.; Ai, C.; He, L.; Wang, Y.; Qiu, X.; Lu, X. The Influence of Geographic Factors on Information Dissemination in Mobile Social Networks in China: Evidence from WeChat. ISPRS Int. J. Geo-Inf. 2018, 7, 189. https://doi.org/10.3390/ijgi7050189
Liu L, Chen B, Ai C, He L, Wang Y, Qiu X, Lu X. The Influence of Geographic Factors on Information Dissemination in Mobile Social Networks in China: Evidence from WeChat. ISPRS International Journal of Geo-Information. 2018; 7(5):189. https://doi.org/10.3390/ijgi7050189
Chicago/Turabian StyleLiu, Liang, Bin Chen, Chuan Ai, Lingnan He, Yiping Wang, Xiaogang Qiu, and Xin Lu. 2018. "The Influence of Geographic Factors on Information Dissemination in Mobile Social Networks in China: Evidence from WeChat" ISPRS International Journal of Geo-Information 7, no. 5: 189. https://doi.org/10.3390/ijgi7050189