Article

A Smartphone-Based System for Outdoor Data Gathering Using a Wireless Beacon Network and GPS Data: From Cyber Spaces to Senseable Spaces

by
Eneko Osaba
1,2,3,*,
Roberto Pierdicca
4,
Eva Savina Malinverni
4,
Anna Khromova
4,
Fernando J. Álvarez
5 and
Alfonso Bahillo
1,2
1
DeustoTech—Fundación Deusto, Avda. Universidades, 24, 48007 Bilbao, Spain
2
Faculty of Engineering, University of Deusto, Avda. Universidades, 24, 48007 Bilbao, Spain
3
TECNALIA Research & Innovation, 48160 Derio, Spain
4
Dipartimento di Ingegneria Civile, Universtitá Politecnica delle Marche, Edile e dell’ Architettura Via Brecce Bianche, 60100 Ancona, Italy
5
Department of Electrical Engineering, Electronics and Automatics, Facultad de Ciencias, Edificio de Física, University of Extremadura, 06006 Badajoz, Spain
*
Author to whom correspondence should be addressed.
ISPRS Int. J. Geo-Inf. 2018, 7(5), 190; https://doi.org/10.3390/ijgi7050190
Submission received: 10 April 2018 / Revised: 11 May 2018 / Accepted: 12 May 2018 / Published: 15 May 2018
(This article belongs to the Special Issue Human-Centric Data Science for Urban Studies)

Abstract

:
Information and Communication Technologies (ICTs) and mobile devices are deeply influencing all facets of life, directly affecting the way people experience space and time. ICTs are also tools for supporting urban development, and they have also been adopted as equipment for furnishing public spaces. Hence, ICTs have created a new paradigm of hybrid space that can be defined as Senseable Spaces. Even if there are relevant cases where the adoption of ICT has made the use of public open spaces more “smart”, the interrelation and the recognition of added value need to be further developed. This is one of the motivations for the research presented in this paper. The main goal of the work reported here is the deployment of a system composed of three different connected elements (a real-world infrastructure, a data gathering system, and a data processing and analysis platform) for analysis of human behavior in the open space of Cardeto Park, in Ancona, Italy. For this purpose, and because of the complexity of this task, several actions have been carried out: the deployment of a complete real-world infrastructure in Cardeto Park, the implementation of an ad-hoc smartphone application for the gathering of participants’ data, and the development of a data pre-processing and analysis system for dealing with all the gathered data. A detailed description of these three aspects and the way in which they are connected to create a unique system is the main focus of this paper.

1. Introduction

Information and Communication Technologies (ICTs) and mobile devices, as a key achievement of human being, are profoundly influencing all facets of life. ICTs, besides awakening a strong interest and attraction for many people in their everyday life, are tools for supporting urban development and can be adopted as equipment for furnishing public spaces.
By intertwining the digital and the physical worlds, ICTs create a new paradigm of hybrid space that can be defined as Senseable Spaces. In other words, the mediated space brings a dynamic and hybridized aspect to physical space [1]. Even if there are relevant cases where the adoption of ICTs has made the use of Public Open Spaces (POSs) more “smart” [2], the possible interrelation and the recognition of an added value need to be further developed. This is one of the main motivations for the research presented here.
Digital services provided for experiencing a POS are now mainly employed through the use of map or web-based applications, which force users to search for their preferred path or location. Furthermore, the space is not smart enough to collect the information from users, apart from the main Big Data Players, such as Google, which do not provide public access to these data. Hence, a space that can sense users’ presence and provide according information is still broadly missing.
In line with this, the adoption of ICTs provides users with new instruments to enhance their experience of visiting and discovering a place; at the same time, they represent a valuable source of information that could be used for the planning process. This research addresses the topic of exploring the relationship between space, users, and technologies, investigating how pervasive digital tools can augment our environments and can leverage new interactivity. Modern technological applications can dynamically deliver different kinds of data to the users, but they also allow for the extraction of data from them. Thus, we have coined the term Senseable Space to define these kinds of spaces capable of providing users with contextual services, to measure and analyze their dynamics, and to react accordingly, in a seamless exchange of information. This new paradigm of hybridized space is, in part, inspired by the work of the Senseable City Lab at the MIT of Boston (http://senseable.mit.edu), MA, USA, founded in 2003 by Carlo Ratti. This aspect will be detailed in the Section 2.
It is important to understand that ICTs are not just an “add-on” to a place, but represent a boost for planners during the design process, providing new possibilities for urban planners and designers, as well as for landscape architects. Monitoring and tracking the so-called User Generated Data (UGD) represent a future pathway for observing, recording, and analyzing the dynamics of many kinds of environments (i.e., cities, POSs, rural areas, etc.) and, more generally, the behavior of people who live in and enjoy these spaces.
To this end, a great advantage is offered by the use of mobile devices, which nowadays can be seen as an extension of the human body and, for this reason, can be used as an “active sensor” that can, at every moment, tell us something about the user. The combination of space sensing and user localization services plays a pivotal role in data collection [3]. The digital footprints [4], left by individuals in their daily activities, can be used for statistics and extracting metrics about socio-spatial behavior. This information is geolocated, and provides numerous opportunities, as they offer the possibility of working with a great deal of spatial and temporal data, always available and always updated. This study of such footprints is one of the foci of the present paper.
Given the above, actors that are involved in this kind of process are restricted to visitors and planners. Visitors have access to interactive experiences and can naturally discover unfamiliar places. They can be tourists, for example, who search for new and unique experiences. Residents also use the place in their daily lives if it suits their needs. They can be seen as visitors as well. The other kind of users are the planners, who create spaces that can satisfy users.
The application reported in the following sections (the CyberCardeto app) has been developed and tested in a real scenario in order to validate the feasibility of the mentioned paradigm of Senseable Spaces, both in terms of giving and receiving information to and from the users. In this light, the main objective of this research work, conducted in the context of the European COST Action TU1306—Cyberparks, is the deployment of a system composed of three different connected elements (a real-world infrastructure, a data gathering system, and a data processing and analysis platform) in the open space of Cardeto Park, in Ancona, Italy. Its deployment is multi-purpose and underpins several aspects such as human behavior analysis, the livability of POS, maintenance, planning or decisions, and policies.
Since such deployment is a complex task, several actions have been performed and are listed here as the main contributions of this paper:
  • The deployment of a real-world infrastructure in Cardeto Park.
  • The development of an ad-hoc smartphone application, CyberCardeto, for the gathering of participants’ data.
  • The implementation of a data pre-processing and analysis system to deal with the data gathered both by beacons and the smartphone application, in order to obtain valuable information for the analysis of the users’ behavior.
An in-depth description of these three aspects and the way in which they are connected to create a unique system is the main focus of this paper. Thoughout this paper, we will detail the real-world scenario, the kind of beacons used, the information that can be collected from the deployed system, and the main information that can be extracted from it. We will also provide real examples of valuable information that can be used for the analysis of users’ behavior in the park.
Furthermore, it should be highlighted that a considerable effort has been made in order to develop a system flexible enough to be easily adaptable to future new scenarios.
The rest of this paper is organized as follows. In Section 2, the background related with the developed work is presented. After that, the environment is described in depth, as well as the way in which we have deployed it (Section 3). The used beacons are also described in that section. Furthermore, in that same section, the developed and used smartphone application is detailed. The main outcomes that we can obtain from both application and beacons are then given in detail (Section 4). After that, the developed pre-processing and post analysis system is described in depth in Section 5; the system is used to deal with all the data generated in the deployed scenario. The experimentation and the analysis of the results obtained with the developed system and the available data are then presented in Section 6. The paper then concludes with some brief conclusions and further research topics (Section 7).

2. Background

Recent research trends demonstrate the importance of including more intelligence in surroundings, in order to transform them into digital environments aware of and “Senseable” of human presence [5].
In other words, whilst the Internet and GPS location can be a valid support to infer information about a user, it is particularly important to underline the crucial role of smart objects. In addition to their increasing miniaturization, sensors, actuators, and processing units can be purchased at very inexpensive prices. Their adoption in medium- and large-scale urban settings may facilitate the process of collecting digital footprints, which can be used as data to make statistics and to extract metrics about these spaces, directly from the users [6].
In the following, a brief literature review is presented to acquaint the reader with the latest approaches of data collection in POS. For the sake of completeness, some of the more relevant works in the literature have been conducted by the Senseable City Lab, which partially inspired this research. The core activities of the lab are oriented towards a pervasive data collection from different users and data sources, to uncover human dynamics, and to support planners. In fact, since the spaces are generally designed for human activities, the planning community should be interested in this gathering of information. As stated by Carlo Ratti, “the way we describe and understand cities is being radically transformed, alongside the tools we use to design them and impact on their physical structure.” Human activities, nowadays, are strictly related to the use of their mobile phones. From these activities it is possible, for instance, to extract data about vehicles. By tracking the single identifier (ID) of each device, or the phone call history, we can monitor vehicle origins and destinations. This specific activity is fundamental for the planning process of the city infrastructures. In this way, several critical issues, such as patterns of congestion, can be derived from these activities. Moreover, to understand the benefits of a new area, it is useful to obtain pedestrian flows [7] for inferring patterns from human tracking (e.g., via GPS positioning services). It is worth mentioning that our research has the following two originalities: first of all, it is conducted for a smaller urban scale, concentrating on urban park dynamics. Secondly, our attempt is oriented toward the use of devices that allow one to collect and provide data in an all-in-one architecture.
The interaction between spaces and users should be done through natural interfaces adapted to the relevant habits and behaviors. To enable this interaction, it is enough to pair with commonly used mobile devices. Some examples of networks of sensors, which can process the context through user interaction in real time, can be found in [8,9,10]. Thus, the development and standardization of new low power consumption and short range wireless technologies has enabled the concept of the Wireless Sensor Network (WSN) [11]. Such networks present many advantages, such as flexibility and adaptability, and they are more robust and consume less power [12]. Today, there are several options for the development of a WSN, and a wide range of scenarios with the corresponding standards and technologies can be found [13].
Even so, WSNs are not the only data source used for data collection purposes. Work performed by the Senseable City Lab of MIT of Boston is oriented towards a pervasive data collection from users, from different data sources, to uncover human dynamics and to support planners. In fact, since the spaces are generally designed for human activities, the planning community should be interested in this gathering of information. As stated by Carlo Ratti, “the way we describe and understand cities is being radically transformed, alongside the tools we use to design them and impact on their physical structure.”
Human activities, nowadays, are strictly related to the use of their mobile phones, so it is possible to extract data about vehicles. By tracking the single identifier (ID) of each device, or by simply analyzing phone calls by cells, one can monitor the origins and destinations of vehicles, which is fundamental for planning the infrastructure of a city. Several critical issues, for instance, patterns of traffic congestion, can be derived. Moreover, to understand the benefits of a new area, it will be useful to obtain pedestrian flows [7,14] to infer patterns from human tracking (e.g., via GPS positioning services).
The authors of [15] report a study conducted in Rome to outline the basis of urban planning using mobile phones and Location-Based Services (LBSs). Exploiting utilities embedded in users’ personal devices, a set of applications can be built that exploit the knowledge of the geographical position of a mobile device in order to provide services based on that information (e.g., urban analysis). The main assumption was that, if deployed to retrieve aggregated data in cities, LBSs could become a powerful tool for urban analysis. However, the benefits are not just for the urban planning itself but also for the whole community living in the urban environment. The beneficiaries can be different—for single users (there is now a well-established technology that allows providing weather forecasts in case of a possible emergency like a flood), a group of users (the recent success of the Pokemon Go application, a game that exploits users’ locations and AR to display virtual objects in the real scene, in a sort of collaborative game), and providers (just think of the improvement that can be given to a network’s performances if the provider could know about the traffic overflows in real time). In this regard, the aim of the project “Mobile Landscapes” was to review and introduce the potential of this technology for the urban planning community. In addition, it presents an application in the metropolitan area of Milan, Italy, based on the geographical mapping of mobile phone usage at different times of the day. In a predefined temporal range, information from mobile phones’ activities were acquired and analyzed with the specific task of understanding urban dynamics. The results seemed to open a new promising line of urban research.
Another interesting case is the one described in [16], which investigates mobile phone traffic records in different cities. From analysis, it emerged that it is possible to outline and predict future trends in the way the expansion of the city is going, and it is also possible to infer statistical patterns, which have great potential in terms of economic growth and geomarketing policies [17].
In [4], for example, geo-tagged crowd-sourced pictures were used to understand the dynamics of the flows of tourists in Rome. Another example can be found in [18].
Dealing with cities’ dynamics, it is also fundamental to discuss the City Guide to Copenhagen project [19], which has the aim of designing, visualizing, and presenting innovative applications for mobility, with particular emphasis on parking infrastructure, multimodal transportation solutions, and methods to enhance the experience of using public transport in Copenhagen. Another important aspect could be to change human habits by improving alternative services (bikes, trains, etc.) with the advent of real-time services and applications based on data. Other related aspects are the sensors for real time parking availability, which are in real-time contact with a mobile application to provide information to bikers, such as health data, a suggested path to reach someplace, and other tools. The advantage is in providing services to users and receiving information from them.
In terms of city space, human activity is important, but so is the quality of life and the conditions of air pollution, recognized as the world’s largest environmental and human health threat [20]. By merging different data, from air pollution data and UGDs, it was possible to quantify the exposure of people to the most polluted areas. Evaluating the population’s exposure to air pollution using spatio-temporal mobility patterns [21] warrants consideration in future environmental epidemiological studies linking air quality and human health. In addition, the authors of [22] present a novel method of mapping the distribution of urban green space, with the aim of quantifying the urban tree cover at the street level and sharing this information on a global scale.
Based on the above, the use of data collected from human activity, monitored through different kinds of connections and technologies, can embrace an incredible number of domains (tourism, urban planning, and environmental monitoring) and address different needs (contextual services, the establishment of planning criteria, and the identification of hazards) [23].
This brief analysis demonstrates that this research topic is emerging and could bring its benefits to almost every domain in which the planning process is required. In the following paragraphs, following the main thread already discussed, a detailed description of our approach will be presented, with a specific focus on the data collection and processing methods developed.

3. Description of the Environment of Deployment

In this section, an in-depth description of the environment in which the system has been deployed is presented. First, in Section 3.1, we present the real environment in which the entire system was installed. After that, in Section 3.2, the sensor network deployed is described, focusing our attention on the beacons: Estimote long-range beacons. We finish this section detailing the developed and used smartphone application, the CyberCardeto Smartphone app. The park has been studied for years by the local authorities. To conduct this study, a profound knowledge of the park has been achieved by direct interviews with the visitors. Additionally, a study of existing cartography has been conducted, as well as an archival research, with the aim of arranging the architecture in the best way. Interested readers can find further information about previous studies in [24,25].

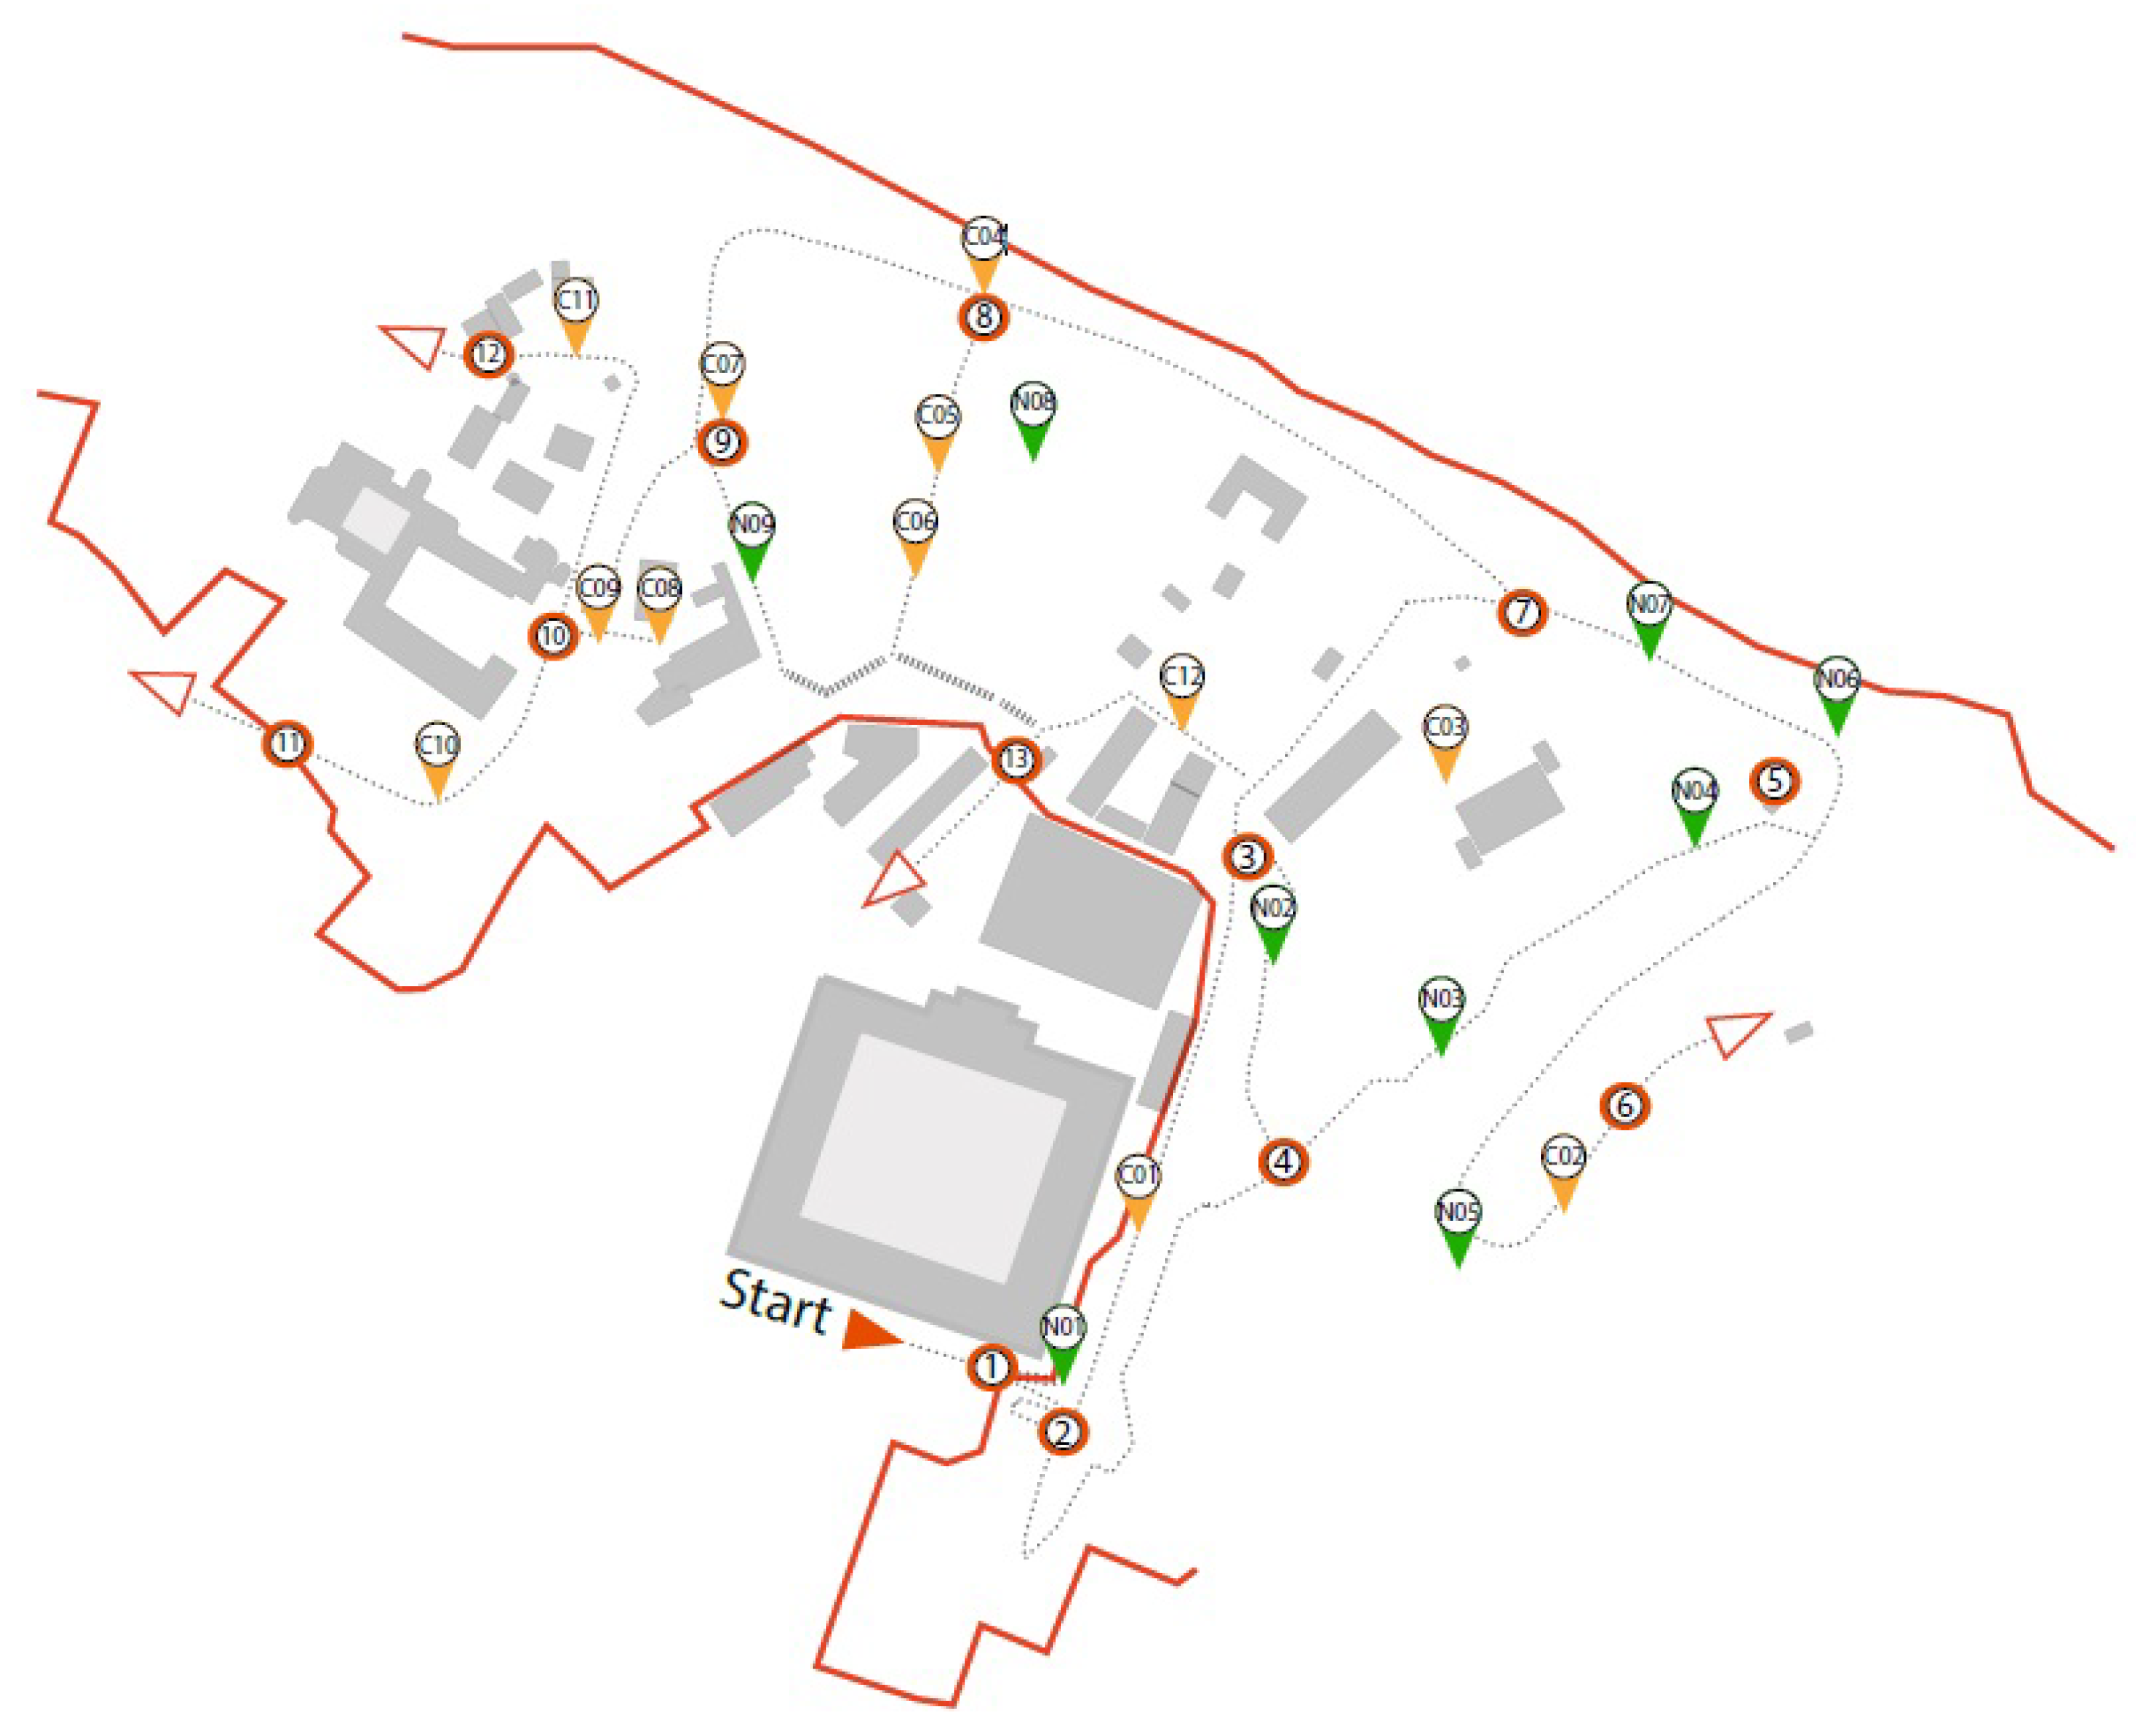
3.1. The Real Environment: Cardeto Park

Before giving a complete description of the aforementioned procedure, a brief introduction of the real environment used is given in this subsection. The environment that is the focus of our study is Cardeto Park, in the north side of Ancona (Italy). This park is near the city centre and is one of the largest green areas of the city, surpassing 35 hectares. This place was chosen for various reasons: the presence of numerous historical places, its notable naturalistic side, and the skyline of the old city. The combination of these elements creates a constant flow of both locals and foreigners. As can be deduced, all these features make Cardeto Park a place with a high potential for the behavior analysis of the visitors. Figure 1 presents a panoramic view of the park.
In addition, Cardeto Park is an interesting subject to analyze from a landscape architectural point of view. The territory of the park can be conceptually divided into three areas: (1) the northwestern part of the park, which is located between the ruins of a Roman amphitheater and the old harbor lighthouse (including a small residential area close to the new lighthouse); (2) the southeastern part, which is a natural zone that includes places with panoramic views, jogging paths, lawn courts for running and sports, ruins of the old Napoleonic fort, and botanic diversity of plants; and (3) the middle part, which can be seen as a blended zone of historical-cultural cluster of the west and the strong natural-botanic character of the south. The latter includes English and Hebrew cemeteries, old military buildings that are going to be restructured (to then be assigned to academic needs), and the playground.
Considering its notable significance in terms of historical, cultural, and botanical aspects, the aforementioned middle part constitutes an excellent area for our research. Hence, the testing area is a territory of nine hectares, where nature and culture are inseparable and there are five different entrances: three that directly connect the area under analysis to the city centre and the remaining two that connect it to the other areas of the park.
According to the heterogeneity of the highlights we just reported, the system we have developed (and will describe in the upcoming section) offers visitors different ways to experience Cardeto Park. In order to define a guideline, a separation between natural and cultural points of interest (POIs) has been made.
Considering also the fact that visitors may change their initially chosen itinerary, we first evaluated the points at which this event is more likely to happen (i.e., entrances and intersections) to define the so-called “bifurcation points,” in which we give the visitors the possibility of changing their decision about the aforementioned experience of the park. To accomplish this, these bifurcation points were equipped with sensors.
Furthermore, the distribution of all the POIs inside Cardeto Park, and the placement of all the sensors used, are shown in the following Figure 2. To correctly understand this map, the following indications should be observed:
  • Orange points: Historical or cultural POIs.
  • Green points: Natural POIs.
  • Red points: Placement of sensors (bifurcation points).
In summary, all the concepts we have introduced in the present section have been used in order to develop the smartphone application and to deploy the sensors, with the intention of promoting the synergy between visitors and the place.

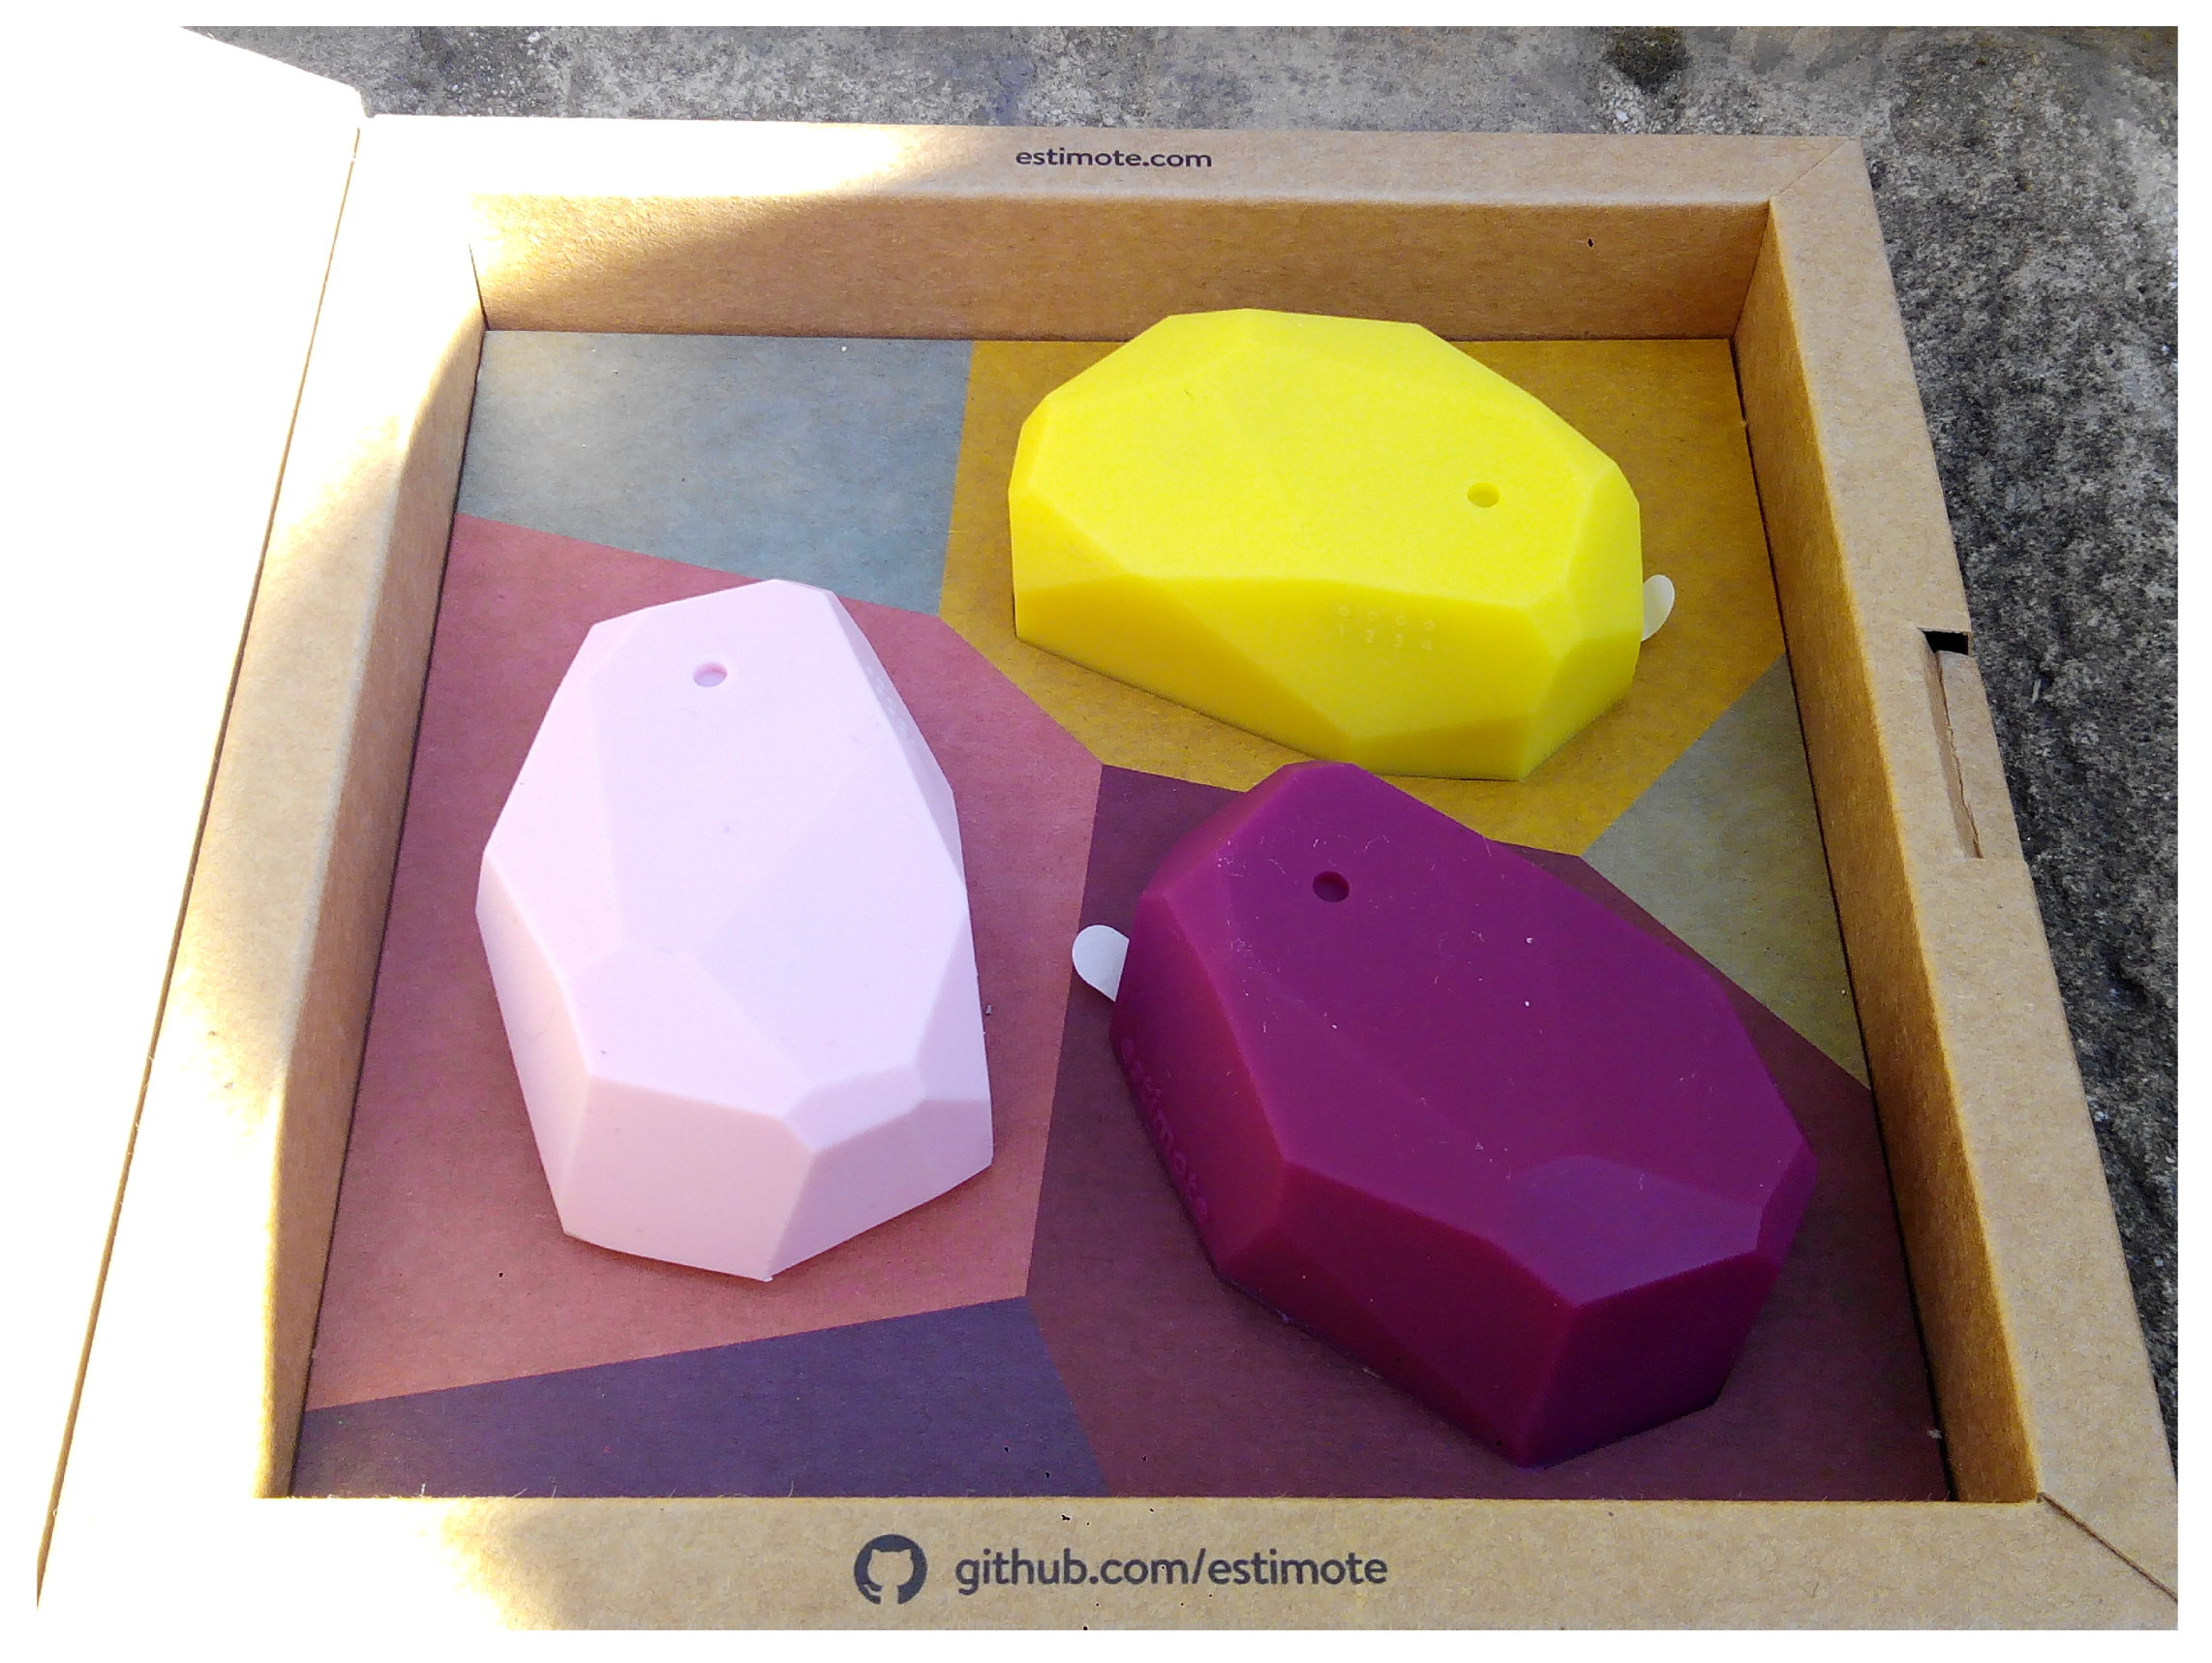
3.2. The Deployed Sensor Network

To date, different technologies have been used to tag objects and POIs, including acoustic, magnetic, and a wide variety of radio-frequency solutions, such as GPS, RFID, WiFi, Zigbee, and Bluetooth, among others. Nevertheless, not all of them comply with the needs of the application described in this paper. The proposed Senseable Space is based on a Wireless Beacon Network, whose main requirements can be summarized as follows:
  • Each beacon should be omni-directional and have a working range of some tens of meters.
  • They must allow bidirectional communication.
  • They must be battery-operated and feature low power consumption.
  • The base technology must be integrated in a majority of commercial portable devices.
After analyzing different alternatives, we finally decided to choose the commercial Estimote long-range location beacons [26], based on Bluetooth Low Energy (BLE) technology. BLE is a relatively new wireless technology developed by the Bluetooth Special Interest Group as a low-power solution, which may contribute to connecting a dramatically large number of devices to the Internet of Things [27]. The Estimote active sensors incorporate a 2.4 GHz radio transceiver with a variable output power from −20 to +4 dBm in steps of 4 dBms and a monopole antenna with 0 dBi gain. Assuming a typical BLE receiver sensitivity of −90 dBm, this gives a theoretical maximum range in free space of
R m a x = c 4 π f × 10 P t + G - S m 20 = 498 m ,
which is reduced to 200 m in the specifications provided by the manufacturer. The noticeable difference between these two values should not be surprising, since the theoretical range does not take into account phenomena such as the receiver’s antenna efficiency, housing attenuation, transmitter–receiver polarity matching, or multipath propagation. According to the Estimote Technical support team, the actual range is greatly dependent on the receiving device, and they have reported ranges from 130 m measured with a Samsung S6 Edge, 152 m with an iPhone 6S, up to 196 m obtained with a Nexus 6.
These beacons also incorporate an ARM Cortex-M4 32-bit microprocessor in charge of managing all the communications, with an over-the-air data rate of 1 Mbps, in addition to other built-in sensors, such as a motion sensor, a temperature sensor, a pressure sensor, an ambient light sensor, and a magnetometer. Figure 3 shows a set of three of these beacons.
These beacons continuously broadcast a coded message that uniquely identifies them to all nearby portable devices, which can also measure the Received Signal Strength to roughly determine the distance to the beacon. They have been designed to operate with temperatures between 0 and 60 °C and a relative humidity between 20% and 80%, although their actual performance can be significantly affected by severe weather conditions due to their high frequency band of operation.
Finally, as has been explained before, one of the activities of this research has been the installation of all the beacons in their correct place. The exact places in which the beacons have been installed can be seen in the previously shown Figure 2. Furthermore, for this installation, several conditions have been met.
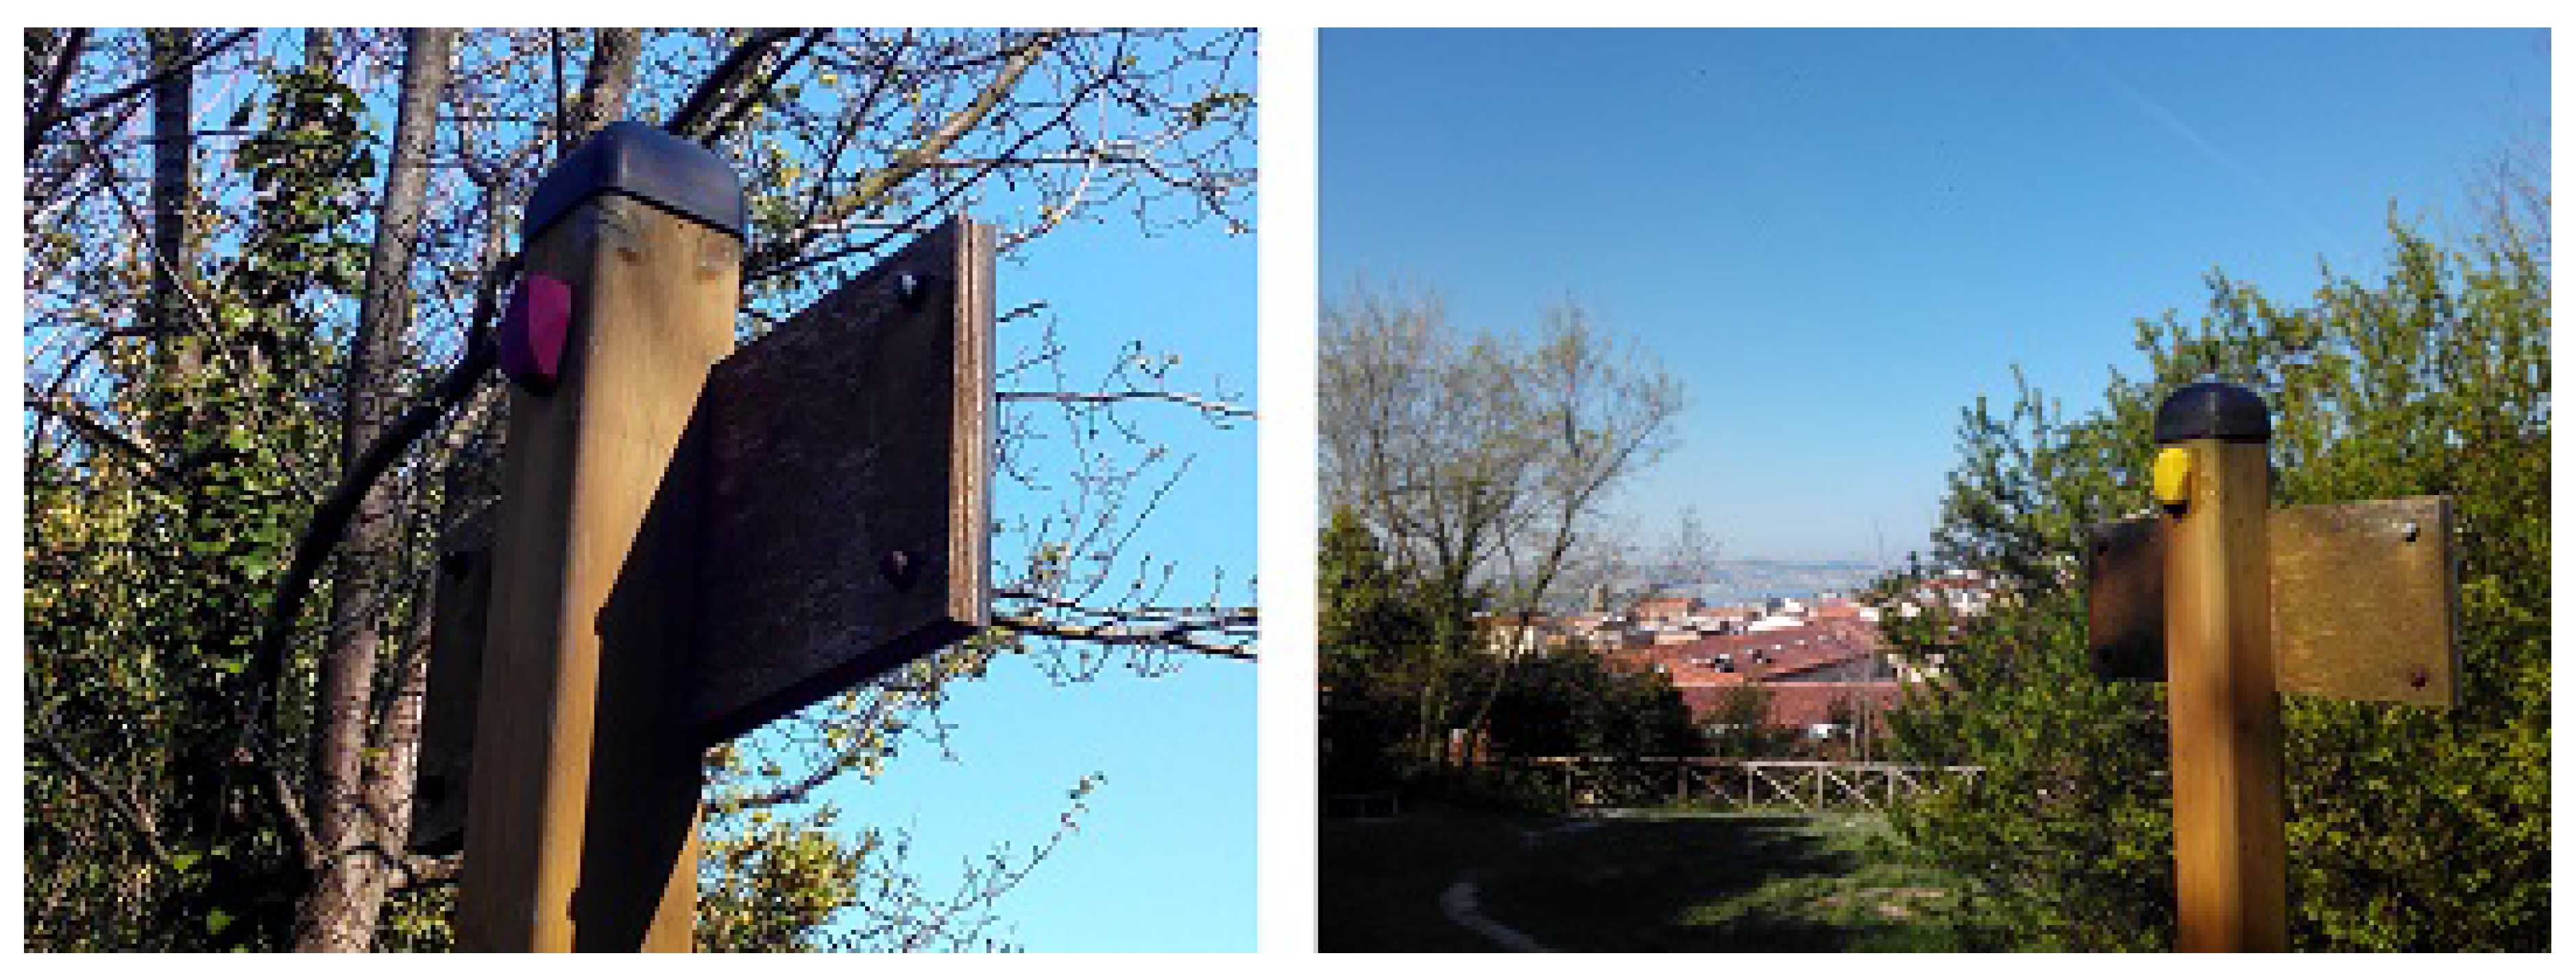
  • The placement of the beacons cannot be intrusive on the natural environment. That is, the installation of the devices must not invade natural terrain, nor prevent the development of naturalness.
  • The placement of the transmitters cannot be intrusive for the visitor’s visual perception. Being a natural and historical park, the installation of the beacons cannot compromise the park’s visual panorama.
  • The positions of the sensors must be efficient for the correct performance of the study. That is, the placement of the sensors must allow for the detection of all visitors who pass through the planned bifurcations. In addition, overlap between different beacons must be avoided.
Therefore, one of the most used placements for this installation were the billboards, which meet the conditions above described. Figure 4 shows two different examples of deployment of the beacons. Finally, it should be highlighted that all the locations where decided after a deep and empirical analysis performed by architects and urban planners. This analysis was done both in the laboratory and in the field. For this reason, prior to the final distribution, we conducted some preliminary tests.

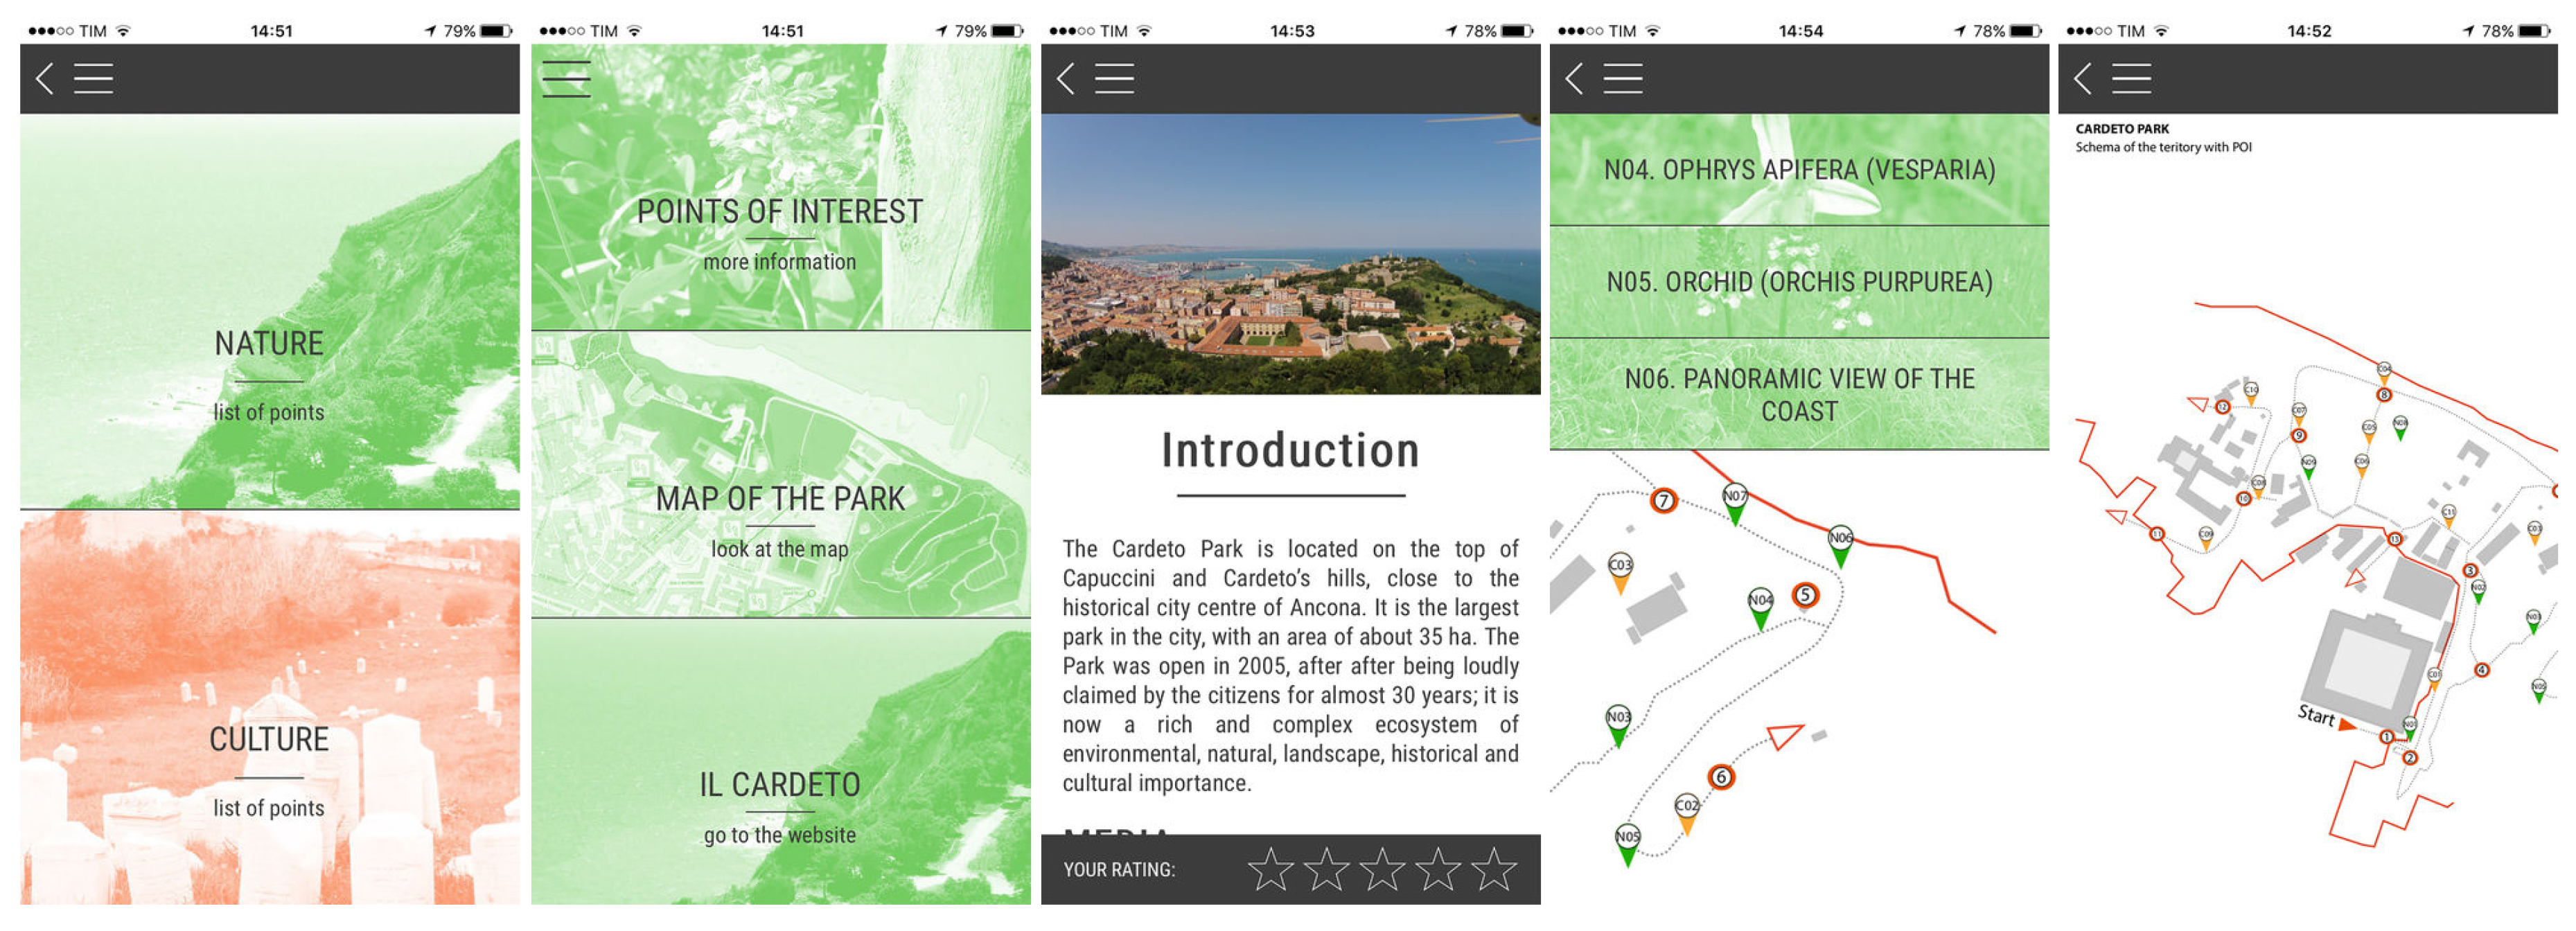
3.3. The CyberCardeto Smartphone App

The CyberCardeto app was conceived, in an initial phase, to enhance the visiting path of Cardeto Park with the primary purpose of guiding the user among the POIs, providing contextual information about the area, thus enhancing the enjoyment of the park in an innovative way, creating a connection with the city. Notwithstanding, as a consequence of the installation of the sensors into the park, a subsequent advantage is to use people’s devices (and locations) to help future planning for the improvement of the park. Figure 5 shows two snapshots of the application running during the visit.
The main functionalities of the smartphone application are real-time localization (which facilitates the orientation of the users within the park and helps to discover several historical and botanical POIs) and the contextual notification of the POIs. Besides that, other functions increase the user’s experience. The localization service allows finding attractions in a virtual map. The list of POIs, categorized as natural or cultural, is useful to study the beauty of the environment in depth. To express their degree of satisfaction, the user is also enabled to rate each POI.
In order to gather the user’s data, a cloud service has been developed, in which data are collected following these rules. Once the mobile device is permanently within the operational range of the beacon (set within 15 m and considered stable once five consecutive pings are recorded), the application (i) notifies the user with suggestions about possible routes and (ii) sends position data to the cloud. The same criterion is adopted to register the activity of a device once the mobile device exits from this area of influence of the beacon. In this way, we collect a series of data as reported in the following section.
At this point, our full commitment to the user’s privacy should be mentioned. For this reason, none of the information collected from any participant can be seen by anyone else. Furthermore, all gathered data is completely untied from any personal identification by means of an anonymization process. In this way, all of the information of the user is stored using a unique identifier, which is the Media Access Control (MAC) address of each BLE device (used as UUID). This fixed MAC address cannot be linked to any personal information such as names or phone numbers, allowing for the collection of different types of information only from the mobile device. Furthermore, as can be observed in future sections, no personal data is stored by any of the systems deployed. In this way, administrators can analyze the material for research purposes, but they will never be able to associate the data with any specific participant.
The CyberCardeto app is available at Apple Store (https://itunes.apple.com/us/app/cybercardeto/id1219952063?mt=8) and Google Play (https://play.google.com/store/apps/details?id=it.univpm.dii.cardeto&hl=es), and is an open source project. For this reason, the code is available on demand.

4. Main Outcomes of the Deployed Scenario

Now that the whole of the real-world scenario has been described, it is interesting to point out that two different data sources are available in the deployed environment. On the one hand, all the information gathered by the beacons is stored in a single comma-separated value (CSV) file. These kinds of files have a row for each user’s identification. Furthermore, all the information of a single record is sequentially stored and separated by commas. At this point, it should be highlighted that all the experimentation has been done using the data that has been collected in Cardeto Park. In this case, the resulting file has the appearance shown in Figure 6, which contains the following values:
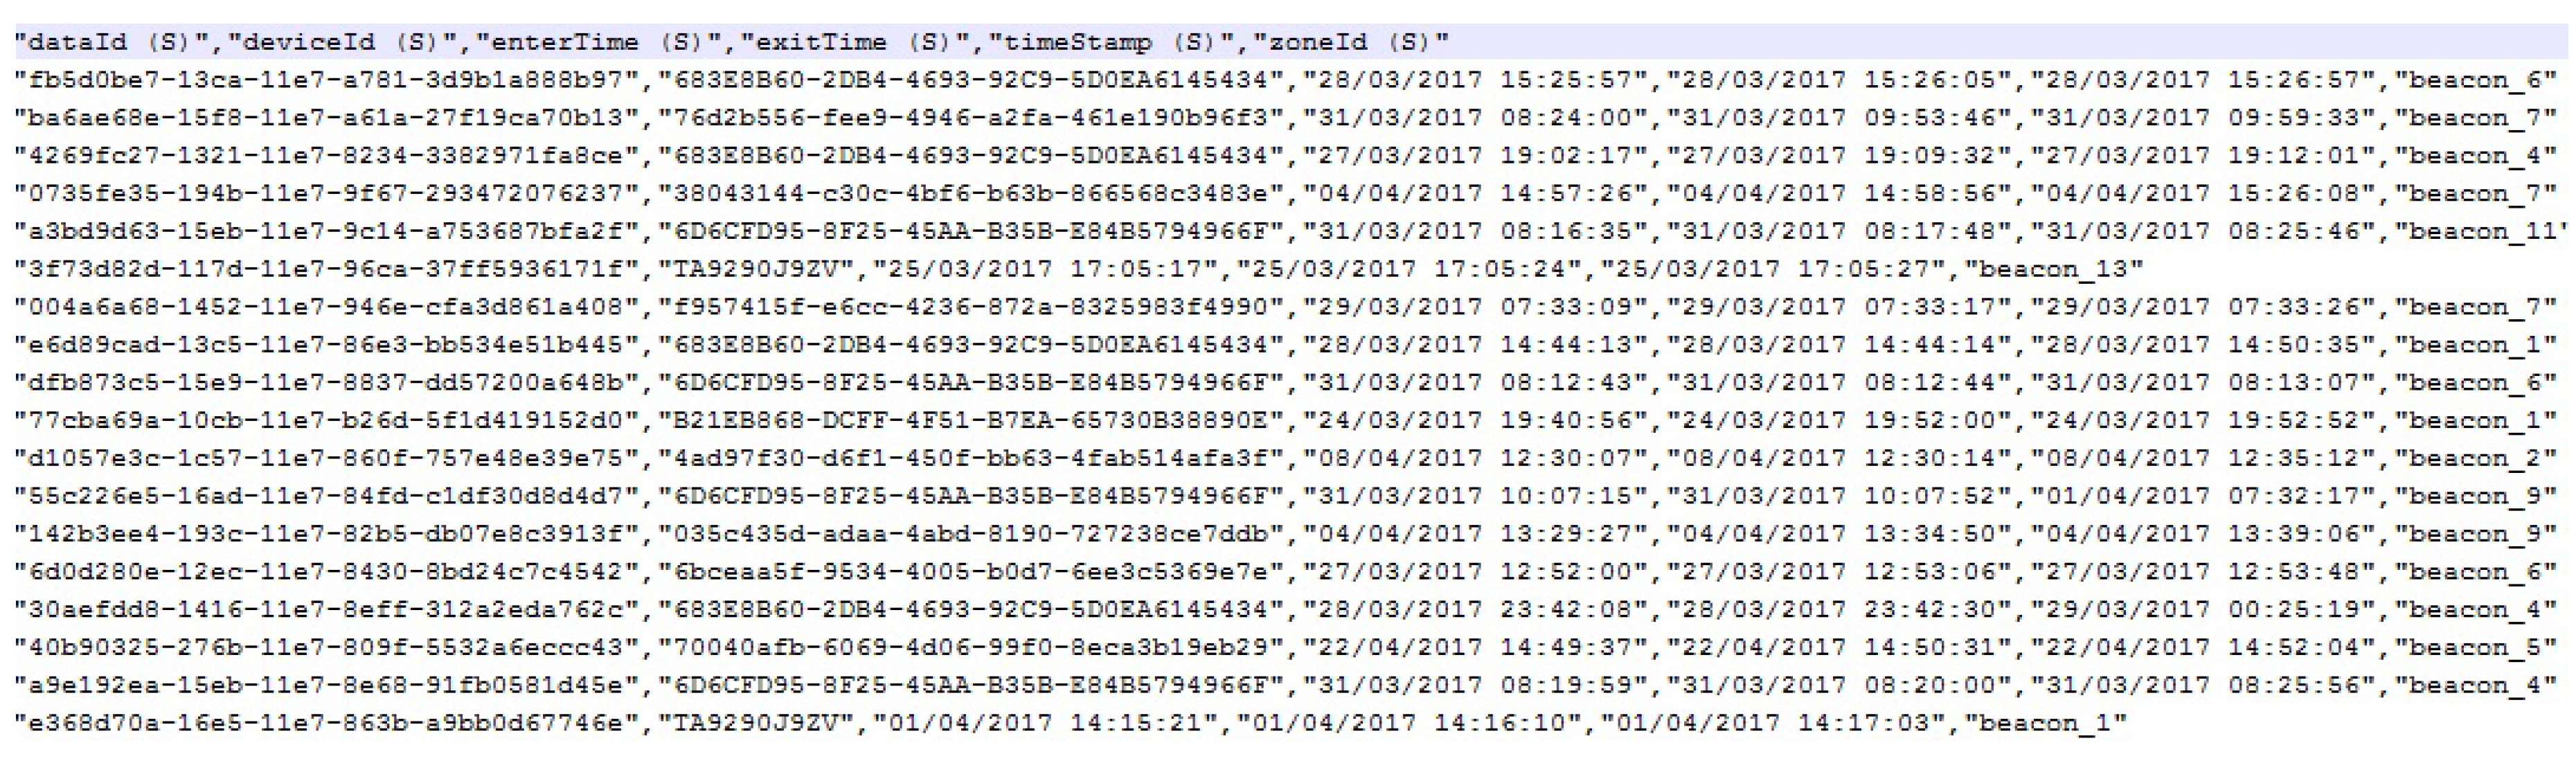
  • dataID: An unequivocal identifier for the specific data entry. It is formatted as a string, and it is automatically generated by the beacon.
  • deviceID: The identifier of the device (smartphone, tablet…) that has passed through the beacon, and which has received the notification of the CyberCardeto app.
  • enterTime: The exact time at which the user’s signal is caught entering into the area of influence of the specified beacon. The format of this parameter is DD/MM/YY hh:mm:ss.
  • exitTime: The exact moment at which the user leaves the domain of the specified beacon. The format of this date is DD/MM/YY hh:mm:ss.
  • timestamp: The timestamp with which the information has been reported. The format of the date is YYYY-MM-DD hh:mm:ss.
  • zoneID: Identification of the beacon. It is depicted as a string, which, in this environment, has a value “beacon_X,” where X is an integer between 1 and 13.
Additionally, as has been explained before, the CyberCardeto digital tool also collects the GPS tracking of the users (recorded in WGS 84 Web Mercator projection with latitude and longitude in decimal degrees). This is the second data source of the environment. This information is useful for determining the route that the user has followed while the app was running. Hence, all information about the GPS tracking of all users is collected into a single CSV, whose format is shown in Figure 7, and which contains the following values:
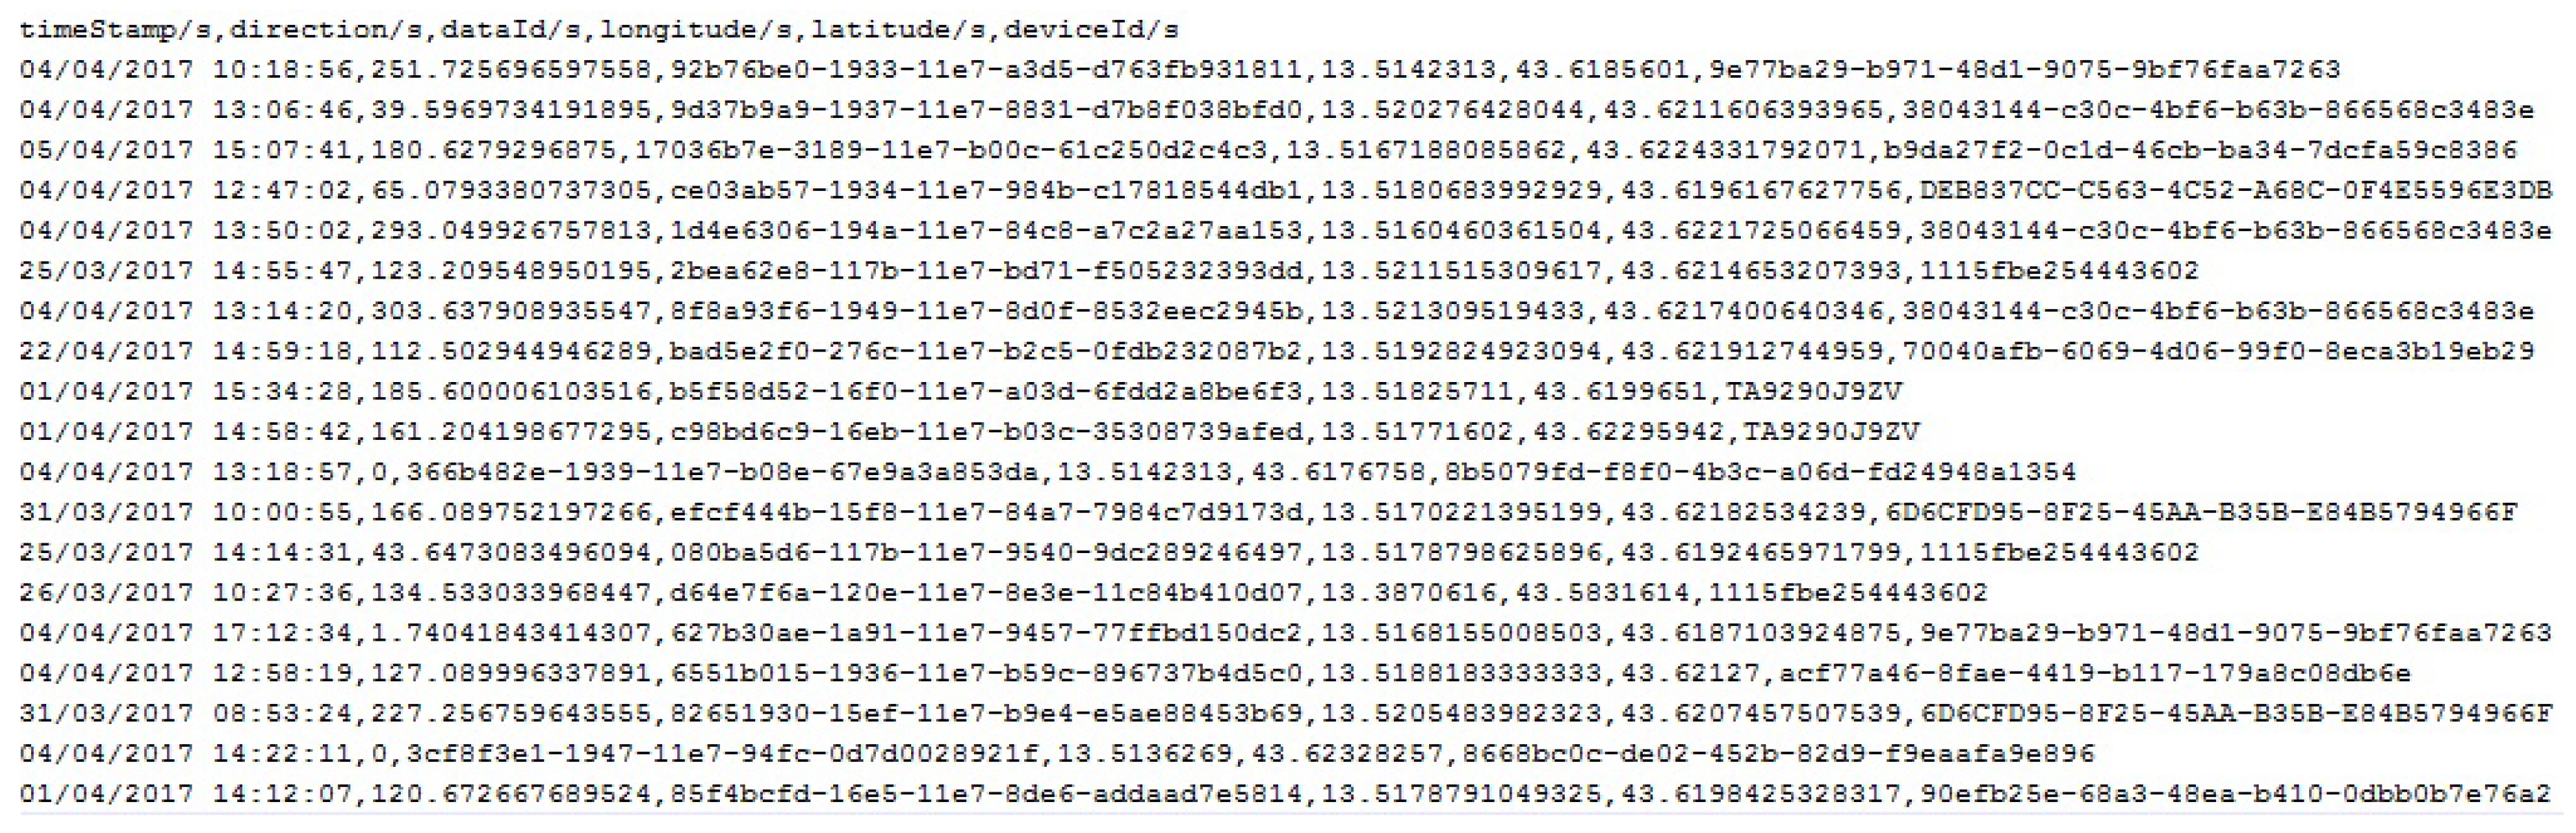
  • timestamp: The timestamp of the record. The format of the timestamp is YYYY-MM-DD hh:mm:ss.
  • direction: The heading of the user. It is represented in decimal degrees, taking geographical North as origin.
  • dataID: An unequivocal identifier for the specific data of the user’s entrance. It is formatted as a string, and it is automatically generated by the CyberCardeto app.
  • latitude: The latitude of the geographical position of the user.
  • longitude: The longitude of the geographical position of the user.
  • deviceID: The identifier of the mobile device in which the app is running. This ID is the same as that gathered by the beacons.
It is important to highlight that these data are not useful when raw. In order to extract information and knowledge from the gathered data, a pre-processing phase needs to be carried out on all these data. The pre-processing engine, along with a post-analysis system, will be explained in the following section.

5. The Pre-Processing and Post-Analysis System

The main objectives of the developed pre-processing and post-analysis system are to gather and merge all available data, to perform a pre-processing procedure, and to extract post-analysis statistics with the aim of extracting knowledge from the collected information and doing so in a way that is useful for researchers.
This platform has been developed using Java as the programming language and Eclipse MARS.2 as the programming framework. Both the implementation of and experimentation with this tool were performed on an Intel Core i5 2410 laptop, with 2.30 GHz and 4 GB of RAM. Briefly explained, the system automatically collects both the files previously described, which need to be placed in a specific folder, and generates the subsequent pre-processing and post-analysis procedures. The pre-processing of the data includes the following steps [28]:
  • Data Cleaning: This method includes operations that correct noisy data, remove wrong data from the dataset, and reduce the unnecessary details [29]. In this case, all the records poorly gathered because of overlaps or beacon errors have been cleaned.
  • Data Transformation: With this method, the data are converted to the type necessary for posterior analysis of the data. In this case, the timestamp value needs to be transformed in order to treat it efficiently.
  • Data Integration: Operations such as identification and unification of variables and domains, analysis of correlations of the attributes, duplication of tuples, and detection of conflicts in data values from different sources are included in this category [30]. In this case, in order to merge both available files, the Date and DeviceID parameters needed to be integrated.
  • Data Merging: Once the previous steps have been carried out, the merging of the data contained in both files is performed. This merging has been made using both the Timestamp and the DeviceID.
  • Data Discretization: This procedure transforms quantitative data into qualitative data, that is, numerical attributes into discrete or nominal attributes with a finite number of intervals [31]. In this case, and in order to make the data more understandable, the isEntering parameter has been normalized to entering or leaving, depending on the case.
  • Missing Data Imputation: This is a type of data cleaning process [32]. Its goal is to fill missing values with correct or adequate data. In most of the cases, it is better to estimate a suitable data value than to leave it blank. In this case, data imputation has been used in those cases in which the GPS location cannot be related one-to-one with the data coming from beacons. The procedure followed in the developed system has been to attach an estimated value to those records in which the latitude and longitude is not available. For this estimation, approximate known localizations have been used. In order to be more specific, for every record in which an exact location is not available, a bilateral search is made in order to find locations registered at nearby timestamps. For example, if a user was registered entering Beacon 3 at 12:00:00, and we do not have the location for this user at this exact time, the system starts a search asking whether we have her/his location at some nearby timestamps, for example, at any moment between 12:00:05 and 11:59:55. If the system still cannot find any location within this time window, it widens the window up to a maximum of +30 and −30 s. If the system does not find any location in any of these cases, these parameters are filled by a “longitude/latitude_not_available.”
After these pre-processing procedures, the developed system performs a post-analysis of the data, with the aim of extracting knowledge and valuable information from it. The main objective of this post-processing is to endow the merged file with additional information that helps in the analysis of the behavior of the users. Specifically, the information extracted from the available data and added to the whole file is as follows:
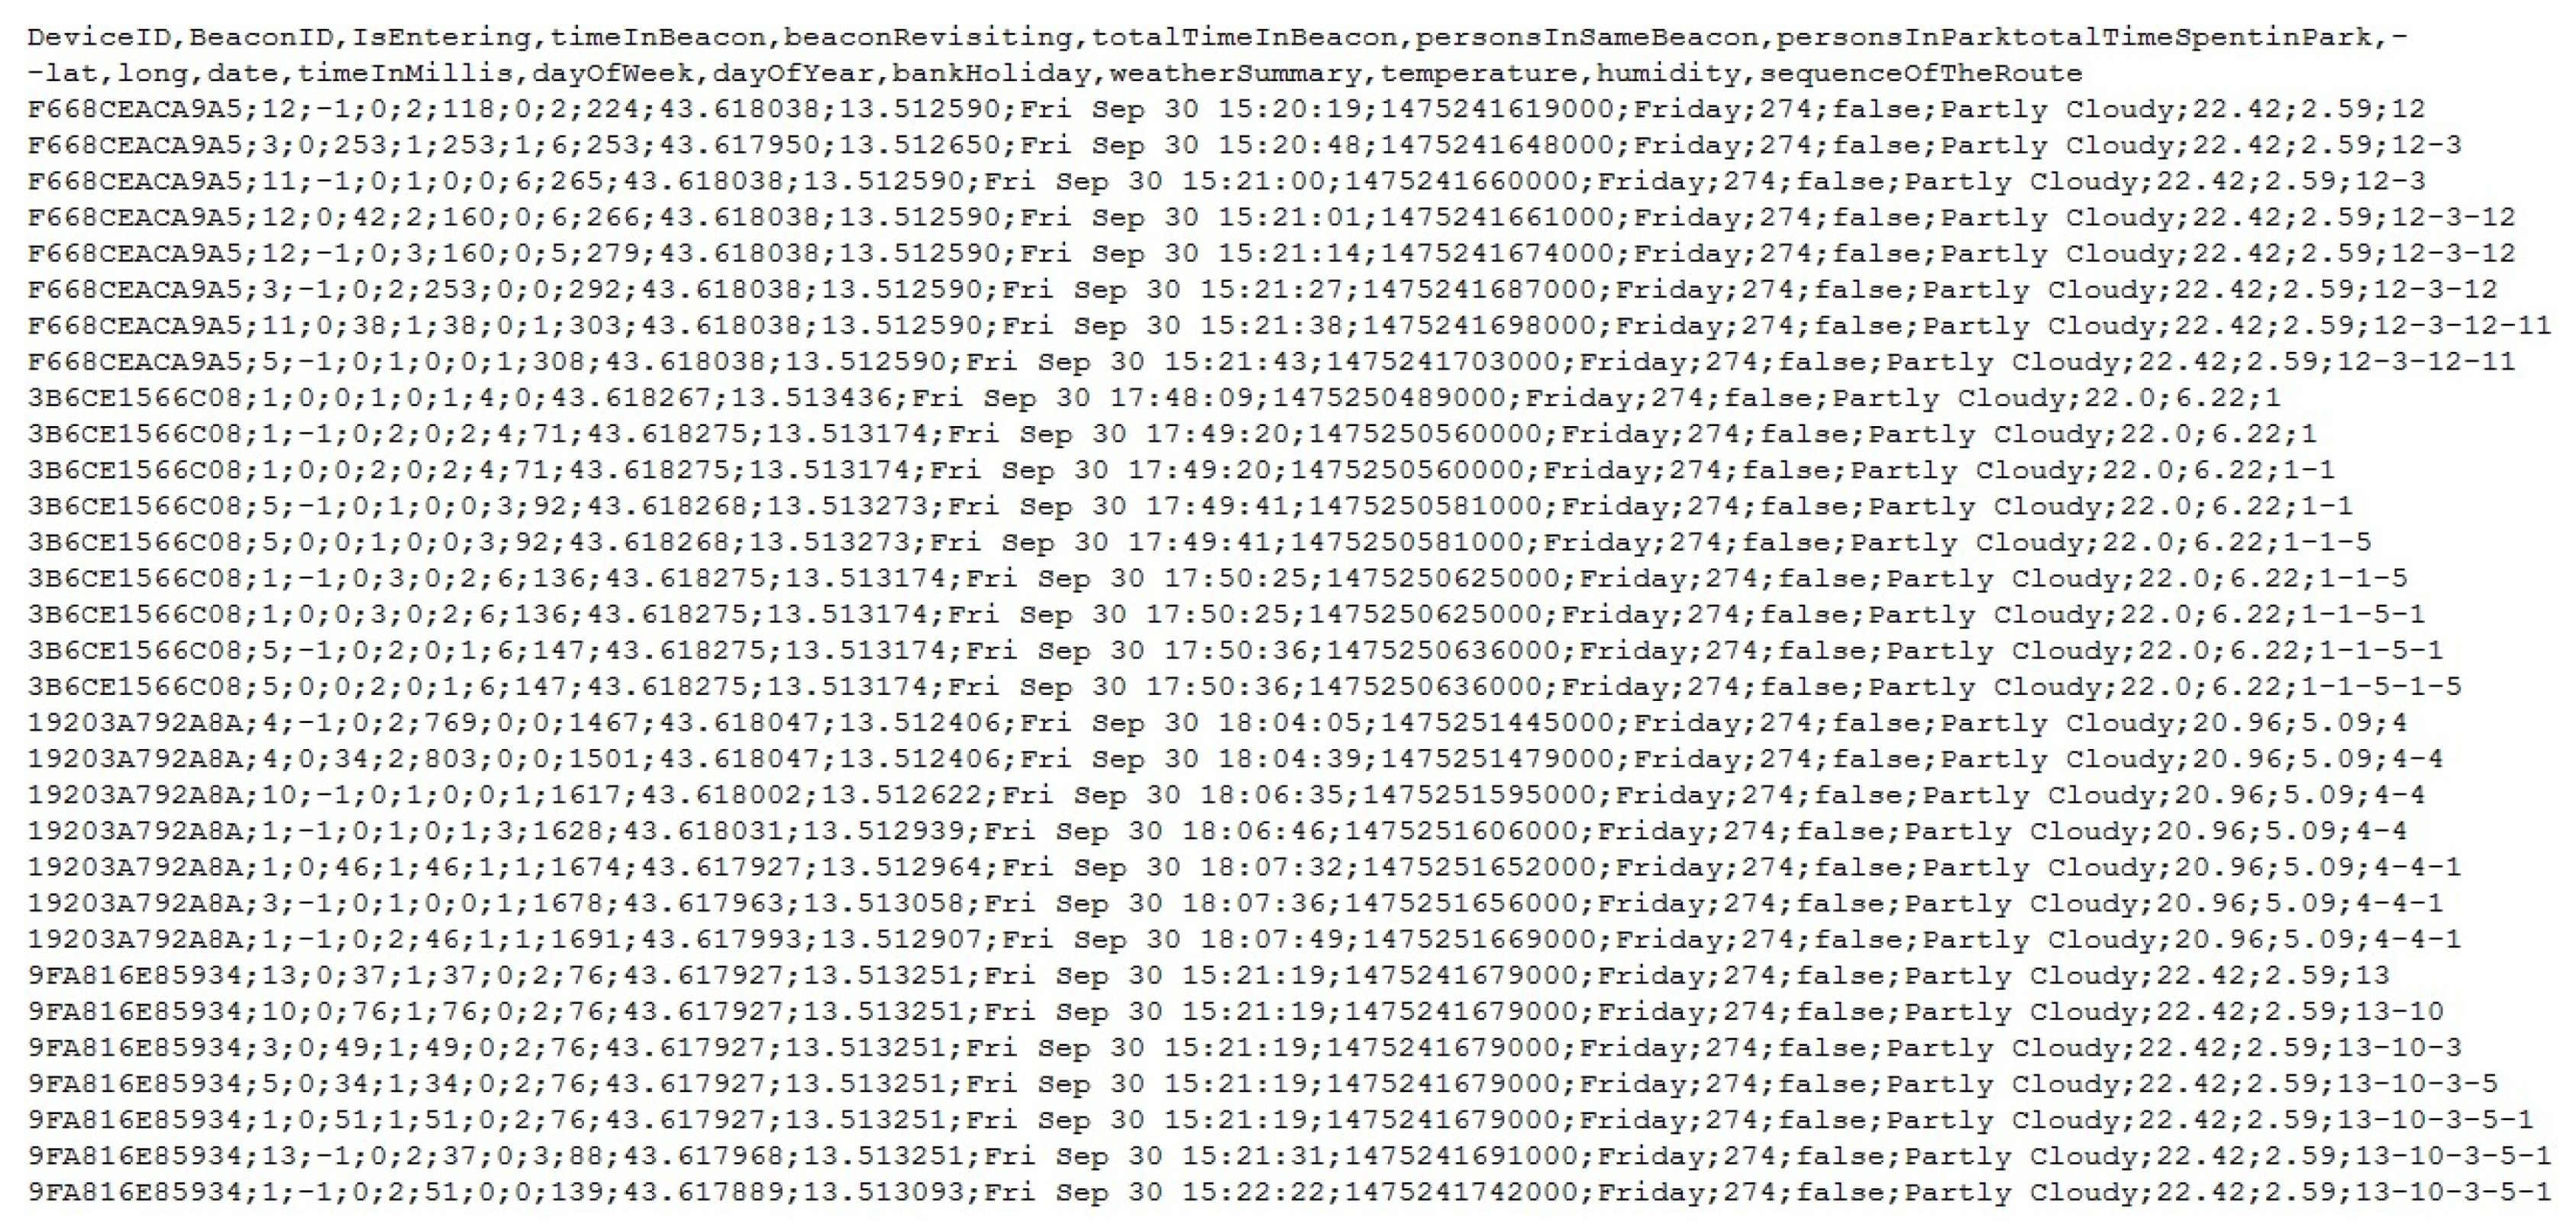
  • Time in Beacon: Once a beacon detects a user leaving its field of influence, the system calculates how much time the user has spent in the beacon’s area since his/her last entrance.
  • Beacon Revisiting: If a beacon detects a user entering its domain, the system counts how many times the user has entered its area in the same day.
  • Total Time in Beacon Area: Every time a beacon detects a user, the system calculates the total time this user has spent in the area of influence in the same day.
  • Total Time Spent in the Park: Each time a beacon detects a user, the system calculates the total time this user has spent in the park as a whole, in the same day.
  • Persons in the Same Beacon: Once a beacon detects a user, either entering or leaving its domain, the system counts the number of users that are in the area of influence of the same beacon at the same time.
  • Time in Milliseconds: This information is directly taken from the timestamp, and is the date represented in milliseconds. This parameter is very useful for data processing systems and environments, such as Java.
  • Day of the Week: This value is also calculated from the timestamp, and it represents the day of the week in which the register was gathered. This information is useful for the analysis of people’s behavior. An example of its importance is the fact that, on the weekend, one expects to detect a larger number of users than on working days. This parameter facilitates the gathering of this information, and it can have the following values: Monday, Tuesday, Wednesday, Thursday, Friday, Saturday, and Sunday.
  • Day of the Year: This value is similar to the previous one. It is an integer representing the number of the day, taking the whole year as reference. This parameter can take any value between 1 and 366 (taking leap years into account).
  • Bank Holiday: This Boolean parameter represents whether the day in which the activity was collected was a bank holiday. The main objective of this parameter is the same as that of the day of the week parameter. To obtain this value, an external web service has been used.
  • Weather Summary: This parameter is a short description of the weather at the time that the user was detected by the beacon. This information is extremely important, not only for the analysis of the user’s behavior but also for the analysis of the beacon’s performance. Examples of different weather summaries could be “partly cloudy” or “heavy rain.” To obtain this information, the partly-freely available Open Weather Map web service (https://openweathermap.org/) has been used. Specifically, the current weather data, or the historical data APIs, are used, depending on the case. It is important to highlight that a pre-processing procedure is also carried out with all information coming from this web service, in order to extract only the information that is relevant to this real case study.
  • Temperature: This parameter shows the temperature in degrees Celsius at the time that the user’s signal was caught by the beacon. This information is also obtained from the Open Weather Map web service.
  • Humidity: This parameter represents the humidity, calculated in percentage, at the time the user passed through the domain of the beacon. This value is also calculated by the Open Weather Map Web Service.
  • Trajectory of the User: This parameter is the sequence that the user has followed in the park since the user’s entrance. This parameter is represented as a list of the Beacon IDs of those beacons that were visited, sequentially, by the user. An example of a trajectory of a user that has visited four different beacons could be 12–9–3–4. More examples can be seen in Table 1.

6. Experimentation and Analysis of the Results

The main objective of the developed system is to facilitate the extraction of valuable knowledge from the gathered data as a whole. Only in this way can we take advantage of the deployed system as a whole, being able to infer valuable information to better understand the user–spatial relationships. Therefore, all information inferred and provided by the developed pre-processing and post analysis system is of crucial importance for the administrators’ in-depth understanding of the participants’ behavior, as conclusions and decisions for the further development and improvement of the park cannot be made otherwise. To enable these insiders, they need to be provided with an easy-to-use tool that, besides computing the data in a more suitable format, allows them to be autonomous in the data interpretation process. In this regard, the visualization of the data is fundamental, since decision-makers are more familiar with visual tools than with raw (even if organized) data [33]. To address this issue, the data filtering and the data visualization tool will be described in what follows.

6.1. Data Organization and Filtering

Visualizing data in a friendly format requires strict cooperation with practitioners who are not familiar with the programming environment, so the visualization should be flexible and comprehensive at the same time. The starting point for populating a database is to make it as organised as possible. The structure of the database has been designed to manage data in the following schema. Figure 8 presents an example of the resulting CSV file. As has been explained, with the information in this new and improved CSV file, the behavior of the people in the park can be understood. It also has more parameters, such as the time in milliseconds, that aid in its treatment in some external tools.
To this end, and thanks to the CSV file generated by the pre-processing and post-analysis system, we can, for example, determine the exact trajectory followed by every user in the park on a single day. Table 1 shows the trajectories followed by some of its users. This information can be obtained simply by reading the resultant CSV, which clearly indicates its utility for the behavior analysis.
Additionally, thanks to this improved CSV, we can also analyze how much time has been spent by each user in the park, simply by reading the file. Table 2 depicts the time spent by some of the users. This time is represented in seconds, and it is related to the trajectories shown in Table 1.
The system also allows for observing the user not only as an individual but as part of the whole park. More concretely, and thanks to the developed system, information about the whole situation of the park can be obtained, which can help administrators of the open space to understand more deeply and thoroughly the activity taking place in the park. Table 3 presents an example of this. In this table, we can see that, by reading the CSV, we can obtain a perspective of the situation of the open space, in the sense that, each time a user enters an area, we can analyze the number of people in the same area and in the whole park at the same moment.
In addition to all of this data directly inferred from the information gathered with the previously described beacons, the contextualization of the knowledge extracted is of crucial importance for an in-depth understanding of the behavior of the users. In this specific case, attaching the current weather, temperature, and day of the week and checking for bank holidays is of paramount importance for understanding the flow of people through the park as a whole.
Knowing the correct trajectories of the users greatly contributes to identifying which parts of the park are preferred by visitors. This could help to decide which parts should be rearranged and made more attractive to people, encouraging them to visit. In any case, it is difficult for this kind of system to understand abnormal variations in the normal flow if there is no contextual information available. For this reason, the developed pre-processing and post-analysis tool enriches the information with data such as the weather or the type of day. This way, the relation of the gathered and inferred information to some contextual data greatly helps space administrators to understand atypical variations. This fact helps to conclude, for example, that the visiting flow of the park has decreased because of the rain or increased due to a bank holiday. This fact helps to avoid wrong and unreliable conclusions.

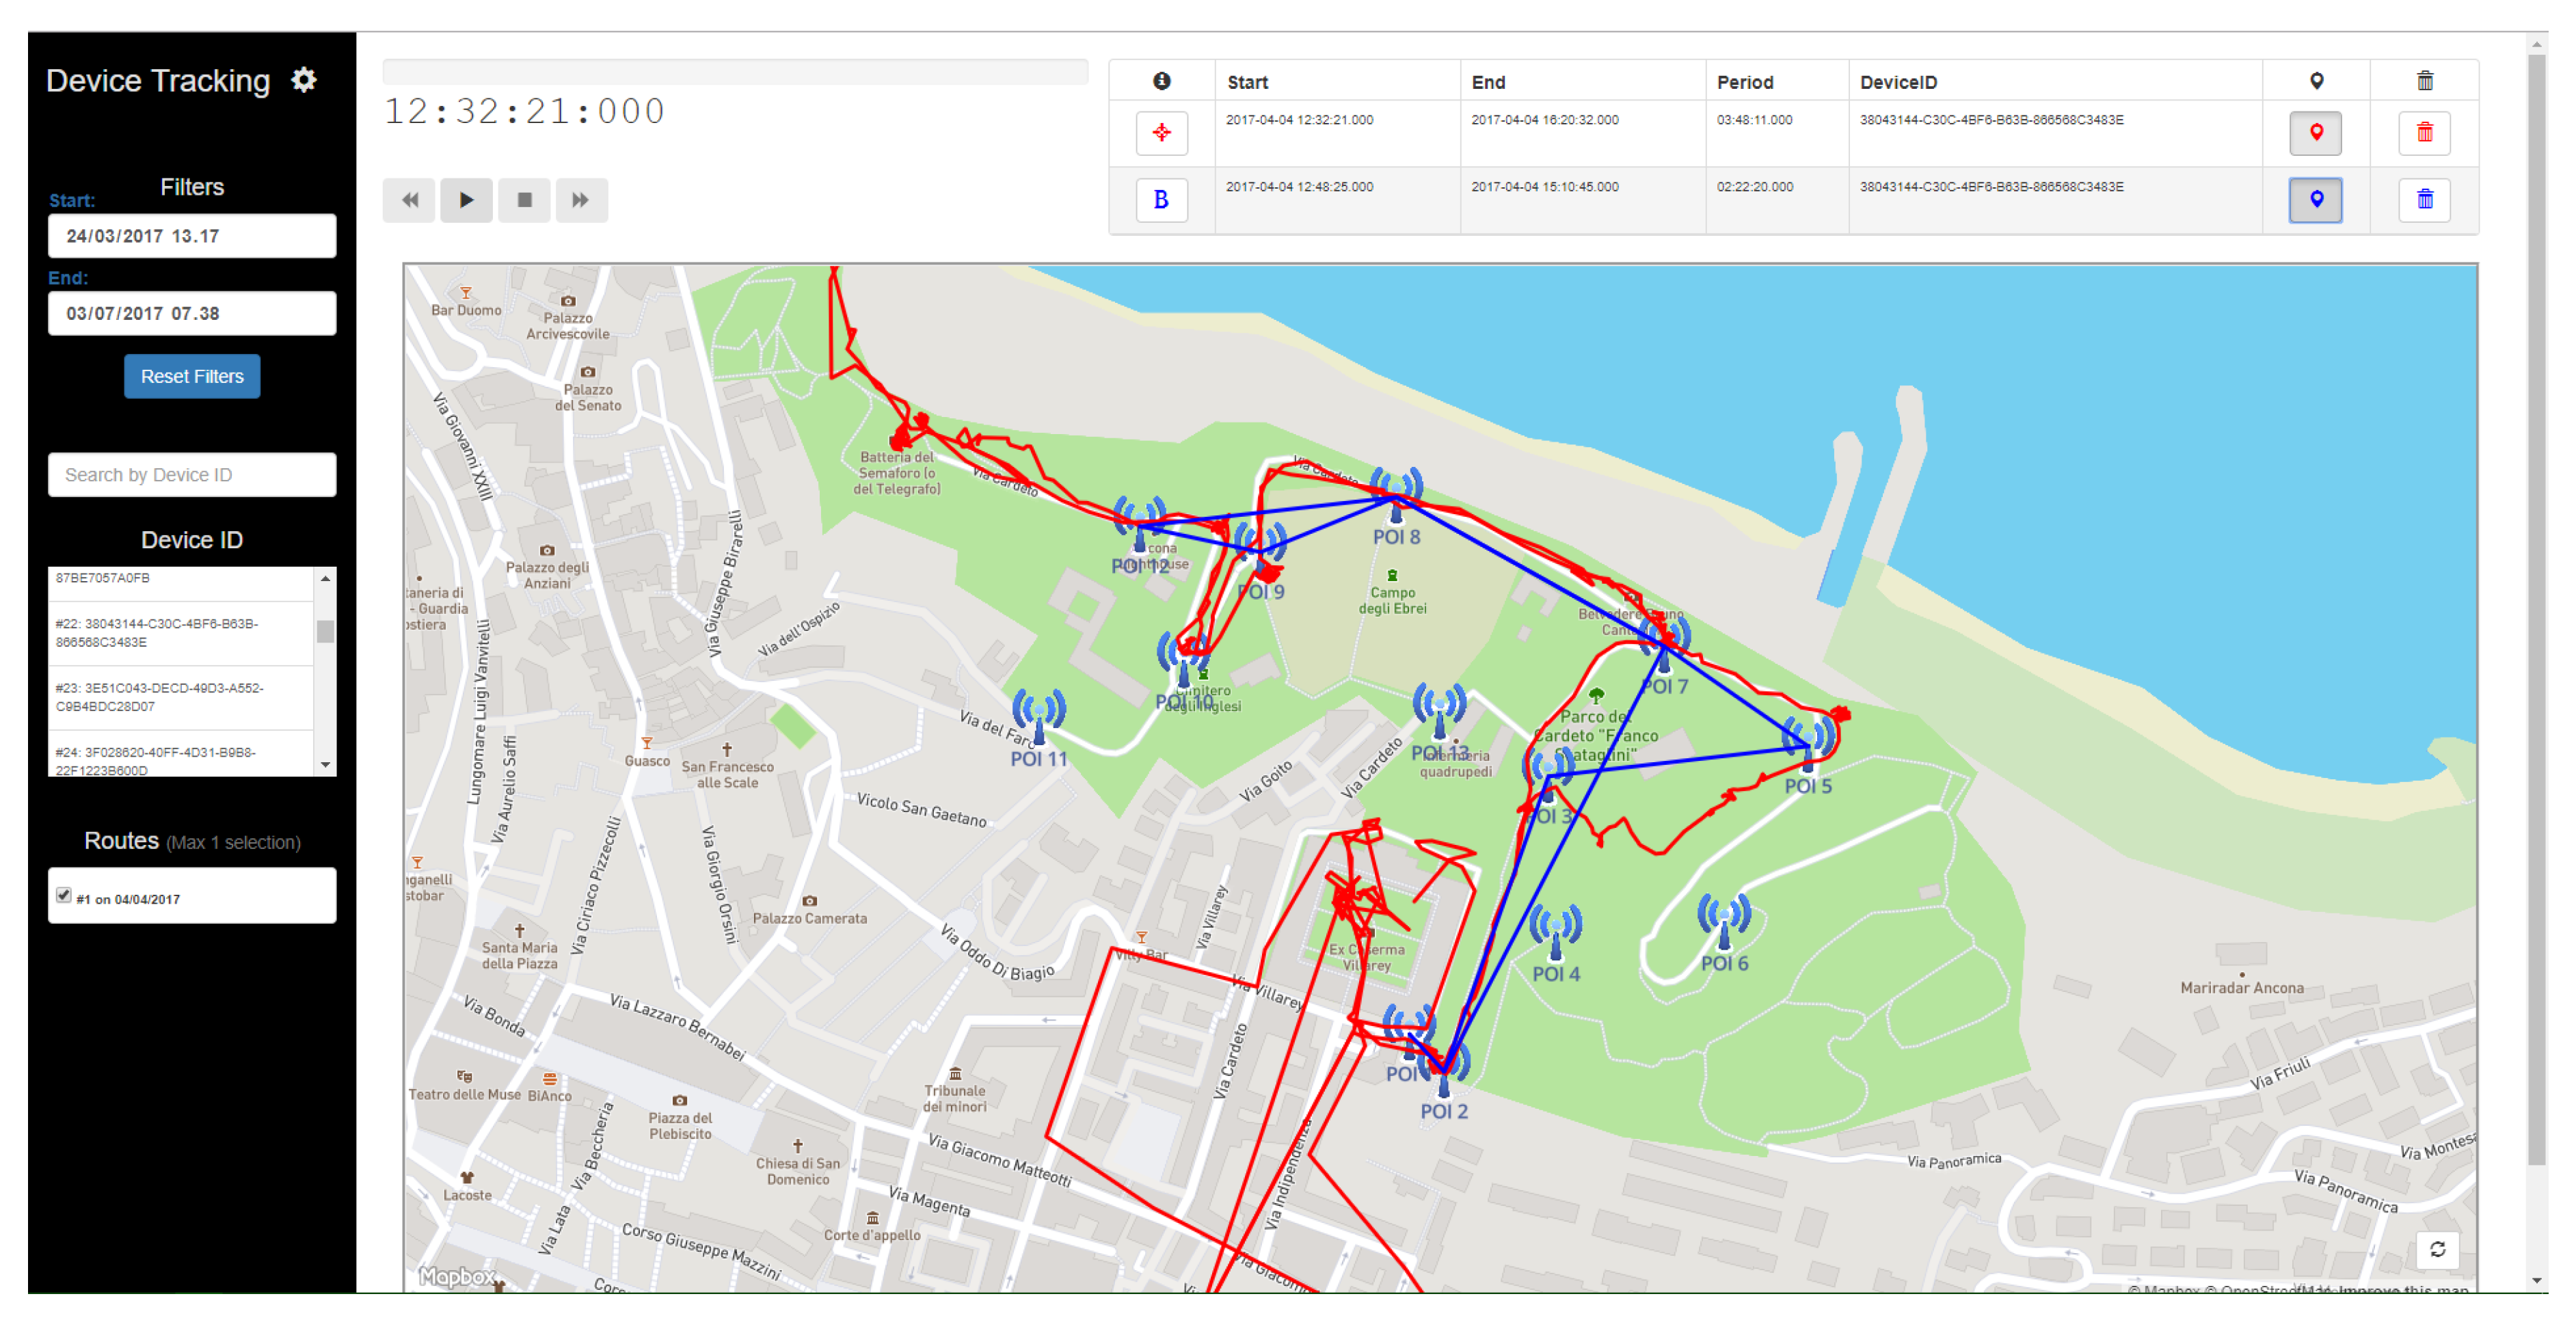
6.2. Data Visualization Tool

The purpose of the visualization tool is to create an extended application including both GPS and Bluetooth beacons data that
  • shows tracking paths (of both GPS and beacons) of various visitors and the differences between them;
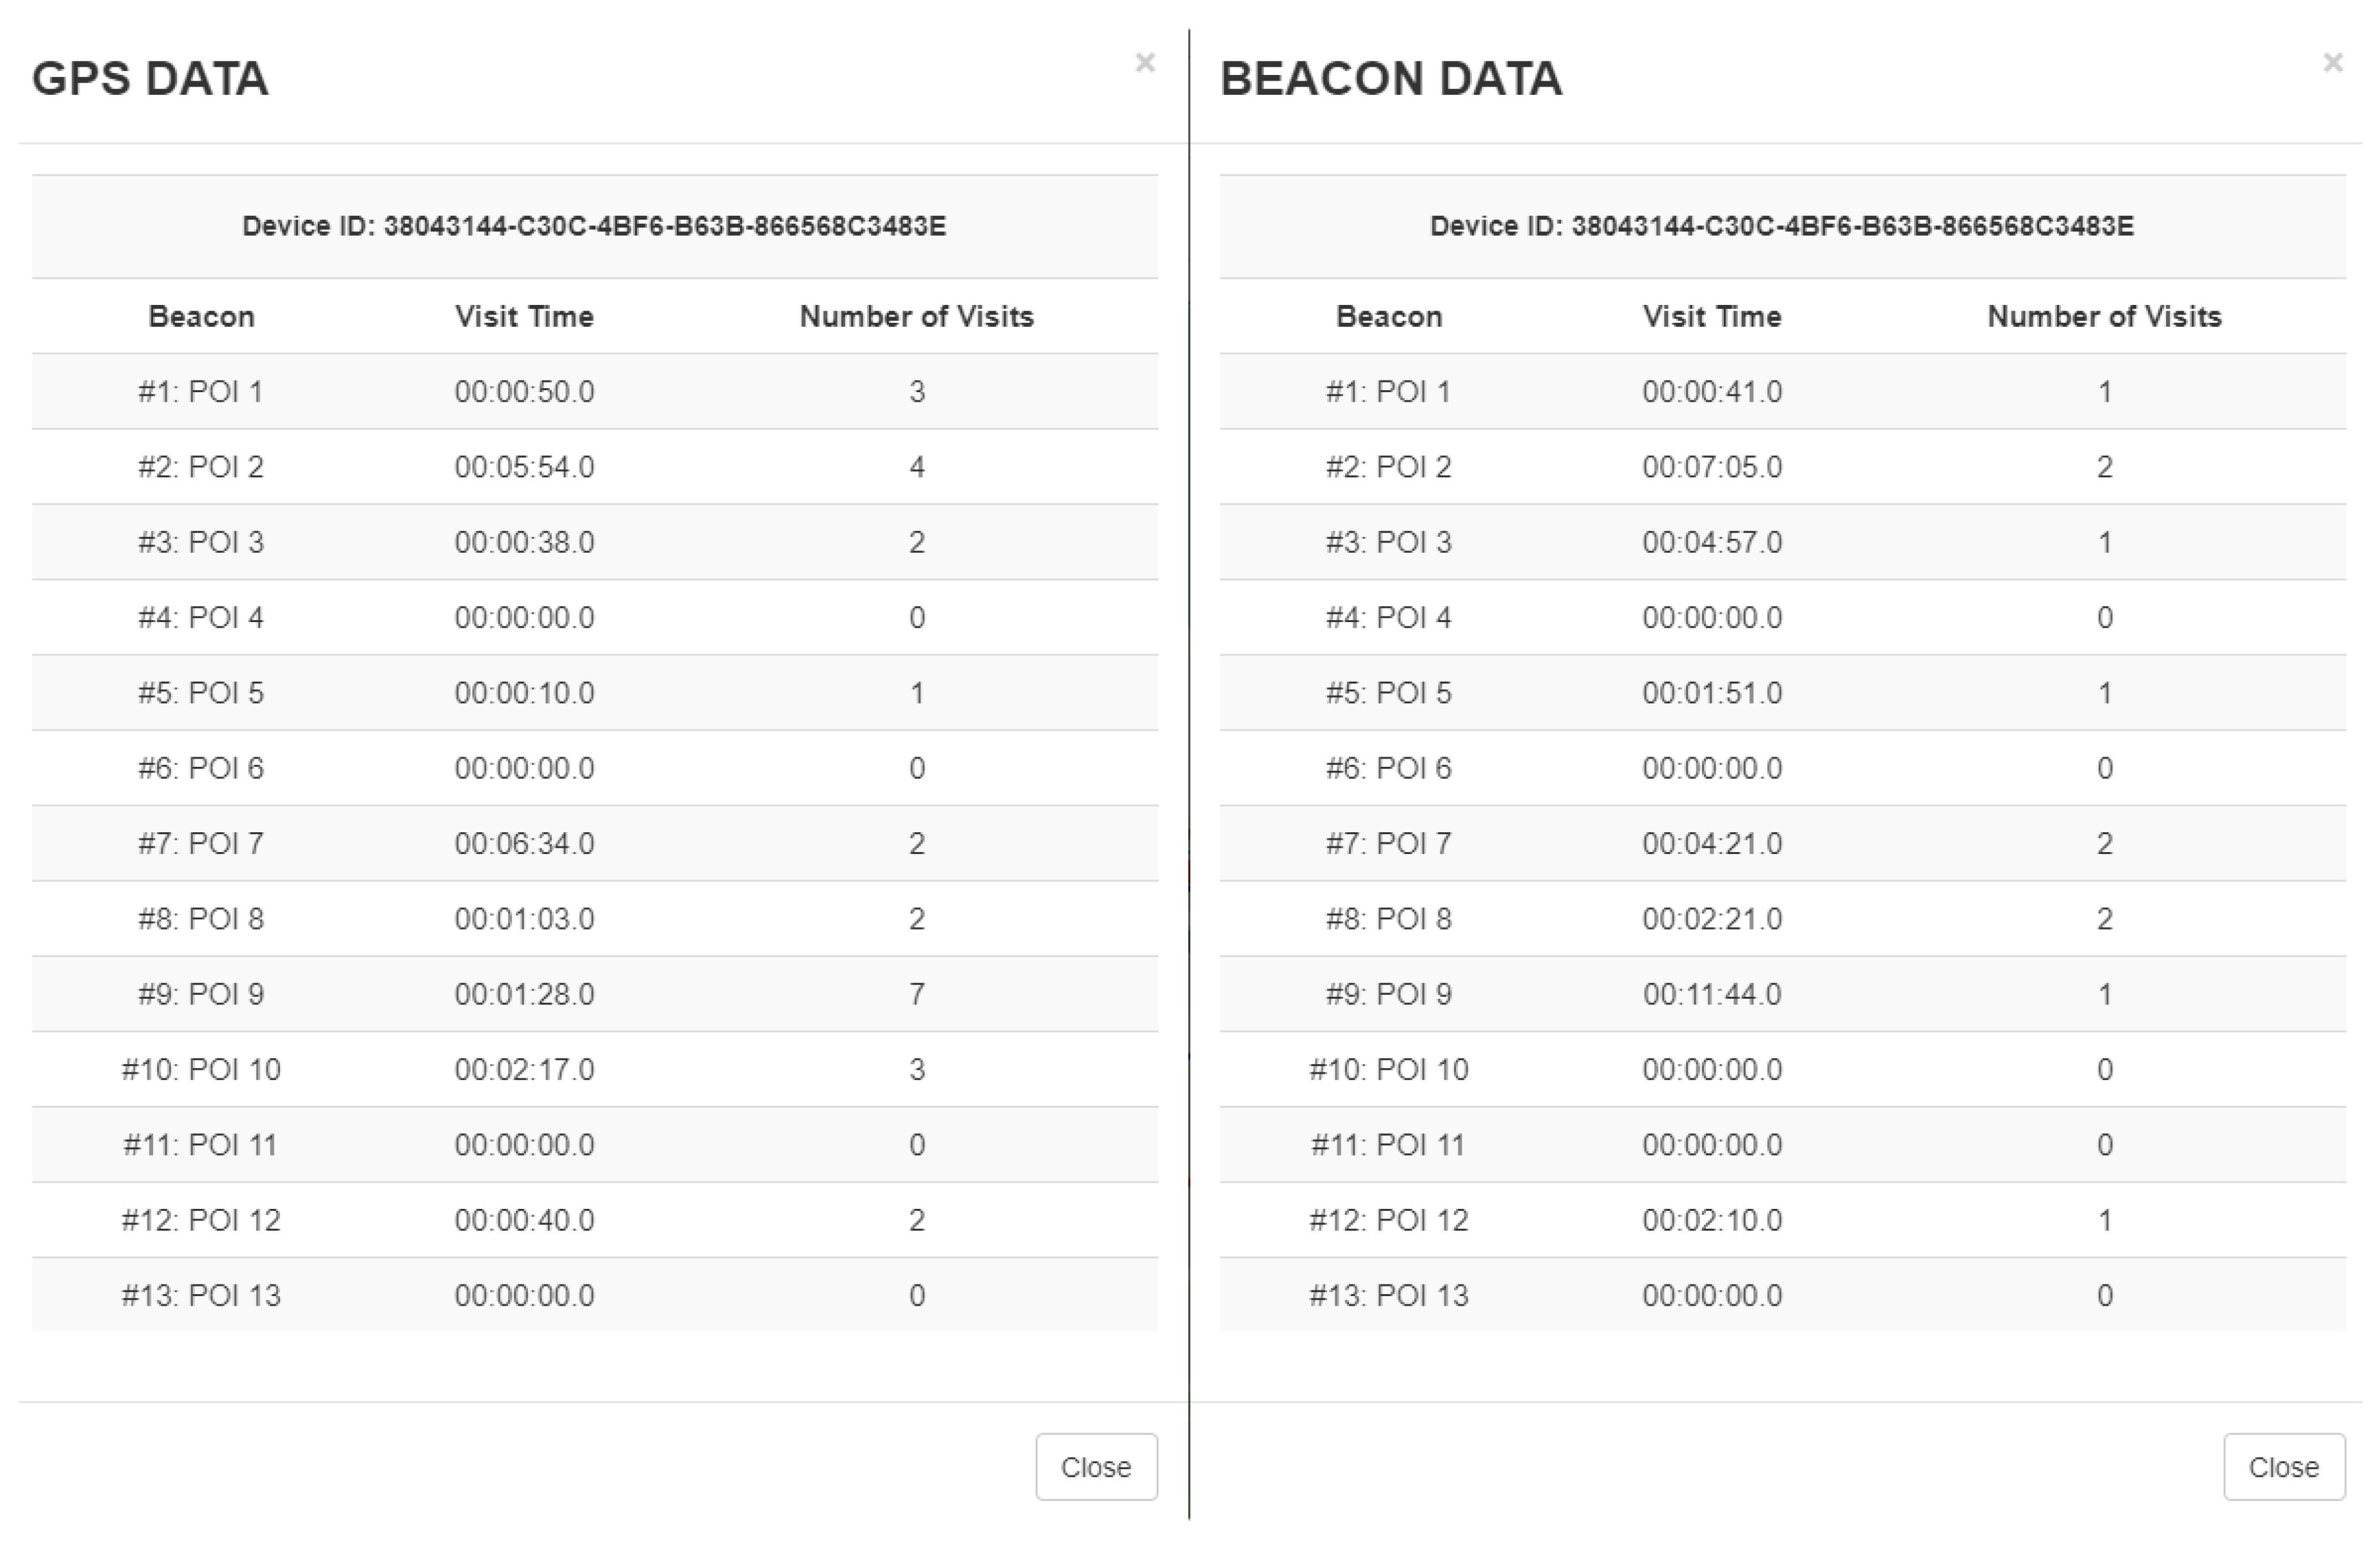
  • shows statistics related to a single visitor;
  • shows statistics related to a single POI;
  • allows uploading new datasets of multiple locations.
The tool is made up of two webpages: the editor page, designed for settings and uploading data, and the web application, designed for analysis and visualization. The first one basically allows one to upload the .csv files and to determine the location of the area of interest. This first page has the purpose of enabling non-expert users to upload autonomously the data collected in a certain period of observation. The latter is designed to query the database thanks to a webpage interface (see Figure 9). The database is filled with the same data structure described previously. Since detections are spread over several months, it was necessary to split data into routes: one route for each device in each day, so that the path visualization appears more clearly and is more useful for data analysis. The GPS routes were registered at a recording rate of 5 s; however, in order to draw up the statistics described in the previous sections (as well as understand the performance of the beacons), each GPS datum is associated with the nearest POI (if there is one), choosing from a list of beacons that are within a maximum distance of 15 m from the GPS detection. The number of visits and total visiting time are calculated for each track mode, in order to evaluate the people’s interest in a particular POI. The number of visits quantifies how many times (not consecutively) a person is in the area of a certain beacon. The visiting time means the time interval spent by a particular person in a beacon area for two consecutive detections; the total visiting time is the sum of all visiting time, considering every visit to a specific POI.
The webpage user can select a device and one of its routes, so the rows related to the GPS and beacon detections of the chosen day will appear in the caption table. The two tracks can be individually drawn by clicking on the respective button, and their time evolution is examined using the interface, depicted in Figure 10.
Two other buttons (info) show statistics related to the selected device on that day (beacon name, total visiting time, and number of visits, as shown in Figure 11).
This feature is particularly useful for understanding the performances of the mobile application in engaging the visitor’s attention. In fact, keeping track of its flow and the related time spent on the nearest beacon permits understanding whether the visitor was captured by the notification by the beacon or not. Bearing in mind the Senseable Space concept, the data visualization tool is suitable for evaluating whether the objectives of the installation have been achieved or not. We can determine whether the information related to the POI reached the visitor. If the notification fails to engage, it will be the prerogative of the manager of the park to rearrange the interaction between the application and the park environment. Though monitoring the single device tracks is undoubtedly useful, it can be very time-consuming, especially if the area of study is wide and the number of devices is large. A generalization of the statistics is thus required. We achieved this by visualizing, for each beacon, the number of visitors in a certain period. The statistics shown in Figure 12 represent a sample of the information collected.
In this light, it is possible to infer that such architecture can allow the exploitation of POS. The system has been conceived as a service for visitors of the park; having real-time notifications about significant POIs of the park can improve their knowledge of the space without any action required from the user. This is a benefit for the user, especially in an urban park where POIs are not easily recognizable. In addition, the use of active beacons provides information even when the GPS signal is missing. Furthermore, these sensors can be easily rearranged among the park to improve the experience of the users. This second action can be made in a reliable way, since the data collection service allows for the understanding of visiting patterns by tracking the users path. If a single POI is not visited, or in case of a public event, beacons can be re-programmed in order to drive visitor flow towards different areas of the park. The reconfiguration by the public authority is reliable, since it is not based on their personal insight, but it is performed with a data-driven approach.

7. Conclusions and Future Work

In this paper, a real case installation to provide and collect data to and from users was presented. We demonstrated how it is possible, thanks to the use of pervasive ICT solutions, to upgrade a POS to the condition of Senseable Space. This provides users with new instruments to enhance their experience when visiting and discovering the park, and represents a valuable source of information that could be used for planning processes. We can thus outline two main kinds of users who can benefit from our approach: visitors and planners. Visitors can have access to interactive experiences with little knowledge of the area. Visitors can be tourists, visiting for a short period of time and searching for new and unique experiences, residents, who, living in the vicinity, will use the place in their daily lives if it suits their needs, and researchers, who seek information about, e.g., fauna, flora, geographical locations, or socio-cultural and spatial aspects. Planners try to create spaces that are able to satisfy users’ expectations. The example reported is strictly connected to tourism (and in particular to tourism oriented towards heritage sites), both in terms of giving and receiving information to and from users.
As a material product of this research, a system has been developed that takes every CSV file that is available in the environment and automatically performs pre-processing and data analysis. As has been mentioned, this system has been developed in Java and can be run on any computer as a standalone desktop application. The first part of the procedure is a pre-processing phase, in which the following steps are performed in sequence: data merging, data cleaning, data transformation, data integration, data discretization, and missing data imputation. All these steps are performed with the intention of generating homogeneity among all available information, and with the aim of selecting data that are strictly usable. The second part of the procedure is a post-processing phase, in which additional information is added to existing information, and in which aggregate data are inferred. The main objective of this step is to extract statistics and generate knowledge that will be used for the analysis of the user’s behavior inside the studied case.
Furthermore, it is noteworthy that the pre-processing and post-analysis system has been developed with the intention of addressing not only the real use case described in this document but also other similar scenarios. This system can be easily adapted to any other environment, requiring only a minimum of adaptation to the format and structure of the data coming from the available sensors.
One of the advantages of such an app-based system is that there is no need to perform a direct user test to validate it. In fact, although during its development some panelists were asked to test it in the real scenario, it was possible to monitor the performance by tracking each session of usage. By analyzing certain features such as the average duration of each session and the number of downloads, un-installs, or crashes, developers can constantly infer useful information to optimize the app. In the present study, we did not observe anomalies and there was no need for further interventions. We would also like to remark that the app even allows users to express their opinion about the POIs; this degree of appreciation can even be considered an indicator to evaluate the usability and willingness by the users.
Finally, it is fair to say that the deployed environment has some drawbacks, the addressing of which has been planned for future research. At this moment, these are two detected drawbacks that will be faced in the following steps of the research:
  • The collection of users’ data is app-based, leading to the gathering of small amounts of data. The period of data acquisition spanned from the end of March 2017 to August 2017, and we actually monitored more than 100 visitors. This fact makes it hard to predict the users’ behavior. This drawback can be solved using other kinds of sensors or beacons. This possibility will be studied in the near future. Furthermore, it is planned to improve the app with some additional features, such as the route planning engine based on metaheuristics [34,35] or automated translations [36].
  • The beacons are error-prone, leading to the strict necessity of strong pre-processing systems. This drawback can be overcome by replacing the existing beacons by more reliable ones.
  • The pre-processing and post-analysis system is not real-time and is not adapted for each visitor. Influencing the visitor’s path could be a good solution if the path is planned according to their preferences. This should be done with a real-time notification service with a predictor-corrector procedure acting as a guidance.

Author Contributions

The environment was deployed in Cardeto Park, under the supervision of R.P. and E.S.M. The placement of the sensors was carried out by A.K. and E.O. under the supervision of F.J.A. The pre-processing and post-analysis system has been performed by E.O. The introduction was written by R.P. and E.O. The background section was written by R.P and E.S.M. The description of the deployed environment was written by A.K and F.J.A. The application was developed by R.P., E.S.M., and A.K. The section dedicated to the CyberCardeto app was written by R.P., E.O., and E.S.M. Section 6 and Section 7 were carried out by E.O., A.B., and R.P. Finally, the section on conclusions and future research was developed by E.O. and R.P. All authors have reviewed and approved the contents of this paper. The authors declare that they have no conflicts of interest.

Acknowledgments

This work has been supported by the Cost Action TU1306, called CYBERPARKS: Fostering knowledge about the relationship between Information and Communication Technologies and Public Spaces supported by strategies to improve their use and attractiveness, the Spanish Ministry of Economy and Competitiveness under the ESPHIA project (ref. TIN2014-56042-JIN) and the TARSIUS project (ref. TIN2015-71564-C4-4-R), and the Basque Country Department of Education under the BLUE project (ref. PI-2016-0010). The authors would also like to thank the staff of UbiSive s.r.l. for the support in developing the application.

Conflicts of Interest

The authors declare no conflict of interest.

References

  1. Abdel-Aziz, A.A.; Abdel-Salam, H.; El-Sayad, Z. The role of ICTs in creating the new social public place of the digital era. Alex. Eng. J. 2016, 55, 487–493. [Google Scholar] [CrossRef]
  2. Vukmirovic, M.; Runic, D. Intelligent pedestrian environment. Lessons from Parisian experience. Int. Forum Knowl. Asset Dyn. 2013, 1, 1762–1772. [Google Scholar]
  3. Kostakos, V.; O’Neill, E.; Penn, A.; Roussos, G.; Papadongonas, D. Brief encounters: Sensing, modeling and visualizing urban mobility and copresence networks. ACM Trans.Comput.-Hum. Interact. (TOCHI) 2010, 17, 2. [Google Scholar] [CrossRef]
  4. Girardin, F.; Calabrese, F.; Dal Fiore, F.; Ratti, C.; Blat, J. Digital footprinting: Uncovering tourists with user-generated content. IEEE Pervasive Comput. 2008, 7, 36–43. [Google Scholar] [CrossRef]
  5. Frontoni, E.; Mancini, A.; Pierdicca, R.; Sturari, M.; Zingaretti, P. Analysing human movements at mass events: A novel mobile-based management system based on active beacons and AVM. In Proceedings of the 24th Mediterranean Conference on Control and Automation (MED), Athens, Greece, 21–24 June 2016; pp. 605–610. [Google Scholar]
  6. Golder, S.A.; Macy, M.W. Digital footprints: Opportunities and challenges for online social research. Sociology 2014, 40, 129. [Google Scholar] [CrossRef]
  7. Bojic, I.; Massaro, E.; Belyi, A.; Sobolevsky, S.; Ratti, C. Choosing the right home location definition method for the given dataset. In International Conference on Social Informatics; Springer: Berlin, Germany, 2015; pp. 194–208. [Google Scholar]
  8. Heidemann, J.; Govindan, R. Embedded sensor networks. In Handbook of Networked and Embedded Control Systems; Springer: Berlin, Germany, 2005; pp. 721–738. [Google Scholar]
  9. Fernández, S.; Gualda, D.; García, J.C.; García, J.J.; Ureña, J.; Gutiérrez, R. Indoor location system based on ZigBee devices and metric description graphs. In Proceedings of the IEEE 7th International Symposium on Intelligent Signal Processing, Floriana, Malta, 19–21 September 2011; pp. 1–5. [Google Scholar]
  10. Sturari, M.; Liciotti, D.; Pierdicca, R.; Frontoni, E.; Mancini, A.; Contigiani, M.; Zingaretti, P. Robust and affordable retail customer profiling by vision and radio beacon sensor fusion. Pattern Recognit. Lett. 2016, 81, 30–40. [Google Scholar] [CrossRef]
  11. Antonio, P.; Grimaccia, F.; Mussetta, M. Architecture and methods for innovative heterogeneous wireless sensor network applications. Remote Sens. 2012, 4, 1146–1161. [Google Scholar] [CrossRef] [Green Version]
  12. Gaddam, A.; Mukhopadhyay, S.; Sen Gupta, G.; Guesgen, H. Wireless sensors networks based monitoring: Review, challenges and implementation issues. In Proceedings of the 3rd International Conference on Sensing Technology, Tainan, Taiwan, 30 November–3 December 2008; pp. 533–538. [Google Scholar]
  13. Benini, L.; Farella, E.; Guiducci, C. Wireless sensor networks: Enabling technology for ambient intelligence. Microelectron. J. 2006, 37, 1639–1649. [Google Scholar] [CrossRef]
  14. Yoshimura, Y.; Amini, A.; Sobolevsky, S.; Blat, J.; Ratti, C. Analysis of pedestrian behaviors through non-invasive Bluetooth monitoring. Appl. Geogr. 2017, 81, 43–51. [Google Scholar] [CrossRef]
  15. Ratti, C.; Frenchman, D.; Pulselli, R.M.; Williams, S. Mobile landscapes: Using location data from cell phones for urban analysis. Environ. Plan. B Plan. Des. 2006, 33, 727–748. [Google Scholar] [CrossRef]
  16. Grauwin, S.; Sobolevsky, S.; Moritz, S.; Gódor, I.; Ratti, C. Towards a comparative science of cities: Using mobile traffic records in new york, london, and hong kong. In Computational Approaches For Urban Environments; Springer: Berlin, Germany, 2015; pp. 363–387. [Google Scholar]
  17. Giannotti, F.; Nanni, M.; Pedreschi, D.; Renso, C.; Trasarti, R. Mining mobility behavior from trajectory data. In Proceedings of the International Conference on Computational Science and Engineering, Vancouver, BC, Canada, 29–31 August 2009; Volume 4, pp. 948–951. [Google Scholar]
  18. Paldino, S.; Bojic, I.; Sobolevsky, S.; Ratti, C.; González, M.C. Urban magnetism through the lens of geo-tagged photography. EPJ Data Sci. 2015, 4, 1. [Google Scholar] [CrossRef]
  19. Outram, C.; Ratti, C.; Biderman, A. The Copenhagen Wheel: An innovative electric bicycle system that harnesses the power of real-time information and crowd sourcing. In Proceedings of the EVER Monaco International Exhibition & Conference on Ecologic Vehicles & Renewable Energies, Monaco, March 2010. [Google Scholar]
  20. Nyhan, M.; Grauwin, S.; Britter, R.; Misstear, B.; McNabola, A.; Laden, F.; Barrett, S.R.; Ratti, C. “Exposure Track”: The Impact of Mobile-Device-Based Mobility Patterns on Quantifying Population Exposure to Air Pollution. Environ. Sci. Technol. 2016, 50, 9671–9681. [Google Scholar] [CrossRef] [PubMed]
  21. Versichele, M.; Neutens, T.; Delafontaine, M.; Van de Weghe, N. The use of Bluetooth for analysing spatiotemporal dynamics of human movement at mass events: A case study of the Ghent Festivities. Appl. Geogr. 2012, 32, 208–220. [Google Scholar] [CrossRef]
  22. Ian, S.; Nikhil, N.; Carlo, R.; Raphäel, P. Green streets: Quantifying and mapping urban trees with street-level imagery and computer vision. Landsc. Urban Plan. 2017, 165, 93–101. [Google Scholar]
  23. Qi, F.; Du, F. Trajectory data analyses for pedestrian space-time activity study. J. Vis. Exp. JoVE 2013, 72, 50130. [Google Scholar] [CrossRef] [PubMed]
  24. Khromova, A.; Costa, C.S.; Erjavec, I.Š.; Pierdicca, R.; Malinverni, E.S.; Galli, A.; Marcheggiani, E. Is the mediated public open space a smart place? Relationships between urban landscapes and ICT–The cost action tu 1306 CyberParks. SCIRES-IT-Sci. Res. Inf. Technol. 2016, 6, 17–28. [Google Scholar]
  25. Pierdicca, R.; Frontoni, E.; Zingaretti, P.; Malinverni, E.S.; Galli, A.; Marcheggiani, E.; Costa, C.S. Cyberarchaeology: Improved way findings for archaeological parks through mobile augmented reality. In International Conference on Augmented Reality, Virtual Reality and Computer Graphics; Springer: Berlin, Germany, 2016; pp. 172–185. [Google Scholar]
  26. Estimote Long Range Location Beacons. Available online: https://community.estimote.com/hc/en-us (accessed on 30 August 2017).
  27. Gomez, C.; Oller, J.; Paradells, J. Overview and Evaluation of Bluetooth Low Energy: An Emerging Low-Power Wireless Technology. Sensors 2012, 12, 11734–11753. [Google Scholar] [CrossRef]
  28. García, S.; Luengo, J.; Herrera, F. Data Preprocessing in Data Mining; Springer: Berlin, Germany, 2015. [Google Scholar]
  29. SáEz, J.A.; Luengo, J.; Herrera, F. Predicting noise filtering efficacy with data complexity measures for nearest neighbor classification. Pattern Recognit. 2013, 46, 355–364. [Google Scholar] [CrossRef]
  30. Doan, A.; Domingos, P.; Halevy, A. Learning to match the schemas of data sources: A multistrategy approach. Mach. Learn. 2003, 50, 279–301. [Google Scholar] [CrossRef]
  31. Garcia, S.; Luengo, J.; Sáez, J.A.; Lopez, V.; Herrera, F. A survey of discretization techniques: Taxonomy and empirical analysis in supervised learning. IEEE Trans. Knowl. Data Eng. 2013, 25, 734–750. [Google Scholar] [CrossRef]
  32. Luengo, J.; García, S.; Herrera, F. On the choice of the best imputation methods for missing values considering three groups of classification methods. Knowl. Inf. Syst. 2012, 32, 77–108. [Google Scholar] [CrossRef]
  33. Li, X.; Zhang, C.; Li, W.; Ricard, R.; Meng, Q.; Zhang, W. Assessing street-level urban greenery using Google Street View and a modified green view index. Urban For. Urban Green. 2015, 14, 675–685. [Google Scholar] [CrossRef]
  34. Osaba, E.; Yang, X.S.; Diaz, F.; Lopez-Garcia, P.; Carballedo, R. An improved discrete bat algorithm for symmetric and asymmetric traveling salesman problems. Eng. Appl. Artif. Intell. 2016, 48, 59–71. [Google Scholar] [CrossRef]
  35. Osaba, E.; Carballedo, R.; Yang, X.S.; Fister Jr, I.; Lopez-Garcia, P.; Del Ser, J. On Efficiently Solving the Vehicle Routing Problem with Time Windows Using the Bat Algorithm with Random Reinsertion Operators. In Nature-Inspired Algorithms and Applied Optimization; Springer: Berlin, Germany, 2018; pp. 69–89. [Google Scholar]
  36. Tenescu, A.; Precup, R.E.; Minculete, N. Evolving fuzzy models for automated translation. Acta Polytech. Hung. 2017, 14, 27–46. [Google Scholar]
Figure 1. General overview of Cardeto Park; the upper image depicts a satellite view, the lower image represents a typical skyline of the park.
Ijgi 07 00190 g001
Figure 2. Distribution of the points of interest (POIs) and beacons over the park.
Ijgi 07 00190 g002
Figure 3. Set of three Estimote long-range location beacons.
Ijgi 07 00190 g003
Figure 4. Examples of the installation of two different beacons.
Ijgi 07 00190 g004
Figure 5. Screenshots of the app running. From left to right: the home page of the app, the menu from which the user can choose from among different categories, the textual information about a sample POI, the POIs alerted once the user gets within the beacon range, and the map visualization.
Ijgi 07 00190 g005
Figure 6. Format of the comma-separated value (CSV) built by the beacons.
Ijgi 07 00190 g006
Figure 7. Format of the GPS data file.
Ijgi 07 00190 g007
Figure 8. Example of the improved CSV file with visitor information and additional parameters.
Ijgi 07 00190 g008
Figure 9. The home page of the web application. The webpage is structured with a search function on the left, allowing searching among the devices in a specific range of time. The map visualizes the POI’s position.
Ijgi 07 00190 g009
Figure 10. An example of the visualization of a tracks. Blue lines: GPS tracks; red lines: beacon tracks. The playback menu shows the status time of the track, while the buttons on the upper right gives access to further statistics.
Ijgi 07 00190 g010
Figure 11. GPS and beacon detection for each device. The example in the figure shows the relation between the GPS position of the device and the ability of each beacon to engage the visitor.
Ijgi 07 00190 g011
Figure 12. Statistics after one month of monitoring visitors’ activities in the park.
Ijgi 07 00190 g012
Table 1. Trajectories followed by some of the users.
UserIdTrajectory
07E21E24-5632-4335-A140-F668CEACA9A513-3-13-10-13-3-5-5-3-1-13-3-1-13-3-13-3-1-1-3-1-13-3-1-13
172BB6F1-67B2-4F37-A833-5BCC2F677F722-1-13-3
25507D83-13B3-467A-9208-9FA816E8593413-9-10-11-1-3-5-7-13-1-13-1-13-1-3-1-11-10-12-1-2-4-3-13-9-10-12
4C623546-8E6D-43BF-8C90-7CAD448963AC13-3-1-13-13-1-2-4-1-1-3-13-9-10-12-10-13-3-1
4DB20600-611E-4578-AE20-2DF4A415324A5-3-13-3-13-3-5-3-13-9-12-12-12-11-12-11
Table 2. Time spent by some of the users.
UserIdTime Spent
07E21E24-5632-4335-A140-F668CEACA9A510,179
172BB6F1-67B2-4F37-A833-5BCC2F677F721825
25507D83-13B3-467A-9208-9FA816E859349163
4C623546-8E6D-43BF-8C90-7CAD448963AC3804
4DB20600-611E-4578-AE20-2DF4A415324A3946
Table 3. Information about the status of the park at specific moments.
UserIdTime StampEntering BeaconPersons in Same Beacon AreaPersons in the Park
07E21E24-5632-4335-A140-F668CEACA9A5Friday September 30 15:20:48316
0D14138D-DA2B-4E90-8E8D-3B6CE1566C08Friday September 30 17:50:25126
172BB6F1-67B2-4F37-A833-5BCC2F677F72Friday September 30 15:57:35339
25507D83-13B3-467A-9208-9FA816E85934Friday September 30 17:11:371327
4DB20600-611E-4578-AE20-2DF4A415324AFriday September 30 18:06:441024

