2D Cartography Training: Has the Time Come for a Paradigm Shift?


1
Departamento de Técnicas y Proyectos en Ingeniería y Arquitectura, Área de Ingeniería Cartográfica, Geodésica y Fotogrametría, Universidad de La Laguna, 38200 La Laguna, Spain
2
Department of Psychology. RISC lab (Research in Spatial Cognition Lab), Temple University, 19122 Philadelphia, USA
*
Author to whom correspondence should be addressed.
ISPRS Int. J. Geo-Inf. 2018, 7(5), 197; https://doi.org/10.3390/ijgi7050197
Submission received: 26 April 2018
/
Revised: 11 May 2018
/
Accepted: 16 May 2018
/
Published: 19 May 2018
Abstract
:2D maps with contour lines can be difficult for students to visualize in three-dimensions to interpret relief. Despite this challenge, teaching based on 2D contour lines is still used, which could generate frustration/motivation problems among students. Recently, strategies based on 3D technologies such as Augmented Reality (AR) have proven to be motivating for students. Has the time come for a paradigm shift in the teaching of land interpretation/representation? The present paper shows the results of an experiment in which 41 engineering students of the subject Cartography performed an activity with 2D contour lines. The impact on students’ motivation was compared with AR. In addition, data about efficiency, effectiveness and user satisfaction were assessed. Results showed that traditional 2D contour line activities were less motivating for students, compared to AR. However, students perceived that doing 2D exercises made them more competent than with AR, although they reported that the 2D exercises required more effort. In terms of participant’s spatial reasoning acquisition, 2D strategies offered results similar to AR. Overall, these results suggest that 2D teaching methodologies are still effective and can be complemented by the use of innovative 3D visualization technologies.
1. Introduction
The 2D representation of landforms in maps has traditionally been done through different cartographic techniques such as shading, hypsometric inks or layer tinting, and color scheme effects. The most popular resource for representing landforms in 2D maps has been contour lines. Contour lines represent a continuous value that unites points of equal value. In the case of topographic maps, these are points of elevation above the mean sea level where the contour line indicates points of equal elevation. Thus, in topographic maps, landscapes are represented two-dimensionally through contour lines which allows for the representation of relief of the land surface. Contour lines are also used in other disciplines, such as in meteorological maps, representing atmospheric pressure.
In the field of cartography, these two-dimensional symbolic representations construct the complex, three-dimensional mental models necessary to understand an environment [1,2]. In addition to offering a precise representation of the relief, topographic maps provide a great visual effect and an illusion of the landscape. Despite their utility, topographic maps require careful analysis to determine surface forms and properties. One factor that contributes to the challenge of interpreting these representations is the vertical dimension of the relief [3]. By their own two-dimensional representation (both in paper format or in two-dimensional displays), they present a difficulty in making a three-dimensional visualization and interpretation of the relief [4], because people differ in the way they abstract the reality represented in a contour line map. While topographic maps have been and continue to be used for teaching cartography, researchers such as Griffin and Lock [5] found that there are inherent perceptual problems in contour line interpretation. These difficulties have generated problems of frustration/motivation among students [6,7,8,9]. Further, issues such as landform representation, spatial skills acquisition, or processes of spatial knowledge construction with different forms of relief representation continue to be active fields of research including recent works by Carbonell [10,11], Collins [12], Tillman, Albrecht and Wunderlich [13], Eynard and Bernhard [14], and Brooke and Bernhard [3].
Despite the difficulties in describing contour lines and teaching basic concepts of relief representation observed in prior research, strategies and methodologies based on 2D representation are still used. Geography and Cartography education requires the use of maps to understand spatial relationships and thus improve spatial thinking among students [12]. This occurs in the early stages of teaching subjects related to geographic information. Niedomsyl et al. [3] (p. 87) noted that, “the use of maps to convey geographic information has a long-standing history in educational contexts”. Further, Collins [12] (p. 3) claimed that, “paper maps have been the primary method for displaying and learning about geographic information for millennia”.
In today’s digital age, students are technological natives and are very familiar with the digital environment. Students come into contact with 3D maps and landscape representations in numerous ways [15] and can visualize the relief through accessible popular applications such as Google Maps, which offers immense potential for the representation of landforms. Further, 3D technologies such as Augmented Reality (AR) may support teaching, although this technology also presents some limitations for its implementation [11]. Specifically, research has been done on the potential of 3D technologies for the representation of the terrain and its impact on students in map-reading skills [16,17,18,19]. Therefore, it is necessary to consider whether traditional strategies based on exercises with 2D representations such as contour lines can be a demotivating factor for students compared to the spectacular and apparent ease of visualization offered by 3D representations. Is it necessary to change strategy in the teaching of concepts related to the representation of landforms? Are the traditional teaching methods using 2D representations still effective in terms of motivating students in Higher Education? Has the time come for a paradigm shift in the teaching of land interpretation/representation in favor of new technologies for three-dimensional representation?
In this research, an experiment was carried out in which a group of 41 engineering students performed traditional exercises with contour lines, a typical 2D strategy. The impact on students’ motivation was measured. The motivation and usability results from the 2D strategy group were compared with the results from a group of engineering students who were in a 3D strategy group where they used a 3D Augmented Reality technology for the representation of relief. The data from the 3D group were previously reported in another manuscript on motivation [20]. The results of the 2D strategy in terms of efficiency, effectiveness and user satisfaction are shown, which are also compared with the AR strategy. Therefore, the goal of this study was to investigate if the traditional 2D tools used for the teaching of cartography are still valid and can be complemented with the new 3D technologies in terms of motivation. Specifically, we wanted to know if students find 2D teaching methods as motivating as 3D teaching methods and if they feel that 2D methods are as effective for their learning as 3D methods.
The findings offer teachers of geographic information in Higher Education data on the advisability or not of applying a change in teaching strategies in favor of modern technologies compared to traditional learning activities.
2. Background: 2D against 3D Representations of the Landforms
There is extensive debate among the teaching community about the convenience of new 3D technologies for the representation of land compared to traditional 2D maps. Specifically, this debate spans several areas including spatial reasoning acquisition, academic improvement, learning objectives, map instruction and interpreting geospatial information, among others. The present research offers a contribution in that debate in terms of motivation.
Investigations such as those carried out by Hegan and Umek [21] compared 2D maps with digital representations in terms of cognitive development in wayfinding tasks. They concluded that maps offer certain advantages over digital representations with regard to learning objectives in developing cartographic literacy. On the contrary, in tasks related to navigation itself, digital representations such sa mobile navigators have several advantages over paper maps due to their capability of alternating between 2D and 3D representations.
In terms of representing relief, 3D representations can be superior to 2D maps because they offer a new dimension of visualization due to their ability to reproduce a more natural image of relief forms [12], in comparison with the abstract representation offered by contour lines. Three-dimensional maps are easier to read because the terrain is depicted with a side view, similar to how people see it in their everyday lives, instead of a top-down view [22]. Taking this into account, in tasks related to the evaluation of environmental impact, Lai, Kwong and Mak [23] highlighted that 3D technology is popular due to the similarity of these representations with the landscape. However, this apparent advantage does not seem to be reflected in 3D technologies ability to support the interpretation of geospatial information in educational fields. In a study conducted by Hegarty et al. [16], students preferred 3D maps over 2D based on their appearance rather than their information content. Savage, Weibe and Divine [24] compared the utility of topographical representations in 2D and 3D for the performance on map-based tasks. They discovered that 3D maps do not offer apparent advantages for the problems that require the third dimension, that is, the elevation data.
Other research [25] has been carried out with geospatial 3D technologies, investigating whether paper or digital map instruction-use is more affective for student learning outcomes. This work showed that digital maps were not more effective than paper maps and found no significant differences in student performance. These results align with those obtained by Verdi, Crooks and White [26] in learning outcomes. In addition, Cunningham [27] argued that 2D mapping is the best tool to develop spatial thinking. In a more recent study, Hurst and Clough [28] analyzed the preference of students using both paper and digital maps and concluded that both instructional media have advantages and disadvantages depending on the use of the map. On the other hand, for geographic experts, the maps were found to be the preferred medium, which is supported by previous works such as by Verdi, Crooks, and White [26] and Pedersen, Farrell, and McPhee [25], who also found a greater preference for paper maps among students.
Niedomsyl et al. [15] conducted a study on the learning benefits of using 2D versus 3D maps, and also concluded that each type of representation offers strengths and weaknesses depending on the purpose sought. Ultimately, they claimed that the current body of research on the overall usefulness of 3D maps versus 2D maps is inconclusive. The use of maps to convey geographic information is widespread, yet little is known about the benefits of using different map formats. Niedomsyl et al. also claimed that research on teaching methods for 2D and 3D maps and their outcomes are inconsistent.
More recent research has studied the impact of paper versus digital maps on spatial reasoning [12]. Results from this work indicated that both paper and digital media aid in developing and improving spatial thinking skill acquisition among students. The results also affirmed that, despite numerous claims in geography education research, geospatial technology does not necessarily do a better job at promoting spatial thinking than paper maps. The author argued for the parallel existence of both digital and paper maps in the classroom because paper map instruction could be used as a complementary instructional tool to digital map instruction. This assertion aligns with another recent study which assessed whether virtual and tangible 3D representations are good complements to traditional 2D teaching for topographic map-reading skill development [19]. The results indicated that, although the improvement in map-reading skill was lower in comparison to 3D models, the combined 2D/3D instruction was significantly better than the 2D instruction alone. These conclusions also match those of St. John et al. [29], and Carbonell and Bermejo [30].
As previously described, there is an ongoing discussion about the usefulness of 3D maps and displays versus bi-dimensional representations related to spatial thinking and map instruction among others, but little work has investigated the impact of these instructional tools on motivation. Prior to the appearance of innovative technologies of three-dimensional cartographic representation, authors such as Carter [31] emphasized that the knowledge and motivation of the map viewer and the map viewing environment had received little attention in the research literature. Subsequent studies highlight the lukewarm interest in geographical field to quantitatively measure students’ motivation when using mapping tools [32]. The lack of interest may reflect a lack of viable alternatives. In the educational area, motivation can be defined as the student’s desire to engage in a learning environment [33]. The present study investigated the impact of 2D maps on the motivation of the student and students’ perceptions in terms of efficiency, effectiveness and user satisfaction.
3. Motivation, Efficiency, Effectiveness and User Satisfaction
Motivation can be defined as a source of energy that is responsible for why learners decide to try, how long they are willing to sustain an activity, how hard they are going to pursue it, and how connected they feel to the activity [34]. Motivation describes the student’s perception of their participation in a particular teaching–learning environment.
Scientists, researchers, and teachers agree that students who are motivated to learn are more likely to engage, persist, and expend effort for task completion than those who are unmotivated [35]. Strategies on design-based learning demonstrated improved motivation for students to pursue careers in the domain of practice as well as improved conceptual understanding [36]. In STEM (Science, Technology, Engineering and Math) domains, as evidence about the role of motivational factors accumulates, the field has become increasingly interested in incorporating measures of these attributes in research and interventions to enhance student success [37].
In addition, in STEM education, there is research on the usability of 3D technologies (Augmented Reality, Spatial Data Infrastructure) in teaching environments [20,38], but there is no information available on traditional teaching methodologies based on 2D representations in terms of efficiency, effectiveness and satisfaction of the user. Usability is related to the development of interactions (systems, product, technology, tools, apps or any devices), which are effective, easy to learn, and user-friendly [39]. What the present study investigates is not a specific technology, application or product, but rather a traditional 2D teaching approach to concepts related to landforms representation and interpretation in maps. Thus, the term usability will be used in a slightly different manner in the present investigation. Specifically, in this experiment, surveys were conducted on efficiency, effectiveness and user satisfaction of the participants, which correspond to the usability components that Bevan [40] and Earthy, Jones and Bevan [41] established in accordance with ISO 9241-11. Although this paper does not address more traditional conceptions of usability, data regarding student’s perception of user satisfaction, efficiency and effectiveness of the experiment are reported. Effectiveness (accuracy and integrity) refers to students’ conceptions about the accuracy of the performed tasks and if the task facilitated accomplishment of the aims it was designed to fulfill. Efficiency (velocity, resources assigned) refers to students’ conceptions about the speed of the tasks performed where the primary goals could be achieved with the least amount of resources. Finally, satisfaction (fulfilling expectations) refers to the user’s attitudes towards the product and whether it fulfilled their initial expectations. These same components were also studied in an activity in which Augmented Reality was used for learning the forms of the terrain, and thus students survey responses can be compared across the two learning activity scenarios.
4. Materials and Method
4.1. 2D Landforms Workshop
The experiment was performed at the beginning of the 2017–2018 academic course in a workshop with 41 second year engineering students who were all in the 2D strategy group (23 males, 18 females, mean age 21.40 years with standard deviation (s.d.) of 1.65). The workshop was proposed as a voluntary activity within the schedule of activities to be carried out in the subject of Cartography. This course serves as an initial introductory course for students beginning their studies in cartography and have no previous experience in the use of maps at the university. Within STEM education, engineers are a group that makes frequent use of maps and cartographic information.
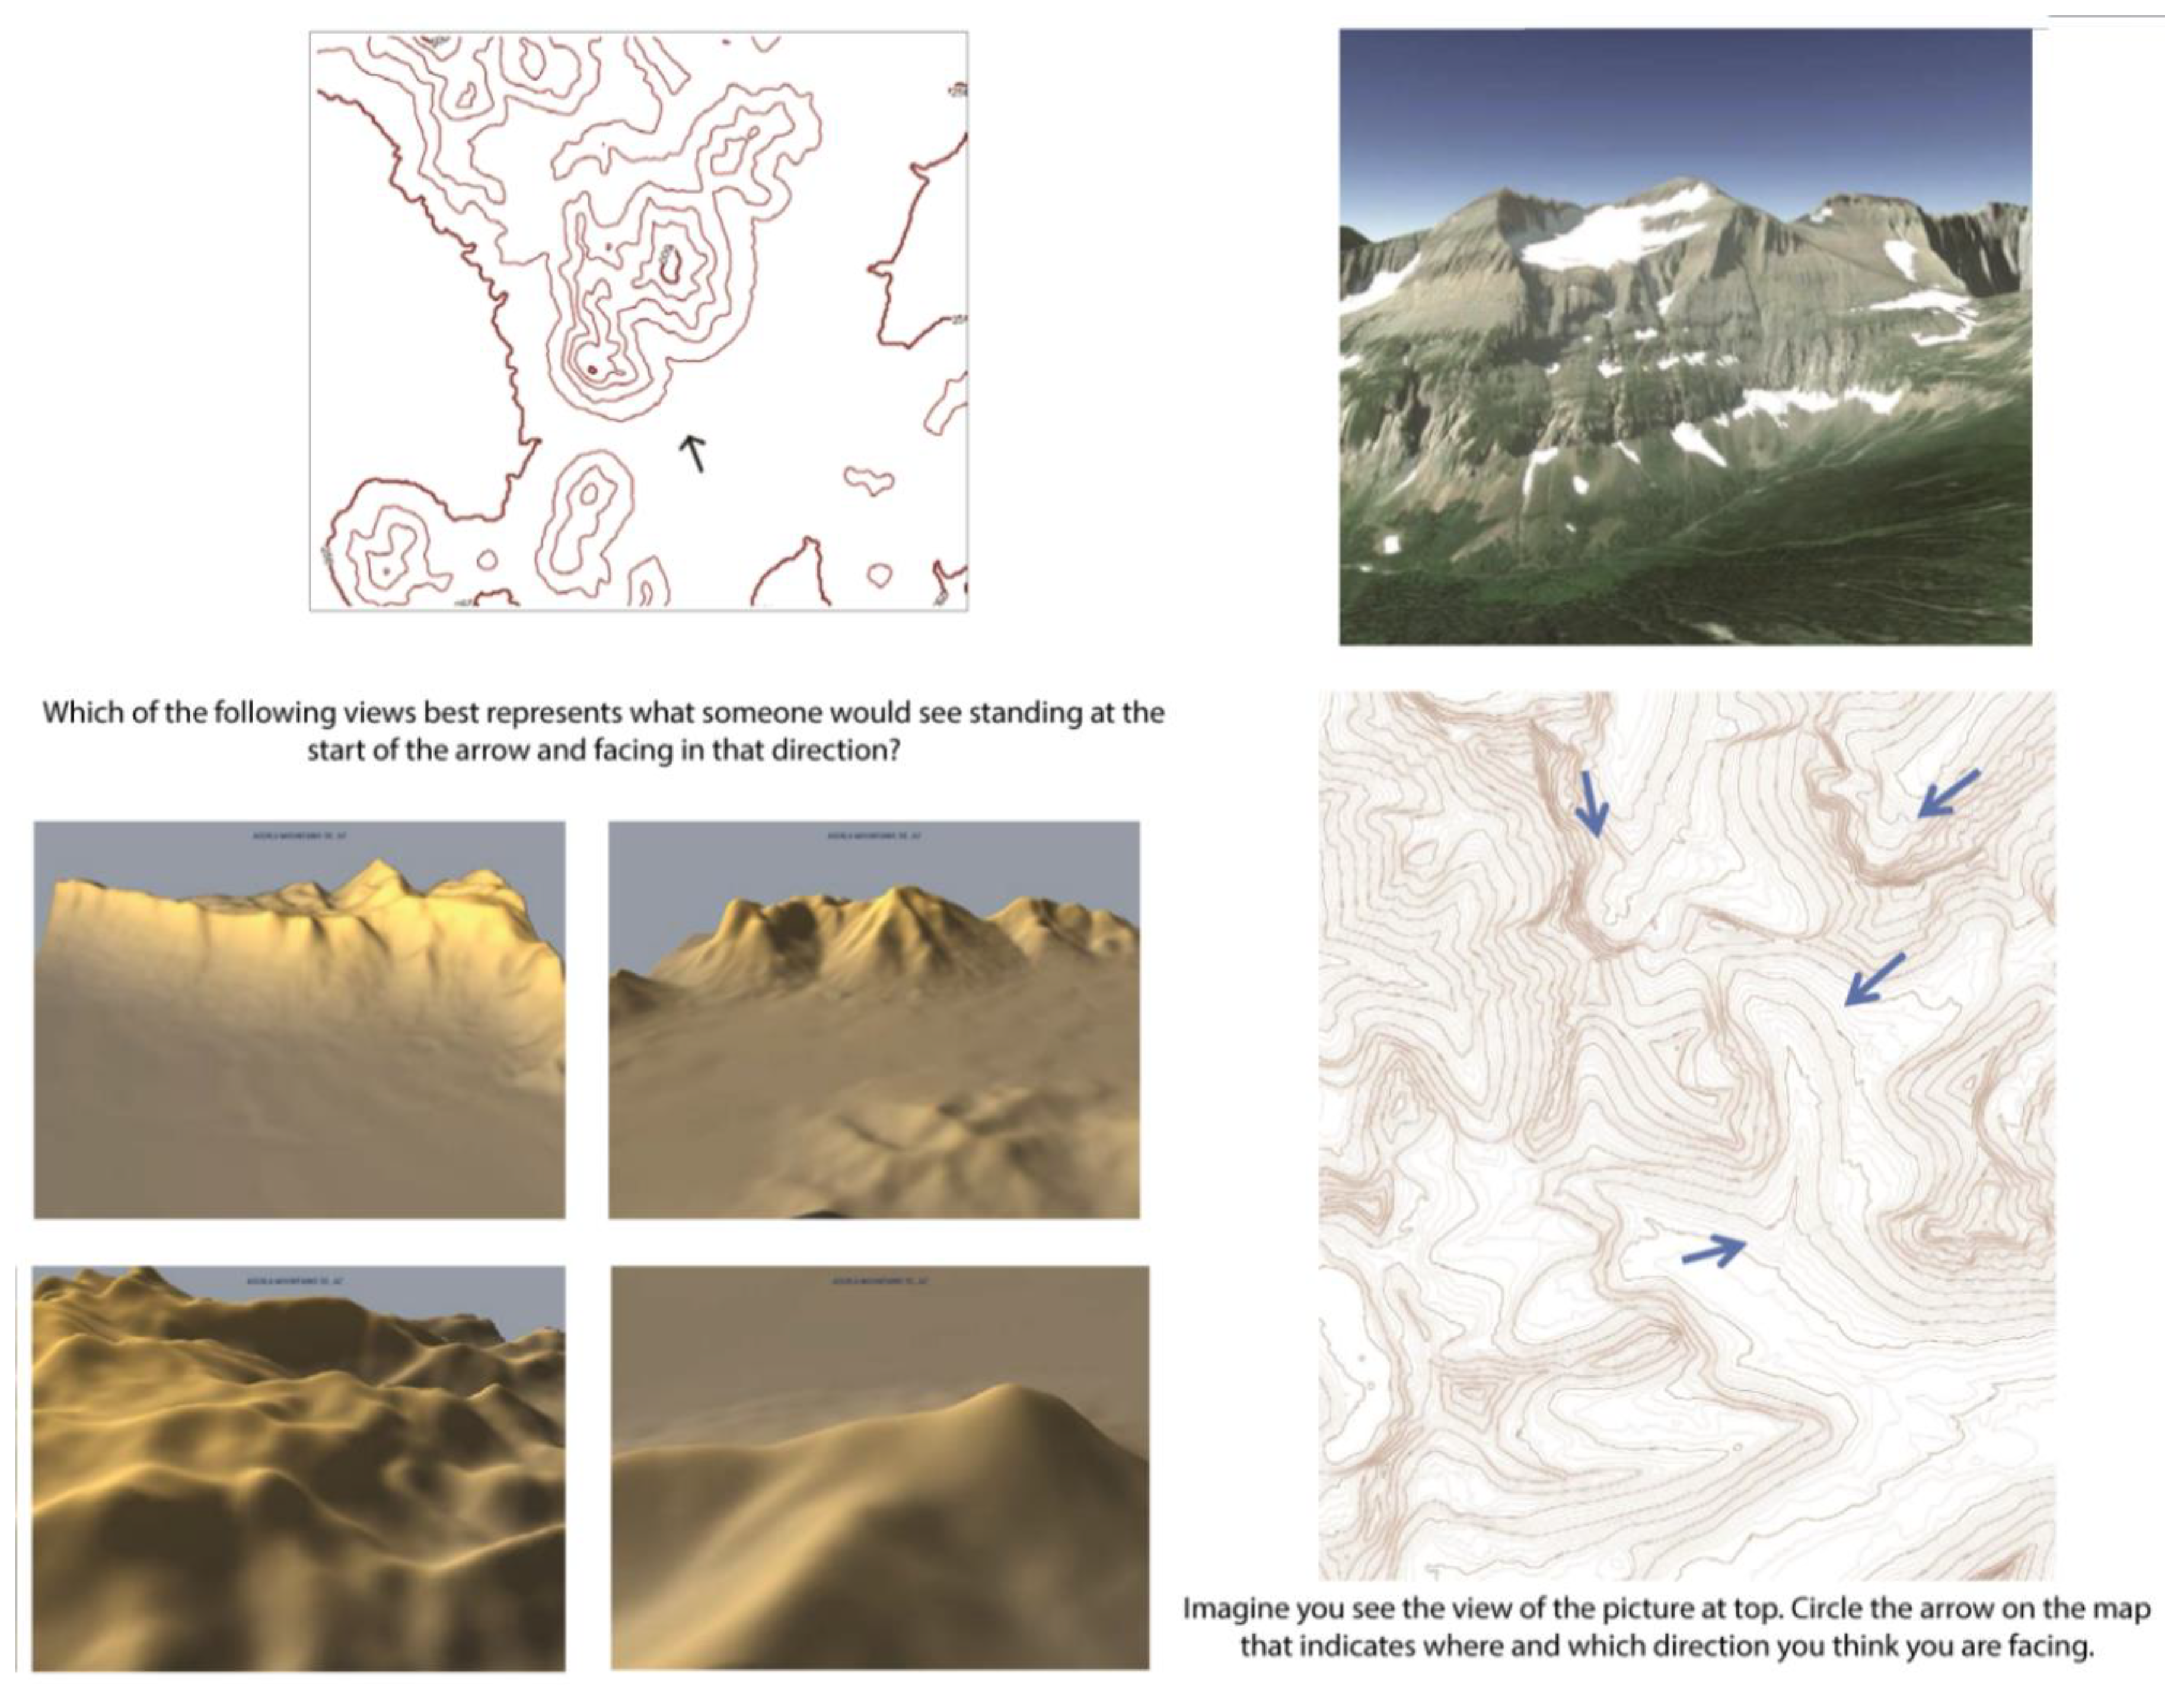
The participants completed 18 exercises in paper format that involved the use and understanding of topographic maps, where topographic relief interpretation was the primary task. In these exercises the relief was represented through contour lines, as well as contour lines combined with panoramic photos of terrain, perspectives, sections and profiles (Figure 1). This battery of exercises corresponds to those included in the Topographic Map Assessment (TMA) [42] developed in collaboration by researchers at Northwestern University, Carlton College, and Temple University. The workshop was designed by the developers of the TMA from the RISC Lab at Temple University (https://sites.temple.edu/risc/), as well as researchers in the Spatial Skills Development research group at the University of La Laguna (http://dehaes.webs.ull.es/). The TMA contains a brief textual introduction to topographic maps, in which basic concepts of cartographic representation are described and defined. Before beginning the 18 exercises, the participants studied this document to insure they all have sufficient knowledge of the required terms.
There were seven types of tasks integrated in the 18 assignments (Table 1). Twelve of the items were worth 1 point, one item was worth 5 points (item 3), one item was worth 3 points (item 11), and 4 items were worth 2 points (items 9, 10, 12, and 17) resulting in a maximum possible score of 28 points.
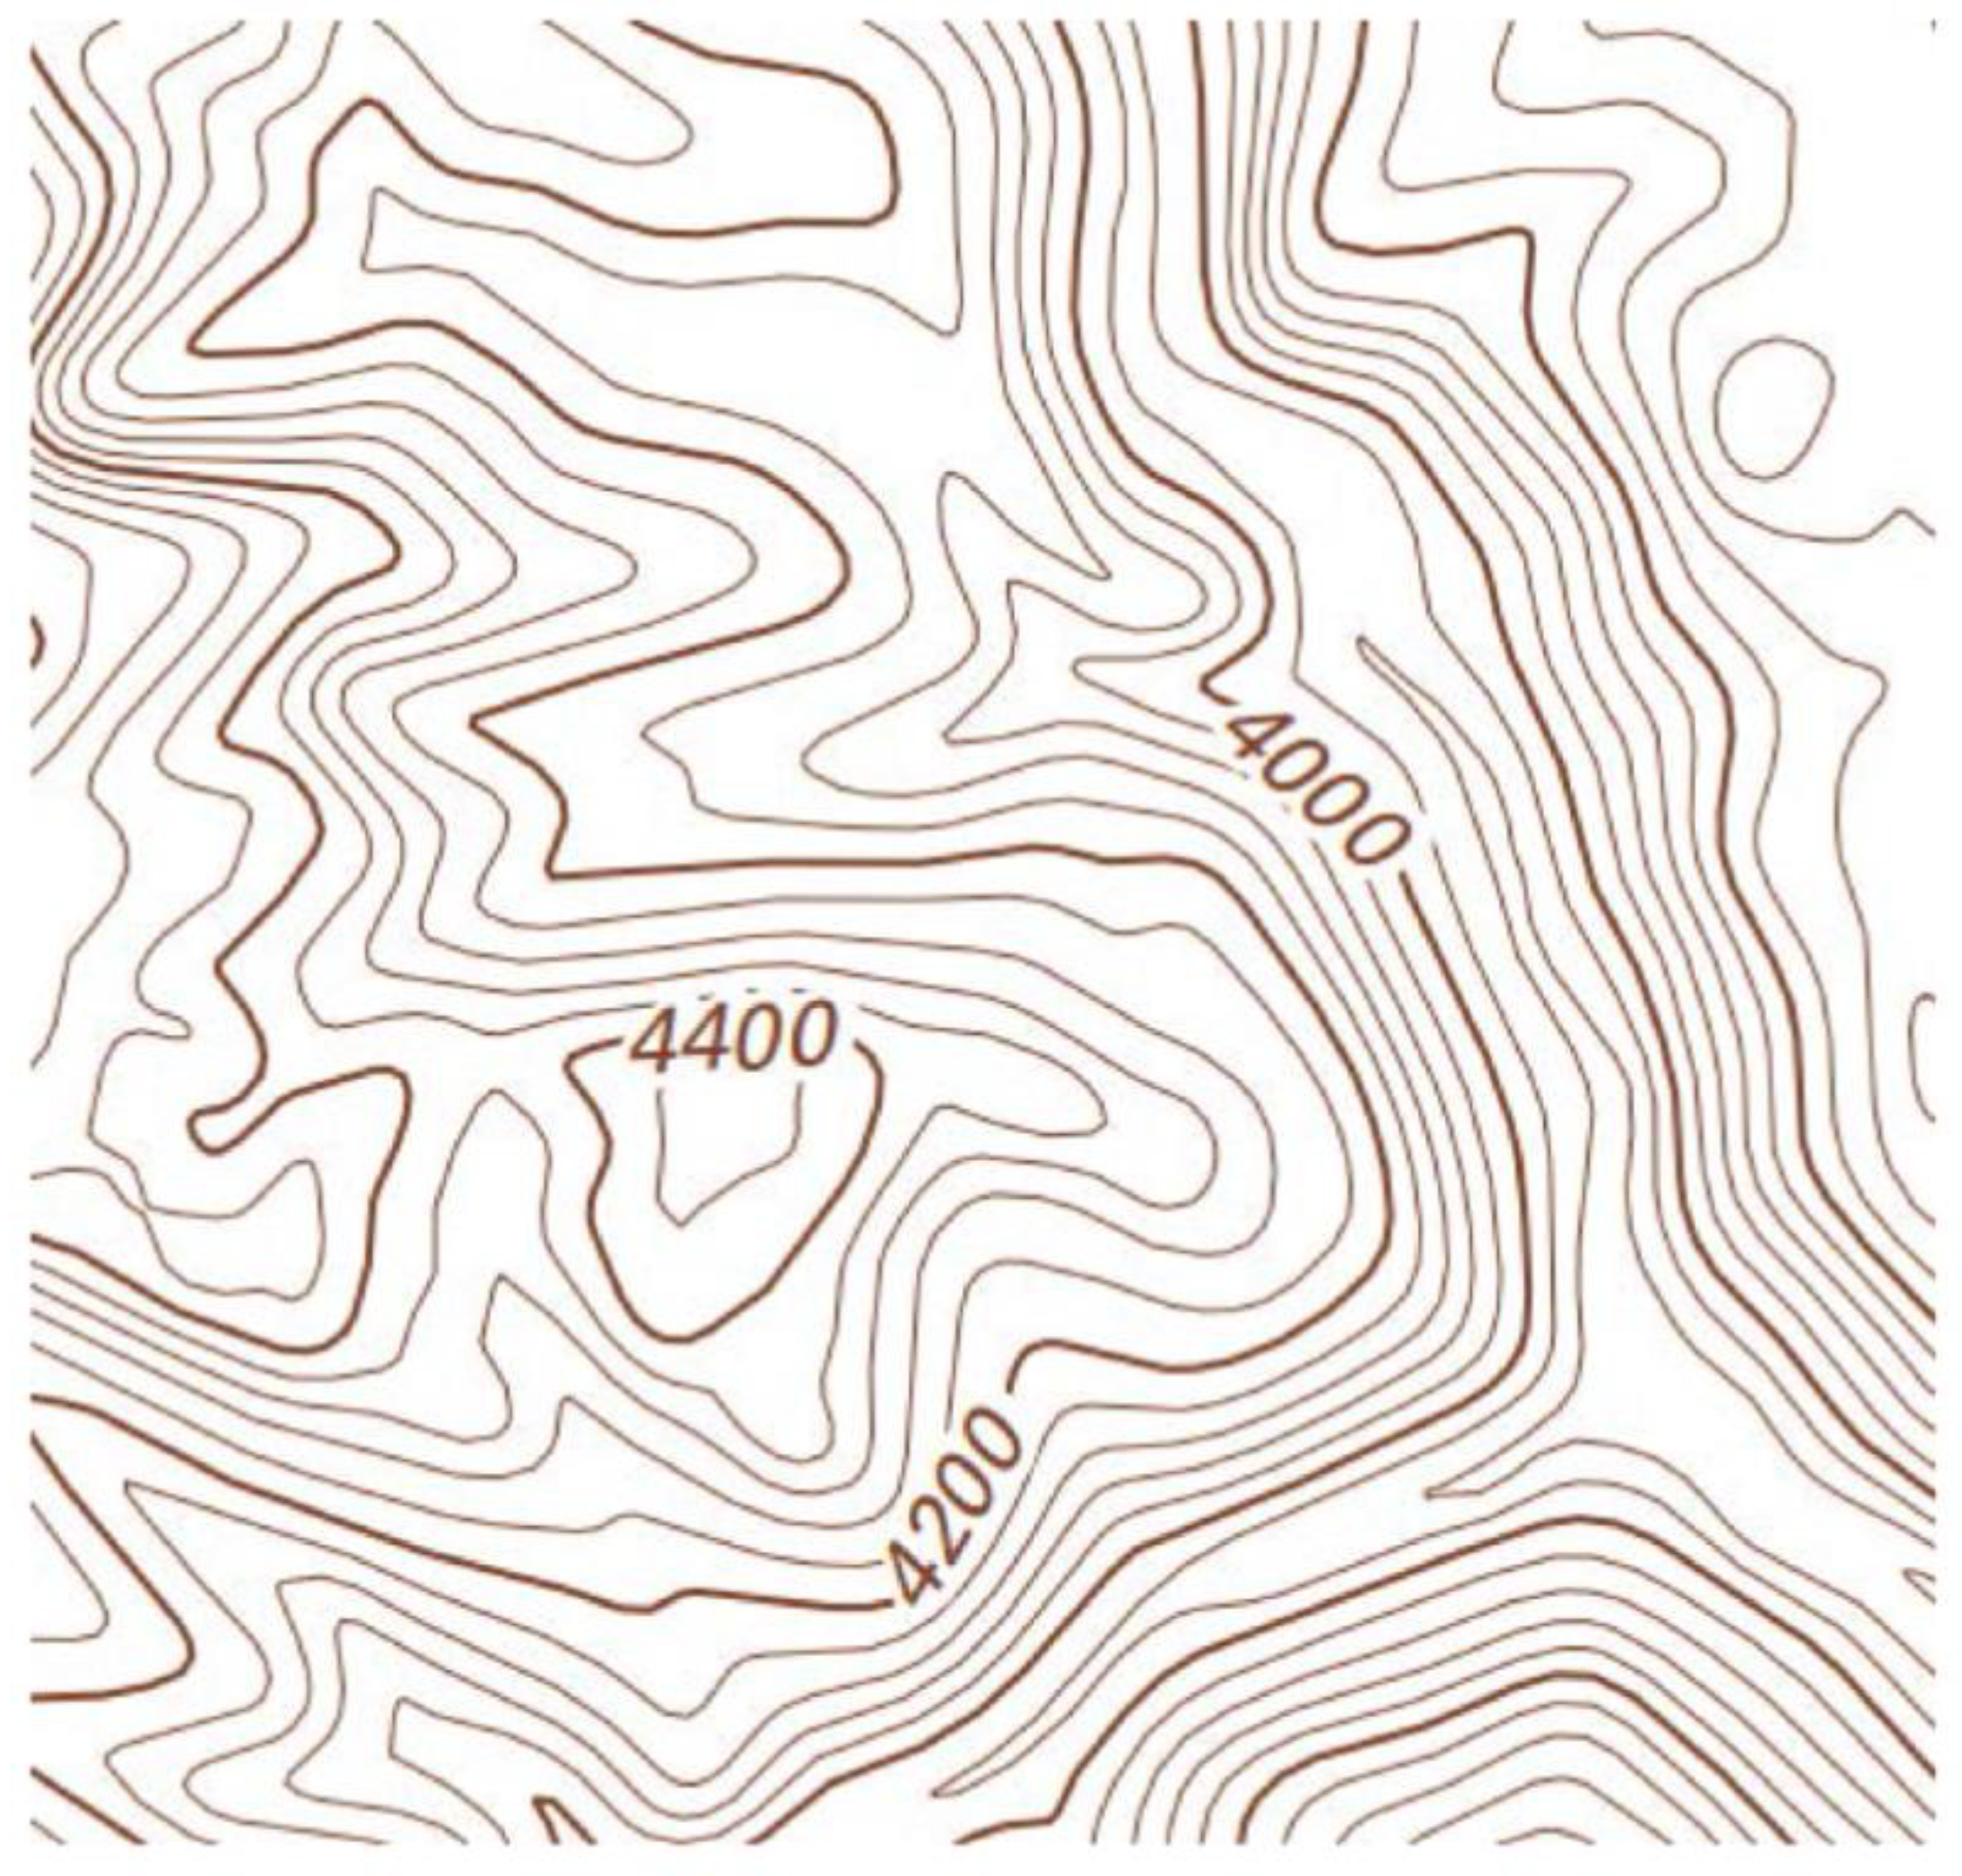
The exercises were designed to give students practice with cartographic interpretation and understanding relief. These items deal with matters such as contour interval (Figure 2), inter-visibility between points, circulation of water on a slope, or the route to get from one point to another with the minimum effort, all in scenarios with different geographical profiles and/or forms of relief. This variety of questions affects the knowledge that a student must have to be able to interact with topographical maps and plans. This battery of exercises has been used in the cartographic, geodesic and photogrammetric engineering areas at the University of La Laguna as a tool for teaching issues related to cartographic representation and interpretation since 2015.
4.2. The Intrinsic Motivation Inventory (IMI)
To assess the impact of the 2D activity performed in the present research on student motivation, the Intrinsic Motivation Inventory (IMI) was used. The IMI was developed for the Rochester Motivation Research Group [43,44,45] and is a multidimensional measurement device intended to assess participants’ subjective experience related to a target activity in laboratory experiments. The instrument assesses up to six subscales or dimensions in 18 items on a 7-point Likert Scale (1: Not at all true, 4: Somewhat true; 7: Very true) including interest/enjoyment, perceived competence, perceived choice, effort/importance, felt pressure and tension, and usefulness.
Research on STEM education also adopted this model of motivation measurement, sometimes referred to as SDT (self-determination-theory) [46,47]. SDT highlights the vital role of intrinsic motivation and provides information on motivational aspects that can support success in the STEM domains.
In the two questionnaires carried out by the participants (IMI and Effectiveness, Efficiency and Satisfaction questionnaire), the Cronbach’s Alpha coefficient is calculated to verify its reliability.
5. Results
5.1. Motivation
5.2. Effectiveness, Efficiency and Satisfaction
The questions in the Effectiveness, Efficiency and Satisfaction questionnaire were created using a 5-point Likert scale (1: strongly disagree, 5: strongly agree). Approximately 8–10 participant samples are needed for making reliable estimations of the usability results, although bigger samples provide more stable values [40], thus the current sample of 41 participants is sufficient. To estimate the reliability of the questionnaires, the Cronbach’s alpha coefficient was calculated as 0.73. Data from the students in the 2D strategy group are presented in Table 3.
5.3. 2D vs. Augmented Reality
The results of the present 2D workshop are compared with those of another workshop on relief interpretation, in which a 3D technology (Augmented Reality) was used. In the Augmented Reality workshop, the participants worked with digital terrain models represented with Augmented Reality, and performed activities related with relief interpretation (slopes, maximum slope lines, elevations, hills, nadir, peak and depression). While the data from the 3D group was previously reported in another manuscript [20], analyzing these data in comparison to the data from the students in the 2D workshop is not previously reported. The 3D workshop was performed at the beginning of 2015–2016 academic year in the same university and also with second-year engineering students of the subject of Cartography (63 second-year engineering students, 41 males and 22 females; mean age 21.30 years with a standard deviation of 2.69). As with the students in the 2D strategy group, the participants in the 3D strategy group did not have previous experience in the interpretation of maps. In both conditions, the same questionnaires were used.
5.3.1. Intrinsic Motivation Inventory Results
The Interest/enjoyment subscale of the IMI was used to assess intrinsic motivation. For the 2D activity, results of this subscale were low (3.39, 0.09 s.d.) such that students did not perceive the activity as enjoyable and interesting. On the other hand, in the workshop performed with Augmented Reality, the results of this subscale were much higher (5.07, 0.28 s.d.). The differences between these scores were significant for items 1 (3.17 2D/5.48 AR), 2 (3.00 2D/4.21 AR), and 3 (4.00 2D/5.52 AR) with p-values of 3.07 × 10⁻²¹, 8.30 × 10⁻⁶ and 1.48 × 10⁻¹¹, respectively, all of them were ≤0.01.
The perceived competence and perceived choice subscale of the IMI is theorized to be a positive predictor of both self-report and behavioral measures of intrinsic motivation. In both the 2D and AR workshops, the score was high: 4.74 (0.56 s.d.) and 5.11 (0.19 s.d.), respectively, such that students believed they had acquired skills by performing the activity. With respect to the 2D workshop compared with Augmented Reality, there were no significant differences in items 4 (4.41 2D/4.41 AR), 5 (4.29 2D/4.27 AR), 7(4.73 2D/4.81 AR), 8 (4.98 2D/5.10 AR) and 9 (5.24 2D/5.02 AR) (p-values = 4.97 × 10⁻¹, 4.53 × 10⁻¹, 3.58 × 10⁻¹, 3.09 × 10⁻¹ and 1.81 × 10⁻¹, respectively, all of them ≥0.01). However, for item 6 (“After working at this activity for a while, I felt pretty competent”), the difference between the 2D and AR workshop was significant (p-value = 1.05 × 10⁻⁴, ≤0.01). The average rating in the Augmented Reality workshop was 4.57, which was significantly lower than the average rating in the 2D workshop (mean of 5.54).
The Effort/importance subscale of the IMI assesses how difficult the activity is for the participant. The students’ responses reflected that they experienced difficulty with the 2D activity and put in a lot of effort (item 10, value = 6.22) and that it felt important to them to do well (item 11, value = 5.37). Only ratings for item 10 showed a significant difference between the 2D and the Augmented Reality (mean of 5.46) activities (p-value = 2.21 × 10⁻⁴, ≤0.01).
The Pressure/Tension subscale of the IMI is related to students’ level of anxiety while performing the activity. This subscale is theorized to negatively predict intrinsic motivation. Because it is a negative predictor, lower scores are considered more desirable. The results obtained in this experiment showed a value (2.68) somewhat above the mean of the Likert scale (1–5), which means that participants felt somewhat pressured during the activity, unlike with Augmented Reality, where the value (2.02) was below the average. For item 12 (“I felt very tense while doing this activity”), the value for the Augmented Reality workshop was significantly lower (2.11) than the value obtained in the 2D workshop (p-value = 1.05 × 10⁻⁵, ≤0.01), indicating that the 2D activities caused more tension.
The Value/Usefulness subscale of the IMI refers to how useful or valuable the participants perceived the activity to be. This subscale represents how people internalize and self-regulate in regard to activities they experience as useful or valuable. The scores demonstrated that students perceived that the activity as being good for spatial reasoning acquisition (5.54) and for landscape interpretation (5.59). In these two items (14 and 15), there were no significant differences with Augmented Reality (5.54 2D/5.62 AR and 5.59 2D/5.90 AR), with p-values = 3.69 × 10⁻¹ and 9.12 × 10⁻², respectively, both ≥0.01. However, for item 16 (“I think this is important to do because it can help me to interpret the relief in maps understanding better the cartographic technics for the relief in maps”), the score was significantly higher in the 2D workshop (6.49) than the Augmented Reality workshop (5.89), (p-value = 9.02 × 10⁻⁴, ≤0.01). However, when asked if students would be willing to repeat the activity, the value obtained in the 2D workshop (3.39) was significantly lower (1.23 × 10⁻¹⁸, ≤0.01) than the AR workshop (5.87).
5.3.2. Effectiveness, Efficiency and Satisfaction
The result of effectiveness was high (3.90). The students considered that the 2D activity performed was a powerful tool to practice with the interpretation of the relief (item 1), and they considered that the activity fulfilled the objective for which it had been designed (item 3). In these aspects, the differences with the Augmented Reality (4.83 2D/4.27 AR and 4.37 2D/4.14 AR) were not significant (p-value = 1.09 × 10⁻³ and 1.02 × 10⁻¹, respectively). Where there was a significant difference (p-value = 4.11 × 10⁻⁷) was in item 2. Land interpretation seemed less easy and intuitive to them with 2D (2.51) than with Augmented Reality (3.52). In respect to efficiency, the average value was 3.00. Fewer resources were necessary to achieve the goal of learning and interpreting the relief (4.59), and they showed a clear preference for this type of activity instead of theoretical classes (4.32). However, they did not find the activity in 2D either quick or easy to do (2.51), in comparison with the one made with Augmented Reality (3.68). This difference was significant (1.41 × 10⁻⁸, ≤0.01). Finally, in user satisfaction, the score was high (3.95). Students perceived the traditional 2D activity improved their map reading skills (3.85, item 10). They also considered that 2D activities are a good complement to other 3D tools for teaching and learning with cartographic information (3.59, item 13), although they showed a difference (p-value = 5.12 × 10⁻⁴, ≤0.01) in item 12 with 2D activity (4.61) versus augmented reality (3.98) as a tool for learning concepts related to relief.
6. Discussion and Conclusions
Although students tended to report having more fun with AR workshop, they tended to perceive that doing the 2D exercises made them more competent at visualizing terrains than with augmented reality. Thus, these results suggest that the traditional teaching–learning processes in 2D may be more effective for the acquisition of competences than 3D technologies.
Overall, the results of the current study indicated that traditional 2D activities with contour lines are less motivating for students, compared to other strategies that employ three-dimensional rendering and visualization technologies such as Augmented Reality. The participants of the present experiment did not perceive the 2D activity as enjoyable and interesting, they did not have fun doing 2D exercises with contour lines and they did not find the activity in 2D quick or easy to do. With AR the results were superior in these aspects. University students of the 21st century are digital natives, and therefore may tend to feel more comfortable in a virtual environment than in an analogous 2D one. The novelty offered by 3D technologies is crucial in terms related with enjoyment. This result coincides with Hegarty et al. [16], in which students preferred 3D maps over 2D based on their appearance rather than their informational content. Moreover, the traditional activities in 2D cause some tension among the students, in comparison with other strategies in which 3D technologies are used. The students did not show preference for repeating the activity, and with the AR the opposite occurred. One of the reasons may be that these types of 2D exercises are very similar to a conventional exam.
Although students tended to report having more fun with AR workshop, they tended to perceive that doing the 2D exercises made them more competent at visualizing terrains than with augmented reality. Thus, these results suggest that the traditional teaching–learning processes in 2D may be more effective for the acquisition of competences than 3D technologies. Similarly, students’ responses indicated that they perceived positively the use of traditional methodologies based on 2D maps for the development of spatial reasoning and for the interpretation of maps but considered that augmented reality was more attractive. In this sense, Savage, Weibe and Divine [24] also concluded that 2D maps offer certain advantages over 3D representations with regard to learning objectives in developing cartographic literacy.
Taken together, these results point to the idea that perhaps 2D and 3D technologies should be used in tandem for supporting student learning and reasoning about landforms and relief in topographic maps. Both instructional media (2D and 3D) have advantages and disadvantages. This affirmation aligns with other recent studies, which concluded that there is a need for the parallel existence of both 2D and 3D representations [12]. Other research [29,30] has also concluded that the combined 2D/3D instruction is superior to 2D instruction alone in terms of map-reading skill development. One potential limitation that warrants further research is related to the logistics of implementing these exercises in classroom. In this sense, the realization of traditional 2D exercises requires fewer resources than the use of 3D technologies, and, specifically, 3D tools such as Augmented Reality or Virtual Reality require specific training by teachers. Future work should aim to identify the type of training needed to make AR activities accessible to teachers.
In conclusion, in the area of topography and cartography education, traditional 2D teaching methodologies are still valid, and can be complemented by the use of innovative three-dimensional representation and visualization technologies.
Author Contributions
Conceptualization, Methodology and writing-review and editing C.C.-C., A.J.J. and T.F.S.; Validation and formal analysis A.J.J. and C.C.-C.; Supervision T.F.S.; writing original draft C.C.-C.
Funding
This research has funded by the Spanish Ministry of Education, Culture and Sport, within the framework of the State Program for the Promotion of Talent and its Employability in I+D+i, the State Mobility Subprogram of the State Plan for Scientific and Technical Research and Innovation 2013–2016, and performed in the RISC lab (Research in Spatial Cognition) of the Temple University. This work has also funded by the National Science Foundation (NSF), grant #1640800.
Acknowledgments
The authors thank Nora Newcombe Ph.D., PI of the Spatial Intelligence and Learning Center (SILC), for her selfless collaboration in carrying out this work. The authors also thank the anonymous reviewers and Editor for their valuable comments.
Conflicts of Interest
The authors declare no conflicts of interest.
References
- Rapp, D.N. Mental Models: Theoretical Issues for Visualizations in Science Education; Gilbert, J.K., Ed.; Visualization in Science Education; Springer: Dordrecht, The Netherlands, 2005; pp. 43–60, ISBN-10 1-4020-3612-4 (HB). [Google Scholar]
- Rapp, D.N.; Uttal, D.H. Understanding and Enhancing Visualizations: Two Models of Collaboration between Earth Science and Cognitive Science. In Earth and Mind: How Geologists Think and Learn about the Earth; Manduca, C., Mogk, D., Eds.; Geological Society of America Press: Boulder, CO, USA, 2006; pp. 121–127. ISBN 9780813724133. [Google Scholar]
- Marston, B.E.; Jenny, B. Improving the representation of major landforms in analytical relief shading. Int. J. Geogr. Inf. Sci. 2015, 29, 1144–1165. [Google Scholar] [CrossRef]
- Rapp, D.N.; Culpepper, S.A.; Kirby, K.; Morin, P. Fostering Students’ Comprehension of Topographic Maps. J. Geosci. Educ. 2007, 55, 5–16. [Google Scholar] [CrossRef]
- Griffin, T.L.C.; Lock, B.F. The perceptual problem in contour Interpretation. Cartogr. J. 1979, 16, 61–71. [Google Scholar] [CrossRef]
- Hsu, H.-P.; Tsai, B.-W.; Chen, C.-H. Teaching Topographic Map Skills and Geomorphology Concepts with Google Earth in a One-Computer Classroom. J. Geogr. 2018, 117, 5–16. [Google Scholar] [CrossRef]
- Clark, D.; Reynolds, S.; Lemanowski, V.; Stiles, T.; Yasar, S.; Proctor, S.; Lewis, E.; Stromfors, C.; Corkins, J. University students’ conceptualization and interpretation of topographic maps. Int. J. Sci. Educ. 2008, 30, 375–406. [Google Scholar] [CrossRef]
- Reusser, L.J.; Corbett, L.B.; Bierman, P.R. Incorporating concept sketching into teaching undergraduate geomorphology. J. Geosci. Educ. 2012, 60, 3–9. [Google Scholar] [CrossRef]
- Atit, K.; Weisberg, S.M.; Newcombe, N.S.; Shipley, T.F. Learning to interpret topographic maps: Understanding layered spatial information. Cogn. Res. 2016, 2, 1–18. [Google Scholar] [CrossRef] [PubMed]
- Carbonell-Carrera, C.; Saorin, J.L.; Melian, D.; De la Torre, J.L. 3D Creative Teaching-Learning Strategy in Surveying Engineering Education. Eur. J. Math. Sci. Tech. Educ. 2017, 13, 7489–7502. [Google Scholar] [CrossRef]
- Carbonell-Carrera, C.; Bermejo, L.A. Augmented reality as a digital teaching environment to develop spatial thinking. Cartogr. Geogr. Inf. Sci. 2017, 44, 259–270. [Google Scholar] [CrossRef]
- Collins, L. The Impact of Paper Versus Digital Map Technology on Students’ Spatial Thinking Skill Acquisition. J. Geogr. 2017, 116. [Google Scholar] [CrossRef]
- Tillmann, A.; Albrecht, V.; Wunderlich, J. Dewey’s concept of experience for inquiry-based landscape drawing during field studies. J. Geogr. High. Educ. 2017, 41, 383–402. [Google Scholar] [CrossRef]
- Eynard, J.D.; Jenny, B. Illuminated and shadowed contour lines: improving algorithms and evaluating effectiveness. Int. J. Geogr. Inf. Sci. 2016, 30, 1923–1943. [Google Scholar] [CrossRef]
- Niedomysl, T.; Anders Larsson, L.; Thelin, M.; Jansund, B. Learning Benefits of Using 2D Versus 3D Maps: Evidence from a Randomized Controlled Experiment. J. Geog. 2013, 112, 87–96. [Google Scholar] [CrossRef]
- Hegarty, M.; Smallman, H.S.; Stull, A.T.; Canham, M.S. Natıve cartography: How intuitions about display configuration can hurt performance. Cartographica 2009, 44, 171–186. [Google Scholar] [CrossRef]
- Metoyer, S.; Bednarz, R. Spatial Thinking Assists Geographic Thinking: Evidence from a Study Exploring the Effects of Geospatial Technology. J. Geogr. 2017, 116, 20–33. [Google Scholar] [CrossRef]
- Carbonell-Carrera, C.; Saorin, J.L.; Melian, D. Relief Interpretation: low cost 3D representation technologies for teahing. Dyna New Tech. 2017, 4, 1–12. [Google Scholar] [CrossRef]
- Carbonell-Carrera, C.; Vlad Avarvarei, B.; Cheliaru, E.L.; Draghia, L.; Catrinel Avarvarei, S. Map-Reading sill development with 3D technologies. J. Geogr. 2017, 116, 197–205. [Google Scholar] [CrossRef]
- Carbonell-Carrera, C.; Saorin, J.L.; De la Torre, J. Teaching with AR as a tool for relief visualization: Usability and motivation study. Int. Res. Geogr. Environ. Educ. 2017, 1, 69–84. [Google Scholar] [CrossRef]
- Hergan, I.; Umek, M. Comparison of children’s wayfinding, using paper map and mobile navigation. Int. Res. Geogr. Environ. Educ. 2017, 26, 91–106. [Google Scholar] [CrossRef]
- Jenny, B.; Buddeberg, J.; Hoarau, C.; Liem, J. Plan oblique relief for web maps. Cartogr. Geogr. Inf. Sci. 2015, 42, 410–418. [Google Scholar] [CrossRef]
- Lai, P.C.; Kwong, K.H.; Mak, A.S.H. Assessing the applicability and effectiveness of 3D visualization in environmental impact assessment. Environ. Plan. B 2010, 37, 221–233. [Google Scholar] [CrossRef]
- Savage, D.M.; Wiebe, E.N.; Devine, H.A. Performance of 2D versus 3D topographic representations for different task types. In Human Factors and Ergonomics Society Annual Meeting Proceedings 48; SAGE Publications: New Orleans, LA, USA, 2004; pp. 1793–1797. [Google Scholar]
- Pedersen, P.; Farrell, P.; McPhee, E. Paper versus pixel: Effectiveness of paper versus electronic maps to teach map reading skills in an introductory physical geography course. J. Geogr. 2005, 104, 195–202. [Google Scholar] [CrossRef]
- Verdi, M.; Crooks, S.M.; White, D.R. Learning effects of print and digital geographic maps. J. Res. Tech. Educ. 2003, 35, 290–302. [Google Scholar] [CrossRef]
- Cunningham, M.A. Why geography still needs pen and ink cartography. J. Geogr. 2005, 104, 119–126. [Google Scholar] [CrossRef]
- Hurst, P.; Clough, P. Will we be lost without paper maps in the digital age? J. Inf. Sci. 2013, 39, 48–60. [Google Scholar] [CrossRef]
- St. John, M.; Cowen, M.B.; Smallman, H.S.; Oonk, H.M. The use of 2D and 3D displays for shape understanding versus relative-position. Hum. Fact. 2001, 43, 79–98. [Google Scholar] [CrossRef] [PubMed]
- Carbonell-Carrera, C.; Bermejo, L.A. Landscape interpretation with augmented reality and maps to improve spatial orientation skill. J. Geogr. High. Educ. 2017, 41, 119–133. [Google Scholar] [CrossRef]
- Carter, J.R. The Map Viewing Environment: A Significant Factor in Cartographic Design. Am. Cartogr. 1988, 15, 379–385. [Google Scholar] [CrossRef]
- Dossin, C.; Ningning, K.N.; Joyeux-Prunel, B. Applying VGI to collaborative research in the humanities: The case of ARTL@S. Cartogr. Geogr. Inf. Sci. 2017, 44, 521–538. [Google Scholar] [CrossRef]
- Keller, J.M.; Deimann, M. Motivation, Volition and Performance. In Trends and Issues in Instructional Design and Technology; Reiser, R.A., Dempsey, J.V., Eds.; Merill Prentice Hall: Boston, MA, USA, 2002; pp. 78–87. ISBN 978-0134235462. [Google Scholar]
- Rost, M. Generating Student Motivation. WorldView, Pearson Longman. 2010. Available online: http://www.longmanhomeusa.com/catalog/products/product-details/?pid=F-0HP&sid=Adult (accessed on 4 April 2018).
- Schmidt, J.T. Preparing Students for Success in Blended Learning Environments: Future Oriented Motivation and Self-Regulation. Ph.D. Thesis, Faculty of Psychology and Educational Sciences, LMU Munchen, Germany, 2007. [Google Scholar]
- Apedoe, X.S.; Reynolds, B.; Ellefson, M.R.; Schunn, C.D. Bringing engineering design into high school science classrooms: The heating/cooling unit. J. Sci. Educ. Tech. 2008, 17, 454–465. [Google Scholar] [CrossRef]
- Skinner, S.E.; Currie, C.; Shusterman, G. A motivational account of the undergraduate experience in science: brief measures of students’ self-system appraisals, engagement in coursework, and identity as a scientist. Int. J. Sci. Educ. 2017, 39, 2433–2459. [Google Scholar] [CrossRef]
- Carbonell, C.; Mejias, M.A.; Saorin, J.L.; Contero, M.C. Spatial data infrastructure: Development of spatial abilities in the framework of European space for higher education. Boletín de la Asociación de Geógrafos Españoles 2012, 58, 157–175. [Google Scholar]
- Preece, J.; Rogers, Y.; Sharp, H. Interaction Design: Beyond Human-Computer Interaction; John Wiley & Sons: New York, NY, USA, 2011; ISBN 0-471-49278-7. [Google Scholar]
- Bevan, N. Practical Issues in Usability Measurement. Interactions 1996, 13, 42–43. Available online: http://interactions.acm.org/archive/view/november-december-2006/practical-issues-in-usability-measurement1 (accessed on 5 February 2018). [CrossRef]
- Earthy, J.; Jones, B.S.; Bevan, N. The improvements of human-centred processes—Facing the challenge and reaping the benefit of ISO 13407. Int. J. Hum.-Comp. Stud. 2001, 55, 553–585. [Google Scholar] [CrossRef]
- Jacovina, M.; Ormand, C.; Shipley, T.F.; Weisberg, S. Topographic Map Assessment. 2014. Available online: http://www.silccenter.org/index.php/testsainstruments (accessed on 6 March 2018).
- Ryan, R.M. Control and information in the intrapersonal sphere: An extension of cognitive evaluation theory. J. Personal. Soc. Psychol. 1982, 43, 450–461. [Google Scholar] [CrossRef]
- Plant, R.W.; Ryan, R.M. Intrinsic motivation and the effects of self-consciousness, self-awareness, and ego-involvement: An investigation of internally-controlling styles. J. Personal. 1985, 53, 435–449. [Google Scholar] [CrossRef]
- Ryan, R.M.; Mims, V.; Koestner, R. Relation of reward contingency and interpersonal context to intrinsic motivation: A review and test using cognitive evaluation theory. J. Personal. Soc. Psych. 1983, 45, 736–750. [Google Scholar] [CrossRef]
- Reeve, J. A Self-Determination Theory Perspective on Student Engagement. In Handbook of Research on Student Engagement; Christenson, S.L., Reschly, A.L., Wylie, C., Eds.; Springer: New York, NY, USA, 2012; pp. 149–172. ISBN 978-1-4614-2017-0. [Google Scholar]
- Ryan, R.M.; Deci, E.L. Facilitating and Hindering Motivation, Learning, and Well-Being in Schools: Research and Observations from Self-Determination Theory. In Handbook of Motivation at School (2nd ed, pp. 96–119); Wentzel, K.R., Miele, D.B., Eds.; Erlbaum: Malwah, NJ, USA, 2016; pp. 1–24. ISBN 9781317681267. [Google Scholar]
- George, D.; Mallery, M. SPSS for Windows Step by Step: A Simple Guide and Reference; Allyn & Bacon: Boston, MA, USA, 2003; pp. 53–55. ISBN 0205375529. [Google Scholar]
Figure 1.
Example of a photointerpretation relief exercise. Source: Topographic Map Assessment, Research in Spatial Cognition Lab, Temple University.
Figure 1.
Example of a photointerpretation relief exercise. Source: Topographic Map Assessment, Research in Spatial Cognition Lab, Temple University.

Figure 2.
Example of contour interval exercise. Source: Topographic Map Assessment, Research in Spatial Cognition Lab, Temple University.
Figure 2.
Example of contour interval exercise. Source: Topographic Map Assessment, Research in Spatial Cognition Lab, Temple University.


Table 1.
Topographic Map Assessment tasks description.
| Topographic Map Assessment Tasks Description | ||
|---|---|---|
| Task | Description | Item Number |
| Path | Easily route between two points | 1 |
| Stream/water-flow | Water flow between two points in different geographical settings | 2, 10, 11, 12 |
| Slope | Steeper slope between two points | 5, 9 |
| Visibility | Questions about visibility between points | 3, 17 |
| Elevation points | Questions about elevation points in a contour interval scenario | 4, 6, 7 |
| Photo interpretation relief | From a photograph/image of a land and a contour lines topographic map different questions are asked | 8, 15, 16, 18 |
| Profile | Questions about topographic profiles from a contour lines topographic map | 13, 14 |
Table 2.
Intrinsic Motivation Inventory. (s.d., standard deviation).
| Intrinsic Motivation Inventory | ||
|---|---|---|
| Subscale Mean (s.d.) | Item | Score (1–7) |
| Interest/enjoyment 3.39 (0.09) | 1. I enjoyed doing this activity very much | 3.17 |
| 2. I thought this activity was quite enjoyable | 3.00 | |
| 3. I would describe this activity as very interesting | 4.00 | |
| Perceived competence 4.74 (0.56) | 4. I think I am pretty good at this activity | 4.41 |
| 5. I think I did pretty well at this activity, compared to other students | 4.29 | |
| 6. After working at this activity for a while, I felt pretty competent | 5.54 | |
| 7. I was pretty skilled at this activity | 4.73 | |
| Perceived choice 5.11 (0.19) | 8. I did this activity because I wanted to | 4.98 |
| 9. I believe I had some choice about doing this activity | 5.24 | |
| Effort/Importance 5.79 (0.38) | 10. I put a lot of effort into this | 6.22 |
| 11. It was important to me to do well at each task | 5.37 | |
| Pressure/tension 2.68 (0.13) | 12. I felt very tense while doing this activity | 3.10 |
| 13. I was anxious while working on this task | 2.27 | |
| Value/usefulness 5.33 (1.32) | 14. I believe this activity could be of some value to me (relief interpretation-map reading) | 5.54 |
| 15. I think that doing this activity is useful for landscape interpretation | 5.59 | |
| 16. I think this is important because it can help me to interpret the relief in maps and better understand cartographic technics for relief in maps | 6.49 | |
| 17. I would be willing to do this again | 3.39 | |
| 18. I think this is an important activity | 5.66 | |
Table 3.
Effectiveness, Efficiency and Satisfaction questionnaire results (s.d., standard deviation).
Table 3.
Effectiveness, Efficiency and Satisfaction questionnaire results (s.d., standard deviation).
| Effectiveness, Efficiency and Satisfaction Questionnaire | ||
|---|---|---|
| Component Mean (s.d.) | Item | Score (1–5) |
| Effectiveness 3.90 (0.08) | 1. The 2D activity is a powerful tool to practice with the interpretation of the terrain | 4.83 |
| 2. The interpretation of terrain relief with the contour lines maps in the 2D activity is easy and intuitive | 2.51 | |
| 3. The 2D activity meets the objective of improving the interpretation of the relief | 4.37 | |
| Efficiency 3.00 (0.17) | 4. I found it quick and easy the 2D activity | 2.51 |
| 5. The 2D activity requires few resources than other 3D resources (Augmented reality, 3D printed models, Digital Terrain Models) to achieve the goals (to learn to interpret the relief) | 4.59 | |
| 6. I take less time to learn concepts about the representation and interpretation of the relief doing exercises like those of the 2D activity than receiving theoretical classes | 4.32 | |
| 7. The 2D activity increases my speed in the interpretation of the relief of cartographic maps | 2.85 | |
| 8. The 2D activity allows me to be more productive because it develops my ability to interpret the relief | 3.76 | |
| Satisfaction 3.95 (0.25) | 9. I think 2D activity is a powerful tool for my development as a student in content related to cartographic information | 3.85 |
| 10. I think the 2D activity is a teaching strategy that improves my learning about the interpretation of relief | 3.85 | |
| 11. I am satisfied with the 2D activity for improve my visualization of relief | 3.83 | |
| 12. The 2D activity helps me to learn the concepts related to the representation of relief | 4.61 | |
| 13. The 2D activity is a good complement to the 3D representation of topographic relief (Digital Terrain Models) for the improvement of the relief interpretation | 3.59 | |
© 2018 by the authors. Licensee MDPI, Basel, Switzerland. This article is an open access article distributed under the terms and conditions of the Creative Commons Attribution (CC BY) license (http://creativecommons.org/licenses/by/4.0/).
Share and Cite
MDPI and ACS Style
Carbonell-Carrera, C.; Jaeger, A.J.; Shipley, T.F. 2D Cartography Training: Has the Time Come for a Paradigm Shift? ISPRS Int. J. Geo-Inf. 2018, 7, 197. https://doi.org/10.3390/ijgi7050197
AMA Style
Carbonell-Carrera C, Jaeger AJ, Shipley TF. 2D Cartography Training: Has the Time Come for a Paradigm Shift? ISPRS International Journal of Geo-Information. 2018; 7(5):197. https://doi.org/10.3390/ijgi7050197
Chicago/Turabian StyleCarbonell-Carrera, Carlos, Allison J. Jaeger, and Thomas F. Shipley. 2018. "2D Cartography Training: Has the Time Come for a Paradigm Shift?" ISPRS International Journal of Geo-Information 7, no. 5: 197. https://doi.org/10.3390/ijgi7050197
Note that from the first issue of 2016, this journal uses article numbers instead of page numbers. See further details here.