Suitability Evaluation of Urban Construction Land Based on an Approach of Vertical-Horizontal Processes


1
Department of Environmental Science and Engineering, Fudan University, Shanghai 200433, China
2
Institute of Urban Studies, Shanghai Normal University, Shanghai 200234, China
3
Department of Geography, Kent State University, Kent, OH 44242, USA
*
Authors to whom correspondence should be addressed.
ISPRS Int. J. Geo-Inf. 2018, 7(5), 198; https://doi.org/10.3390/ijgi7050198
Submission received: 26 March 2018
/
Revised: 10 May 2018
/
Accepted: 16 May 2018
/
Published: 20 May 2018
(This article belongs to the Special Issue Urban Environment Mapping Using GIS)
Abstract
:Suitability evaluation of urban construction land is critical for both urban master planning and the proper utilization of land resources. Using the Beihu New District of Jining City, China, as a case study, this paper introduces a novel research approach for comprehensive suitability evaluation based on vertical-horizontal processes. First, by considering both the land development potential and ecological constraint resistance, the potential-resistance (PR) model was developed and used to analyze the suitability for urban construction of vertical processes. Then, given the results of the vertical suitability analysis, the current urban built-up areas were selected as the sources of urban expansion, and the minimum cumulative resistance (MCR) model was applied to evaluate the suitability for urban development in terms of horizontal processes. The study area was regionalized into four categories—priority, suitable, restricted, and prohibited areas—which were defined based on the development threshold. The results showed that restricted and prohibited areas for urban construction occupied most of the study area. Totally, 648.51 km2 was categorized as restricted or prohibited, accounting for 12.89% and 54.75% of the total area, respectively. Priority and suitable areas for urban construction covered a total area of 310.37 km2, accounting for 16.55% and 15.81% of the total area, respectively. These areas were mainly distributed around urban centers and urban built-up areas. These findings reflect the substantial potential for future urban development and construction in the study area. The newly developed principles and methods of suitability evaluation for urban construction land presented in this paper provide more appropriate scales and spatial location for urban development and an ecological baseline for future urban growth.
1. Introduction
With the acceleration of urbanization since the 1980s, China has witnessed dramatic growth in urban construction, and this phenomenon has been observed in other developing countries worldwide [1,2]. Until now, urban expansion has been the most common change in land-use patterns, and this growth is expected to continue for decades in China [3,4]. In addition to promoting social and economic development, urbanization has also resulted in the reduction of the surrounding agricultural and ecological lands. This change has served as the impetus for the declines in regional ecosystem services and environmental quality [4,5,6,7]. Additionally, the adverse ecological and environmental effects of the unreasonable utilization of land resources have hampered regional and urban sustainable development. Therefore, to achieve sustainable urban development and minimize its negative effects, decision makers must identify the appropriate areas for different development purposes, including land preservation and urban development.
Land-use suitability analysis aims at specifying the most appropriate spatial pattern for future land use according to specific requirements, preferences, or predictors of several activities [8,9,10]. Since the 1980s, computer-aided technologies have been gradually adopted in the field of land-use suitability analysis. GIS-based land-use suitability analysis is undoubtedly the most broadly applied approach [11,12]. In agriculture, forestry, and ecological protection, researchers have extended the evaluation of land utilization from specific crops [13], tree species [14], livestock and poultry [15,16], or protected species [17] to more general types of land use for multiple species at different scales [18,19,20,21]. Another important application is site selection for urban [12,22,23,24] and rural construction [25], as well as human-made facilities for other purposes [26,27,28]. Other applications include land suitability evaluation for environmental impact analysis [29], landscape planning [30], and assessments of geological favorability [31]. In this study, we focus on the suitability evaluation of urban construction land. The increasing contradiction between the protection of cultivated lands and forests and the unreasonable expansion of urban areas has revealed failures in policies, legislation, and the execution of laws regarding land-use planning and management. Nevertheless, improving the ecological basis for these decisions is also important. The suitability evaluation of land for urban construction based on GIS is quantitative, normalized, and informational; therefore, this system can meet all the relevant demands. Improved analysis methods translate to better results for policy formulation, better land-use decisions, and increased sustainability.
McHarg’s work is generally considered to be of pioneering significance in regard to this approach. His team overlaid individual transparent maps containing natural and anthropogenic attributes with serial shading and constructed overall suitability maps for various utilizations through superimposing individual maps [9]. Currently, the most widely applied approach involves the integration of GIS and Multiple Criteria Decision Making (MCDM). This approach is believed to be the most advanced method of configuring conventional overlaid maps [10]. In this process, planners integrate spatial and non-spatial elements and generate predictable results via multi-index synthetic estimation [32]. MCDM can be classified into multi-objective and multi-attribute decision-making methods [33]. Because calculating the former is comparatively complex and difficult to achieve in GIS, the latter is much more widely used among researchers and planners. Such approaches include Weighted Linear Combination (WLC) [34], Analytic Hierarchy Process (AHP) [13,24,35,36], Technique for Order Preference by Similarity to Ideal Solution (TOPSIS) [37], and Ordered Weighted Averaging (OWA, commonly treated as an improvement of WLC) [38,39] methods.
However, classical maps overlay techniques based on Boolean operations and weighted analysis oversimplify the complexity of the evaluation process by neglecting certain indefinable factors of influence in the GIS environment. Some of these factors include the development potential of certain land-use components, and others are related to limitations. Unified scoring criteria and vertical units consider only quantitative differences and ignore qualitative differences, making it difficult for qualitative factors to be appropriately addressed [32]. What is more, from a critical perspective, traditional approaches of land use suitability evaluation considered only the vertical processes of land units and neglected horizontal processes. Horizontal processes, such as the spatial movement of species, the sprawl of urban construction, and the spread of disasters, occur among different landscape units and are related to flows and interactions. These types of situations are unlikely to be expressed in McHarg’s overlay techniques [40]. Therefore, we consider horizontal processes to describe the flows or interactions of factors among land units at the landscape level.
Numerous models describing horizontal processes have been developed and applied, such as fire ecosystem models [41], gravity modeling and graph theory [21,42], habitat suitability index models [43], and the graphing of theoretic models [44]. However, the complex computational processes and stringent data requirements of these models have limited their application [37]. Knaapen proposed the minimum cumulative resistance (MCR) model to measure habitat isolation [45]. This model utilizes a simple and clear data structure and fast algorithms, with highly visual results [46]. Furthermore, it considers both the distance and the effects of adjacent landscape characteristics, which have rarely been addressed in previous studies. Therefore, it has been frequently used for studies in urban expansion [46,47,48]. The main idea of the MCR model can be summarized as follows: in nature, any movement must face resistance. For a horizontal movement of an object (expansion, fluxion, etc.), the less resistance the object encounters, the easier the movement happens. Besides, the results of vertical suitability analysis for urban construction land with calculated resistance values can be directly input into the MCR model, which was designed for horizontal suitability evaluation. Therefore, this makes the vertical and horizontal suitability evaluations easier and more practicable than previous individual case studies [49,50]. This combined method may offer the opportunity to overcome the deficiencies of traditional methods of land use suitability evaluation.
This paper aims to provide a scientific basis for selecting land for urban construction at the development scale while informing decisions about the optimal direction for urban growth. This paper also presents a new discussion and theoretical exploration regarding suitability evaluations of urban construction land. This study explores a new method of evaluating the suitability of urban construction land based on the comprehensive analysis of both vertical and horizontal processes. The suitability evaluation of vertical processes in this paper refers to the traditional land suitability evaluation method, that is the classical overlay techniques. ”Vertical” is a picturesque phrase. Here, we describe the process of overlay techniques of different natural or humanistic attributes as ”vertical” instead of processes that actually happen in a vertical direction. Meanwhile, MCR model simulates the urban expansion on horizontal processes and therefore can be described as ”horizontal”, which cannot be expressed or calculated by overlay maps of vertical processes. Our study attempt to combine these two processes, and therefore we call them ”vertical” and ”horizontal” graphically. The Beihu New District of Jining City, Shandong Province, China, was taken as a case study, and it was organized into following sections. First, we simultaneously considered the potential and the resistance of urban construction and development. Then, we established a potential-resistance model following the suitability analysis of urban construction land concerning the vertical processes. Next, based on the vertical suitability analysis results, we regarded the urban built-up areas as “sources” and simulated urban spatial sprawl using the MCR model following the suitability regionalization of urban construction land, which concerns the horizontal processes of the study area. Based on the threshold values of resistance, we divided the study area into the priority, suitable, restricted, and prohibited areas.
2. Study Area and Methods
2.1. Study Area
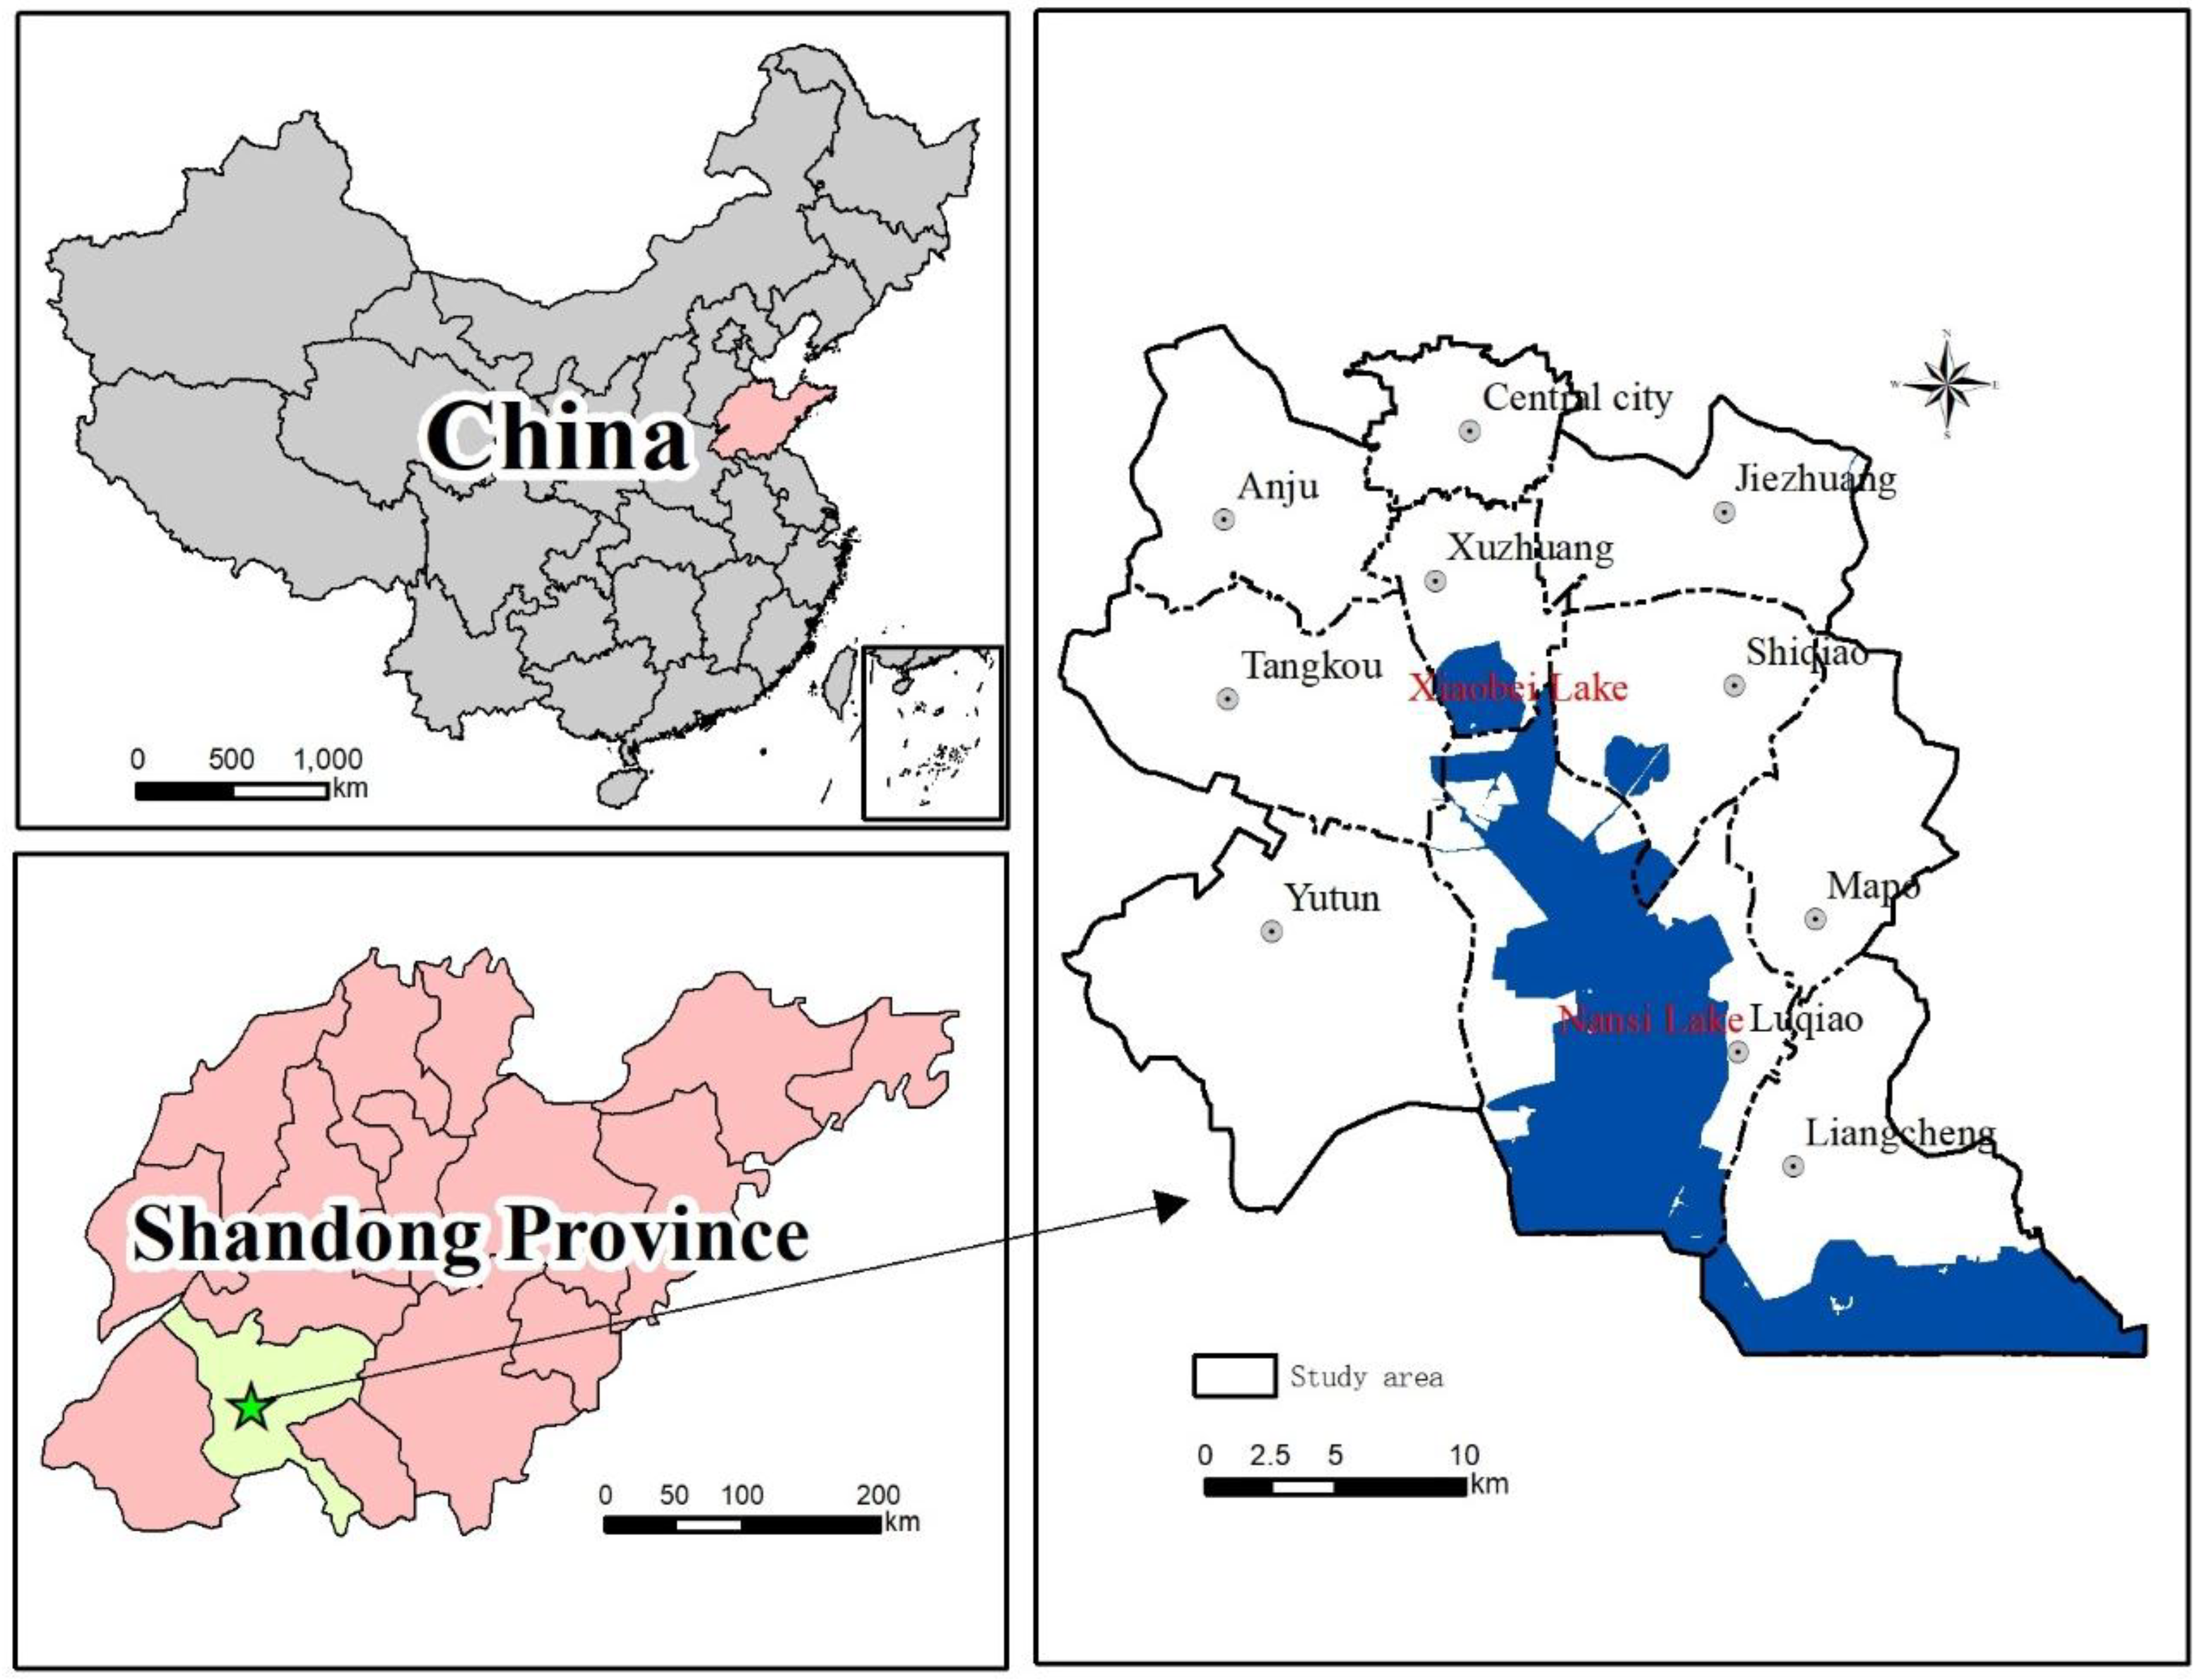
Jining City (34°26′–35°57′ N, 115°52′–117°36′ E) is situated in southwestern Shandong Province, China, covering a total area of 11,187 km2. Jining City has a population of 8.30 million, and its urbanization rate is 52.75% (2015). Jining is home to more than 70 types of minerals and other geological products and has large deposits of coal, limestone, gypsum, and barite [51]. However, early unreasonable exploitation of coal resources and the unique geologic conditions have formed numerous coal mining subsidence areas. Moreover, covered coal resource areas under urban construction lands are common in this region due to the long history of the city. Furthermore, the remaining land resources that could support future urban construction are scarce.
The study area is Beihu New District, which consists of five sub-districts (Anju, Tangkou, Yutun, Xuzhuang, and Jiezhuang), and four towns (Shiqiao, Mapo, Luqiao, and Liangcheng). The south-central part of the city is surrounded by Nansi Lake (including Weishan Lake, Zhaoyang Lake, Dushan Lake, and Nanyang Lake) and Xiaobei Lake (to the north of Nansi Lake), with a total area of 958.88 km2 (Figure 1). From two aspects we think Beihu New District is an ideal research object for applying our new suitability evaluation methodology. From natural conditions, it is a typical city locates in the vast North of China. No extreme natural conditions exist in the study area, and the diversity of natural conditions (gentle terrain, typical water system, large deposits of minerals, etc.) may lead to clear results for both traditional land use suitability evaluation and our innovative suitability regionalization method. Furthermore, the region under which the study area belongs has been in a fast urbanization process. Numerous new urban districts, like the study area, have been built or is being built in China [3,4,52]. The new urban district is a key area for future urban development and construction. To avoid repeating the ecological environmental issue problems caused by irrational development and construction in the past, it is necessary to perform scientific and rational suitability evaluations of urban construction land in the early stage of development and construction in the new district. Such evaluations can guide the reasonable and orderly construction of the district and minimize the impact on the ecological system caused by urbanization, and it is not only helpful for the study area, but also for other areas in fast urbanization process in China, as well as other countries, especially the developing ones.
2.2. Data Collection and Processing
The data analyzed in this study include a 2013 land use map of the study area, land-use status survey data from 2013, a 1:10,000 topographic map of the study area obtained from the Jining Urban and Rural Planning Bureau, and thematic maps that provide information on basic farmland protection zones, water source protection areas, coal mining subsidence areas, and areas with covered coal resources obtained from the Jining Land and Resources Bureau. Additionally, water source protection areas were obtained from the Jining Water Conservancy Bureau.
First, each topographic map was corrected by geometric calibration through ERDAS Image 9.1 software. Then, the corrected topographic maps and their projection information were used to achieve geometrically precise corrections to the land-use maps and the aforementioned thematic maps. All data were projected using the transverse Mercator projection system (Krasovsky ellipsoid). The central meridian was 114.00. The root-mean-square error (RMSE) was controlled within 0.5 pixels. Second, the corrected land-use map and all thematic maps were digitized in ArcGIS 10.3, and various types of land-use information were verified by the staff in the Jining Urban and Rural Planning Bureau. As a result, we obtained a land-use map in a vector format and all thematic maps containing the spatial distributions of specific factors in the study area. Based on China’s “Current Land-Use Classification” (GB-T21010-2007) and considering local realities, we divided the land use of the study area into 8 types: farmland, garden plots, woodland, wet land, urban construction land, rural construction land, independent industrial and mining land, and natural reserve areas. Thus, a database containing land-use attributes and thematic information from the study area was formed.
2.3. Urban Construction Land Suitability Analysis Based on the Potential-Resistance (PR) Model
The first step for our study is to evaluate the land suitability for construction in the study area. Evaluating factors of different categories and attributes have different performances of influence on urban construction [21,24,53,54]. Some of these factors apply extreme resistance and present absolute restriction on urban expansion, while others apply motivation or potential. Therefore, we quantified potential and resistance for urban construction, respectively, and in accordance with and previous researches [55,56], analyze the suitability of urban construction land based on the potential-resistance model.
2.3.1. Analysis of the Urban Development and Construction Potential
The analysis of the urban development and construction potential provides an important basis for macroscopically identifying the best future development directions and scale of a city. For a land unit, the potential for construction hinges on its distance to growth poles of urban area, the main road, and the intensity of land use [53,54]. In this paper, the distance to built-up areas (D_B), the distance to main roads (D_M), and the current land-use situation (LU) were all used as major factors that influence the development potential of a land unit [22,23,24]. The land units were divided into five potential development categories according to the results of each factor: ultra-high, high, medium, low, and ultra-low development potential. These categories were ranked as 9, 7, 5, 3, and 1, respectively. The grades and assignments of all factors are shown in Table 1. The assignment method is one of the popular methods for evaluation of land use [55]. The “value” 1, 3, 5, 7, 9 or 9, 7, 5, 3, 1 were obtained according to the important and sensitive level between the factor and the evaluation element. The readers can completely utilize this method in similar research. It must be noticed that the value giving is different depending on the type of land use. For instance, in this study, the value can be giving as Table 1 since we focus on the suitability evaluation of urban construction land. Compared to our study, the factor division and value giving are quite different if the evaluation element is ecological land or agriculture land.
Next, the weight of each evaluation factor was determined using the AHP method. As a multi-criteria analysis method that combines qualitative analysis and quantitative analysis, the AHP method was introduced by Saaty [56]. Based on the hierarchy principle of a given system, AHP breaks down a complex problem into simple groups and hierarchies and compares them pair-wisely and step-wisely. Subjective judgments of human are expressed and processed numerically. The Delphi method was applied in this procedure [13,16,35,36]. For the Delphi method, several experts can state their comments on the relative importance of each factor independently and anonymity, and the comments would be more consistent gradually after several rounds of feedback and modifications [16,57,58]. The final decision could be made by the average proposed from the experts and it would be introduced in the judgement matrix. In the suitability evaluation field, a factor hierarchy can be extremely helpful as part of a complex decision-making process. The implementation process included the following three steps:
- The first step involved comparing the degree of importance to urban planning between two single indices using a Delphi method and assessing the factors on a 1–9 scale. For our research, we consulted 10 experts in the fields of environmental science, geography, urban and rural planning, and ecology from the academy of the authors, planning institution and functional departments of Jining municipal government. (Table 2).
- The second step involved constructing a judgment matrix and calculating the eigenvalue of each factor.
- The third step involved calculating the weight of each factor and performing a consistency check.
The relative weight of each factor was calculated based on the distance to the current built-up area (0.4599), the distance to the main road (either existing or decided by planning) (0.3189), and the current land-use situation (0.2212). Weighted overlay analysis was subsequently applied via the ArcGIS platform according to the following equation:
where Pi is the potential value for urban development and construction at a point in the space, Xip is the value of potential factor i, and Wip is the weight of potential factor i.
2.3.2. Analysis of the Ecological Constraint Resistance
The sensitivity of important ecological and environmental factors is the main source of resistance to urban development [59,60]. To quantitatively evaluate the ecological-based resistance to urban development in the study area, seven factors were selected based on previous studies [21,24,61] of urban land-use suitability evaluation. These factors included topography, distance to major rivers (D_MR), areas with covered coal resources (CR), coal mining subsidence areas (CM), water source protection areas (WP), cultural sites (CS), and basic farmland (BF). We divided the sensitivity values of all the factors into 5 grades based on their significance degree. The possible categories included ultra-high, high, medium, and low ecologically sensitive areas and non-ecologically sensitive areas. These parcel types were graded as 9, 7, 5, 3, and 1, respectively (Table 3).
Among these parcel types, current coal mining subsidence areas, core water source protection areas, and permanent basic farmlands should be treated as rigid ecological boundaries that cannot be crossed and that should exercise “veto power” over development. Construction should be prohibited in these areas in future urban planning and construction. Thus, we assigned these types of areas a special score of 9999 to ensure the appropriateness of the comprehensive evaluation results. The grades and assignments of all factors are shown in Table 3. The extremum method was applied to determine the weight of each area according to Liebig’s law of the minimum [14].
where ESi is the urban ecological resistance at a point and Xir is the value of the resistance factor i (topography, D_MR, CR, CM, WP, CS, and BF).
ESi (ecological sensitivity) = Max(Xir)
Sensitivity analysis for assessing the various ecological constraints that affect urban construction is performed in ArcGIS 10.3 based on the above analysis and assignment standards and the obtained classification layers for each factor. Then, based on the Formula 2, the sensitivity of each ecological factors was superimposed in ArcGIS 10.3.
2.3.3. Urban Construction Land Suitability Analysis Based on the Potential-Resistance Model
Based on the assessment of urban development potential and ecological constraints and previous research achievements [56,57], we treated the suitability as the difference between potential and resistance and modified the traditional methodology of land suitability evaluation. As a result, we established a potential-resistance model for urban development and construction. This formula can be expressed as follows:
where Si is the suitability value for urban construction land. For a land unit, the Si is influenced by Pi and ESi. The larger the Pi is, the lower the ESi is, the more suitable the land unit is for urban development and construction. Both Pi and ESi are positive values. In accordance with the sign of the difference, each land unit of the study area can be labeled with a positive value, suggesting it is a suitable location for urban development, or a negative value, suggesting it should be maintained as an ecological preservation area.
Si = Pi − ESi
2.4. Urban Construction Land Suitability Regionalization Based on the MCR Model
Based on the urban construction land suitability analysis described above, we obtained an evaluation value for urban construction land suitability, Si. Subsequently, the horizontal processes related to urban spatial expansion in the study area were simulated and predicted using the MCR model. The MCR model accounted for three factors: source, distance, and features of the landscape interface [46,47]. In this paper, an important assumption is that the higher Si is (Si is the suitability value of land unit calculated from the results of vertical suitability analysis), the less resistance the future urban expansion may encounter. On the contrary, lower Si means greater resistance for the urban expansion. Therefore, based on this assumption, we can use the value of Si to calculate the resistance plane for MCR model.
The formula for the MCR model can be expressed as follows:
which is a modification of the model provided by Knaapen et al. [45] and is a least-cost model [49,61,62] that represents the cost of an object moving through landscapes of different resistances from a “source” [63]. This method is commonly used in GIS for measuring accessibility [47,64]. In this formula, f is an unknown positive function that reflects a positive correlation among the minimum resistance of any point in space and the distance between the point and all the sources as well as the interface features of the landscape. Additionally, Dij is the spatial distance from source j to a certain landscape interface I, and Ri refers to the resistance to a certain movement from landscape unit i.
Although f is usually unknown, the cumulative value of (Dij × Ri) can be viewed as a measure of the relative accessibility of some path from a certain source to any point in space. The minimum resistance from each source to a certain point in space was adopted to measure the accessibility of the point. In the horizontal simulation of urban spatial growth, the current urban construction lands were introduced as sources. However, the MCR model considers the resistance to a certain movement from landscape unit i, which is inversely related to the sustainability evaluation value Si. Furthermore, the resistance value in the MCR model is positive, and Si can be either positive or negative. Thus, to complete the calculation, we first normalized the evaluation value.
Then, the reciprocal of the normalized value was determined to obtain the resistance value of the MCR model from the vertical land suitability analysis.
The computation was then achieved using the spatial analysis module in ArcGIS 10.3.
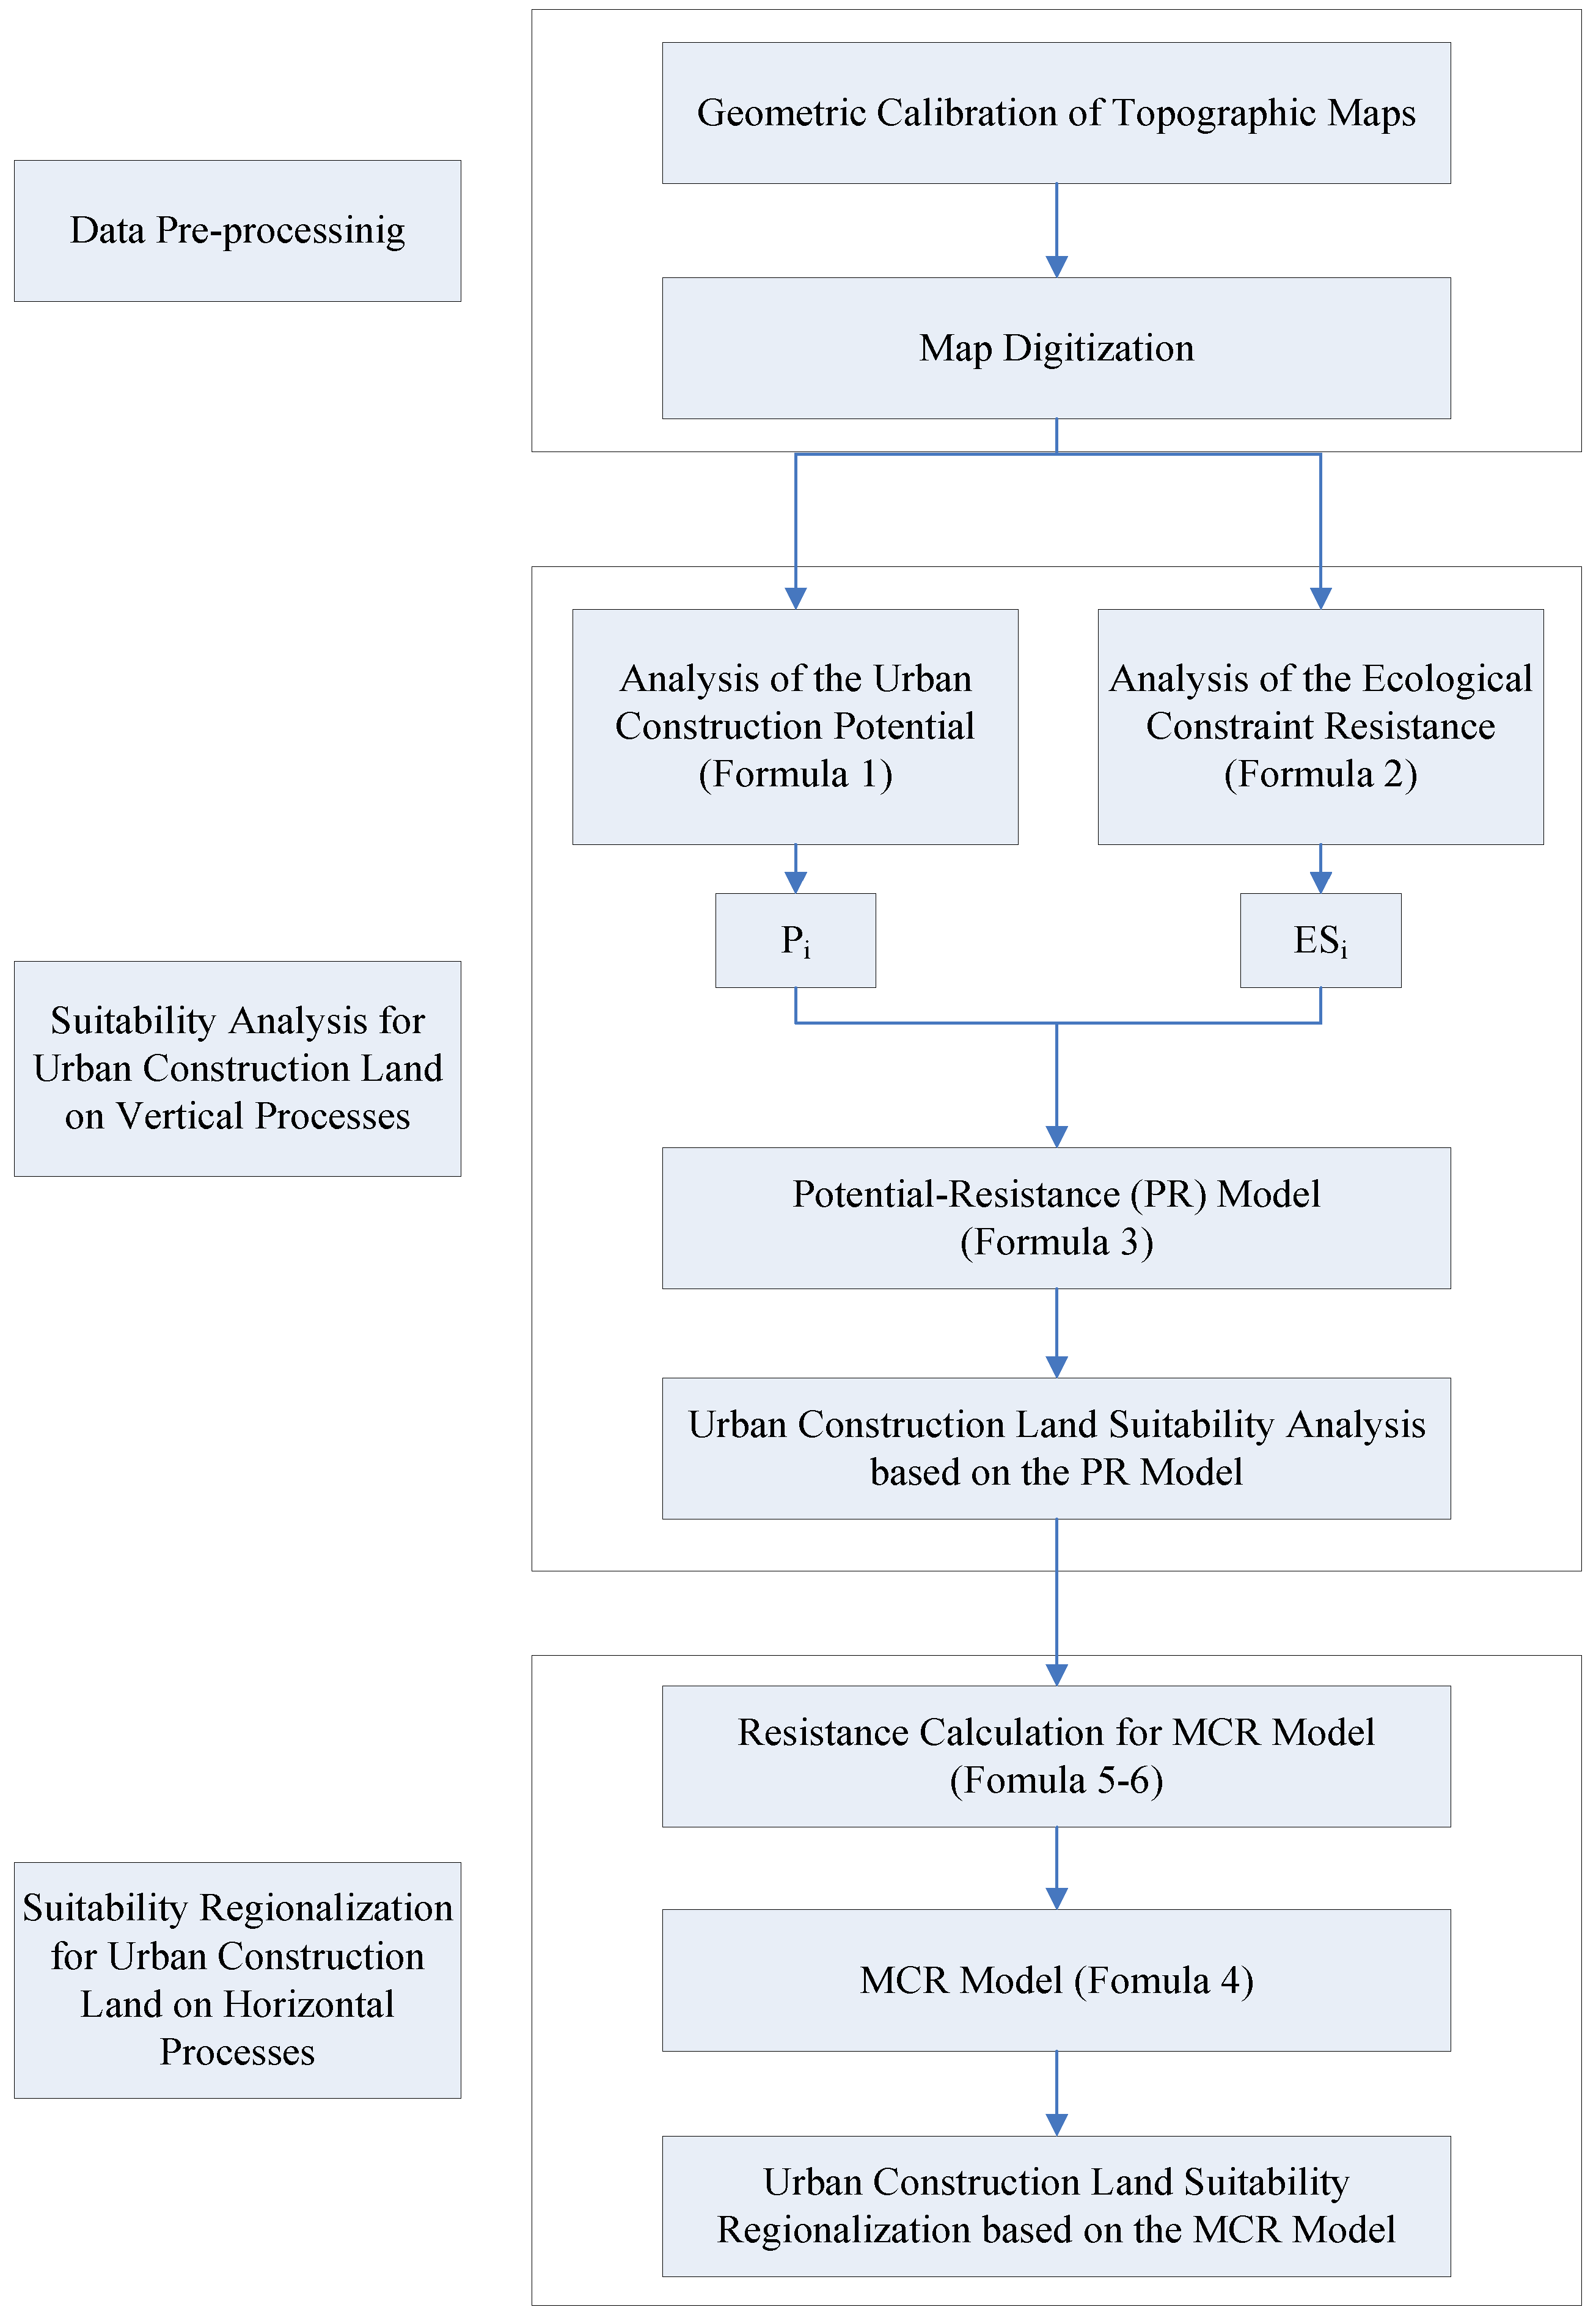
The flowchart of the methodology is shown in Figure 2.
3. Results
3.1. Suitability Analysis for Urban Construction Land
3.1.1. Analysis of Urban Development and the Construction Potential
Based on aforementioned methods and assignment systems, each potential factor of urban development and construction was spatially analyzed in ArcGIS 10.3, and hierarchical layers were obtained for each factor. Subsequently, we used weighted stacking for the layers of each individual factor in the GIS platform to form a figure for the potential evaluation of areas for urban development and construction stored in raster (spatial resolution 10 m) form (Figure 3). As shown, the development and construction potential of Jining’s central city is significant, and it is considerably larger than those in sub-districts and towns. In contrast, the development potential of the remaining sub-districts and towns, except for that of the Xuzhuang sub-district, is relatively small, and regions near the central city and the main road possess greater development potential. The point-axis development pattern surrounding Nansi Lake is well defined in the study area. The development axis between the central city and the Xuzhuang sub-district is the most important, followed by the Mapo-Luqiao-Liangcheng axis, which is composed of three towns and trends toward integrated development. In addition, the Jiezhuang-Shiqiao axis and the Anju-Tangkou axis have also gradually formed as new development axes.
3.1.2. Analysis of Urban Development and Construction Resistance
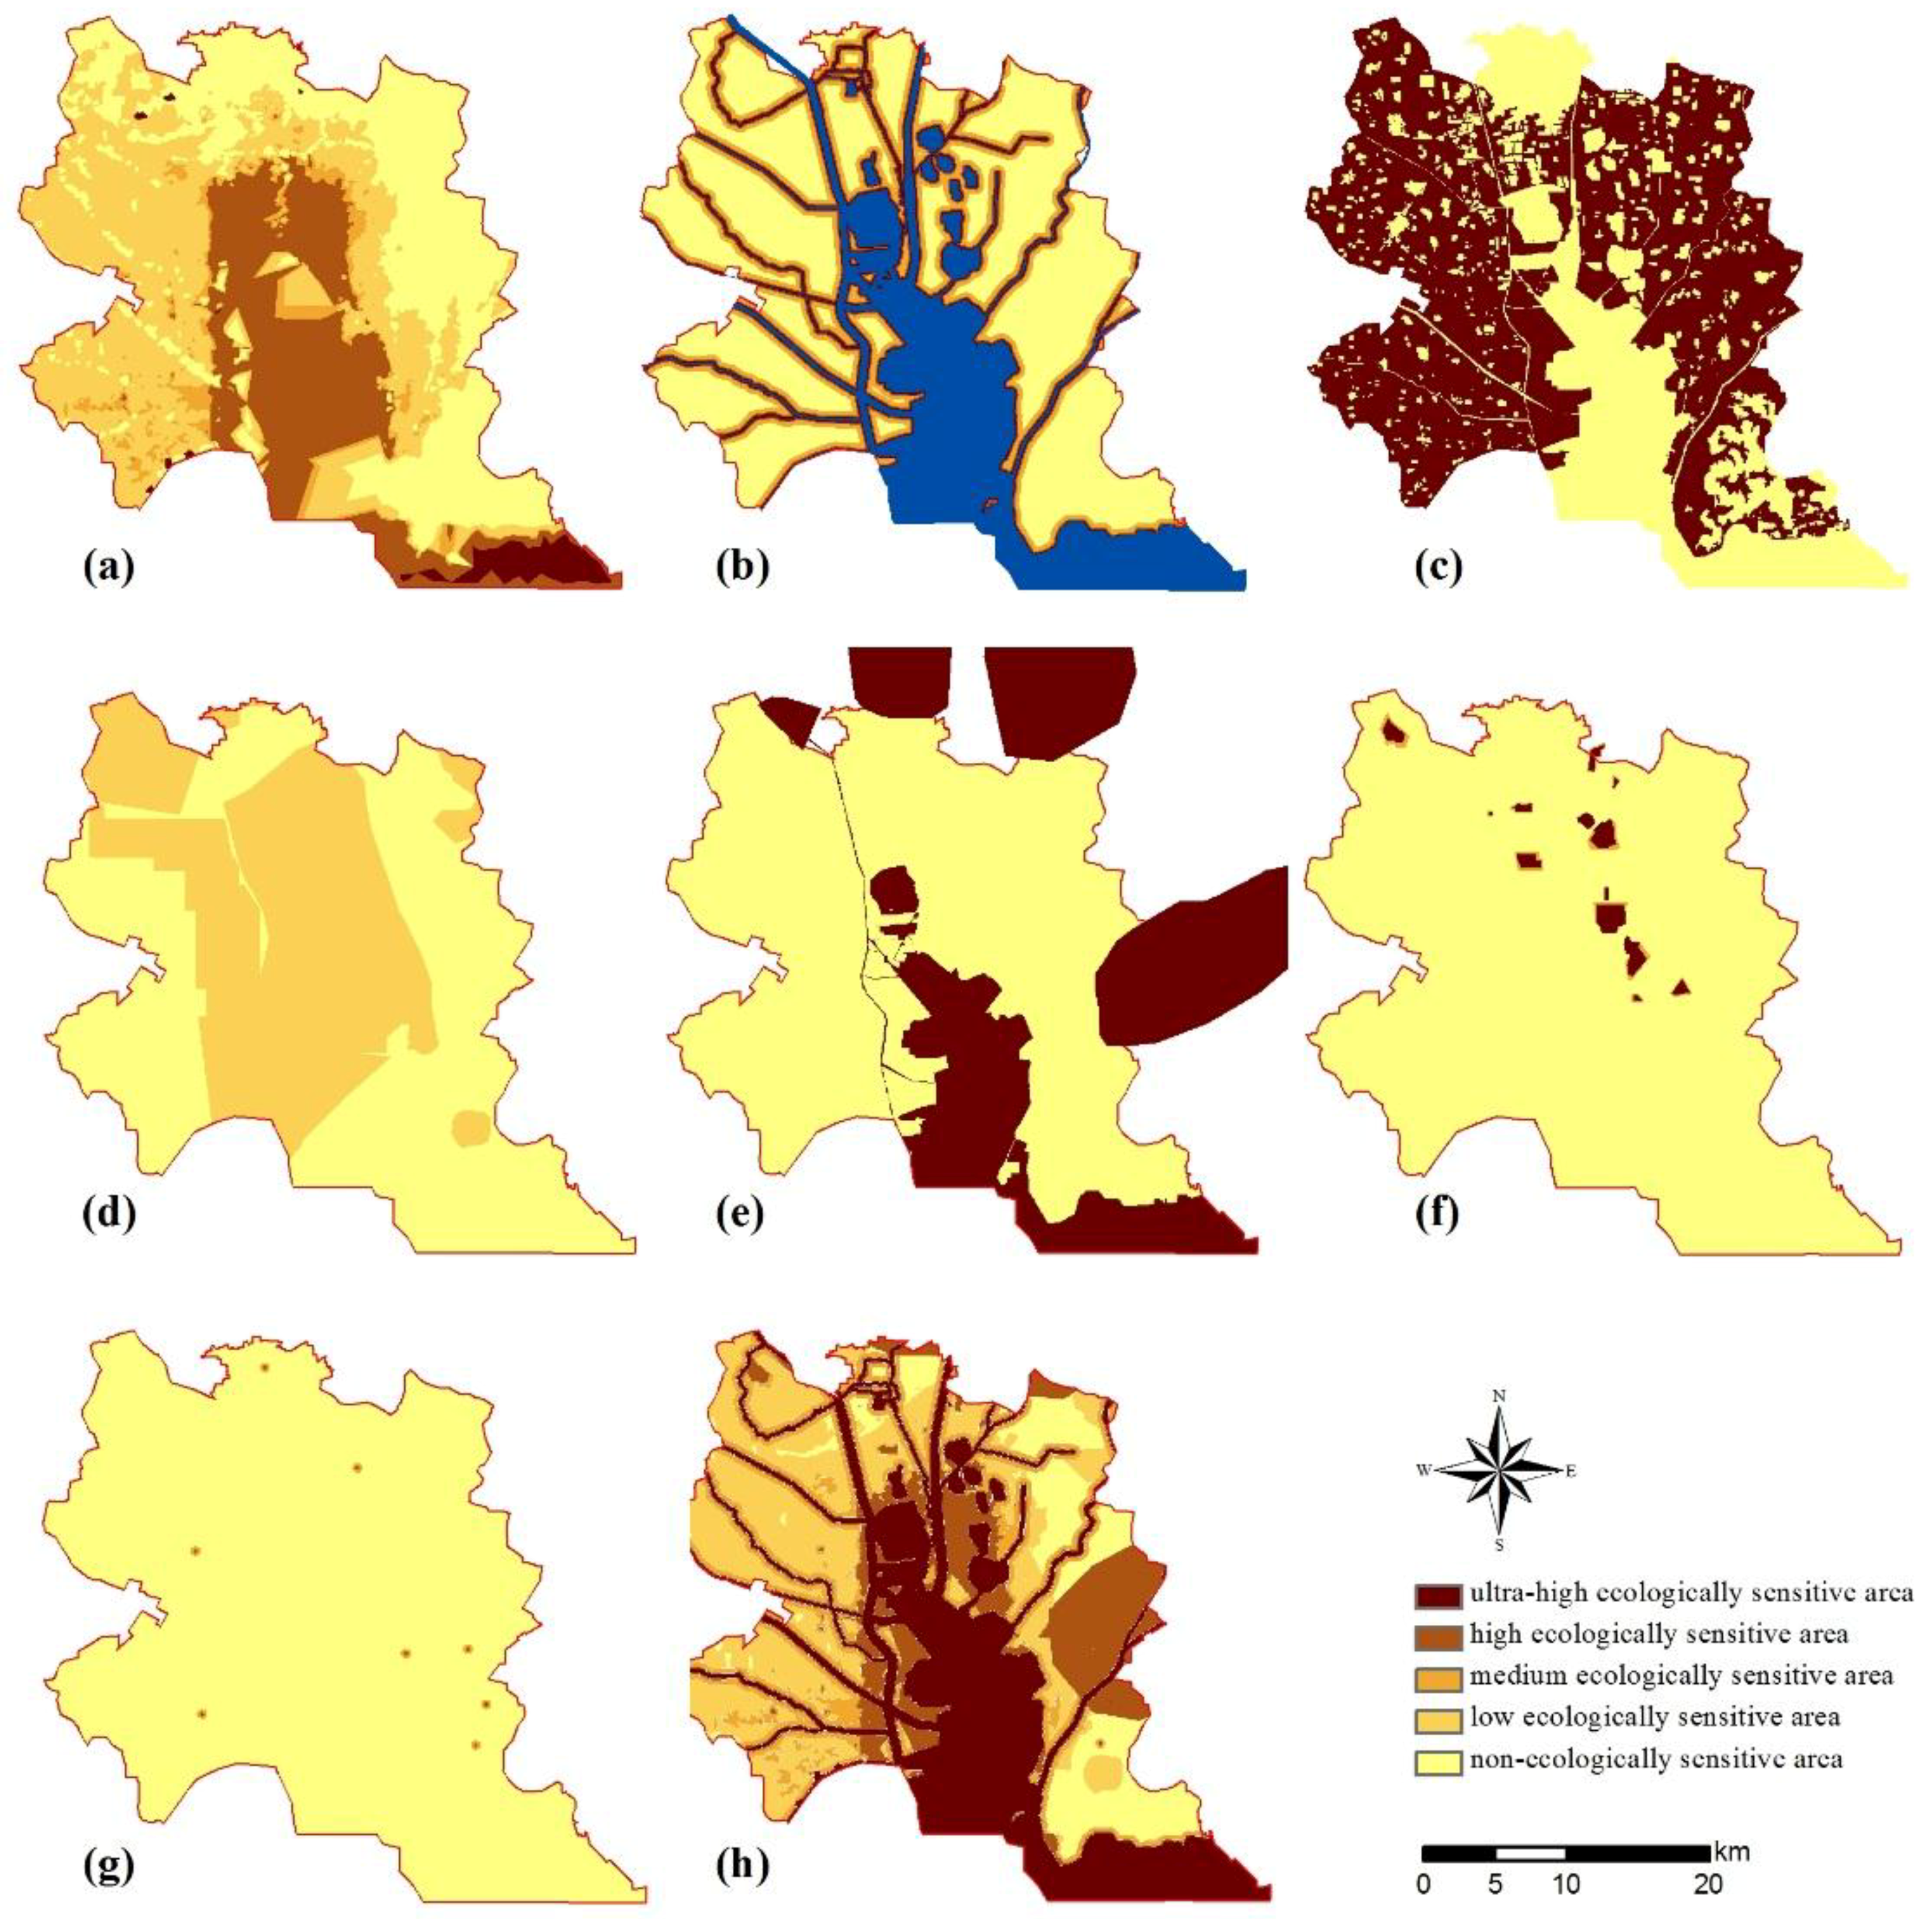
The resistance analysis results for urban development and construction in the study area were generated and stored in raster (spatial resolution 10 m) form, which shown in Figure 4.
Due to the flat topography of Jining City and the relatively high water level of Nansi Lake during the wet season, the study area suffers from frequent flooding. Therefore, the sensitivity of topography was determined based primarily on the water level of Nansi Lake. In the northern part of Nansi Lake, the limited water level was 34.2 m, and the normal water level was 34.5 m. For the southern part of Nansi Lake, the normal water level was 32.5 m, while the designed flood level was 36 m.
Coal mining subsidence was primarily determined by field survey research, image interpretation, the distribution of covered coal resources, and planning research on the Jining wetland system. Based on this information, we were able to obtain the current coal subsidence areas and the predicted coal subsidence areas in 2020.
In accordance with the relevant regulations in China, basic farmland protection areas are areas in which construction is prohibited. As shown in Figure 4c, there would be little land available for urban construction in the study area if all basic farmland areas were excluded, making further urbanization impossible. In addition, this study adopted the version of local land-use planning enacted in 2006, which has an implementation deadline of 2020. Therefore, from the perspective of urban development, we ultimately did not take this factor into account. It should be highlighted that the proposed “permanent basic farmland” concept in the third Plenary Session of the 17th Communist Party of China Central Committee in 2008 suggested that permanent basic farmland should not be developed for any other purpose under any conditions or misappropriated in any way in future land-use planning. According to the comprehensive ecological sensitivity analysis results (Figure 4h), land units with high or ultra-high sensitivity distributions are mainly confined to low-lying areas, water source conservation areas, and areas closer to the river. The resistances of these areas for urban development are relatively large.
3.1.3. Urban Construction Land Suitability Analysis based on Vertical Processes
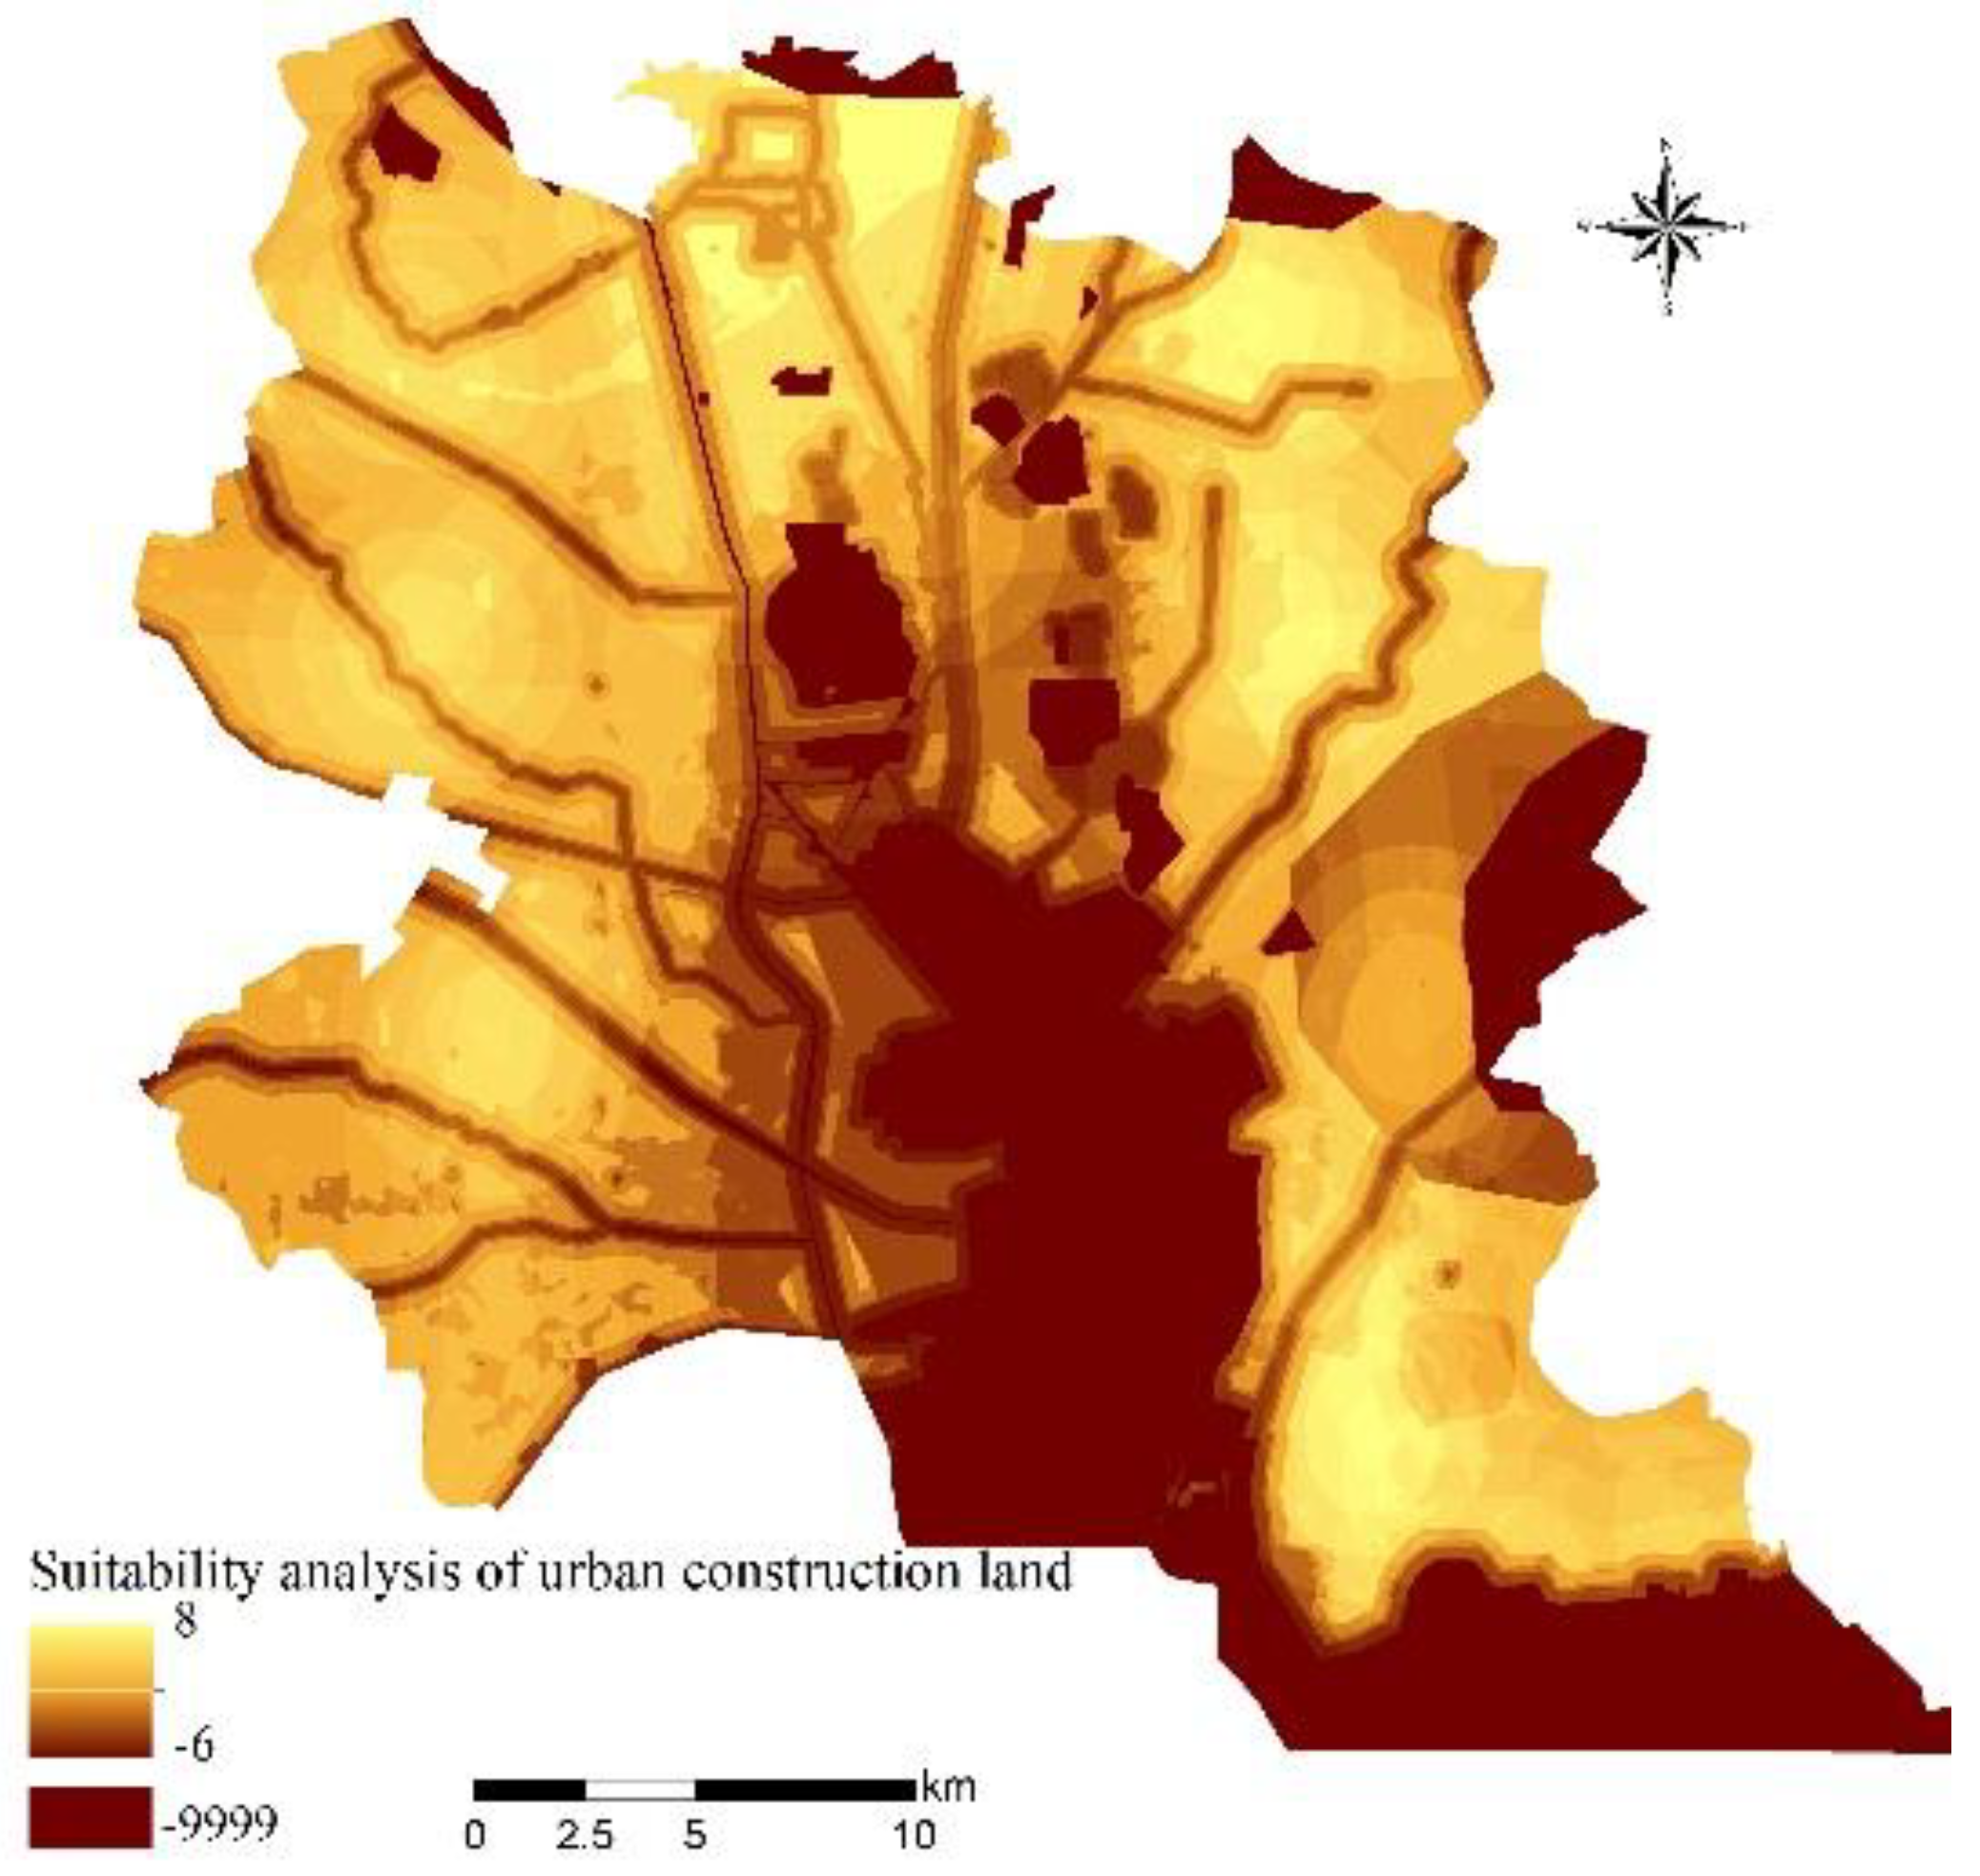
Based on the urban development potential and resistance evaluation, we adopted a potential-resistance model and performed an urban construction land suitability analysis for the vertical processes (Figure 5).
Figure 5 reveals that relatively suitable land units for construction are mainly distributed in the southern part of the central city and in the zones surrounding the main sub-districts and town centers. Given the great considerable exploration potential, these areas may ultimately serve as bases for the future development of Beihu New District. Land units with low levels of construction suitability were mostly distributed along Xiaobei Lake, Nansi Lake, major rivers, and water source protection areas, which should be developed and utilized moderately with scientific guidance. Land units that are extremely inappropriate for construction contain major rivers and lakes, as well as wetlands and mud flats surrounding the waterways. These regions are critical in protecting local ecosystems and maintaining local ecological security and are therefore not suitable locations for urban growth. Thus, ecological protection measures in these regions should be followed strictly, and no exploitation or construction activities should be allowed.
3.2. Comprehensive Suitability Regionalization for Urban Construction Land
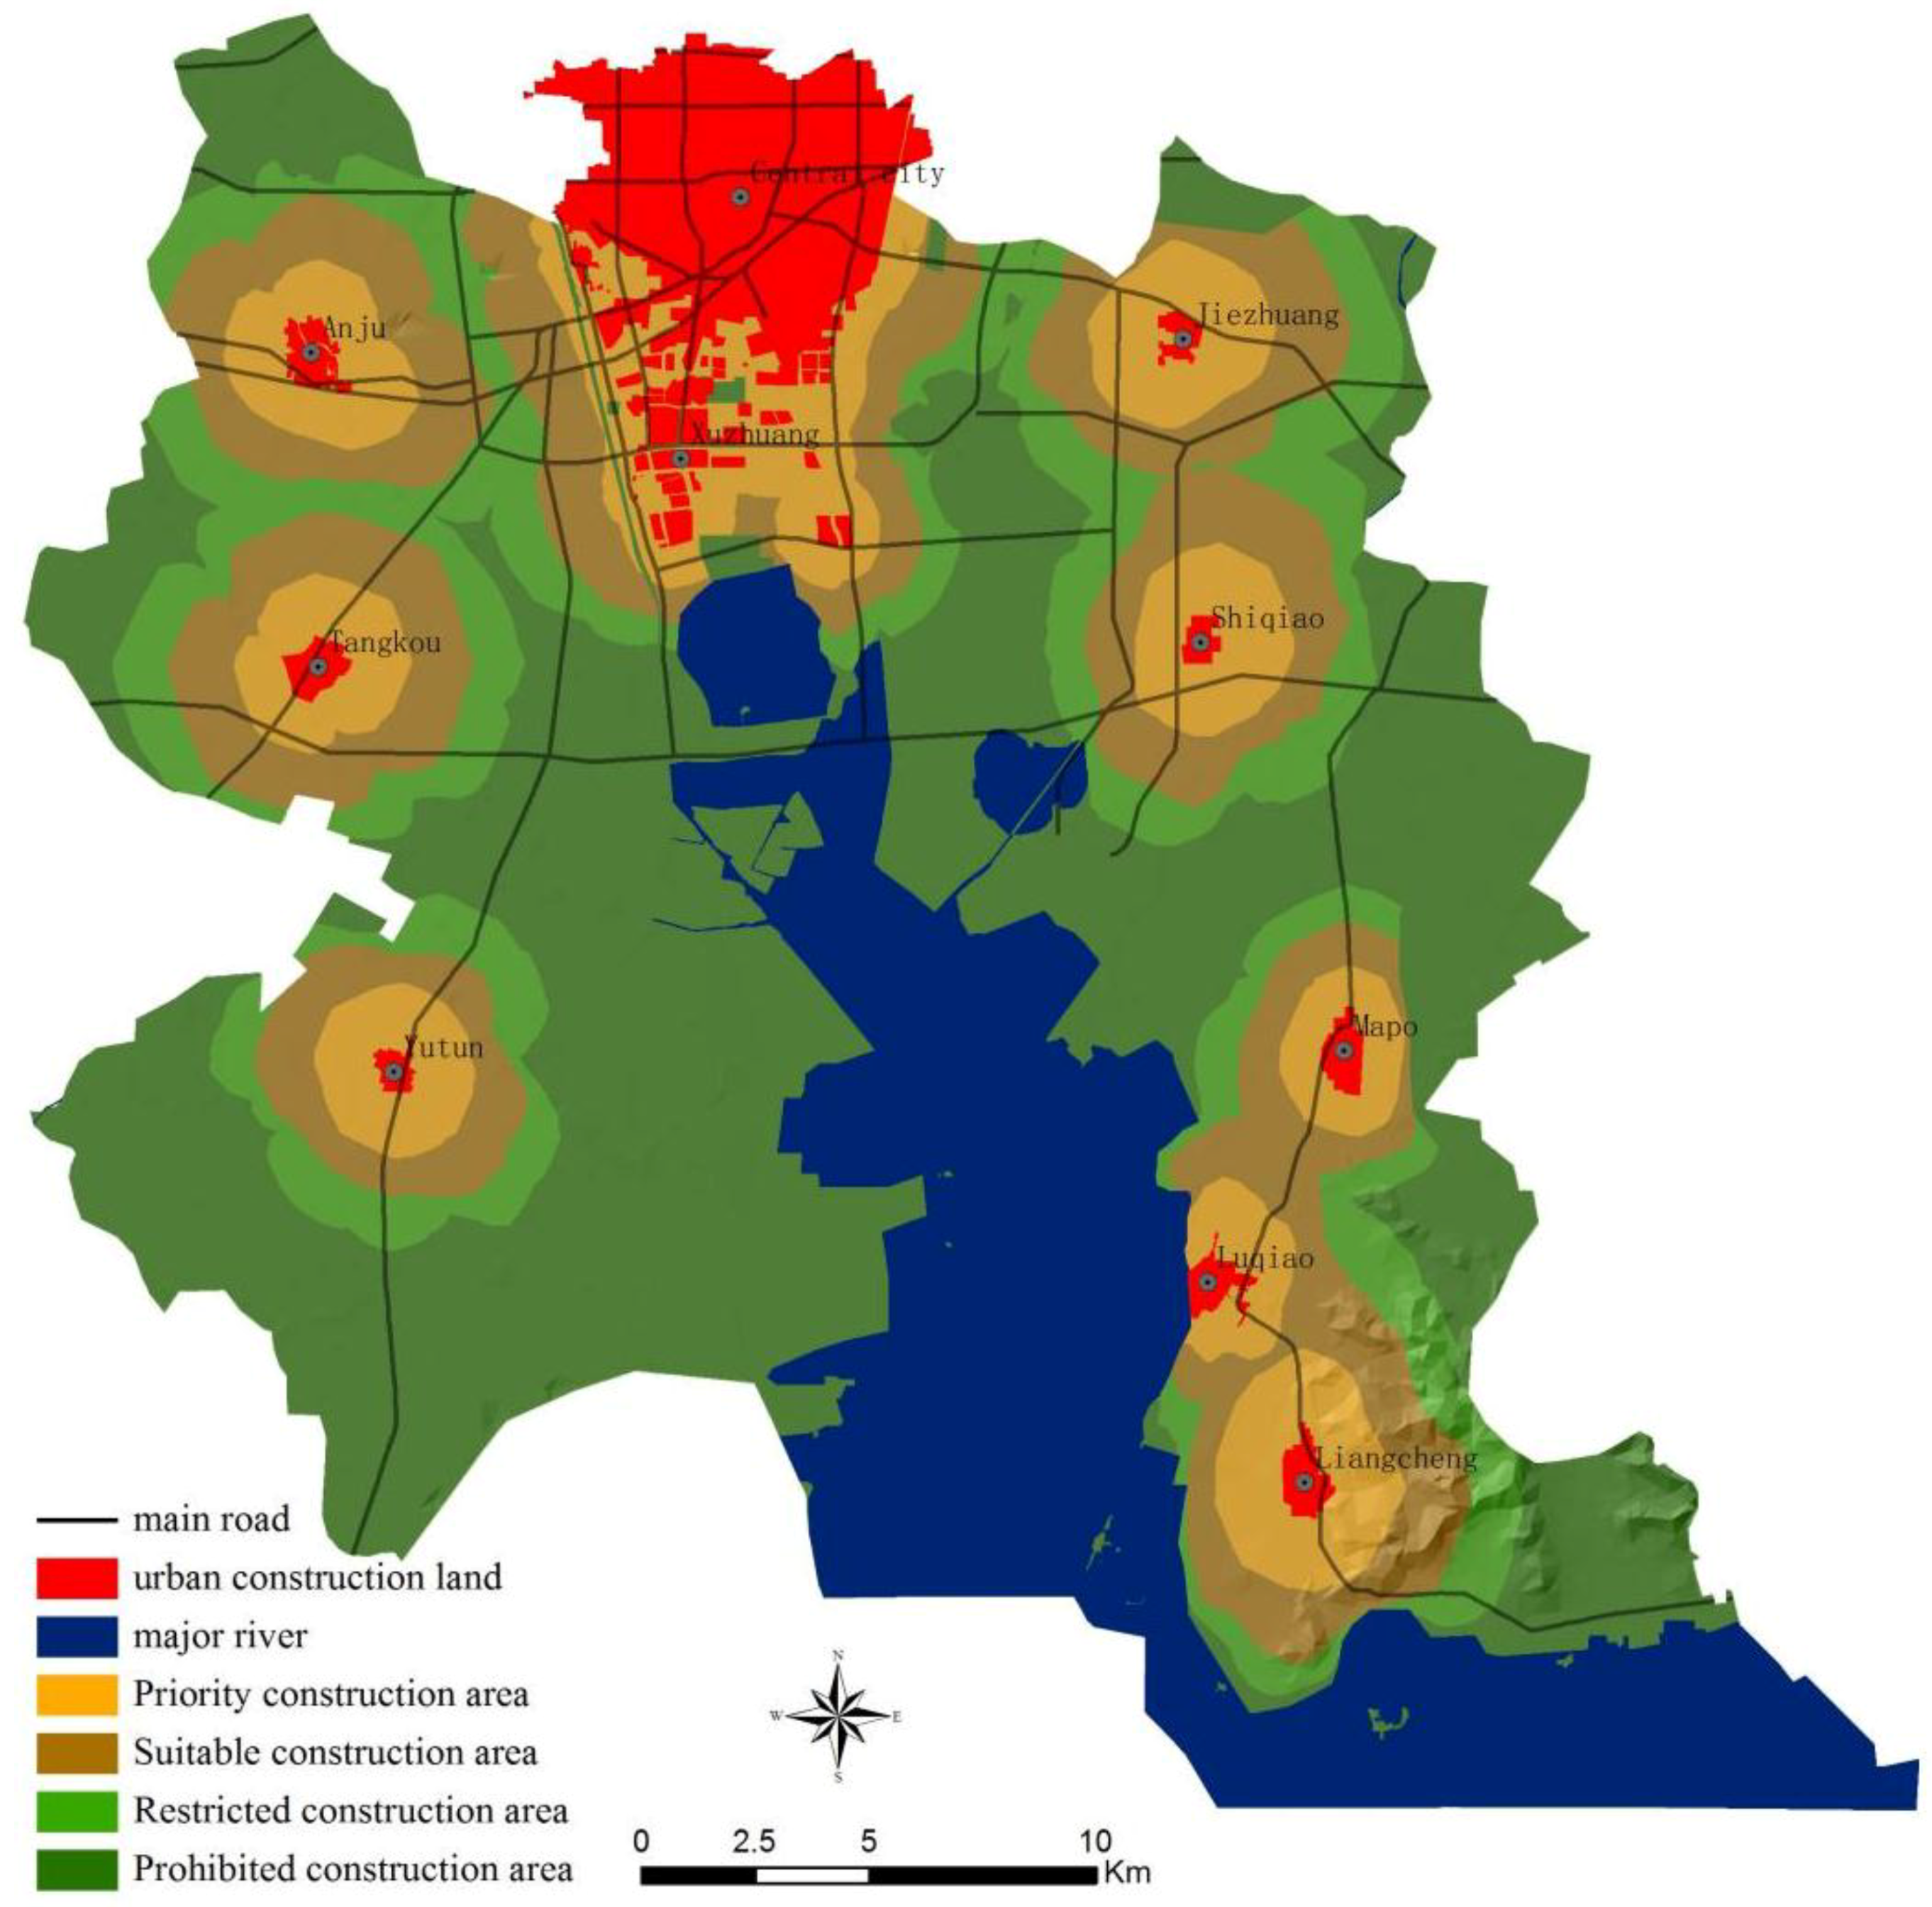
Based on the suitability analysis results of vertical process, we adopted the MCR model to simulate urban spatial growth for horizontal processes. We obtained comprehensive suitability regionalization categories for urban construction based on the resistance threshold (Figure 6). Notable changes may occur in the unit where the threshold is located when urban spatial growth surpasses the resistance threshold value. Therefore, it is possible for researchers to classify land units into different intervals before and after the resistance threshold is reached. In this study, we ultimately divided the study area into four types of areas with respect to urban construction: priority areas, suitable areas, restricted areas, and prohibited areas.
From Table 4, we can see that the priority areas for urban construction covered a total area of 158.75 km2, accounting for 16.55% of the study area. These areas were spread across the peripheral belts of the currently built-up zones. Due to significant radiation effects, the development of these areas is generally driven by growth spreading outward from nearby urban or town centers. These land units have relatively mature physical infrastructures, and negative impacts on the local environment are typically quite small. Suitable areas for urban construction covered 151.62 km2, accounting for 15.81% of the study area. Such areas were located between the restricted areas and the above areas, and these areas are buffer zones between non-construction land and construction land. Thus, such areas can be treated as elastic boundaries for the prospective expansion of urban sprawl within the study area. Restricted areas for construction covered 123.57 km2, accounting for 12.89% of the study area. These areas form the buffer zones for ecological protection as well as the isolation belts that separate individual areas of urban development for baseline ecological security. These areas are of great importance in guiding local development patterns in clustered cities and maintaining ecological security in the study area. The remaining land units were classified as prohibited areas for urban construction. They covered a total area of 524.94 km2 and accounted for more than half of the total area (54.75%). In the study area, these zones provide vital ecosystem services, including but not limited to flood regulation and storage, conservation of soil and water, biodiversity protection, and ecological recreation. Such areas should be protected from any destructive human activities. Therefore, this category provides the ecological foundation for sustainable development in the study area, and its boundary represents a barrier to future urban expansion.
Compared to the results shown in Figure 5, the comprehensive suitability evaluation of the study area is much more intuitive and helpful for guiding the planning and exploitation of Beihu. As shown in Figure 6, land units encircling the present built-up areas have higher construction priorities than other areas. However, in some of these areas in Figure 5, especially areas surrounding the centers of the development axis of the study area (Anju-Tangkou-Yutun), the development priority is not well defined. Based on the right axis, some farmlands and lake plains have higher priorities than Mapo Town and Luqiao Town, which are lower in priority given their proximity to important water resource conservation areas. This phenomenon also differs from the comprehensive evaluation results of our new method, as shown in Figure 6.
4. Discussion
4.1. Innovations and Inspirations for Local Development Strategies
There have been a lot of case studies worldwide on the land use suitability evaluation. For example, Vladica et al. took Sara mountain national park as a case to evaluate Land-use evaluation for sustainable construction [55], Li et al. took a case of Pingtan Island for comprehensively evaluating land development suitability [64], Halil et al. took a case study of Yusufeli district in Artvin to analyze agricultural land use suitability [35]. However, these cases of land use suitability evaluation only considered the suitability on vertical processes. Traditional suitability evaluation methods, based on maps overlay techniques, were criticized for paying more attention to the selection and weighting of various evaluation factors, the grading of result. In addition, the traditional suitability analysis method usually regards various factors as isolated factors without interactions and can produce results that are vertically stacked [9,10,33,40]. However, some processes behave as flows or interactions among land units on horizontal planes. Due to the different distances to the sources of horizontal processes, different land units may require different resistance and produce distinct effects on the determined land use suitability based on a specific purpose. Traditional suitability evaluation methods lack the supporting materials for the description of these processes [65].
Compared with traditional methods of land use suitability evaluation using maps overlay techniques, the improvements of methods proposed in this study mainly involve the following three aspects:
- (1)
- The evaluation factors of construction land suitability on vertical processes were divided into potential factors and resistance factors, and the suitability was evaluated based on PR model.
- (2)
- As urban expansion is a typically horizontal process, this paper highlighted the integration of vertical and horizontal processes linking the PR and MCR models for construction land suitability evaluation. The evaluation results may be more instructive for site selection and planning of urban construction land, and it is beneficial to guide the urban development in the direction of multi-center and group.
- (3)
- Traditional evaluation results are similar to the suitability analysis results in this study (Figure 5). Although many areas seem to be suitable for construction, they are not appropriate for actual development and construction due to the lack of infrastructure and matching industries. This is a common problem in many new cities which leads them to be ghost or sleeping cities.
In this work, according to the traditional land suitability evaluation method concerning vertical processes, we first obtained the results presented in Figure 5. Except for zones surrounding built-up areas, the other land units were found to be suitable for urban construction, including the east portion of the Yutun sub-district, the southwest portion of Shiqiao Town, and the shorelines of Nansi Lake in the western and southern portions of Liangcheng Town. The latter areas are far from current urban areas, have relatively low population densities, and currently lack essential infrastructure, such as roads, which would be required to support urban development and construction. Furthermore, the poor conditions in these areas would inevitably result in much higher costs for development and therefore frustrate the stakeholders, in particular the local authority and property developers.
These evaluation results may reflect why some new town projects have been unsuccessful [66,67]. New town projects have become popular in China in recent decades. However, based on the experiences of some other cities [68,69,70], such as Jakarta, Hong Kong, and Paris, where new towns are located far from old urban areas, while the rational and ideal local conditions are often not considered. The resulting low appeal to residents caused some new towns to quickly become “ghost towns” due to inconvenient transportation options, high vacancy rates, and long commute times [52,68]. Because urban sprawl is also a typical process that occurs on a horizontal plane, merely looking at the superposition of factors concerning the vertical processes may result in some problems unexpected. For instance, regions such as farmlands, undeveloped lands away from cities, or protected waterfront zones, which were featured with flat terrain and rich natural endowments, may be considered suitable for urban construction according to the results of traditional methods. However, in these hotspots high development costs are common for infrastructure. Blindness in development occurring in these hotspots may lead to high ecological costs and therefore waste the valuable resources. Given the limited advantages of construction in such areas, the potential wasting of resources and damage to the natural environment or cultivated lands could have serious consequences on regional sustainability. Therefore, sustainable development is unlikely to be achieved in the entire region, and new methods will be needed to enhance the rationality of land suitability evaluation.
By adopting and applying the MCR model to evaluate the suitability of urban construction land in terms of horizontal processes, we obtained the comprehensive suitability evaluation results of the study area, as shown in Figure 6. The study area has flat terrain and a relatively simple land-use structure, and the only horizontal process considered was urban sprawl. These conditions make the study region an ideal model for the simulation and calculation processes. Priority construction areas encircle the existing built-up areas according to our analysis. Based on the above discussion, we think that the regionalization results provided by our comprehensive method are both reasonable and economical for the future exploitation of this area. Additionally, we provided our own thoughts on the development strategy in Beihu New District. After considering both vertical and horizontal processes, we might be able to produce a more scientific land suitability evaluation than previous methods. We believe that a comprehensive evaluation method could have important application value for urban and regional sustainable development.
This study is a special topic for suitability evaluation of construction land in “Urban development strategy planning of Beihu New District in Jining City”, which is an official plan of Jining municipal government. The goal of “Urban development strategy planning of Beihu New District in Jining City” is to direct the future urban development and construction in Beihu New District. Based on the results of this study, the future urban construction land in “Urban development strategy planning of Beihu New District in Jining City” is mainly distributed in the priority construction area and suitable construction area. Meanwhile, most of the dark green areas in Figure 6 are as prohibited construction areas in “Urban development strategy planning of Beihu New District in Jining City.”
4.2. Limitations and Prospects of Our Research
In this research, after selecting evaluation factors and accounting for the local ecological and development situation, we adopted the AHP method to compare the degree of importance for urban development based on two single factors. AHP, as one of the most widely known multi-criteria analysis approaches [71], has been comprehensively used in urban planning [72], determining strategy [73], and environmental management [74]. It is especially more popular applied in research of “suitability evaluation.” Undoubtedly, some subjectivity would exist in the process of calculating the relative importance of each factor. Therefore, in selection of indicator, on the basis of related previous research, the final decision has been recognized by combination of the comments made by local planning, land, and environmental administrations to increase the scientificity, specialty, and reasonability. In the process of comparing pairwise or ratios among factors, the experts from various administrations and institutions were consulted to state their comments independently and anonymity. The comments would be more consistent gradually after several rounds of discussions. The final weight decision thus could be made by the average proposed from the experts. Additionally, almost all factors exist theoretically in relationship, and the relative importance of each factor can be confirmed through AHP method. The factors selected in this study are commonly used independently in land use suitability evaluation. More detailed information please see references [22,23,24,56,73,74]. Then, we constructed a judgment matrix, calculated the eigenvalue of each factor, and obtained the weight of each index. During this process, we determined the importance of each factor using the Delphi method (an expert consultation method). Kalogirou [75] reported that compared to procedural sequential algorithms, the expert scoring method is a faster and more flexible solution to classification problems. Nevertheless, the use of other systems for the comprehensive evaluation method in our research would also be reasonable. Other methods of weighting factors could also be used in similar areas of research in the future. Due to the length limitation of this paper, these topics are not covered because they are beyond the scope of the current work.
Urban spatial expansion is a dynamic process, and it is the result of the combined effects of natural, social, economic, and political factors. Due to the possible omission of the former three types of factors, the absence of analysis of political factors was almost inevitable in our method. In addition, the quantification and spatialization of factors that influence ecology from a local policy perspective has been difficult in similar studies. Differences in policy orientation and implementation have indeed altered the potential constraints placed on land units, many of which are vertical process attributes, as well as the speed and pattern of urban sprawl, which are horizontal process attributes. Future research on these factors will undoubtedly improve the usefulness of the proposed method.
Furthermore, in spite of the exploration in method focused in this study, the accuracy/quality of the data is quite important for land use suitability evaluation. However, the maximum scale of topographic map we can get from the local government in this study is 1:10,000 as the topographic map in larger scale is secret-related. The accuracy of construction land suitability evaluation result may be improved if a larger scale topographic map can be obtained, for fine classification of topography factor in our study.
5. Conclusions
Using Beihu New District as a case study, we explored a potential-resistance model for urban development and construction based on previous studies and classical suitability evaluation methods of land use. This model comprehensively considered the potential and ecological resistance of urban construction to analyze the suitability of vertical processes. Subsequently, we applied the MCR model to simulate and predict urban spatial expansion and evaluate the suitability of horizontal processes. Finally, we divided the study area into priority, suitable, restricted, and prohibited areas and defined the proper scales and spatial location for urban construction and development. We also defined the ecological borders of future urban growth in the study area.
Compared to traditional suitability evaluations of land use, which typically consider only the vertical processes, the method proposed in this study integrated both the vertical and horizontal processes that affect urban development and construction. Our new method improves upon traditional evaluation methods and not only enriches the approaches used in land suitability evaluations but also makes the evaluation results more feasible and reasonable. Notably, the method improves both the objectivity of urban spatial decision making and the scientific validity of land-use planning. Moreover, it may have considerable value in guiding the compact and multi-center development of local urbanization systems, determining the industrial functions and residential demands of the central city, and decreasing the unnecessary waste of ecological and cultivated land resources. Nevertheless, in certain regions under different conditions, further explorations are still needed, including selecting, classifying, assigning, and conducting weighted calculations involving evaluation factors and introducing political factors from a spatial perspective. Furthermore, based on our new method of land suitability evaluation, multi-scene urban spatial expansion simulation, and land-use layout optimization, combining the existing urban land-use change prediction models with rational scenario design will be the focus of future research.
Author Contributions
R.Z. and Y.Y. conceived and designed the overall ideas for the study, performed the processing and analysis of the data, and wrote the earlier draft of manuscript. Y.Y. and R.Z. rewrote the manuscript. H.Z. and X.Y. revised the manuscript and improved the quality of latest version. All of the authors read and approved the final manuscript. X.W. participated in field survey.
Acknowledgments
This research is jointly supported by the project Humanity and Social Science Youth Foundation of the Ministry of Education of China (Grants No. 16YJCZH161), the Natural Science Foundation of Shanghai (Grants No. 18ZR1427700), and the National Natural Science Foundation of China (Grants No. 41171432 and No. 51378127).
Conflicts of Interest
The authors declare no conflict of interest.
References
- Foley, J.A.; DeFries, R.; Asner, G.P.; Barford, C.C.; Bonan, G.; Carpenter, S.R.; Stuart Chapin, R., III; Coe, M.T.; Daily, G.C.; Gibbs, H.; et al. Global consequences of land use. Science 2005, 309, 570–574. [Google Scholar] [CrossRef] [PubMed]
- Zhang, L.; Li, W.; Wang, W.; Xiong, Y. Research on space modeling for minimum urban ecological land based on GIS: A case in Shenzhen. J. Nat. Resour. 2008, 23, 69–78. [Google Scholar]
- Liu, J.; Kuang, W.; Zhang, Z.; Xu, X.; Qin, Y.; Ning, J.; Zhou, W.; Zhang, S.; Li, R.; Yan, C.; et al. Spatiotemporal characteristics, patterns, and causes of land-use changes in China since the late 1980s. J. Geogr. Sci. 2014, 24, 195–210. [Google Scholar] [CrossRef]
- Seto, K.C.; Güneralp, B.; Hutyra, L.R. Global forecasts of urban expansion to 2030 and direct impacts on biodiversity and carbon pools. Proc. Natl. Acad. Sci. USA 2012, 109, 16083–16088. [Google Scholar] [CrossRef] [PubMed]
- Costanza, R.; d’Arge, R.; De Groot, R.; Farber, S.; Grasso, M.; Hannon, B.; Limburg, K.; Naeem, S.; O’Neill, R.; Parurlo, J.; et al. The value of the world’s ecosystem services and natural capital. Nature 1997, 387, 253–260. [Google Scholar] [CrossRef]
- Radford, K.G.; James, P. Changes in the value of ecosystem services along a rural–urban gradient: A case study of Greater Manchester, UK. Landsc. Urban Plan. 2013, 109, 117–127. [Google Scholar] [CrossRef]
- Haas, J.; Ban, Y. Urban growth and environmental impacts in Jing-Jin-Ji, the Yangtze, River Delta and the Pearl River Delta. Int. J. Appl. Earth Obs. 2014, 30, 42–55. [Google Scholar] [CrossRef]
- Hopkins, L.D. Methods for generating land suitability maps: A comparative evaluation. J. Am. Inst. Plan. 1977, 43, 386–400. [Google Scholar] [CrossRef]
- Collins, M.G.; Steiner, F.R.; Rushman, M.J. Land-use suitability analysis in the United States: Historical development and promising technological achievements. Environ. Manag. 2001, 28, 611–621. [Google Scholar] [CrossRef] [PubMed]
- Malczewski, J. GIS-based land-use suitability analysis: A critical overview. Prog. Plan. 2004, 62, 3–65. [Google Scholar] [CrossRef]
- Klosterman, R.E. The what if? Collaborative planning support system. Environ. Plan. B 1999, 26, 393–408. [Google Scholar] [CrossRef]
- Burian, J.; Stastny, S.; Brus, J.; Pechanec, V.; Vozenilek, V. Urban Planner: Model for optimal land use scenario modelling. Geografie 2015, 120, 330–353. [Google Scholar]
- Zhang, J.; Su, Y.; Wu, J.; Liang, H. GIS based land suitability assessment for tobacco production using AHP and fuzzy set in Shandong province of China. Comput. Electron. Agric. 2015, 114, 202–211. [Google Scholar] [CrossRef]
- Zabihi, H.; Ahmad, A.; Vogeler, I.; Said, M.; Golmohammadi, M.; Golein, B.; Nilashi, M. Land suitability procedure for sustainable citrus planning using the application of the analytical network process approach and GIS. Comput. Electron. Agric. 2015, 117, 114–126. [Google Scholar] [CrossRef]
- Yan, B.; Shi, W.; Yan, J.; Chun, K. Spatial distribution of livestock and poultry farm based on livestock manure nitrogen load on farmland and suitability evaluation. Comput. Electron. Agric. 2017, 139, 180–186. [Google Scholar] [CrossRef]
- Díaz, I.; Mello, A.L.; Salhi, M.; Spinetti, M.; Bessonart, M. Multiscalar land suitability assessment for aquaculture production in Uruguay. Aquac. Res. 2017, 48, 3052–3065. [Google Scholar] [CrossRef]
- Bello-Pineda, J.; Ponce-Hernández, R.; Liceaga-Correa, M.A. Incorporating GIS and MCE for suitability assessment modelling of coral reef resources. Environ. Monit. Assess. 2006, 114, 225–256. [Google Scholar] [CrossRef] [PubMed]
- Reshmidevi, T.V.; Eldho, T.I.; Jana, R. A GIS-integrated fuzzy rule-based inference system for land suitability evaluation in agricultural watersheds. Agric. Syst. 2009, 101, 101–109. [Google Scholar] [CrossRef]
- Halder, J.C. Land suitability assessment for crop cultivation by using remote sensing and GIS. J. Geogr. Geol. 2013, 5, 65. [Google Scholar] [CrossRef]
- Sarkar, S.; Dyer, J.S.; Margules, C.; Ciarleglio, M.; Kemp, N.; Wong, G.; Juhn, D.; Supriatna, J. Developing an objectives hierarchy for multicriteria decisions on land use options, with a case study of biodiversity conservation and forestry production from Papua, Indonesia. Environ. Plan. B 2017, 44, 464–485. [Google Scholar] [CrossRef]
- Fan, C.; Shen, S.; Wang, S.; She, G.; Wang, X. Research on urban land ecological suitability evaluation based on gravity-resistance model: A case of Deyang city in China. Procedia Eng. 2011, 21, 676–685. [Google Scholar]
- Liu, R.; Zhang, K.; Zhang, Z.; Borthwick, A. Land-use suitability analysis for urban development in Beijing. J. Environ. Manag. 2014, 145, 170–179. [Google Scholar] [CrossRef] [PubMed]
- Abdullahi, S.; Pradhan, B.; Mansor, S.; Shariff, A. GIS-based modeling for the spatial measurement and evaluation of mixed land use development for a compact city. Mapp. Sci. Remote Sens. 2015, 52, 18–39. [Google Scholar] [CrossRef]
- Mosadeghi, R.; Warnken, J.; Tomlinson, R.; Mirfenderesk, H. Comparison of Fuzzy-AHP and AHP in a spatial multi-criteria decision making model for urban land-use planning. Comput. Environ. Urban Syst. 2015, 49, 54–65. [Google Scholar] [CrossRef]
- Romano, G.; Dal Sasso, P.; Liuzzi, G.T.; Gentile, F. Multi-criteria decision analysis for land suitability mapping in a rural area of Southern Italy. Land Use Policy 2015, 48, 131–143. [Google Scholar] [CrossRef]
- Delgado, O.B.; Mendoza, M.; Granados, E.L.; Geneletti, D. Analysis of land suitability for the siting of inter-municipal landfills in the Cuitzeo Lake Basin, Mexico. Waste Manag. 2008, 28, 1137–1146. [Google Scholar] [CrossRef] [PubMed]
- Azizi, A.; Malekmohammadi, B.; Jafari, H.; Nasiri, H.; Parsa, V. Land suitability assessment for wind power plant site selection using ANP-DEMATEL in a GIS environment: Case study of Ardabil province, Iran. Environ. Monit. Assess. 2014, 186, 6695–6709. [Google Scholar] [CrossRef] [PubMed]
- Watson, J.J.W.; Hudson, M.D. Regional Scale wind farm and solar farm suitability assessment using GIS-assisted multi-criteria evaluation. Landsc. Urban Plan. 2015, 138, 20–31. [Google Scholar] [CrossRef]
- Bagdanavičiūtė, I.; Valiūnas, J. GIS-based land suitability analysis integrating multi-criteria evaluation for the allocation of potential pollution sources. Environ. Earth Sci. 2013, 68, 1797–1812. [Google Scholar] [CrossRef]
- Uy, P.D.; Nakagoshi, N. Application of land suitability analysis and landscape ecology to urban greenspace planning in Hanoi, Vietnam. Urban For. Urban Green. 2008, 7, 25–40. [Google Scholar] [CrossRef]
- Bonham-Carter, G.F. Geographic Information Systems for geoscientists-modeling with GIS. In Computer Methods in the Geoscientists; Elsevier Ltd.: Amsterdam, The Netherlands, 1994; Volume 13, p. 398. [Google Scholar]
- He, Y.; Chen, Y.; Yang, P.; Wu, W.; Yao, Y.; Li, Z. An overview and perspective of alien land suitability evaluation study based on GIS technology. Prog. Geogr. 2010, 28, 898–904. (In Chinese) [Google Scholar]
- Malczewski, J. Chapter 3: Introduction to multicriteria decision analysis. In GIS and Multicriteria Decision Analysis; John Wiley and Sons Ltd.: Hoboken, NJ, USA, 1999; pp. 65–91. [Google Scholar]
- Malczewski, J. On the use of weighted linear combination method in GIS: Common and best practice approaches. Trans. GIS 2000, 4, 5–22. [Google Scholar] [CrossRef]
- Akıncı, H.; Özalp, A.Y.; Turgut, B. Agricultural land use suitability analysis using GIS and AHP technique. Comput. Electron. Agric. 2013, 97, 71–82. [Google Scholar] [CrossRef]
- Chen, Y.; Yu, J.; Khan, S. Spatial sensitivity analysis of multi-criteria weights in GIS-based land suitability evaluation. Environ. Model. Softw. 2010, 25, 1582–1591. [Google Scholar] [CrossRef]
- Malczewski, J. A GIS-based approach to multiple criteria group decision-making. Int. J. Geogr. Inf. Sci. 1996, 10, 955–971. [Google Scholar] [CrossRef]
- Malczewski, J.; Chapman, T.; Flegel, C.; Walters, D.; Shrubsole, D.; Martin, H. GIS-multicriteria evaluation with ordered weighted averaging (OWA): Case study of developing watershed management strategies. Environ. Plan. A 2003, 35, 1769–1784. [Google Scholar] [CrossRef]
- Malczewski, J. Ordered weighted averaging with fuzzy quantifiers: GIS-based multicriteria evaluation for land-use suitability analysis. Int. J. Appl. Earth Obs. 2006, 8, 270–277. [Google Scholar] [CrossRef]
- Yu, K.J. Landscape ecological security patterns in biological conservation. Acta Ecol. Sin. 1999, 19, 8–15. (In Chinese) [Google Scholar]
- Kercher, J.R.; Axelrod, M.C. A Process Model of fire ecology and succession in a mixed-conifer forest. Ecology 1984, 65, 1725–1742. [Google Scholar] [CrossRef]
- Kong, F.; Yin, H.; Nakagoshi, N.; Zong, Y. Urban green space network development for biodiversity conservation: Identification based on graph theory and gravity modeling. Landsc. Urban Plan. 2010, 95, 16–27. [Google Scholar] [CrossRef]
- Li, W.; Chen, Q.; Cai, D.; Li, R. Determination of an appropriate ecological hydrograph for a rare fish species using an improved fish habitat suitability model introducing landscape ecology index. Ecol. Model. 2015, 311, 31–38. [Google Scholar] [CrossRef]
- Jordán, F.; Báldi, A.; Orci, K.M.; Racz, I.; Varga, Z. Characterizing the importance of habitat patches and corridors in maintaining the landscape connectivity of a Pholidoptera transsylvanica (Orthoptera) metapopulation. Landsc. Ecol. 2003, 18, 83–92. [Google Scholar] [CrossRef]
- Knaapen, J.P.; Scheffer, M.; Harms, B. Estimating habitat isolation in landscape planning. Landsc. Urban Plan. 1992, 23, 1–16. [Google Scholar] [CrossRef]
- Li, F.; Ye, Y.; Song, B.; Wang, R. Evaluation of urban suitable ecological land based on the minimum cumulative resistance model: A case study from Changzhou, China. Ecol. Model. 2015, 318, 194–203. [Google Scholar] [CrossRef]
- Dong, J.; Dai, W.; Shao, G.; Xu, J. Ecological network construction based on minimum cumulative resistance for the city of Nanjing, China. ISPRS Int. J. Geo-Inf. 2015, 4, 2045–2060. [Google Scholar] [CrossRef]
- Liu, G.; Liang, Y.; Cheng, Y.; Wang, H.; Yi, L. Security patterns and resistance surface model in urban development: Case study of Sanshui, China. J. Urban Plan. Dev. 2017, 143, 05017011. [Google Scholar] [CrossRef]
- Parks, S.A.; McKelvey, K.S.; Schwartz, M.K. Effects of weighting schemes on the identification of wildlife corridors generated with least-cost methods. Conserv. Biol. 2013, 27, 145–154. [Google Scholar] [CrossRef] [PubMed]
- Zhou, R.; Li, Y.; Hu, Y.; Su, H.; Wang, J. Spatiotemporal differentiation of construction land expansion in a typical town of south Jiangsu Province. Chin. J. Appl. Ecol. 2011, 22, 217–224. (In Chinese) [Google Scholar]
- Jining Statistical Bureau. Jining Statistical Yearbook; China Statistics Press: Beijing, China, 2015; pp. 37–40.
- Yin, D.; Qian, J.; Zhu, H. Living in the “Ghost City”: Media Discourses and the Negotiation of Home in Ordos, Inner Mongolia, China. Sustainability 2017, 9, 2029. [Google Scholar] [CrossRef]
- Mustafa, A.; Heppenstall, A.; Omrani, H.; Saadi, I.; Cools, M.; Teller, J. Modelling built-up expansion and densification with multinomial logistic regression, cellular automata and genetic algorithm. Comput. Environ. Urban Syst. 2018, 67, 147–156. [Google Scholar] [CrossRef]
- Li, G.; Sun, S.; Fang, C. The varying driving forces of urban expansion in China: Insights from a spatial-temporal analysis. Landsc. Urban Plan. 2018, 174, 63–77. [Google Scholar] [CrossRef]
- Vladica, R.; Marija, M.; Marina, N.; Jelena, B. Land-use evaluation for sustainable construction in a protected area: A case of Sara mountain national park. J. Environ. Manag. 2018, 206, 430–445. [Google Scholar]
- Saaty, T.L. The Analytic Hierarchy Process: Planning, Priority Setting, Resource Allocation; McGraw-Hill International: New York, NY, USA, 1980. [Google Scholar]
- Zong, Y.; Wang, R.; Wang, C.; Wang, H.; Zhang, L. Ecological suitability assessment on land use based on potential-constrain approach: The case of urbanized areas in Dalian city, China. Geogr. Res. 2007, 26, 1117–1127. (In Chinese) [Google Scholar]
- Adriaensen, F.; Chardon, J.P.; De Blust, G.; Swinnen, E.; Villalba, S.; Gulinck, H.; Matthysen, E. The application of “least-cost” modeling as a functional landscape model. Landsc. Urban Plan. 2003, 64, 233–247. [Google Scholar] [CrossRef]
- Martellozzo, F.; Amato, F.; Murgante, B.; Clarke, K. Modelling the impact of urban growth on agriculture and natural land in Italy to 2030. Appl. Geogr. 2018, 91, 156–167. [Google Scholar] [CrossRef]
- Xu, K.; Kong, C.; Li, J.; Zhang, L. GEO-environmental suitability evaluation of land for urban construction based on a back-propagation neural network and GIS: A case study of Hangzhou. Phys. Geogr. 2012, 33, 457–472. [Google Scholar] [CrossRef]
- Ye, Y.; Su, Y.; Zhang, H.; Liu, K.; Wu, Q. Construction of an ecological resistance surface model and its application in urban expansion simulations. J. Geogr. Sci. 2015, 25, 211–224. [Google Scholar] [CrossRef]
- Kursah, M.B. Least-cost pipeline using geographic information system: The limit to technicalities. Int. J. Appl. Geospat. Res. 2017, 8, 1–15. [Google Scholar] [CrossRef]
- ESRI (Environmental Systems Research Institute). Cell-Based Modeling with Grid; Environmental Systems Research Institute Inc.: Redlands, CA, USA, 1994. [Google Scholar]
- Li, Q.; Huang, J.; Wang, C.; Lin, H.; Zhang, J.; Jiang, J.; Wang, B. Land Development Suitability Evaluation of Pingtan Island Based on Scenario Analysis and Landscape Ecological Quality Evaluation. Sustainability 2017, 9, 1292. [Google Scholar] [CrossRef]
- Yu, K.J.; Duan, T.W.; Li, D.H.; Peng, J.F. Landscape accessibility as a measurement of the function of urban green system. City Plan. Rev. 1999, 8, 8–44. (In Chinese) [Google Scholar]
- Jin, X.; Long, Y.; Sun, W.; Lu, Y.; Yang, X.; Tang, J. Evaluating cities’ vitality and identifying ghost cities in China with emerging geographical data. Cities 2017, 63, 98–109. [Google Scholar] [CrossRef]
- Saatsaz, M.; Monsef, I.; Rahmani, M.; Ghods, A. Site suitability evaluation of an old operating landfill using AHP and GIS techniques and integrated hydrogeological and geophysical surveys. Environ. Monit. Assess. 2018, 190, 144. [Google Scholar] [CrossRef] [PubMed]
- Firman, T. New town development in Jakarta Metropolitan Region: A perspective of spatial segregation. Habitat Int. 2004, 28, 349–368. [Google Scholar] [CrossRef]
- Hui, E.; Lam, M. A study of commuting patterns of new town residents in Hong Kong. Habitat Int. 2005, 29, 421–437. [Google Scholar] [CrossRef]
- Desponds, D.; Auclair, E. The new towns around Paris 40 years later: New dynamic centralities or suburbs facing risk of marginalisation? Urban Stud. 2017, 54, 107–134. [Google Scholar] [CrossRef]
- Qiu, L.; Zhu, J.; Pan, Y.; Hu, W.; Amable, G. Multi-criteria land use suitability analysis for livestock development planning in Hangzhou metropolitan area, China. J. Clean. Prod. 2017, 161, 1011–1019. [Google Scholar] [CrossRef]
- Hamid, M.; Mohammad, S. An Agent-Based Modeling approach for sustainable urban planning from land use and public transit perspectives. Cities 2018, 3, 1–10. [Google Scholar]
- Zeynel, A.; Mehmet, A.; Hicert, G. Determining strategies for the cadastre 2034 vision using an AHP-Based SWOT analysis: A case study for the turkish cadastral and land administration system. Land Use Policy 2017, 67, 151–166. [Google Scholar]
- Lu, Y.; Xu, H.; Wang, Y.; Yang, Y. Evaluation of water environmental carrying capacity of city in Huaihe River Basin based on the AHP method: A case in Huai’an City. Water Resour. Ind. 2017, 18, 71–77. [Google Scholar] [CrossRef]
- Kalogirou, S. Expert systems and GIS: An application of land suitability evaluation. Comput. Environ. Urban 2002, 26, 89–112. [Google Scholar] [CrossRef]
Figure 1.
Location of the study area.

Figure 2.
Flowchart of the research methodology.

Figure 3.
Analysis of the urban development and construction potential.

Figure 4.
Analysis of urban development and construction resistance in the study area—(a) sensitivity of topography; (b) sensitivity of D_MR; (c) sensitivity of BF; (d) sensitivity of CR; (e) sensitivity of WP; (f) sensitivity of CM; (g) sensitivity of CS; and (h) comprehensive ecological sensitivity evaluation results (excluding basic farmland).

Figure 5.
Suitability analysis of urban construction land for vertical processes.

Figure 6.
Result of the comprehensive suitability evaluation in the study area.


Table 1.
Grades and dividing criteria for construction potential factors.
| Factors | Classification | Assigned Value (Xip) | |
|---|---|---|---|
| D_MR | National road | 0~66 m buffer zone | 0 |
| Provincial road | 0~66 m buffer zone | ||
| Railway | 0~55 m buffer zone | ||
| Urban main road | 0~50 m buffer zone | ||
| Distance to green belt of roads | 0~200 m | 9 | |
| 200~500 m | 7 | ||
| 500~1000 m | 5 | ||
| Greater than 1000 m | 1 | ||
| D_B | 0~1000 m | 9 | |
| 1000~2000 m | 7 | ||
| 2000~3000 m | 5 | ||
| Greater than 3000 m | 3 | ||
| LU | natural reserve areas | 0 | |
| woodland, wet land | 1 | ||
| garden plots | 3 | ||
| farmland | 5 | ||
| rural construction land, independent industrial and mining land | 7 | ||
| urban construction land | 9 | ||
Table 2.
The characteristics of experts.
| Experts’ ID | Majors or Research Interests | Affiliation |
|---|---|---|
| 1 | Environmental science | Fudan University |
| 2 | Ecology | Fudan University |
| 3 | Geography | Shanghai Normal University |
| 4 | Ecology | Shanghai Normal University |
| 5 | Urban and rural planning | Urban planning and architectural design institute of Fudan University |
| 6 | Urban and rural planning | Urban planning and architectural design institute of Fudan University |
| 7 | Geography | Jining Urban and Rural Planning Bureau |
| 8 | Urban and rural planning | Jining Urban and Rural Planning Bureau |
| 9 | Land resource management | Jining Land and Resources Bureau |
| 10 | Environmental management | Jining Water Conservancy Bureau |
Table 3.
Grades and dividing criteria for ecological sensitivity factors.
| Factors | Classification | Assigned Value (Xir) | |
|---|---|---|---|
| Topography | Less than 32.5 m | 9 | |
| 32.5–34.2 m | 7 | ||
| 34.2–34.5 m | 5 | ||
| 34.5–36 m | 3 | ||
| Greater than 36 m | 1 | ||
| D_MR | Guangfu River | 0~150 m buffer zone | 0 |
| The Beijing-Hangzhou Grand Canal | 0~200 m buffer zone | ||
| Xiaobei Lake & Nansi Lake | 0~200 m buffer zone | ||
| Other rivers | 0~40 m buffer zone | ||
| Distance to green belt of water system | 0~100 m | 9 | |
| 100~200 m | 7 | ||
| 200~500 m | 5 | ||
| Greater than 500 m | 1 | ||
| CR | Areas with covered coal resources | 3 | |
| Other areas | 1 | ||
| CM | Current coal mining subsidence areas | 9999 | |
| Coal mining subsidence areas in 2020 (predicted) | 5 | ||
| Other areas | 1 | ||
| WP | Core area of ground-level and underground water source conservation area | 9999 | |
| Other areas | 1 | ||
| CS | Absolute protection coverage | 9 | |
| Construction control zone | 7 | ||
| Landscape coordination area | 5 | ||
| Other areas | 1 | ||
| BF | Basic farmland preservation zone | 9999 | |
| Other areas | 0 | ||
Table 4.
Area statistics of the comprehensive suitability evaluation.
| Land-Use Category | Suitability for Construction | Area (km2) | Proportion (%) |
|---|---|---|---|
| Construction-suitable land use | Priority areas | 158.75 | 16.55 |
| Suitable areas | 151.62 | 15.81 | |
| Ecologically suitable land use | Restricted areas | 123.57 | 12.89 |
| Prohibited areas | 524.94 | 54.75 |
© 2018 by the authors. Licensee MDPI, Basel, Switzerland. This article is an open access article distributed under the terms and conditions of the Creative Commons Attribution (CC BY) license (http://creativecommons.org/licenses/by/4.0/).
Share and Cite
MDPI and ACS Style
Yan, Y.; Zhou, R.; Ye, X.; Zhang, H.; Wang, X. Suitability Evaluation of Urban Construction Land Based on an Approach of Vertical-Horizontal Processes. ISPRS Int. J. Geo-Inf. 2018, 7, 198. https://doi.org/10.3390/ijgi7050198
AMA Style
Yan Y, Zhou R, Ye X, Zhang H, Wang X. Suitability Evaluation of Urban Construction Land Based on an Approach of Vertical-Horizontal Processes. ISPRS International Journal of Geo-Information. 2018; 7(5):198. https://doi.org/10.3390/ijgi7050198
Chicago/Turabian StyleYan, Yuetian, Rui Zhou, Xinyue Ye, Hao Zhang, and Xinjun Wang. 2018. "Suitability Evaluation of Urban Construction Land Based on an Approach of Vertical-Horizontal Processes" ISPRS International Journal of Geo-Information 7, no. 5: 198. https://doi.org/10.3390/ijgi7050198
Note that from the first issue of 2016, this journal uses article numbers instead of page numbers. See further details here.