Mapping Spatiotemporal Patterns and Multi-Perspective Analysis of the Surface Urban Heat Islands across 32 Major Cities in China


Abstract
:1. Introduction
2. Methodology
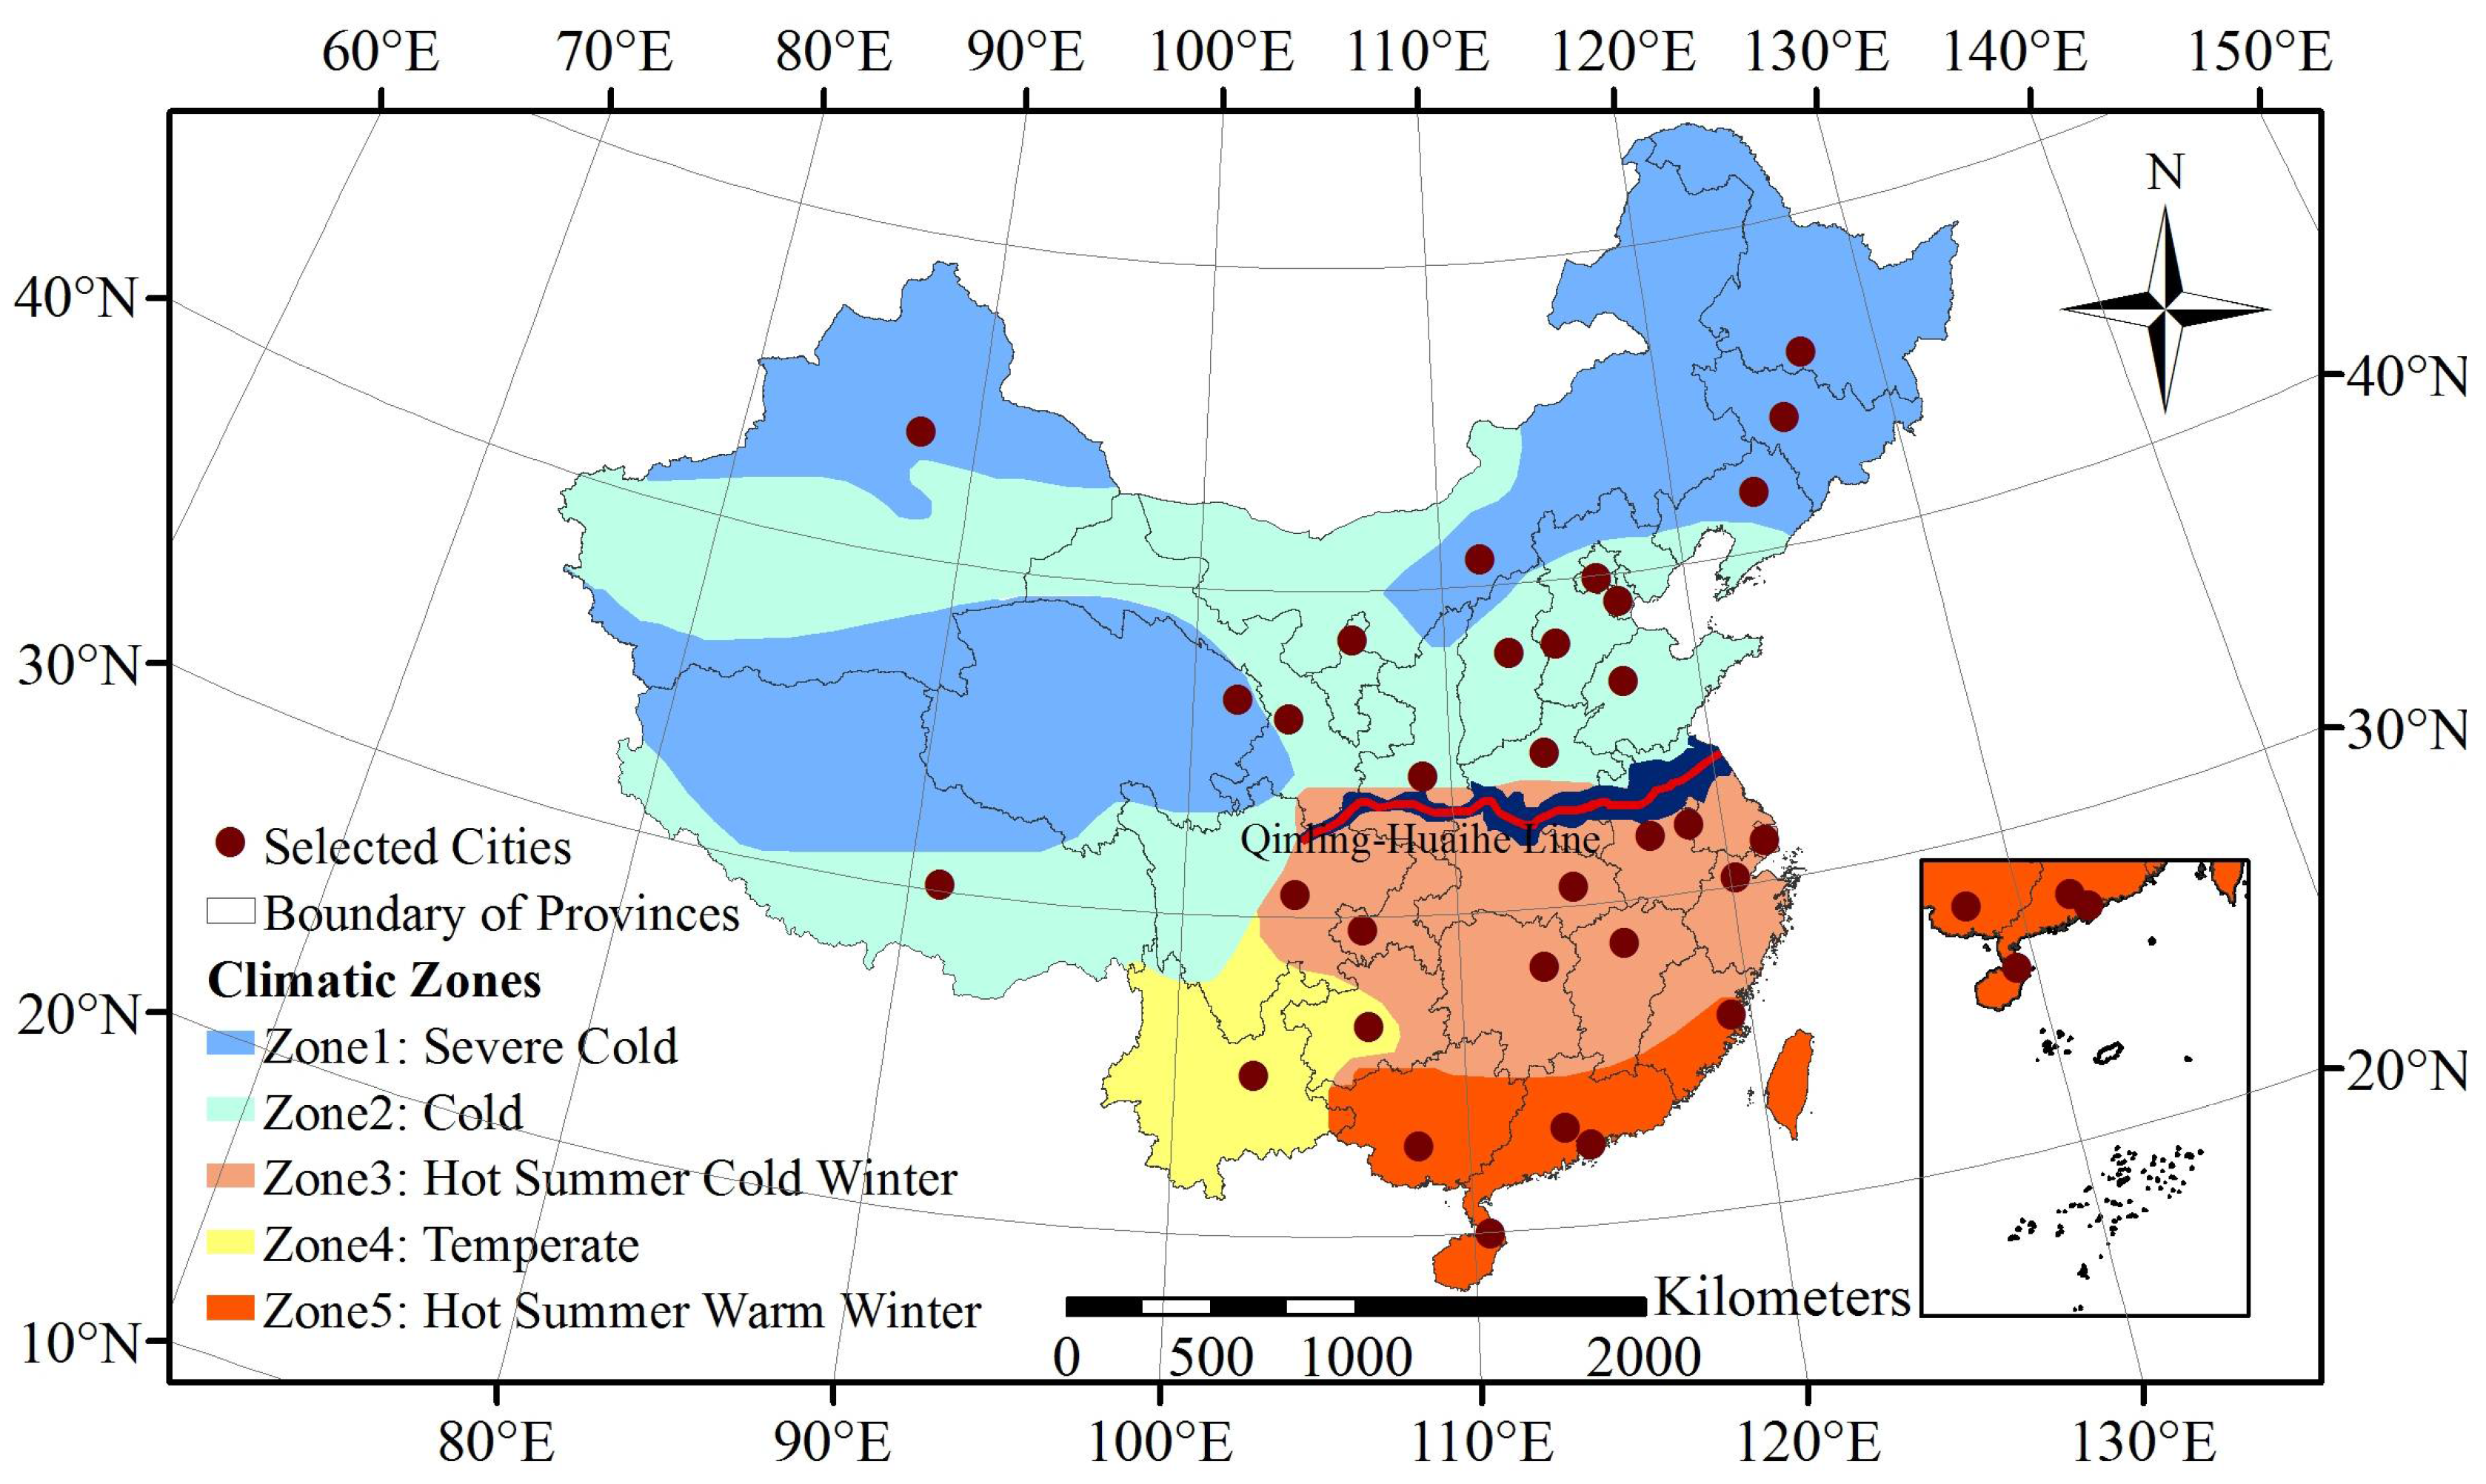
2.1. Study Area
2.2. Datasets and Methodology
2.2.1. Surface Urban Heat Island Intensity Calculation
LST Derivation
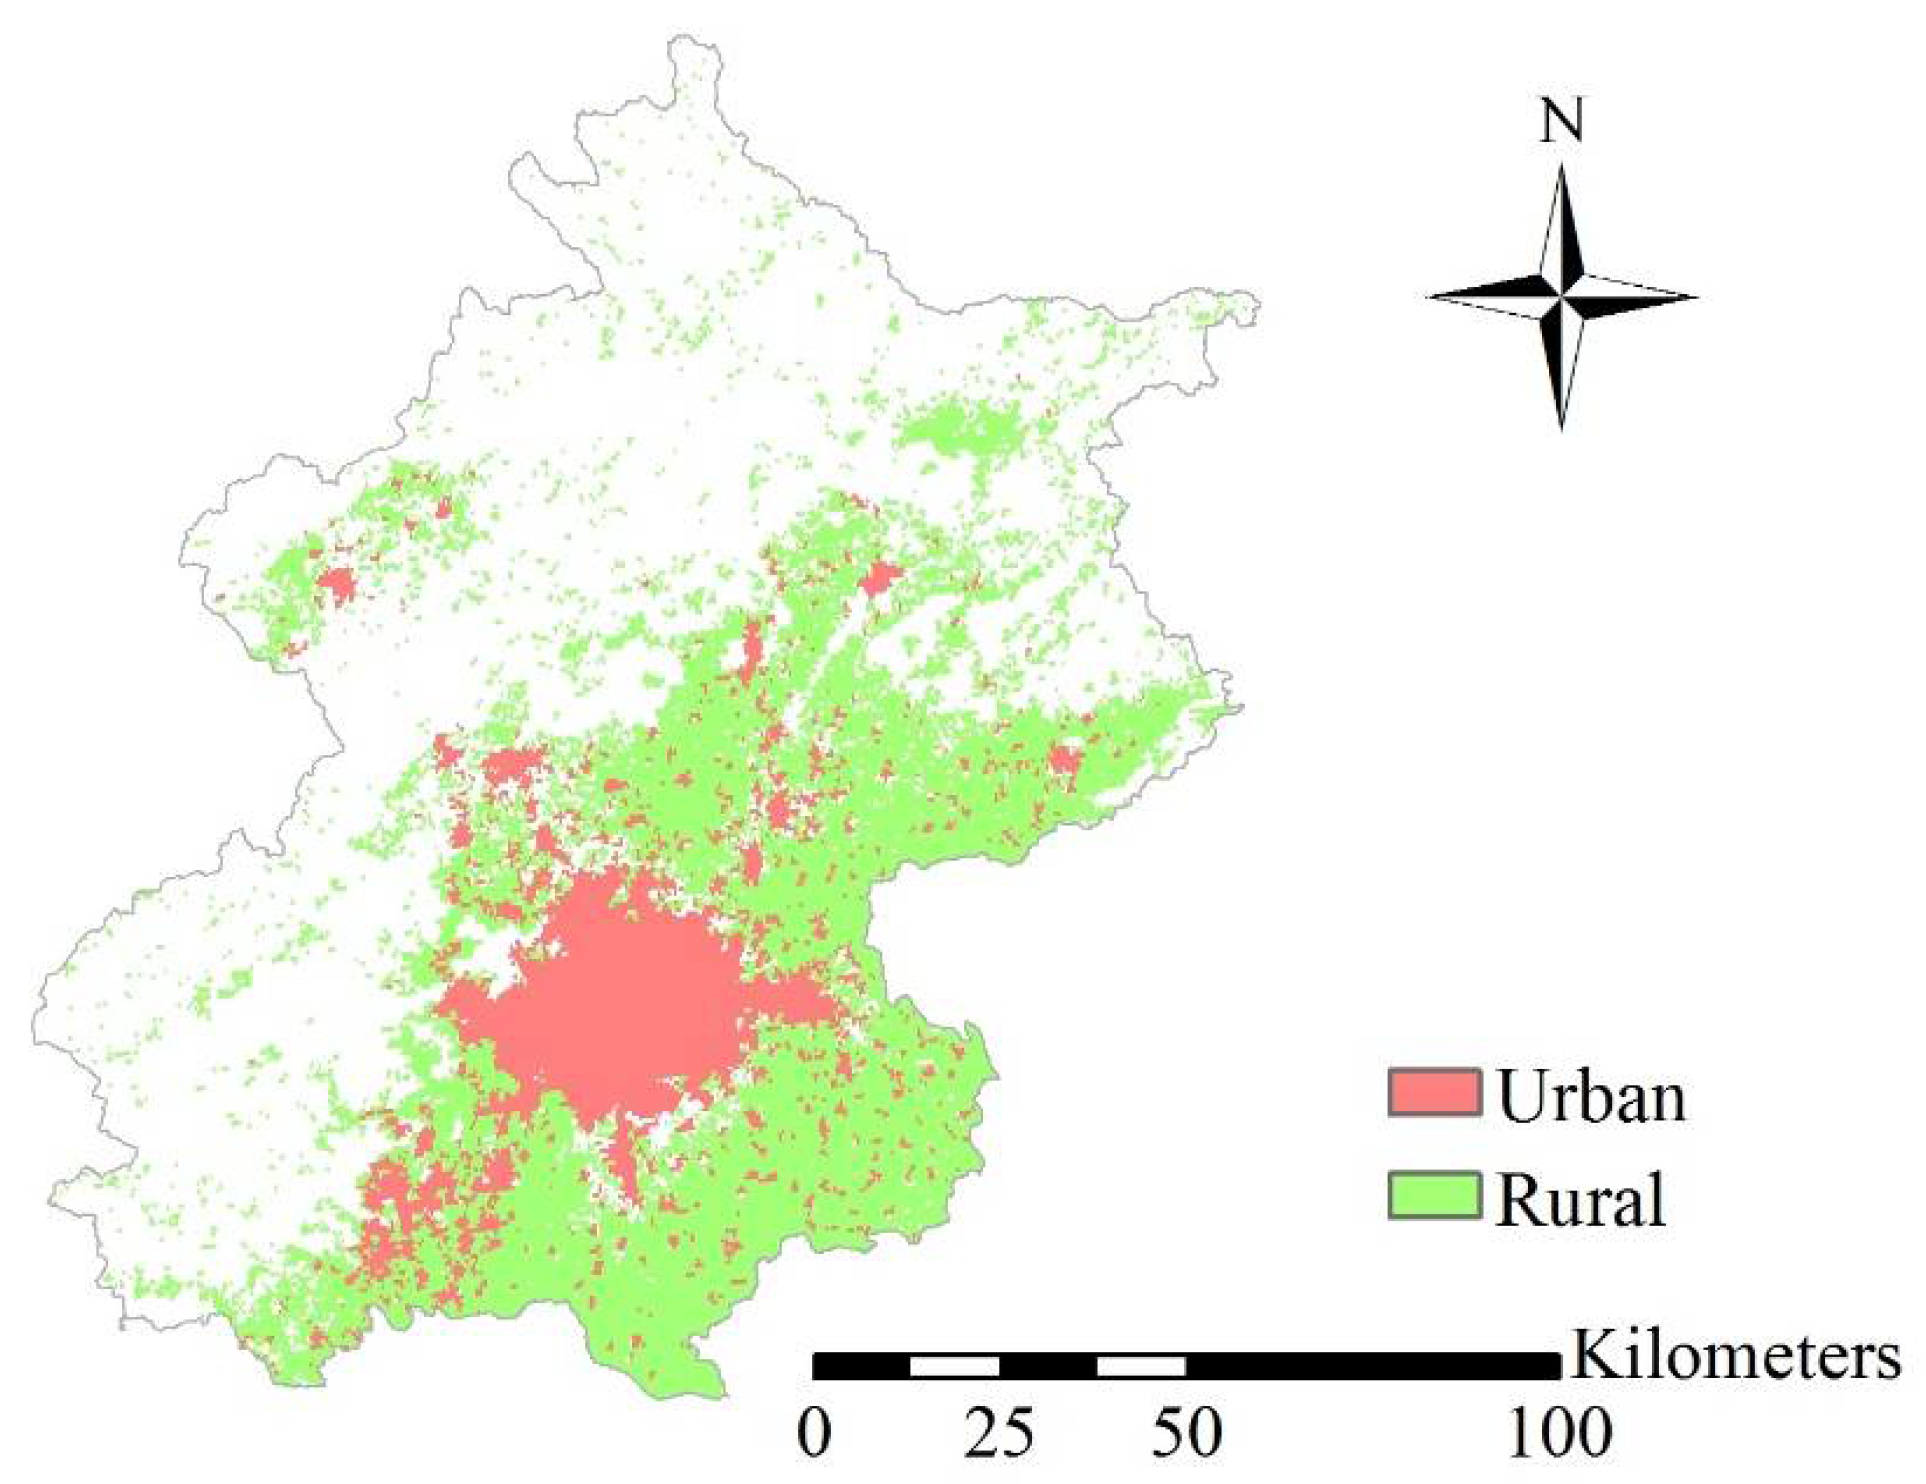
Urban and Rural Area Extraction
SUHII Calculation
2.2.2. Spatiotemporal Mapping and Multi-Perspective Analysis of the SUHIIs
SOM Model
Experiments in this Research
- (1)
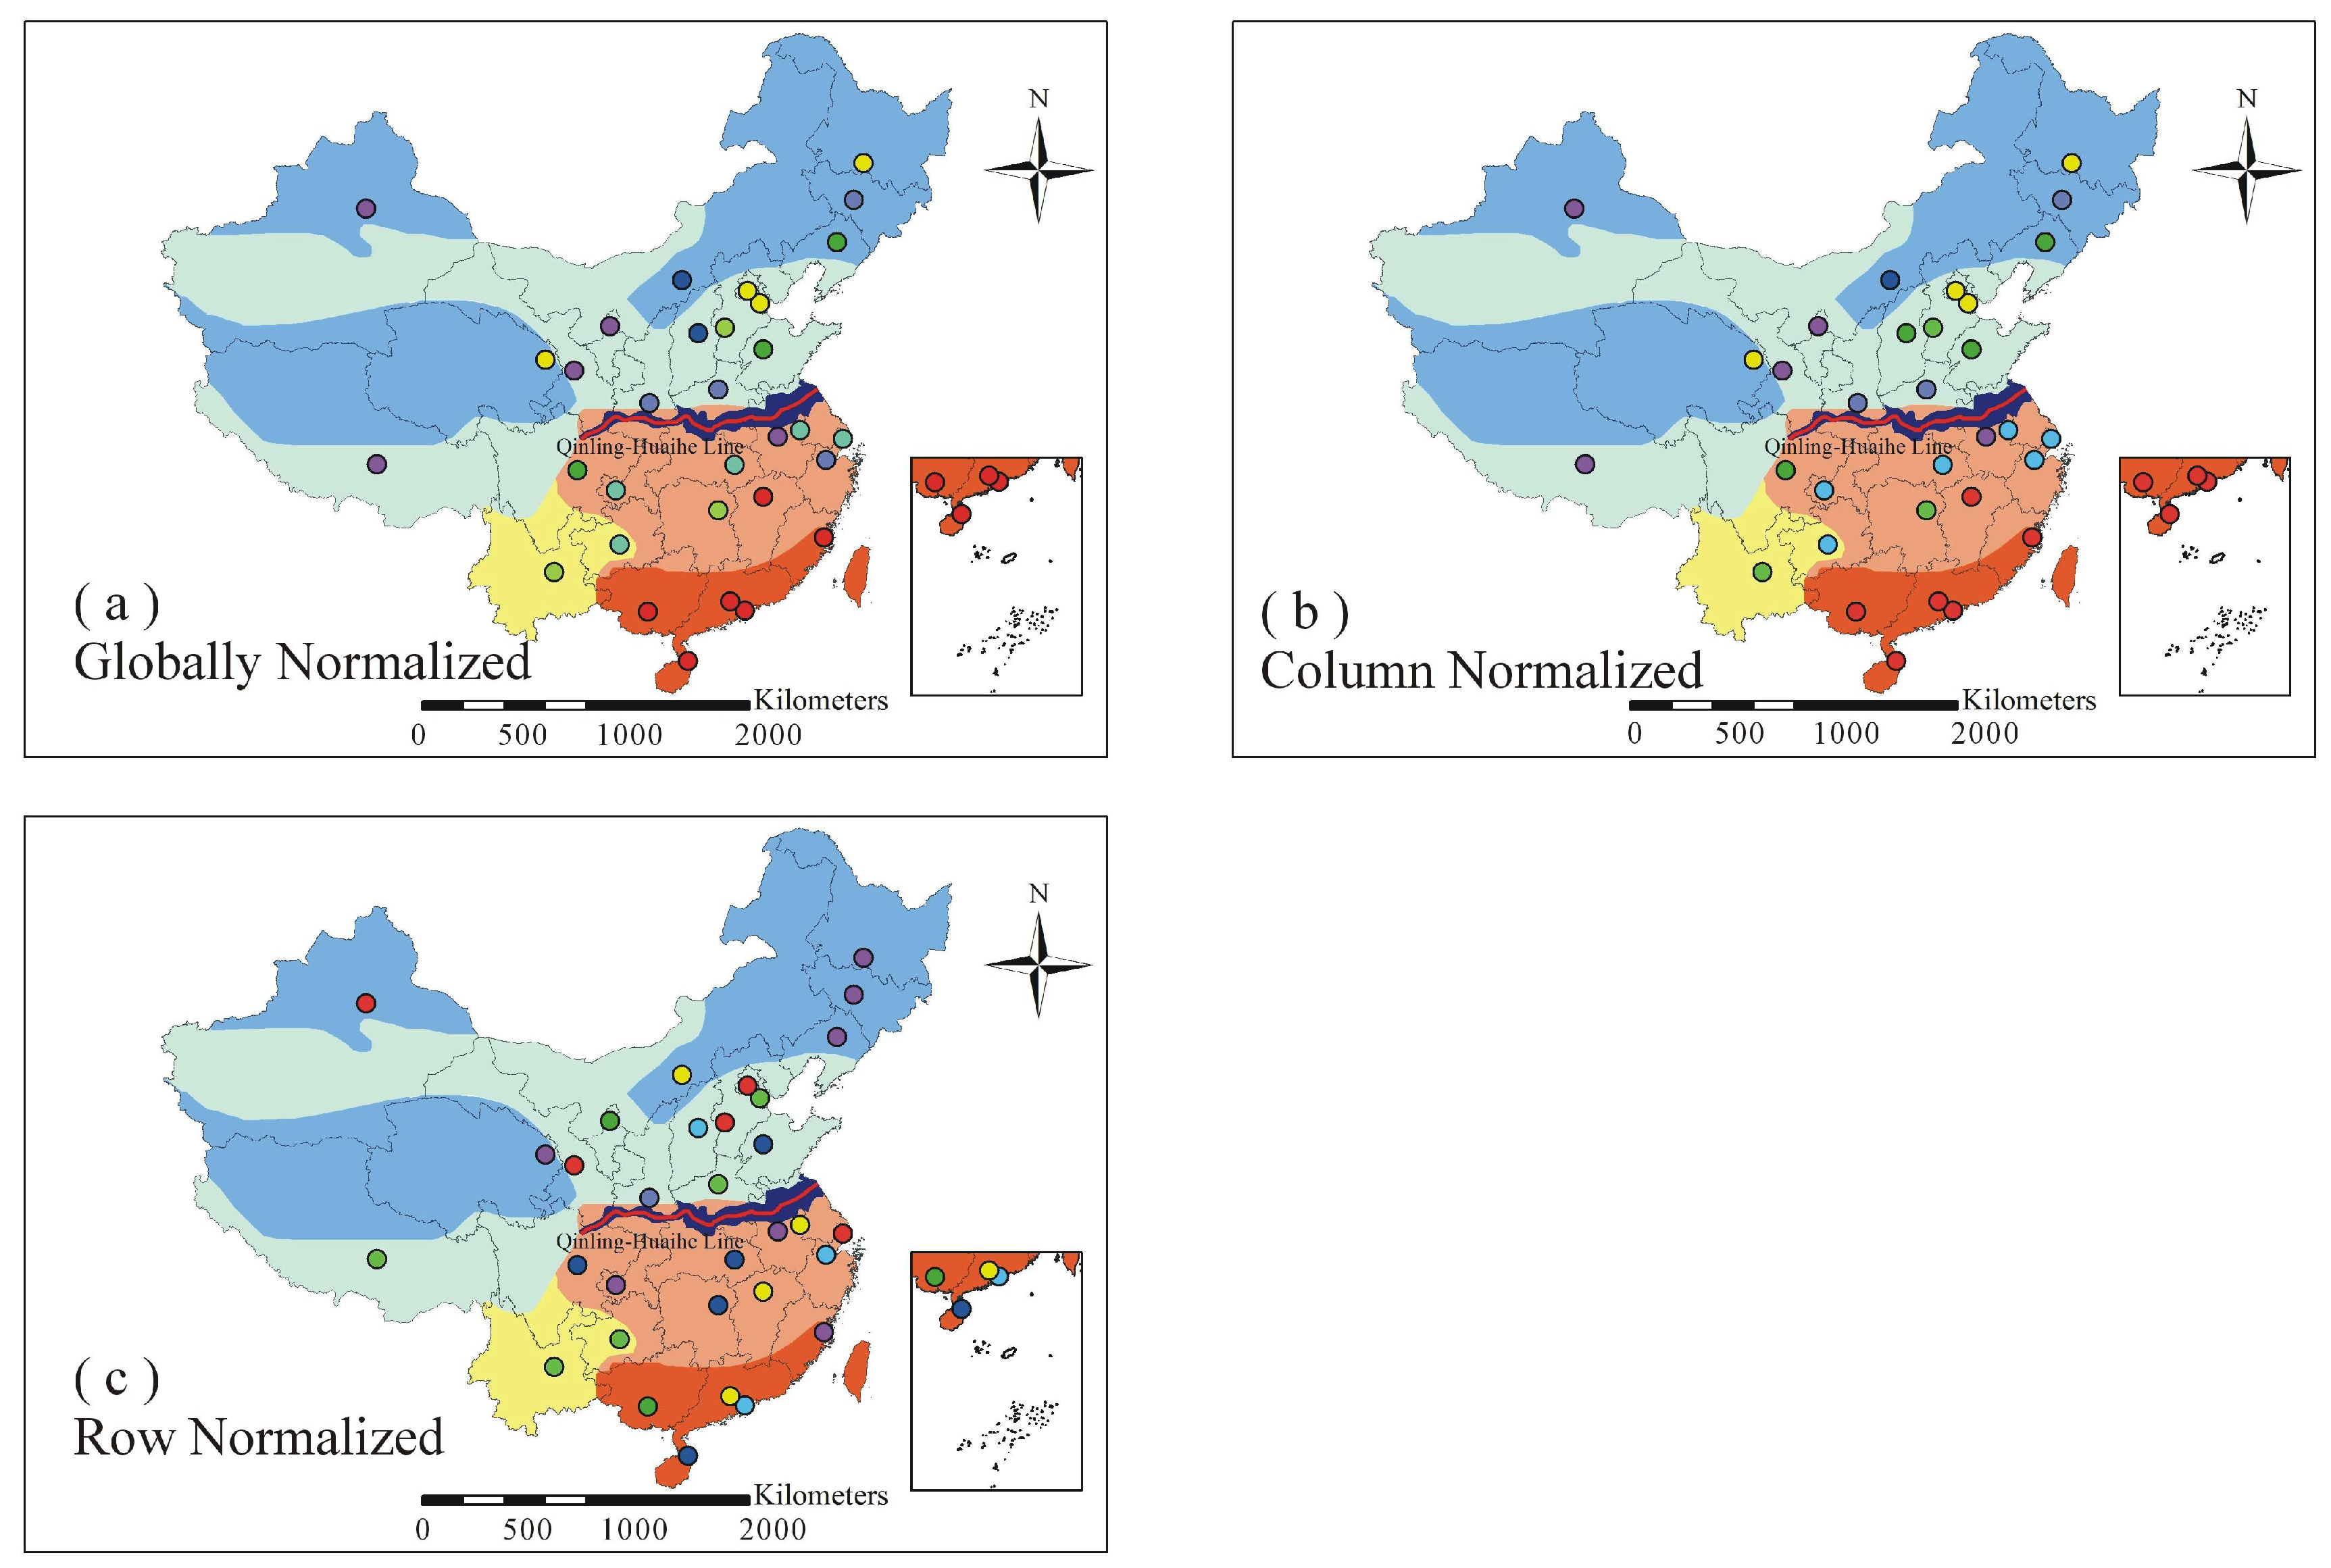
- Globally Normalized. All SUHII values were normalized to 0–1 in a single step, based on the smallest and largest value ever observed for any city and any time period. Clusters among cities observed in the visualization, as expressed by the same colors, is thus largely reflective of differences in the SUHIIs.
- (2)
- Column Normalized. Normalization occurred here in isolation for each time slice, based on minimum and maximum values for the respective slice. Assuming that the geographic distribution of relative SUHII at different times was relatively constant, in that the relative ranking of cities does not change despite changes in absolute magnitudes, similar patterns of cities were expected to be close to what is produced by global normalization.
- (3)
- Row Normalization. This is another form of normalization occurring within cities, that is, within rows of the input matrix. With the smallest and largest value ever observed for a particular city driving the normalization, this leads to the ability to more directly compare temporal SUHII signatures. For example, row normalization allows temporal alignment of local maxima and minima of different cities to be recognized despite differences in magnitude. Broad regional patterns affecting SUHII were expected to be highlighted using this approach, since regional causes may drive SUHII up or down in similar patterns.
3. Results and Discussion
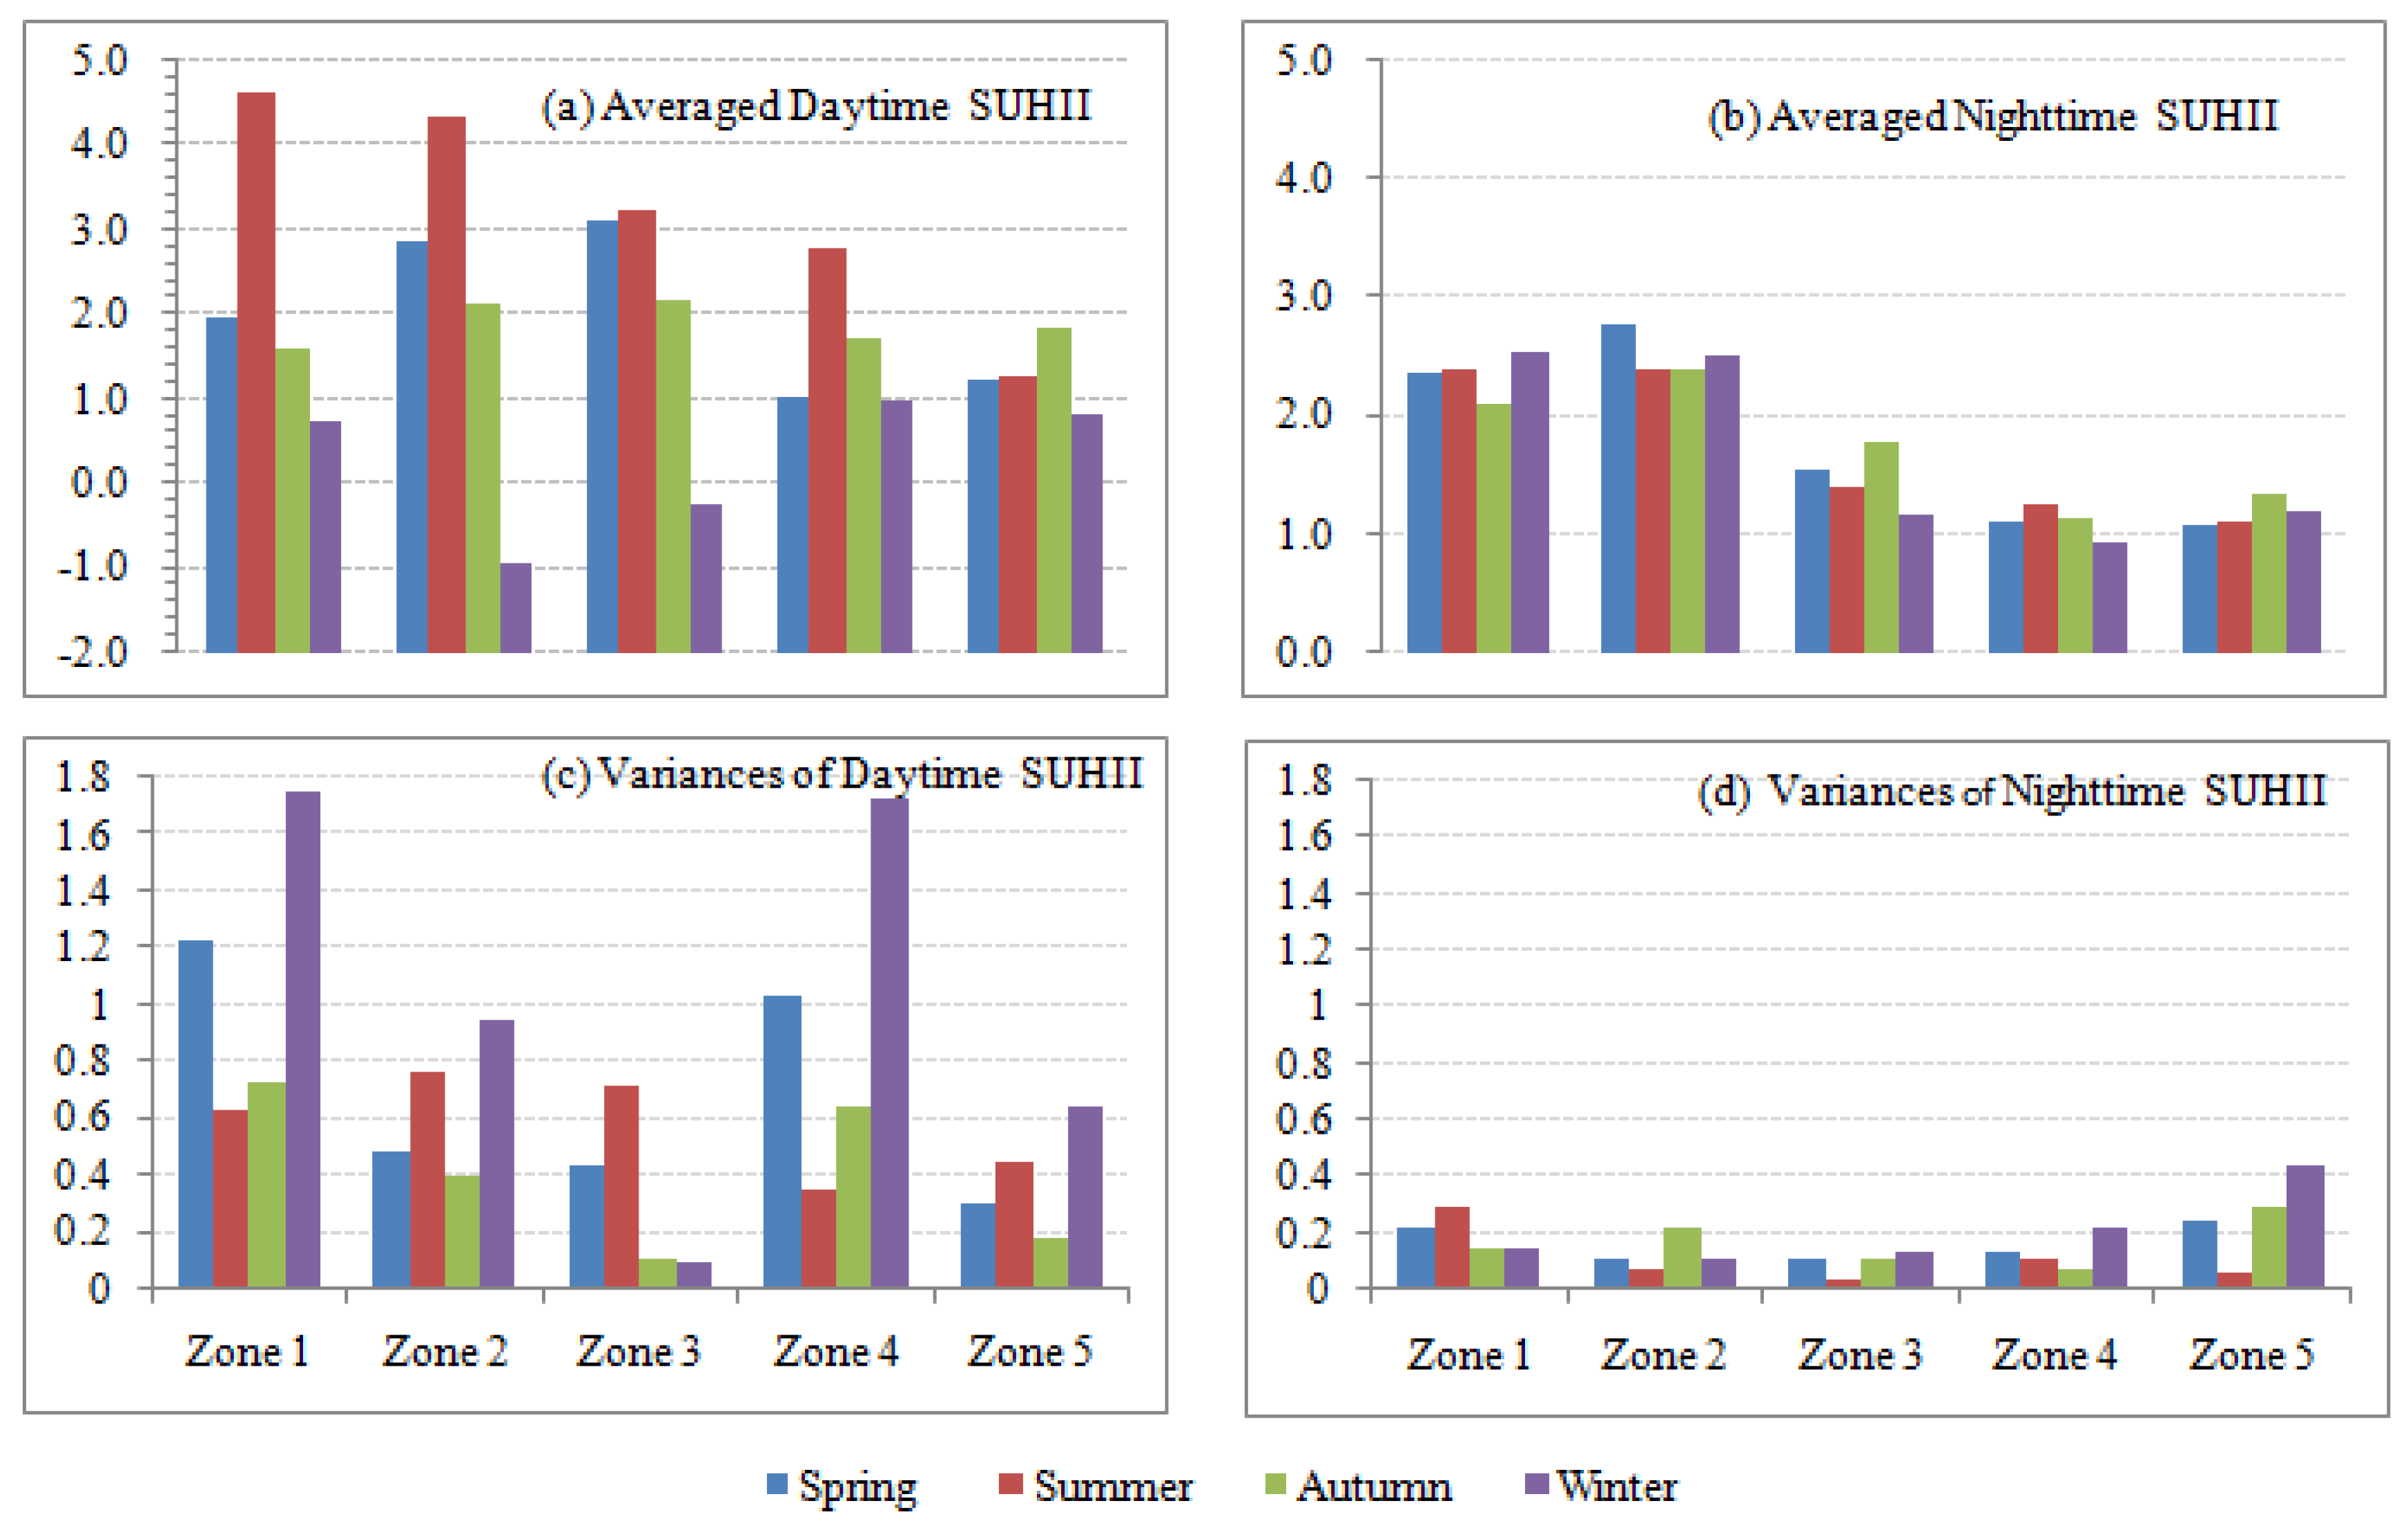
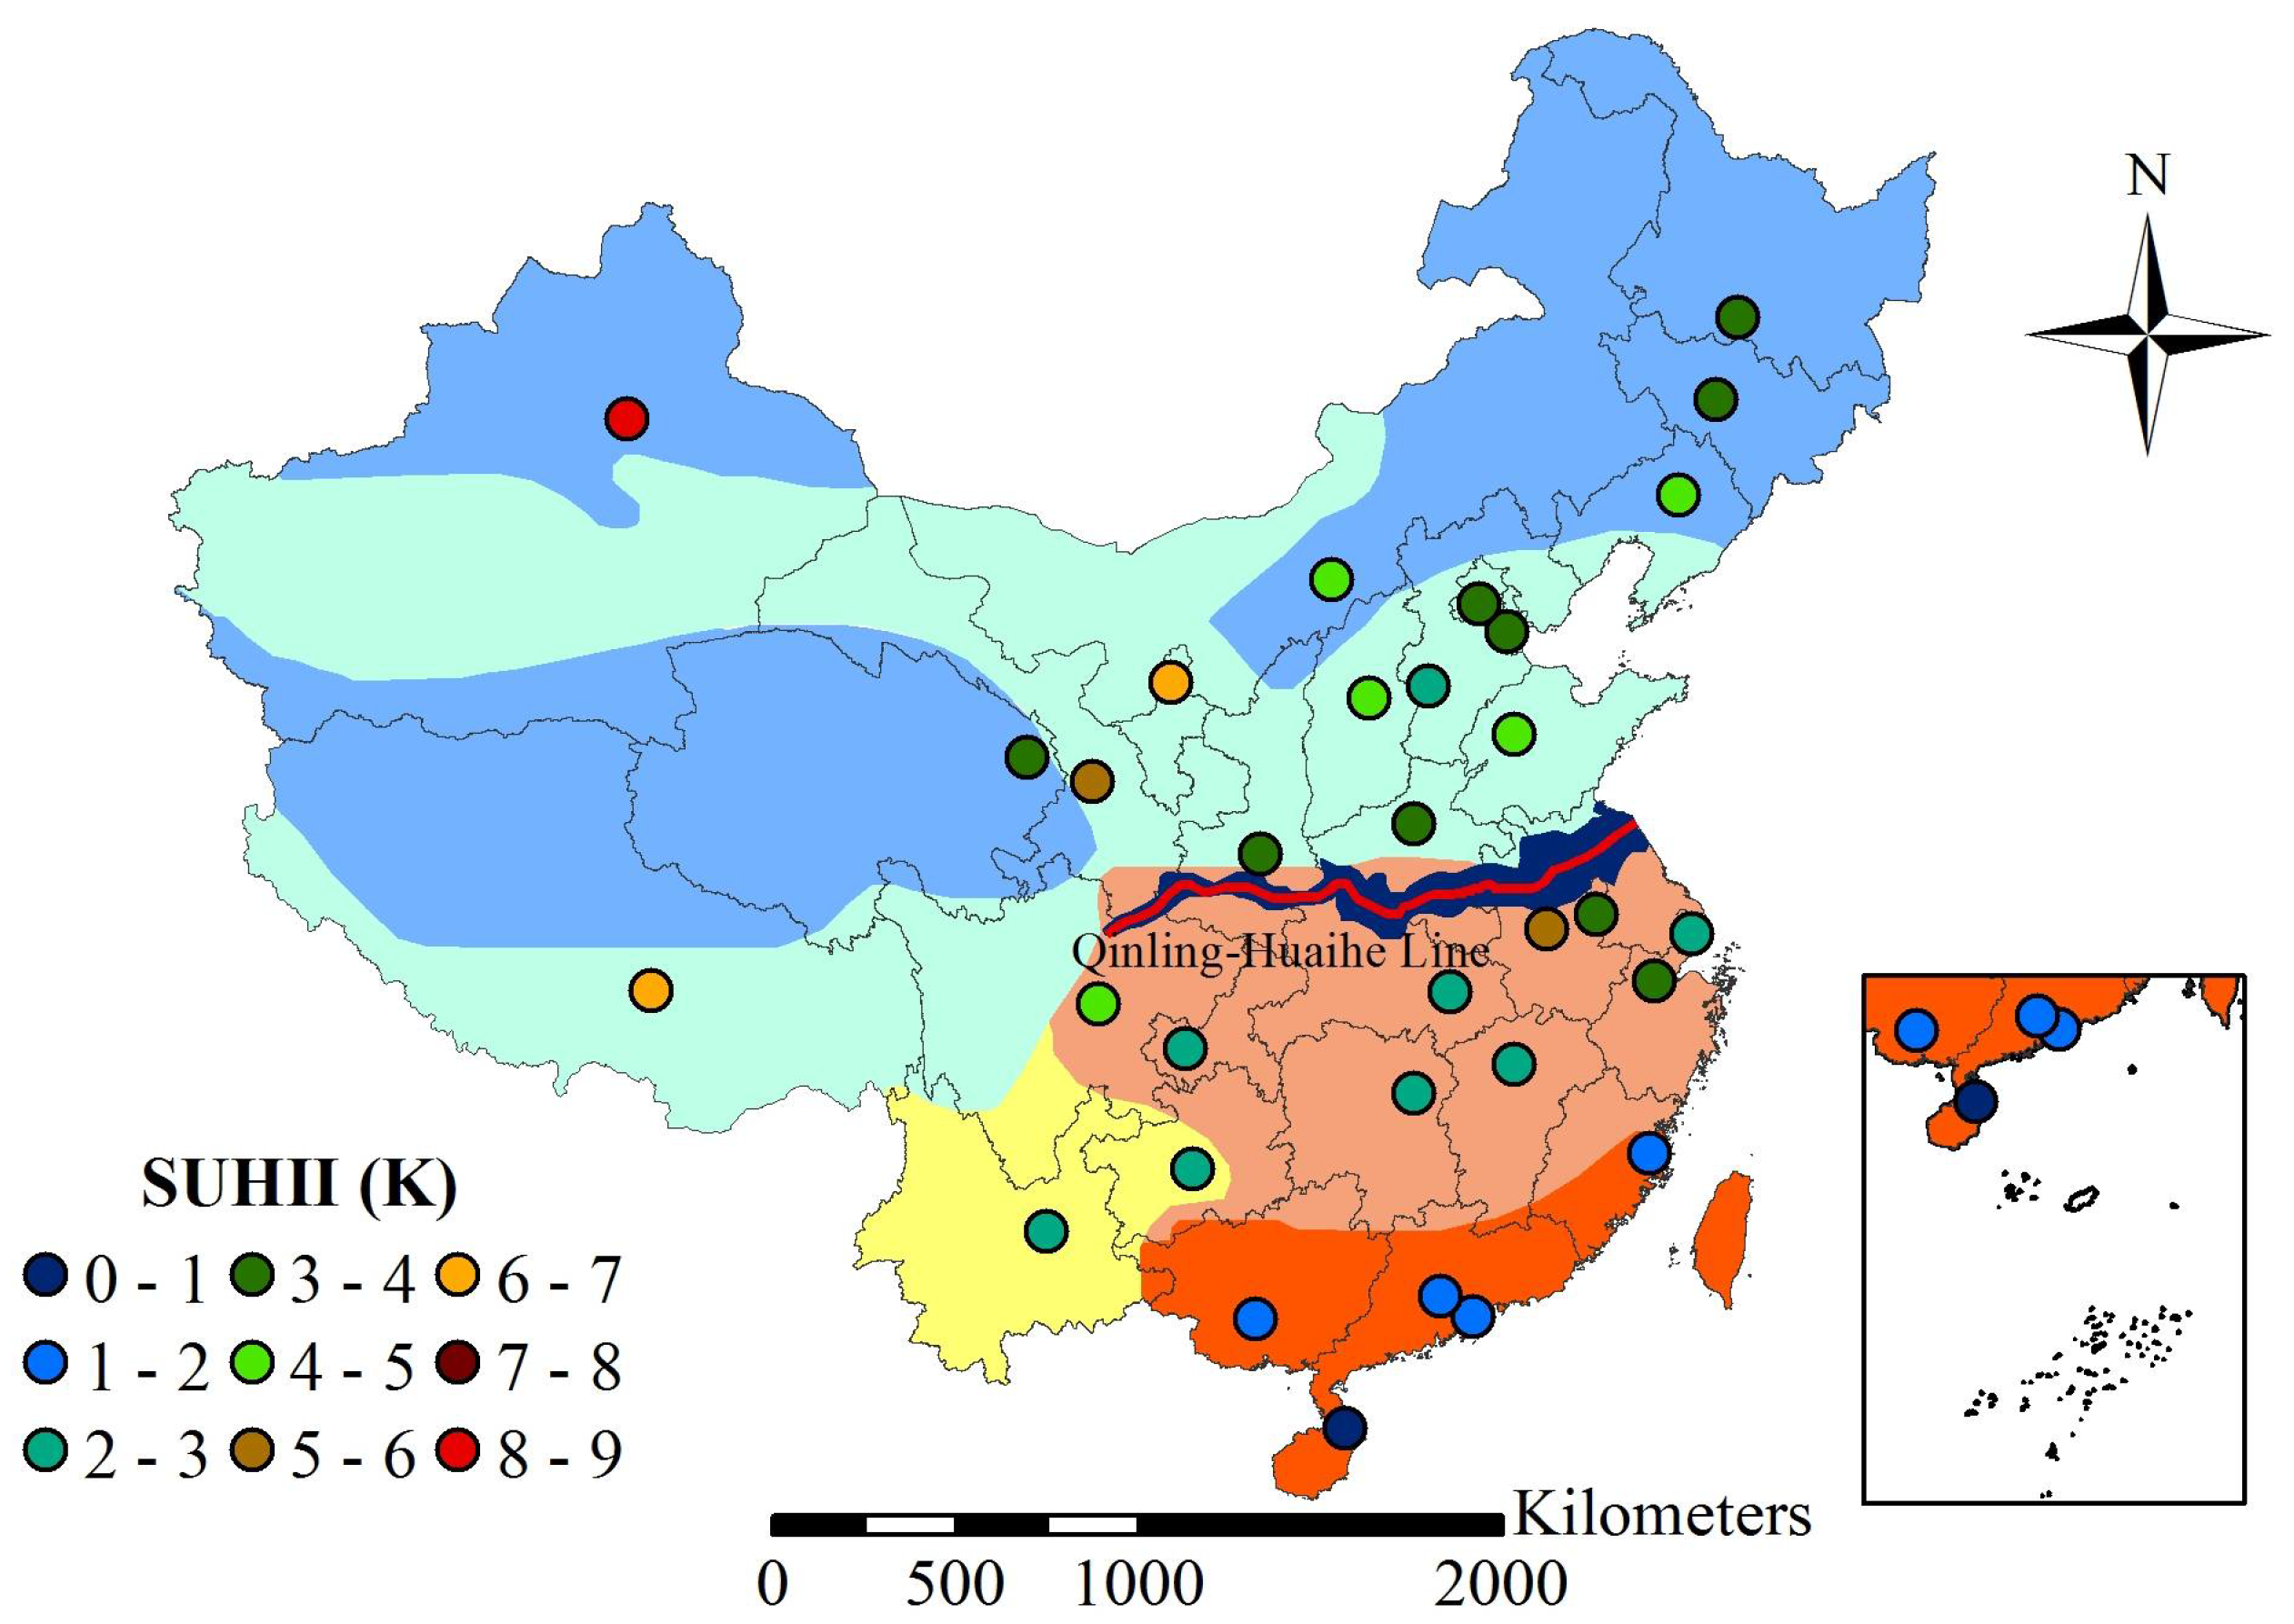
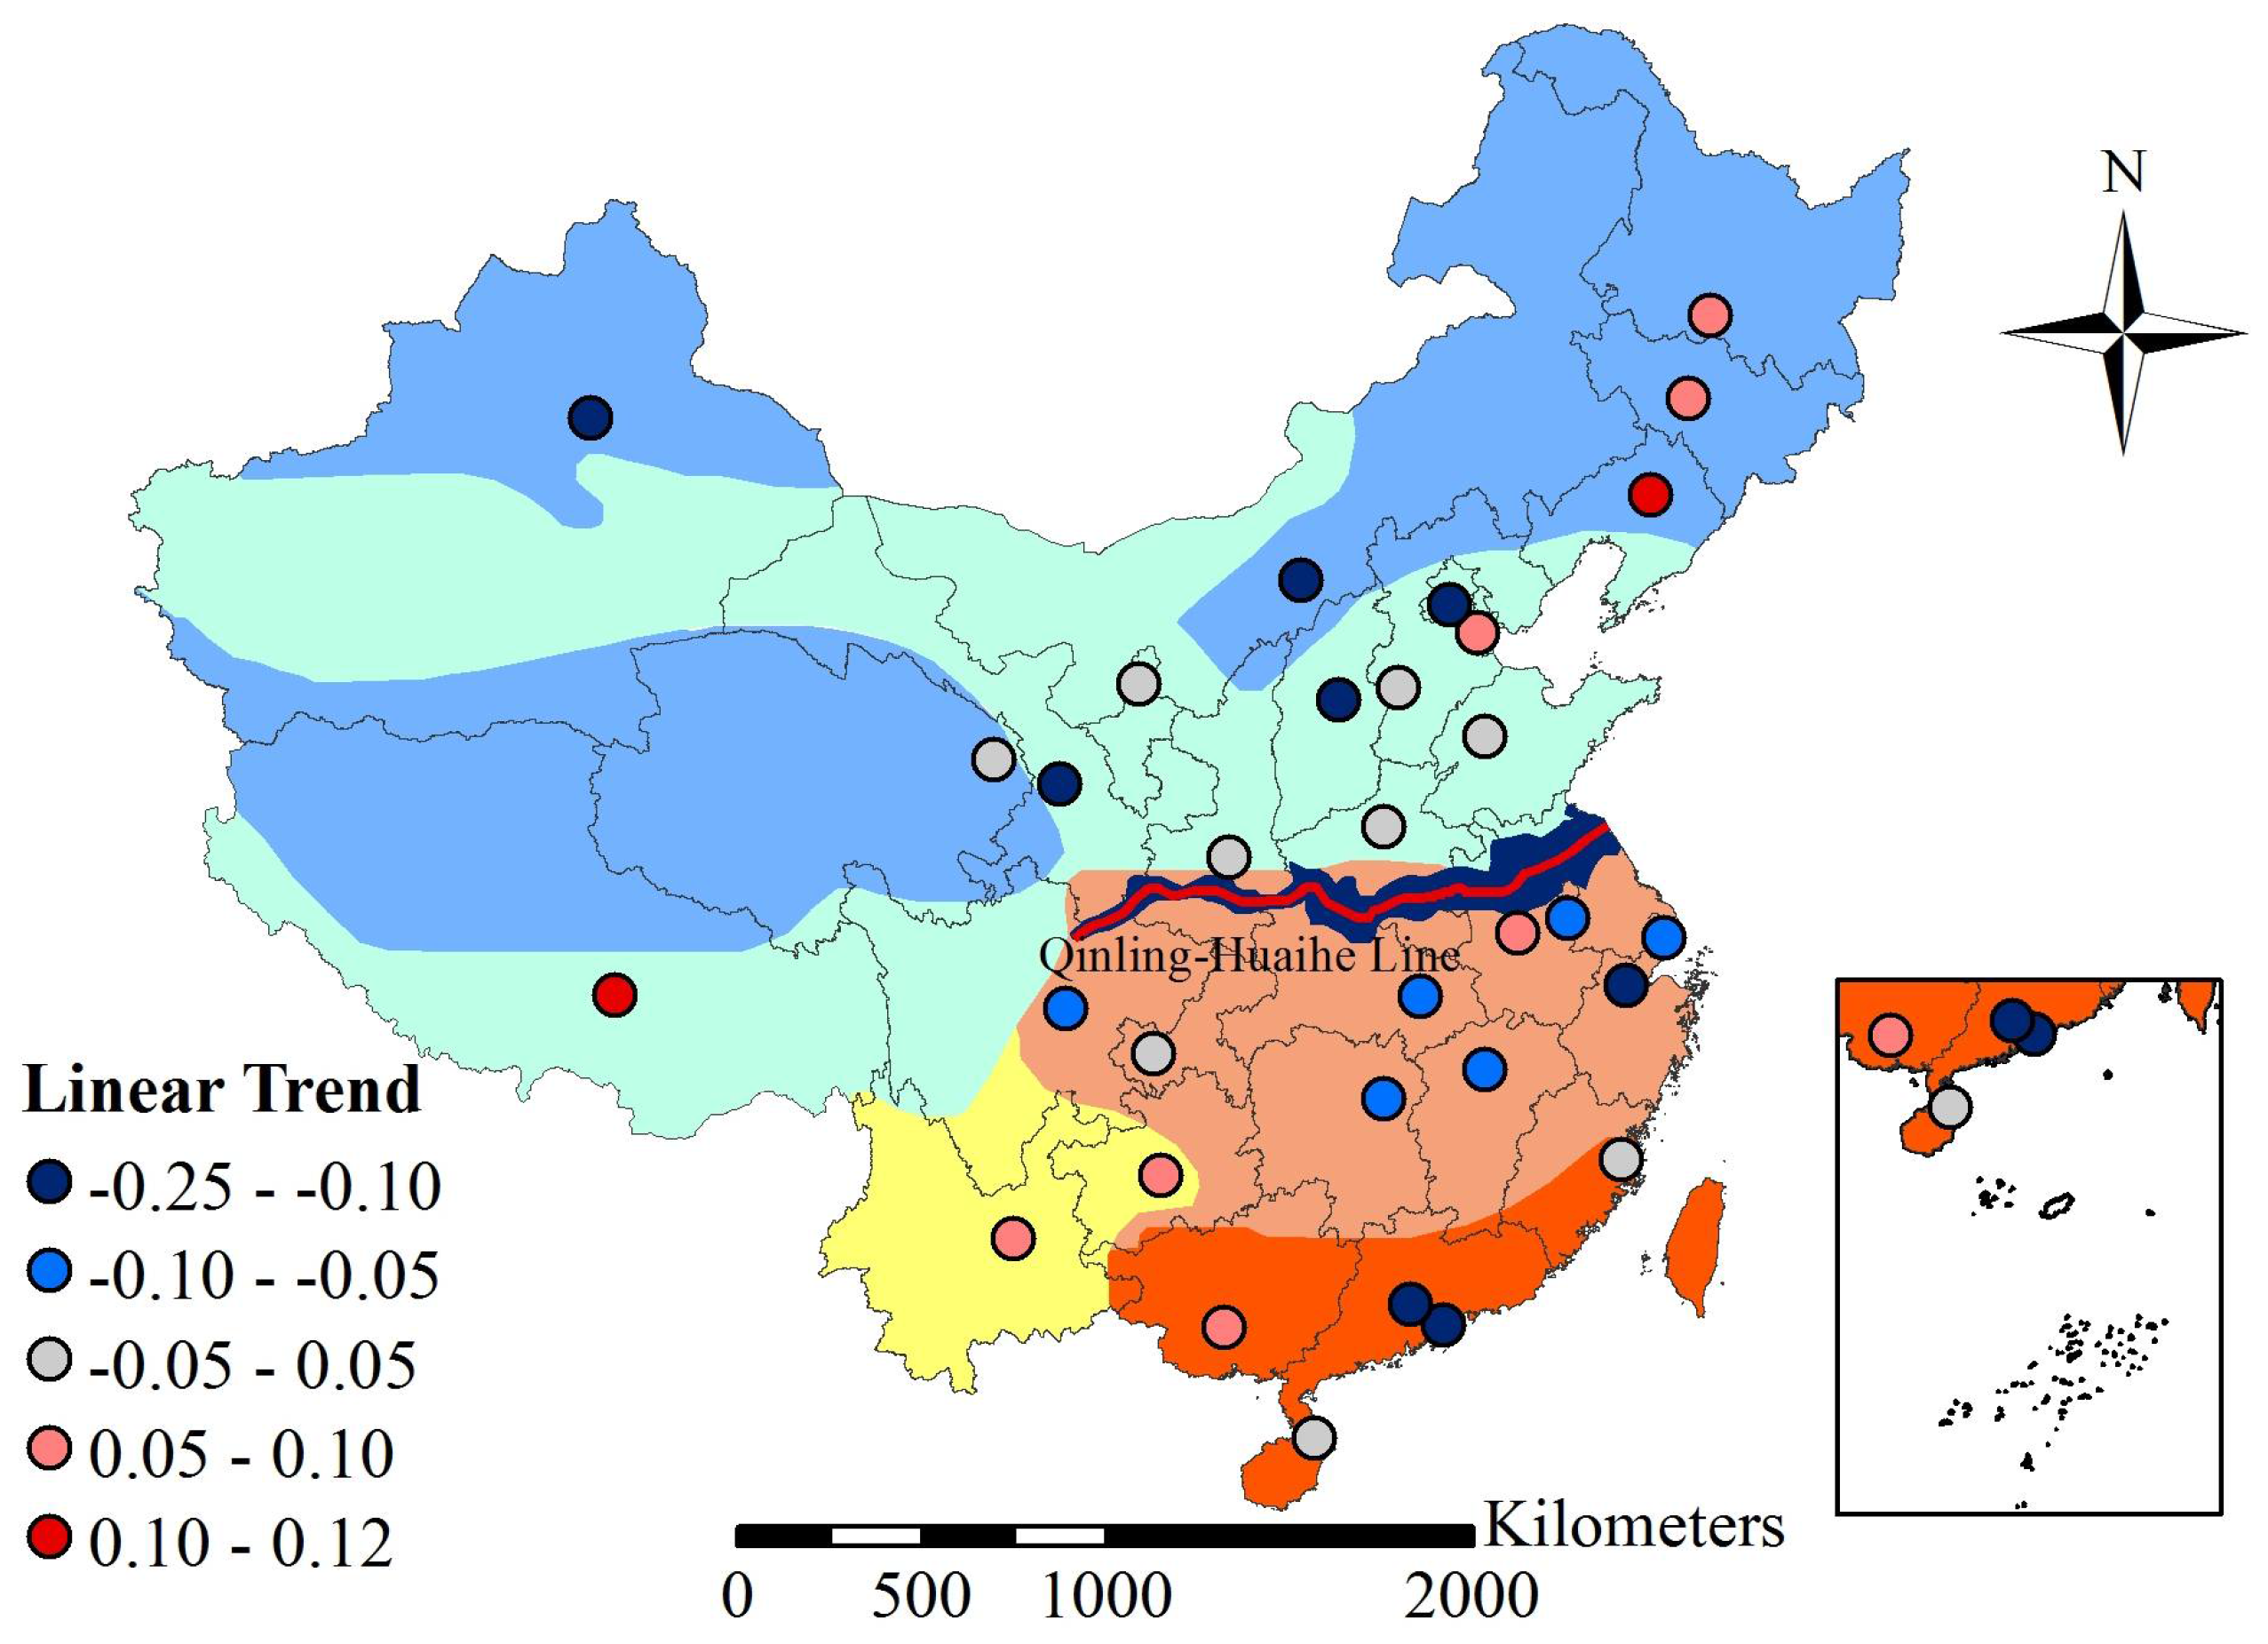
3.1. Spatiotemporal Variation of the SUHIIs
3.2. Spatiotemporal Mapping of the SUHIIs
3.3. Multi-Perspective Analysis of the SUHIIs Patterns
4. Conclusions
Author Contributions
Acknowledgments
Conflicts of Interest
References
- Grimm, N.B.; Faeth, S.H.; Golubiewski, N.E.; Redman, C.L.; Wu, J.G.; Bai, X.M.; Briggs, J.M. Global change and the ecology of cities. Science 2008, 319, 756–760. [Google Scholar] [CrossRef] [PubMed]
- Oke, T.R. The energetic basis of the urban heat island. Q. J. R. Meteorol. Soc. 1982, 108, 1–24. [Google Scholar] [CrossRef]
- Oke, T.R. City size and the urban heat island. Atmos. Environ. 1973, 7, 769–779. [Google Scholar] [CrossRef]
- Santamouris, M.; Papanikolaou, N.; Livada, I.; Koronakis, I.; Georgakis, C.; Argiriou, A.; Assimakopoulos, D.N. On the impact of urban climate on the energy consumption of buildings. Sol. Energy 2001, 70, 201–216. [Google Scholar] [CrossRef]
- Sarrat, C.; Lemonsu, A.; Masson, V.; Guedalia, D. Impact of urban heat island on regional atmospheric pollution. Atmos. Environ. 2006, 40, 1743–1758. [Google Scholar] [CrossRef]
- Epstein, P.R. Climate change and human health. N. Engl. J. Med. 2005, 353, 1433–1436. [Google Scholar] [CrossRef] [PubMed]
- Voogt, J.A.; Oke, T.R. Thermal remote sensing of urban climates. Remote Sens. Environ. 2003, 86, 370–384. [Google Scholar] [CrossRef]
- Wang, W.C.; Zeng, Z.; Karl, T.R. Urban heat islands in China. Geophys. Res. Lett. 1990, 17, 2377–2380. [Google Scholar] [CrossRef]
- Huang, L.; Li, J.; Zhao, D.; Zhu, J. A fieldwork study on the diurnal changes of urban microclimate in four types of ground cover and urban heat island of Nanjing, China. Build. Environ. 2008, 43, 7–17. [Google Scholar] [CrossRef]
- Li, Q.; Zhang, H.; Liu, X.; Huang, J. Urban heat island effect on annual mean temperature during the last 50 years in China. Theor. Appl. Climatol. 2004, 79, 165–174. [Google Scholar] [CrossRef]
- Weng, Q.H. Thermal infrared remote sensing for urban climate and environmental studies: Methods, applications, and trends. J. Photogramm. Remote Sens. 2009, 64, 335–344. [Google Scholar] [CrossRef]
- Xiao, R.B.; Weng, Q.H.; Ouyang, Z.Y.; Li, W.F.; Schienke, E.W.; Zhang, Z.M. Land surface temperature variation and major factors in Beijing, China. Photogramm. Eng. Remote Sens. 2008, 74, 451–461. [Google Scholar] [CrossRef]
- Li, S.S.; Gong, H.L.; Zhao, W.J.; Sun, Y.H. Analysis and study of urban heat environment and respirable particulate matter in Beijing city. Jt. Urban Remote Sens. Event 2009, 1–3, 577–582. [Google Scholar]
- Weng, Q.H.; Lu, D.S.; Schubring, J. Estimation of land surface temperature-vegetation abundance relationship for urban heat island studies. Remote Sens. Environ. 2004, 89, 467–483. [Google Scholar] [CrossRef]
- Shen, H.; Huang, L.; Zhang, L.; Wu, P.; Zeng, C. Long-term and fine-scale satellite monitoring of the urban heat island effect by the fusion of multi-temporal and multi-sensor remote sensed data: A 26-year case study of the city of Wuhan in China. Remote Sens. Environ. 2016, 172, 109–125. [Google Scholar] [CrossRef]
- Fu, P.; Weng, Q. A time series analysis of urbanization induced land use and land cover change and its impact on land surface temperature with landsat imagery. Remote Sens. Environ. 2016, 175, 205–214. [Google Scholar] [CrossRef]
- Dai, Z.; Guldmann, J.-M.; Hu, Y. Spatial regression models of park and land-use impacts on the urban heat island in central Beijing. Sci. Total Environ. 2018, 626, 1136–1147. [Google Scholar] [CrossRef]
- Zhang, L.; Meng, Q.; Sun, Z.; Sun, Y. Spatial and temporal analysis of the mitigating effects of industrial relocation on the surface urban heat island over China. ISPRS Int. J. Geo-Inf. 2017, 6, 121. [Google Scholar] [CrossRef]
- Buyantuyev, A.; Wu, J. Urban heat islands and landscape heterogeneity: Linking spatiotemporal variations in surface temperatures to land-cover and socioeconomic patterns. Landsc. Ecol. 2010, 25, 17–33. [Google Scholar] [CrossRef]
- Zhou, D.; Bonafoni, S.; Zhang, L.; Wang, R. Remote sensing of the urban heat island effect in a highly populated urban agglomeration area in east China. Sci. Total Environ. 2018, 628–629, 415–429. [Google Scholar] [CrossRef] [PubMed]
- Tran, H.; Uchihama, D.; Ochi, S.; Yasuoka, Y. Assessment with satellite data of the urban heat island effects in asian mega cities. Int. J. Appl. Earth Obs. Geoinf. 2006, 8, 34–48. [Google Scholar] [CrossRef]
- Imhoff, M.L.; Zhang, P.; Wolfe, R.E.; Bounoua, L. Remote sensing of the urban heat island effect across biomes in the continental USA. Remote Sens. Environ. 2010, 114, 504–513. [Google Scholar] [CrossRef]
- Pongrácz, R.; Bartholy, J.; Dezső, Z. Application of remotely sensed thermal information to urban climatology of central European cities. Phys. Chem. Earth 2010, 35, 95–99. [Google Scholar] [CrossRef]
- Peng, S.; Piao, S.; Ciais, P.; Friedlingstein, P.; Ottle, C.; Bréon, F.-M.; Nan, H.; Zhou, L.; Myneni, R.B. Surface urban heat island across 419 global big cities. Environ. Sci. Technol. 2011, 46, 696–703. [Google Scholar] [CrossRef] [PubMed]
- Clinton, N.; Gong, P. Modis detected surface urban heat islands and sinks: Global locations and controls. Remote Sens. Environ. 2013, 134, 294–304. [Google Scholar] [CrossRef]
- Stewart, I.D.; Oke, T.R. Local climate zones for urban temperature studies. Bull. Am. Meteorol. Soc. 2012, 93, 1879–1900. [Google Scholar] [CrossRef]
- Wang, K.; Wang, J.; Wang, P.; Sparrow, M.; Yang, J.; Chen, H. Influences of urbanization on surface characteristics as derived from the moderate-resolution imaging spectroradiometer: A case study for the Beijing metropolitan area. J. Geophys. Res. Atmos. 2007, 112. [Google Scholar] [CrossRef]
- Zhang, H.; Qi, Z.; Ye, X.; Cai, Y.; Ma, W.; Chen, M. Analysis of land use/land cover change, population shift, and their effects on spatiotemporal patterns of urban heat islands in metropolitan Shanghai, China. Appl. Geogr. 2013, 44, 121–133. [Google Scholar] [CrossRef]
- Chen, Z.; Gong, C.; Wu, J.; Yu, S. The influence of socioeconomic and topographic factors on nocturnal urban heat islands: A case study in Shenzhen, China. Int. J. Remote Sens. 2012, 33, 3834–3849. [Google Scholar] [CrossRef]
- Chen, X.; Su, Y.; Li, D.; Huang, G.; Chen, W.; Chen, S. Study on the cooling effects of urban parks on surrounding environments using landsat tm data: A case study in Guangzhou, southern China. Int. J. Remote Sens. 2012, 33, 5889–5914. [Google Scholar] [CrossRef]
- Zhou, X.; Wang, Y. Dynamics of land surface temperature in response to land-use/cover change. Geogr. Res. 2011, 49, 23–36. [Google Scholar] [CrossRef]
- Xiao, H.; Weng, Q. The impact of land use and land cover changes on land surface temperature in a karst area of China. J. Environ. Manag. 2007, 85, 245–257. [Google Scholar] [CrossRef] [PubMed]
- Bao, T.; Li, X.; Zhang, J.; Zhang, Y.; Tian, S. Assessing the distribution of urban green spaces and its anisotropic cooling distance on urban heat island pattern in Baotou, China. ISPRS Int. J. Geo-Inf. 2016, 5, 12. [Google Scholar] [CrossRef]
- Zhou, D.; Zhang, L.; Hao, L.; Sun, G.; Liu, Y.; Zhu, C. Spatiotemporal trends of urban heat island effect along the urban development intensity gradient in China. Sci. Total Environ. 2016, 544, 617–626. [Google Scholar] [CrossRef] [PubMed]
- Zhou, D.; Zhao, S.; Liu, S.; Zhang, L.; Zhu, C. Surface urban heat island in China’s 32 major cities: Spatial patterns and drivers. Remote Sens. Environ. 2014, 152, 51–61. [Google Scholar] [CrossRef]
- Zhou, D.; Zhao, S.; Zhang, L.; Sun, G.; Liu, Y. The footprint of urban heat island effect in China. Sci. Rep. 2015, 5, 11160. [Google Scholar] [CrossRef] [PubMed]
- Yao, R.; Wang, L.; Huang, X.; Niu, Z.; Liu, F.; Wang, Q. Temporal trends of surface urban heat islands and associated determinants in major chinese cities. Sci. Total Environ. 2017, 609, 742–754. [Google Scholar] [CrossRef] [PubMed]
- Kolovos, A.; Skupin, A.; Jerrett, M.; Christakos, G. Multi-perspective analysis and spatiotemporal mapping of air pollution monitoring data. Environ. Sci. Technol. 2010, 44, 6738–6744. [Google Scholar] [CrossRef] [PubMed]
- Kohonen, T. Self-Organizing Maps; Springer: Berlin, Germany, 2001. [Google Scholar]
- Delgado, T.R.; Wang, S.; Zhong, E.; Cai, W.; Long, L. Competitive learning approach to GIS based land use suitability analysis. J. Resour. Ecol. 2016, 7, 430–438. [Google Scholar] [CrossRef]
- Agarwal, P. Self-Organising Maps: Applications in Geographic Information Science; John Wiley & Sons: Chichester, UK, 2008. [Google Scholar]
- Hong, T. A close look at the China design standard for energy efficiency of public buildings. Energy Build. 2009, 41, 426–435. [Google Scholar] [CrossRef]
- Zheng, D. Eco-Geographical Regions in China; Commercial Press: Beijing, China, 2008; pp. 1–387. [Google Scholar]
- Öke, K. The Armenian Question; Turkish Historical Society Printing House: Ankara, Turkey, 2001; 297p. [Google Scholar]
- Wang, J.; Huang, B.; Fu, D.; Atkinson, P. Spatiotemporal variation in surface urban heat island intensity and associated determinants across major chinese cities. Remote Sens. 2015, 7, 3670–3689. [Google Scholar] [CrossRef]
- Bounoua, L.; Safia, A.; Masek, J.; Peters-Lidard, C.; Imhoff, M.L. Impact of urban growth on surface climate: A case study in Oran, Algeria. J. Appl. Meteorol. Clim. 2009, 48, 217–231. [Google Scholar] [CrossRef]
- Xu, X.; Zhou, Y.X. Urban Geography; Higher Education Press: Beijing, China, 2008. (In Chinese) [Google Scholar]
- Friedl, M.A.; Sulla-Menashe, D.; Tan, B.; Schneider, A.; Ramankutty, N.; Sibley, A.; Huang, X. Modis collection 5 global land cover: Algorithm refinements and characterization of new datasets. Remote Sens. Environ. 2010, 114, 168–182. [Google Scholar] [CrossRef]
- Heyden, Y.V.; Vankeerberghen, P.; Novic, M.; Zupan, J.; Massart, D.L. The application of Kohonen neural networks to diagnose calibration problems in atomic absorption spectrometry. Talanta 2000, 51, 455–466. [Google Scholar] [CrossRef]
- Carnahan, W.H.; Larson, R.C. An analysis of an urban heat sink. Remote Sens. Environ. 1990, 33, 65–71. [Google Scholar] [CrossRef]
- Schwarz, N.; Schlink, U.; Franck, U.; Großmann, K. Relationship of land surface and air temperatures and its implications for quantifying urban heat island indicators: An application for the city of Leipzig (Germany). Ecol. Indic. 2012, 18, 693–704. [Google Scholar] [CrossRef]
- Sailor, D.J.; Lu, L. A top-down methodology for developing diurnal and seasonal anthropogenic heating profiles for urban areas. Atmos. Environ. 2004, 38, 2737–2748. [Google Scholar] [CrossRef]
- Wang, J.F.; Li, X.H.; Christakos, G.; Liao, Y.L.; Zhang, T.; Gu, X.; Zheng, X.Y. Geographical detectors-based health risk assessment and its application in the neural tube defects study of the Heshun region, China. Int. J. Geogr. Inf. Sci. 2010, 24, 107–127. [Google Scholar] [CrossRef]


| City | Lat. | Lon. | Urban Area (2010; km2) | Rural Area (2010; km2) | Pop. in 2010 (Unit: 10,000, People) | Annual Change Rate (CR) of Pop. (2003–2013) |
|---|---|---|---|---|---|---|
| Beijing | 39.91 | 116.40 | 1902 | 5146 | 1258 | 15.99 |
| Chengdu | 30.67 | 104.07 | 582 | 6618 | 1149.07 | 13.96 |
| Fuzhou | 26.06 | 119.31 | 467 | 1371 | 645.9 | 5.40 |
| Guangzhou | 23.12 | 113.25 | 1069 | 1923 | 806.14 | 10.71 |
| Guiyang | 26.58 | 106.72 | 162 | 1504 | 373.16 | 3.63 |
| Harbin | 45.75 | 126.65 | 727 | 26,919 | 992.02 | 3.46 |
| Haikou | 19.96 | 110.52 | 111 | 596 | 160.44 | 2.40 |
| Hangzhou | 30.26 | 120.17 | 337 | 1957 | 689.12 | 6.15 |
| Hefei | 31.86 | 117.28 | 174 | 6256 | 493.42 | 28.63 |
| Hohhot | 40.81 | 111.65 | 187 | 1670 | 229.56 | 2.30 |
| Jinan | 36.67 | 117.00 | 279 | 7215 | 604.08 | 2.34 |
| Kunming | 25.04 | 102.72 | 838 | 3958 | 536.31 | 5.08 |
| Laksa | 30.17 | 91.13 | 31 | 176 | 48.46 | 1.49 |
| Lanzhou | 36.06 | 103.79 | 447 | 181 | 323.54 | 3.94 |
| Nanchang | 28.68 | 115.88 | 166 | 4988 | 502.25 | 5.61 |
| Nanjing | 32.06 | 118.78 | 230 | 4860 | 632.42 | 6.90 |
| Nanning | 22.82 | 108.32 | 427 | 2083 | 707.37 | 8.31 |
| Shanghai | 31.22 | 121.46 | 1503 | 4160 | 1412 | 9.44 |
| Shzhen | 22.55 | 114.07 | 680 | 293 | 259.87 | 15.37 |
| Shenyang | 41.79 | 123.43 | 668 | 11,343 | 719.6 | 3.86 |
| Shijiangzhuang | 38.04 | 114.48 | 986 | 10,154 | 989.16 | 10.42 |
| Taiyuan | 37.87 | 112.56 | 310 | 1866 | 365.5 | 4.12 |
| Tianjin | 39.14 | 117.18 | 970 | 7704 | 985 | 7.49 |
| Urumqi | 43.80 | 87.58 | 329 | 280 | 243.03 | 8.84 |
| Wuhan | 30.58 | 114.27 | 490 | 5572 | 836.73 | 4.26 |
| Xian | 34.26 | 108.93 | 447 | 4529 | 782.73 | 8.75 |
| Xining | 36.62 | 101.77 | 333 | 487 | 196.01 | 3.87 |
| Yinchaun | 38.47 | 106.30 | 118 | 1505 | 158.8 | 3.78 |
| Changchun | 43.88 | 125.32 | 586 | 18,245 | 758.89 | 4.04 |
| Changsha | 28.20 | 112.97 | 252 | 4055 | 650.12 | 6.01 |
| Zhengzhou | 34.76 | 113.65 | 552 | 6437 | 744.62 | 36.52 |
| Chongqing | 29.56 | 106.55 | 539 | 16,544 | 3303 | 24.26 |
| Name | Product | Pixel Size | Temporal Granularity | Timeframe | Source |
|---|---|---|---|---|---|
| MYD 11A2 | Land surface temperature | 1000 m | 8-day | 2003–2013 | https://search.earthdata.nasa.gov/search |
| MCD 12Q1 | Land cover | 500 m | annually | 2003–2013 | https://search.earthdata.nasa.gov/search |
| Cluster | Cities |
|---|---|
| 1 | Shanghai, Lanzhou, Shijiazhuang, Beijing, Urumqi |
| 2 | Kunming, Guiyang, Zhengzhou, Tianjin, Laksa |
| 3 | Shenzhen, Hangzhou, Taiyuan |
| 4 | Xi’an |
| 5 | Guangzhou, Nanchang, Nanjing, Hohhot |
| 6 | Nanning, Yinchuan |
| 7 | Changsha, Wuhan, Chengdu, Jinan, Haikou |
| 8 | Fuzhou, Chongqing, Hefei, Xining, Shenyang, Changchun, Harbin |
© 2018 by the authors. Licensee MDPI, Basel, Switzerland. This article is an open access article distributed under the terms and conditions of the Creative Commons Attribution (CC BY) license (http://creativecommons.org/licenses/by/4.0/).
Share and Cite
Wang, J.; Meng, B.; Fu, D.; Pei, T.; Xu, C. Mapping Spatiotemporal Patterns and Multi-Perspective Analysis of the Surface Urban Heat Islands across 32 Major Cities in China. ISPRS Int. J. Geo-Inf. 2018, 7, 207. https://doi.org/10.3390/ijgi7060207
Wang J, Meng B, Fu D, Pei T, Xu C. Mapping Spatiotemporal Patterns and Multi-Perspective Analysis of the Surface Urban Heat Islands across 32 Major Cities in China. ISPRS International Journal of Geo-Information. 2018; 7(6):207. https://doi.org/10.3390/ijgi7060207
Chicago/Turabian StyleWang, Juan, Bin Meng, Dongjie Fu, Tao Pei, and Chengdong Xu. 2018. "Mapping Spatiotemporal Patterns and Multi-Perspective Analysis of the Surface Urban Heat Islands across 32 Major Cities in China" ISPRS International Journal of Geo-Information 7, no. 6: 207. https://doi.org/10.3390/ijgi7060207