Construction and Optimization of Three-Dimensional Disaster Scenes within Mobile Virtual Reality

Abstract
:1. Introduction
2. Methodology
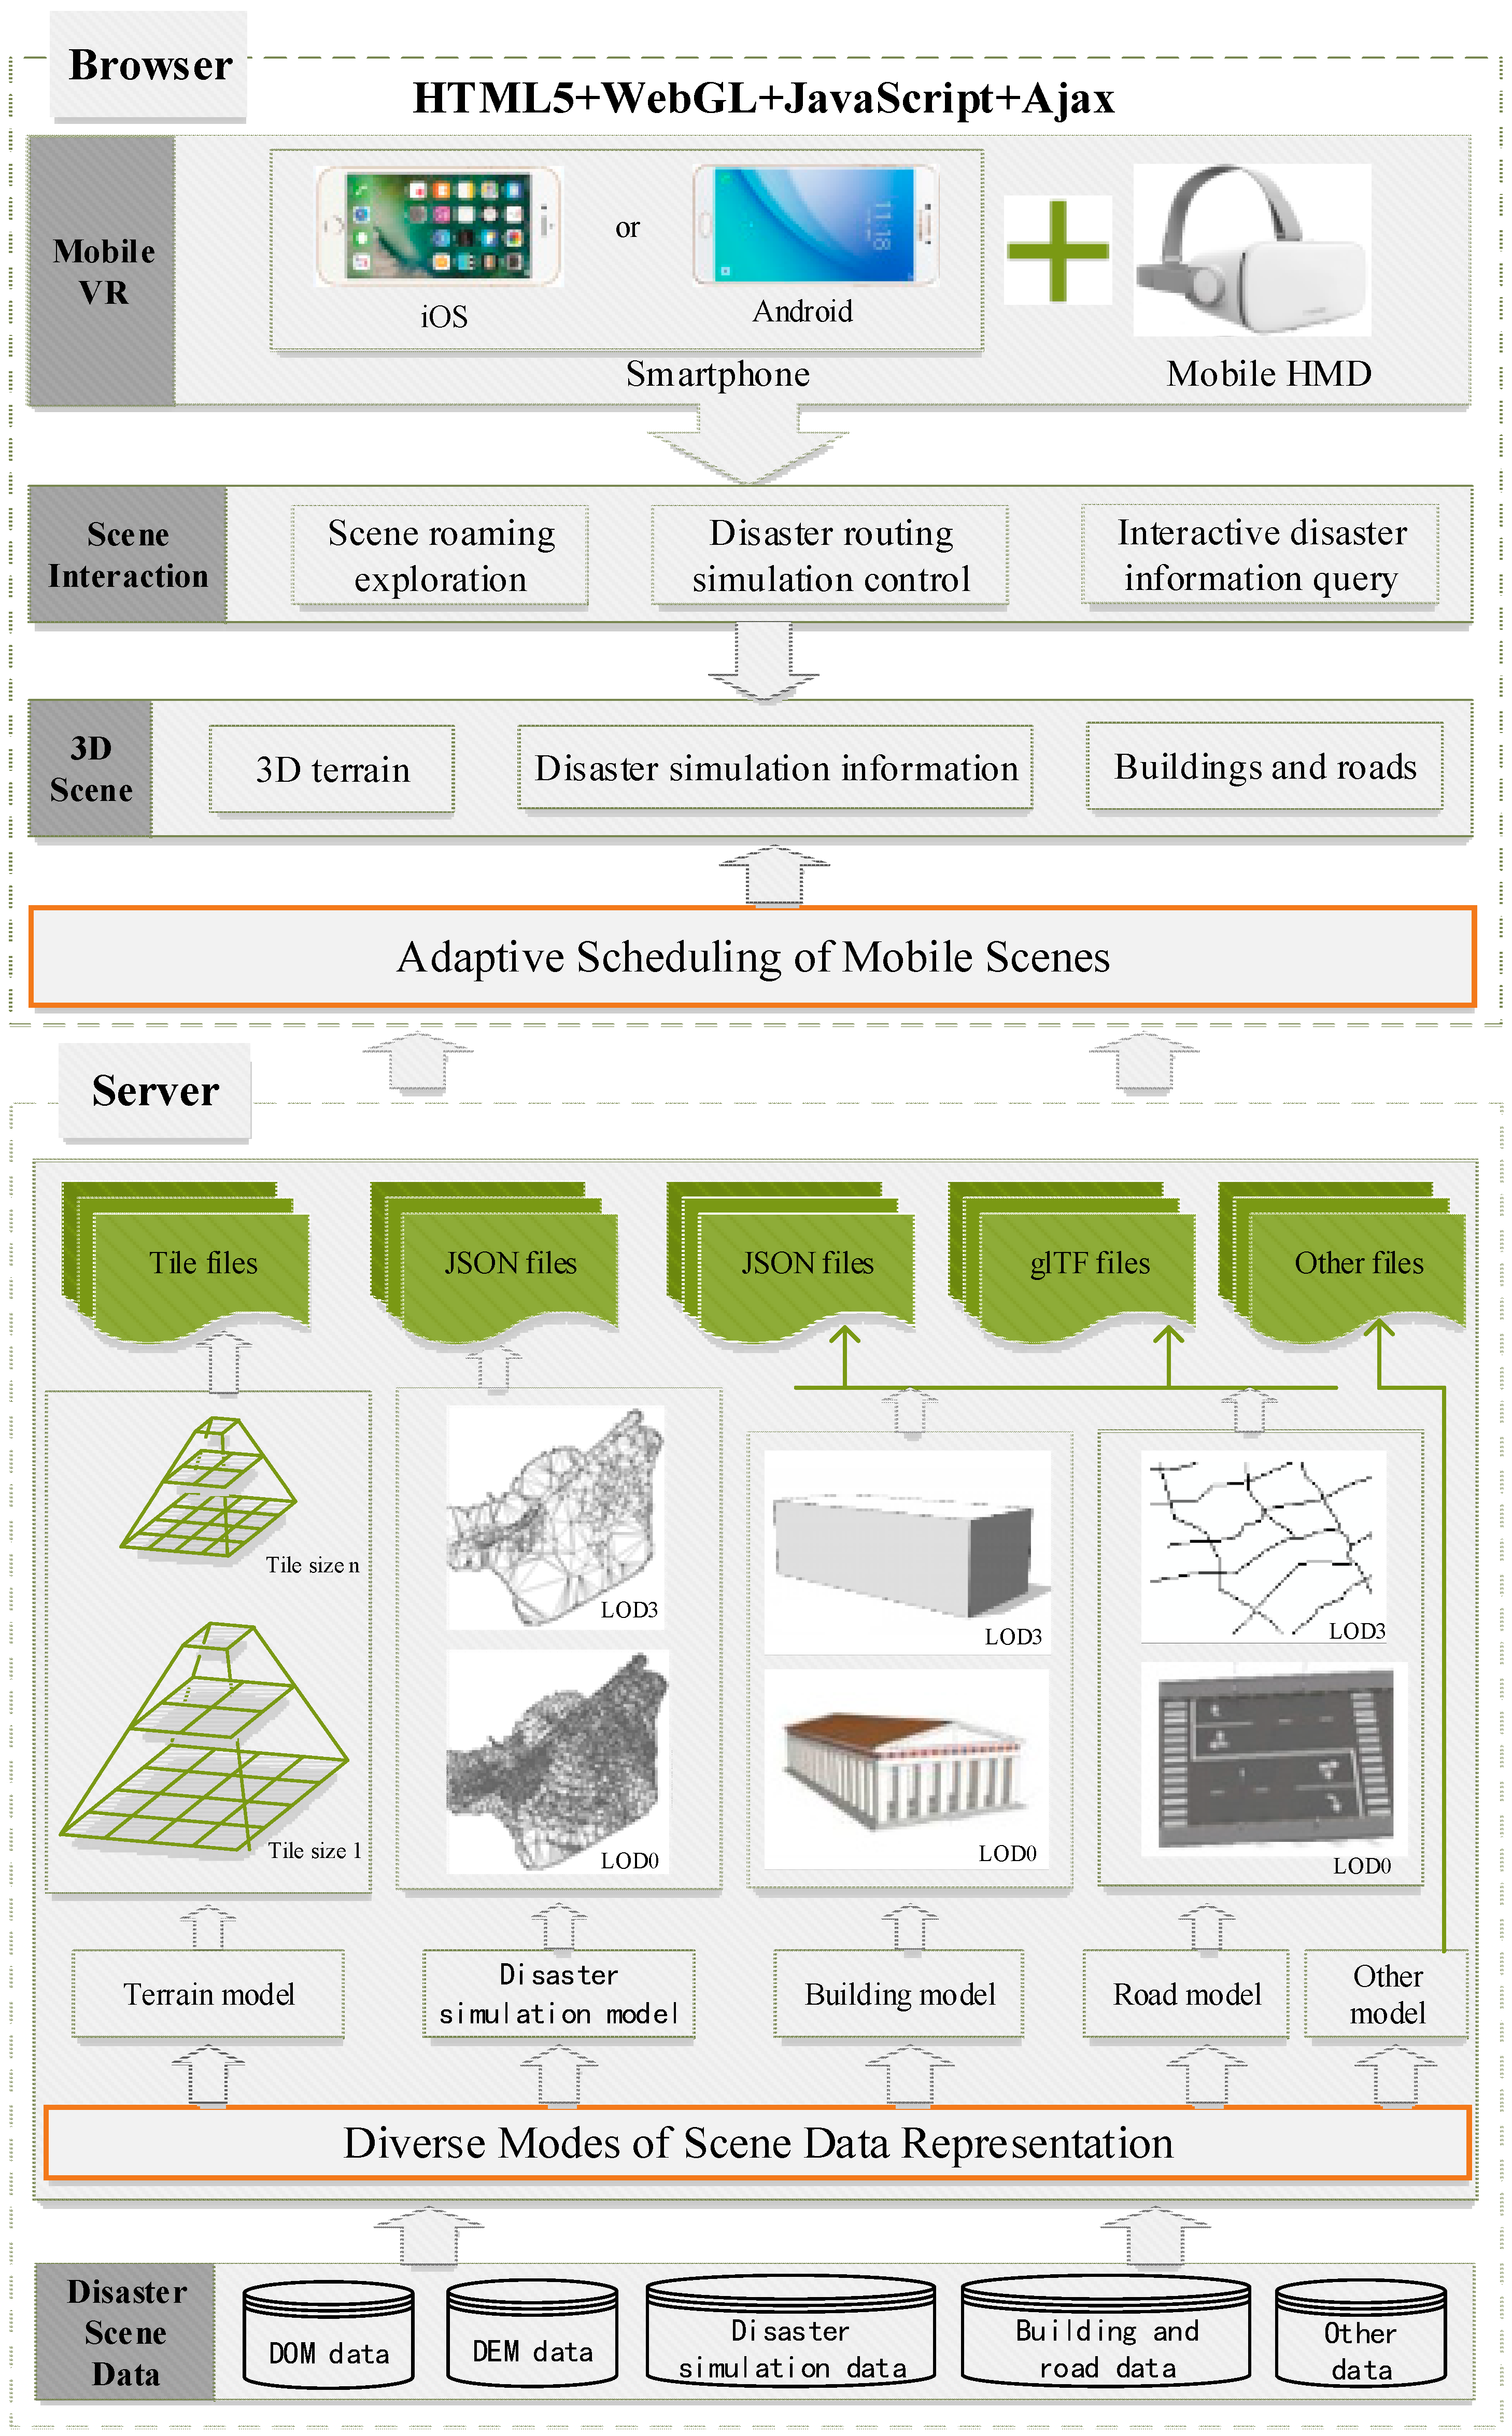
2.1. General Design
2.2. Diverse Modes of Scene Data Representation
2.3. Optimization of Mobile Scene Representation
- 1.
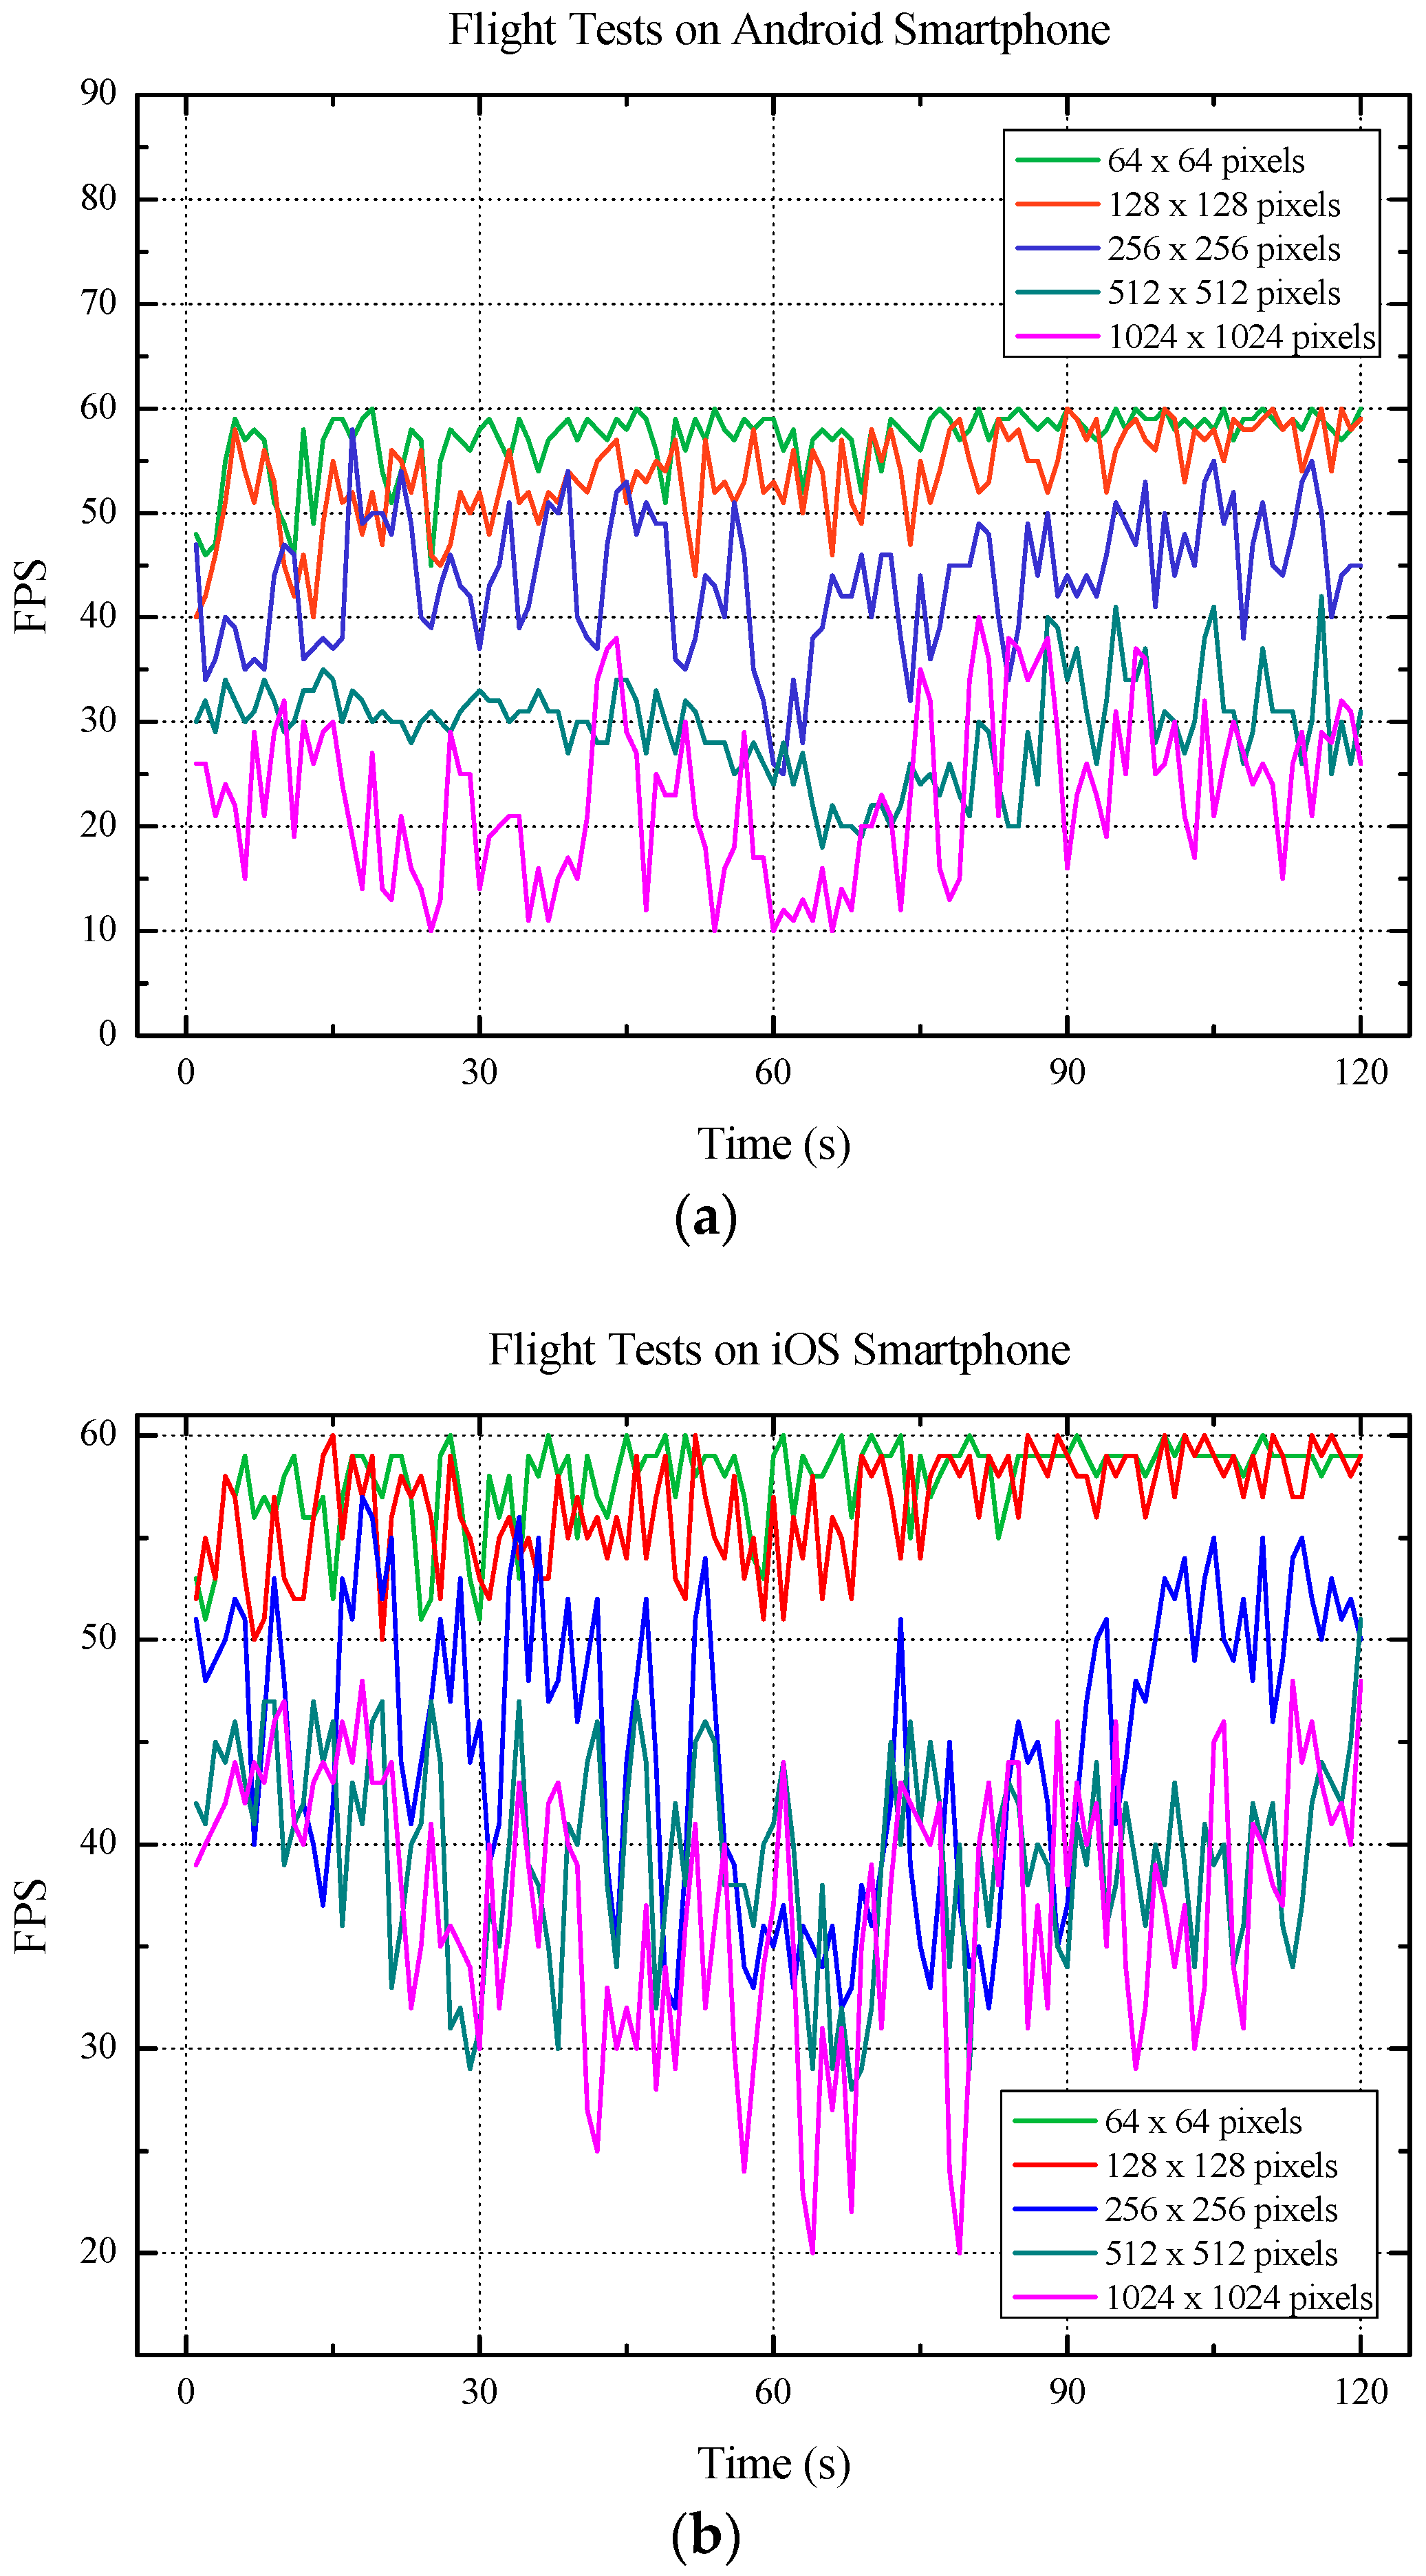
- Reducing the maximum tile level that can be loaded for a specific tile-size image or DEM pyramid model: if the maximum tile level that can currently be loaded is Lmax (e.g., 17), then the maximum tile level can be reset to L = Lmax − i (i = 1, 2, …, i ≤ Lmax − Lmin), where Lmin denotes the lowest level of the tile pyramid model.
- 2.
- Loading tiles of smaller sizes: if the tile size of the currently loaded image or DEM pyramid model is N and the maximum tile level that can be loaded is M, we can consider loading tiles with a tile size of S, where S = N/2i (i = 1, 2, 3, …), while simultaneously limiting the maximum tile level that can be loaded to M.
2.4. Adaptive Scheduling of Mobile Scenes
3. System Implementation and Experimental Analysis
3.1. Implementation of the Prototype System
3.2. Experimental Data and Environment
3.2.1. Experimental Data
3.2.2. Experimental Environment
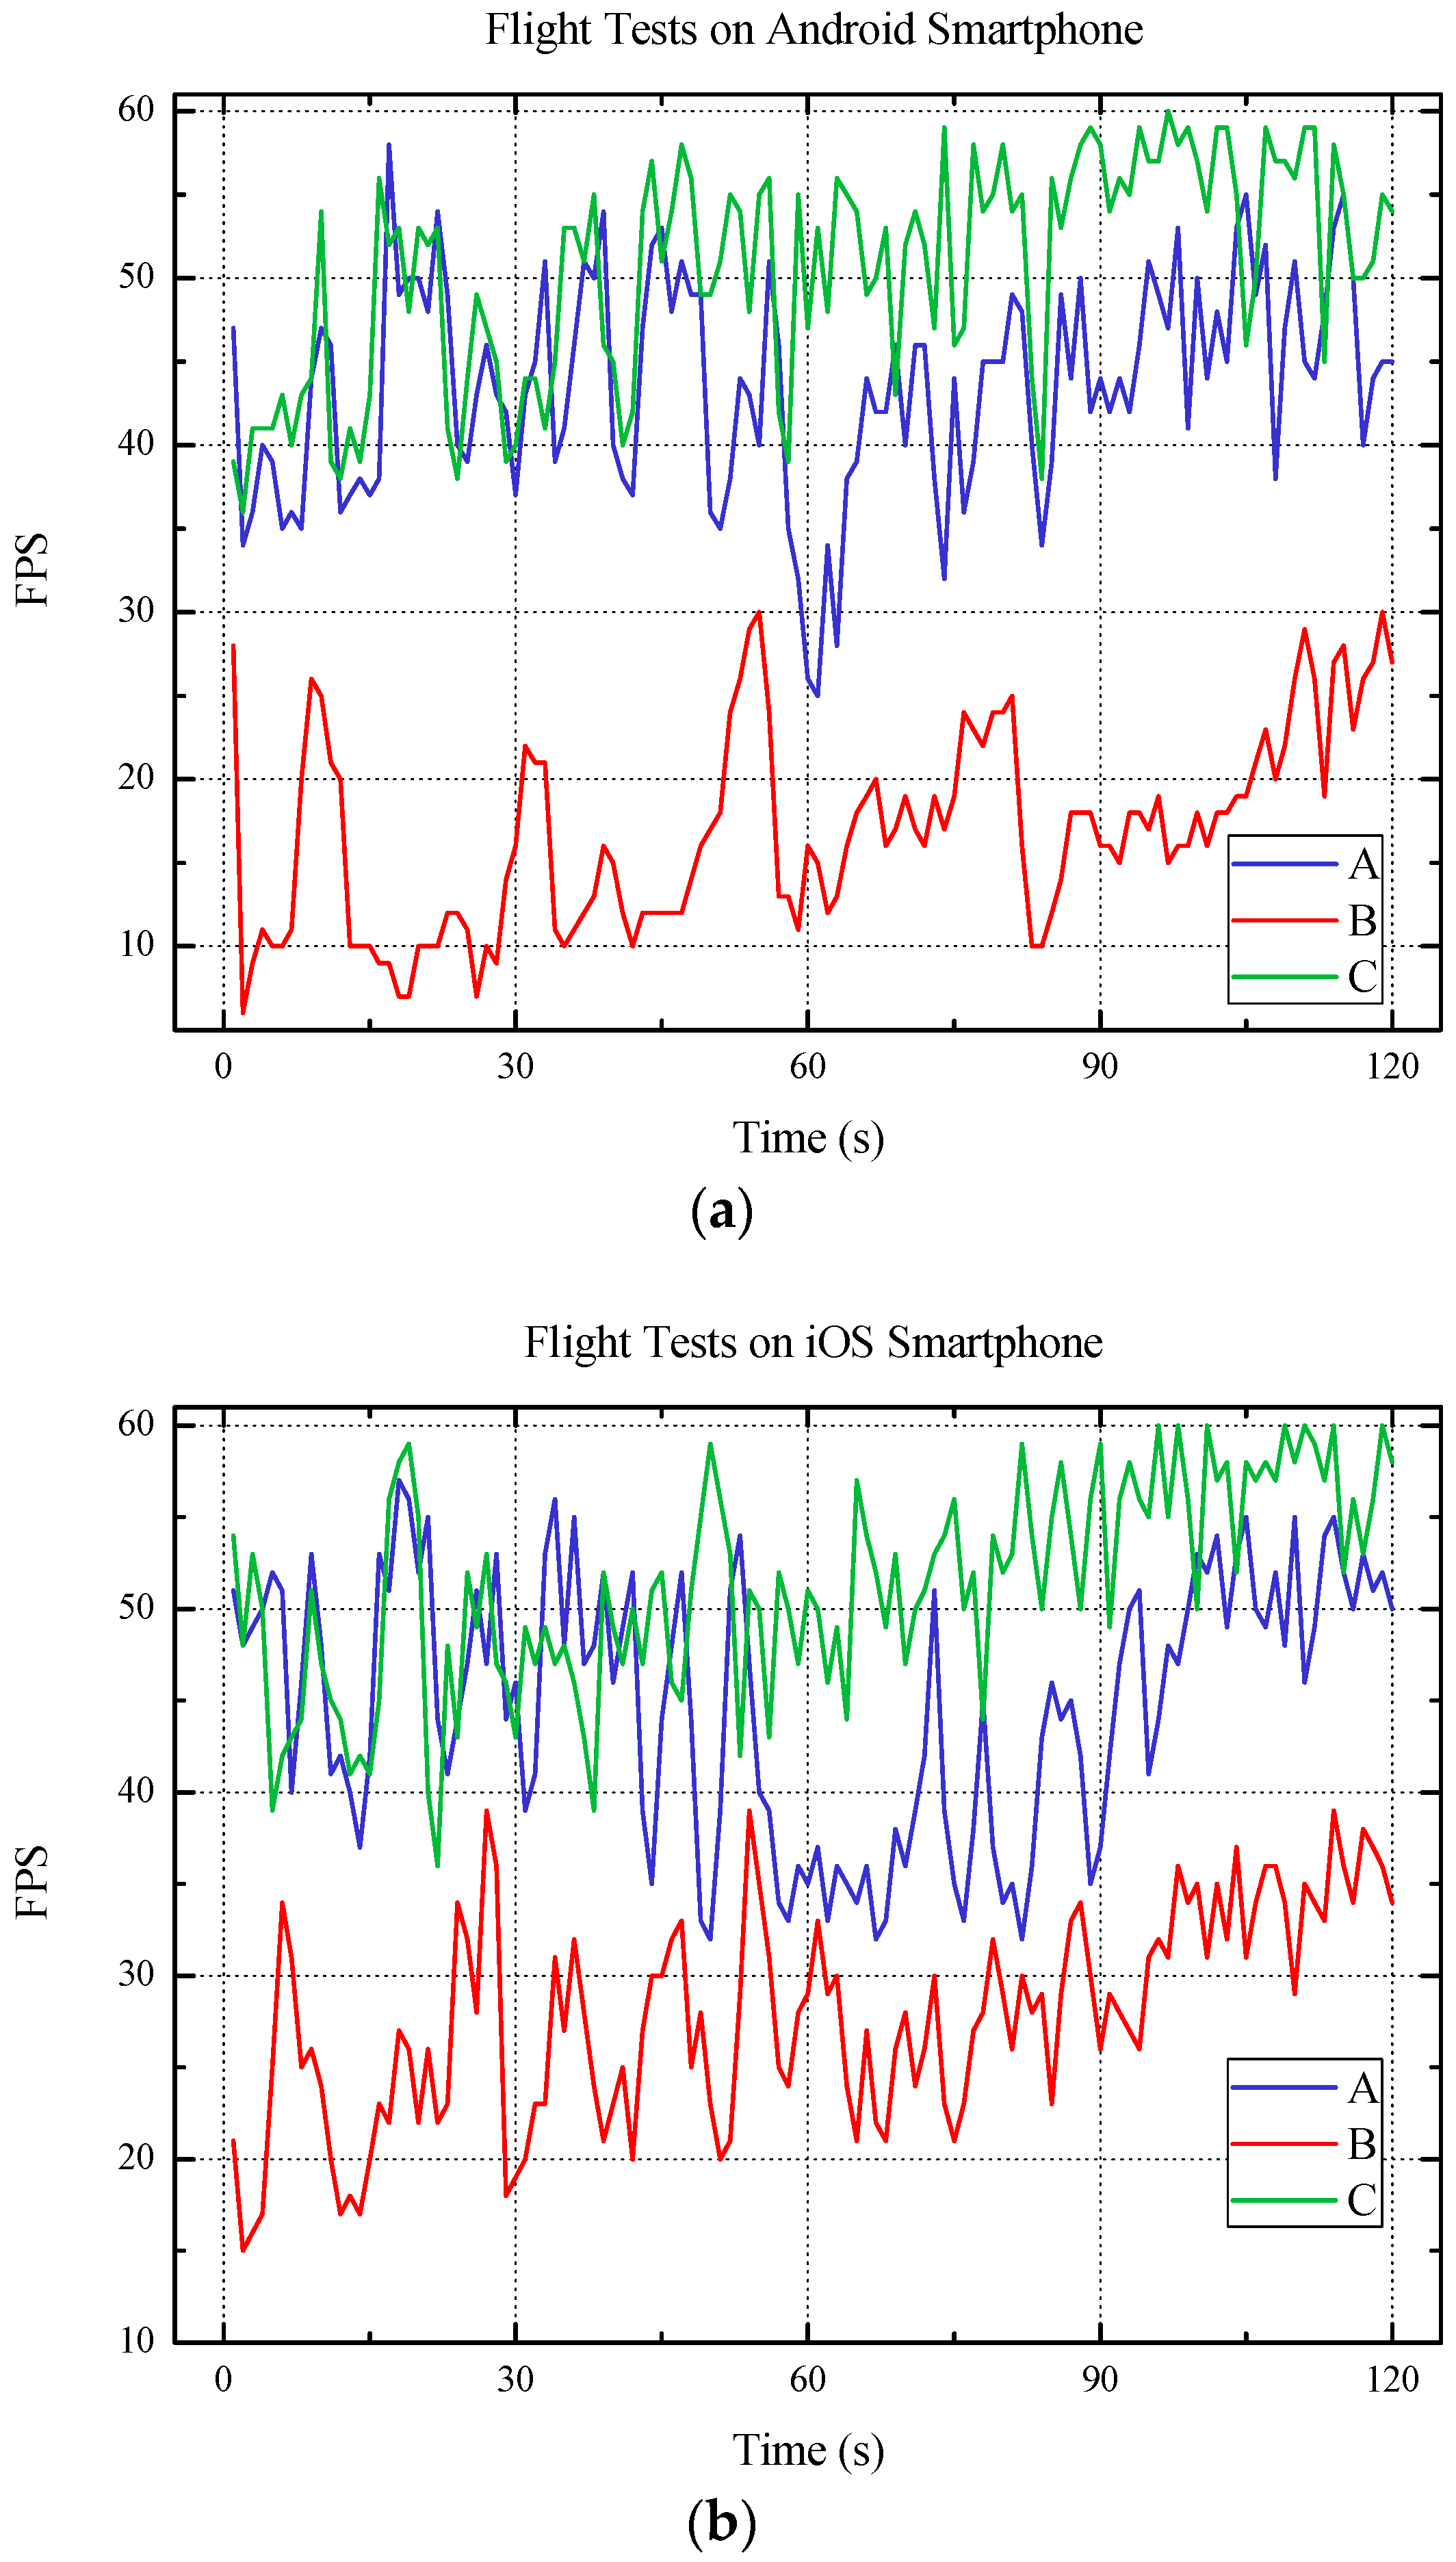
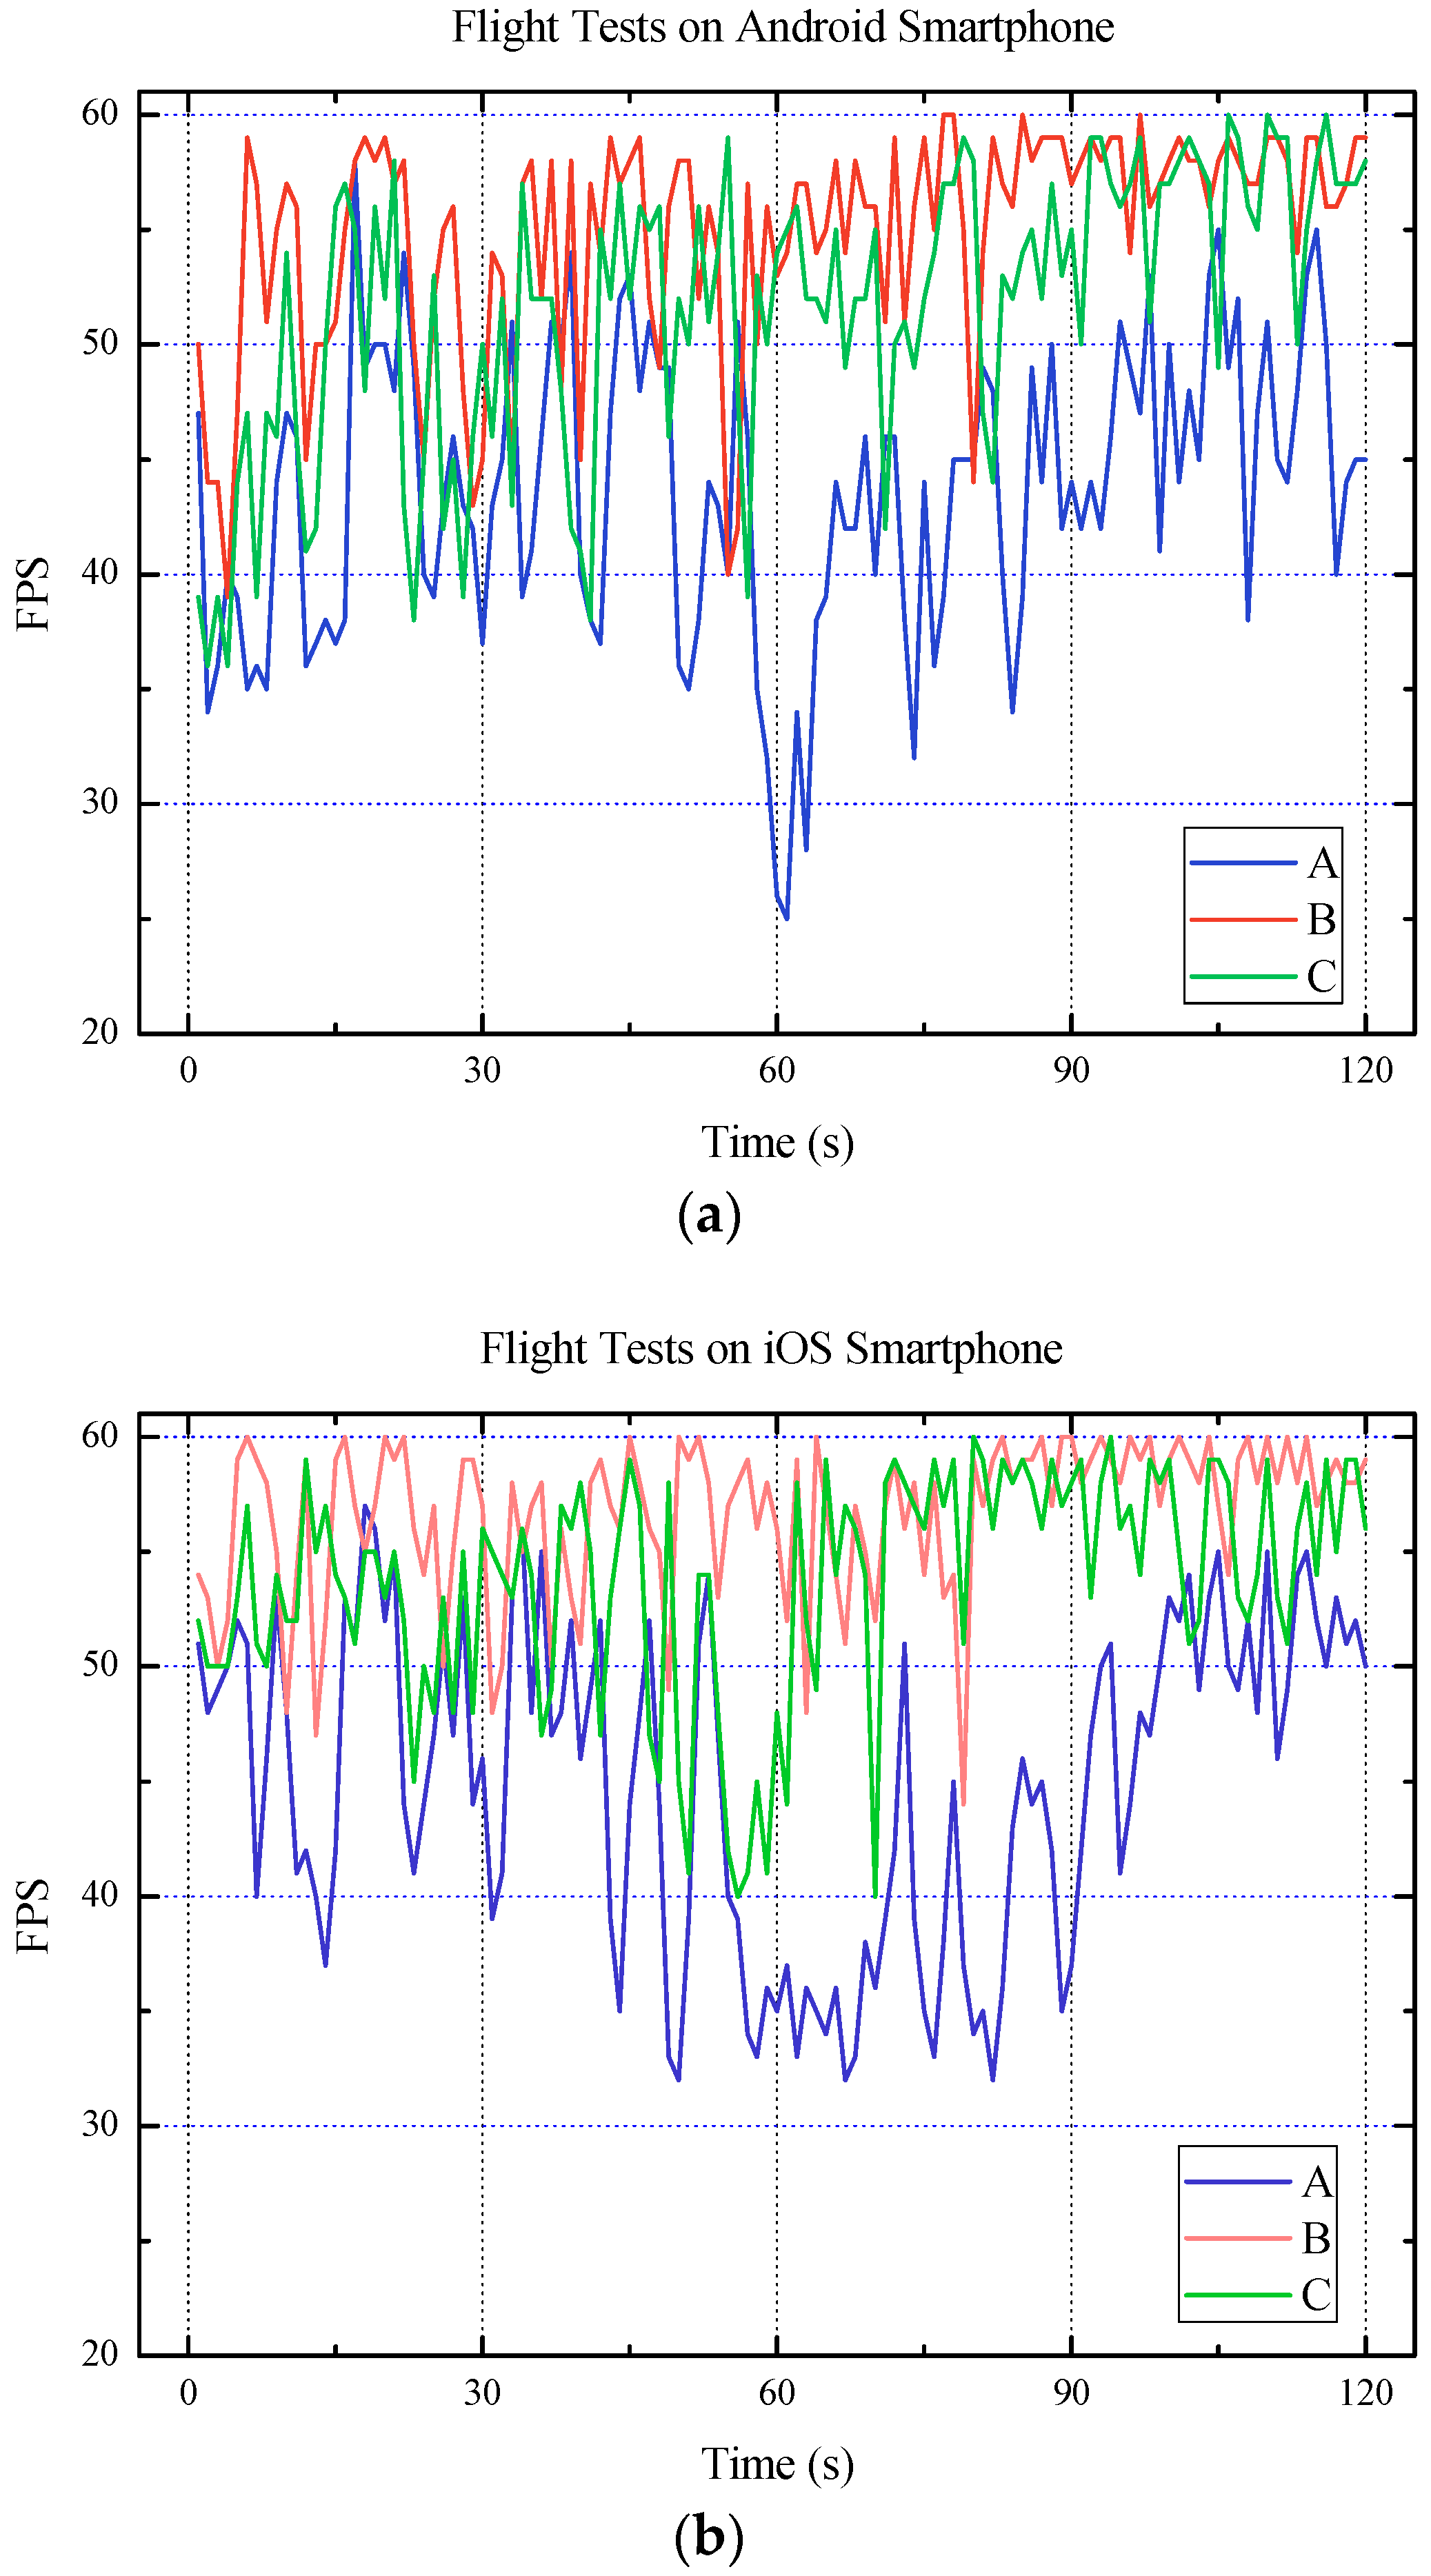
3.3. Scene Construction and Optimization Experiments
3.3.1. Experimental Method
3.3.2. Experimental Results
4. Conclusions and Future Work
Author Contributions
Funding
Acknowledgments
Conflicts of Interest
References
- Yin, Y.P.; Wang, W.P.; Zhang, N.; Yan, J.K.; Wei, Y.J. The June 2017 Maoxian landslide: Geological disaster in an earthquake area after the Wenchuan Ms 8.0 earthquake. Sci. China Technol. Sci. 2017, 60, 1762–1766. [Google Scholar] [CrossRef]
- Shultz, J.M.; Galea, S. Mitigating the Mental and Physical Health Consequences of Hurricane Harvey. JAMA 2017, 318, 1437–1438. [Google Scholar] [CrossRef] [PubMed]
- Chan, Y.; Mori, M. Web-based Flood Monitoring System Using Google Earth and 3D GIS. In Proceedings of the IEEE International Geoscience and Remote Sensing Symposium, Vancouver, BC, Canada, 24–29 July 2011; pp. 1902–1905. [Google Scholar]
- Lai, J.S.; Chang, W.Y.; Chan, Y.C.; Kang, S.C.; Tan, Y.C. Development of a 3D virtual environment for improving public participation: Case study—The Yuansantze Flood Diversion Works Project. Adv. Eng. Inform. 2011, 25, 208–223. [Google Scholar] [CrossRef]
- Li, Y.; Gong, J.H.; Zhu, J.; Song, Y.Q.; Hu, Y.; Ye, L. Spatiotemporal simulation and risk analysis of dam-break flooding based on cellular automata. Int. J. Geogr. Inf. Sci. 2013, 27, 2043–2059. [Google Scholar] [CrossRef]
- Evans, S.Y.; Todd, M.; Baines, I.; Hunt, T.; Morrison, G. Communicating flood risk through three-dimensional visualization. Proc. Inst. Civ. Eng. Civ. Eng. 2014, 167, 48–55. [Google Scholar]
- Li, Y.; Gong, J.H.; Liu, H.; Zhu, J.; Song, Y.Q.; Liang, J.M. Real-time flood simulations using CA model driven by dynamic observation data. Int. J. Geogr. Inf. Sci. 2015, 29, 523–535. [Google Scholar] [CrossRef]
- Zhu, J.; Yin, L.Z.; Wang, J.H.; Zhang, H.; Hu, Y.; Liu, Z.J. Dam-break flood routing simulation and scale effect analysis based on virtual geographic environment. IEEE J. Sel. Top. Appl. Earth Obs. Remote Sens. 2015, 8, 105–113. [Google Scholar] [CrossRef]
- Zhu, J.; Zhang, H.; Yang, X.F.; Yin, L.Z.; Li, Y.; Hu, Y.; Zhang, X. A collaborative virtual geographic environment for emergency dam-break simulation and risk analysis. J. Spat. Sci. 2016, 61, 133–155. [Google Scholar] [CrossRef]
- Curebal, I.; Efe, R.; Ozdemir, H.; Soykan, A.; Sonmez, S. GIS-based approach for flood analysis: Case study of Kecidere flash flood event (Turkey). Geocarto Int. 2016, 31, 355–366. [Google Scholar] [CrossRef]
- Winkler, D.; Zischg, J.; Rauch, W. Virtual reality in urban water management: Communicating urban flooding with particle-based CFD simulations. Water Sci. Technol. 2018, 77, 518–524. [Google Scholar] [CrossRef] [PubMed]
- Lu, X.Z.; Han, B.; Hori, M.; Xiong, C.; Xu, Z. A coarse-grained parallel approach for seismic damage simulations of urban areas based on refined models and GPU/CPU cooperative computing. Adv. Eng. Softw. 2014, 70, 90–103. [Google Scholar] [CrossRef]
- Li, B.R.; Wu, J.P.; Pan, M.; Huang, J. Application of 3D WebGIS and real-time technique in earthquake information publishing and visualization. Earthq. Sci. 2015, 28, 223–231. [Google Scholar] [CrossRef] [Green Version]
- Xiong, C.; Lu, X.Z.; Hori, M.; Guan, H.; Xu, Z. Building seismic response and visualization using 3D urban polygonal modeling. Autom. Constr. 2015, 55, 25–34. [Google Scholar] [CrossRef]
- Xu, Z.; Lu, X.Z.; Law, K.H. A computational framework for regional seismic simulation of buildings with multiple fidelity models. Adv. Eng. Softw. 2016, 99, 100–110. [Google Scholar] [CrossRef]
- Redweik, P.; Teves-Costa, P.; Vilas-Boas, I.; Santos, T. 3D City Models as a Visual Support Tool for the Analysis of Buildings Seismic Vulnerability: The Case of Lisbon. Int. J. Disaster Risk Sci. 2017, 8, 308–325. [Google Scholar] [CrossRef] [Green Version]
- Wu, J.; Chen, G.Q.; Zheng, L.; Zhang, Y.B. GIS-based Numerical Modelling of Debris Flow Motion across Three-dimensional Terrain. J. Mt. Sci. 2013, 10, 522–531. [Google Scholar] [CrossRef]
- Liu, J.Q.; Tang, H.M.; Zhang, J.Q.; Shi, T.T. Glass landslide: The 3D visualization makes study of landslide transparent and virtualized. Environ. Earth Sci. 2014, 72, 3847–3856. [Google Scholar] [CrossRef]
- Yu, M.; Huang, Y.; Xu, Q.; Guo, P.; Dai, Z.L. Application of virtual earth in 3D terrain modeling to visual analysis of large-scale geological disasters in mountainous areas. Environ. Earth Sci. 2016, 75, 563. [Google Scholar] [CrossRef]
- Kuester, F.; Hutchinson, T.C. A virtualized laboratory for earthquake engineering education. Comput. Appl. Eng. Educ. 2006, 15, 15–29. [Google Scholar] [CrossRef]
- Kellogg, L.H.; Bawden, G.W.; Bemardin, T.; Billen, M.; Cowgill, E.; Hamann, B.; Jadamec, M.; Kreylos, O.; Staadt, O.; Sumner, D. Interactive visualization to advance earthquake simulation. Pure Appl. Geophys. 2008, 165, 621–633. [Google Scholar] [CrossRef]
- Zaalberg, R.; Midden, C.J.H. Living behind dikes: Mimicking flooding experiences. Risk Anal. 2013, 33, 866–876. [Google Scholar] [CrossRef] [PubMed]
- Gong, X.L.; Liu, Y.J.; Jiao, Y.; Wang, B.J.; Zhou, J.C.; Yu, H.Y. A novel earthquake education system based on virtual reality. IEICE Trans. Inf. Syst. 2015, E98D, 2242–2249. [Google Scholar] [CrossRef]
- Philips, A.; Walz, A.; Bergner, A.; Graeff, T.; Heistermann, M.; Kienzler, S.; Korup, O.; Lipp, T.; Schwanghart, W.; Zeilinger, G. Immersive 3D geovisualization in higher education. J. Geogr. High. Educ. 2015, 39, 437–449. [Google Scholar] [CrossRef]
- Li, C.Y.; Liang, W.; Quigley, C.; Zhao, Y.B.; Yu, L.F. Earthquake safety training through virtual drills. IEEE Trans. Vis. Comput. Graph. 2017, 23, 1388–1397. [Google Scholar] [CrossRef] [PubMed]
- Liu, M.W.; Zhu, J.; Zhu, Q.; Qi, H.; Yin, L.Z.; Zhang, X.; Feng, B.; He, H.G.; Yang, W.J.; Chen, L.Y. Optimization of simulation and visualization analysis of dam-failure flood disaster for diverse computing systems. Int. J. Geogr. Inf. Sci. 2017, 31, 1891–1906. [Google Scholar] [CrossRef]
- Voigt, S.; Giulio-Tonolo, F.; Lyons, J.; Kucera, J.; Jones, B.; Schneiderhan, T.; Platzeck, G.; Kaku, K.; Hazanika, M.K.; Czaran, L. Global trends in satellite-based emergency mapping. Science 2016, 353, 247–252. [Google Scholar] [CrossRef] [PubMed]
- Zou, M.; Yuan, Y. China’s comprehensive disaster reduction. Int. J. Disaster Risk Sci. 2010, 1, 24–32. [Google Scholar]
- Wu, Q.; Zhou, W.F.; Guan, E.T. Emergency responses to water disasters in coalmines, China. Environ. Geol. 2009, 58, 95–100. [Google Scholar] [CrossRef]
- Jeong, K.; Kim, J. Event-Centered Maze Generation Method for Mobile Virtual Reality Applications. Symmetry 2016, 8, 120. [Google Scholar] [CrossRef]
- Powell, W.; Powell, V.; Brown, P.; Cook, M.; Uddin, J. Getting Around in Google Cardboard—Exploring Navigation Preferences with Low-Cost mobile VR. In Proceedings of the 2nd IEEE Workshop on Everyday Virtual Reality, Greenville, SC, USA, 20 March 2016; pp. 5–8. [Google Scholar]
- Han, S.; Kim, J. A Study on Immersion of Hand Interaction for Mobile Platform Virtual Reality Contents. Symmetry 2017, 9, 22. [Google Scholar] [CrossRef]
- Millen, M.I.; Kreylos, O.; Hanann, B.; Jadamec, M.A.; Kellogg, L.H.; Staadt, O.; Sumner, D.Y. A geoscience perspective on immersive 3D gridded data visualization. Comput. Geosci. 2008, 34, 1056–1072. [Google Scholar] [Green Version]
- Boulos, M.N.K.; Lu, Z.H.; Guerrero, P.; Jennett, C.; Steed, A. From urban planning and emergency training to Pokémon Go: Applications of virtual reality GIS (VRGIS) and augmented reality GIS (ARGIS) in personal, public and environmental health. Int. J. Health Geogr. 2017, 16, 7. [Google Scholar] [CrossRef] [PubMed]
- Noguera, J.M.; Segura, R.J.; Ogayar, C.J.; Joan-Arinyo, R. Navigating large terrains using commodity mobile devices. Comput. Geosci. 2011, 37, 1218–1233. [Google Scholar] [CrossRef]
- Noguera, J.M.; Barranco, M.J.; Segura, R.J.; Martinez, L. A mobile 3D-GIS hybrid recommender system for tourism. Inf. Sci. 2012, 215, 37–52. [Google Scholar] [CrossRef]
- Noguera, J.M.; Segura, R.J.; Ogayar, C.J.; Joan-Arinyo, R. A scalable architecture for 3D map navigation on mobile devices. Pers. Ubiquitous Comput. 2013, 17, 1487–1502. [Google Scholar] [CrossRef] [Green Version]
- Magliocchetti, D.; Conti, G.; De-Amicis, R. I-MOVE: Towards the use of a mobile 3D GeoBrowser framework for urban mobility decision making. Int. J. Interact. Des. Manuf. 2012, 6, 205–214. [Google Scholar] [CrossRef]
- Trujillo, A.; Suárez, J.P.; Calle-La, M.D.; Gómez, D.; Pedriza, A.; Santana, J.M. Glob3 Mobile: An Open Source Framework for Designing Virtual Globes on iOS and Android Mobile Devices. In Progress and New Trends in 3D Geoinformation Sciences; Pouliot, J., Daniel, S., Hubert, F., Zamyadi, A., Eds.; Springer: Berlin/Heidelberg, Germany, 2013; pp. 211–229. [Google Scholar]
- Suárez, J.P.; Trujillo, A.; Santana, J.M.; Calle-La, M.D.; Gómez, D. An efficient terrain Level of Detail implementation for mobile devices and performance study. Comput. Environ. Urban Syst. 2015, 52, 21–33. [Google Scholar] [CrossRef]
- Santana, J.M.; Wendel, J.; Trujillo, A.; Suárez, J.P.; Simons, A.; Koch, A. Multimodal Location Based Services—Semantic 3D City Data as Virtual and Augmented Reality. In Progress in Location-Base d Services 2016; Gartner, G., Huang, H.S., Eds.; Springer: Berlin/Heidelberg, Germany, 2017; pp. 329–353. [Google Scholar]
- Glob3 Mobile. Available online: http://glob3.sourceforge.net/mobile.html (accessed on 29 March 2018).
- Kim, M.; Lee, J.; Jeon, C.; Kim, J. A study on interaction of gaze pointer-based user interface in mobile virtual reality environment. Symmetry 2017, 9, 189. [Google Scholar]
- Ringe, S.; Kedia, R.; Poddar, A.; Patel, S. HTML5 Based Virtual Whiteboard for Real Time Interaction. In Proceedings of the 4th International Conference on Advances in Computing, Communication and Control, Mumbai, India, 1–2 April 2015; pp. 170–177. [Google Scholar]
- Yin, L.Z.; Zhu, J.; Zhang, X.; Li, Y.; Wang, J.H.; Zhang, H.; Yang, X.F. Visual analysis and simulation of dam-break flood spatiotemporal process in a network environment. Environ. Earth Sci. 2015, 74, 7133–7146. [Google Scholar] [CrossRef]
- Li, W.W.; Wang, S.Z. PolarGlobe: A web-wide virtual globe system for visualizing multidimensional, time-varying, big climate data. Int. J. Geogr. Inf. Sci. 2017, 31, 1562–1582. [Google Scholar] [CrossRef]
- Christen, M.; Nebiket, S.; Loesch, B. Web-based large-scale 3D-geovisualisation using WebGL: The OpenWebGlobe project. Int. J. Inf. Model. 2012, 1, 16–25. [Google Scholar] [CrossRef]
- Sample, J.T.; Loup, E. Tile-Based Geospatial Information Systems: Principles and Practices; Springer: Berlin/Heidelberg, Germany, 2010; pp. 5–15. [Google Scholar]
- Cesium. Available online: https://cesiumjs.org/ (accessed on 31 March 2018).[Green Version]


| Scene Model Type | Representation Form | Strategies for Adaptive Scene Scheduling |
|---|---|---|
| terrain models | image/digital elevation model (DEM) pyramid models with multiple tile sizes | 1. raising/lowering the maximum tile level that can be loaded in the scene 2. loading tiles of larger/smaller sizes |
| disaster simulation models | a group of TIN (Triangulated Irregular Network) models with a level-of-detail (LOD) structure | loading a more detailed/simplified LOD model |
| house models | LOD models | loading a more detailed/simplified LOD model |
| road models | road centerlines | loading all/main road centerlines |
| Tile Type | Tile Size (Pixel) | Minimum Tile Level | Maximum Tile Level |
|---|---|---|---|
| image tiles | 64 | 10 | 19 |
| 128 | 10 | 18 | |
| 256 | 10 | 17 | |
| 512 | 10 | 16 | |
| 1024 | 10 | 15 | |
| DEM tiles | 64 | 10 | 15 |
| Smartphone | CPU | GPU | Memory Size | Operating System |
|---|---|---|---|---|
| MI 5s | Snapdragon MSM8996SG-AB | Adreno 530 | 3 G | Android 8.5.4 |
| iPhone 7 | Apple A10 Fusion | PowerVR GT7600 | 2 G | iOS 10 |
© 2018 by the authors. Licensee MDPI, Basel, Switzerland. This article is an open access article distributed under the terms and conditions of the Creative Commons Attribution (CC BY) license (http://creativecommons.org/licenses/by/4.0/).
Share and Cite
Hu, Y.; Zhu, J.; Li, W.; Zhang, Y.; Zhu, Q.; Qi, H.; Zhang, H.; Cao, Z.; Yang, W.; Zhang, P. Construction and Optimization of Three-Dimensional Disaster Scenes within Mobile Virtual Reality. ISPRS Int. J. Geo-Inf. 2018, 7, 215. https://doi.org/10.3390/ijgi7060215
Hu Y, Zhu J, Li W, Zhang Y, Zhu Q, Qi H, Zhang H, Cao Z, Yang W, Zhang P. Construction and Optimization of Three-Dimensional Disaster Scenes within Mobile Virtual Reality. ISPRS International Journal of Geo-Information. 2018; 7(6):215. https://doi.org/10.3390/ijgi7060215
Chicago/Turabian StyleHu, Ya, Jun Zhu, Weilian Li, Yunhao Zhang, Qing Zhu, Hua Qi, Huixin Zhang, Zhenyu Cao, Weijun Yang, and Pengcheng Zhang. 2018. "Construction and Optimization of Three-Dimensional Disaster Scenes within Mobile Virtual Reality" ISPRS International Journal of Geo-Information 7, no. 6: 215. https://doi.org/10.3390/ijgi7060215