Article

Inferencing Human Spatiotemporal Mobility in Greater Maputo via Mobile Phone Big Data Mining

by
Mohamed Batran
1,*,
Mariano Gregorio Mejia
1,
Hiroshi Kanasugi
2,
Yoshihide Sekimoto
1 and
Ryosuke Shibasaki
3
1
Institute of Industrial Science, The University of Tokyo, Tokyo 153-8508, Japan
2
Earth Observation Data Integration and Fusion Research Initiative, The University of Tokyo, Tokyo 153-8505, Japan
3
Center for Spatial Information Science, The University of Tokyo, Chiba 277-8568, Japan
*
Author to whom correspondence should be addressed.
ISPRS Int. J. Geo-Inf. 2018, 7(7), 259; https://doi.org/10.3390/ijgi7070259
Submission received: 7 June 2018 / Revised: 24 June 2018 / Accepted: 26 June 2018 / Published: 30 June 2018
(This article belongs to the Special Issue Geospatial Big Data and Urban Studies)

Abstract

:
The mobility patterns and trip behavior of people are usually extracted from data collected by traditional survey methods. However, these methods are generally costly and difficult to implement, especially in developing cities with limited resources. The massive amounts of call detail record (CDR) data passively generated by ubiquitous mobile phone usage provide researchers with the opportunity to innovate alternative methods that are inexpensive and easier and faster to implement than traditional methods. This paper proposes a method based on proven techniques to extract the origin–destination (OD) trips from the raw CDR data of mobile phone users and process the data to capture the mobility of those users. The proposed method was applied to 3.4 million mobile phone users over a 12-day period in Mozambique, and the data processed to capture the mobility of people living in the Greater Maputo metropolitan area in different time frames (weekdays and weekends). Subsequently, trip generation maps, attraction maps, and the OD matrix of the study area, which are all practically usable for urban and transportation planning, were generated. Furthermore, spatiotemporal interpolation was applied to all OD trips to reconstruct the population distribution in the study area on an average weekday and weekend. Comparison of the results obtained with actual survey results from the Japan International Cooperation Agency (JICA) indicate that the proposed method achieves acceptable accuracy. The proposed method and study demonstrate the efficacy of mining big data sources, particularly mobile phone CDR data, to infer the spatiotemporal human mobility of people in a city and understand their flow pattern, which is valuable information for city planning.

1. Introduction

The quality of urban life and a city’s economic growth may lie in how well its urban spaces and transportation infrastructure have been planned for and developed. In urban and transportation planning, it is critical to consider how to efficiently and effectively move people and goods in the city from their points of origin to their respective destinations by understanding how people conduct their daily activities and, with that, their travel behavior. Traditional methods persist in collecting such needed travel and activity behavior data via household and person-trip interview surveys and roadside monitoring. However, these activities are usually limited to a relatively small sample size, involve relatively large-scale deployment, and are resource intensive in terms of cost and labor. As we now enter the era of big data [1], and in light of advances in digital and sensing technologies that acquire big data, researchers in urban and transportation planning-related fields have been developing new approaches that utilize potentially better alternatives to traditional methods that can sense different aspects of crowd mobility with less effort and money while maintaining an acceptable level of accuracy.
The widespread use of pervasive sensors allows different levels of human mobility to be captured, and to better describe the displacement of people in time and space. Such is the case of mobile phones that are arguably the highest scale consumer tech in the world with 66% global penetration rate and more than five billion unique worldwide subscribers in 2017 [2]. In much of Sub-Saharan Africa, mobile phones are more common than access to electricity [3]. Mobile phone data, also known as call detail records (CDR), is a digital record passively produced and collected by telecommunications equipment of mobile network operators (MNOs) for each instance of mobile phone communication usage (i.e., voice calls, short message service (SMS), and internet service). Each record includes the exact time stamp and the location of the used telecommunications tower. Thus, mobile phone data has been seen by urban planners and traffic engineers as a promising source to develop a wide range of smart city applications [4] such as enhancing smart mobility and transportation, as well as collecting reliable information about real-time population distribution.
The advantages of using mobile phone data over traditional methods include ease and continuous streaming of data over a long period of time. While traditional survey methods provide a snapshot of the traffic situation in a typical weekday, mobile phone data can capture weekday and weekend travel patterns, as well as seasonal variation [5] of a large sample of the population at a low cost and wide geographical scale [6]. On the other hand, limitations of mobile phone data include sparseness [6], representativeness [7], and anonymity [8]. Arai, 2013 [9] discussed the previously mentioned limitations and their impact on mobile phone data analysis results. Despite the limitations, researchers have been trying to handle such data with various statistical measures to extract useful information and add social value.
Studies have demonstrated the use of CDR data analytics to understand the travel behavior and mobility of people in cities and generate meaningful results that are readily useable and interpretable for city planning purposes. The trajectory of 100,000 individuals was analyzed by [10] from their call record history and concluded that human trajectories show high degree of spatial and temporal regularity, and that humans follow a simple reproducible pattern. The concept of motifs from network theory was employed by [11] to analyze different travel patterns in Paris, France. The authors were able to detect 17 unique travel network patterns in the daily mobility of the population, which are sufficient to capture 90% of the trip patterns found from travel survey data. In addition to mobility behaviour of the individual, [12] studied the spatial structure of 31 Spanish cities from mobile phone data of the population. They were able to define a set of indicators to classify cities from the dynamic of their population. A framework to detect patterns of road usage in a city using mobile phone data was developed by [13]. They found that only few road segments are congested and that most of those segments can be associated with few major driver sources. Estimating the origin and destination (OD) of trips has been an active area of research in the past decade. Early studies [14] using synthetic vehicular and mobile phone data have shown that mobile phone data have great potential. An origin–destination matrix from mobile phone data was developed by [15] by extracting tower to tower transient OD, and using a simulator to estimate the appropriate scaling factor. In addition, various efforts to estimate characteristics of individual trips extracted from mobile phone data has emerged. A method to infer transportation mode was proposed by [16] based on travel time extracted from CDR data in the city of Boston. Although CDR data is coarse-grained, their method demonstrated acceptable accuracy on par with that obtained using fine-grained data. A method to estimate transportation mode from mobile phone data was developed by [17] by incorporating geographic information system (GIS) urban transportation network data to estimate modal split at a given location. The movement of people in Yangon was esrtimated by [18] within a limited time frame separately for weekdays and weekends based on CDR data. The origins and destinations of the trips were taken based on traffic analysis zones corresponding to the cellular tower in which the record was made. CDR was utilized by [19] in Singapore to examine human travels in an activity-based approach that focused on patterns of tours and trip-chaining behavior in daily mobility networks. They developed an integrated pipeline that included parsing, filtering, and expanding massive and passive raw CDR data and extracting meaningful mobility patterns from them that can be directly used for urban and transportation planning purposes. An activity-aware map was developed by [20] that described the probable daily activities of people (during weekdays) for specified areas based on CDR data. Their results showed a strong correlation in daily activity patterns within the group of people who share a common work area’s profile. Furthermore, it had the advantage of being low cost and suitable for statistical analysis on the transportation modes of a large population. Meanwhile, in a more practical application of mobile phone big data mining, Toole et al. 2015 [21] demonstrated a full method of transportation demand modeling that utilizes CDR data as the main input, and developed an interactive visualization platform that provides output readily interpretable by planners and policymakers. Demographic attributes and socio-economic indicators are also essential in parallel with trip information. First evidence that a subscriber’s personality can be inferred from his/her mobile phone records was provided by [22]. The authors were able to predict subscribers’ personality traits with 42% accuracy. Furthermore, Blumenstock, Cadamuro and On, 2015 [23] and Steele et al. 2017 [24] attempted to build predictive maps on poverty from mobile phone record data in Rwanda and Dhaka, respectively.
We adopted some of the techniques used and proven in these studies to demonstrate the mining of mobile phone big data to extract meaningful information for understanding the daily mobility of people in Greater Maputo, which is a first for CDR data analytics in Mozambique. We also introduce the use of the high-resolution settlement layer (HRSL), developed by the Facebook Connectivity Lab and Center for International Earth Science Information Network (CIESIN). To our knowledge, HRSL has never been used in combination with CDR data in previous studies to expand the CDR user sample to the actual population. Furthermore, we incorporate widely available geographic information from OpenStreetMap, and show how to derive the spatiotemporal distribution of the population in Greater Maputo on an average weekday and weekend. To evaluate the accuracy of our method against traditional survey methods, we introduce a validation approach that compares our results with actual available person-trip survey data in three different spatial resolutions comprising the traffic analysis zones (TAZs) established in the report of the Japan International Cooperation Agency (JICA) [25].
The remainder of this paper is organized as follows: Section 2 explains in detail the study area and the data used, which include the CDR data for trip estimation, the HRSL population data for expanding the user sample to the population, and the JICA survey data used for validation. Section 3 explains the proposed methodology in detail, from preparing the study area to scaling up the sample to represent the actual population. Section 4 presents experimental results of the proposed method, and its validation with survey data. Finally, Section 5 presents concluding remarks, including discussion of the potential of the proposed method for actual application in urban and transportation planning and development.

2. Study Area and Data
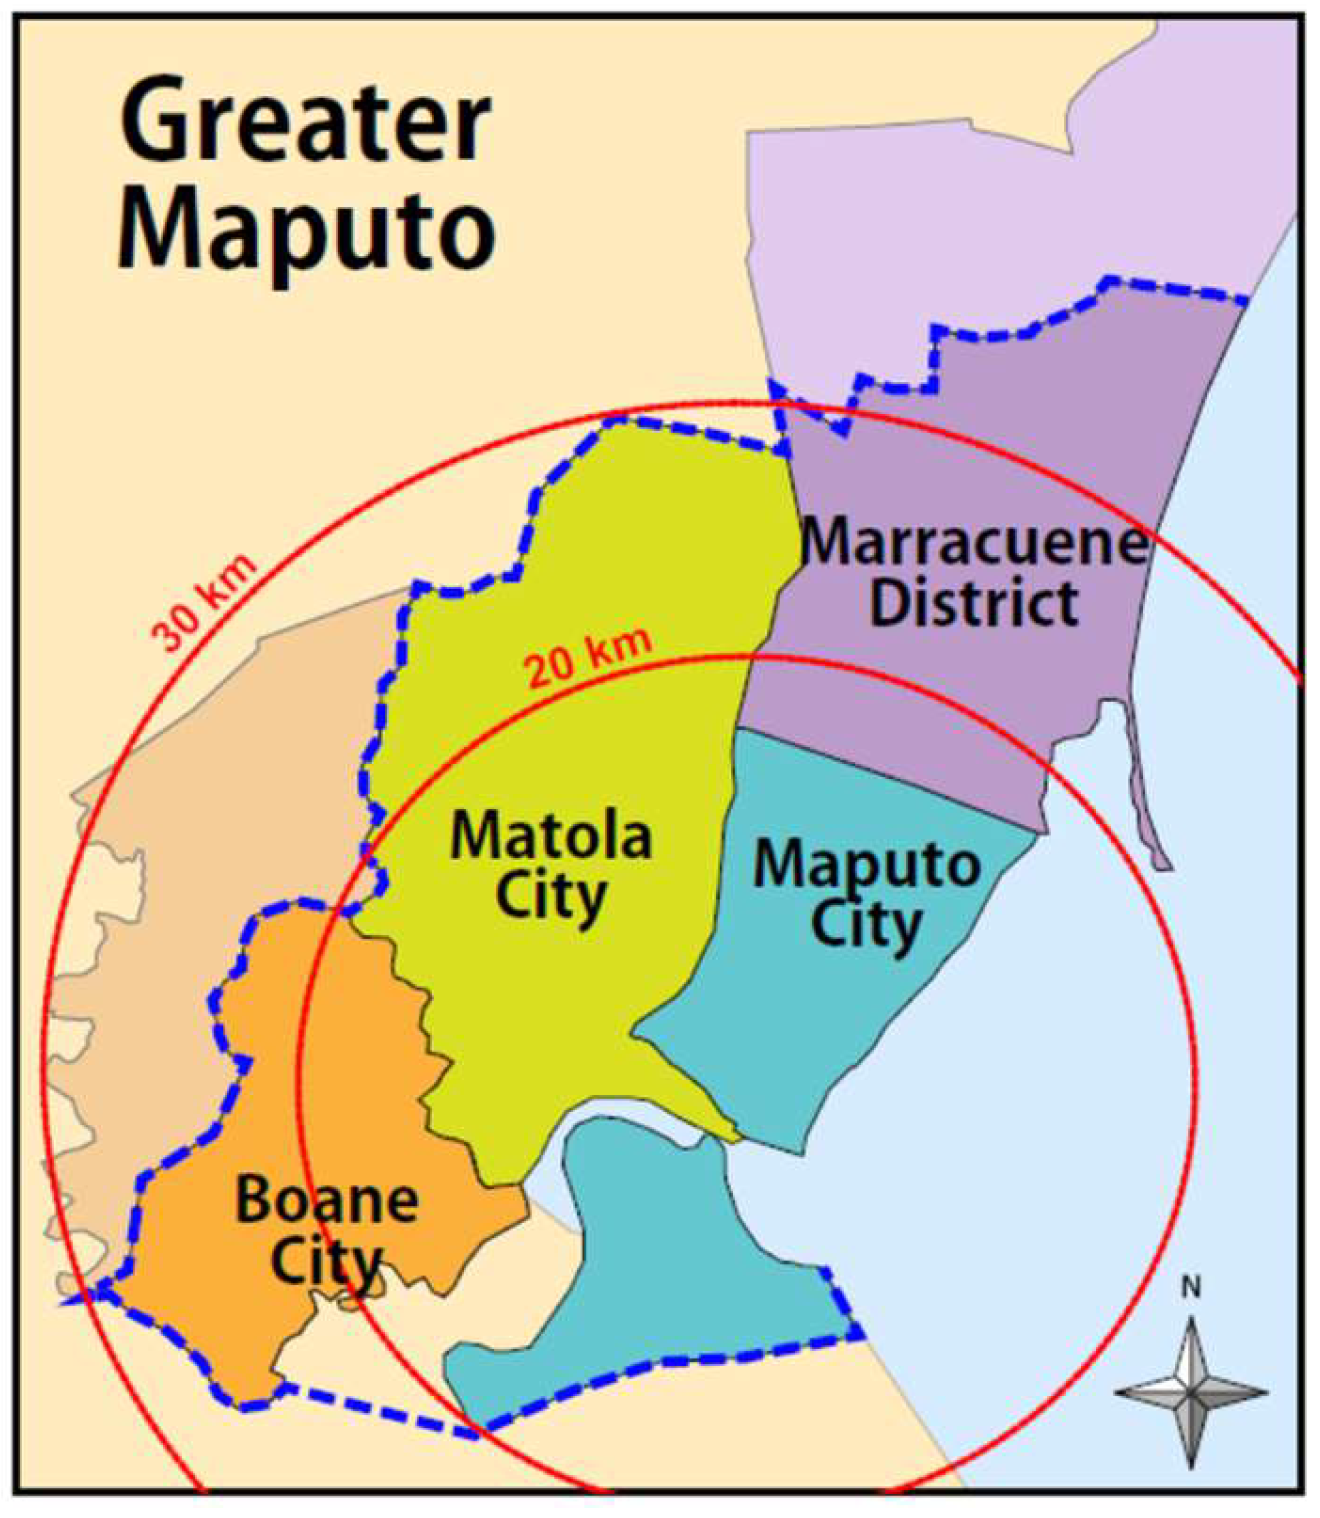
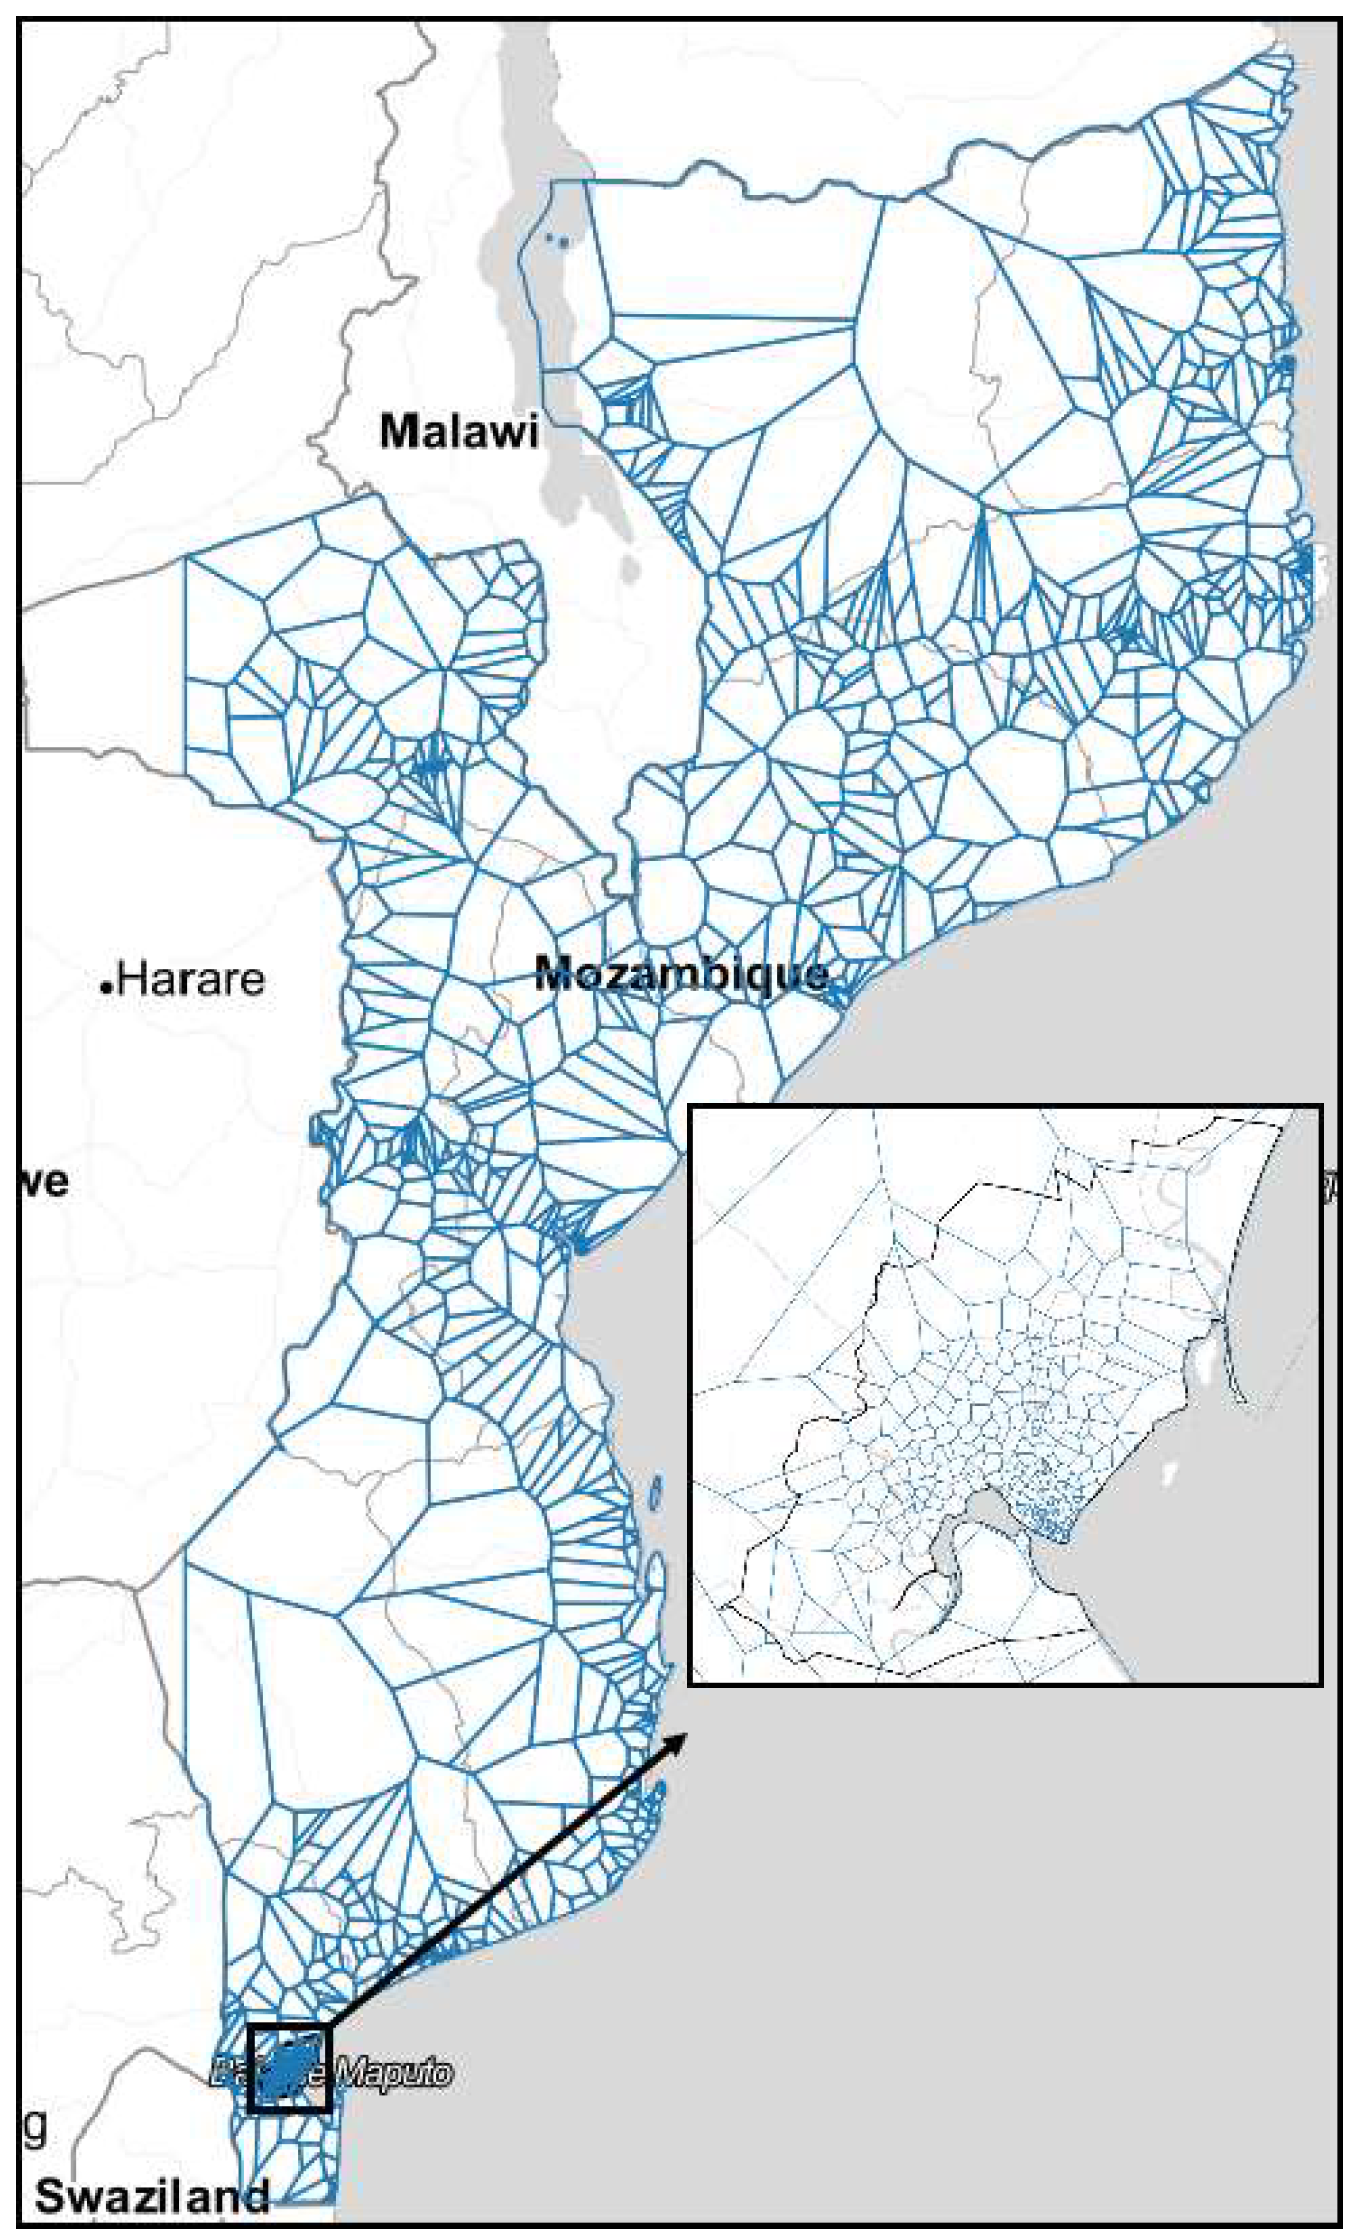
2.1. Study Area

The study area was Mozambique’s Greater Maputo metropolitan area—consisting of the capital city Maputo, Matola City, Boane City, and Marracuene District. In recent years industrial and residential development and the growing urban population has spread from Maputo City, the country’s political and industrial center, to the neighboring areas of Matola, Boane, and Marracuene, creating the 120,767-ha Greater Maputo metropolitan area, as shown in Figure 1 [25]. According to JICA’s forecast for the medium term from 2012 to 2035, the population of Greater Maputo is expected to increase from 2.2 million to 3.7 million and its economy to grow by a factor of 2.3 in terms of gross domestic product (GDP) per capita. With urban and economic development, Greater Maputo has seen more movement of people and goods, and with it, worsening traffic conditions in its underdeveloped road network. The number of daily person trips is estimated to more than double, from 3.1 million trips/day in 2012 to 6.5 million trips/day in 2035, with car ownership increasing by a factor of 1.5 for the same medium-term period [25]. These rapid growth development indicators imply an urgent need to formulate a comprehensive master plan that can facilitate implementation and improvement of Greater Maputo’s public transport infrastructure and road network [25].

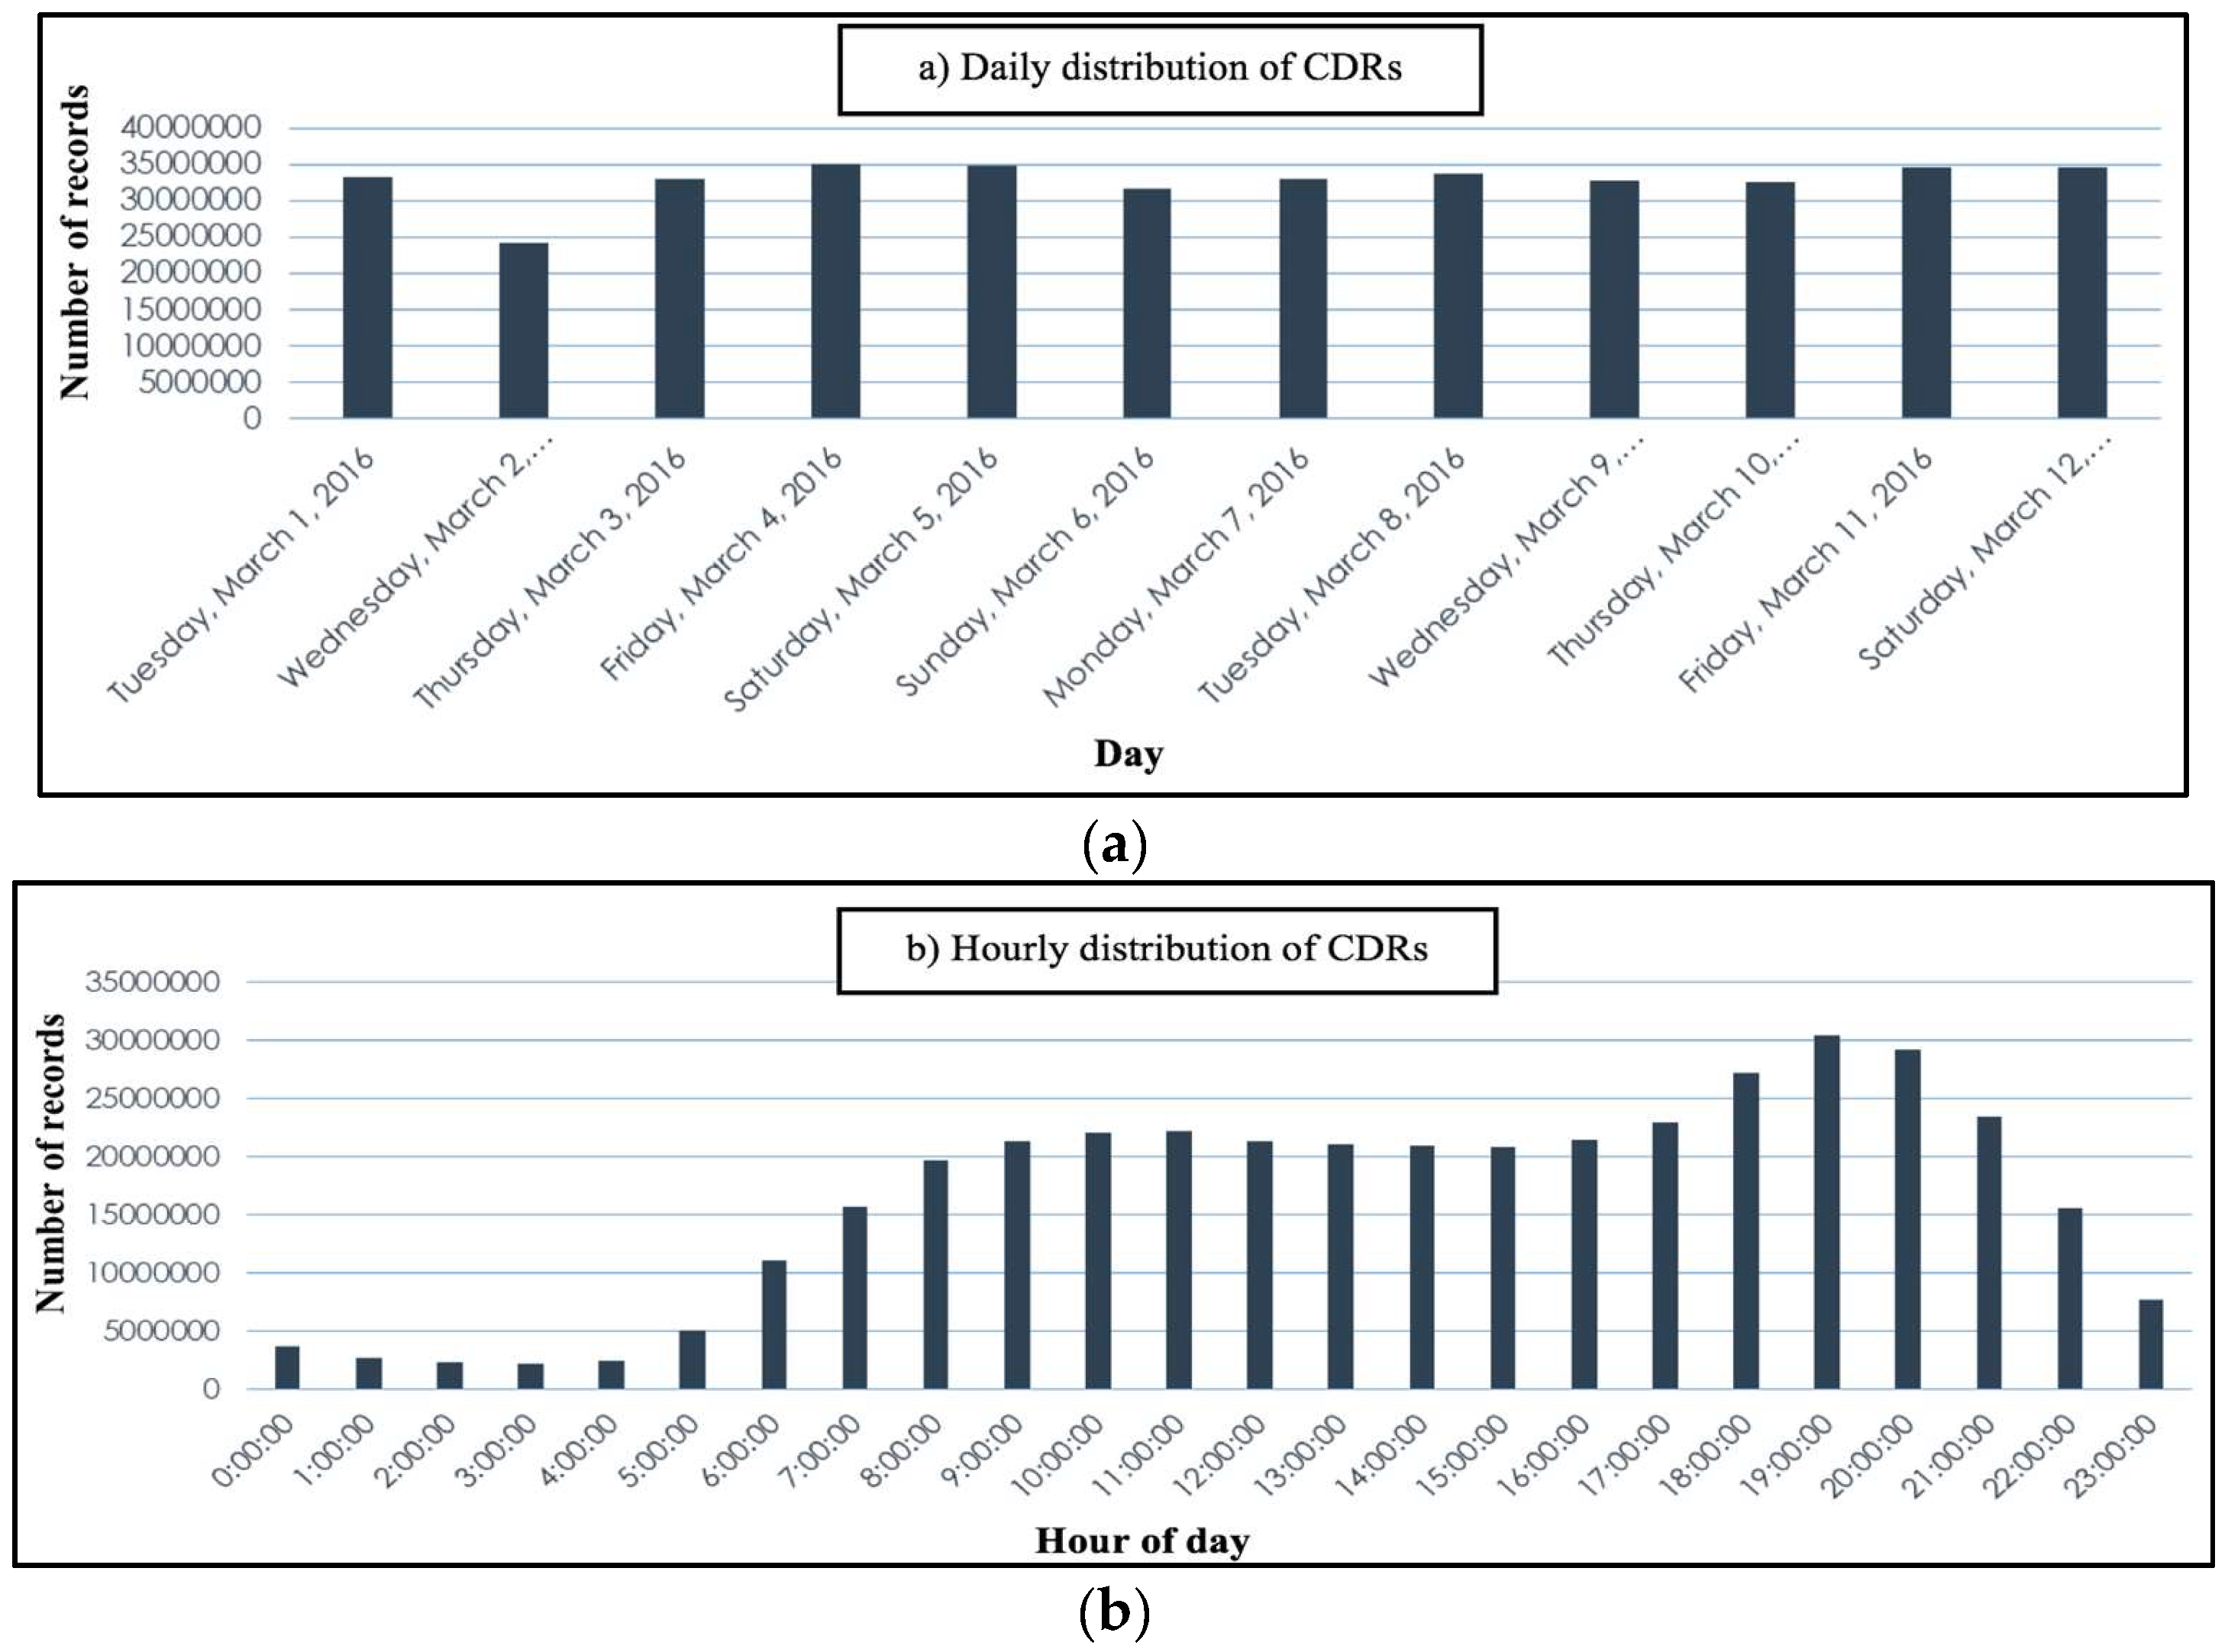
2.2. Call Detail Record (CDR) Data

This study used mobile phone CDR data collected over a 12-day period, i.e., 1st to 12th of March 2016, from a major mobile network operator (MNO) in Mozambique. The raw CDR dataset contained a total of 393 million mobile phone usage records from 3.4 million anonymous subscribers of the MNO nationwide. The observation period include 9 weekdays and 3 weekends and does not include any public or religious holidays that may have different mobility patterns. As stated above, three main types of mobile phone usage are considered: (1) making/receiving a voice call, (2) sending/receiving a text message by SMS, and (3) using data or internet service. Because of privacy issues, all personal information in the CDR that may reveal the subscriber’s identity were anonymized by the MNO prior to its distribution. The relevant information contained in the CDR data include the user ID, timestamp and type of mobile phone usage, and ID and location of the recording cellular tower.
Figure 2 shows the temporal distribution (daily and hourly) of the raw CDR dataset. It should be noted that the 12-day observation period consists of nine weekdays and three weekends. The daily distribution shows a consistent number of recorded mobile phone usage for all days, with the exception of one day, i.e., 3 March 2016 (Wednesday), which has a relatively low number of records (minimum value). Meanwhile, it is interesting to see that the hourly distribution shows low mobile phone usage records between midnight and 5:00 am, the time period when most of the population is expected to be sleeping. On the other hand, the most active period is between 6:00 pm and 8:00 pm. The trip identification efficiency relies on the number of mobile phone records, which is relatively high from 8:00 am until 11:00 pm based on the hourly distribution. It is expected that it is within this time frame that most trips occur—particularly people traveling between their home and workplace or some other place, and would statistically provide better trip estimates.

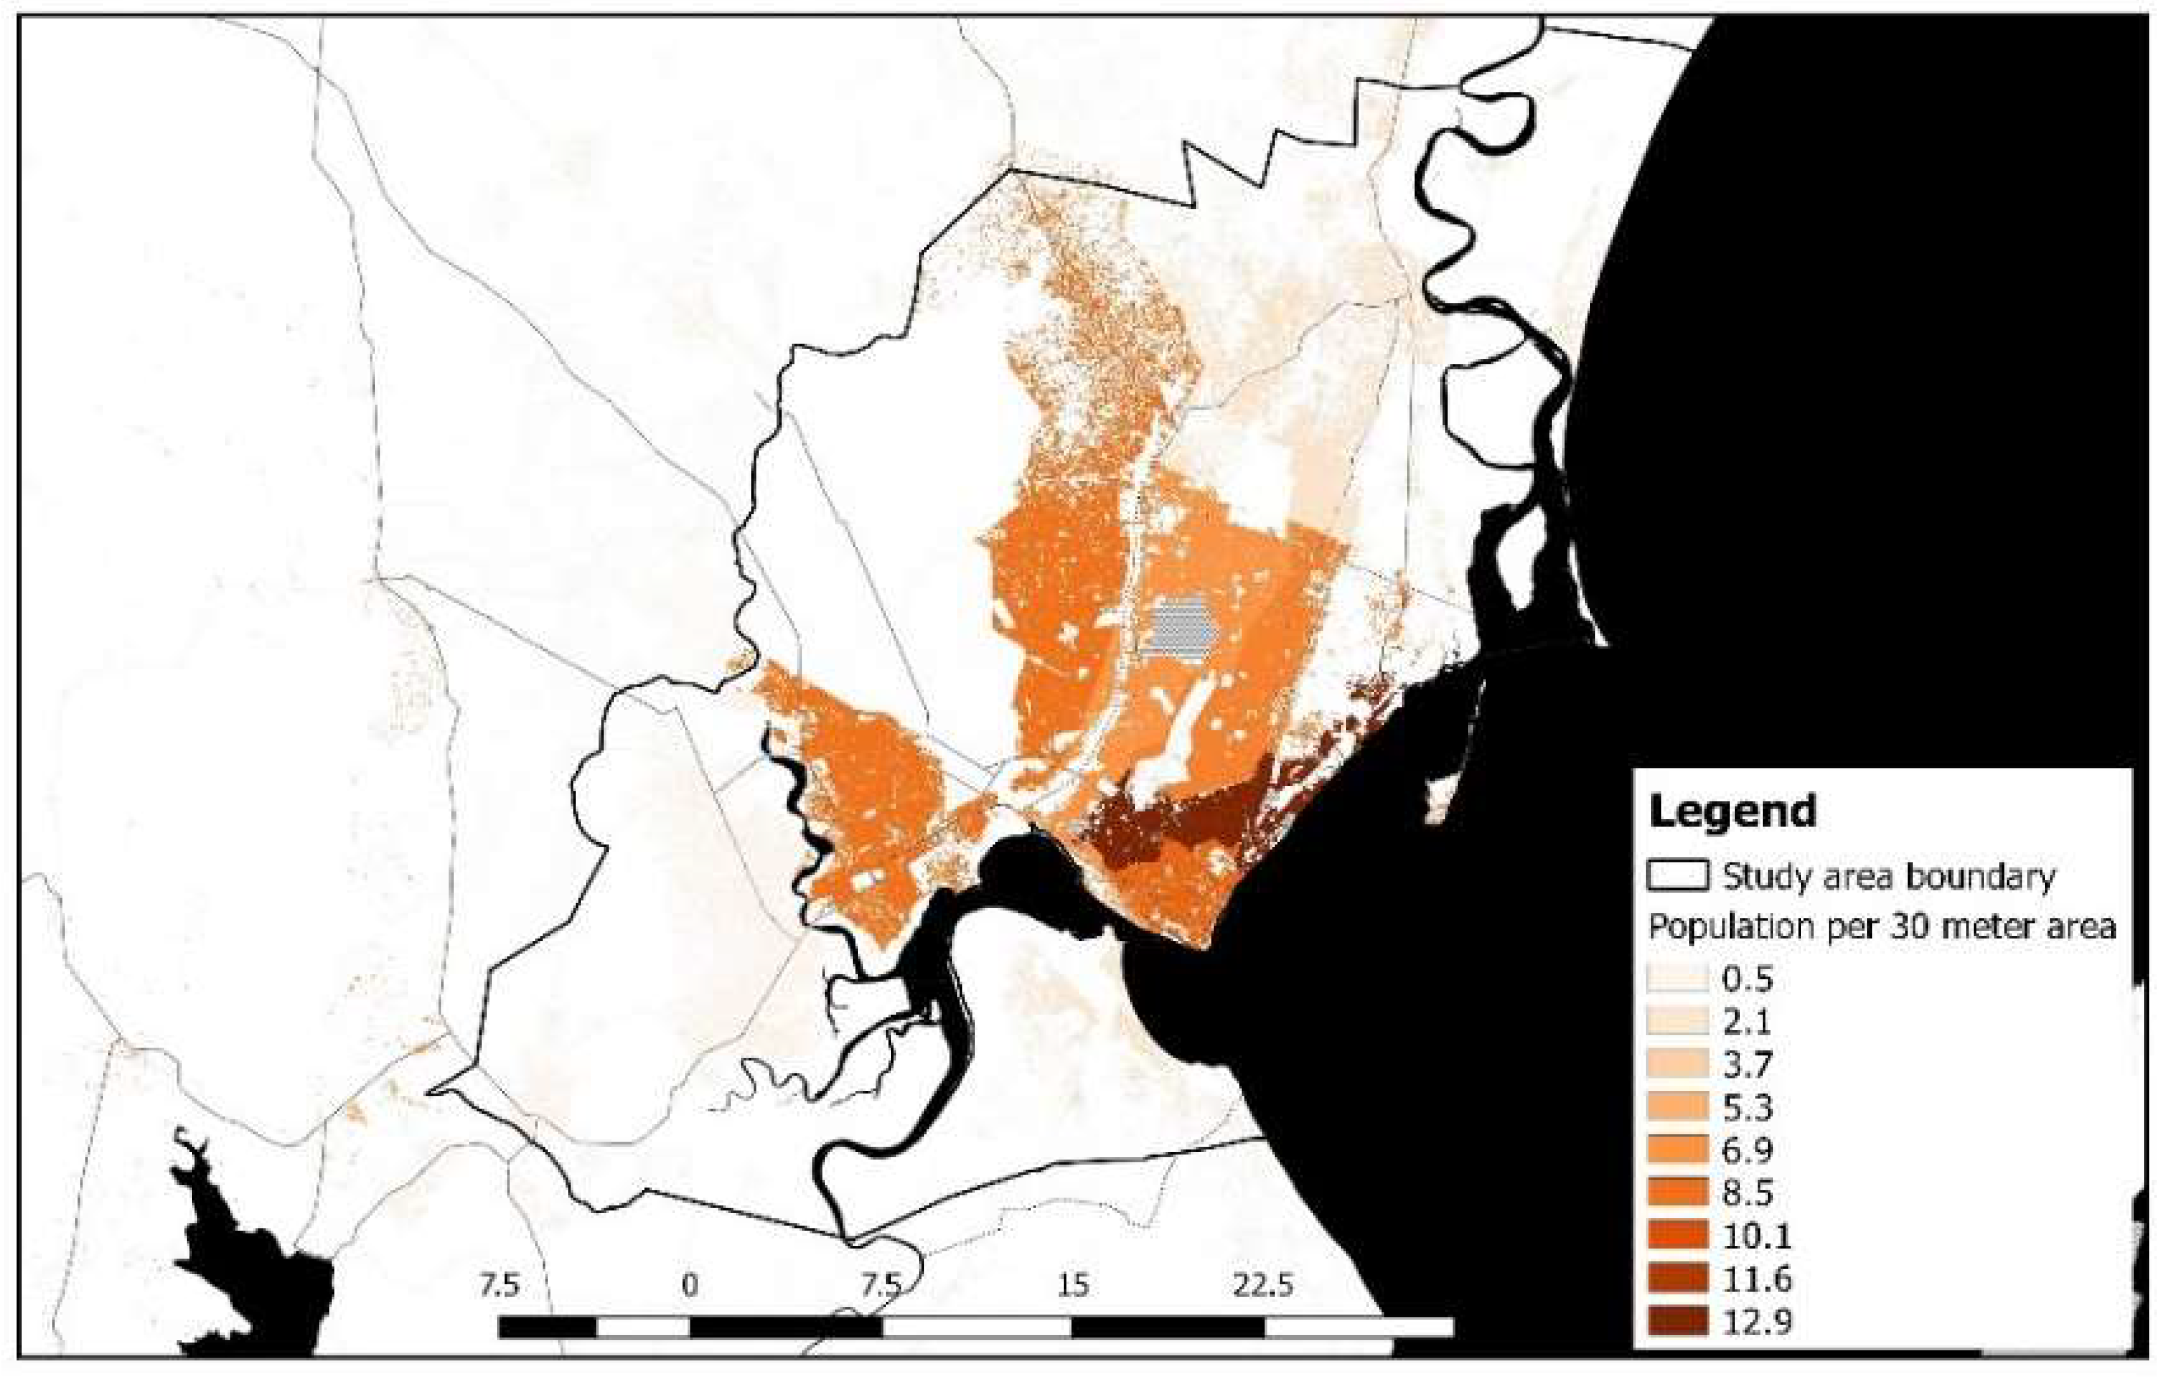
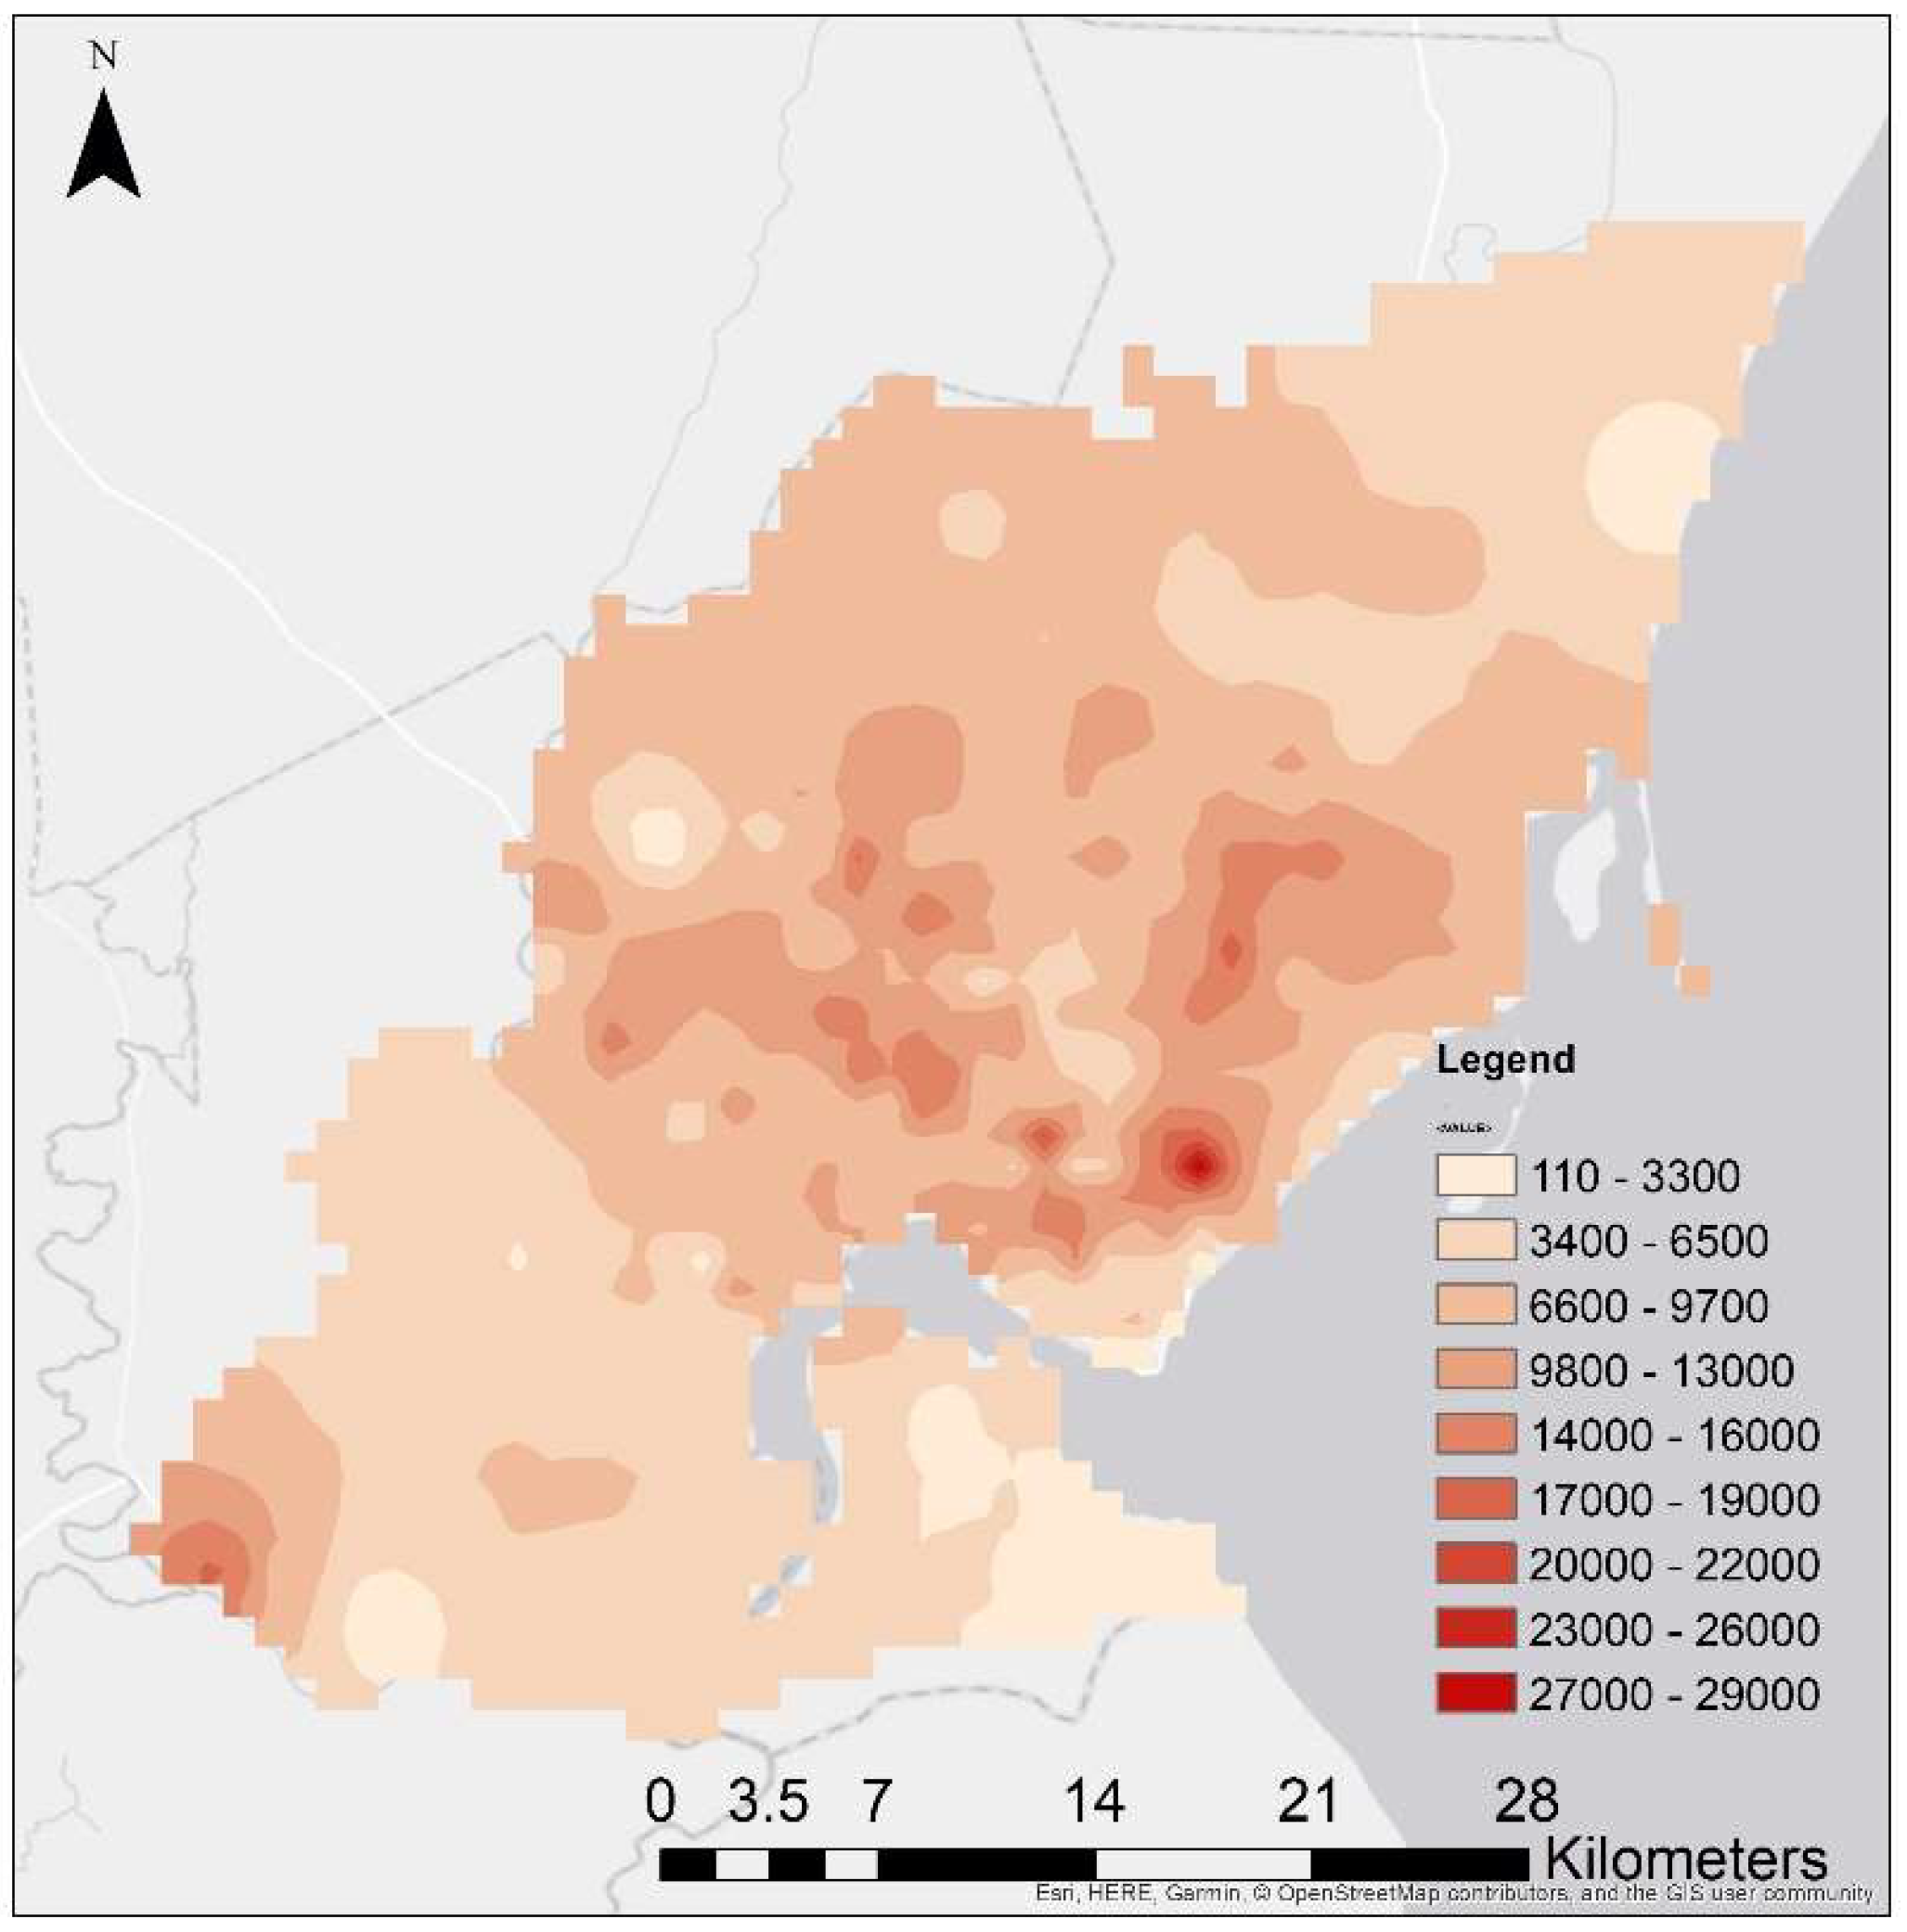
2.3. Population Data from the High-Resolution Settlement Layer (HRSL)

Clearly mobile phone dataset described in Section 2.2 represents a sample of the population and need to be combined with accurate information about population distribution as will be discussed in Section 3.5. This study used Greater Maputo’s population data obtained from the HRSL. The HRSL developed for Mozambique, as shown in Figure 3, provides estimates of human population distribution at a resolution of one arc-second (approximately 30 m) for the year 2015 based on recent census data and high-resolution satellite imagery from DigitalGlobe [26]. This is done by first extracting urban settlements from the 0.5-m spatial resolution satellite imagery by the Connectivity Lab at Facebook using computer vision techniques, then applying proportional allocation to distribute population data from subnational census data to the settlement extent. (Detailed information about the HRSL can be found on the CIESIN website.). This means that HRSL is a finer disaggregated version of traditional census data and that it can be used with confidence to calculate the population in any arbitrary area of interest. Accordingly, the HRSL population distribution is used to estimate the population at the cellular tower zone level, which is represented by Voronoi zones, as discussed in Section 3.1. The estimated total population in the study area is 2,661,832. Statistics on the resulting population aggregation to the Voronoi polygons in the study area are summarized in Table 1. This means that the mean of the total population living within the boundary of Voronois is 10,277.

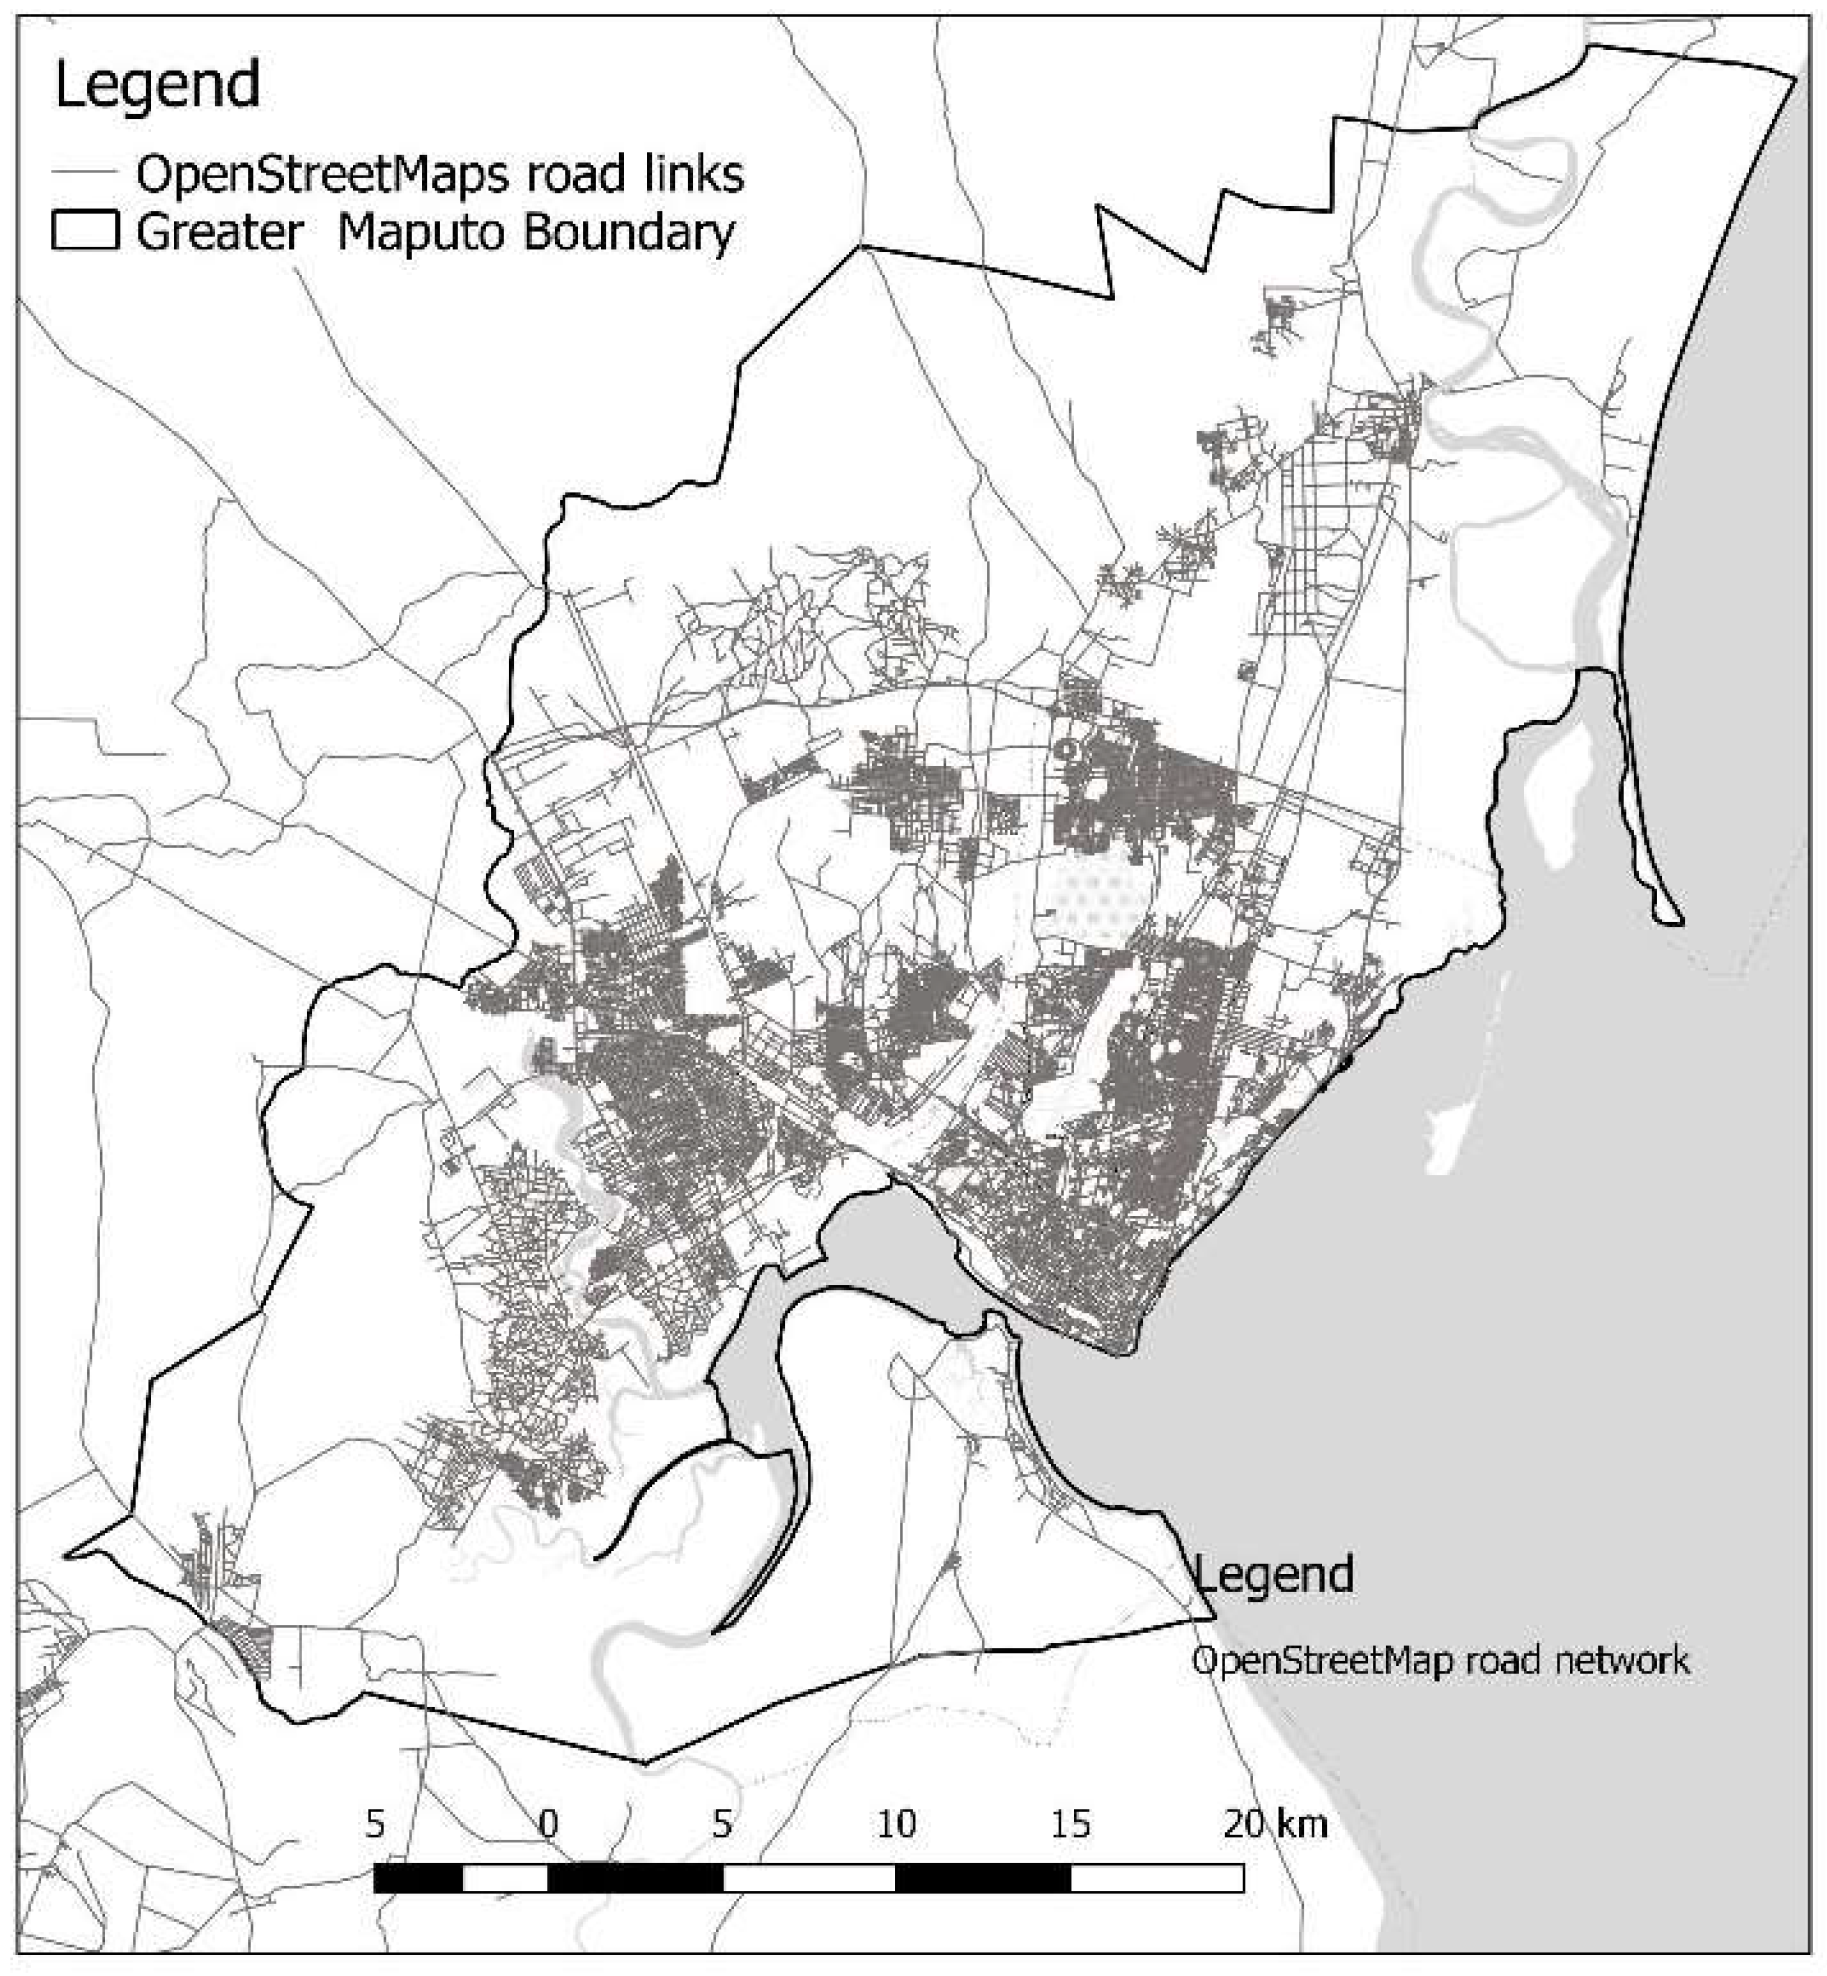
2.4. OpenStreetMap Road Network Data

Similar to HRSL which will be used to scale up subscribers to represent the population. Mobility should be analyzed with consideration of the existing transportation infrastructure in the study area. This is particularly useful in reconstructing the route of each trip along available transportation network infrastructure which will provide more realistic estimation of the population distribution as will be discussed in Section 3.6. In this study, we use OpenStreetMap (OSM) [27] which is a collaborative project that provides anyone free access to crowdsourced geographical data of the world. Since the data itself is collected by volunteers, data representativeness varies from one country to another. OSM data in Mozambique contains over 400,000 road links (as of May 2018) with sufficient coverage in the Greater Maputo area to represent the transportation network in the study area, as shown in Figure 4.

2.5. Japan International Cooperation Agency (JICA) Survey Data for Results Validation

To assess the validity of the proposed method and its output, we compare the results to the most recent person-trip survey data obtained from JICA’s Comprehensive Urban Transport Master Plan for the Greater Maputo project [25]. The JICA survey sampled a total of 38,216 persons over the age of six from 9983 sampled households, producing a total of 65,168 trips in one day. In the classical four-step demand forecasting model, the first step (which is trip generation) estimates the number of trips originating from and attracted to TAZs that are defined based on socio-economic, demographic, and land-use attributes of the cordoned area [28]. To validate our results, we considered three TAZ levels based on the zoning levels of the Greater Maputo metropolitan area in the JICA report; specifically, A TAZ, B TAZ, and C TAZ, as shown in Figure 5. The TAZs of the C TAZ level were identified for the JICA survey and for transport modeling purposes. They correspond to the administrative boundaries of the “bairro,” where census data are available. A few bairros were consolidated to form larger TAZs for the B TAZ level, and further consolidation occurred to result in four large TAZs for the A TAZ level. Table 2 shows a statistical summary of the three TAZ levels.

3. Methodology

In extracting the origin–destination (OD) trips from raw CDR data, and scaling them to represent the mobility of the actual population of Greater Maputo in different time frames (weekdays and weekends), we propose a method that incorporates proven techniques from previous research [11,18,19]. Our method involves the following: (1) Voronoi tessellation of the study area, (2) estimation of the home location of subscribers, (3) filtering of valid user-days of the sample, (4) extraction of mobility/OD trips of the filtered sample, and (5) application of two types of magnification factors—one to scale up the user sample to represent the actual population in each zone, and the other to normalize the user sample to one observation day.

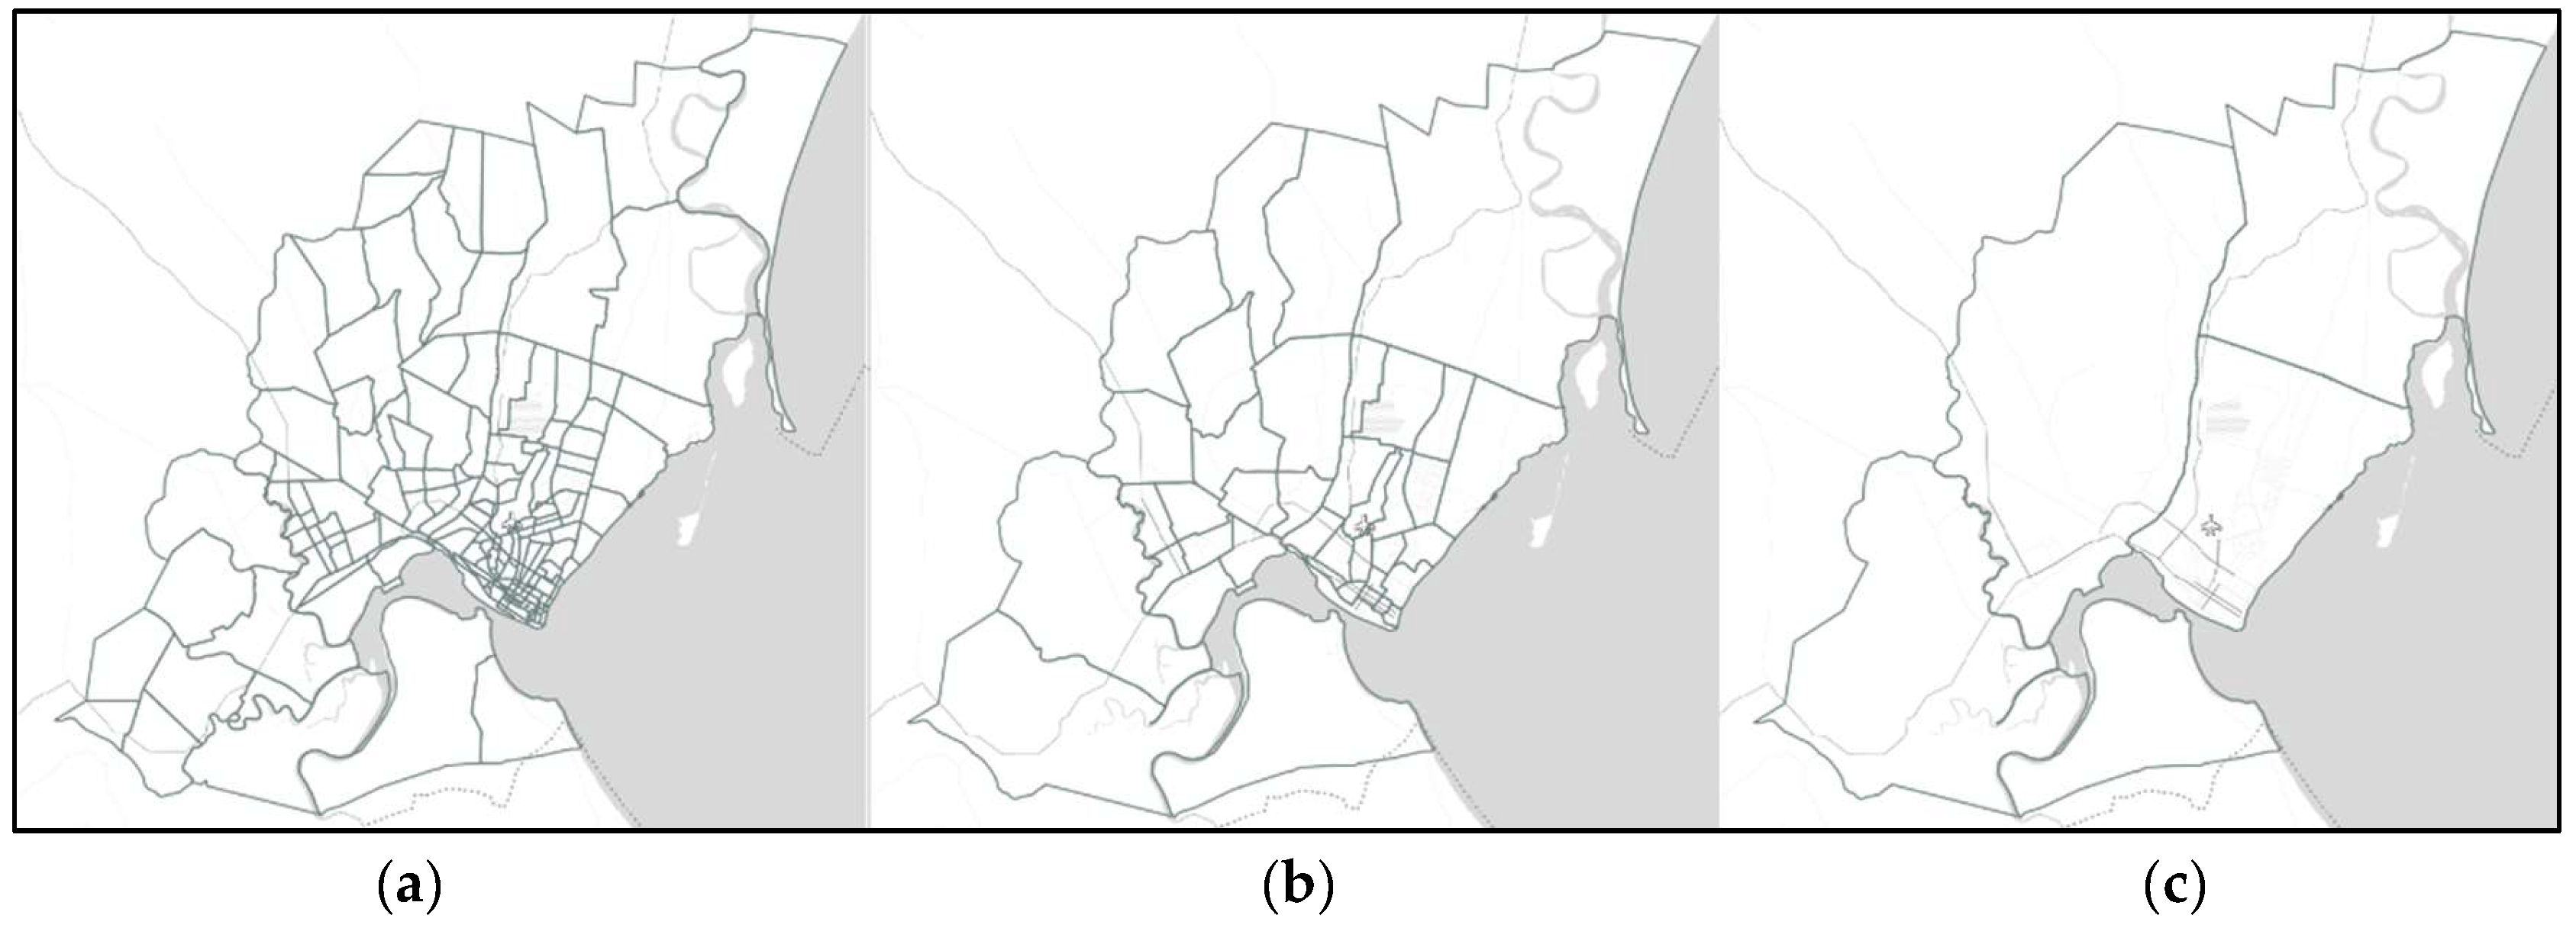
3.1. Voronoi Tessellation of the Study Area

There are 259 cellular towers in the study area, which are spatially distributed in relation to the distribution of population density. The density distribution of the cellular towers, and correspondingly the mobile phone network coverage area, increases toward the city center and central business district. In general, there is overlapping of coverage areas of neighboring cellular towers, which should be considered in order to appropriately represent the locational boundaries of each tower. Accordingly, a centroidal Voronoi [29] diagram of the cellular tower network in the study area was developed, as shown in Figure 6. Each Voronoi tessellation approximately represents the mobile phone network coverage and, correspondingly, the area coverage of each cellular tower. Table 3 gives a summary of the Voronoi tessellations in the study area. The minimum area coverage is 0.01 km2 and the maximum is 241.21 km2, whereas the mean and median are 8.15 km2 and 1.81 km2, respectively.

3.2. Home Location Estimation

There are several reasons why there is a need to identify the home location of the subscribers [19]. Firstly, it is needed when combining the CDR data and the population data from the HRSL to scale up the user sample to represent the actual population. Secondly, we considered only the users living within the study area; thus, if a user was found to have a home location outside the study area they were excluded from the sample. Thirdly, the environment and attributes of people’s homes, such as land use, affects their travel behavior and activities [30,31]. This is important to understand people’s mobility and travel behavior as affected by the space or environment that surrounds them, especially from an urban planning and development perspective [19].
Accordingly, we estimated the most probable location of a subscriber’s home based on their mobile phone usage records. It is expected that most people would be at home at night and during the weekends, rather than during working hours on weekdays. The home location of subscribers was estimated based on the frequency of recorded mobile phone usage at cellular towers (corresponding to the Voronoi zones) at these times. The “night time” considered for this study was between 8:00 pm and 6:00 am, because this time period was found to be when most of the people in Greater Maputo are at home according to the JICA household survey. Furthermore, most of the population reside outward of the city center in Maputo, in the outskirts of the study area. Therefore, the cellular towers (Voronoi zones) located in these areas were considered as home locations of the subscribers. Other subscribers with home locations estimated outside of the study area were excluded from the sample. Therefore, from our home estimation location, we found 1,279,291 subscribers living within the study area out of the 3.4 million subscribers of the whole Mozambique (approximately 37%). This corresponded to 48% of the total population of Greater Maputo estimated using HRSL (2,661,832 people). Figure 7 shows the distribution of subscribers living in the study area resulting from the home location estimation. The average number of subscribers served by each cellular tower is 7250, which is less than the mean population per cellular tower (10,277) as presented in Table 1.

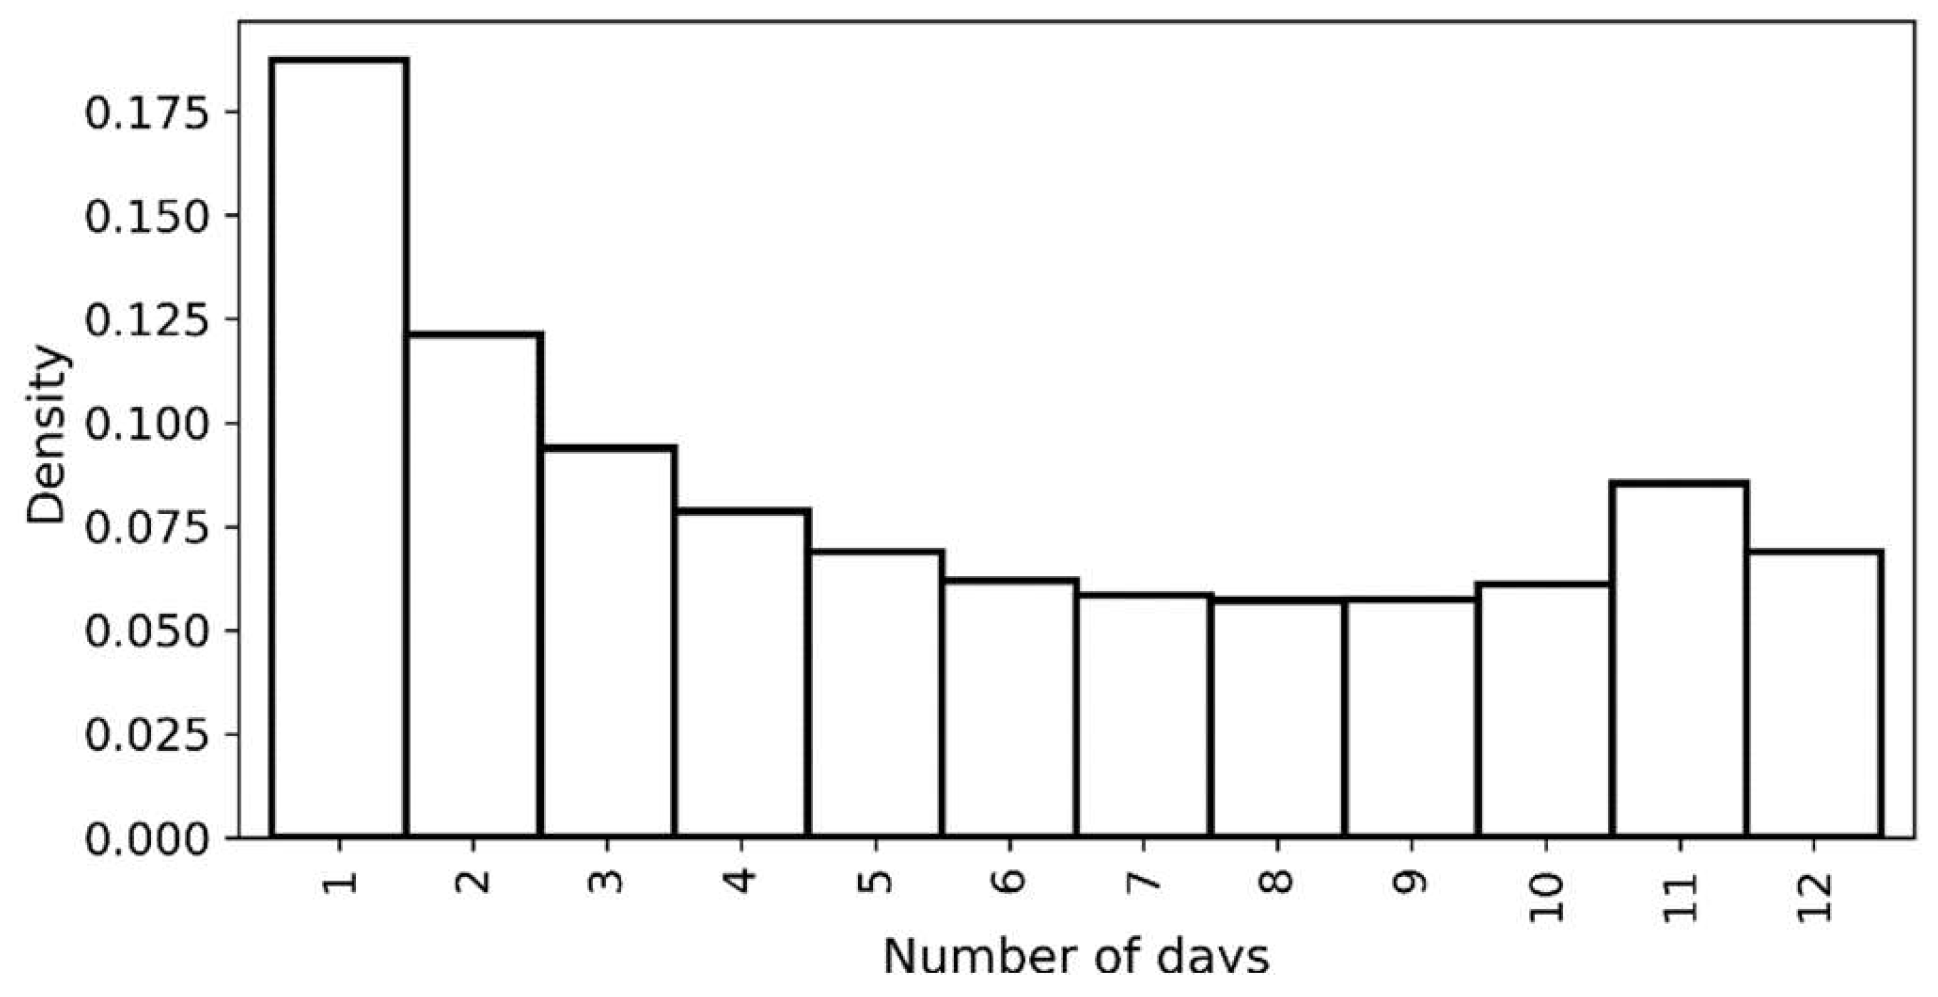
3.3. Filtering Valid User Days

According to Jiang, Ferreira and Gonzalez, 2017 [19], the advantages of CDR data are its longer sample period and larger sample size compared to traditional survey data, whereas its disadvantage is its sparseness. As such, it is important to consider user days with much mobile phone activity or usage. According to previous studies [11,19], extracting individual mobility patterns from CDR data can be regarded as statistically consistent and comparable with that of traditional survey data given that a certain threshold of daily mobile phone activity or usage is met by users. The value of this threshold should not be overly small as it would favor shorter trip patterns, and not overly large as it would exclude too many users [11]. In this regard, this study used similar filtering rules, as follows:
  • A day is valid for a user if he/she has a CDR in at least eight of the 48 half-hour time slots in one day (24 h).
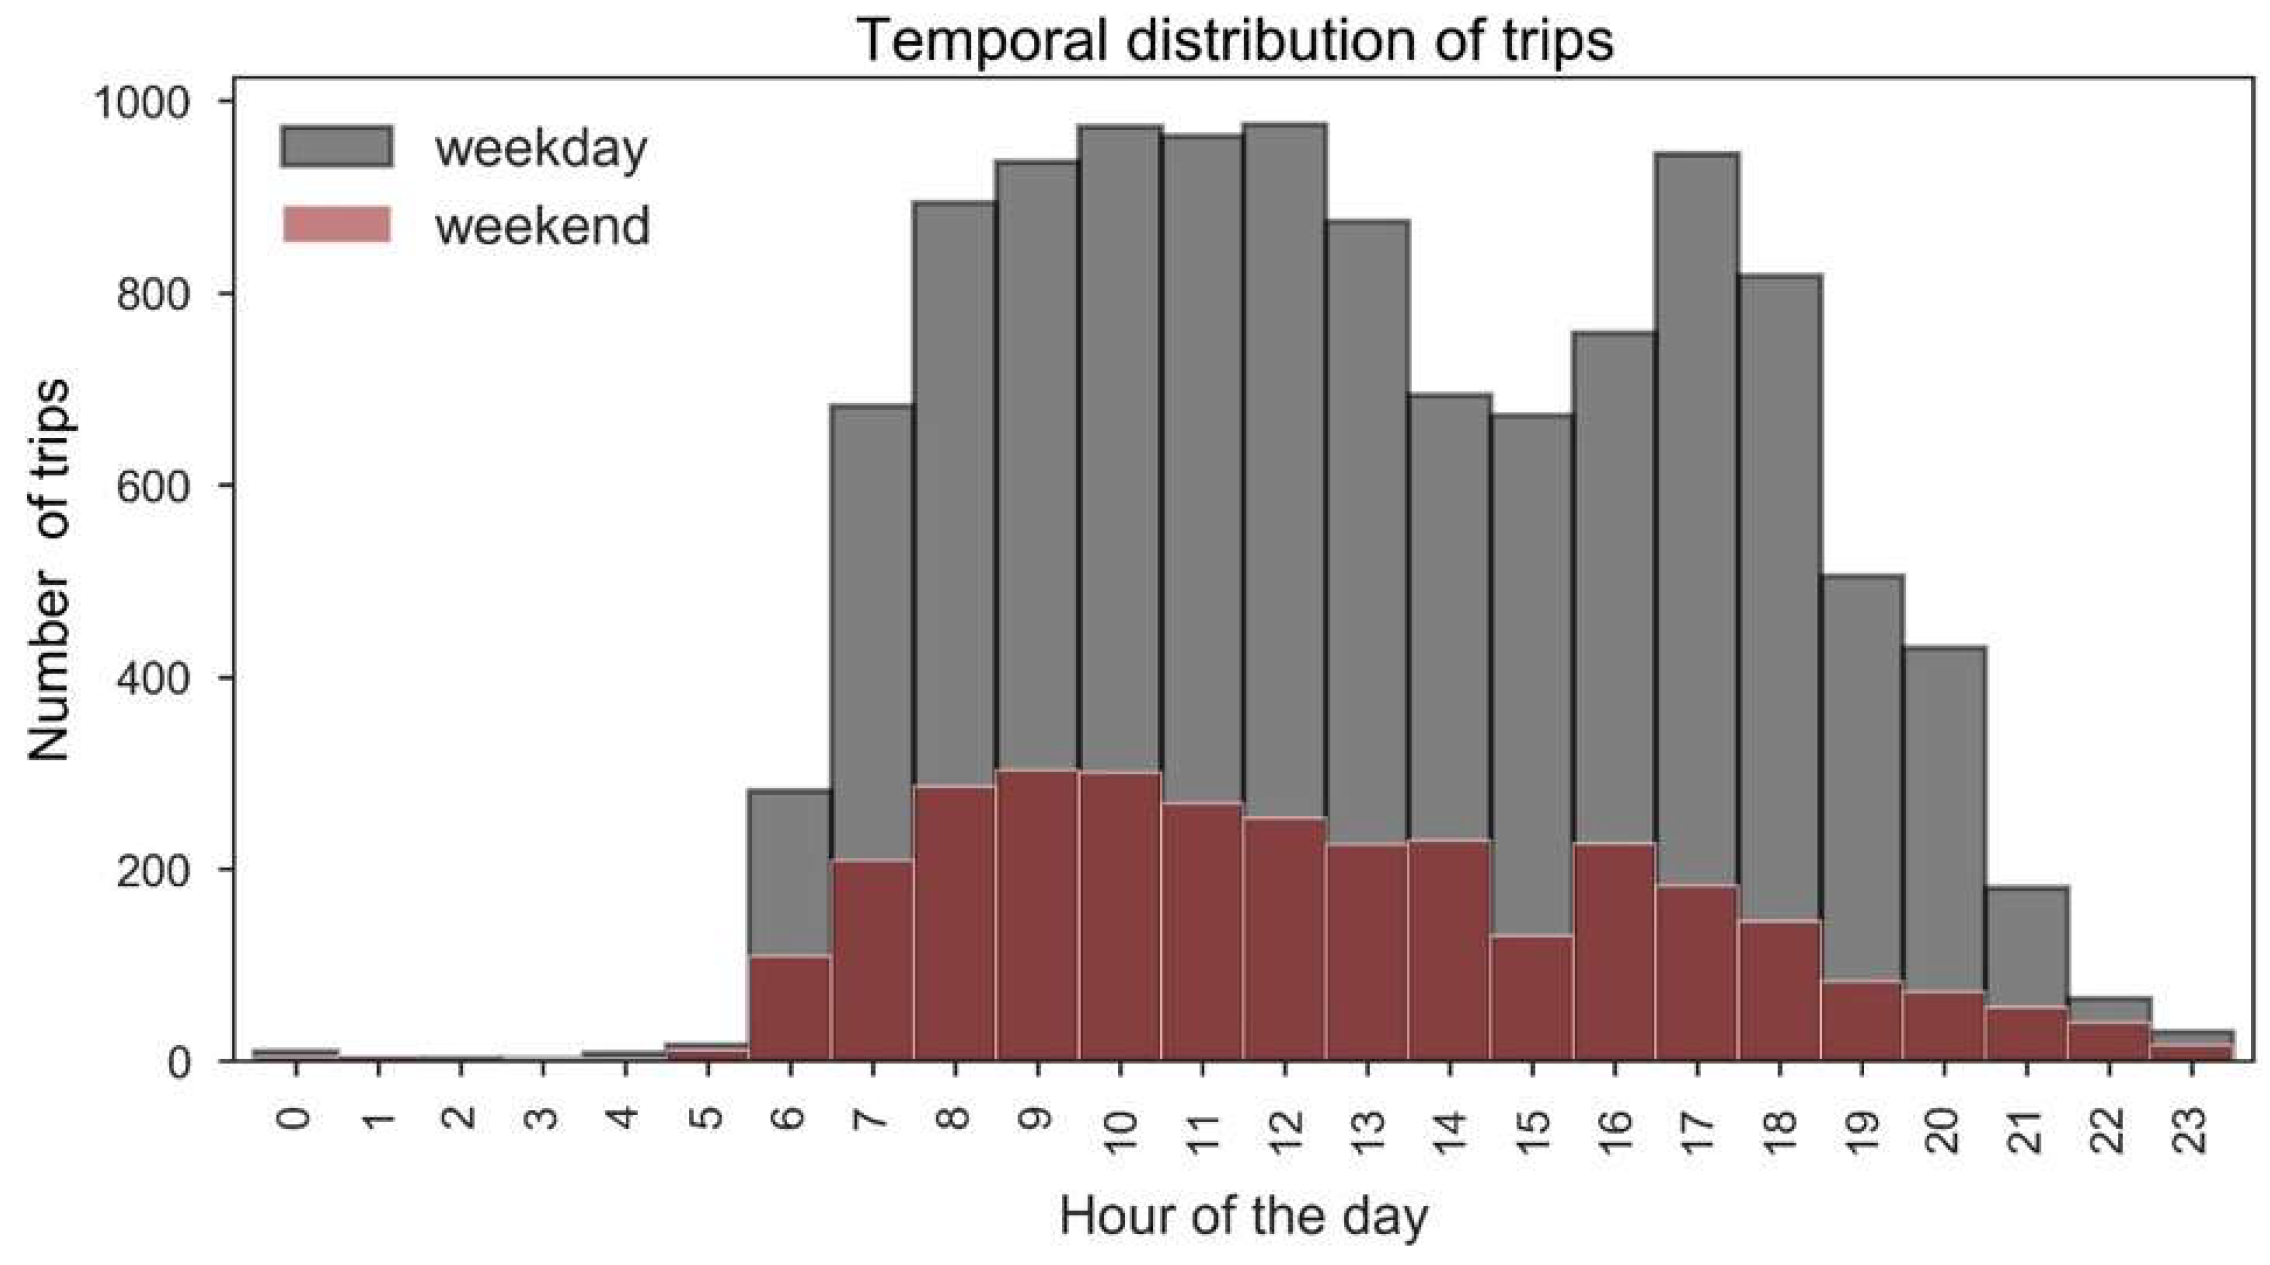
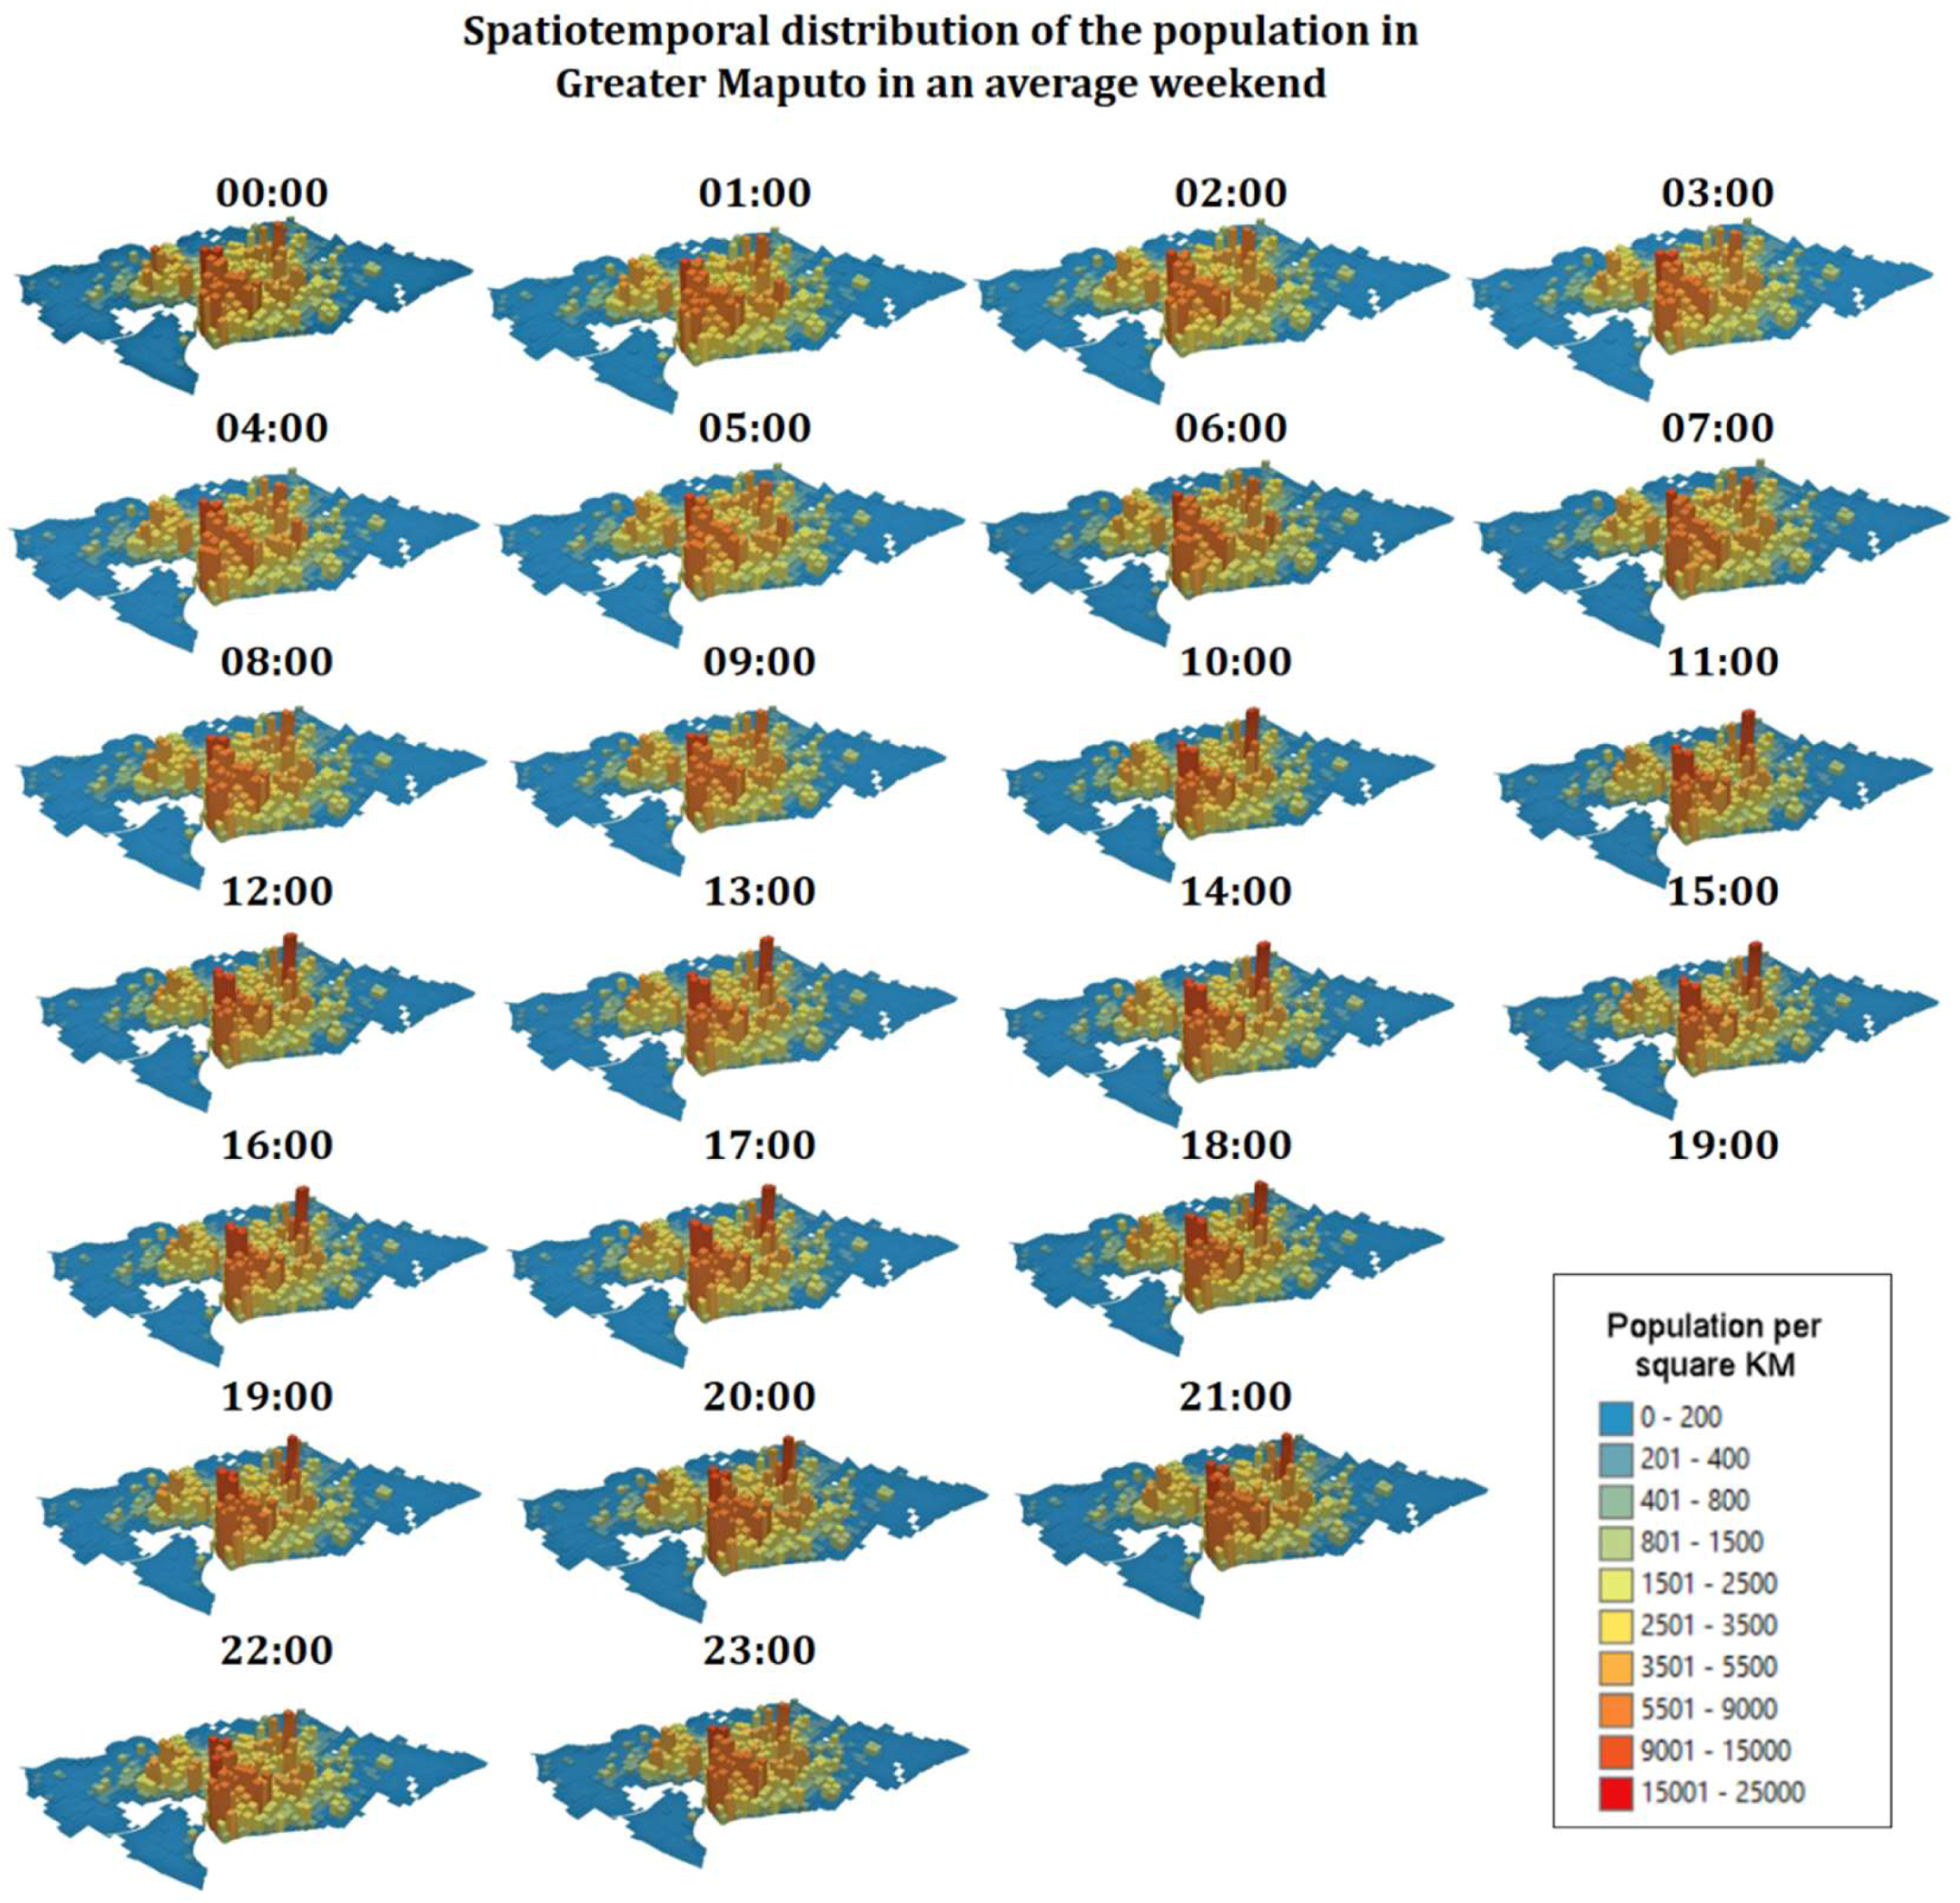
  • Weekdays and weekends are treated separately as we presume that trip behavior can vary between them.
After filtering the 1,279,291 users extracted from the home location estimation, there remained 797,329 users that had at least one valid user-day observation (62%). Figure 8 Shows the distribution of the number of valid user days per user where 17.5% of filtered users have only one valid user day. This translated to a total of 4,385,089 valid user days (3,252,971 user weekdays and 1,132,118 user weekends), which correspond to 14,744,180 trips for user weekdays, and 4,965,739 trips for user weekends as summarized in Table 4. This equates to an average of 4.5 trips per user per weekday, and 4.3 trips per user per weekend. The filtered sample of 797,329 users corresponds to 30% of Greater Maputo’s population of 2,661,832 (from HRSL), as compared to the person-trip survey, which sampled only 1.7% [25]. This gives the advantage of having better sample representativeness for the CDR data.

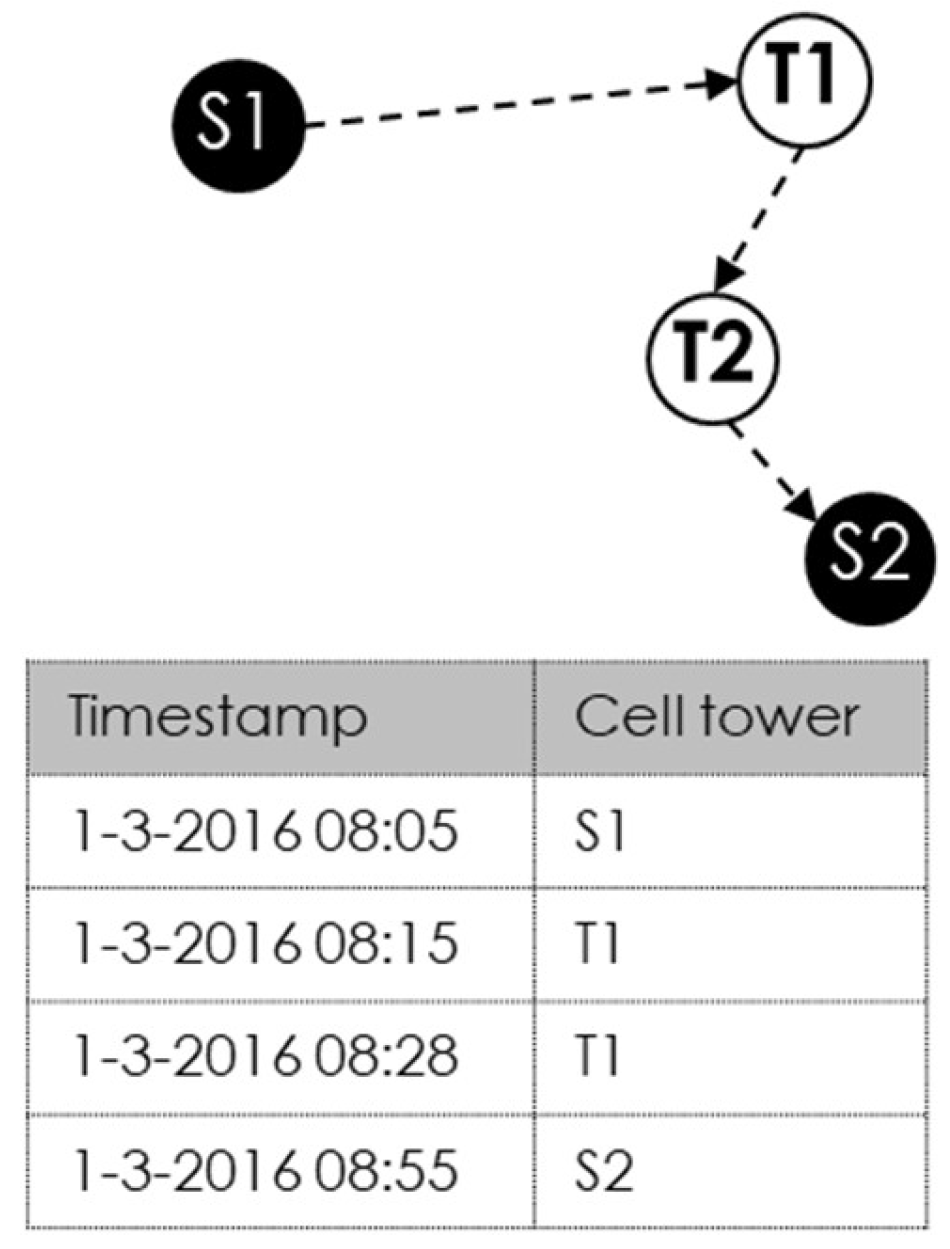
3.4. Origin–Destination Extraction

Studying macroscopic mobility requires more knowledge about the start and the end of the trips to quantify trip generation and attraction volumes across different parts of a city. On the other hand, CDR has the attribute of sparseness, which therefore requires further processing in order to extract meaningful trips. In this study, we utilized an approach similar to that of Jiang, Ferreira and Gonzalez, 2017 [19], in which the OD extraction process is split into two main steps: (1) estimation of the possible stay zones for each subscriber, and (2) extraction of trip segments between the different stay points. This method was previously applied to triangulate CDR traces with an uncertainty of 200–300 m for all traces [32]. However, our CDR dataset is in the cellular tower level zone, which, as previously discussed, has varying coverage areas, i.e., “location uncertainty.” Spatial constraints were, therefore, also added to capture more underlying trips than focusing only on key places of interest.

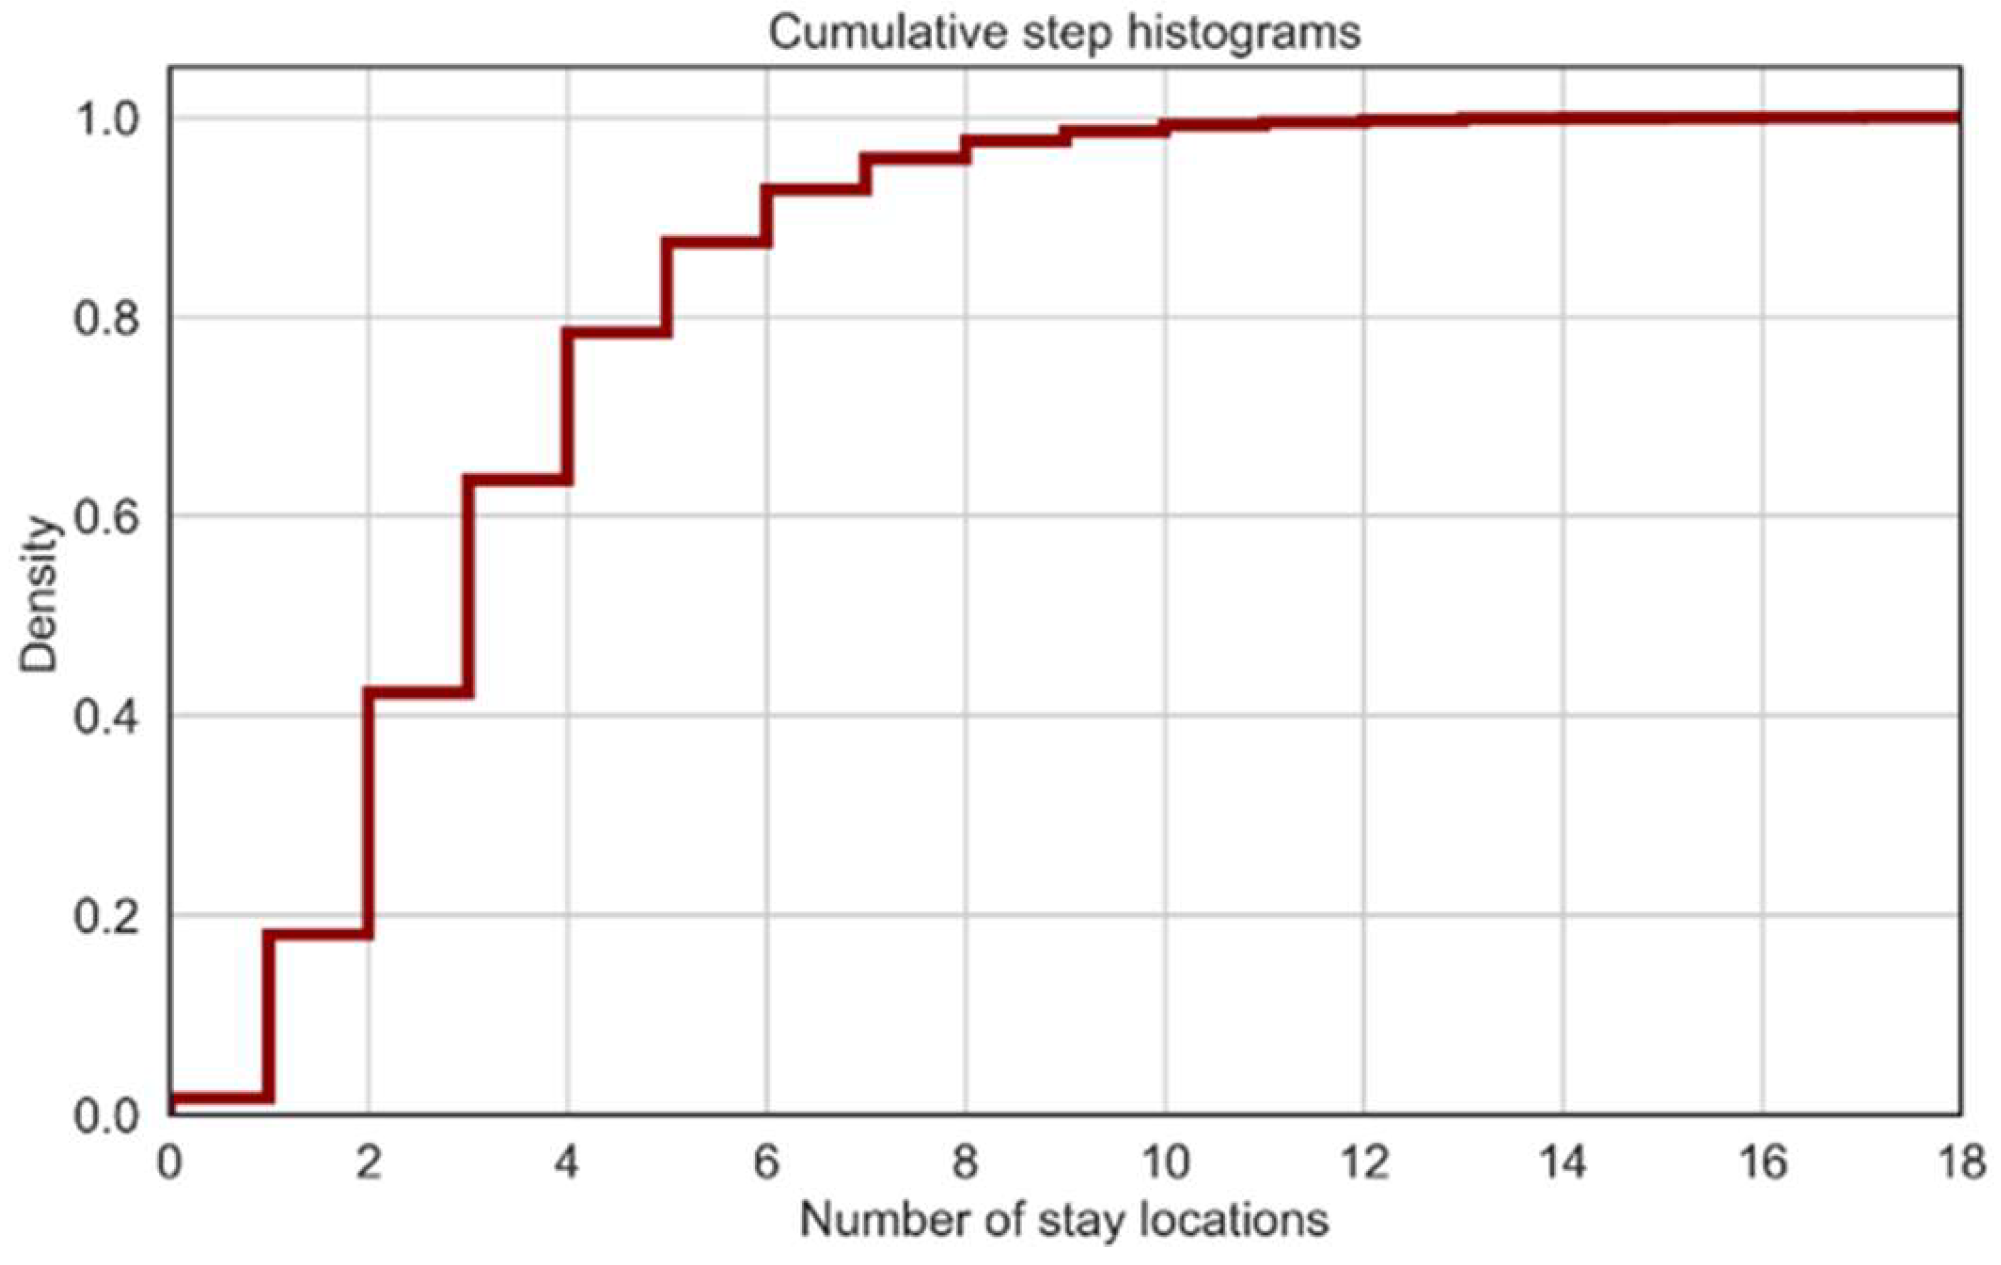
3.4.1. Extraction of Stay Locations

Based on the fact that people spend most of their time at a few key locations [33], such as their homes and workplaces, it is important to carefully capture those locations for each subscriber from his/her CDRs. Those locations are normally associated with a longer stay period. However, it is also important to identify other places that are visited less frequently, such as shopping areas and cafés, that could possibly be associated with a stay state. Thus, we employed all 12 days of CDR data to extract all possible stay locations for each subscriber. In general, for each subscriber, a zone was identified as a stay location if his/her CDRs indicated that he/she continuously stayed in a certain zone for a given threshold period. This threshold can influence the number of extracted stay locations per user significantly, adding bias to any further trip extraction. Because cellular tower coverage varies based on population density, as previously stated, the threshold period had to also be proportional to the coverage area. The stay threshold period has an impact on the number of extracted stay locations per user and, correspondingly, the number of trips. Therefore, it has to be considered reasonably. To capture trips with short stay locations, for example, buying at a store or dropping children at school, it is important to define the minimum threshold period that would not capture a false stay location. The exact stay time varies based on multiple parameters, including the transportation mode used to arrive and leave the destination and, more importantly, the coverage area of the subject cellular towers. Accordingly, we set the minimum threshold period at 30 min in order to ensure that small stays were extracted without capturing noise. Figure 9 shows the distribution of the number of extracted stay locations per user. The resulting average number of stay locations extracted per user was 3.2.

3.4.2. Extraction of Trips

The basic concept for trip extraction is capturing recorded locations (in terms of cellular tower zones) with successive time stamps as a trip or part of a trip depending on whether the locations are identified as stay locations. Figure 10 shows an example of a trip, where S1 and S2 are origin and destination stay locations, respectively, and T1 and T2 are intermediate records.

3.5. Estimation of Magnification Factors

In order to expand the user sample to represent the actual population of Greater Maputo, as in previous studies [18,19], we used two types of magnification factors: (1) scaling up the user sample to represent the actual population in each zone, and (2) normalizing of the user sample to one observation day.

3.5.1. User Sample to Population Magnification Factor

The user magnification factor for a user i in zone j ( u s r _ m a g i j ) is simply the proportion between the total user sample with home location in that specific zone ( P o p _ u s e r j ) and the actual population taken from HRSL in the same ( P o p _ H R S L j ), as follows:
u s r _ m a g i j = P o p _ H R S L j P o p _ u s e r j
Figure 11 shows the distribution of the user magnification factors obtained in the study area.

3.5.2. Valid User-Days Magnification Factor

The valid user-days magnification factor is needed to normalize all users’ mobility to one observation day, particularly for those with more than one valid user day, as discussed in Section 3.1. The valid user-days magnification factor should be treated separately for weekday and weekend samples. The sample period had nine weekdays and three weekends; therefore, the maximum valid user-days for the weekday sample and the weekend sample were nine and three, respectively. Accordingly, the valid user-days magnification factor for user i ( d a y _ m a g _ f a c i ) was simply the proportion between the user magnification factor of user i ( u s r _ m a g i j ) and the user’s corresponding valid user-days ( u s r _ d a y i ), as follows:
d a y _ m a g _ f a c i = u s r _ m a g i j u s r _ d a y i { i f   w e e k d a y ,       1 u s r _ d a y i 9 i f   w e e k e n d ,       1 u s r _ d a y i 3

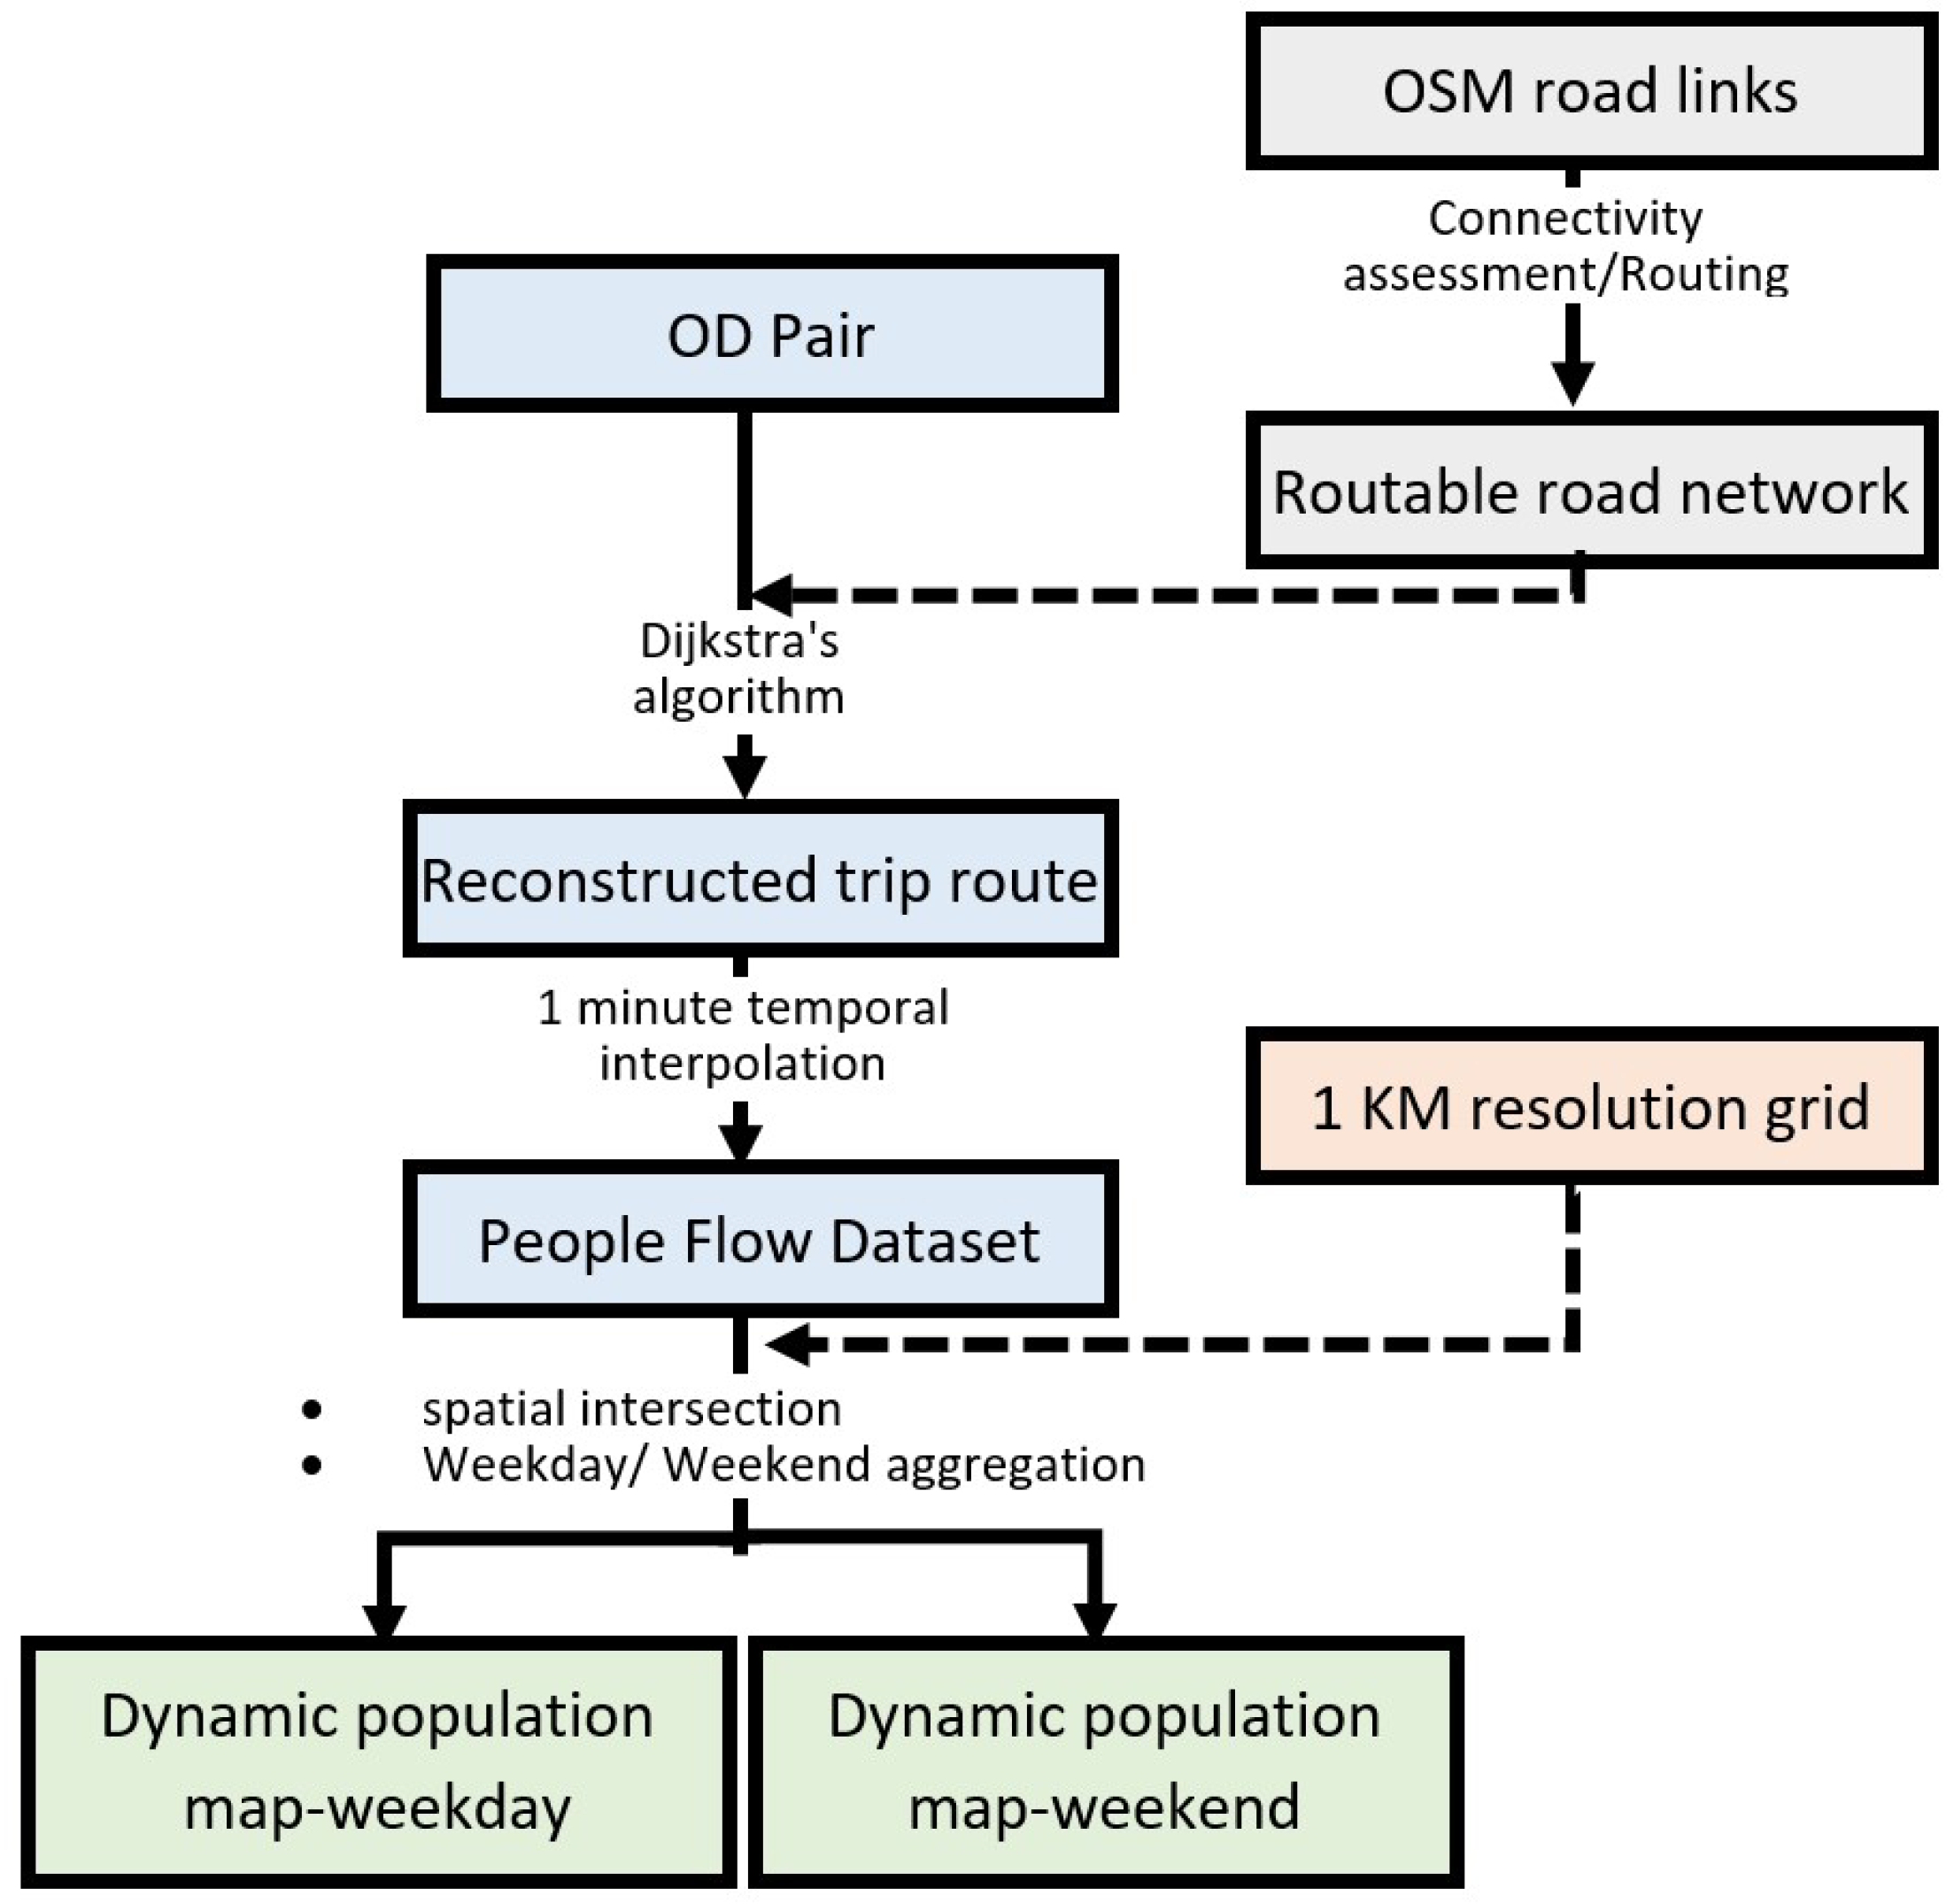
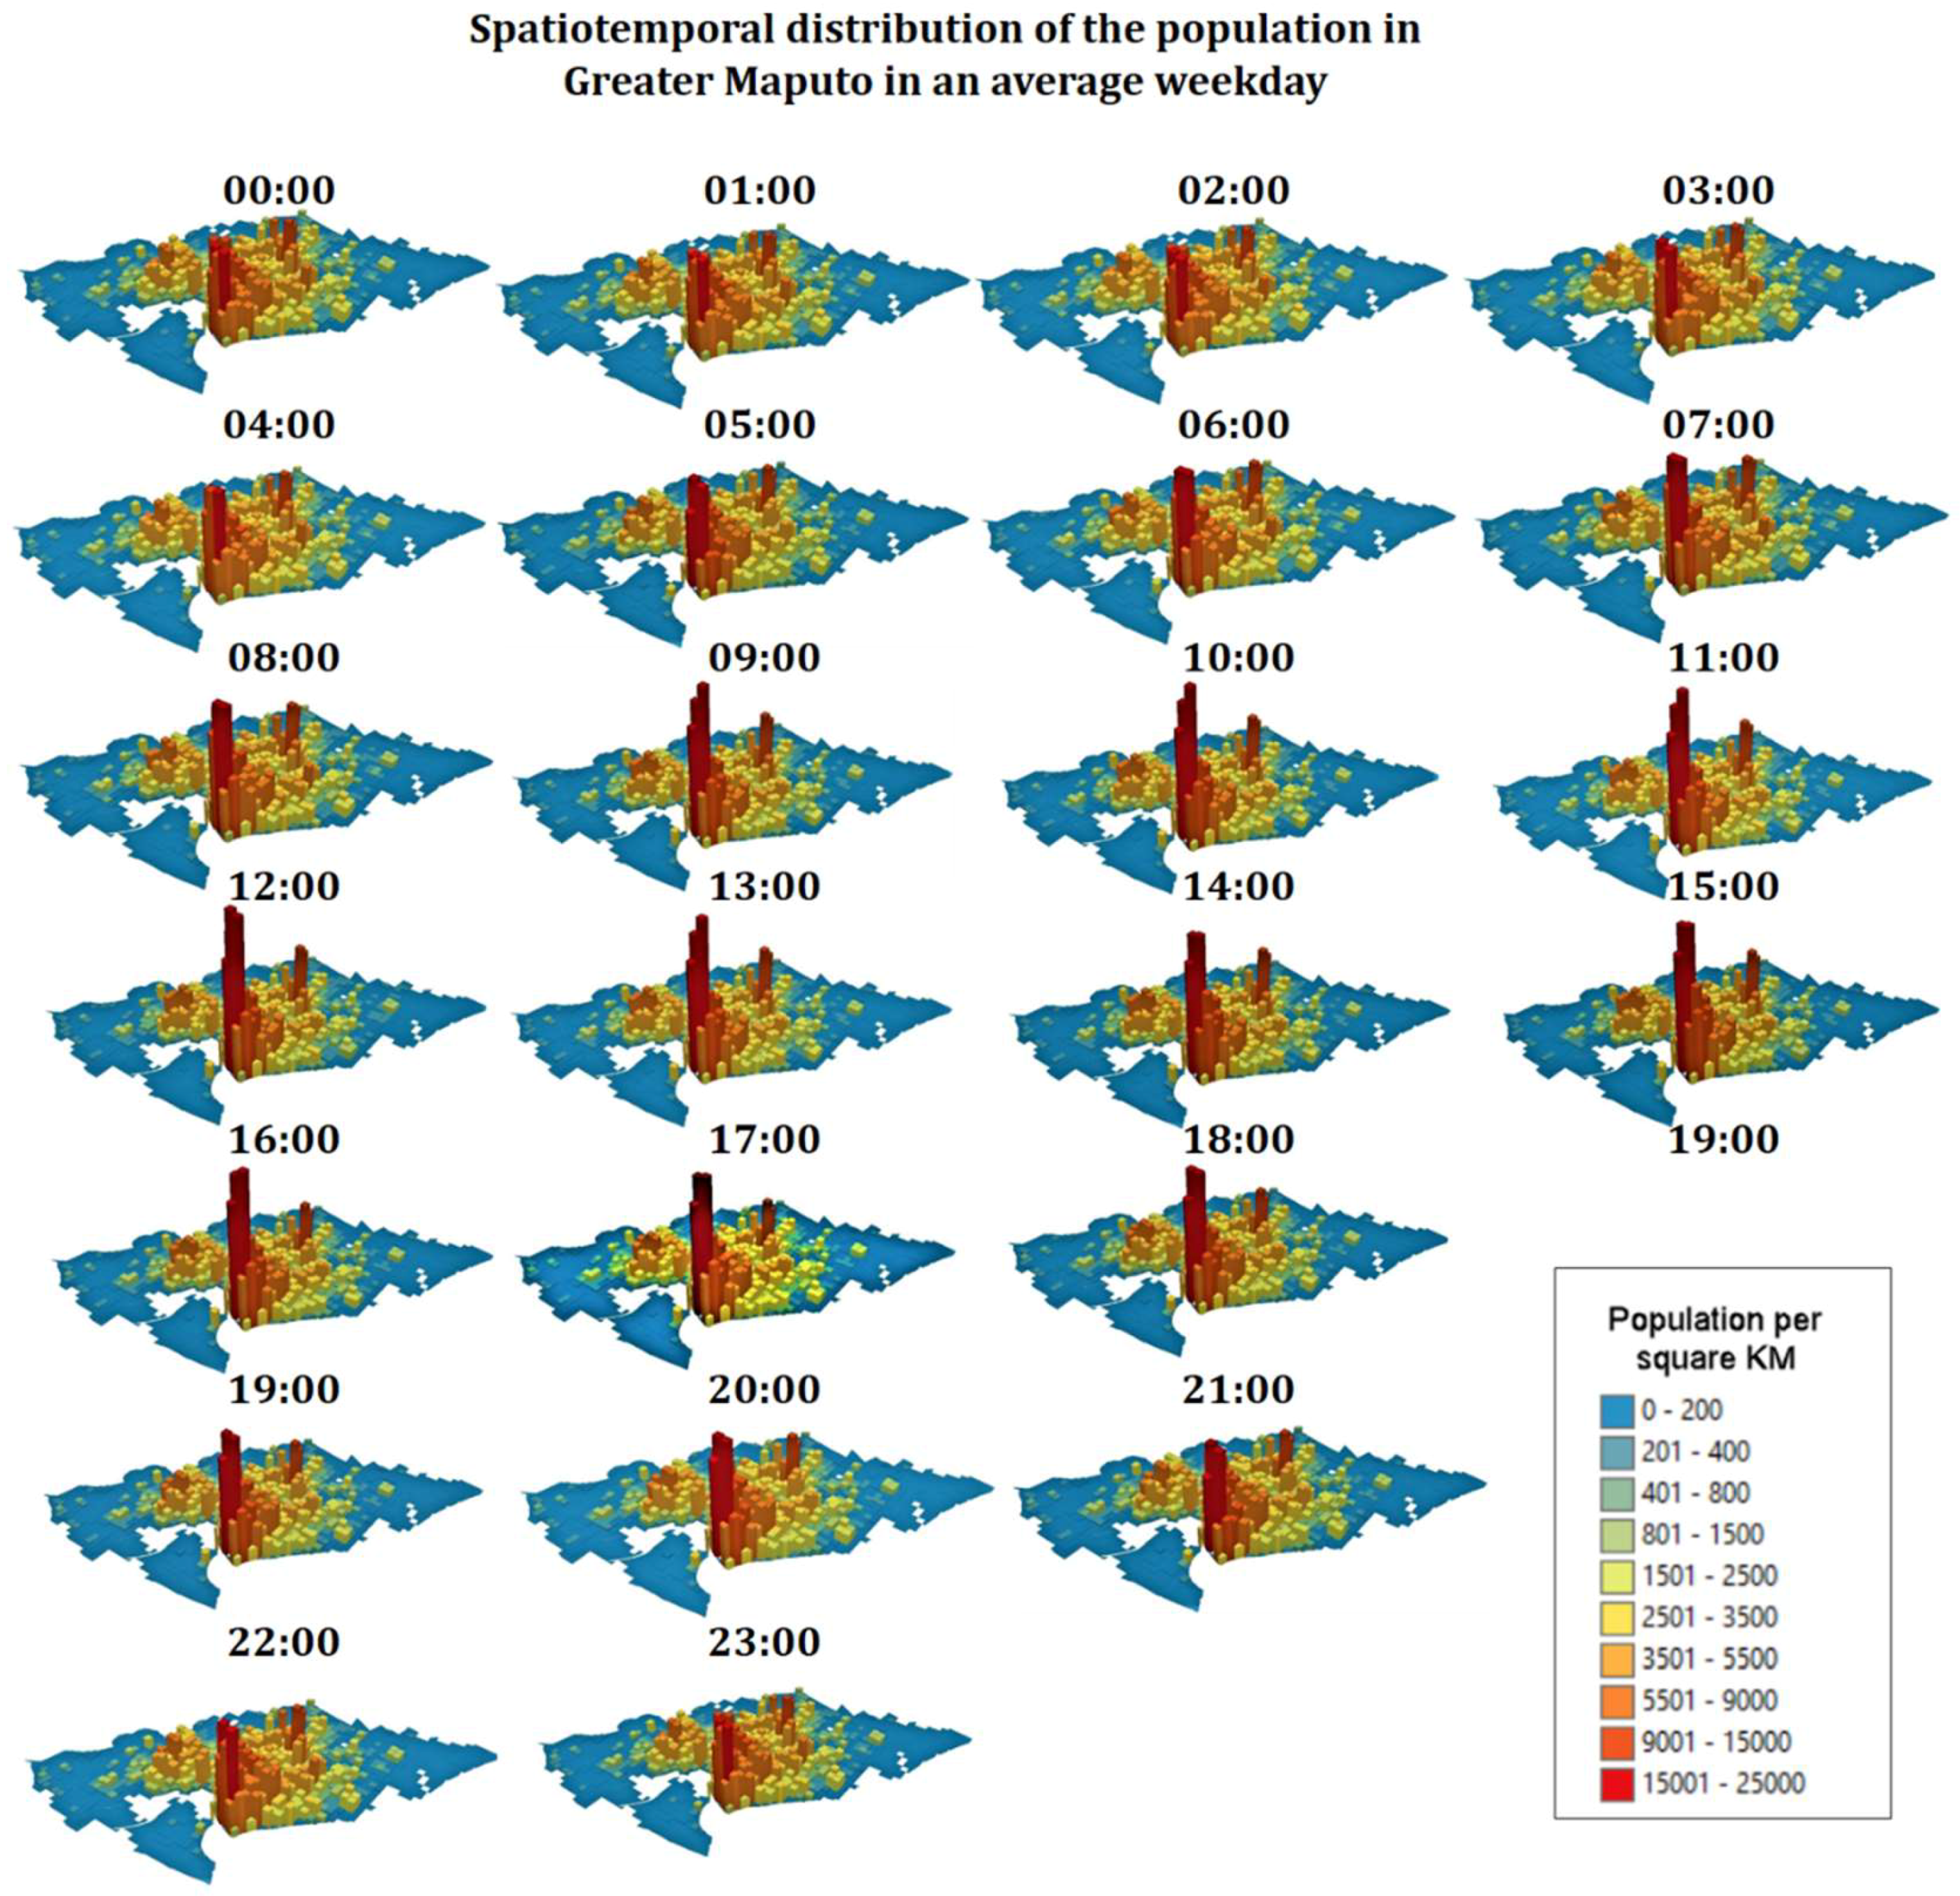
3.6. Spatiotemporal Interpolation

Before further utilization of the OSM road links, we applied topological correction and connectivity assessment to handle insufficient and disconnected nodes as we previously proposed in [34], resulting in 353,139 connected links and 271,454 nodes in the whole of Mozambique. Then, we used the osm2po [35] converter and routing engine to parse OSM pre-processed links and make it routable. Such preprocessing is an essential step to ensure all road links are well connected without any possible isolated road clusters.
To derive the spatiotemporal distribution of the population in the Greater Maputo area with the previously estimated OD pairs as an input, we applied an automatic routing and temporal interpolation for the subscriber location during all of his/her observed periods including stay periods when no mobility is detected. First, a simple Dijkstra’s algorithm is used to reconstruct the subscriber’s route over the previously prepared OSM road network. Then, we interpolate the position of the subscriber along that route using an arbitrary 1-minute interval from the start to end time of his/her trip. We applied the mentioned method to all ODs extracted from the 12-day study period which resulted in a massive spatiotemporal people flow dataset. We then aggregated weekdays and weekends separately for each hour of the day and constructed a 1-km resolution 3D map that represents the distribution of the population in an average weekday and weekend in Greater Maputo. Figure 12 presents the flow of the spatiotemporal interpolation method.

4. Results and Validation
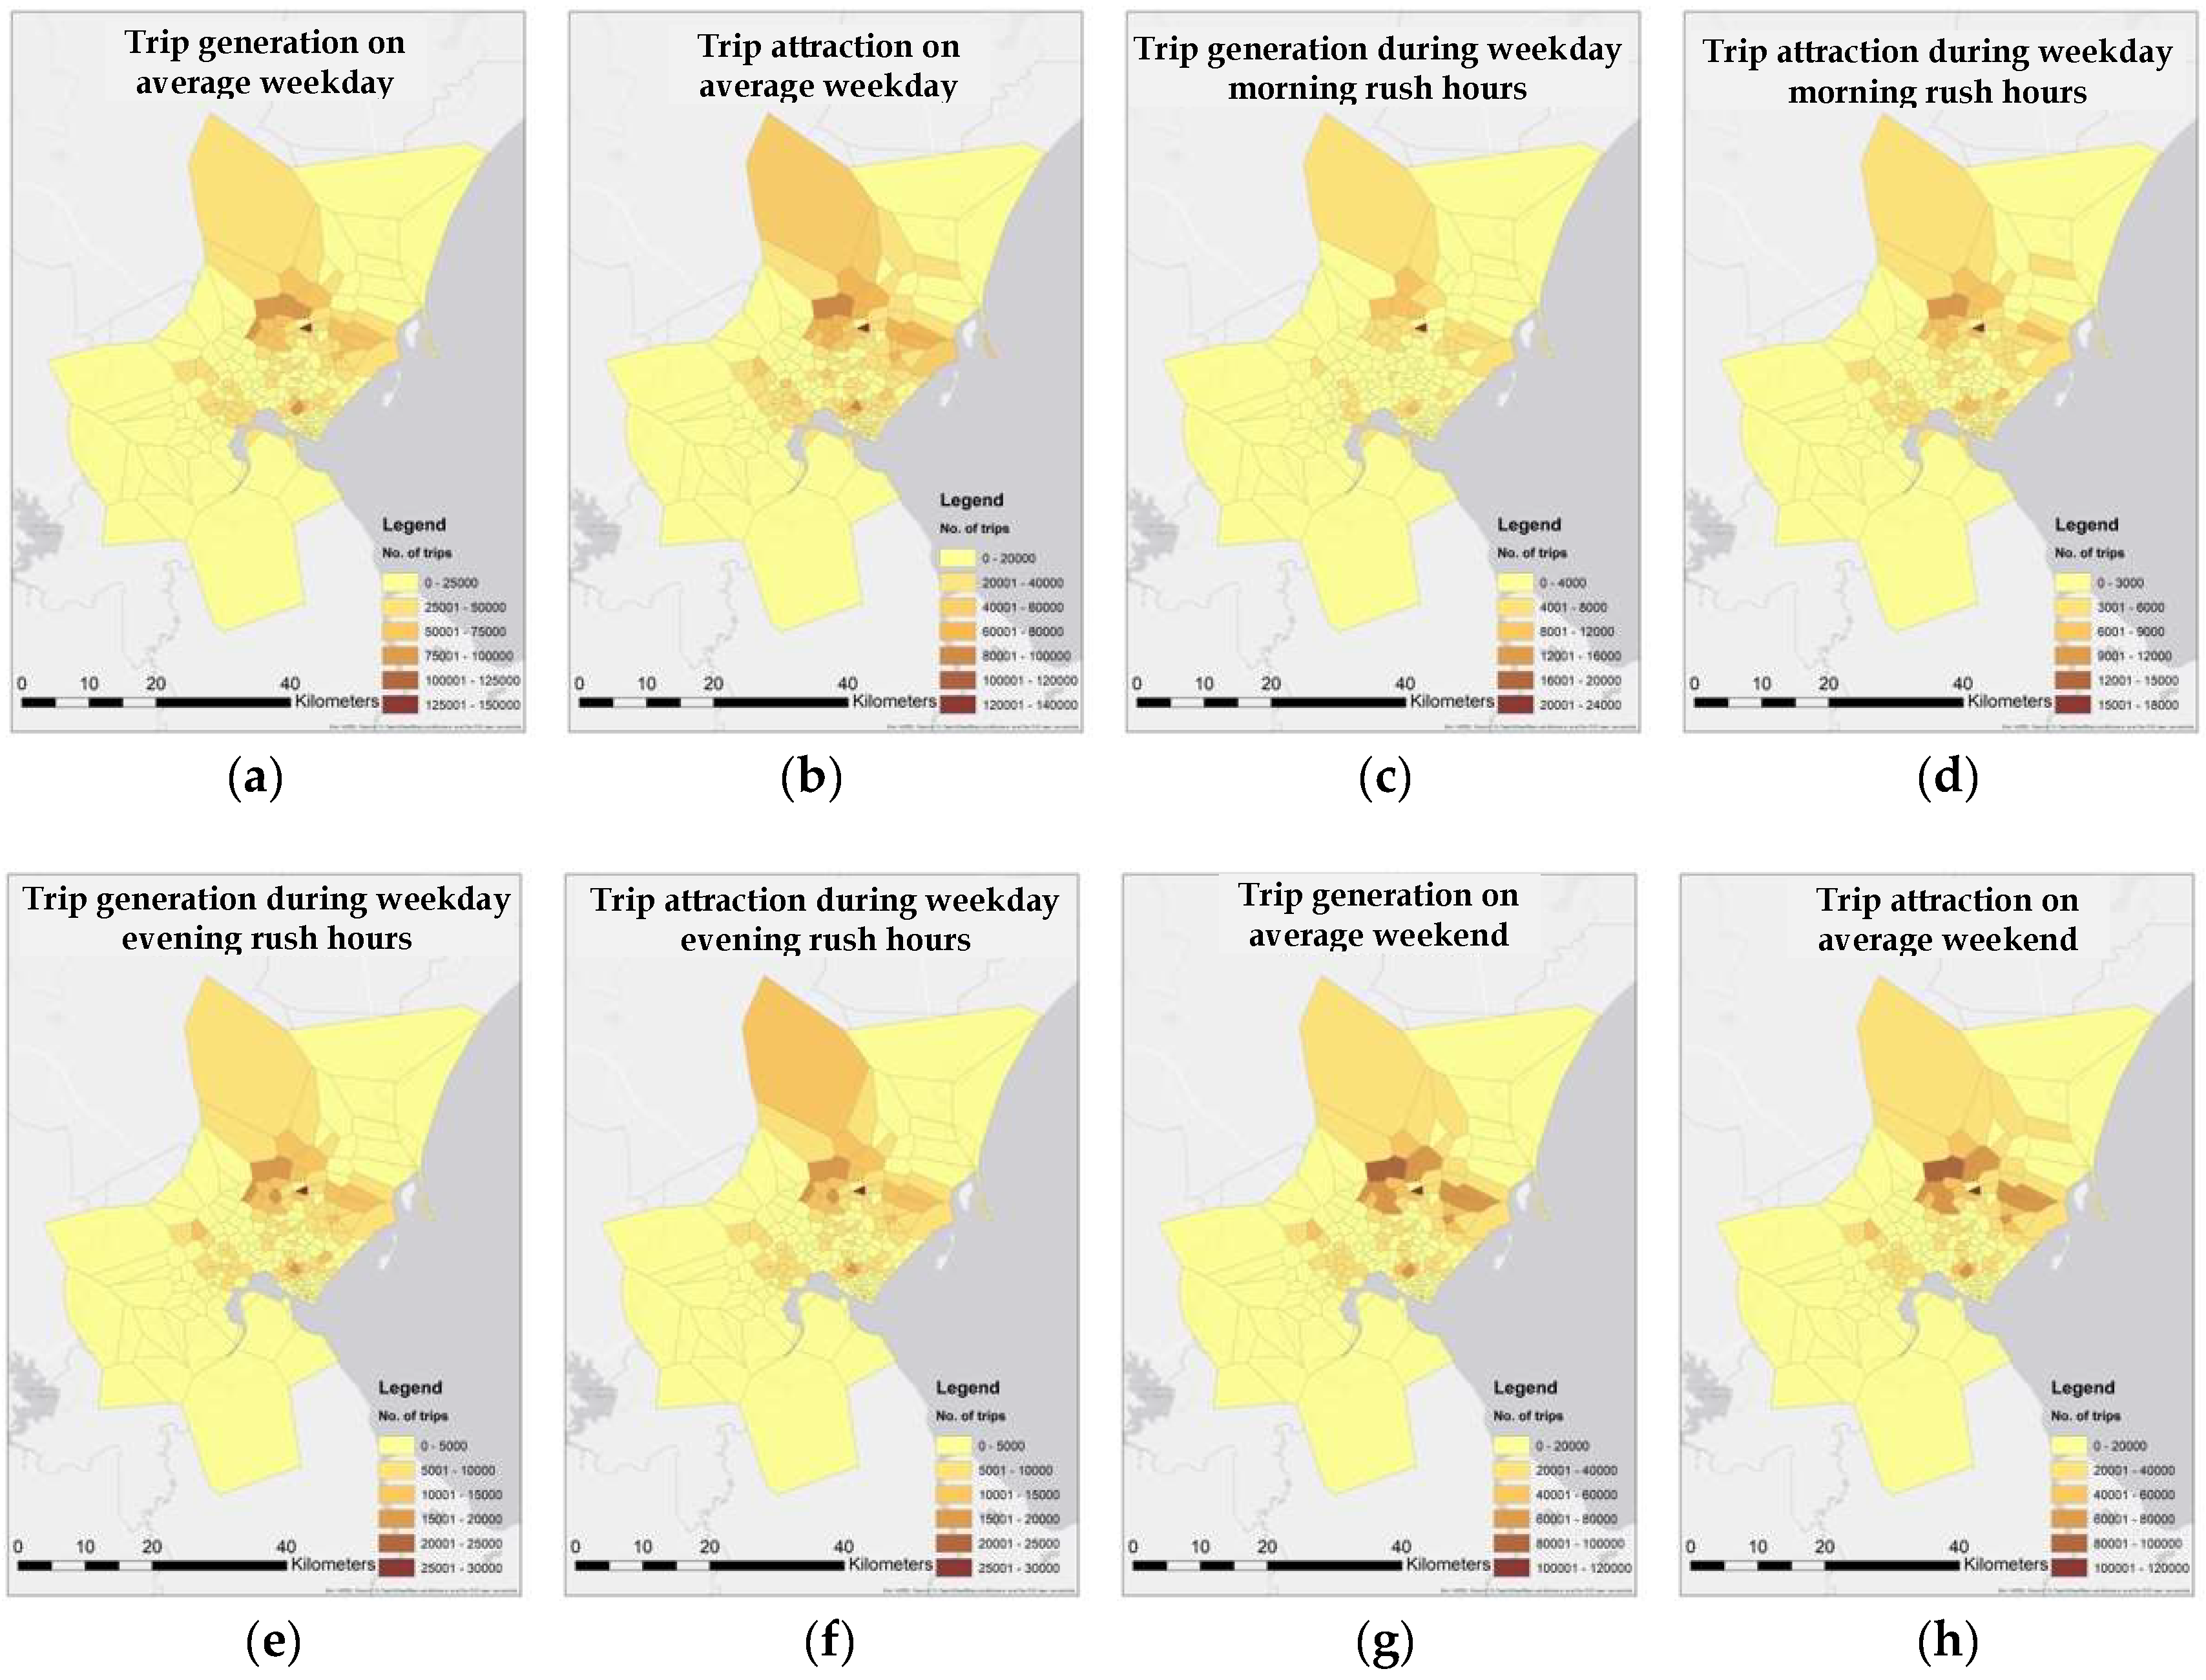
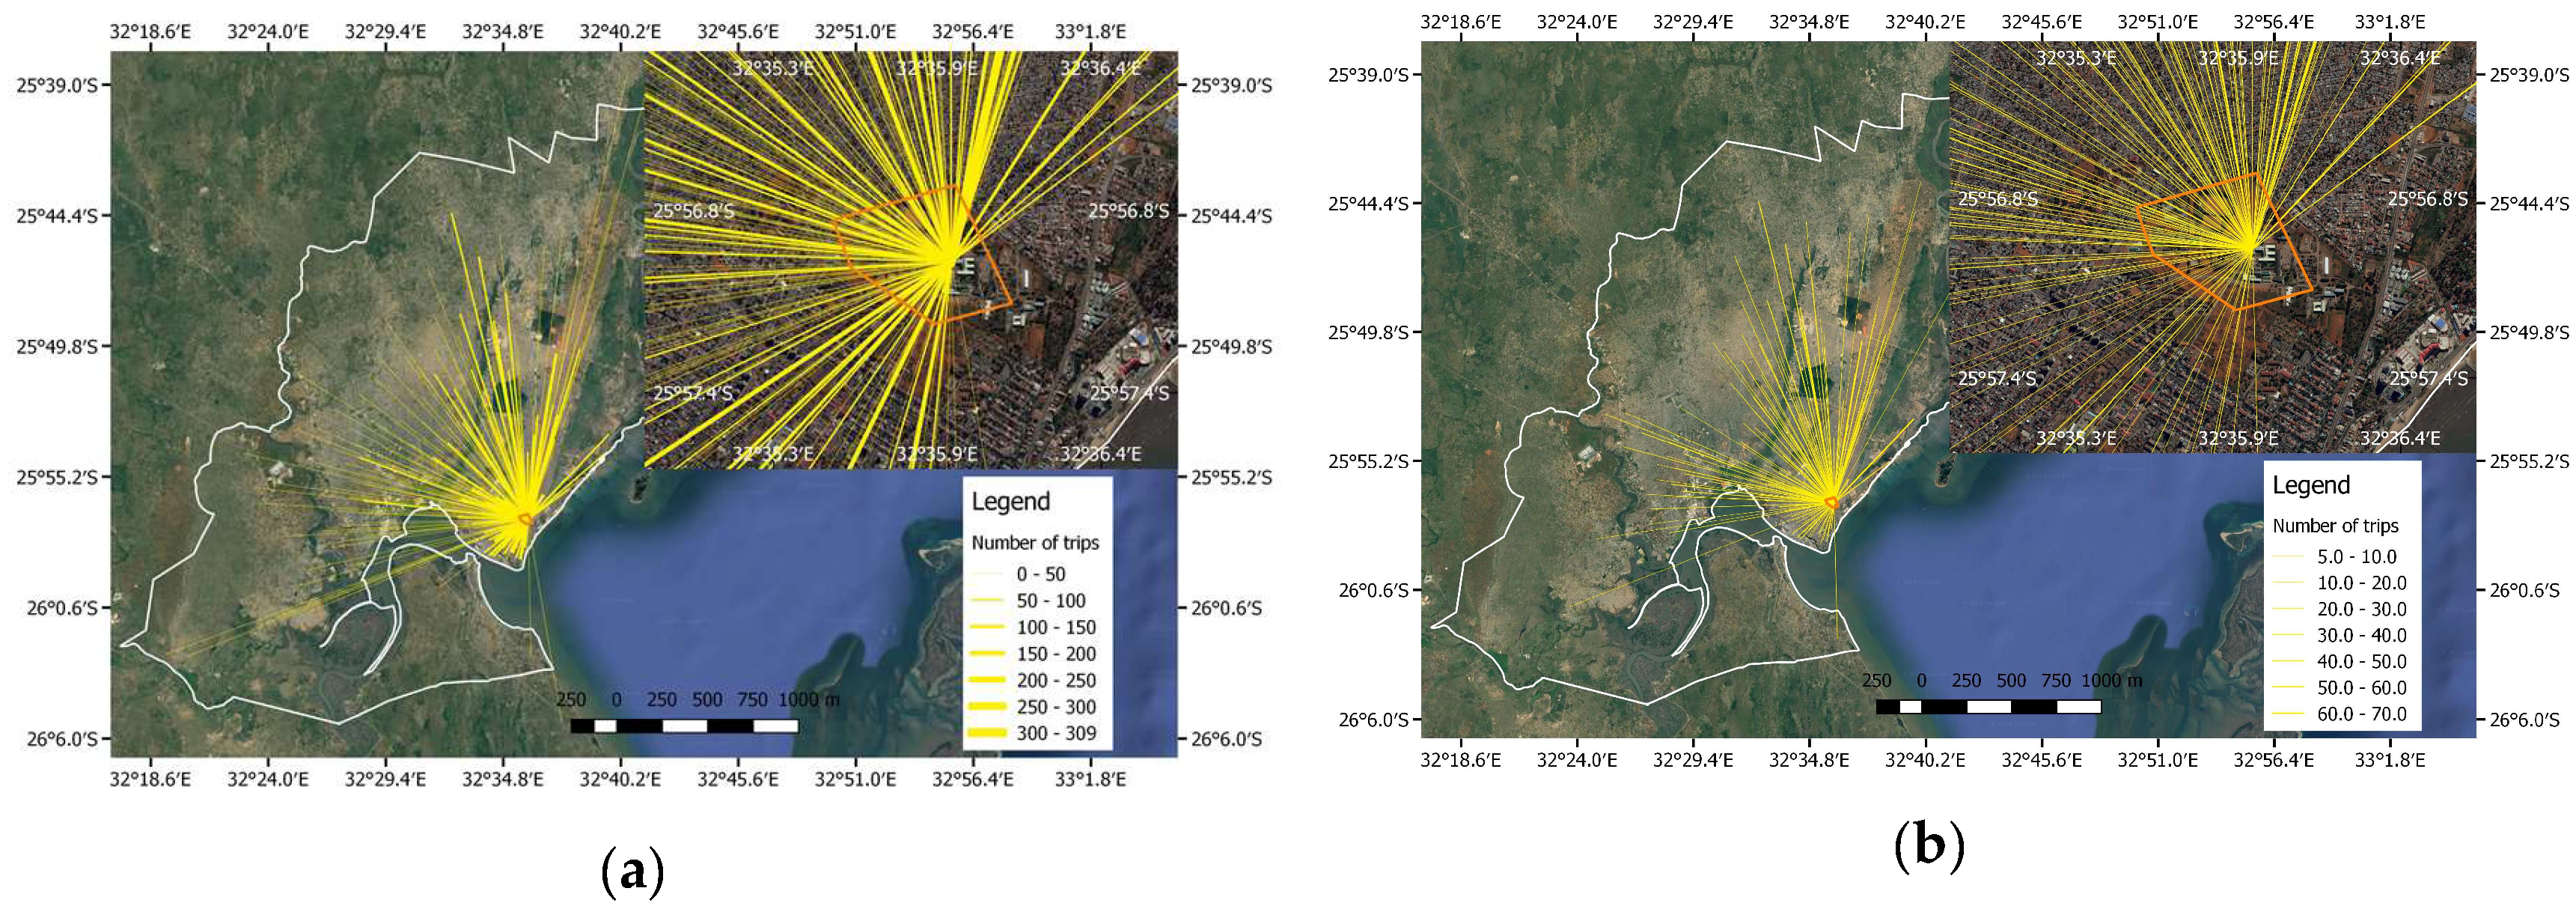
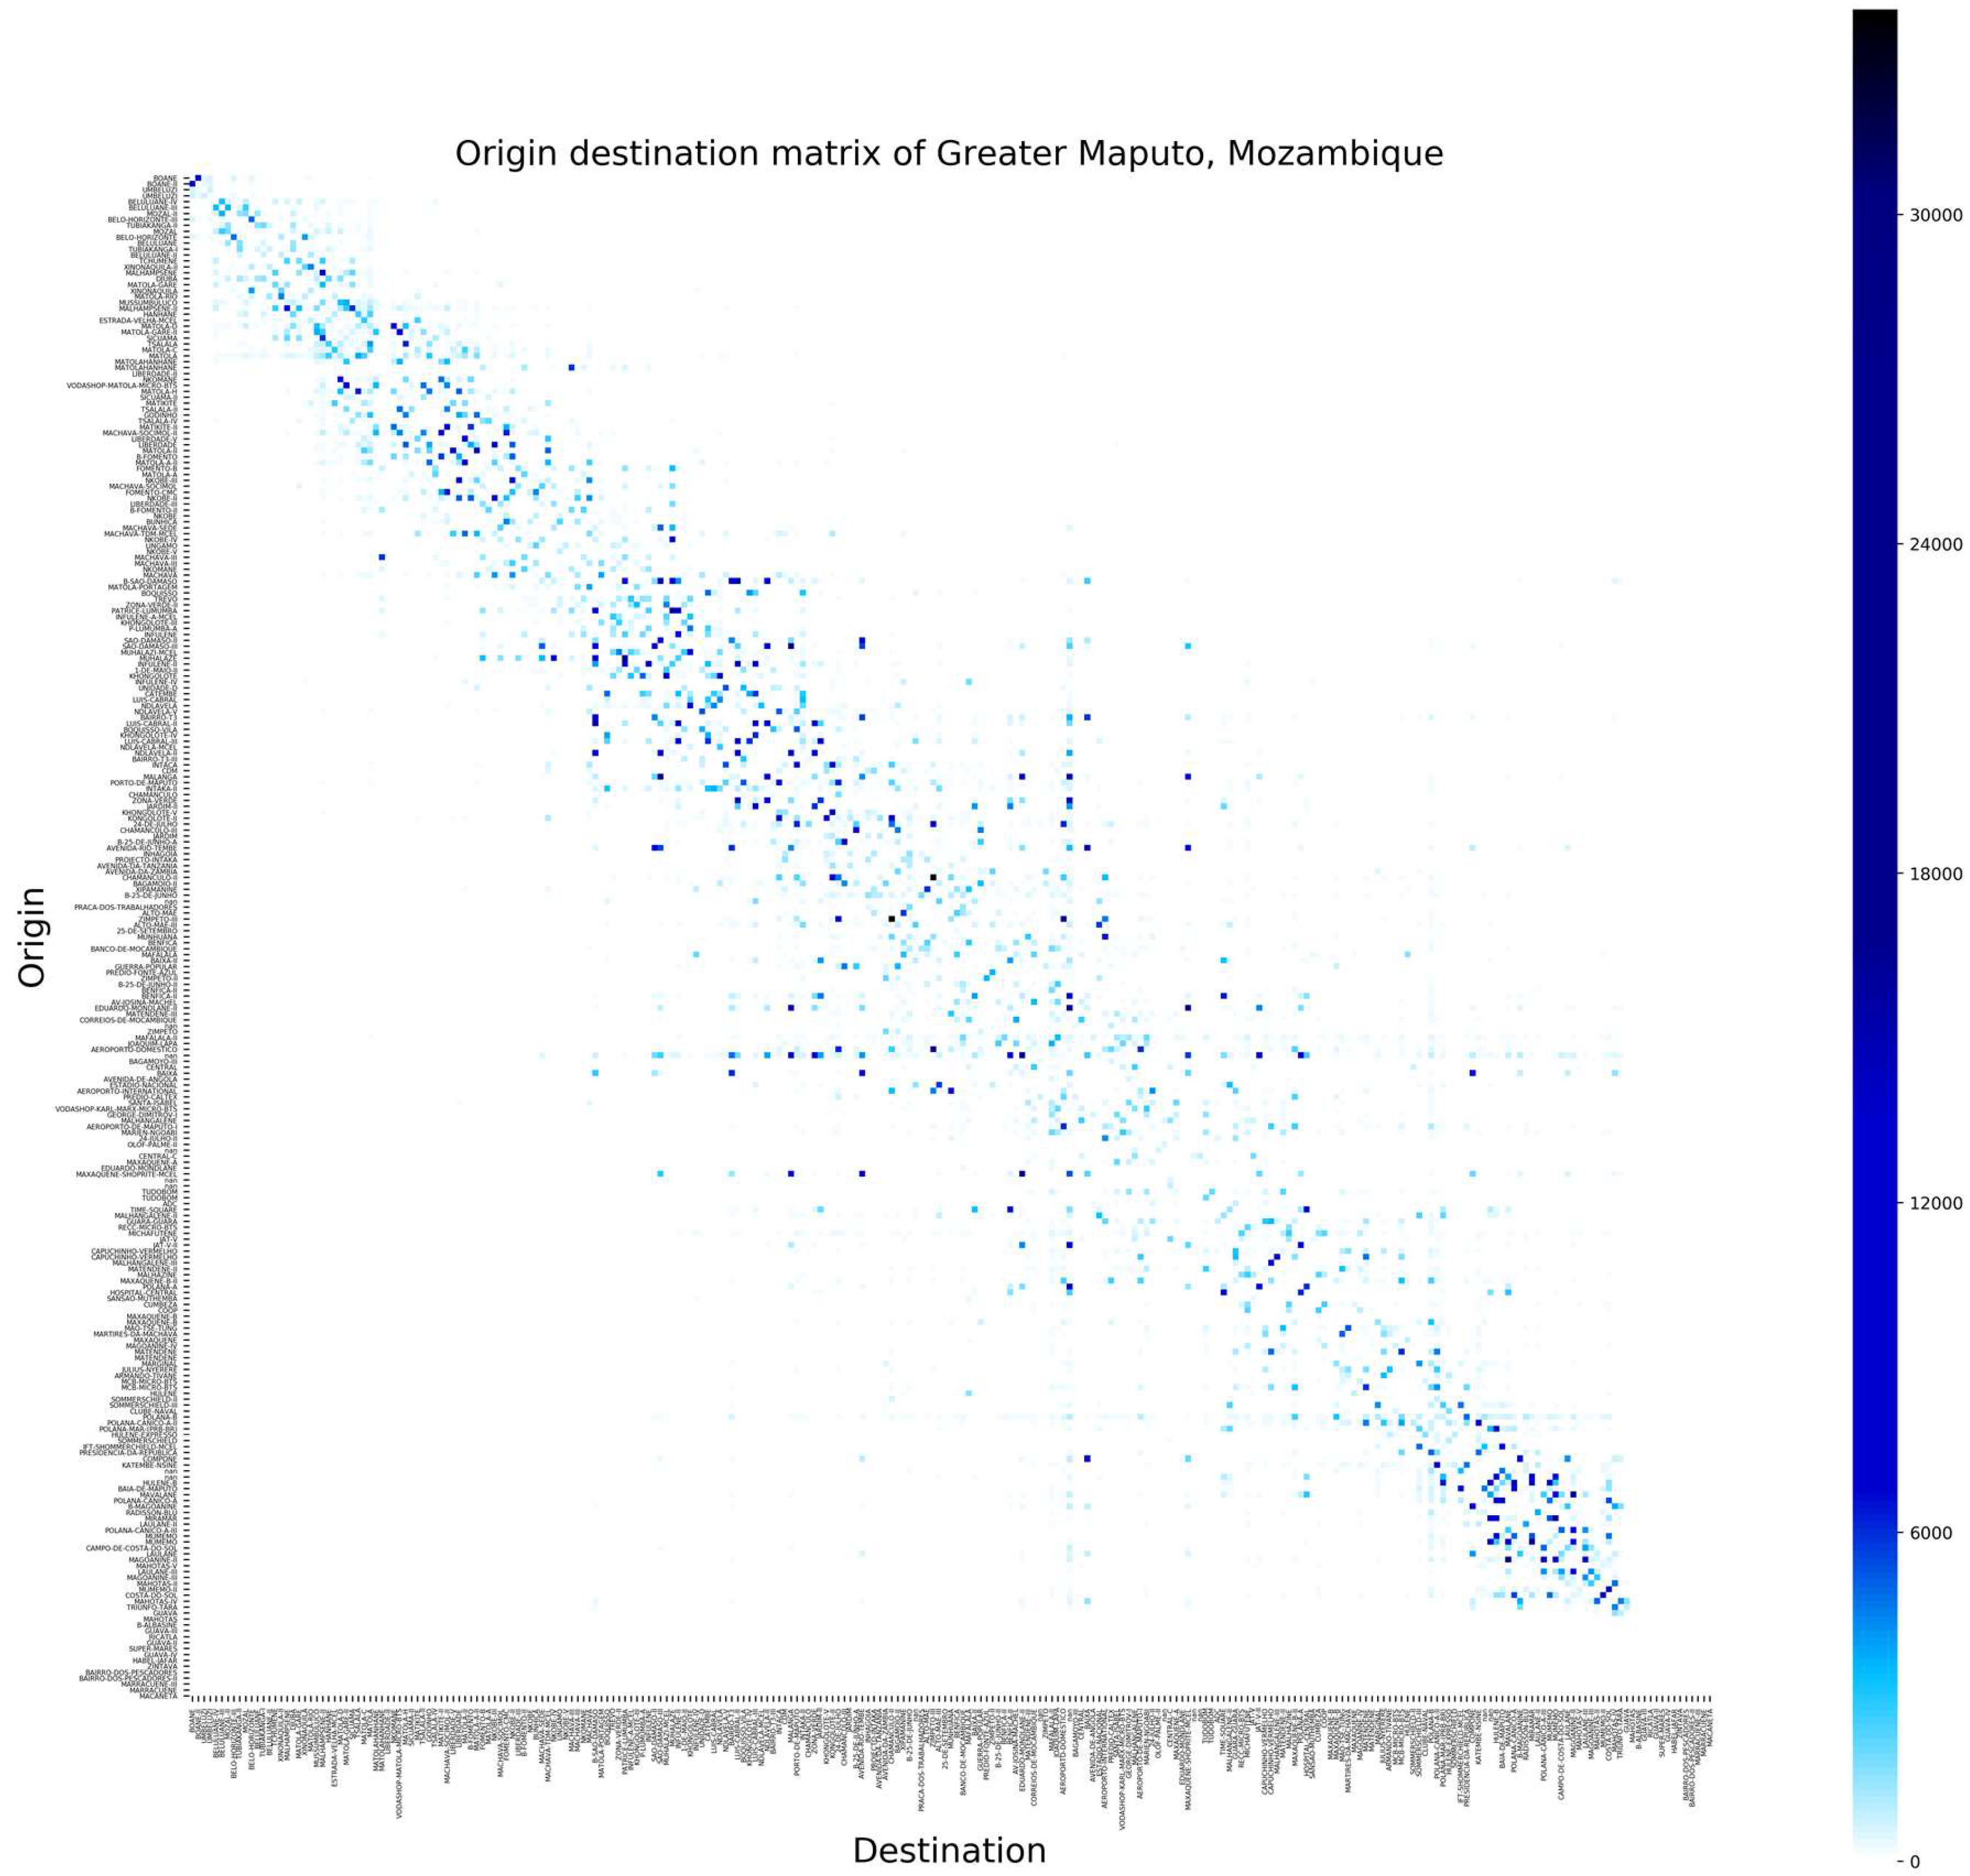
4.1. Results

The results of our method for extracting the trips of users in Greater Maputo are presented in the form of trip generation and attraction maps, as shown in Figure 13. The trip generation and attraction maps are classified as follows: (a) trip generation on average weekday, (b) trip attraction on average weekday; (c) trip generation during weekday morning rush hours (6:00–9:00); (d) trip attraction during weekday morning rush hours (6:00–9:00); (e) trip generation during weekday evening rush hours (16:00–19:00); (f) trip attraction during weekday evening rush hours (16:00–19:00); (g) trip generation on average weekend; and (h) trip attraction on average weekend. It can be observed that all eight maps show similarity in the number of trips for all zones. The zones outward from the center of Greater Maputo, particularly, in Marracuene District, Boane City, and the lower part of Maputo City, have relatively low generated and attracted trips. This implies that a smaller share of the population lives in these zones, resulting in correspondingly less travel activity. On the other hand, the central part of Maputo City and the central-northern part of Matola City show the highest number of generated and attracted trips, implying a greater share of Greater Maputo’s population reside in those zones and a high level of travel activity. This is in fact the case as those zones are part of the city center, wherein the central business district, main commercial areas, and Mozambique’s major university are located. Those zones continually produce and attract both short and long trips. The maps also provide an insight on the land use of those zones, such as for residential, business, or education.
Figure 14 shows the resulting people flow maps respectively for (a) weekday and (b) weekend, which show the origin and destination of trips connected by lines. It can be observed in the flow maps that most of the trips are heavily concentrated in the central part of the study area, similar to the observation from the trip generation and attraction maps, and that there is an obvious difference in trip volume between weekdays and weekends; specifically, the latter is much lower. In addition, there appears to be a formation of four clusters of short trips in the central area, which suggests land use with heavy daily activities on both weekdays and weekends. Furthermore, it can also be observed that some of the trips cross water, which are presumably the trips made by water ferries. From the report of JICA [25], 1% of the total trips are made using this transportation mode. It is interesting to note that this aspect can be visualized from CDR data.
In addition, we show a demonstrative example by using our approach in capturing accurately the origin of all trips to a specific zone as destination, and the change in mobility between weekdays and weekends. Figure 15a,b shows a flow map of the trips toward Universidade Eduardo Mondlane, Mozambique’s oldest and largest university, on weekdays and weekends, respectively, while Figure 16 shows the temporal distribution of trips over a 24-h period. With this example, we can observe distinctly the difference in the number of trips between weekday and weekend; specifically, there are more trips as classes are typically held on weekdays. Moreover, we can capture how many people arrive at the university at different times. It is interesting that we captured two peaks during weekdays when people arrive, i.e., in the morning (8:00–12:00) and in the evening (17:00–18:00). The first peak period pertains to the trips taken by the students (including university professors and staff) for the regular classes, while the other peak period is for the evening classes mostly taken by working students, as verified by the university.
Furthermore, we constructed an OD matrix of the study area, as shown in Figure 17, with 259 origins/destinations corresponding to the Voronoi cellular tower zones. This, as well as the trip generation/attraction maps, are practically useful for transportation planning purposes, particularly for transport demand forecasting for new roads, or for new public transport routes.
Finally, we present people flow (refer to the supplementary video) and the spatiotemporal distribution of the population in the Greater Maputo area. Figure 18 presents the hourly distribution of the population on an average weekday as captured by mobile phone data. Distribution starts to change from 06:00 when people are expected to engage in their daily activities and move to the city center, which is well captured in the figure. The city center is most congested at noon and during work hours until 18:00. After that, the density at the city center starts to decrease between 18:00 and 23:00 when people return home. Figure 19 presents the hourly distribution of the population on an average weekend as captured by mobile phone data. The population is well distributed across the study area as compared to weekdays. The first change in the distribution seems to appear at 10:00 (which is later than 06:00 on weekdays) with density increasing at city center as well but at a lower density than on weekdays. In both the weekday and weekend distributions, there are two peaks that attract a large number of the population during daytime. The first and strongest peak is found at the central part of Maputo City, the commercial and business district of the capital city. The second peak contains Zimpeto, which is one of the main bus stations that receives people from urban and suburban areas who are commuting to the central part of Maputo City or other areas.
The above results indicate that mobile phone data can successfully represent the spatiotemporal distribution of the population given an appropriate statistical handling and filtration of non-representative users as we have previously shown in the methodology section. The results can be used for multiple applications besides urban planning applications. For instance, in disaster-management applications temporal distribution of the population is more important rather than the static nighttime population. By considering the dynamic population distribution, disaster-management officials will be able to enforce pre-disaster preparedness by estimating the impact of different hazard scenarios with respect to population distribution. Furthermore, continuous monitoring of the real-time population distribution after disaster will enable better response and data driven decision making when timeline and efficiency of resources allocation are critical. More importantly, documenting and analyzing people’s behavior and mobility pattern during disasters can provide a good indicator of the efficiency of disaster awareness or suggest alternatives.

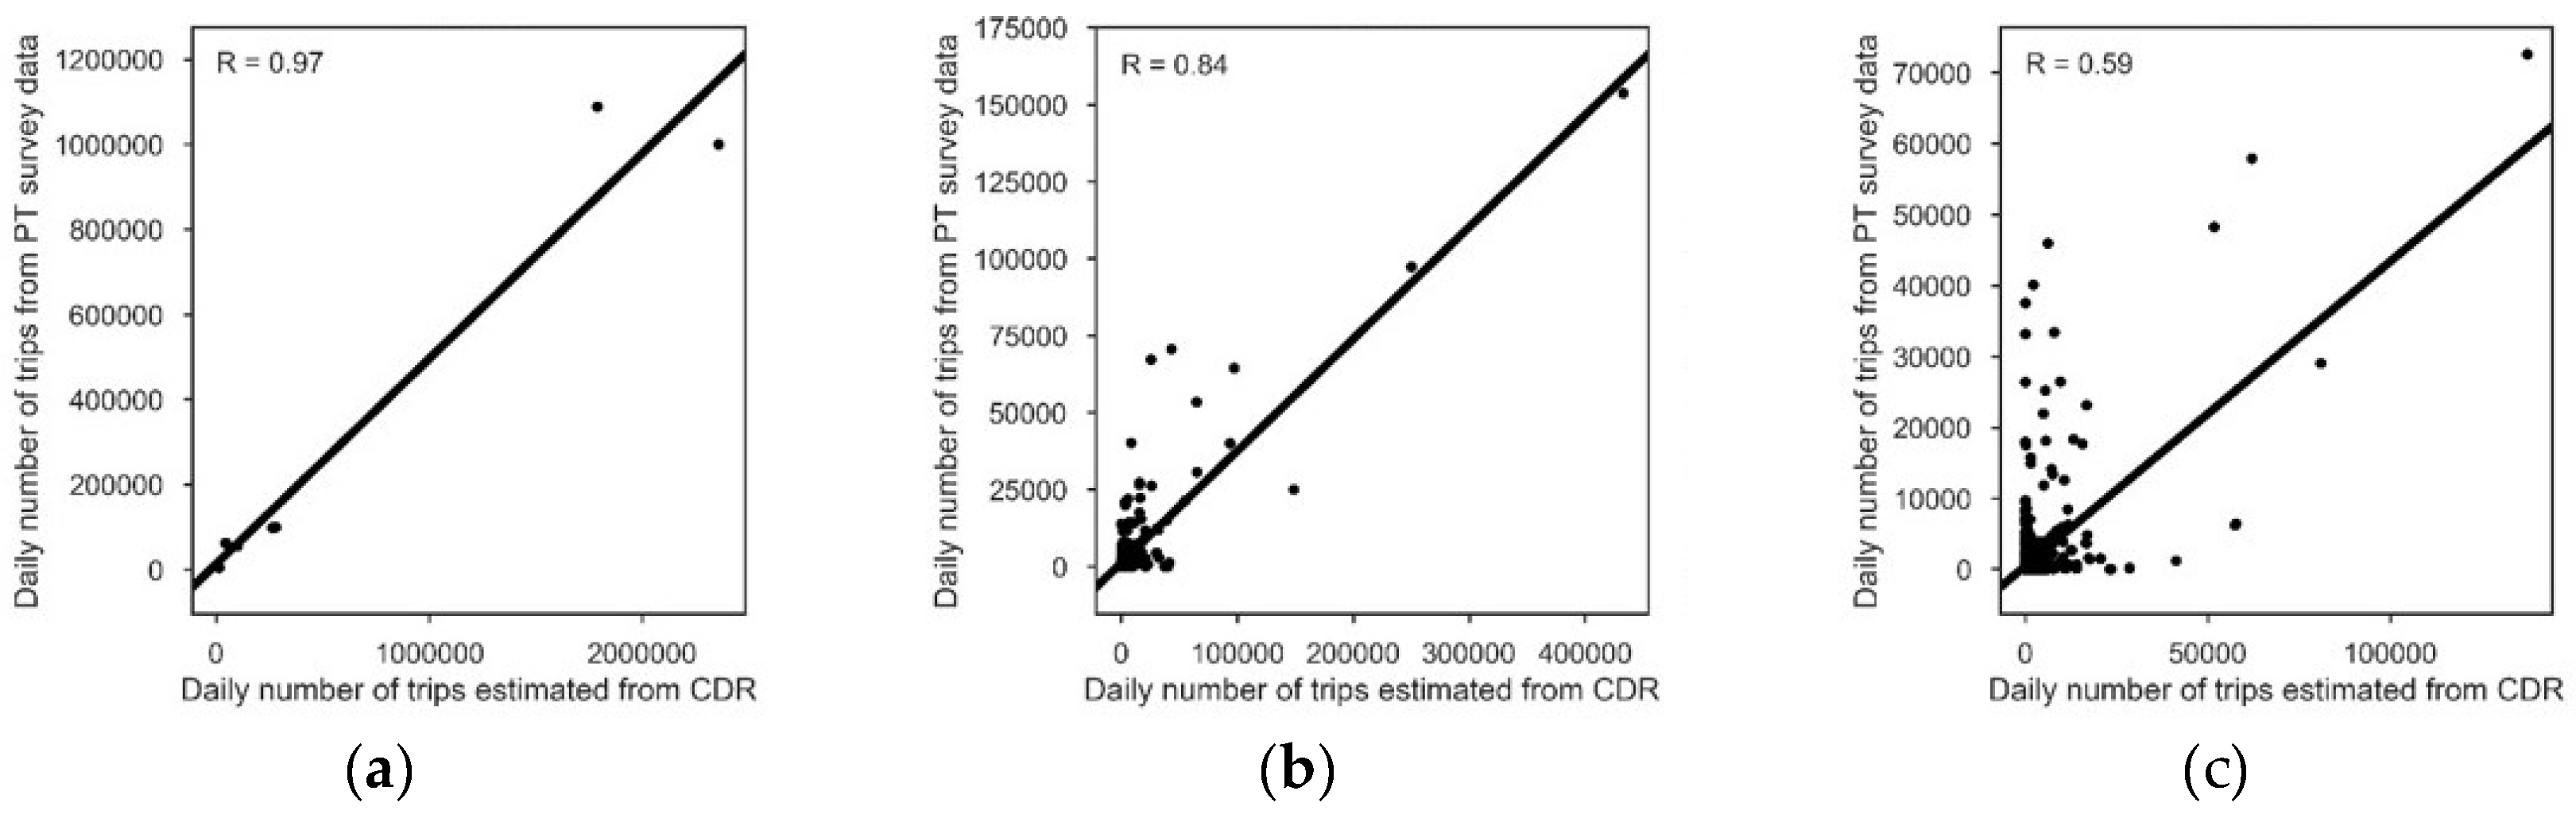
4.2. Validation of Results

To validate the results, we compared the extracted trips from CDR data with JICA’s person-trip interview survey data. However, our validation has the following limitations: (1) only weekday trips were considered as JICA’s data did not cover weekends; (2) the JICA person-trip survey accounted for population based on the 2011 census, whereas we used population from the HRSL in 2015; and (3) the Voronoi zones vary with JICA’s traffic analysis zone levels (A TAZ, B TAZ, and C TAZ), as discussed in Section 3.1. Figure 20 compares the daily weekday trip volume extracted from CDR to that from JICA’s person-trip survey. Relatively good correlation of the daily trip volume from CDR with the B TAZ level trips (R2 = 0.84) and A TAZ level trips (R2 = 0.97) can be obtained based on the obtained R-squared (R2) values. It can be observed that the correlation or accuracy improves as the zoning size increases, considering that the zoning mismatch decreases between the Voronoi zoning level and larger TAZ levels (B TAZ and A TAZ). Accordingly, it can be said that we achieved acceptable accuracy with respect to data collected from a traditional method, which in this case is from JICA’s person-trip survey.
Furthermore, CDR can capture short trips between neighboring zones, which the person-trip survey is not able to as it only accounts for a person’s main trip of purpose, such as, typically between home and workplace. In essence, the person-trip survey does not account for trips other than their main purpose. This can be seen as an advantage of CDR data over the person-trip survey data as the mobility of people taking short trips as well as the intermediate points/locations of trips can be captured, not just the “endpoints” or origin and destination locations.

5. Conclusions

This paper proposed an innovative method based on proven techniques for extracting the spatiotemporal mobility patterns of millions of people living in a metropolitan area and reconstructing their spatiotemporal distribution from mobile phone big data—specifically, call detail record (CDR) data. The results of the proposed method are presented in the form of trip generation and attraction and people flow maps and OD matrix, which are easily interpretable and practically useful for urban and transportation planning purposes. Furthermore, we presented in addition 1-h interval population density maps for an average weekday and weekend. We applied the proposed method to Greater Maputo, as a first for CDR data analytics in Mozambique. The main advantages of using CDR data over traditional data collection methods include utilization of fewer resources in terms of cost and labor for both data acquisition and method implementation, and a larger sample size that provides less bias. Moreover, our method is easily reproducible such that the results can be updated regularly or as soon as new CDR data are acquired, unlike traditional surveys, which take years to be updated. In addition, our method is able to capture trips in different time frames (weekdays and weekends), in contrast to person-trip interview surveys which can give biased results.
Our results are practically useful for planners and policymakers as they provide them with an understanding of which areas should be considered or prioritized for developing/improving new/existing road and public transportation networks and infrastructure. For example, our OD matrix can be readily used and interpreted for transportation demand modeling. The population distribution map allows monitoring the dynamic changes in how people move an emerging metropolitan area. Such can be directly used to detect and comprehend the temporal characteristics of congestion and to adjust the existing transportation facilities correspondingly. Urban planners can find the temporal density of an area a useful indicator of land use. Public facility managers may also benefit from understanding how and where people move in the surrounding neighborhood to operate their facilities more effectively.
Our analysis provided thoughtful insights and represented temporal changes in densities in the metropolitan area. We applied an offline data processing in our method for 12 days only due to limited data availability. A longer observation period may enhance the robustness of the results and show seasonal changes in mobility. In addition, we relied directly on the cellular tower location, and the Voronoi polygons, correspondingly, to infer population mobility patterns. However, the distribution of such infrastructure may change when the MNO decides to add or remove a cellular tower at a certain location. That may result in inconsistent results over time. However, telecommunications companies can triangulate and localize the location of mobile phones when recording any transaction with an accuracy between 200 to 300 m as in [32]. Such will convert the geographical location associated with CDR to coordinates and eliminate the aforementioned problem.
In future work we plan to fine-tune our method to obtain more accurate results, and extend the coverage of our study to the entire country of Mozambique with a longer observation period and localized coordinates.

Supplementary Materials

The following are available online at https://zenodo.org/record/1302815#.WzmFMVJwuVk.

Author Contributions

Authorship has been included and strictly limited to researchers who have substantially contributed to the reported work. M.B. and M.G.M. wrote the paper. M.B. designed the research framework. M.B. and H.K. Conducted the technical analysis of mobile phone big data. M.B. directed the static visualization, while H.K. directed the dynamic visualization of human mobility. R.S. and H.K. administered CDR data acquisition. Y.S. provided critical review and suggestions that enhanced the outcome. All authors discussed the results and their implications and approved the submitted manuscript.

Funding

This research received no external funding.

Acknowledgments

The authors gratefully acknowledge Instituto Nacional das Comunicações de Moçambique (INCM) and Mozambique Road Fund for facilitating CDR data acquisition used in this study.

Conflicts of Interest

The authors declare no conflicts of interest.

References

  1. Manyika, J.; Chui, M.; Brown, B.; Bughin, J.; Dobbs, R.; Roxburgh, C.; Byers, A.H. Big data: The next frontier for innovation, competition, and productivity. McKinsey Glob. Inst. 2011, 156. [Google Scholar] [CrossRef]
  2. GSM Association (GSMA). The Mobile Economy 2018; GSMA; London, United Kingdom, 2018.
  3. In Much of Sub-Saharan Africa, Mobile Phones Are More Common Than Access to Electricity—Daily Chart. Available online: https://www.economist.com/graphic-detail/2017/11/08/in-much-of-sub-saharan-africa-mobile-phones-are-more-common-than-access-to-electricity (accessed on 31 May 2018).
  4. Steenbruggen, J.; Tranos, E.; Nijkamp, P. Data from mobile phone operators: A tool for smarter cities? Telecommun. Policy 2015, 39, 335–346. [Google Scholar] [CrossRef] [Green Version]
  5. Calabrese, F.; Lorenzo, G. Di Estimating Origin-Destination Flows using Mobile phone Location Data. Cell 2011, 10, 36–44. [Google Scholar] [CrossRef]
  6. Becker, R.A.; Cáceres, R.; Hanson, K.; Isaacman, S.; Loh, J.M.; Martonosi, M.; Rowland, J.; Urbanek, S.; Varshavsky, A.; Volinsky, C. Human mobility characterization from cellular network data. Commun. ACM 2013, 56, 74. [Google Scholar] [CrossRef]
  7. Ranjan, G.; Zang, H.; Zhang, Z.-L.; Bolot, J. Are call detail records biased for sampling human mobility? ACM Sigmob. Mob. Comput. Commun. Rev. 2012, 16, 33. [Google Scholar] [CrossRef] [Green Version]
  8. Arai, A.; Witayangkurn, A.; Kanasugi, H.; Horanont, T.; Shao, X.; Shibasaki, R. Understanding User Attributes from Calling Behavior: Exploring Call Detail Records through Field Observations. Adv. Mob. Comput. Multimed. 2014, 95–104. [Google Scholar] [CrossRef]
  9. Arai, A. Dynamic Census: Estimation of Demographic Structure and Spatiotemporal Distribution of Dynamic Living Population by Analyzing Mobile Phone Call Detail Records; The University of Tokyo: Tokyo, Japan, 2013. [Google Scholar]
  10. González, M.C.; Hidalgo, C.A.; Barabási, A.L. Understanding individual human mobility patterns. Nature 2008, 453, 779–782. [Google Scholar] [CrossRef] [PubMed]
  11. Schneider, C.M.; Belik, V.; Couronne, T.; Smoreda, Z.; Gonzalez, M.C. Unravelling daily human mobility motifs. J. R. Soc. Interface 2013, 10, 20130246. [Google Scholar] [CrossRef] [PubMed]
  12. Louail, T.; Lenormand, M.; Cantu Ros, O.G.; Picornell, M.; Herranz, R.; Frias-Martinez, E.; Ramasco, J.J.; Barthelemy, M. From mobile phone data to the spatial structure of cities. Sci. Rep. 2014, 4, 1–12. [Google Scholar] [CrossRef] [PubMed] [Green Version]
  13. Wang, P.; Hunter, T.; Bayen, A.M.; Schechtner, K.; González, M.C. Understanding road usage patterns in urban areas. Sci. Rep. 2012, 2. [Google Scholar] [CrossRef] [PubMed] [Green Version]
  14. Caceres, N.; Wideberg, J.P.; Benitez, F.G. Deriving origin—Destination data from a mobile phone network. IET Intell. Transp. Syst. 2007, 15–26. [Google Scholar] [CrossRef]
  15. Iqbal, M.S.; Choudhury, C.F.; Wang, P.; González, M.C. Development of origin-destination matrices using mobile phone call data. Transp. Res. Part C Emerg. Technol. 2014, 40, 63–74. [Google Scholar] [CrossRef]
  16. Wang, H.; Calabrese, F.; Di Lorenzo, G.; Ratti, C. Transportation Mode Inference from Anonymized and Aggregated Mobile Phone Call Detail Records. In Proceedings of the 13th International IEEE Conference on Intelligent Transportation Systems, Funchal, Portugal, 19–22 September 2010. [Google Scholar]
  17. Qu, Y.; Gong, H.; Wang, P. Transportation Mode Split with Mobile Phone Data. IEEE Conf. Intell. Transp. Syst. Proc. 2015, 2015, 285–289. [Google Scholar] [CrossRef]
  18. Zin, T.A.; Lwin, K.K.; Sekimoto, Y. Estimation of Originating-Destination Trips in Yangon by Using Big Data Source. J. Disaster Res. 2018, 13, 6–13. [Google Scholar] [CrossRef]
  19. Jiang, S.; Ferreira, J.; Gonzalez, M.C. Activity-Based Human Mobility Patterns Inferred from Mobile Phone Data: A Case Study of Singapore. IEEE Trans. Big Data 2017, 3, 208–219. [Google Scholar] [CrossRef]
  20. Phithakkitnukoon, S.; Horanont, T.; Di Lorenzo, G.; Shibasaki, R.; Ratti, C. Activity-aware map: Identifying human daily activity pattern using mobile phone data. Lect. Notes Comput. Sci. 2010, 6219, 14–25. [Google Scholar] [CrossRef]
  21. Toole, J.L.; Colak, S.; Sturt, B.; Alexander, L.P.; Evsukoff, A.; González, M.C. The path most traveled: Travel demand estimation using big data resources. Transp. Res. Part C Emerg. Technol. 2015, 58, 162–177. [Google Scholar] [CrossRef]
  22. De Montjoye, Y.; Quoidbach, J.; Robic, F. Phone-Based Metrics. In Proceedings of the 6th international conference on Social Computing, Behavioral-Cultural Modeling and Prediction, Washington, DC, USA, 2–5 April 2013; pp. 48–55. [Google Scholar] [CrossRef]
  23. Blumenstock, J.; Cadamuro, G.; On, R. Predicting poverty and wealth from mobile phone metadata. Science 2015, 350, 1073–1076. [Google Scholar] [CrossRef] [PubMed]
  24. Steele, J.E.; Sundsøy, P.R.; Pezzulo, C.; Alegana, V.A.; Bird, T.J.; Blumenstock, J.; Bjelland, J.; Engø-Monsen, K.; de Montjoye, Y.-A.; Iqbal, A.M.; et al. Mapping poverty using mobile phone and satellite data. J. R. Soc. Interface 2017, 14, 20160690. [Google Scholar] [CrossRef] [PubMed] [Green Version]
  25. Japan International Cooperation Agency (JICA). Comprehensive Urban Transport Master Plan for the Greater Maputo 2014; JICA: Tokyo, Japan, 2014. [Google Scholar]
  26. HRSL; Columbia University: New York, NY, USA, 2016.
  27. Contributors, O. OpenStreetMap. Available online: www.openstreetmap.org (accessed on 15 January 2018).
  28. McNally, M.G. The four-step model. In Handbook of Transport Modelling, 2nd ed.; Emerald Group Publishing Limited: Bingley, UK, 2007; pp. 35–53. [Google Scholar]
  29. Okabe, A.; Boots, B.; Sugihara, K. Spatial Tessellations: Concepts and Applications of Voronoi Diagrams; John Wiley & Sons, Inc.: New York, NY, USA, 1992; ISBN 0-471-93430-5. [Google Scholar]
  30. Cervero, R.; Murakami, J. Effects of built environments on vehicle miles traveled: Evidence from 370 US urbanized areas. Environ. Plan. A 2010, 42, 400–418. [Google Scholar] [CrossRef]
  31. Zegras, C. Influence of land use on travel behavior in Santiago, Chile. Transp. Res. Rec. J. Transp. Res. Board 2004, 175–182. [Google Scholar] [CrossRef]
  32. Alexander, L.; Jiang, S.; Murga, M.; González, M.C. Origin–destination trips by purpose and time of day inferred from mobile phone data. Transp. Res. Part C 2015, 58, 240–250. [Google Scholar] [CrossRef]
  33. Isaacman, S.; Becker, R.; Cáceres, R.; Kobourov, S.; Martonosi, M.; Rowland, J.; Varshavsky, A. Identifying important places in people’s lives from cellular network data. In Proceedings of the 2011 International Conference on Pervasive Computing, San Francisco, CA, USA, 12–15 June 2011; pp. 133–151. [Google Scholar]
  34. Sekimoto, Y.; Watanabe, A.; Nakamura, T.; Horanont, T. Digital archiving of people flow by recycling large-scale social survey data of developing cities. Int. Arch. Photogramm. Remote Sens. Spat. Inf. Sci. 2012, 39, B2. [Google Scholar] [CrossRef]
  35. Moeller, C. Osm2po-OpenStreetMap Converter and Routing Engine for Java. Available online: http//osm2po (accessed on 15 January 2018).
Figure 1. Map of the Greater Maputo metropolitan area, which shows the four main cities/district it covers, as taken from the report of the Japan International Cooperation Agency (JICA) [25].
Ijgi 07 00259 g001
Figure 2. Temporal distribution of the call detail record (CDR) dataset: (a) daily, and (b) hourly.
Ijgi 07 00259 g002
Figure 3. Image of the high-resolution settlement layer (HRSL) of Greater Maputo [7].
Ijgi 07 00259 g003
Figure 4. Image of the available OpenStreetMap road links in Greater Maputo.
Ijgi 07 00259 g004
Figure 5. Division of traffic analysis zones (TAZs) for each TAZ level: (a) A TAZ, (b) B TAZ, and (c) C TAZ.
Ijgi 07 00259 g005
Figure 6. Voronoi diagram of the study area (magnified area), representing the mobile network coverage of each cellular tower.
Ijgi 07 00259 g006
Figure 7. Subscriber distribution in the study area.
Ijgi 07 00259 g007
Figure 8. Number of valid days per user.
Ijgi 07 00259 g008
Figure 9. Distribution of number of stay locations per user.
Ijgi 07 00259 g009
Figure 10. Example of an extracted trip from a CDR.
Ijgi 07 00259 g010
Figure 11. Distribution of user magnification factors ( u s r _ m a g i j ) in the study area.
Ijgi 07 00259 g011
Figure 12. Spatiotemporal interpolation method to derive population distribution.
Ijgi 07 00259 g012
Figure 13. Trip generation and attraction maps: (a) trip generation on average weekday; (b) trip attraction on average weekday; (c) trip generation during weekday morning rush hours; (d) trip attraction during weekday morning rush hours; (e) trip generation during weekday evening rush hours; (f) trip attraction during weekday evening rush hours; (g) trip generation on average weekend; and (h) trip attraction on average weekend.
Ijgi 07 00259 g013
Figure 14. People flow maps in Greater Maputo: (a) on weekday, and (b) on weekend.
Ijgi 07 00259 g014
Figure 15. Flow map for trips to Universidade Eduardo Mondlane: (a) on weekday, and (b) on weekend.
Ijgi 07 00259 g015
Figure 16. Temporal distribution of trips to Universidade Eduardo Mondlane.
Ijgi 07 00259 g016
Figure 17. Constructed origin–destination (OD) matrix of the study area.
Ijgi 07 00259 g017
Figure 18. Spatiotemporal distribution of the population in Greater Maputo on an average weekday.
Ijgi 07 00259 g018
Figure 19. Spatiotemporal distribution of the population in Greater Maputo on an average weekend.
Ijgi 07 00259 g019
Figure 20. Comparison of daily trip volumes obtained from CDR and person-trip survey at respective TAZ levels: (a) A TAZ, (b) B TAZ, and (c) C TAZ.
Ijgi 07 00259 g020
Table 1. Population distribution statistics per Voronoi for Greater Maputo.
MinMaxMeanMedian
6245,26110,2776781
Table 2. Statistical summary of Voronoi zones in the study area.
Zone LevelNo. of TAZsMin (km2)Max (km2)Mean (km2)Median (km2)
C TAZ1700.03 95.20 7.101.08
B TAZ400.81305.1330.219.65
A TAZ4252.61381.09302.17287.49
Table 3. Statistical summary of Voronoi zones in the study area.
Zone SourceNumber of TowersMin (km2)Max (km2)Mean (km2)Median (km2)
CDR Voronoi 2590.01241.218.151.83
Table 4. Statistical summary of user sample before and after filtering valid user-days.
Before FilteringAfter Filtering
Number of users1,279,291797,329
Number of user-days12,059,5614,385,089
[Weekdays: 3,252,971, Weekends: 1,132,118]
Number of trips27,117,80619,724,307
[Weekdays: 14,744,180, Weekends: 4,965,739]

