Historical Collaborative Geocoding
by
 , , , and
Rémi Cura
1,2,† ,
,
Bertrand Dumenieu
2,3,†,
Nathalie Abadie
1,
Benoit Costes
1,
Julien Perret
1,2,3,* and
Maurizio Gribaudi
2,3 1
LaSTIG/ENSG, Institut National de l’Information Géographique et Forestière (IGN)—Université Paris-Est, 94165 Saint-Mandé, France
2
GeoHistoricalData
3
The Ecole des Hautes Etudes en Sciences Sociales (EHESS), 75006 Paris, France
*
Author to whom correspondence should be addressed.
†
These authors contributed equally to this work.
ISPRS Int. J. Geo-Inf. 2018, 7(7), 262; https://doi.org/10.3390/ijgi7070262
Submission received: 6 April 2018
/
Revised: 31 May 2018
/
Accepted: 26 June 2018
/
Published: 4 July 2018
(This article belongs to the Special Issue Historic Settlement and Landscape Analysis)
Abstract
:The latest developments in the field of digital humanities have increasingly enabled the construction of large data sets which can be easily accessed and used. These data sets often contain indirect spatial information, such as historical addresses. Historical geocoding is the process of transforming indirect spatial information into direct locations which can be placed on a map, thus allowing for spatial analysis and cross-referencing. There are many geocoders that work efficiently for current addresses. However, these do not tackle temporal information, and usually follow a strict hierarchy (country, city, street, house number, etc.) which is difficult—if not impossible—to use with historical data. Historical data is filled with uncertainty (pertaining to temporal, textual, and positional accuracy, as well as to the reliability of historical sources) which can neither be ignored nor entirely resolved. Our open source, open data, and extensible solution for geocoding is based on extracting a large number of simple gazetteers composed of geohistorical objects, from historical maps. Geocoding a historical address becomes the process of finding one or several geohistorical objects in the gazetteers which best match the historical address searched by the user. The matching criteria are customisable, weighted, and include several dimensions (fuzzy string, fuzzy temporal, level of detail, positional accuracy). Since our goal is to facilitate historical work, we also put forward web-based user interfaces which help geocode (one address or batch mode) and display results over current or historical maps. Geocoded results can then be checked and edited collaboratively (no source is modified). The system was tested on the city of Paris, France, for the 19th and 20th centuries. It showed high response rates and worked quickly enough to be used interactively.

1. Introduction
1.1. Context
In historical sciences, cartography and spatial analysis are extensively used to uncover the spatial patterns at play within textual historical data. These data contain indirect textual references about location, such as place names (toponyms) or postal addresses. In order to map such data, each item needs to be geocoded—that is, assigned with coordinates through the matching of an indirect spatial reference with entities identified in a geographical data source (e.g., a map georeferenced in a well-known coordinate reference system) [1]. Problems emerge when such spatial references become obsolete due to the temporal gap between the data to be geocoded and the reference datasource—locating the London Crystal Palace (destroyed by fire in 1936) on a current map would be rather difficult. Worse still, it might create ambiguities and possibly lead to erroneous geocoding, as the Crystal Palace now refers to a South London residential area. Although manual geocoding can help in such cases, the constantly increasing volume of historical data, which results from the flourishing number of initiatives in the field of digital humanities, calls for automatic approaches. Despite the existence of highly efficient geocoding tools and API for modern data, it remains a challenge to come up with a truly historical geocoder [2,3].
1.2. Approach and Contributions
The main focus of this article is the historical geocoding problem: providing the best matching of geohistorical objects in available gazetteers for a given textual address query.
We propose to depart from the classic geocoding paradigm, where a high-quality, hierarchical, complex and complete gazetteer is used in conjunction with a simple matching method. Instead, we intend to relax the constraints on the address definition process, and use several simpler gazetteers at the same time. The complexity is transferred to the matching method, which is fully temporal, fuzzy, and can be customized according to the user’s goal.
We also discuss the construction of a geohistorical database, the development of data matching (linkage) methods which make full use of the temporal aspects of geohistorical data and the input query, as well as the collaborative dimension. The main contributions of this article consist of (1) a formalisation of the historical geocoding problem; (2) a minimal model of geohistorical objects which can easily be re-used and extended; (3) an open-source geocoding tool which is powerful, easy to use, and can be extended with any geohistorical data; (4) a graphic tool to control and edit the geocoding results, which can then optionally be used to enrich the geohistorical database; (5) a qualification of geocoding results in textual, spatial, and temporal terms.
2. Theory
2.1. Geocoding
2.1.1. Related Work
Geocoding is an inevitable step in any spatially-based study with considerable bodies of data. This makes it a critical process in various contexts: public health, catastrophe risk management, marketing, social sciences, etc. Many geocoding web services have been developed to fulfil this need, originating from private initiatives (Google Geocoding API, Mapzen (mapzen.com)), public agencies (the French National Address Gazetteer (adresse.data.gouv.fr/api/)) or from the open-source community (OpenStreetMap Nominatim (nominatim.openstreetmap.org), Gisgraphy (gisgraphy.com)). These services can be characterized in terms of their three main components [1,4]: input/output data, reference dataset, and processing algorithm. The input is the textual description the user wants to refine into coordinates. It might take the form of a traditional address containing a building number, street name, city name, or country (e.g., “13 rue du Temple, Paris, France”), but it may also be incomplete, or simply refer to a landmark (e.g., “The Eiffel Tower, Paris”). The reference dataset designates a gazetteer which pairs names of geographical entities (places, addresses) with geographical features. Because the main geocoding tools are provided by heavyweight actors of geographical information such as Google, Microsoft, OSM, or the national cartographic agencies, the geographical databases they produce are used as the reference dataset for these geocoders. These databases are extremely structured (hierarchy, normalization) and of high quality.
The processing algorithm consists of finding the best-matching element from the reference dataset for the associated input description. Finally, the output usually contains a geographical feature along with its similarity score (e.g., perfect or approximate match). Although the geometries of the matched features may be complex, they are most often rendered into simple two-dimensional points.
2.1.2. Estimating and Conveying the Quality of Geocoded Places
Because of its ability to transform the indirect spatial reference of a piece of information into a direct spatial reference, the process of geocoding is a critical stage of many spatial analyses wherein data is not directly associated with geographical coordinates (e.g., observations associated with place names). However, geocoding cannot be limited to this process. It is crucial to estimate or measure the quality of each individual indirect-to-direct transformation and either convey this information along with the final results or provide a mechanism which can correct these results. It would otherwise be impossible to establish a distinction between result variations due to the imperfection of the geocoding process and a real phenomenon which could be hidden in the data.
The quality of geocoding services can be estimated via two very important criteria [5]. First, the database quality: how complete and up-to-date is the reference database? Second, result characterisation: how spatially accurate is each result, and what is its associated reliability? In addition, the quality of the matching process can also be evaluated (how the process deals with errors in the input address, for instance).
2.1.3. Temporal Depth
Common geocoding approaches cannot be used for (geo)historical data for three main reasons. To begin with, existing geocoding services do not take the temporal aspect of the query, or the dataset they rely on, into account. Indeed, they usually rely on current data, such as OpenStreetMap (openstreetmap.org) data, which is continuously updated. As such, they implicitly work on a valid time that is the present (or possibly the interval between the beginning of the database construction and present time). The second reason is that they rely on an exhaustive, strongly hierarchical database whose accuracy can be checked against ground truth (i.e., there is always a way to check the actual location of an address; the database can therefore constitute an unambiguous and objective reference). Unfortunately, historical data cannot easily be verified. One must compare it with different available (geo)historical sources (possibly incomplete and conflicting), and must often make assumptions or hypotheses. Such hypotheses are in turn continuously challenged and updated by new discoveries, and there is no way to provide a truly definitive answer. Primary sources may also be wrong or misleading. Modern geocoding tools are not geared towards dealing with these ambiguities. Finally, available historical sources for the weaving of a gazetteer are sparse (both spatially and temporally), heterogeneous, and complex. We believe that all of these specificities call for a dedicated approach. Similar observations have already been made in the context of archival data by the UK National Archives, for example [6]. Large historical event gazetteers already exist [7,8] and provide an important basis for the development of the reference dataset. More specifically, the classic steps we have identified in geocoding for a historical source are first to establish a reference gazetteer for addresses (associating standardized textual addresses with coordinates), and then to determine the input standardized textual addresses within this gazetteer (geocoding). Theoretically speaking, this whole process is very akin to a simple database join, where the key would be the standardized textual address. However, this methodology does not take the historical dimension into account, and requires both standardized and complete gazetteers. For instance, St-Hilaire et al. [2] pinpoint a reference gazetteer of “CSD” (census subdivision) for each year in the historical period of interest. Geocoding is then completed separately for each year, with a simple CSD match. Logan et al. [9] introduce more detailed address gazetteers (which go so far as to provide street numbers). However, since the work was still in progress at the time the article was written, it gives no details on the geocoding process. Lafreniere and Gilliland [10] present work pertaining to several historical periods, and each one comprises a gazetteer of standardized addresses. When a historical address needs to be geocoded, the temporally closest gazetteer is chosen, which then allows for regular matching to occur.
However, our ambition is to fully make use the time dimension, and to relax the constraints on gazetteers. First, we can simultaneously combine several simple gazetteers by merely using a minimal subset of required information (according to the suggested geohistorical object model). Each gazetteer contains data which can both be fuzzy (errors in the address text, the date, or the position) or situated on different scales (house address, street, neighbourhood). Moreover, gazetteers may conflict with one another. Then, the geocoding of a query address is achieved thanks to a sophisticated multi-dimensional matching tool which can be customized according to user needs.
2.1.4. Handling the Imperfections of Geohistorical Data
Geohistorical data, like any other type of data, contains imperfections. Such imperfections can be categorized into three main classes : uncertainty, imprecision, and ambiguity [11]. Uncertainty applies to information of which the reliability can be questioned. To what extent can we trust the location of an address point depicted in a map, when we know that this map contains errors? Just as a GPS can generate a location within a 20-m radius, the precision of the locations spawned within a historical map is limited by the precision of the map itself. Ambiguity arises from two situations. First, different sources can provide conflicting information about the same geographic entity. Second, the information available in an entity can be too sparse to properly define the properties of that entity, and can therefore be unable to produce data of sufficient quality.
To our knowledge, no other historical geocoding approach has taken the the characterisation of geocoding results into consideration. However, it is an essential aspect for historical geocoding due to the very imprecise and sparse nature of geohistorical data. Indeed, geocoding results need to be validated and/or edited manually.
Given the large amount of addresses (more than 100,000 addresses for Paris) and the potential complexity of the task, this is clearly a large amount of work. Fortunately, several projects such as OpenStreetMap have lead the way for what is usually called volunteered geographical information (VGI) [12] of crowdsourcing geospatial data [13]. This approach consists of using collaboration to solve a problem collectively, usually by having citizens participate in the process. This approach has already been extensively used for historical data, although in distinctively different contexts. For instance, Southall, Mostern, and Berman [14] put forward a website which aspires to collaboratively input the place names that appear on the map of Great Britain for the years 1888 to 1914. Other projects such as Keweenaw history http://www.keweenawhistory.com/ and several projects heralded by the New York City Public Library labs [15] have been using crowdsourcing to create or edit historical data, such as building footprints. Our approach is similar: a convenient web interface and the power of collaborative editing are also used. However, our end goal is different. Our purpose is not to create an authoritative historical data source. Rather, we intend to allow each user to adapt the source to their own usage.
As suggested in a recent typology of participation in citizen science and VGI [16], different levels of participation can be defined. These levels range from “crowdsourcing”, where the cognitive demand is minimal, to “extreme citizen science” or “collaborative science”, where citizens are involved in all stages of research (problem definition, data collection and analysis). In the rest of this article, we propose a collaborative historical geocoding approach for a simpler participation of citizens in geohistorical research using dedicated interactive tools. A reproducible research approach using open source tools and open data [17,18,19,20] leads to a more collaborative historical science.
2.1.5. Handling Heterogeneous Address Types
Some modern geocoders are able to return various types of geographic features. For instance, the OpenStreetMap geocoder can return a set of hierarchically organized geographical features.
Similarly, the method we present here is able to return different geographical features based on the best match for the textual address. For example, the following textual address, “12 rue du Temple, Paris, France”, might return a dot representing the building, a polyline representing the street, and/or a polygon for the city or the country, depending on the available information and on user preferences (the scale parameter).
2.2. Integrating Geohistorical Data
General Considerations about Building a Spatio-Temporal Database
Extracting information from historical maps amounts to building a spatio-temporal database. There are several approaches to doing so, and we stress that our attempt is not to create a continuous spatio-temporal database. Instead, we store representations of the same space at multiple moments in history, according to the well-known snapshot model [21].
2.3. Extracting Geohistorical Objects from Historical Maps
The starting point for building gazetteers is to extract information from historical maps. The first part of the extraction process is to scan the maps (i.e., going from a paper map to a computer file) and to georeference the map in a defined coordinate reference system. These maps are historical sources, and as such, a historical analysis is performed in order to estimate the probable valid time (temporalisation), positional accuracy, completeness, confidence, relation to other historical maps, etc.). In our approach, we focus on geometrically accurate historical maps as our primary source for two main reasons:
- Historical maps are spatially close to modern maps. The way in which spatial information is described is very similar (both are based on mathematically well-defined reference systems, as opposed for instance to an artistic painting of a city which would be seen as a non-geometrical map). The integration of the information they convey in a Geographical Information System (GIS) is therefore facilitated.
- The main goal of such maps is to provide a reliable depiction of the shape and location of geographical features.
Although this choice seriously reduces the number of possible sources and therefore lessens the quantity of accessible spatial information, it aims at efficiency. Indeed, geometrical maps are a good compromise because they are reliable while at the same containing a large amount of spatial information, and can bear the complexity of information extraction.
2.3.1. Georeferencing Historical Maps
We must establish a correspondence between each pixel of the historical map and its geographical coordinates. To do so, we first choose a common spatial reference system (SRS). We then identify common geographical features between historical maps and current maps: so-called ground control points (GCPs). Last, we compute a warping transform which will stick as closely as possible to the matching points. Finding GCPs between current maps and historical maps can be increasingly difficult as we go back in time, because there are less and less perennial GCPs. Consider, for instance, the city of Paris, where the French Revolution and its consequences combined with 19th century transformations (including the so-called Haussmannian transformations) resulted in massive changes in the shape of the city. To this end, we could start by georeferencing, for example, 20th century maps to current maps, then georeference, for example, 19th century maps to 20th century maps, and keep going for even older maps. A more in-depth analysis of the spatial quality of historical maps of Paris can be found in [22].
Choosing the Target Spatial Reference System
Geographic coordinates are expressed through a coordinate reference system, which can either be geographical (i.e., coordinates are latitude and longitude) or projected on a plane. Georeferencing a map requires choosing a target coordinate system to place it on the Earth’s surface. It can be chosen arbitrarily, but it is advisable to select a coordinate system associated with a cartographic projection close to that of the map which is to be georeferenced. Indeed, most Western countries’ maps since the 18th century have attempted to depict a geometrically accurate geographical space, which implies using a mathematical model for the Earth and to display a projection on a piece of paper. Large-scale maps such as city maps usually rely on a simple plate carrée projection with an approximation of the Earth, depicted as a flat surface. In the case of low-scale maps such as country maps, the projection and coordinate system depends on the state of geodetic knowledge and cartographic methods. In most cases, however, the exact parameters of the historical map projection are unknown. Ignoring the original projection and coordinate system of the map can result in geometrical distortions of the georeferenced map.
Selection of Ground Control Points
The identification of pairs of GCPs is a critical step because the number, distribution, and quality (i.e., positional accuracy, reliability, confidence) of the points strongly influence the quality of the georeferencing. The reliability of the chosen GCPs actually depends on the geographic entities they are placed on, which calls for an in-depth study of the construction process of the historical map. Because this can be a very time-consuming task, it is possible to choose the GCPs based on some simple rules. First, the GCPs should be located on the geographic entities that are the most stable through time. This typically includes the main religious and administrative buildings such as churches and palaces. On high-scale maps of cities, street intersections might also be acceptable supports for GCPs. On low-scale geometric maps, bell towers are often the most accurate objects since they have been extensively used as anchors for survey operations. In general, unstable geographical features such as rivers, forests, rural roads, coastal lines, etc. should be avoided. While the quality of the selected points depends on each map, a simple general rule is to select as many homogeneously distributed points as possible in order to make some progress [23]. Three parameters must be considered: the geometrical type of the features carrying the ground control points, their nature, and the method used to identify them. Usually, features chosen as ground control points are represented by 2D points. Lines or surfaces may also be used, and possibly even curves [24]. For historical maps, the positional accuracy of mapping themes can vary greatly, either because of the map’s purpose, or due to the mapmaking process itself. Optionally, geodetic features drawn on the map such as meridians or parallels can also be used as GCPs, provided their geodetic characteristics can be fully specified (e.g., identify exactly which meridian is drawn in which exact reference system). The actual identification of GCPs can be achieved by automatic or manual processes. Automatic approaches are notably used for historical aerial photographs, where feature detection and matching algorithms are well-fitted [25]. Common GIS tools offer georeferencing software, allowing users to manually select pairs of ground control points identified in both the input and reference maps. Such tools are often used for historical map georeferencing because: (1) they are easy to utilize and (2) they allow historians to control the quality and reliability of the identified points by using co-visualization between both maps. The NYPL Lab even proposed a web-based version geared toward historical data (Map Warper http://maps.nypl.org/warper/).
Choosing a Geometric Transformation Model
Once an acceptable set of paired features has been identified, the last step is to compute the transformation from the input map to the reference. Several transformation models have been proposed: global transforms (affine, projective), global with local adaptations (polynomial-based), and local transforms (rubbersheeting, thin-plate spline, kernel-based approaches, etc.). Studies have been conducted to assess the relevance of these transformations for historical maps [23,26,27]. They show that choosing a model is mostly a matter of compromise between the final spatial matching between the feature pairs (i.e., the expected residual error) and the acceptable map distortion with regards to its legibility. Exact or near-perfect matching between features can be achieved with local transforms and high-order polynomials, whereas the internal structure of the map is mostly preserved by global transformations. Low-order polynomials offer a compromise between both constraints.
2.3.2. Temporalization: Locating Geohistorical Sources in Time
Georeferencing is a way of locating multiple maps in the same reference space. Similarly, temporalization is the process of locating each geohistorical source in time. When building spatio-temporal snapshots from historical maps, the key problem is determining the moment where the map is representative of the actual state of the area it portrays (i.e., the valid time of the map). We define the valid time of each map as the period starting with the beginning of the topographic survey and ending with the publication of the map, which is often uncertain. Representing uncertain or imprecise periods of time is a common issue when dealing with historical information, and many authors have relied on fuzzy set theory to represent and reason on imperfect temporal knowledge [28,29]. In all generality, temporal knowledge is represented by a function of time with values ranging from 0 (the source provides no information at this time) to 1 (geographical entities portrayed in the map are regarded as existing and tangible at this time).
2.3.3. Extracting Information from Maps
Once the historical maps have been georeferenced and temporalized, their cartographic objects can be extracted to produce geohistorical objects. The most common way of extracting information from maps is by human action with classic GIS software (e.g., QGIS). However, each historical map of Paris contains a large amount of information to be extracted (e.g., thousands of street names, even more building numbers, etc.). A first solution would therefore be to use computer vision and machine learning methods to create automatic extraction tools. These tools can process the whole map in a few hours. Regrettably, such tools are difficult to design, are very specific to each historical map, and may produce low-quality results (see Figure 1). Collaborative approaches have recently shown to be very efficient for building large geographical databases in a relatively short period of time (OSM http://www.openstreetmap.org, NYPL http://buildinginspector.nypl.org/). In the end, for the use case of Paris, data is mainly extracted manually by experts, except for the Open Street Map data which is a mix of collaborative editing and collaboration with the French Mapping Agency (IGN).
3. Methods
Based on historical sources and historical maps, we extracted geographical features which were then gathered into several gazetteers. These (geo)historical features were modelled generically (geohistorical objects) into a relational database management system (RDBMS). Geocoding an input historical address involves finding the geohistorical object in the gazetteers that best matches this historical address. We propose a matching process relying on several distances (temporal, textual, spatial, etc.) which can be customised by the user. The results can be displayed via a web mapping interface over current or historical maps, and further checked and edited collaboratively. Any edit creates a duplicate of the original geohistorical object from the gazetteer, which is then added as another geohistorical source (user-contributed). Figure 2 illustrates this approach.
3.1. Building Historical Gazetteers
Our approach for building a historical gazetteer follows these steps:
- a historical map is scanned;
- scans are georeferenced using hand-picked control points;
- historical work allows for the estimation of temporal information and spatial precision of the map;
- road names and axis geometry are extracted from the scan (manually or automatically);
- building numbers are extracted from the scan (manually or automatically);
- in some cases, building numbers can be generated from the available data (e.g., road starting and ending building number);
- normalised names are created from historical names (dealing with abbreviations, etc.),
- geohistorical objects are created.
Extracting Geo-Historical Information from Maps
The whole process is carefully designed and explained in detail in [30], which is a work on modelling historical geospatial information including source qualification, georeferencing, analysis, and data extraction, associated with optimization methods to create and exploit spatio-temporal street graphs (linkage between historical information).
Geohistorical objects are then extracted from the referenced historical maps, mostly manually (collaboratively), or with the help of computer vision techniques. The main advantage is that for a given moment in time we can have several conflicting snapshots that coexist. This is essential, as solving these conflicts may not be possible, and reporting these several conflicting geocoding results to historians may help appreciate the results. The drawbacks of this model (i.e., information redundancy and the inability to store the changes themselves) can be overcome during the geocoding process.
3.2. Modelling Geohistorical Objects
Information extracted from historical maps is used to create gazetteers. Gazetteers may contain different kinds of information, but we designed a core set of information that these gazetteers must possess: the geohistorical object model. To this end, we designed a geohistorical object model with all the necessary attributes and the flexibility to adapt to a great variety of geohistorical object types and sources. Our goal was to provide a generic minimal (geo)historical object model which can be used by others and easily extended when necessary. Please note that this geohistorical object model is separate from the geocoding issue, and that several gazetteers may contain redundant or conflicting geo-historical objects. Such occupancy is allowed, as it is common for historical sources to be redundant and conflicting. Furthermore, the geocoding method was designed to take these issues into account.
3.2.1. Modelling Geohistorical Objects
Geohistorical data is extremely diverse, both in terms of historical sources and of how the sources were dealt with by historians. As such, historians use complex tailored models. We do not aim to model every piece of geohistorical data in its own specificity and complexity. Instead, we propose to model the bare minimal common properties of all geohistorical objects, and offer mechanisms in order for this model to be easily extended and tailored to the specificities of the data. To define the bare minimal model, we start from the very nature of a geohistorical object: both a historical object and a geospatial object. The extension mechanism is provided via a database-object oriented design using table inheritance, and is packaged into a PostgresSQL extension https://github.com/GeoHistoricalData/geohistorical_objects..
Geohistorical objects possess both a historical and a geospatial component. We stress that modelling the primary source and the extraction process of a geohistorical object is important in order to trace the provenance of the information. The details of the model are illustrated in Figure 3.
Historical Aspect
In our model, a historical object is defined by its name, source, and temporalization.
- Name. By name, we mean the historical name initially used to identify the object in the historical source, and the current name used by historians to identify the object in the current context. For instance, the historical name for the Eiffel Tower in Paris may be “tour de 300 m”, but today, it is referenced as “Tour Eiffel”. Both can coexist in a gazetteer (two different geohistorical objects, with a different source and date).
- Source. A historical object is defined by a primary historical source (document) where the object is referenced. In addition to the historical source, the way in which the object was digitized in this source is also essential. For instance, a street name may have the Jacoubet map as its historical source, and would have been digitized via collaborative editing on the georeferenced map.
- Temporalization. Any historical source is associated with temporal information (fuzzy dates), which is the period during which the source is most likely to be relevant. In addition to the historical source’s temporal information, a historical object can also have its own temporal information. For instance, a street may have been extracted from a historical map created between 1820 and 1842. The use of other historical documents may allow the probable existence of this street to be narrowed to 1824–1836. Keep in mind that several other geohistorical objects may describe this street at several other time periods in the same or in another gazetteer.
Geospatial Aspect
A geohistorical object is also defined by geospatial information: a direct spatial reference (geometry) and its positional accuracy metadata.
- Geometry. A feature has a geometry which follows the OGC standard http://www.opengeospatial.org/standards. It may be a point, polyline, polygon, or a composition of any of these, in a specified SRS. The geometry is extracted from the historical source manually or automatically. Such information will be given in the Source description.
- Positional accuracy. Historical features have positional accuracy information. This precision expresses the spatial uncertainty of the historical source (the person drawing the map might have made mistakes) and the spatial imprecision of the digitizing process (the person editing the digitised map might have made a mistake). One historical source may contain several accuracy metadata, one for each geohistorical object type it contains. For instance, a historical map may contain buildings and roads. Buildings may have a different positional accuracy (5 m) than the road axis (20 m). Besides, the digitising process precision may have been 5 m.
Temporal Aspect
A historical source contains information about its valid time. This valid time is represented in a fuzzy way. Our model can adapt to any piecewise linear function, but we chose to model imprecise valid times as trapezoidal fuzzy sets, since these functions are simple to understand and use, and cover most common use cases. We rely on the pgSFTI https://github.com/OnroerendErfgoed/pgSFTI postgres extension to store and manipulate such temporal fuzzy information. For instance, Figure 4 illustrates the valid time of a map whose topographic survey started in year 1775, ended between years 1779 and 1780, and which was engraved in late 1780.
3.2.2. A Database of Geohistorical Objects
We define a conceptual schema for geohistorical objects, which is based on two names, a source, a capture process, fuzzy dates, and a geometry. This delineates the core of a generic geohistorical object. However, this geohistorical object model is easily extendible using the table inheritance mechanism, an object-oriented design mechanism available in PostgreSQL (see Figure 5).
Table Inheritance
The concept of table inheritance is simple, although slightly dissimilar to classic object-oriented inheritance. When a table is created as inheriting from a table , will at least feature the columns of , but can also contain other columns (provided there is no name/type collision). In our case, this means that a table of geohistorical objects will inherit from the main geohistorical object table (i.e., will have all the core columns of geohistorical objects (names, sources, temporal aspect, spatial aspect)), but can also have its own tailored column, providing the necessary flexibility. Another key aspect of table inheritance is that when the table is queried, the query will not only be executed on the rows of the table, but also on the rows of all tables. This means that all tables using the geohistorical object model will be virtually grouped and accessible from one table. This behaviour has no real equivalent in object-oriented programming.
Simulated Inheritance of Index and Constraints
The PostgreSQL table inheritance mechanism is limited in some aspects, because constraints and index cannot be inherited. Constraints are essential, because they are used to guarantee that any geohistorical object will correctly use existing sources from the source tables (“historical_source” and “numerical_origin_process”). Indexes are also essential, because when using hundreds of thousands of geohistorical objects, they are needed to help speed up the queries.
We index not only names, but all geohistorical object core columns (names, sources, temporal aspects, spatial aspects). We propose a registering function that the user can execute only once when creating a new geohistorical object table. This function then creates all the necessary indexes and constraints, and the appropriate inheritance.
Modelling a Geohistorical Object from the User’s Perspective
The practical steps to creating geohistorical objects are simple:
- Add the historical source and numerical origin process in the source and process tables.
- Create a new table inheriting geohistorical objects and containing your additional custom columns
- Use the registering function with this table name
- Insert your data in the table.
Please note that no disambiguation or comparison must be performed compared to other historical sources. Several historical sources with conflicting/duplicate information can co-exist without any problem.
3.3. The Historical Geocoder
In our method, geocoding something means finding the most similar geohistorical objects within the available gazetteers, which then provide the geospatial information. This approach relies on two key components: gazetteers of geohistorical objects, and a metric to find the best matches. This approach allows geocoding to be performed broadly, as it does not rely on a structured address (number, street, city, etc.), but rather on a non-constrained name. For instance, the address “Eiffel Tower, Paris” is not structured, but would nonetheless be useful in our approach.
3.3.1. Creating Geohistorical Object Gazetteers for Geocoding
Geohistorical object gazetteers are key for geocoding. These objects are extracted from historical maps and inserted into geohistorical object tables. Each table forms a gazetteer.
Database Architecture for Geocoding
Again, we use the PostgreSQL table inheritance mechanism. To this end, we create two tables dedicated to geocoding. Gazetteer tables which will be used in geocoding must inherit from these two tables. Table “precise_localisation” is for geohistorical objects corresponding to postal addresses (e.g., “12 rue du Temple, Paris”). Table “rough_localisation” is for road axis, neighbourhood, and other coarse urban objects. We chose to have two separate tables for ease of use and performance. Geocoding queries are then performed on the two parent tables, but thanks to inheritance, these parent tables virtually contain all the gazetteers’ tables containing the actual geohistorical objects, as illustrated in Figure 6.
3.3.2. Finding the Best Matches
Once geohistorical object gazetteers describing precise and rough localisation are available, we geocode to find the best match between the input query and the objects.
Concept
We call the potential matches “candidates”, and the problem is then to rank the candidates from best to worst. The user can choose how many candidates they want, depending on the application. For an automated batch geocoding, the best match (top candidate) is optimal. For a human analysis of data, several matches may be more interesting (e.g., the top 10 candidates). What qualifies as “best” depends on the user’s expectations. We provide a number of metrics which can be combined by a user into a tailored ranking function. The function is expressed in SQL, with access to all postgres math functions. We describe the available metrics and give examples of such functions.
We note that other matching methods using probability or machine learning have recently emerged (see [31] for an evaluation).
Example
For instance, when a user geocodes the address “12 rue de la Vannerie, Paris” in 1854, they may be more interested in geohistorical objects that are textually close (e.g., a geohistorical object “12 r. de la Vannerie Paris”, 1810), or maybe geohistorical objects that are temporally close (e.g., “12 r. de la Tannerie Paris”, 1860).
Metric: String Distance
We use the string distance provided by the PostgreSQL Trigramm extension (pg_trgm https://www.postgresql.org/docs/current/static/pgtrgm.html), which compares two strings of characters by comparing how many successive sets of three characters are shared. For instance “12 rue du Temple” will be farther away from “12 rue de la Paix” than from “10 r. du Temple”.
Metric: Temporal Distance
Both the address query and the geohistorical object are described by fuzzy dates. In order to compare such temporal information, we propose a simple fuzzy date distance that casts fuzzy dates into polygons. The x axis is the time, and the y axis is the object’s probability of existence. Then, the distance between two dates A and B is computed as shortest_line_length (A,B) + Area (A) − Area (A ∩ B). Note that this distance is asymmetric.
Metric: Building Number Distance
To get building number distance, a function first extracts the building number both from the input address query () and from the geohistorical object (). If and have the same parity, the distance is . If parity is different, the distance is . In France, building numbers generally have the same parity on each side of the street (e.g., Left : 1, 3, 5, …; Right: 2, 4, 6, …). We analysed current building numbers in Paris and determined that on average, given a building number , the closest building number with a different parity has a 10 number difference.
Metric: Positional Accuracy
Another way to rank geohistorical objects is to use their positional accuracy. The positional accuracy of a geohistorical object is either the positional accuracy computed for this object when it is available, or the default positional accuracy of its geohistorical source.
Metric: Level of Detail Distance
Providing localisation information at different levels of detail, depending on user requirements, is an important quality issue for our geocoder. For instance, if the level of detail of the user’s query data is the city, there is no need to perform a more precise geocoding. The user can therefore specify a target scale range . Then, given a geohistorical object whose geometry is buffered () with its spatial precision, the scale distance is defined by . The formula gives an idea of the geohistorical object’s spatial scale.
Metric: Geospatial Distance
The user may provide an approximate position for the area they are interested in. For instance, in France, cities “Vitry-le-Francois” (East) and “Vitry-sur-Seine” (near Paris) both exist, but are spatially very far apart. A user expecting results in the Paris area may provide a geometry (e.g., a point) near Paris. The classic geodesic distance is then computed between the provided geometry and the candidate geohistorical objects.
Example of Matching Function
The different metrics can be weighted and combined depending on user needs. Equation (1) provides an example favouring good string similarity, but not at the expense of a large temporal distance:
3.4. Collaborative Editing of Geohistorical Objects
The geocoding approach we presented in the previous section works inside a PostgreSQL database. Given an input address and fuzzy date, plus a set of parameters, it returns the geohistorical objects that best match the input. However, the geocoding results are only as good as the gazetteers used (at best). The geohistorical objects within the gazetteers may be spatially imprecise, mistakenly named, or simply missing. Given that the volume of geohistorical objects is large (for Paris, approximately 50,000 building numbers per historical map), we created a collaborative platform which facilitates geocoding, result visualisation, and geospatial object editing when necessary. To this end, we created a dedicated web application in order for collaborative edits to be made without having to install specific tools. The user can then edit both the position of the result and the fuzzy date of the result. In fact, the user does not edit the sources, but actually edits a duplicate. These duplicates are stored and used by the geocoder as another gazetteer. We do not try to merge/resolve several edits of the same address, as is common for historical gazetteers, because there is no unique definition of an address’ proper position. By design, the quantity of data is then ever-increasing, yet the very large number of addresses (several hundreds of thousands) and the user profile (expert or historians) limit this potential problem.
3.4.1. About Collaborative Editing
Given the complexity of calibrating automatic extraction tools on specific maps and their relative reliability, the collaborative digitisation of vector objects from maps is a safe alternative. For instance, we used such an approach in order to extract the main feature of the Cassini maps (18th century France) [32]. Furthermore, the results of the collaborative extraction of features can then be used to test, calibrate, or train automatic extraction algorithms. However, the collaborative editing paradigm used is somewhat different from the classic one, a-la Open Street Map, which has also been used in several historical mapping projects. In the classic paradigm, users are asked to input and correct well-defined historical data, such as building footprints or toponyms, based on a map where this information appears unambiguously. The end goal is then to create authoritative, complete, and coherent gazetteers. This requires a large amount of work on the users’ inputs, using strategies such as vote and anonymous check to ensure the gazetteer quality.
In contrast, our approach introduces a much simpler collaborative editing process, whereby the users are not tasked with creating an authoritative gazetteer, but rather create their own version tailored after their specific needs. In our model, users never edit original data, but instead create their own geohistorical objects.
For instance, a user might geocode the address “12 rue du Temple, Paris; 1856”. The geocoded result (e.g., a point) might be drawn from an available gazetteer created from a historical map. Such a point position may be not accurate enough for the user, and they may decide to correct it. While correcting the point, the user is not editing the gazetteer, but just adding a new geohistorical object into a new gazetteer which represents this user’s edits. Such edits can subsequently be modified by the same user, and may appear in other users’ geocoding results. However, no step is performed to aggregate user edits. The reason is that unlike a building footprint, an address position is not something that is well-defined. Different historians may use different definitions of what an address position should be. One might require that addresses be centred in the building, others that they be at the front of the building, etc.
The necessity not to aggregate user edits is even more obvious when considering the address date. Several historians may use different sources to date an address, leading to the creation of several geohistorical objects representing this address in different time periods.
A potential issue would be data build-up, as each edit may introduce new data. The impact of this issue is greatly reduced for several reasons. The first is that the goal is not to create a reference gazetteer. As such, merging is not required per se. The second is relevant to scale. Just for the city of Paris, there are hundreds of thousands of building numbers, with very frequent changes. Thus, the chances that a single address gets edited many times by many different users is low. The third reason is more theoretical. The increasing amount of data is actually a useful feature. Several edits by several users will result in several edited geohistorical objects being added to a specific gazetteer (the user-edit gazetteer). In turn, these results will be used by the geocoder, which will enrich future user experience. Indeed, a future user geocoding the same address would be able to see all the edited versions, and thus choose the more appropriate one according to their needs.
3.4.2. Collaborative Editing Architecture
Figure 7 outlines the architecture used for collaborative editing.
Architecture
The heart of the architecture is a PostgreSQL database server, which contains the geohistorical object gazetteers to be used for geocoding as well as the geocoding function. A web server can geocode addresses and return results via a REST API. However, the web server has another option wherein the results are not returned, but instead written in a result table along with a random unique identifier (RUID). The RUID is then the key that allows the display and editing of the results. To this end, a geoserver can access (read and edit) the result table via the WFS-T protocol. A web application based on Leaflet then acts as a user interface to display and edit the results via the geoserver.
Persistence of Geocoding Results and Edits
The architecture that allows persistence of the results is illustrated in Figure 8. When using the RUID mechanism, each geocoding result (i.e., the found geohistorical object from the gazetteers) is associated to this RUID.
The user therefore has permanent access to its results, regardless of the computer session or browser cache issues.
For edits, a specific mechanism is used. The user does not directly edit the result table, as they could potentially edit other peoples’ results. Instead, the user edits a dedicated result_view which acts like a bouncer. It allows one to edit only if the edit is occurring on a row that has the user’s RUID. Of course, user edits of geospatial objects do not affect the source data, for tracking purposes.
Instead, a new user edit automatically creates an edited copy of the geohistorical object in a dedicated table “user_edit_added_to_geocoding” which is a gazetteer and is used by the geocoding process. The edited geohistorical objects are inserted in this table. The objects retain their “historical_source”, but their “numerical_origin_process” is changed to properly document the fact that they are the result of collaborative editing.
3.4.3. Collaborative Editing User Interface
We consider that building an efficient user interface is very important for historical geocoding. In particular, many end users are specialised in history rather than computer science, and thus an easy access to geocoding is essential. All our interfaces are web-based for maximum compatibility. We propose three interfaces where results are shared (see Figure 9).
Interface for a REST API
The simplest interface we propose is a form that helps to build the necessary REST API parameters. Indeed, a REST API works via URL containing precise parameters, and it can be tedious to manipulate. For instance: http://api.geohistoricaldata.org/geocoding?address=12ruedutemple&date=1850&precision=true&maxresults=1. This interface is designed to be used in an automated way, for batch geocoding.
Interface for Batch Geocoding via CSV Files
In our experience, historians often work with spreadsheet files, where each line will be a potential historical object, along with an address and a date. To facilitate the geocoding of these addresses, we propose a user interface which reads comma-separated values (CSV) files (a standard spreadsheet format) and geocodes the addresses and dates they contain. This interface is built around the PapaParse http://papaparse.com Javascript framework. The geocoding results can then either be downloaded as a CSV file, or displayed and edited in a Web application.
Interface for Displaying and Editing Results
The most complex interface we propose is based on the Leaflet http://leafletjs.com Javascript framework. There, the user can geocode an address, or use an address which has already been geocoded via the RUID mechanism (see Section 3.4.2.1), be it from previous sessions or from geocoded CSV files. The geocoding results are displayed on top of a relevant historical map, and can be edited. Users can edit result geometry as well as result names (historical and normalised). We stress that although such edits are stored in the database and used by further geocoding queries, they do not, by design, affect source data.
4. Results
Several experiments were performed to validate our approach. First, the geohistorical model was used to integrate objects extracted from historical maps from the 19th century for the city of Paris, and the current OpenStreetMap road axis and building numbers for Paris city surroundings. Road axis, building numbers, and neighbourhoods were successfully integrated to the geocoder sources. Multiscale geocoding of dozens of thousands of historical addresses was then performed. Addresses were extracted manually by historians and extracted automatically through an automatic process. For one of the datasets, a historian manually corrected the automated geocoding results, so as to evaluate the quality of our method. Lastly, the collaborative editing of geohistorical objects was evaluated in two scenarios: analysis (several results for one address), and edit (efficiency of check/edit top results for several addresses).
4.1. Geohistorical Objects Sources
Three main historical sources of geohistorical objects were used to build gazetteers and perform geocoding (see Figure 10). The first two were historical maps of Paris from the 19th century. These maps were georeferenced, then street axes (and possibly building numbers) were manually extracted. The third historical sources were road axes and building numbers for Paris surroundings extracted from current Open Street Map data.
4.1.1. Historical Maps Used
Two major French atlases of Paris from the 19th century were integrated as geohistorical sources. The first one was the “Atlas municipal de la Ville, des faubourgs et des monuments de Paris” (Municipal atlas of the city, suburbs and monuments of Paris) created at the scale of 1:2000 between 1827 and 1836 by Theodore Simon Jacoubet, an architect who worked for the municipal administration of Paris. The second atlas is the 1888 edition of the “Atlas municipal des vingts arrondissements de la ville de Paris” (Municipal atlas of the 20 districts of Paris). For legibility reasons, we refer to the first atlas as the “Jacoubet atlas” and to the second as the “Alphand atlas” (named after Jean-Charles Alphand who was the director of the department of public works of Paris at that time). The Jacoubet atlas depicts a city standing between the housing development following the sale of properties which had been confiscated during the French Revolution and the major changes in the urban structure arising from the emergence of the fist train stations in 1837–1840 and the so-called Haussmannian transformations.
The Alphand atlas is a portrayal of Paris on a scale of 1:5000, erected after most of the Haussmannian transformations (major rework of Paris urbanism in the 19th century) had been made and after the city was merged with 11 of its neighbouring municipalities in 1860. Both atlases contain large-scale views of Paris, separated in several sheets (54 and 16 for Jacoubet and Alphand, respectively) and portray the urban street network with the name of each street, as well as public and religious buildings (see Figure 11). In addition, the house numbers are specified for most of the streets in the city, although the Alphand atlas pictures only the numbers at the start and end of each street section. Both atlases are also built upon a triangulation canvas which covers the entire city, enabling us to expect a high positional accuracy of the geographical features they contain.
The two atlases are georeferenced using the grids drawn on the maps, which are aligned on the Paris meridian, as a pseudo-geodetic object to identify feature pairs. The dimensions of the grid cells also appear on the maps, allowing us to reconstruct the grids in a geographic reference system. The Lambert I conformal conic projection was chosen to georeference the maps. It uses the Paris meridian as the prime meridian and relies on the NTF (Nouvelle Triangulation Française) geodetic datum. The main advantage of this projection is that it is locally close to the planar triangulation of Paris used in the atlases. The projection of the maps can thus reasonably be approximated by the Lambert I projection, making the reconstruction of the grids in the target coordinate reference system straightforward. In addition, since both maps have a high scale and are reliable because they are official maps with high positional accuracy, we used rubbersheeting as the geometric transform model. The georeferencing process applied for each atlas was the following:
- reconstruct the meridian-aligned grid with Lambert I coordinates;
- in each sheet, mask the non-cartographic parts out (cartouche, borders, etc.);
- for each sheet, set pairs of ground control points at each intersection between the vertical and horizontal lines of the grids in the map and in the reconstructed grid;
- transform each sheet with a rubbersheeting transform based on the ground control points previously identified on the grids.
Based on these atlases, vector road axis were manually drawn and the road names inputted for the Alphand map. The building numbers at the beginning and end of each street segment were also inputted. For Jacoubet, the building numbers from a previous map (Project Alpage, Vasserot map, [33]) were adapted to fit the Alphand map. Multiple series of successive checking and editing were performed using ad hoc visualisation and tools.
For Alphand, building numbers were then generated based on available information (for each street segment, for each side, beginning and ending number) by linear interpolation, and an offset. The size of the offset was estimated by using current Paris road width when the road had not changed too much. Overall, the process is quite similar to that in [34].
4.1.2. Other Geohistorical Sources
The presented system accepts any data that conforms to the previously introduced geohistorical object model. As such, we also introduced data from OpenStreetMap, dated from 2016. As a comparison, Carrion et al. [35] use uniquely current data to geocode medieval places. We used the version of the data which was transformed to be used by the Nominatim geocoder. Custom scripts extracted road axis and building numbers, which were then converted into a geohistorical object table. Spatial precision was estimated after a short analysis of the positioning of a few Paris addresses. The use of Open Street Map addresses highlights several of the possibilities which the proposed method offers. First, our geocoder can work seamlessly with historical and modern data. The user can choose which type of data to use by placing more or less importance on temporal distance. Furthermore, the OSM addresses may act as a safety net for addresses that do not appear in any other historical gazetteer. Last, using modern data may be of interest for further address evolution analysis. We stress that for the geocoding system, the OSM data is just another geohistorical data set that happens to be dated from around 2016. Other modern address datasets could similarly be added.
4.2. Geocoding of Historical Datasets
One of the end goals of our geocoding tool is to be useful for historians. Therefore, we contacted several historians working on 19th century Paris. They had been collecting historical textual addresses associated to a person or business for their own research, by manually browsing hundreds of archive documents. Overall, the collected textual addresses were of good quality (being hand collected), although they sometimes contained errors and abbreviations. We imported their data into the geocoding server and geocoded the provided addresses (i.e., associated matching geohistorical objects from the gazetteers). Figure 12 shows an extract of the thousands of geocoded addresses, while Table 1 gives an overview of the number of successes and timing.
4.2.1. Manually Collected Datasets
South Americans: Collection of South American immigrants living in Paris in 1926, manually input from census, collected by Elena Monges (EHESS).
Textile: Collection of professionals of the textile industry in Paris, manually input from the “Almanachs du Commerce de Paris”, from 1793 to 1845, collected by Carole Aubé (EHESS).
Artists accommodations: Textual addresses of artist studios and artists accommodations between 1791 and 1831, collected by Isabelle Hostein (EHESS) to study their impact on Paris’ development.
Health administrators: Addresses of public health and hygiene administrators in Paris between 1807 and 1919 ([36]), collected by Maurizio Gribaudi and Jacques Magaud (INED-EHESS).
4.2.2. Belle Epoque
The Belle Epoque dataset is different from the previous one because it was automatically extracted from directories of Paris financial societies between 1871 and 1910. Directories are books referencing company addresses (as well as names and other information). The process of automatic extraction is in itself complex (Project Belle Epoque [37]), and is out of the scope of this article. We can only provide a brief description below.
First, each page of the directories of Paris for specific years was photographed. Pictures were then straightened, and information was extracted via an OCR software which was configured for the directory’s specific layout. Further rule-based processing parsed the text into address fields. As a result of this automatic process, the quality of addresses was often significantly lower than manually edited addresses (characters may be wrong, other textual fields may have bled into the address field, etc.). Therefore, we tested two settings by allowing a greater maximum string distance from 0.3 to 0.5 (over 1).
4.3. Manual Editing of the Geocoding Results for Evaluation
For one of the data sets (Textile 1 and 2), the historian manually corrected the positions of the geocoding results (i.e., the positions the geocoding associated to input textual addresses). The corrected positions now form a ground truth dataset (associating textual addresses and corrected positions). We geocoded this ground-truth dataset again and analysed the results to try and understand the accuracy of the geocoder.
The segment between an address point resulting from automated geocoding and an address point after manual editing (ground truth) was plotted. Results are presented in Table 2 and in Figure 13. We classified the results based on the length of this segment (i.e., the error in metres generated by the geocoding method).
- When the edit moved the address point by less than 15 m, we considered that the edit was mostly about small moves (e.g., centering the point on the building limit).
- Between 15 and 55 m, the correct street is found, but the building numbers are slightly misplaced (by a few numbers).
- Between 55 and 155 m, the street is correct in most cases, but the building numbers are far from their correct position.
- Above 155 m, streets are mostly wrong.
We stress that given Paris buildings’ average size and the lack of a precise definition of an address (is it the position of the door, the center of the building, etc.?), results up to 55 m (>92% of the dataset) could be considered as very close to ground truth.
4.4. Collaborative Editing
We propose several user interfaces for easy geocoding, and collaborative editing of the geocoding results. We informally tested the interfaces, and found that they facilitated geocoding, especially for the batch mode. We also tested the collaborative editing in two use cases. In the first use case, a specialised user geocodes a single address and displays the top three corresponding results. The user is an expert and their goal is both to geocode an address and assess the reliability of the result at the same time. In the second use case, a user batch geocodes several addresses (30), looking at the best result for each address. The user then displays the results on the map and checks/edits the addresses. Please keep in mind that edits never change the gazetteers, but rather create new geohistorical objects.
4.4.1. Use Case 1: Top Three Results for One Address
Using the Web application, we geocoded the address “10 rue de Vaugirard, Paris” for the date 1840, and asked for the top three results, as shown in part one of illustration Figure 14. A matching building number geohistorical object exists in the three gazetteers extracted from the three maps. Based on these results, we can safely assume that this building number has not changed during the last two centuries.
4.4.2. Use Case 2: Batch Geocoding of 30 Addresses and Check/Edit
In this use case, a regular user checks/corrects 30 random addresses from the Jacoubet map using the Web application. The task is performed quickly; checking and editing each address is a matter of seconds. The main time-consuming task is the loading of the background historical map, due to unfortunate hardware limitations. The edit speed seems to be on par with a desktop-based editing solution (using QGIS).
5. Discussion
5.1. Genericity
Reaching a more generic geocoding service is important if we want to make it usable in other contexts and to profit from the various sources of knowledge on past spaces.
5.1.1. Geohistorical Sources and Data
Using External Resources from the Web of Data as New Sources
In addition to features representing address points and streets, georeferenced features of other types could benefit the geocoding service. As a matter of fact, people often refer to places of interest, such as famous buildings, monuments like statues or fountains, or even identified neighbourhoods to describe their position in space. We are thus considering adding data about places of interest to improve our geocoding service. Like the data used to build the geocoder, this data could be gathered from ancient maps. It may also originate from existing gazetteers and knowledge bases published on the Web of data, such as DBpedia (http://wiki.dbpedia.org/), Yago (http://www.mpi-inf.mpg.de/departments/databases-and-information-systems/research/yago-naga/yago/#c10444), the Getty Thesaurus of Geographical Names (http://www.getty.edu/research/tools/vocabularies/tgn/) or the gazetteer of place names published by the French National Library http://data.bnf.fr/).
Widening the Spectrum of Cartographic Sources
We drew from Jacoubet and Alphand maps, yet there are several other maps to be used, dating from the end of the 19th century to the beginning of the 20th century. From the beginning of the 20th century, the Paris city administration produced one map per year, and it can be generally said that major cities in France were often mapped starting in 1900. A natural progression of our work would be to add maps of other cities and countries.
Before the beginning of the 19th century, the address system in Paris was very different. In the mid-18th century, the address system consisted of each building having a specific name (no number, no notion of street name) in its neighbourhood. Our geocoding process was also designed to integrate this type of address system, but it has not yet been tested. More generally, this type of indirect localisation very closely resembles the field of the Web of knowledge.
Diversity in Geohistorical Object Natures
In this article, several types of geohistorical objects were used for geocoding: building numbers, streets axes , and neighbourhoods. Other datasets were investigated as well, such as the city limits collaboratively extracted from the Cassini maps by the Geo Historical Data project [32]. In fact, a compiled version of city limits (GeoPeuple project [38]) from 1793 to 2010, created by EHESS, was also tested. However, building cadastres could also be integrated so as to have a building layout associated to an address rather than a point, which would solve the old problem of address points. Indeed, there is currently no consensus as to where a building number address point should be positioned: on the entry door, on the letter box, etc. In some cases, there is more precise data available, providing the layout of apartments in buildings, which is very exciting.
5.1.2. Genericity in Usages
Named Entity Linking
As previously mentioned in Section 5.1, people often refer to place names to describe their position in space. The task of retrieving place names in a gazetteer or in a knowledge base, also known as (spatial) named entity linking or toponym resolution, is a widely used way of disambiguating mentions of spatial named entities extracted from texts by means of natural language processing approaches for information retrieval, information extraction, or document indexing purposes [39]. As we plan to upgrade our geohistorical database with data about places of interest, we must also adapt our geocoding service in order to make it retrieve reference data stored in the database and corresponding to place names mentions proposed by the users. Spatial named entity linking implies solving issues related to place names’ inherent ambiguity [40], such as the fact that a place may have several names or the fact that several places may be designated by the same name. For each spatial named entity mention to be disambiguated, unsupervised state-of-the-art approaches first select candidates from the gazetteer based on character string similarity. Then, they introduce additional criteria in order to decide which candidate is the best reference for a given place name, usually taken from the textual context of the mention [41,42]. In cases where textual context is very limited (e.g., in tweets or location descriptions extracted from directories), this step of candidate ranking is even more challenging [43].
Analysis tool of the Cartographic Sources Content
It is interesting to look at which historical sources were the most used for geocoding, although the historical sources were chosen based on a complex ranking function. If we take the example of the over 10,000 geocoded addresses from the “Artists accommodations” dataset, we could expect all of the results to be drawn from the Jacoubet map, as the dataset is between 1793 and 1836, and the Jacoubet map is also in this range. However, analysing these results shows that if Jacoubet was used for 80% of the addresses, Alphand was used for 15%, although the map was issued 30 years after Jacoubet. More surprisingly, the OpenStreetMap current data is still used for 5% of the addresses, although it is about two centuries older than the dataset.
Similar analyses of other datasets show that all maps are always used, with of course a focus on the temporally closest map. Interestingly, these results are in agreement with similar work presented in [44], Section 4, where a prototype of multi-temporal geocoding is proposed. The approach shows that for different datasets, all reference maps (Jacoubet, Alphand, and BDAdresse (2010)) were used, with proportions depending on the parameters at play and the weight of each criteria. We think that these results are explained by the fact that historical maps miss some information, contain errors, and do not have the same geographical coverage.
5.2. Quality of the Geocoding
5.2.1. Increasing the Quality of the Gazetteers
Collaborative Enrichment
We propose several easy ways to use the geocoding capacities through Web-based user interfaces. As we put prototypes forward, the experiments are merely proofs of concept for the moment. For a real validation, a complete user study would be required, which is outside the scope of this article.
Cross-Referencing Historical Maps
One way to improve quality of available historical data is to use advanced cross-referencing. Indeed, the process of linking and merging similar data from heterogeneous datasets, which is called data conflation, enables the transfer of information from one feature to the another, and may thus bring additional knowledge about data imperfections without using ground truth data, which are non-existent for geohistorical data. For instance, Costes et aL. [44,45] proposed an aggregated spatio-temporal graph to merge and confront historical road networks. This process can reduce data heterogeneity and allow the detection of aberrations such as toponymic or numbering errors, as well as doubtful temporal trajectories of objects such as short disappearances, thereby leading to better data quality. Advanced cross-referencing also allows for the construction of a genealogy of addresses by considering temporally linked addresses, which can deal with toponymic evolution or changes in addressing systems or numbering of buildings, thus paving the way for better spatio-temporal geocoding results.
5.2.2. Communicating the Reliability of a Geocoding
Geocoding Qualification and Quality Measures
Modern geocoders are evaluated by how often they find a localisation, and by the precision of their returned localisation (e.g., [46]). The first criterion illustrates the geocoding algorithm’s ability to retrieve an address as well as the gazetteer’s exhaustiveness. The second criterion refers to the positional accuracy of the gazetteer. Using such quality evaluation measures which encompass both the algorithm results and the gazetteer completeness makes the evaluation of their respective quality impossible. In the field of named entity linking, however, distinct quality evaluation measures have been proposed for the entity retrieval algorithm, such as the measures introduced by [42] and completed by [47], and for the reference knowledge base (see [48] for knowledge bases general quality measures and [49] to evaluate the fitness of some knowledge bases for a given named entity linking task).
Geovisualisation
The prototype graphic user interface we put forward could be improved in several ways. The goal would be to efficiently provide the user with information about the quality of geocoding, and the context of results. First, the size of the point displayed to represent the result could be proportional to the estimated spatial precision. This would help to visually assess relevant information. Second, the result could be colour-coded to represent the temporal proximity with the input date. In a similar way, when multiple results are proposed, a time slider would be most useful to graphically distinguish result candidates from one another. Third, the background historical map displayed in the prototype is currently set. Yet, the most appropriate background map could be automatically displayed based on the input address dates provided by the user. Last, the current prototype becomes easily cluttered when displaying a large number of labels. Several strategies could be used, such as a better clustering of spatially close results, shorter labels, or better label placement.
5.2.3. Integrating User Correction into Historical Sources
In collaborative editing, edits come from untrusted sources. Validating edits and solving conflicts is a classic problem. In our prototypes, every user edit is potentially used by the geocoder (they are added to a dedicated gazetteer). We could use a voting scheme where edits are only taken into account when a sufficient number of users have made the same ones. However, we stress that due to the amount of data to edit (several hundred thousand building numbers), we prefer to rely on user benevolence, considering that a user who decides to spend the time to edit century-old historical data is committed to accurate editing.
5.2.4. Scalability
The main design choice of our geocoding architecture is to use a flat model for the address (an address is any set of characters), as opposed to current geocoders which are highly hierarchical (an address refers to a street, which refers to a neighbourhood, etc.). This modelling choice allows for the necessary freedom for incomplete historical data, but also comes with a trade-off regarding scaling capabilities. Indeed, for strongly hierarchical data, it is possible to have separate databases for each city, for instance, thus preventing one database from growing too much and ensuring a nice scaling capability.
However, this is not the case with our architecture. By using database indexes, we can theoretically guarantee a fast geocoding time for up to several million geohistorical objects used as sources. The main bottleneck in this case is not the temporal aspect (it relies on PostGIS geometry, which enables multiple theoretical solutions for scaling), but the textual aspects (i.e., the address string itself). To scale over several million addresses, specific architectures may be used to deal with the text search, for instance a distributed database (database sharing), in a way that resembles the current software Elastic Search. However, we stress that given the current available amount of historical sources, such a scaling problem should not be an issue for long.
6. Conclusions
This article tackles the historical geocoding problem. As shown throughout the article, the historical aspects bring major complications to the geocoding problem. The main difficulties come from the nature of historical data (uncertainty, fuzzy date, precision, sparseness), which prevents the use of current-address geocoding methods based on strong hierarchical modelling. Instead, we propose a historical geocoding system based on a sound geohistorical object model. This model is designed to cover the minimal features, and thanks to its genericity, modularity, and open source nature, can easily be extended to fit other historical sources. Geohistorical objects from several historical sources have been integrated into the database and coherently georeferenced and edited to form gazetteers. Geocoding an address at a given time is a matter of finding the best-matching geohistorical object in the gazetteers, if any. Our simple, coherent, historical geocoding system has been tested on several real-life datasets collected by historians, and can be easily used for other places/times/types of localisations. Diverse historical sources covering two centuries for the city of Paris were integrated into the geocoder. The proposed geocoder is able to localise a large percentage of addresses at a fast pace (about 200 ms per address). Finally, the article describes a prototype web-based user interface which demonstrates the interest of collaborative editing of address localisation, and helps historians and other digital humanities researchers use geocoding services.
Supplementary Materials
The code and additional documentation, its associated code repository and the code for the geocoder itself it available here: https://www.mdpi.com/2220-9964/7/7/262/s1.
Author Contributions
R.C. and B.D. designed the model and the computational framework and carried out the implementation. R.C., B.D., N.A. and J.P. wrote the manuscript with input from all authors.
Funding
Part of this work was funded by the Belle Epoque project - PSL (The Parisian Financiers’ Belle Epoque (1871-1913). Spaces, Organizations and Social Structures (BELLEPOQUE)).
Acknowledgments
Thanks to the Belle Epoque project and Angelo Riva and Thierry Géraud, the Institut Louis Bachelot for funding. Thanks to historians who contributed to creating the datasets, especially Benoit Costes for the edit of Alphand map. The authors thank the reviewers for their patient, in-depth reviews and suggestions. They led to very substantial and beneficial changes.
Conflicts of Interest
The authors declare no conflict of interest.
References
- Goldberg, D.W.; Wilson, J.P.; Knoblock, C.A. From Text to Geographic Coordinates: The Current State of Geocoding. J. Urban Reg. Inf. Syst. Assoc. 2007, 19, 33–46. [Google Scholar]
- St-Hilaire, M.; Moldofsky, B.; Richard, L.; Beaudry, M. Geocoding and Mapping Historical Census Data: The Geographical Component of the Canadian Century Research Infrastructure. Hist. Methods J. Quant. Interdiscip. Hist. 2007, 40, 76–91. [Google Scholar] [CrossRef]
- Daras, K.; Feng, Z.; Dibben, C. HAG-GIS: A spatial framework for geocoding historical addresses. In Proceedings of the 23rd GIS Research UK Conference, Leeds, UK, 15–17 April 2015. [Google Scholar]
- Hutchinson, M.J.; Veenendaal, B. An agent-based framework for intelligent geocoding. Appl. Geomat. 2013, 5, 33–44. [Google Scholar] [CrossRef]
- Roongpiboonsopit, D.; Karimi, H.A. Comparative Evaluation and Analysis of Online Geocoding Services. Int. J. Geogr. Inf. Sci. 2010, 24, 1081–1100. [Google Scholar] [CrossRef]
- Clough, P.; Tang, J.; Hall, M.M.; Warner, A. Linking archival data to location: A case study at the UK national archives. Aslib Proc. 2011, 63, 127–147. [Google Scholar] [CrossRef]
- Mostern, R.; Johnson, I. From named place to naming event: Creating gazetteers for history. Int. J. Geogr. Inf. Sci. 2008, 22, 1091–1108. [Google Scholar] [CrossRef]
- Southall, H.; Mostern, R.; Berman, M.L. On historical gazetteers. Int. J. Humanit. Arts Comput. 2011, 5. [Google Scholar] [CrossRef]
- Logan, J.R.; Jindrich, J.; Shin, H.; Zhang, W. Mapping America in 1880: The Urban Transition Historical GIS Project. Hist. Methods J. Quant. Interdiscip. Hist. 2011, 44, 49–60. [Google Scholar] [CrossRef] [PubMed] [Green Version]
- Lafreniere, D.; Gilliland, J. “All the World’s a Stage”: A GIS Framework for Recreating Personal Time-Space from Qualitative and Quantitative Sources: GIS Framework for Recreating Time-Space. Trans. GIS 2015, 19, 225–246. [Google Scholar] [CrossRef]
- De Runz, C. Imperfection, Temps et Espace: Modélisation, Analyse et Visualisation Dans un SIG Archéologique. Ph.D. Thesis, Université de Reims-Champagne Ardenne, Reims, France, 2008. [Google Scholar]
- Goodchild, M.F. Citizens as sensors: The world of volunteered geography. GeoJournal 2007, 69, 211–221. [Google Scholar] [CrossRef]
- Heipke, C. Crowdsourcing geospatial data. ISPRS J. Photogramm. Remote Sens. 2010, 65, 550–557. [Google Scholar] [CrossRef]
- Southall, H.; Aucott, P.; Fleet, C.; Pert, T.; Stoner, M. GB1900: Engaging the Public in Very Large Scale Gazetteer Construction from the Ordnance Survey “County Series” 1:10,560 Mapping of Great Britain. J. Map Geogr. Libr. 2017, 13, 7–28. [Google Scholar] [CrossRef]
- Vershbow, B. NYPL Labs: Hacking the Library. J. Libr. Adm. 2013, 53, 79–96. [Google Scholar] [CrossRef]
- Haklay, M. Citizen Science and Volunteered Geographic Information: Overview and Typology of Participation. In Crowdsourcing Geographic Knowledge: Volunteered Geographic Information (VGI) in Theory and Practice; Sui, D., Elwood, S., Goodchild, M., Eds.; Springer: Dordrecht, The Netherlands, 2013; pp. 105–122. [Google Scholar]
- Fomel, S.; Claerbout, J.F. Guest Editors’ Introduction: Reproducible Research. Comput. Sci. Eng. 2009, 11, 5–7. [Google Scholar] [CrossRef]
- Aruliah, D.A.; Brown, C.T.; Hong, N.P.C.; Davis, M.; Guy, R.T.; Haddock, S.H.D.; Huff, K.; Mitchell, I.; Plumbley, M.D.; Waugh, B.; et al. Best Practices for Scientific Computing. arXiv 2012, arXiv:1210.0530. [Google Scholar]
- Wilson, G.; Bryan, J.; Cranston, K.; Kitzes, J.; Nederbragt, L.; Teal, T.K. Good Enough Practices in Scientific Computing. arXiv 2016, arXiv:cs.SE/1609.00037. [Google Scholar] [CrossRef] [PubMed]
- Marwick, B. Computational Reproducibility in Archaeological Research: Basic Principles and a Case Study of Their Implementation. J. Archaeol. Method Theory 2016, 1–27. [Google Scholar] [CrossRef]
- Armstrong, M.P. Temporality in Spatial Databases. In Proceedings of the GIS/LIS’88, San Francisco, CA, USA, 30 November–2 December 1988; pp. 880–889. [Google Scholar]
- Duménieu, B.; Abadie, N.; Perret, J. Assessing the planimetric accuracy of Paris atlases from the late 18th and 19th centuries. In SAC 2018, KEGeoD–Knowledge Extraction from Geographical Data; ACM Press: New York, NY, USA, 2018. [Google Scholar]
- Herrault, P.A.; Sheeren, D.; Fauvel, M.; Monteil, C.; Paegelow, M. A Comparative Study of Geometric Transformation Models for the Historical “Map of France” Registration. Geographia Technica 2013. p. 34. Available online: https://hal.archives-ouvertes.fr/hal-01416127/document (accessed on 10 May 2018).
- Fabbri, R.; Kimia, B. 3D curve sketch: Flexible curve-based stereo reconstruction and calibration. In Proceedings of the 2010 IEEE Conference on Computer Vision and Pattern Recognition (CVPR), San Francisco, CA, USA, 13–18 June 2010; pp. 1538–1545. [Google Scholar]
- Cléri, I.; Pierrot-Deseilligny, M.; Vallet, B. Automatic Georeferencing of a Heritage of old analog aerial Photographs. ISPRS Ann. Photogramm. Remote Sens. Spat. Inf. Sci. 2014, 2, 33. [Google Scholar] [CrossRef]
- Bitelli, G.; Cremonini, S.; Gatta, G. Ancient map comparisons and georeferencing techniques: A case study from the Po River Delta (Italy). E-Perimetron 2009, 4, 221–228. [Google Scholar]
- Boutoura, C.; Livieratos, E. Some fundamentals for the study of the geometry of early maps by comparative methods. E-Perimetron 2006, 1, 60–70. [Google Scholar]
- De Runz, C.; Desjardin, E.; Piantoni, F.; Herbin, M. Anteriority index for managing fuzzy dates in archæological GIS. Soft Comput. 2010, 14, 339. [Google Scholar] [CrossRef]
- Kauppinen, T.; Mantegari, G.; Paakkarinen, P.; Kuittinen, H.; Hyvönen, E.; Bandini, S. Determining relevance of imprecise temporal intervals for cultural heritage information retrieval. Int. J. Hum. Comput. Stud. 2010, 68, 549–560. [Google Scholar] [CrossRef]
- Duménieu, B. Un Système D’information Géographique Pour Le Suivi d’objets Historiques Urbains à Travers L’espace et Le Temps. Ph.D. Thesis, Ecole Des Hautes Etudes en Sciences Sociales, Paris, France, 2015. [Google Scholar]
- Massey, C.G. Playing with matches: An assessment of accuracy in linked historical data. Hist. Methods J. Quant. Interdiscip. Hist. 2017, 50, 129–143. [Google Scholar] [CrossRef]
- Perret, J.; Gribaudi, M.; Barthelemy, M. Roads and cities of 18th century France. Sci. Data 2015, 2. [Google Scholar] [CrossRef] [PubMed]
- Noizet, H.; Bove, B.; Costa, L. Paris de Parcelles En Pixels; Presses Universitaires de Vincennes: Vincennes, France, 2013. [Google Scholar]
- Dhanani, A. Suburban built form and street network development in London, 1880–2013: An application of quantitative historical methods. Hist. Methods J. Quant. Interdiscip. Hist. 2016, 49, 230–243. [Google Scholar] [CrossRef] [Green Version]
- Carrion, D.; Migliaccio, F.; Minini, G.; Zambrano, C. From historical documents to GIS: A spatial database for medieval fiscal data in Southern Italy. Hist. Methods J. Quant. Interdiscip. Hist. 2016, 49, 1–10. [Google Scholar] [CrossRef]
- Gribaudi, M.; Magaud, J. L’action Publique et Ses Administrateurs Dans Les Domaines Sanitaires et Social en France, 1800 à 1900. 1999. Available online: https://journals.openedition.org/histoiremesure/777?lang=en (accessed on on 10 May 2018).
- Lazzara, G.; Levillain, R.; Géraud, T.; Jacquelet, Y.; Marquegnies, J.; Crépin-Leblond, A. The SCRIBO Module of the Olena Platform: A Free Software Framework for Document Image Analysis. In Proceedings of the 11th International Conference on Document Analysis and Recognition (ICDAR), Beijing, China, 16–17 September 2011; pp. 252–258. [Google Scholar] [CrossRef]
- Plumejeaud-Perreau, C.; Grosso, E.; Parent, B. Dissemination and Geovisualization of Territorial Entities History. J. Spat. Inf. Sci. 2014, 8, 73–93. [Google Scholar] [CrossRef]
- Shen, W.; Wang, J.; Han, J. Entity linking with a knowledge base: Issues, techniques, and solutions. IEEE Trans. Knowl. Data Eng. 2015, 27, 443–460. [Google Scholar] [CrossRef]
- Overell, S. The problem of place name ambiguity. SIGSPATIAL Spec. 2011, 3, 12–15. [Google Scholar] [CrossRef]
- Mihalcea, R.; Csomai, A. Wikify!: Linking Documents to Encyclopedic Knowledge. In Proceedings of the Sixteenth CIKM ’07 ACM Conference on Conference on Information and Knowledge Management, Lisbon, Portugal, 6–10 November 2007; ACM: New York, NY, USA, 2007; pp. 233–242. [Google Scholar] [CrossRef]
- Hachey, B.; Radford, W.; Nothman, J.; Honnibal, M.; Curran, J.R. Evaluating Entity Linking with Wikipedia. Artif. Intell. 2013, 194, 130–150. [Google Scholar] [CrossRef]
- Zhang, W.; Gelernter, J. Geocoding location expressions in Twitter messages: A preference learning method. J. Spat. Inf.Sci. 2014, 2014, 37–70. [Google Scholar]
- Costes, B. Vers la Construction D’un référentiel géographique Ancien. Un modèle de Graphe Agrégé Pour intégrer, Qualifier et Analyser des Réseaux Géohistoriques. Ph.D. Thesis, Université Paris-Est, Champs-sur-Marne, France, 2016. [Google Scholar]
- Costes, B.; Perret, J.; Bucher, B.; Gribaudi, M. An aggregated graph to qualify historical spatial networks using temporal patterns detection. In Proceedings of the 18th AGILE International Conference on Geographic Information Science, New York, NY, USA, 14–17 May 2015. [Google Scholar]
- Zimmerman, D.L.; Fang, X.; Mazumdar, S.; Rushton, G. Modeling the Probability Distribution of Positional Errors Incurred by Residential Address Geocoding. Int. J. Health Geogr. 2007, 6, 1. [Google Scholar] [CrossRef] [PubMed]
- Brando, C.; Frontini, F.; Ganascia, J. REDEN: Named Entity Linking in Digital Literary Editions Using Linked Data Sets. CSIMQ 2016, 7, 60–80. [Google Scholar] [CrossRef]
- Zaveri, A.; Rula, A.; Maurino, A.; Pietrobon, R.; Lehmann, J.; Auer, S. Quality assessment for linked data: A survey. Semant. Web 2016, 7, 63–93. [Google Scholar] [CrossRef]
- Brando, C.; Abadie, N.; Frontini, F. Linked Data Quality for Domain Specific Named Entity Linking. In Proceedings of the 1st Atelier Qualité des Données du Web, 16ème Conférence Internationale Francophone sur l’Extraction et la Gestion de Connaissances, Reims, France, 18–22 January 2016. [Google Scholar]
Figure 1.
In this example, handwritten text is automatically detected and extracted (red) from a historical map using various image processing methods. Note that some building numbers are not extracted.
Figure 1.
In this example, handwritten text is automatically detected and extracted (red) from a historical map using various image processing methods. Note that some building numbers are not extracted.

Figure 2.
Gazetteers of geohistorical objects are created based on information extracted from georeferenced historical maps. Geocoding a historical address means finding the best-matching object in these gazetteers, based on a customised function (semantic, temporal aspect, spatial precision, etc.). Results can be displayed through a dedicated web interface for collaborative editing.

Figure 3.
The geohistorical object model, where each object is characterized by its historical source (e.g., the historical map in which the object was described) and a numerical origin process, which is the process through which the object was digitized. Aside from source and origin processes, an object is also described by a fuzzy date, a text, and a geometry.

Figure 4.
An uncertain valid time modelled as a trapezoidal fuzzy set function.

Figure 5.
The table inheritance mechanism: a child table inheriting from a parent table inherits all the parent columns, and can also have its own. However, the parent table also virtually contains all the content of the child tables.
Figure 5.
The table inheritance mechanism: a child table inheriting from a parent table inherits all the parent columns, and can also have its own. However, the parent table also virtually contains all the content of the child tables.

Figure 6.
Geocoding table architecture. Two tables of geohistorical_object are the support for geocoding queries. Because all extracted geohistorical object tables inherit from these two tables, they both virtually contain all the objects.
Figure 6.
Geocoding table architecture. Two tables of geohistorical_object are the support for geocoding queries. Because all extracted geohistorical object tables inherit from these two tables, they both virtually contain all the objects.

Figure 7.
Conceptual architecture for interactive display and edit of geocoding results. The stack contains only standard components. The use of WFS-T and REST standard protocols makes the change or customisation of some components easier.
Figure 7.
Conceptual architecture for interactive display and edit of geocoding results. The stack contains only standard components. The use of WFS-T and REST standard protocols makes the change or customisation of some components easier.

Figure 8.
Collaborative display and edit is achieved through a mix of standards (REST , WFS-T) and custom solutions (triggers) that enable the sharing of a basic public/private key.
Figure 8.
Collaborative display and edit is achieved through a mix of standards (REST , WFS-T) and custom solutions (triggers) that enable the sharing of a basic public/private key.

Figure 9.
Various Web user interfaces (UIs) that can be used to access the proposed historical geocoding tool. CSV: comma-separated values.
Figure 9.
Various Web user interfaces (UIs) that can be used to access the proposed historical geocoding tool. CSV: comma-separated values.

Figure 10.
An overview of some of the geohistorical objects used for geocoding. These were mostly extracted manually, often collaboratively, using various tools.
Figure 10.
An overview of some of the geohistorical objects used for geocoding. These were mostly extracted manually, often collaboratively, using various tools.

Figure 11.
Samples of the georeferenced Alphand Atlas (2nd row) and Jacoubet Atlas (1st row) at different scales: (a) district and (b) urban islet. Column (c) shows how buildings are portrayed in the maps.
Figure 11.
Samples of the georeferenced Alphand Atlas (2nd row) and Jacoubet Atlas (1st row) at different scales: (a) district and (b) urban islet. Column (c) shows how buildings are portrayed in the maps.

Figure 12.
Illustrations of all the historical textual address data sets that were geocoded. Result size is proportional to spatial precision.
Figure 12.
Illustrations of all the historical textual address data sets that were geocoded. Result size is proportional to spatial precision.

Figure 13.
A textual address data set was geocoded, then manually corrected by a historian. We plotted the segment between the geocoded addresses and the corrected addresses, and analysed the results based on the magnitude of the spatial error.
Figure 13.
A textual address data set was geocoded, then manually corrected by a historian. We plotted the segment between the geocoded addresses and the corrected addresses, and analysed the results based on the magnitude of the spatial error.

Figure 14.
Two use cases. In the first use case, an expert geocodes an address and analyses the top three results to assess the reliability of the result. In the second use case, a user batch geocodes 30 addresses (one result per address) in Paris and checks/edits the results.
Figure 14.
Two use cases. In the first use case, an expert geocodes an address and analyses the top three results to assess the reliability of the result. In the second use case, a user batch geocodes 30 addresses (one result per address) in Paris and checks/edits the results.


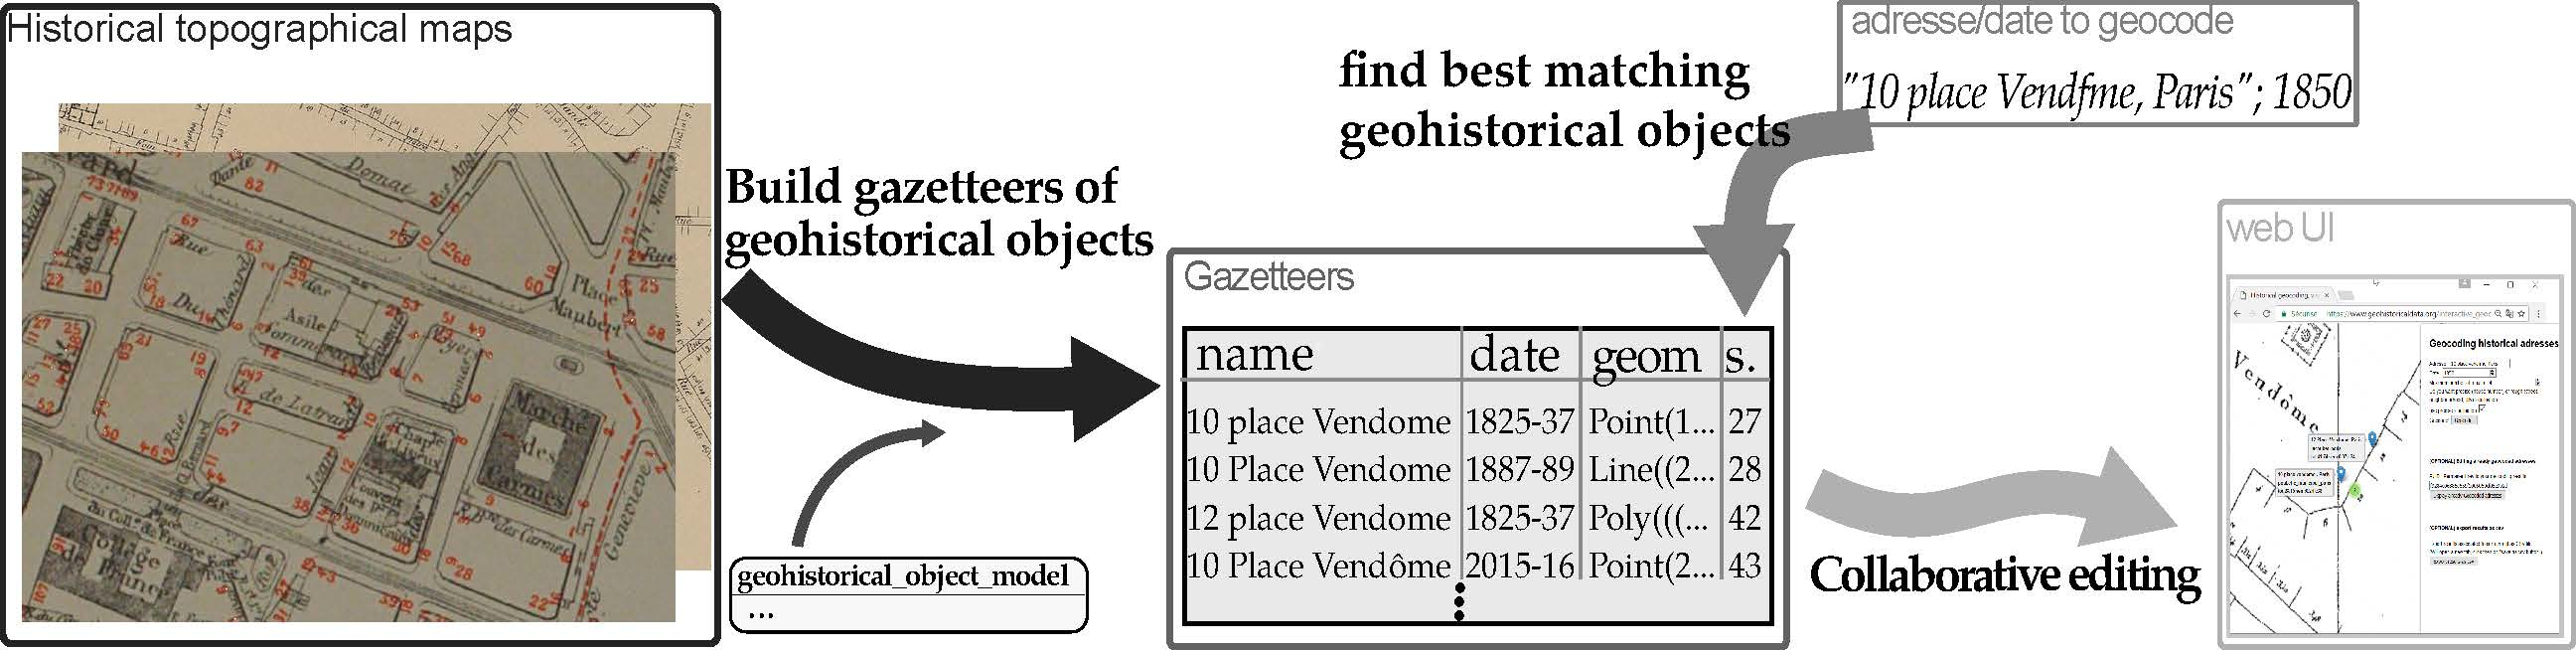
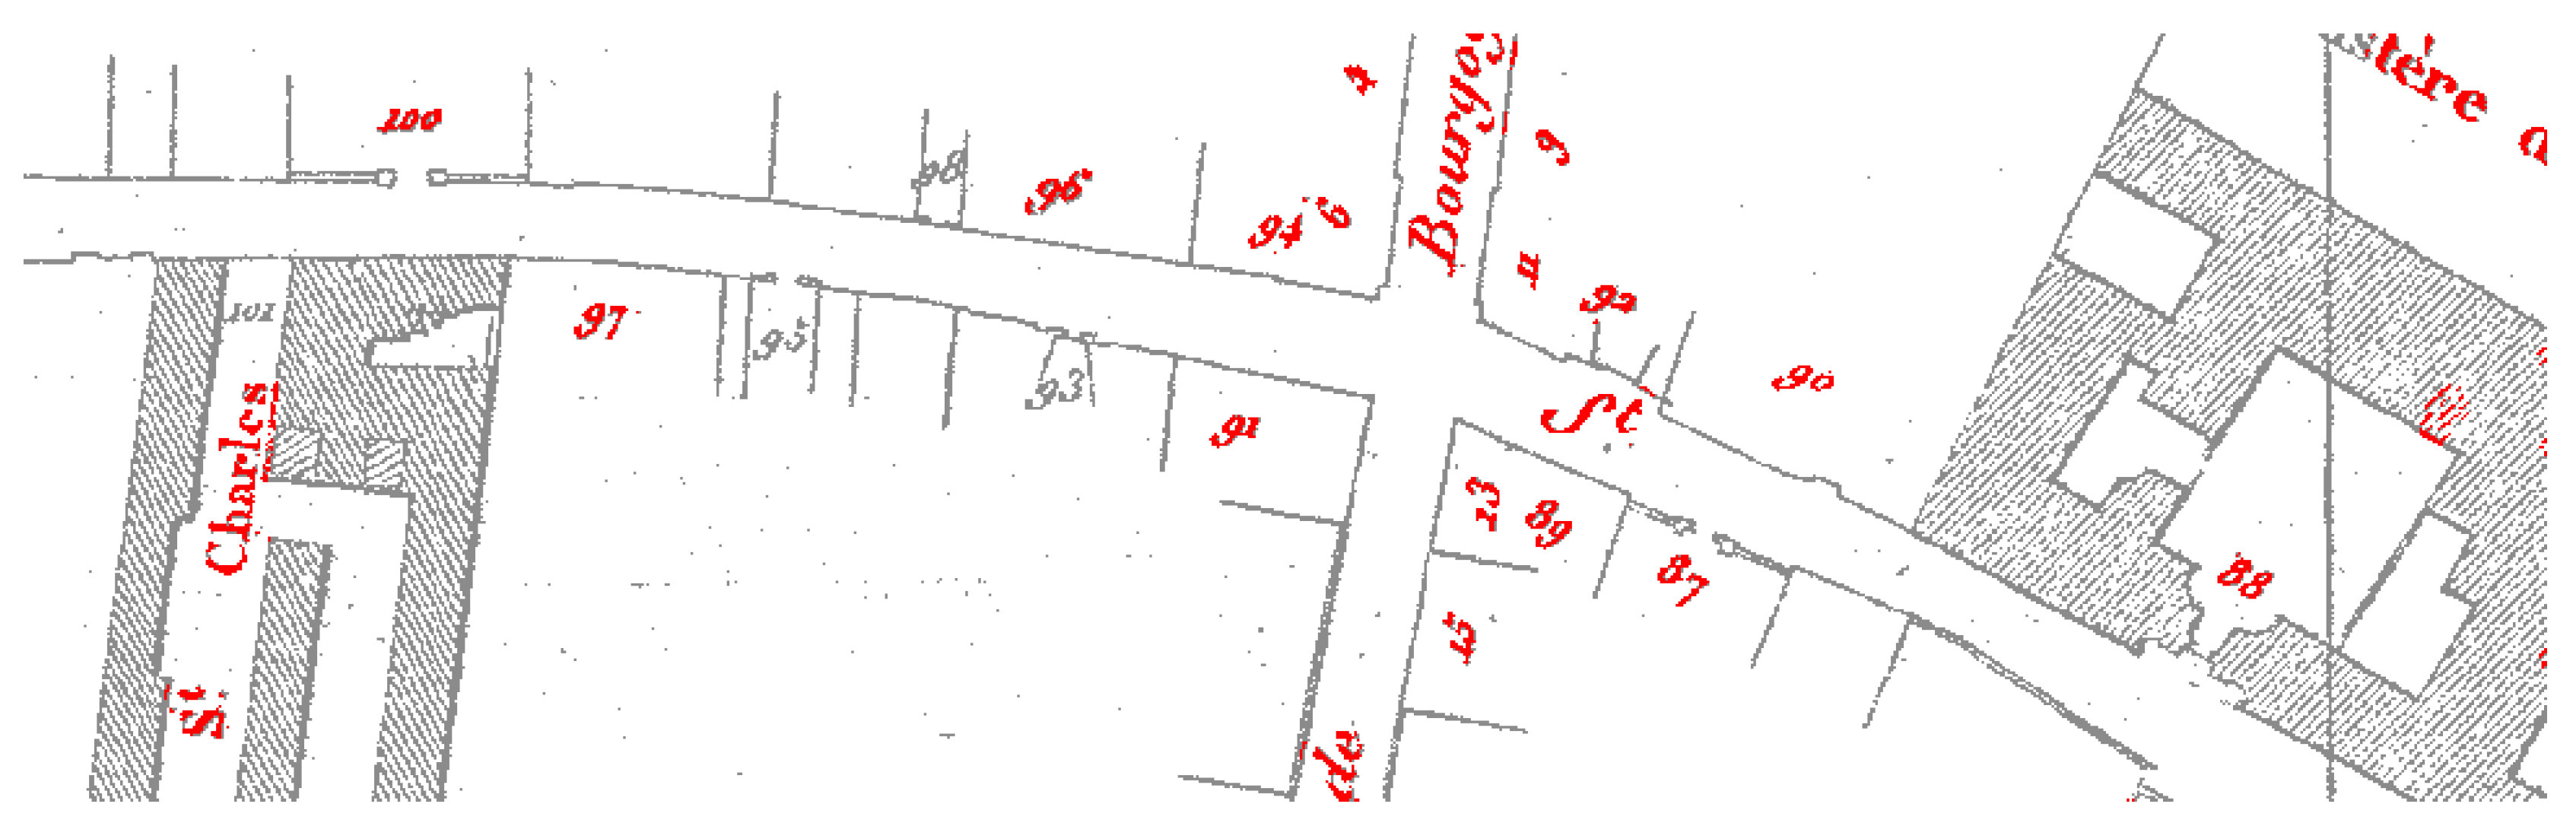
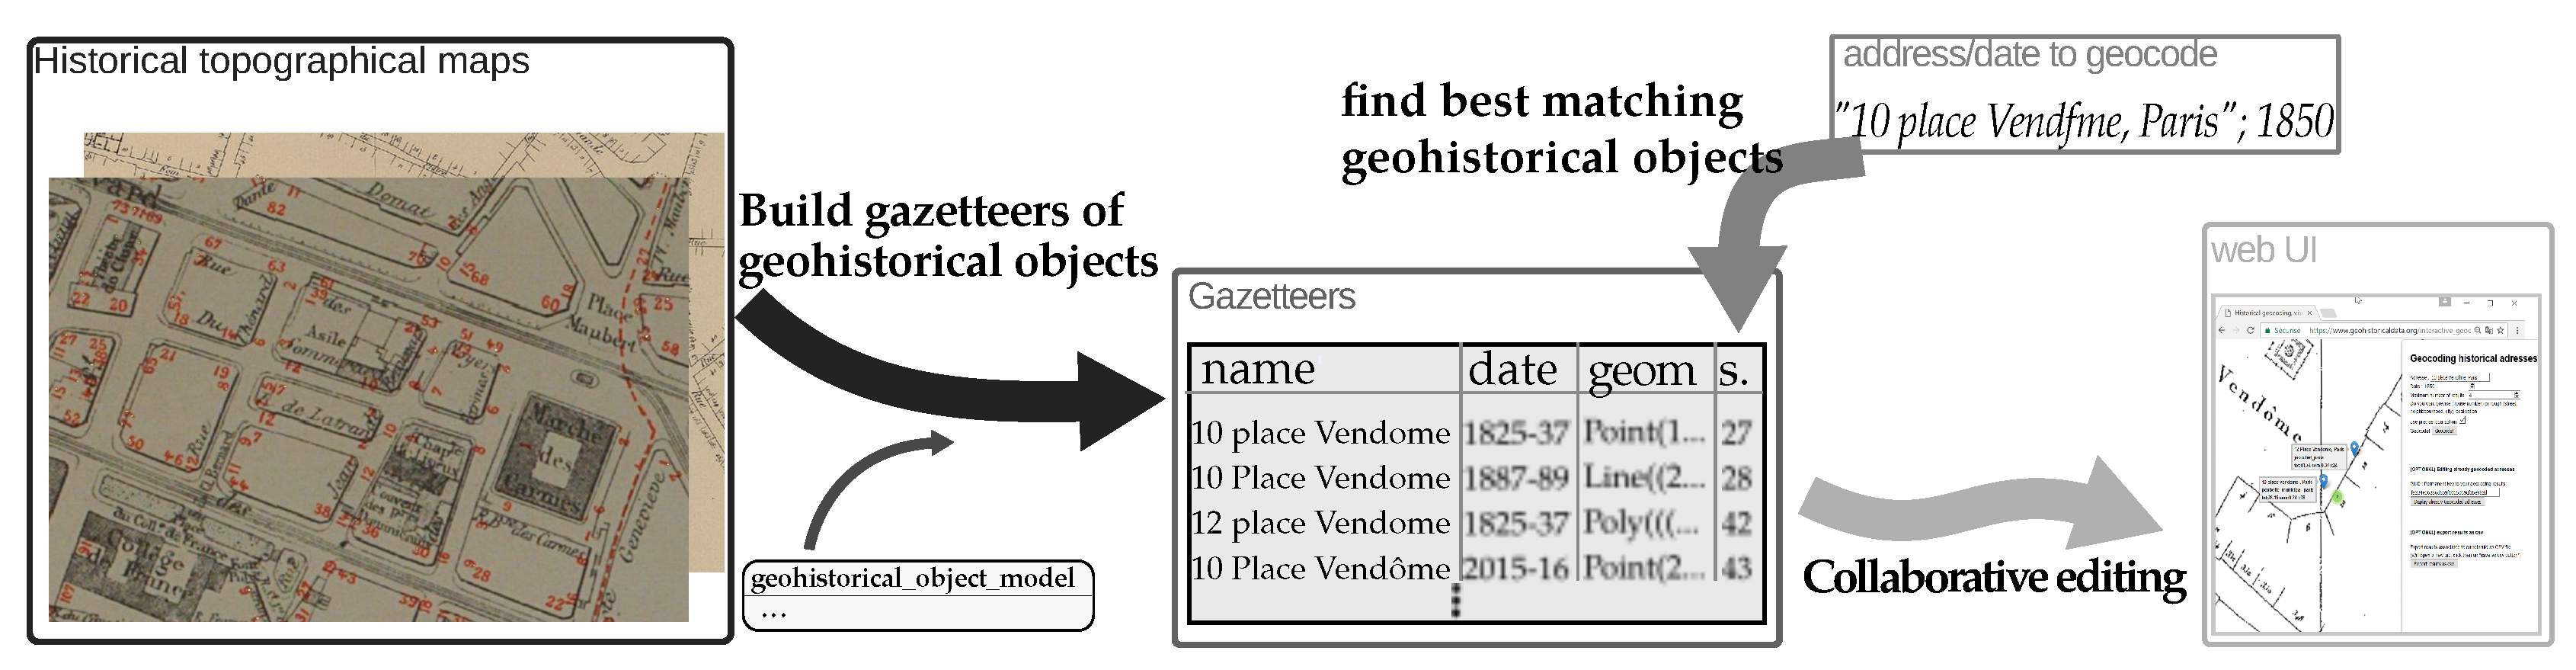
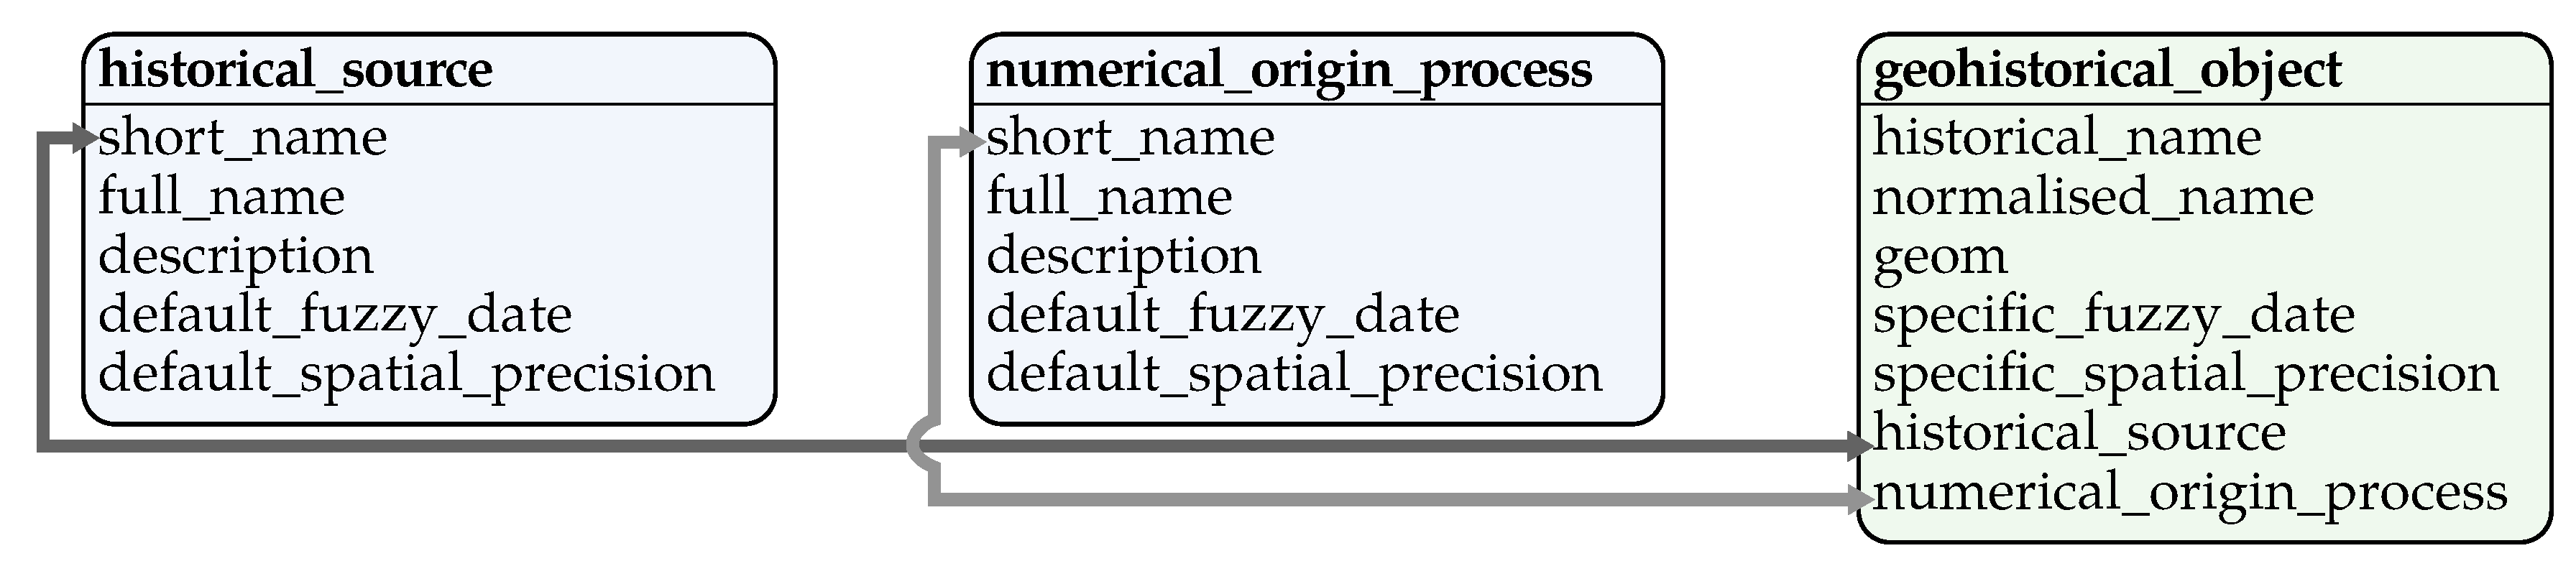
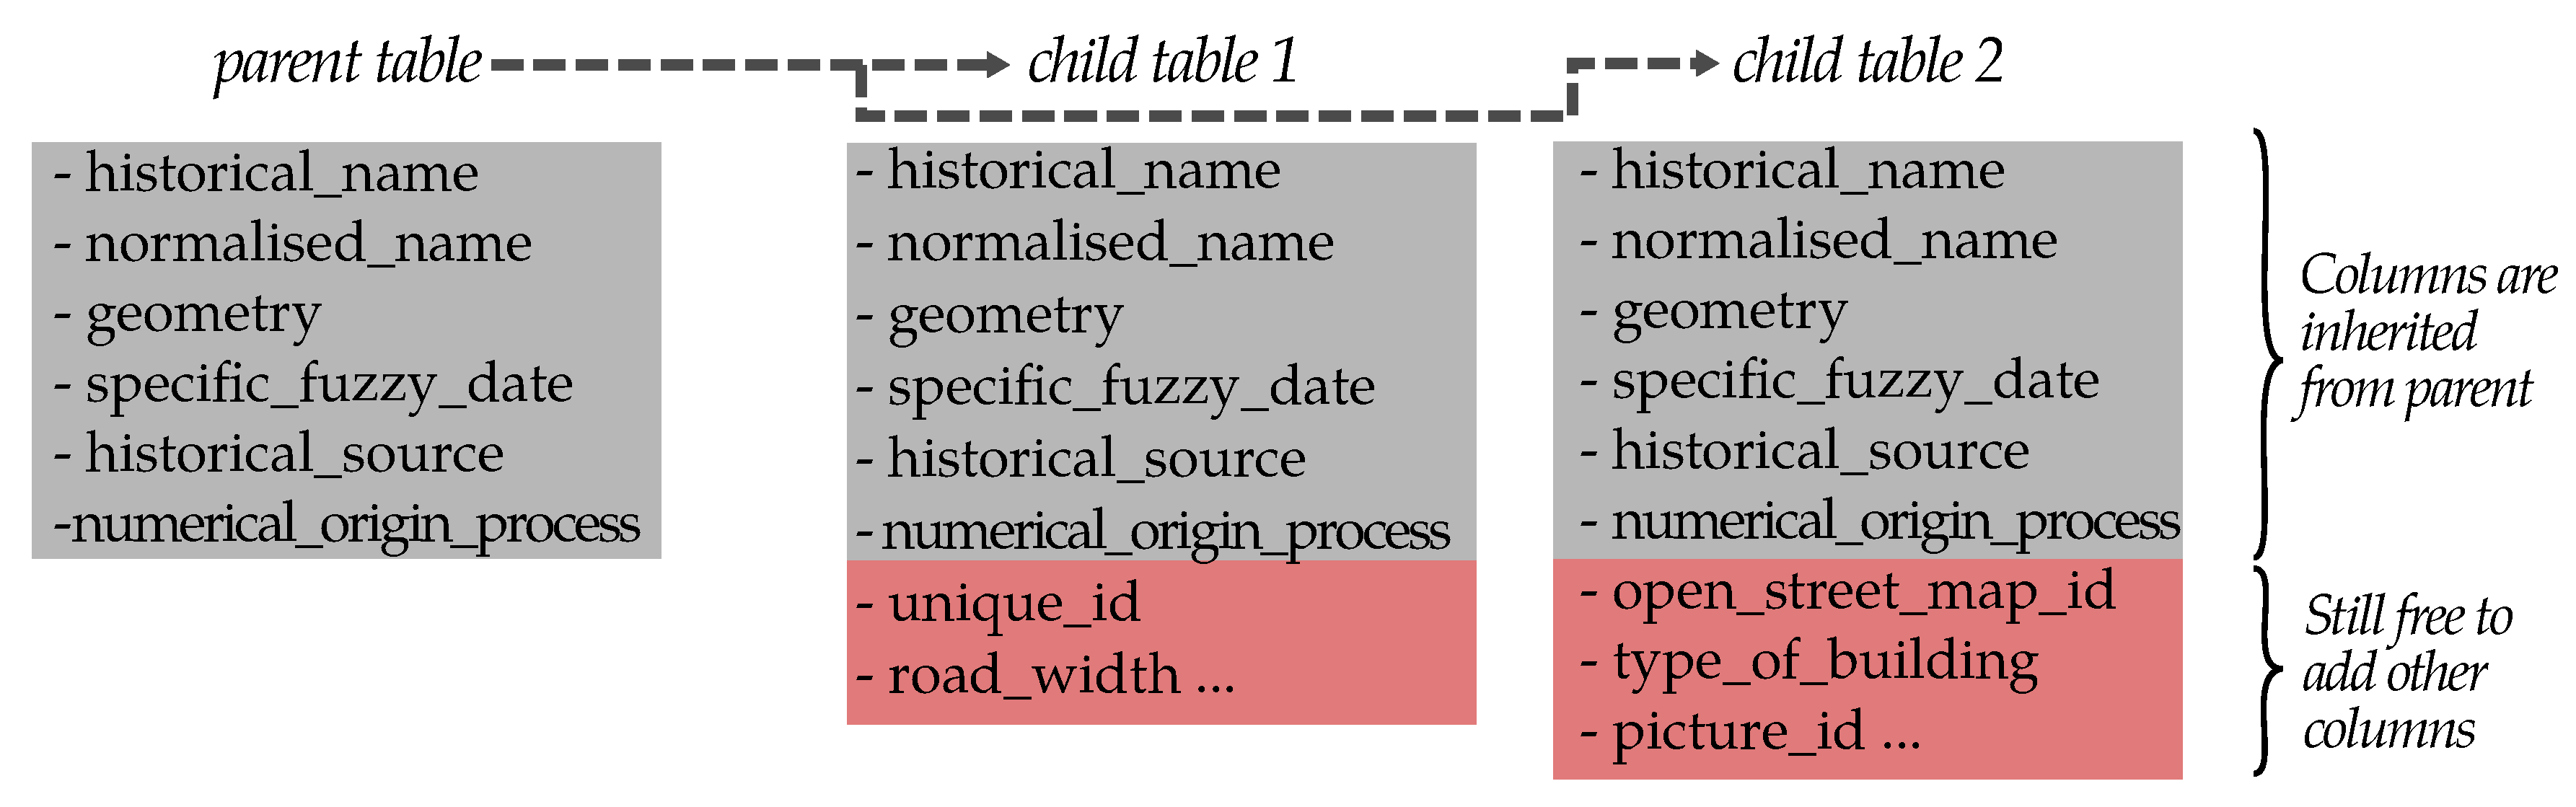
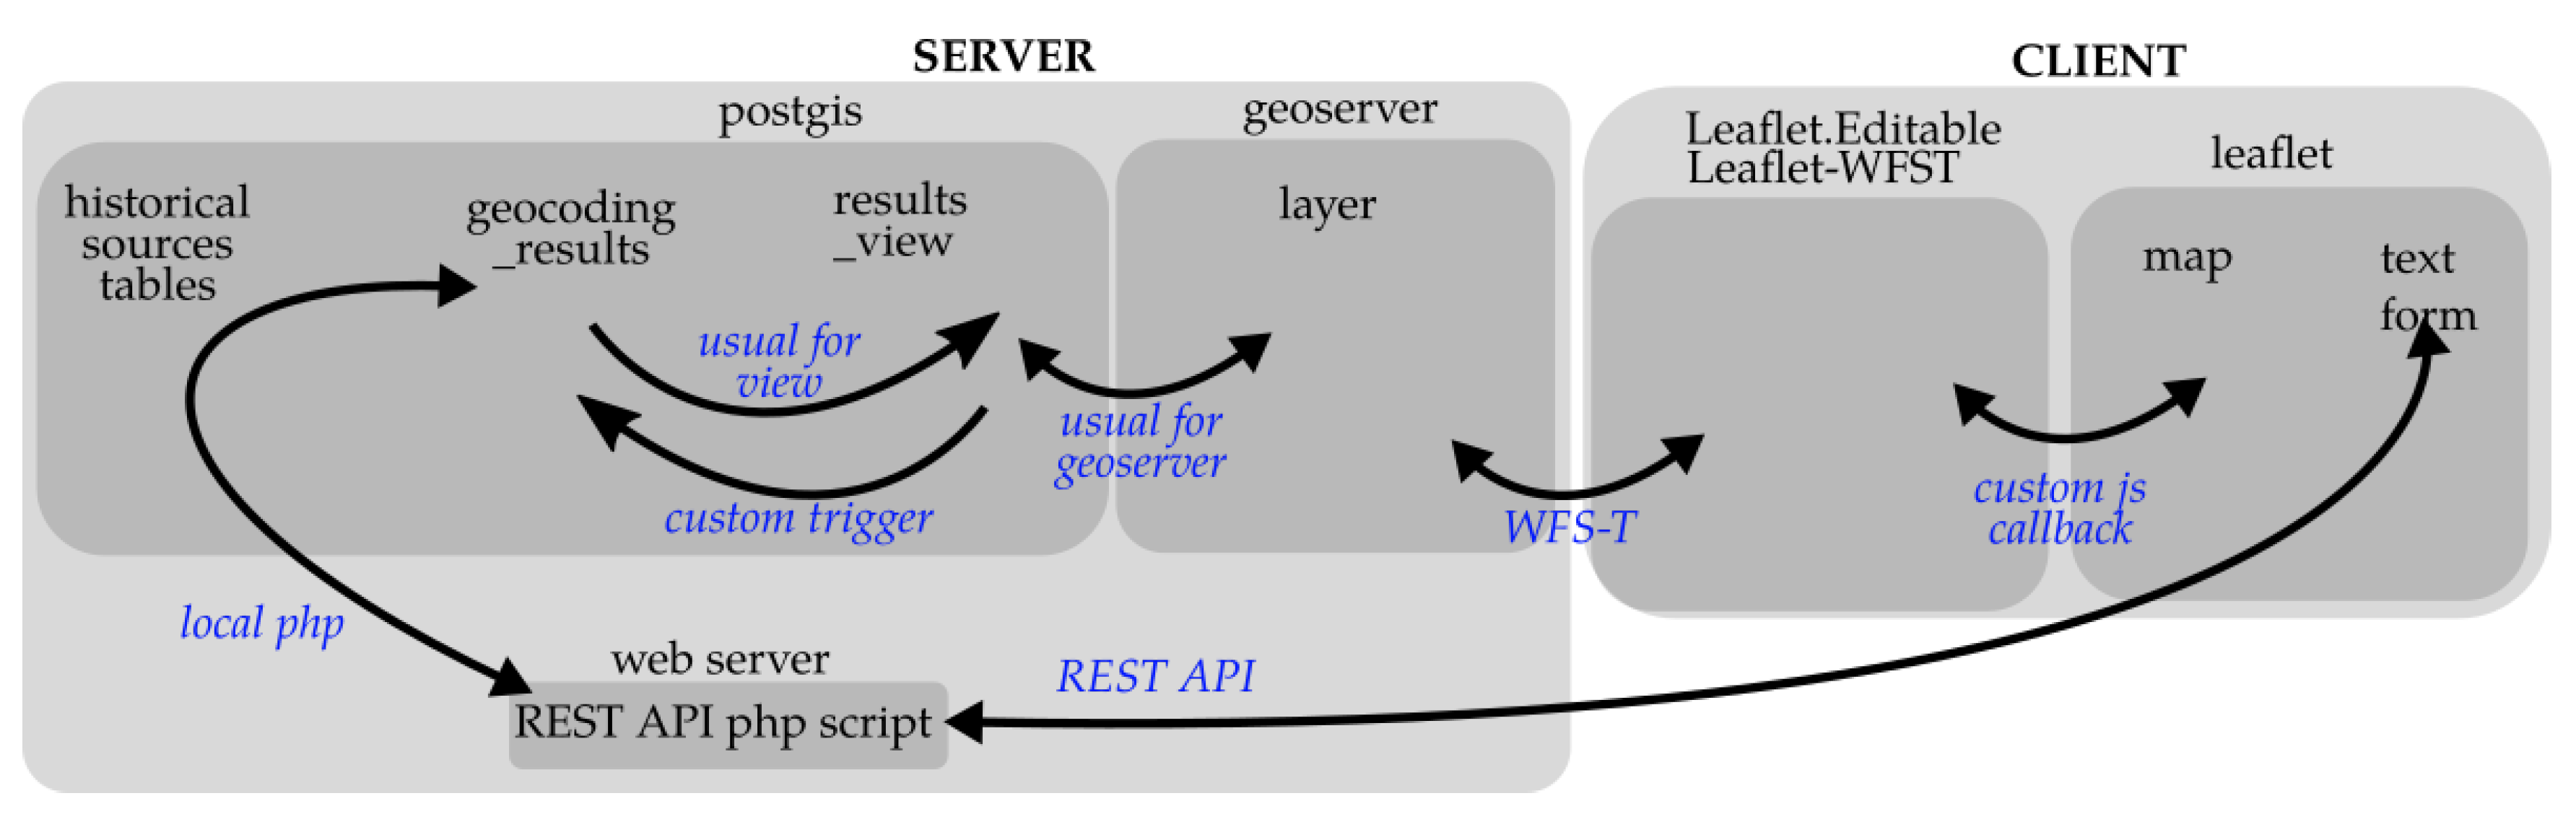
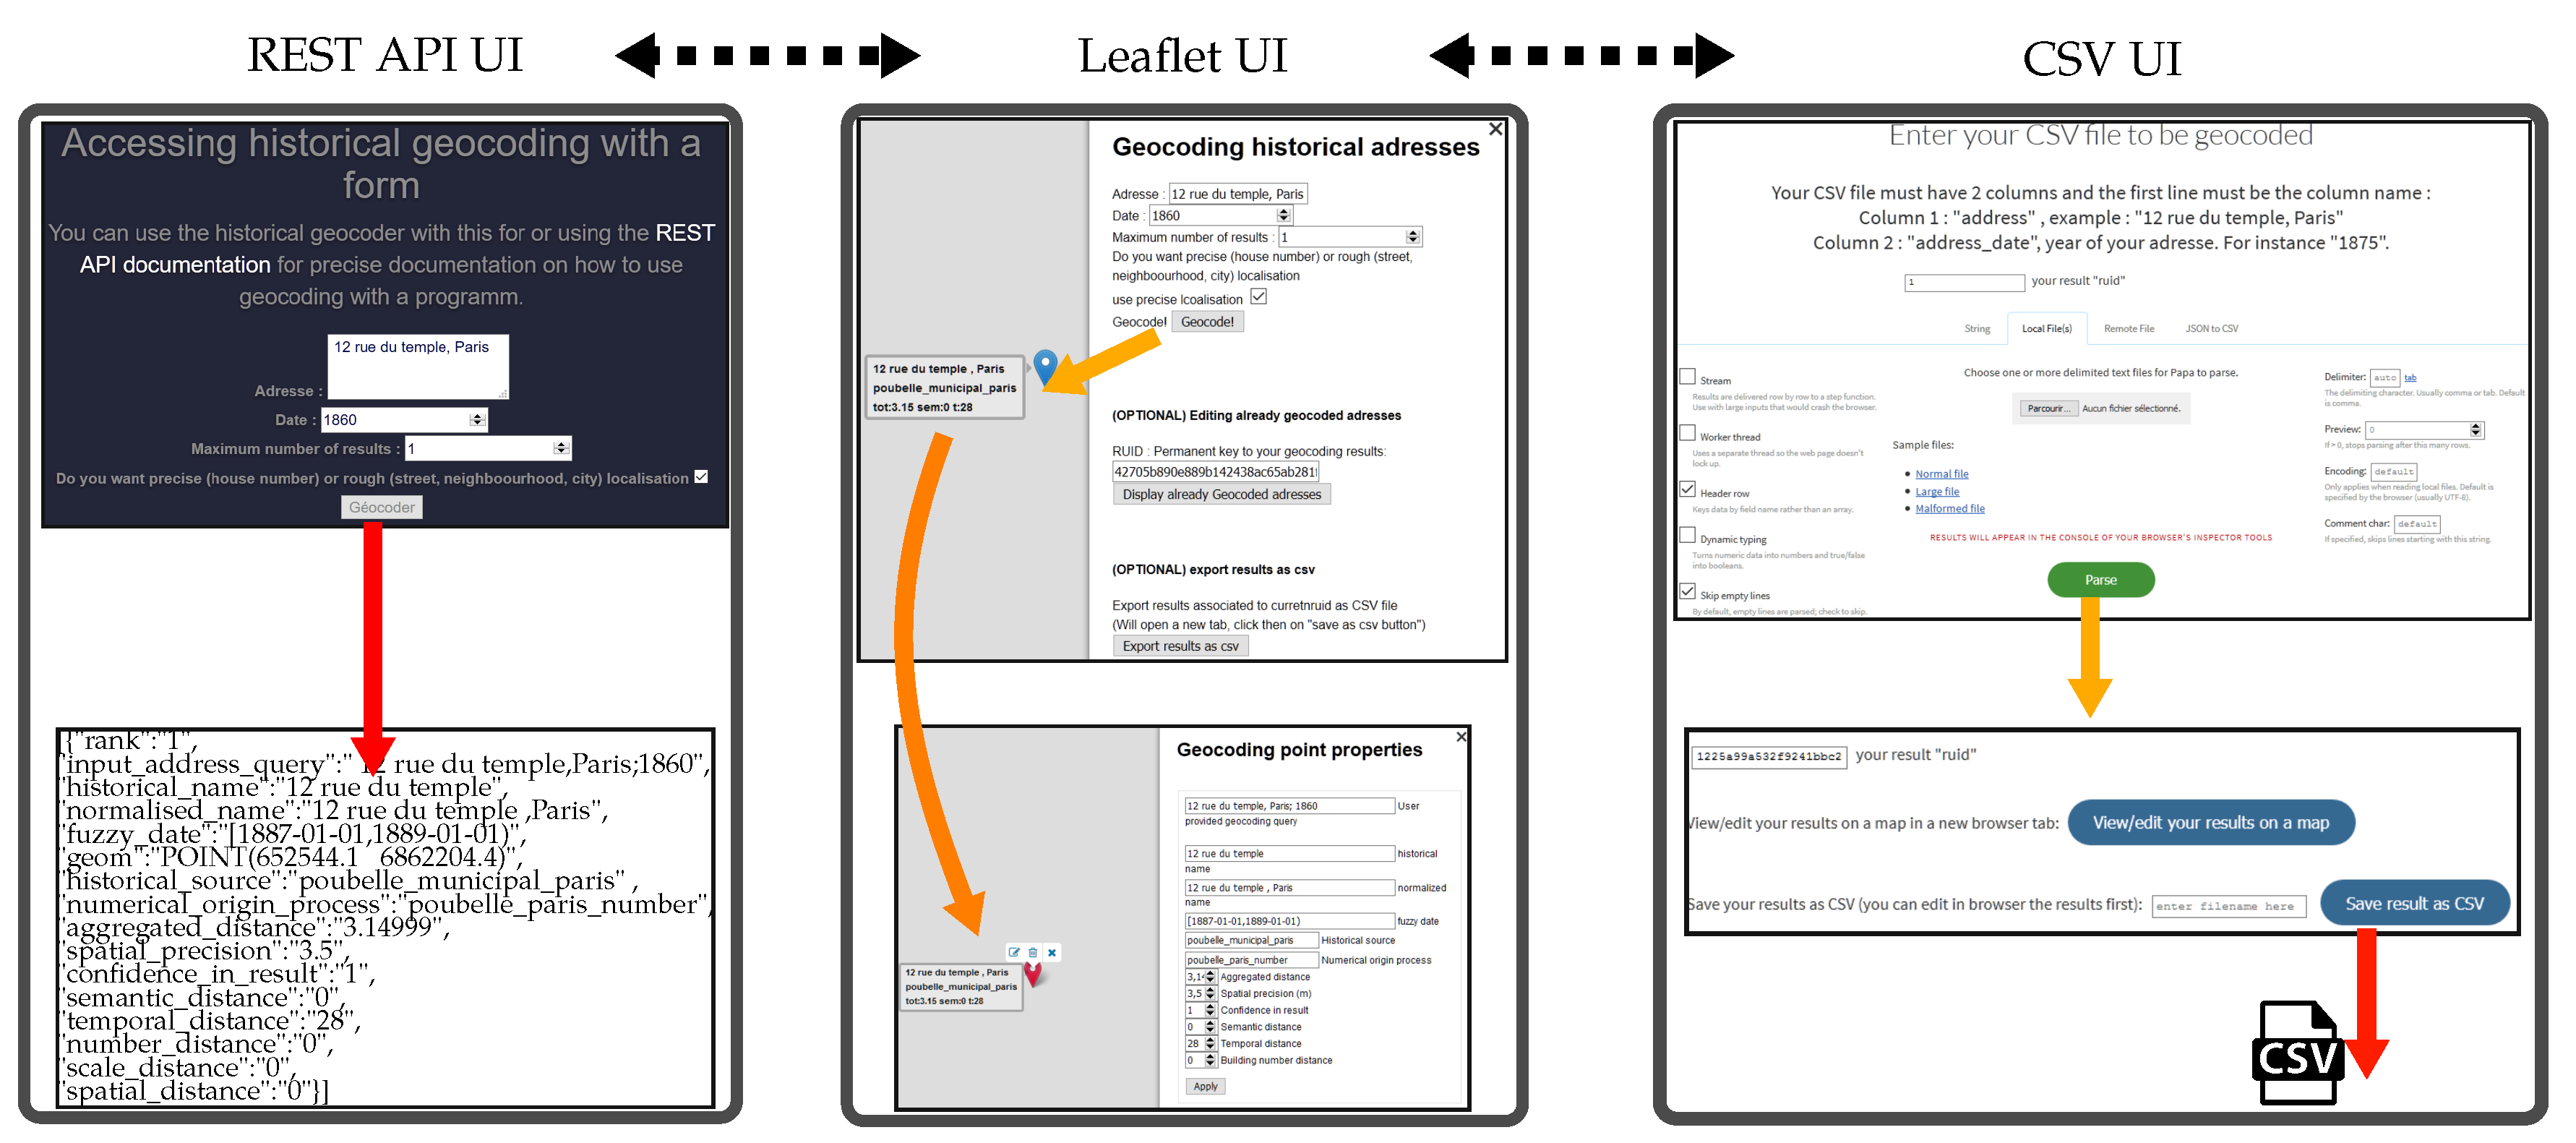
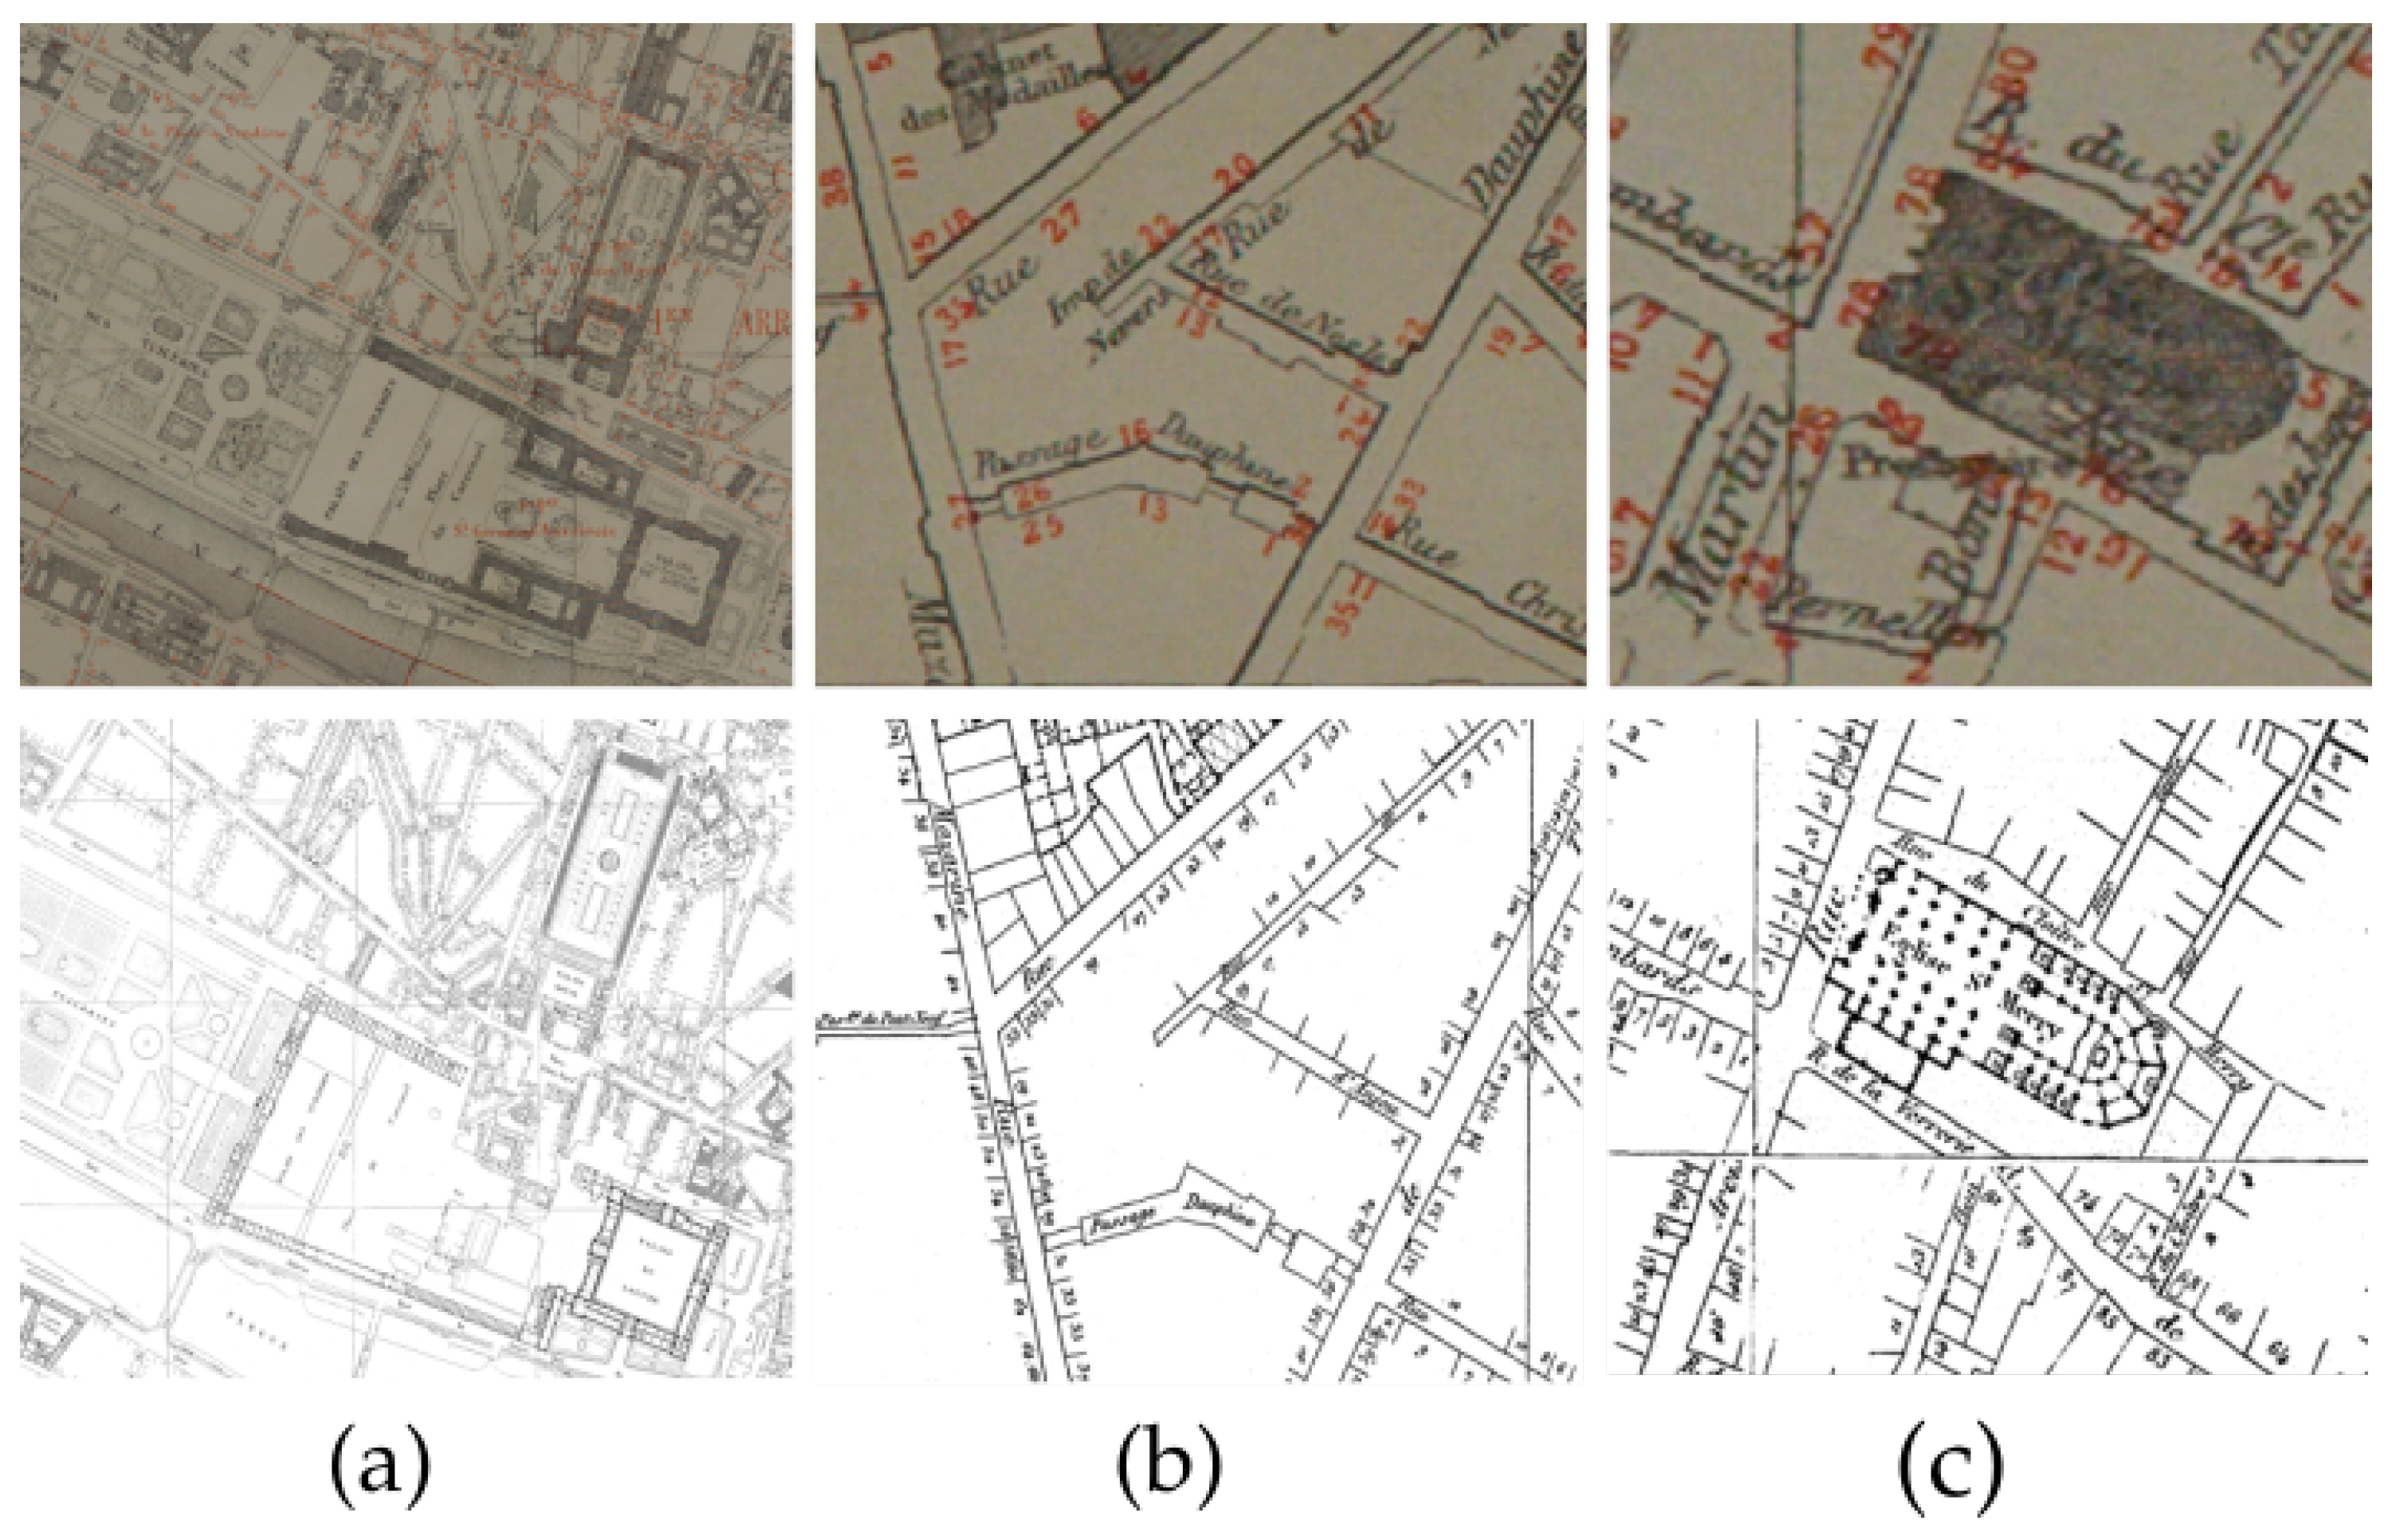
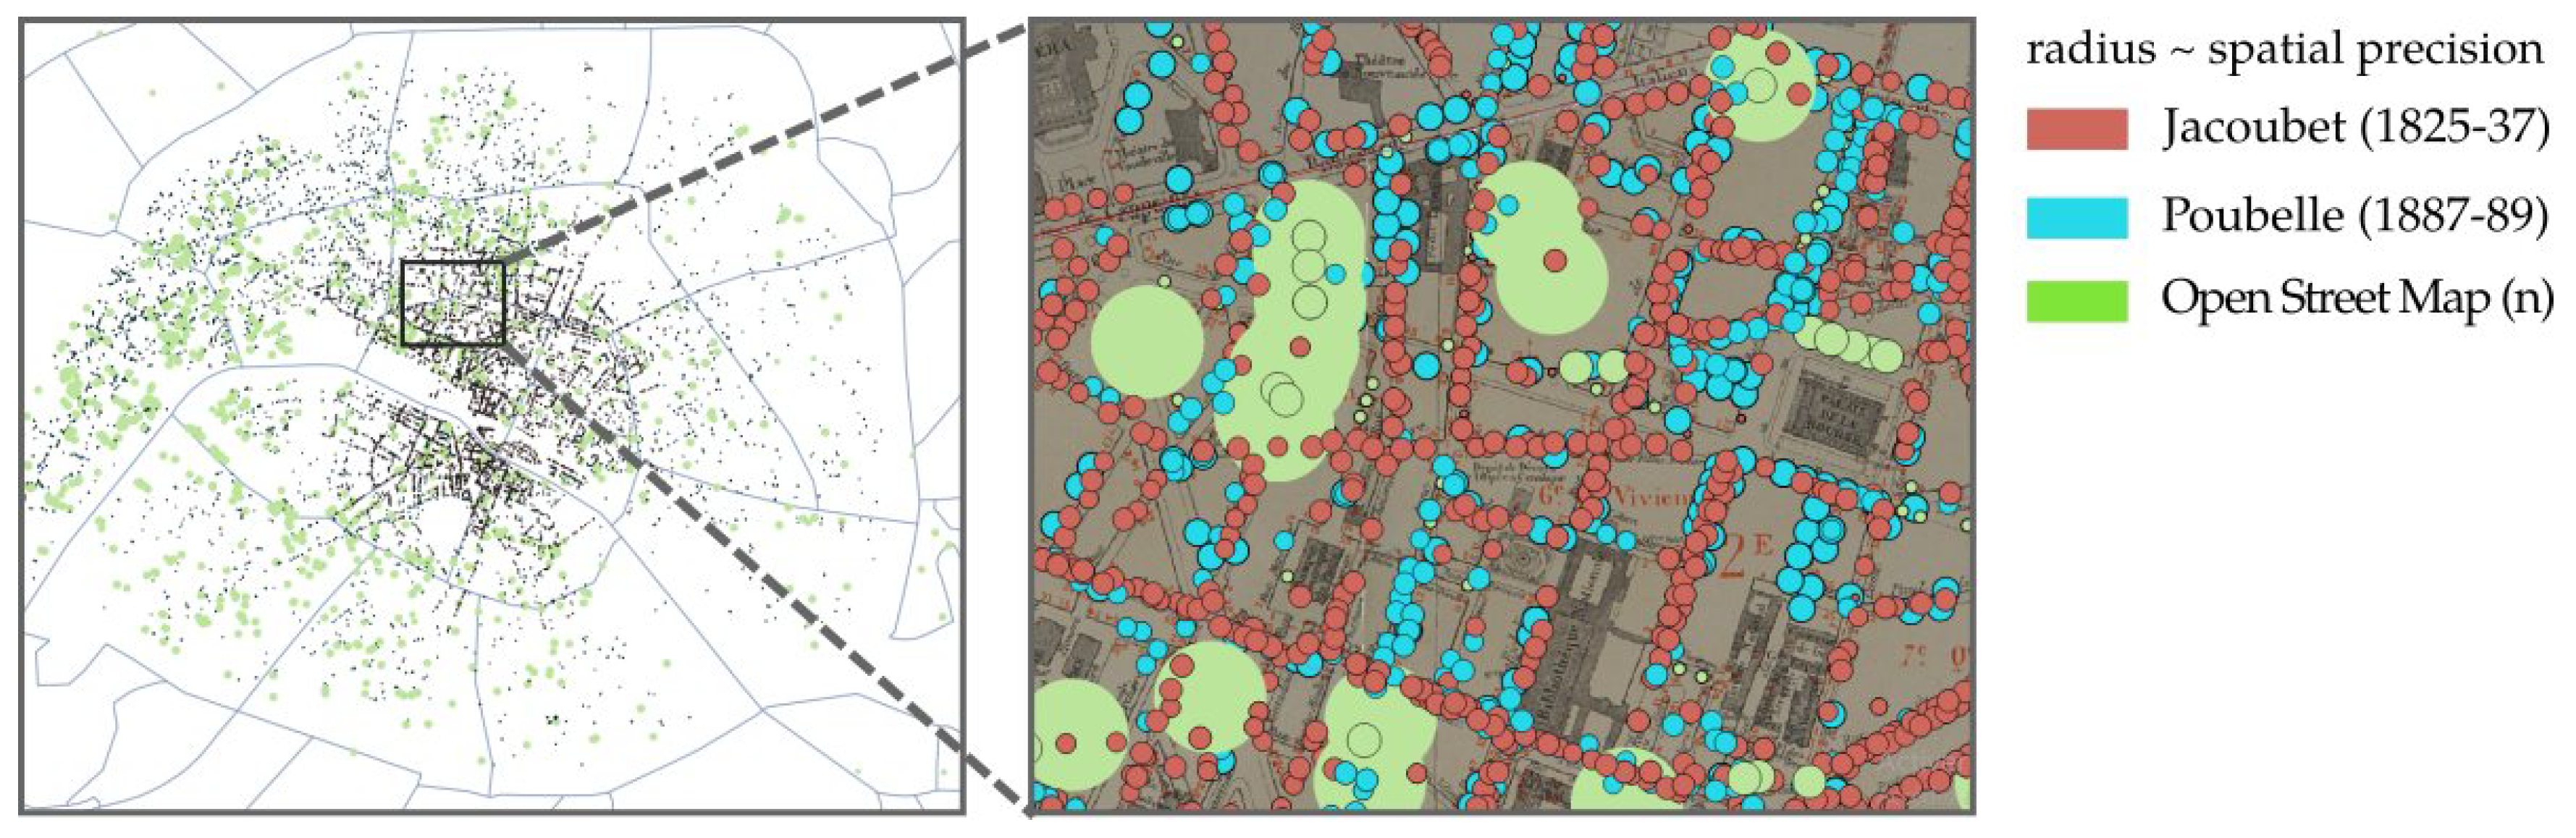
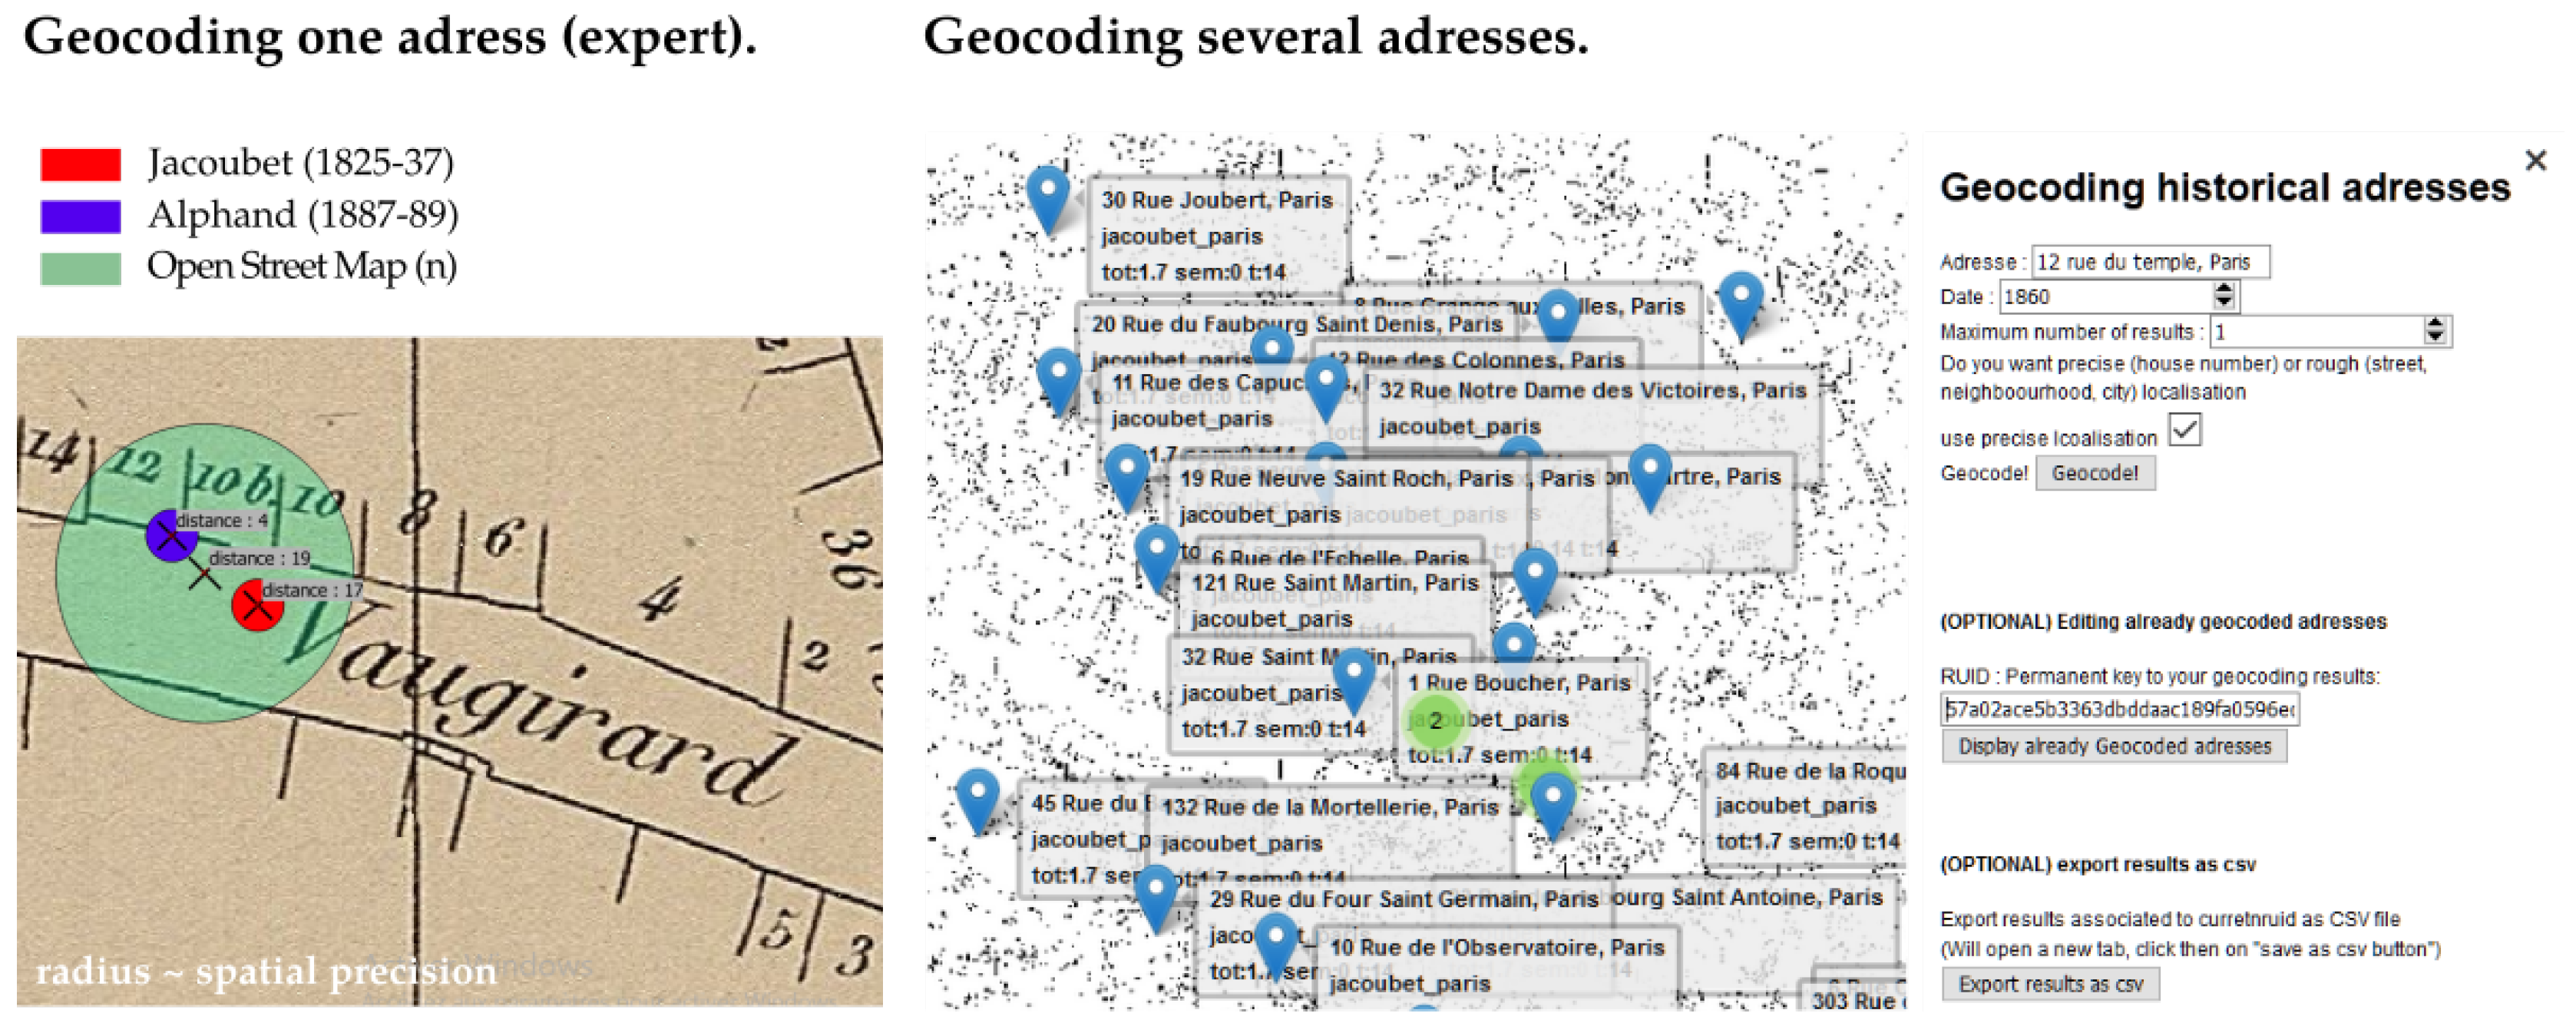
Table 1.
For all textual address historical data sets, how many addresses were geocoded and how long it took.
Table 1.
For all textual address historical data sets, how many addresses were geocoded and how long it took.
| Dataset Name | Input Addresses | Response Rate (Rough) | Seconds/1000 Addresses |
|---|---|---|---|
| South Americans | 13,991 | 13,743 (250) | 138 |
| Textile | 5777 | 5688 (16) | 135 |
| Textile 2 | 3070 | 3053 (2) | 110 |
| Artists accommodations | 13,907 | 10,215 (2955) | 244 |
| Health administrators | 1887 | 1698 (171) | 316 |
| Belle epoque (0.3) | 6467 | 3880 (337) | 280 |
| Belle epoque (0.5) | 6467 | 6000 | 351 |
Table 2.
Evaluating the error of geocoded results, via the geographic distance (dist.) of the edit (in metres), the percentage of the total 8823 addresses, the average aggregated distance score (Avg(Agg)), the average string distance (Avg(Sem)), or should the table column heading be changed? , the average temporal distance (Avg(Tempo)), and the subjective most common reason for edits that we encountered while browsing the data.
| Dist. (m) | % | Avg(Agg) | Avg(Sem) | Avg(Tempo) | Main Edit Cause (Subjective) |
|---|---|---|---|---|---|
| 0–15 | 81% | 9.4 | 0.07 | 19.5 | moving point on building limit |
| 15–55 | 11% | 12.4 | 0.09 | 27.2 | small numbering editing (same street) |
| 55–155 | 2% | 23.7 | 0.14 | 41.2 | large numbering editing (same street) |
| 155–7200 | 6% | 26.9 | 0.18 | 49.1 | editing street |
© 2018 by the authors. Licensee MDPI, Basel, Switzerland. This article is an open access article distributed under the terms and conditions of the Creative Commons Attribution (CC BY) license (http://creativecommons.org/licenses/by/4.0/).
Share and Cite
MDPI and ACS Style
Cura, R.; Dumenieu, B.; Abadie, N.; Costes, B.; Perret, J.; Gribaudi, M. Historical Collaborative Geocoding. ISPRS Int. J. Geo-Inf. 2018, 7, 262. https://doi.org/10.3390/ijgi7070262
AMA Style
Cura R, Dumenieu B, Abadie N, Costes B, Perret J, Gribaudi M. Historical Collaborative Geocoding. ISPRS International Journal of Geo-Information. 2018; 7(7):262. https://doi.org/10.3390/ijgi7070262
Chicago/Turabian StyleCura, Rémi, Bertrand Dumenieu, Nathalie Abadie, Benoit Costes, Julien Perret, and Maurizio Gribaudi. 2018. "Historical Collaborative Geocoding" ISPRS International Journal of Geo-Information 7, no. 7: 262. https://doi.org/10.3390/ijgi7070262
Note that from the first issue of 2016, this journal uses article numbers instead of page numbers. See further details here.