Article

The Impact of the Parameterisation of Physiographic Features of Urbanised Catchment Areas on the Spatial Distribution of Components of the Water Balance Using the WetSpass Model

Faculty of Geographical and Geological Sciences, Institute of Physical Geography and Environmental Planning, Department of Hydrology and Water Management, Adam Mickiewicz University of Poznań, Bogumiła Krygowskiego 10 Str., 61-680 Poznan, Poland
*
Authors to whom correspondence should be addressed.
ISPRS Int. J. Geo-Inf. 2018, 7(7), 278; https://doi.org/10.3390/ijgi7070278
Submission received: 22 May 2018 / Revised: 18 July 2018 / Accepted: 19 July 2018 / Published: 21 July 2018

Abstract

:
An analysis was conducted of the activity of individual homogeneous Hydrological Response Units (HRUs) and their impact on the components of the spatially distributed water balance based on the example of two urbanised catchments of the city of Poznań (Western Poland). Water balance was developed using the WetSpass model and GIS spatial data, based on hydrometeorological data from the reference period of 1961–2000 including projected land usage changes and precipitation changes expected by 2025 in the city. The catchments were parameterised with reference to land usage, soil permeability, terrain declivities and the level of groundwater waters in summer and winter. The dependence between HRUs and their impact on components of the water balance was determined. Water balance forecasts have shown two-way changes in the components of approximately 12% of the catchments. A significant increase of surface runoff (an increase of 20–30 mm/HRU) at the expense of effective infiltration reduction (by 15–20 mm/HRU) was determined for arable land intended for development. An increase of infiltration and evapotranspiration at the expense of the surface runoff reduction is forecast for areas designed for urban afforestation. The tendency of increase of atmospheric precipitation within the city until 2025 was indicated by changes in the water balance components. Changes in the landscape resulting from urban expansion may lead to detrimental hydrological effects: accumulation of surface runoffs and occurrence of local flash flooding, as confirmed by the simulations carried out using the WetSpass model. The results may contribute to a more accurate understanding of the impact of urban landscape modification patterns on the water balance at the regional and local scale.

1. Introduction

Water resources planning and management consists in their quantification, and in the distribution and utilisation of waters. To answer the question as to how best to manage, regulate and protect water resources, use is made of information about catchment areas and data pertaining to these resources, which are gathered in Geographical Information Systems (GISs). The identification and forecasting of water resources is utilised in diverse types of activities connected with the development of water-management systems in areas benefiting from varying levels of economic investment. Basic information for the decision support system utilised in water resources planning and management is provided by the results of analyses and the modelling of water balance components using a time-spatial approach.
It is recognised that models and methods for assessing the spatial properties of a catchment area, which are based on teledetection data and GIS systems, allow us to determine its parameters to an extent sufficient to conduct spatial analyses of the conditions of both local and regional water circulation [1,2,3,4,5,6,7].
The fundamental problem of spatial analyses of water circulation conditions and model studies of complex hydrological systems concerns the continuity or discontinuity of hydrological processes occurring in the catchment area and the selection of the scale and size of the basic assessment field [8,9,10,11,12]. This is reflected in the methods for simulating and visualising the time and space relations that occur between them [13,14,15,16].
The structure of the catchment area system, made up of single Hydrological Response Unit (HRU), is determined by a number of diverse features, among others morphological, geological–lithological, hydrogeological, hydrographical, and also concerning land cover and usage. The spatial distribution of these features determines the degree of its isotropy and homogeneity. Surface recognition formula can be used for surfaces with a specific spatial function for delimiting homogeneous land surfaces. The function covers the following steps: the designation of components, division into zones, detection of rare properties, the matching of components to the surface representation, and the identification of the surface [17].
In balance models that consideration and forecast changes in available resources, measured for example by the magnitude of flow in a river or the level of groundwater, it is necessary to use precipitation–runoff models or models of the spatially distributed water balance model, coupled with GISs. In models of this type, the basic data include—apart from climatic data (precipitation, temperature, air humidity, wind speed, and solar radiation energy)—a digital elevation model (DEM), soil types with their associated hydrogeological properties, and land usage. The concepts of a HRU calculation unit has found application among others in the following models: MIKE SHE, SWAP, SWAT, SWB, WetSpa and WetSpass, which estimate the spatial distribution of the water balance components under various environmental conditions [2,18]. Tests are performed among others on hydrological models and water management models (e.g., MIKE BASIN and MODSIM), while at the same time analysing the possibility of mutual data provision [19,20]. They are used for simulating climate change and the impact of decisions concerning changes in spatial development in the catchment area on the quantity and quality of water resources. The quantitative expression of the characteristics of individual subsystems of a catchment area constitutes a point of departure for conducting a spatial analysis of the variability of individual parameters and a comparative analysis between different units, for example catchment areas or geological–soil–topographical associations. These assumptions are satisfied by the WetSpass (Water and Energy Transfer between Soil, Plants and Atmosphere under quasi-Steady State) model. This model utilises a number of empirical dependences occurring among the atmosphere, soil medium and vegetation as regards the exchange of water and energy to calculate the annual average and seasonal average values of effective infiltration of groundwater, surface runoff and evapotranspiration [2]. WetSpass takes into consideration the spatial variability of characteristic features of the catchment area system and of elements of the water balance using a raster approach and GISs, and its structure makes it possible to update the data, keep scenarios of changes in water circulation, and also compile the data with other models, e.g., of groundwater filtration. The results of the modelling of components of the water balance on a regional and local scale utilising the WetSpass model have found application in research into the state of water resources and the forecasting of changes occurring therein under the influence of climatic factors and anthropogenic pressure. The WetSpass model was used, among others, in research on the water balance in the catchment areas of European rivers [1,14,21,22,23,24,25], and also in catchment areas located in hot and dry climate zones [26,27,28,29]. The results of model-based research that utilises WetSpass may constitute a significant element of the system for managing and protecting water resources in a catchment area, especially in strongly urbanised areas that are subject to dynamic changes in spatial development. An increase in the degree of urbanisation entails the transformation and fragmentation of the municipal landscape and a change in the structure of the active surface of a catchment area, which in hydrological terms contributes to the disruption of relations between components of the water balance and decreases the surface stability of the catchment area.
The article presents the spatial analysis of the impact of urbanised catchment areas on the development of the areal hydrological activity. Parameterisation was identified using the WetSpass spatially distributed water balance model. Modelling was conducted for two catchment areas—the Bogdanka River and the Junikowski Stream, located within the boundaries of the city of Poznań (Western Poland). A significant problem concerns the dynamic accretion of sealed soils at the expense of biologically active surfaces which may bring about a weakening of the structure of the hydrological balance in the surface arrangement. Apart from the quasi-natural infiltration surfaces, there are also strongly urbanised zones that contribute to the generation of surface runoff and its accumulation, leading to an increase in the threat of local flash flooding.
The WetSpass model was applied to forecast changes in the water balance of the catchments, assuming changes in the land use structure and the tendency of increase in atmospheric precipitation in the city Poznań until 2025. Urban expansion can modify rainfall patterns and may contribute to changes in relation to spatial patterns and precipitation volumes. Changes in hydrological processes in urbanized catchments are, in particular, a consequence of changes in land use, most often in the direction of reduction of vegetation zones at the cost of impermeable surfaces.
The novelty of the research was to test the water balance models taking into account the impact of the predicted changes in land use and the projected increase in atmospheric precipitation on the distribution and volume of water balance components using the WetSpass model. The spatial distribution of components of the water balance model in the analysed catchment areas was examined for hydro-meteorological conditions that were averaged for the year and for the winter and summer half-year periods, determined for the years 1961–2000. These were then compared to the period of 2000–2025, taking into account changes of the environmental and climatic factors. Changes in land use are mainly related to the increase of urbanized (built-up) areas at the expense of arable land, while atmospheric precipitation shows an increasing trend. When assessing the relationships occurring between environmental characteristics of a catchment area, reference surfaces were specified for Hydrological Response Units (HRUs), for which the hydrological potential determining the course of the dominant process (effective infiltration of precipitation, surface runoff and evapotranspiration) was established. Furthermore, simulations conducted until 2025 were intended to identify zones with a predisposition to the generation of increased surface runoff, including zones in the city that were potentially threatened with local flash flooding. The analysis of the spatial distribution of components of the water balance of the catchment area made it possible to determine the range of the biologically active surface, which in municipal space also plays an important role in the processes of renewal of shallow groundwater resources.
The assessment of the hydrological activity in urbanised areas indicates the compensating and regenerating functions of water resources as a part of Integrated Urban Water Management (IUWM). Studies on dispersed water balance in urban catchments can be useful in determining the directions of an investment policy as part of cities’ adaptation to climate change and rainwater management, e.g., blue infrastructure, distributed retention solutions related to spatial planning. This approach allows reducing costly solutions and mitigating the effects of building density or results of climate change. In that respect, new tools and advanced technical solutions are also helpful, as well as new opportunities of data management, GIS and hydrological models for preventive and prophylactic activities [13].

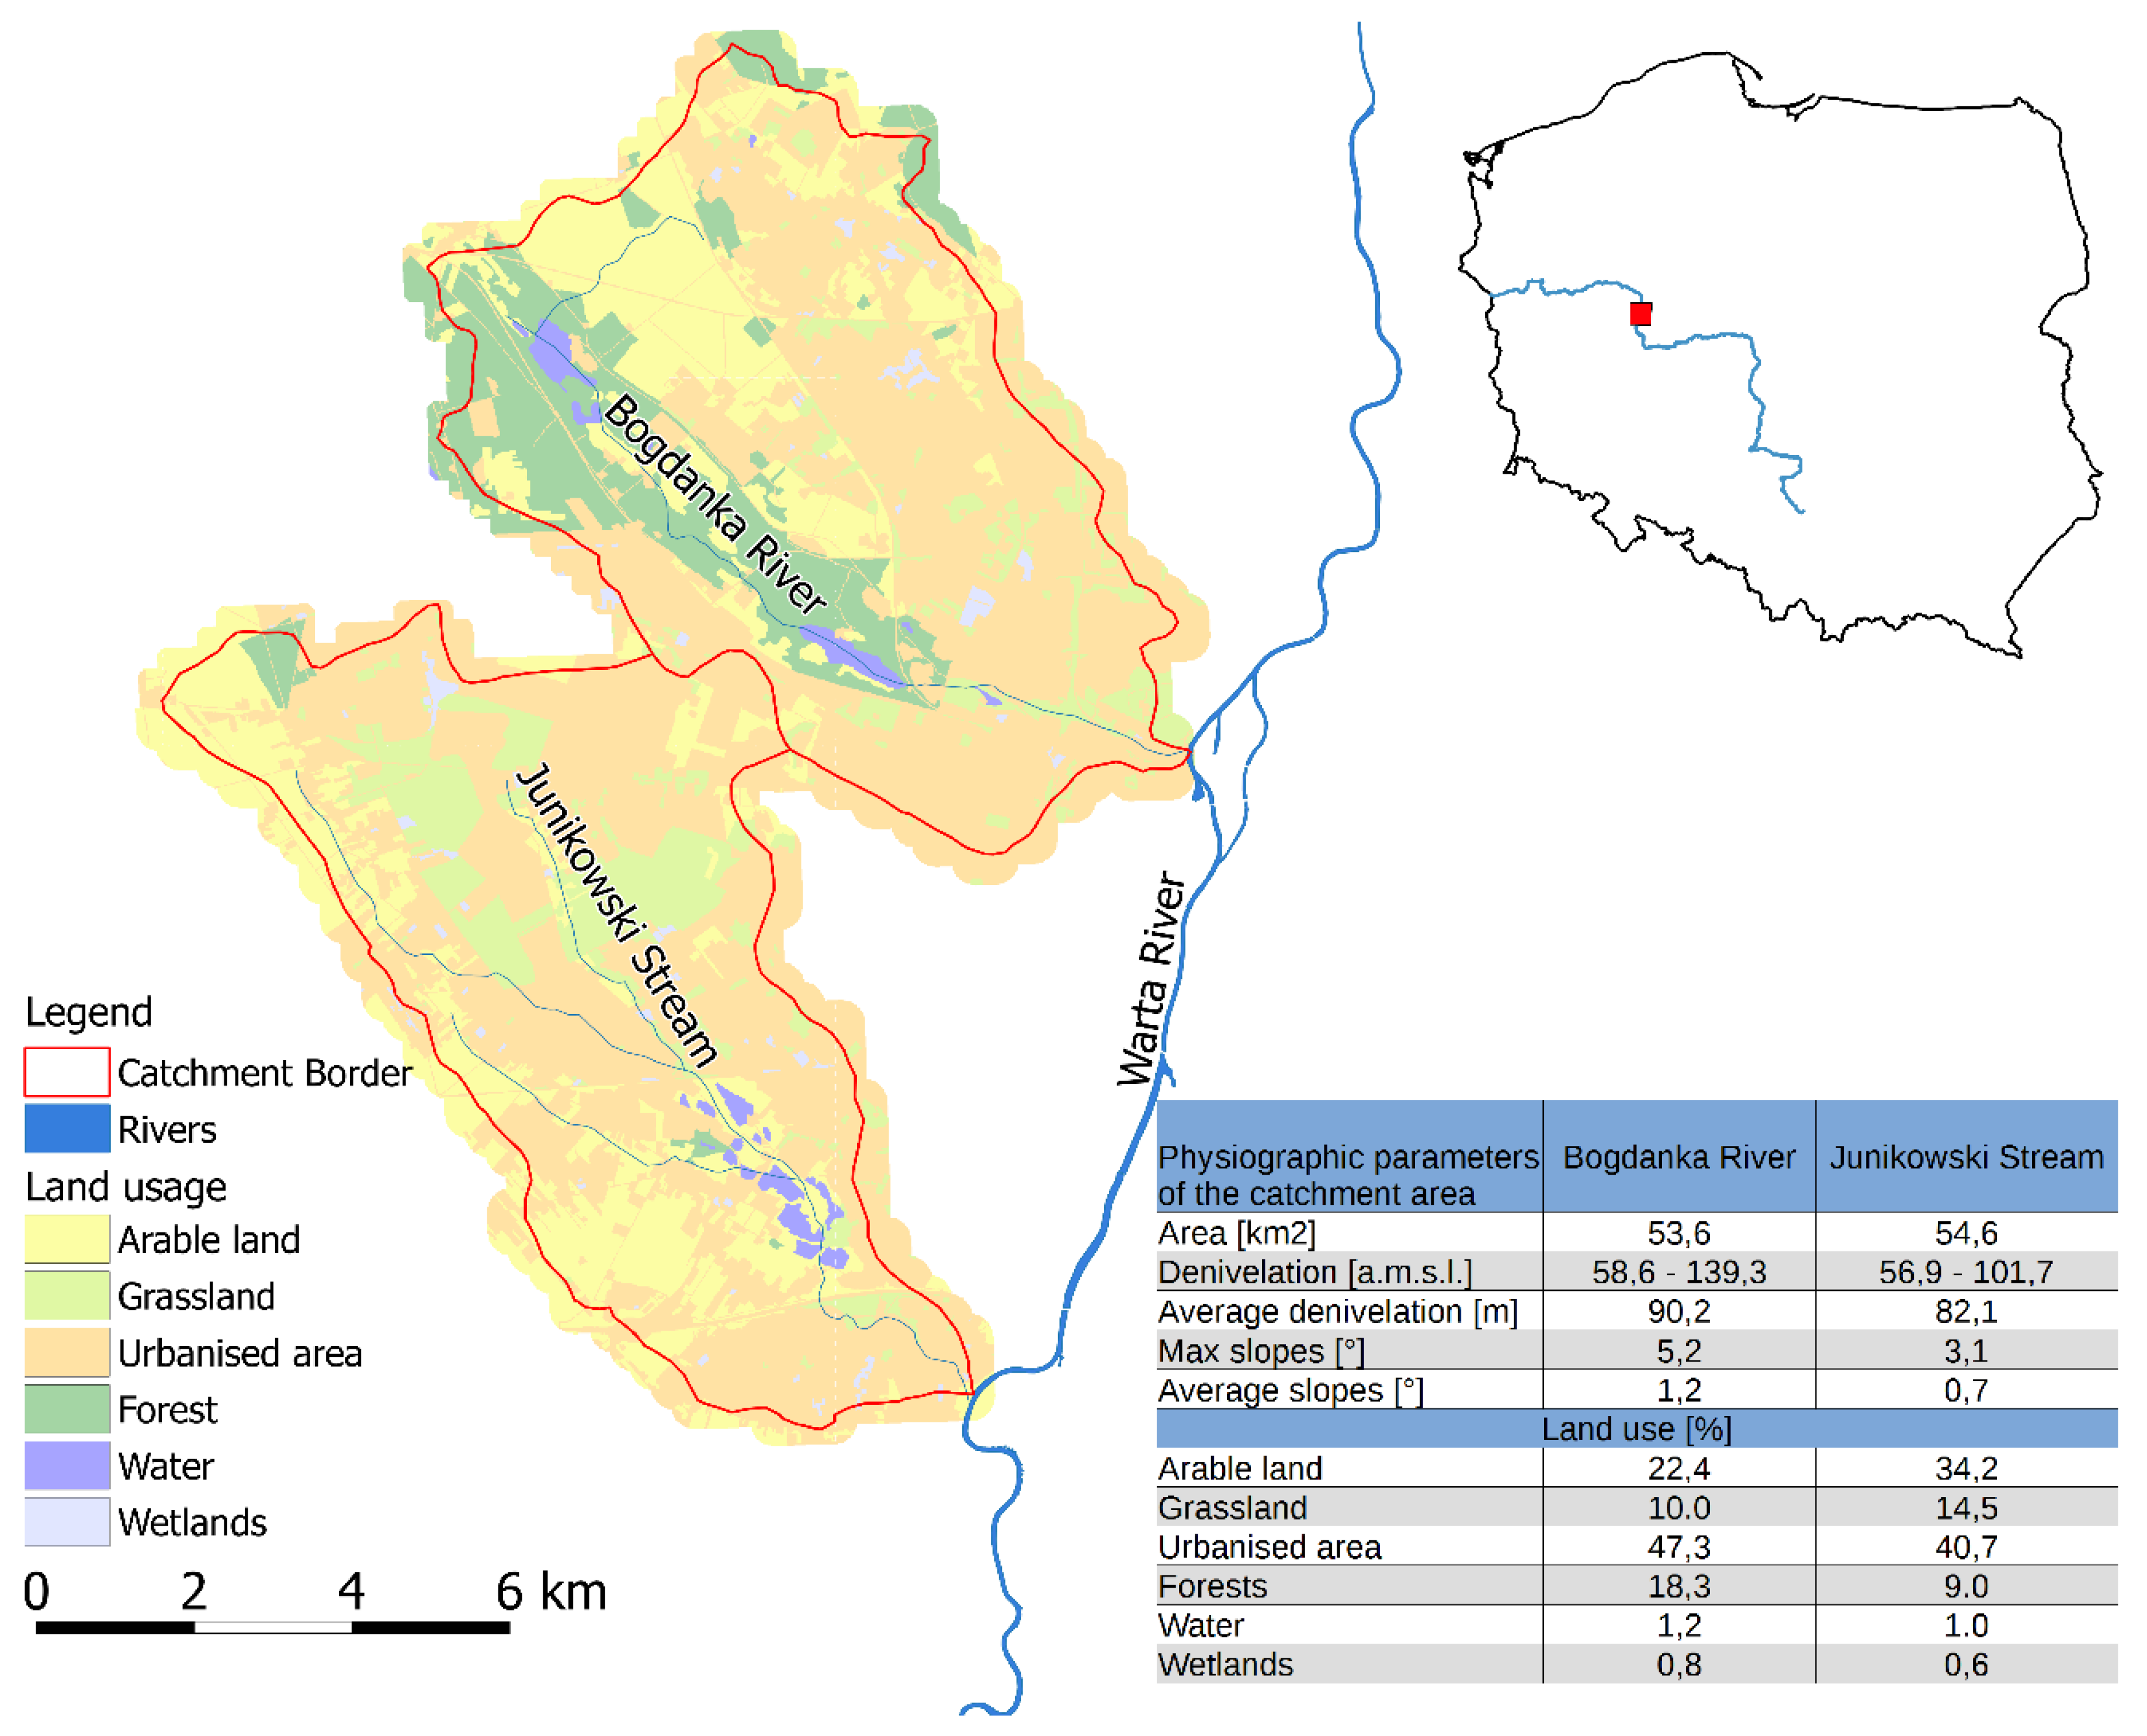
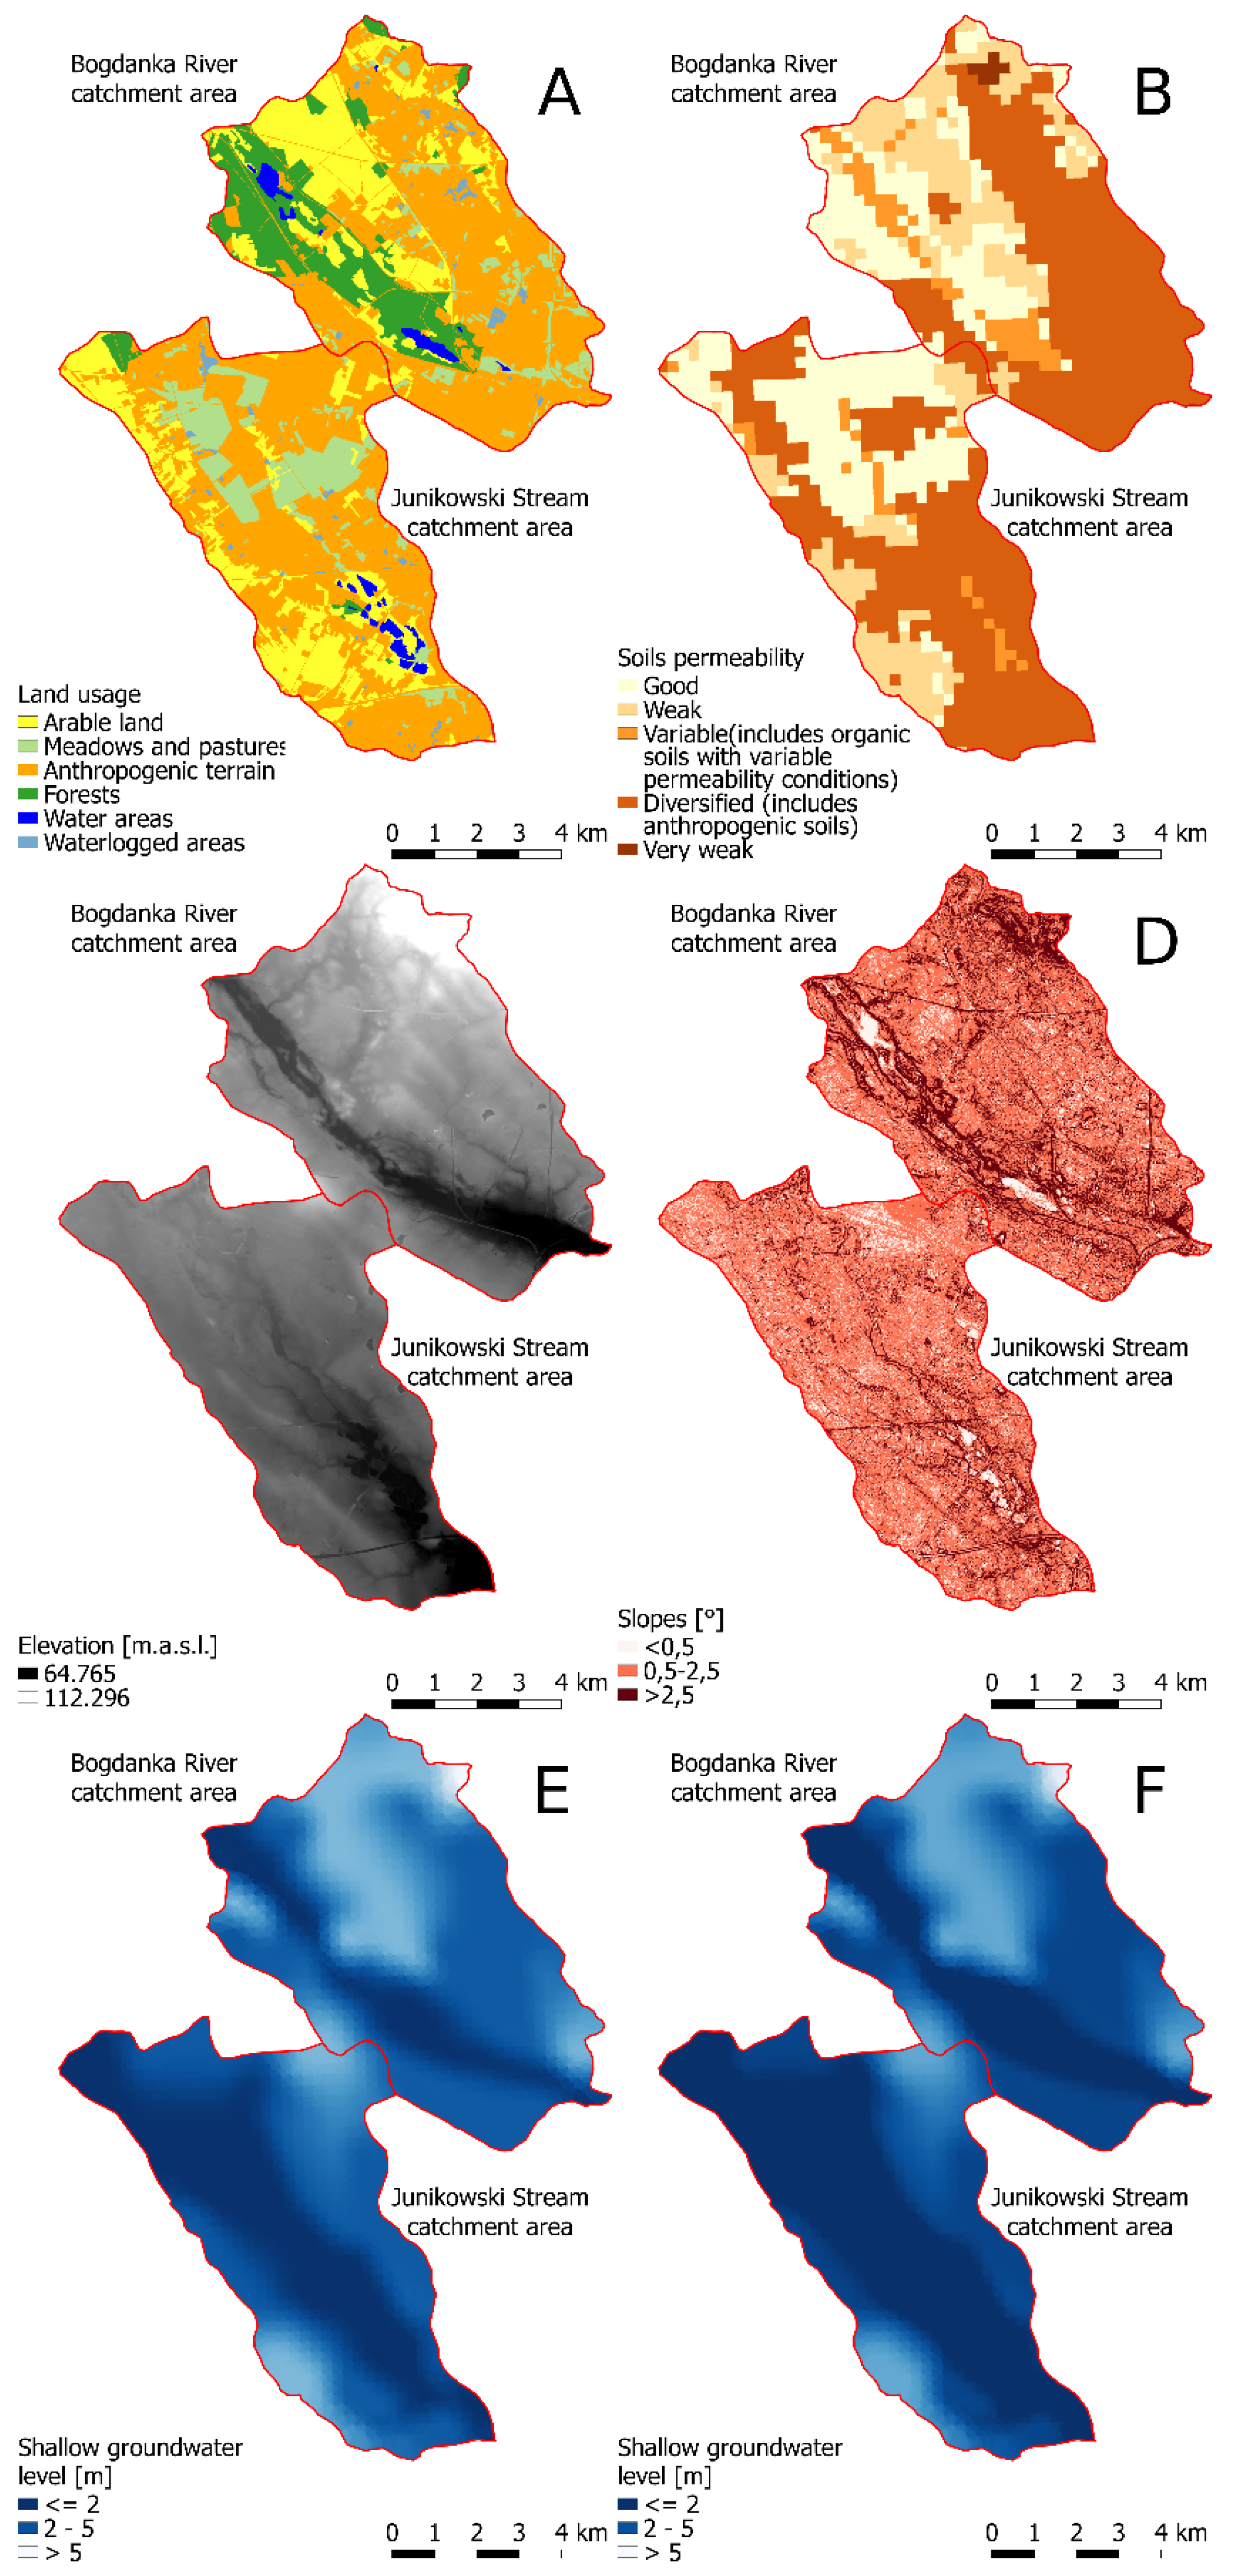
2. Area of Research and Source Material
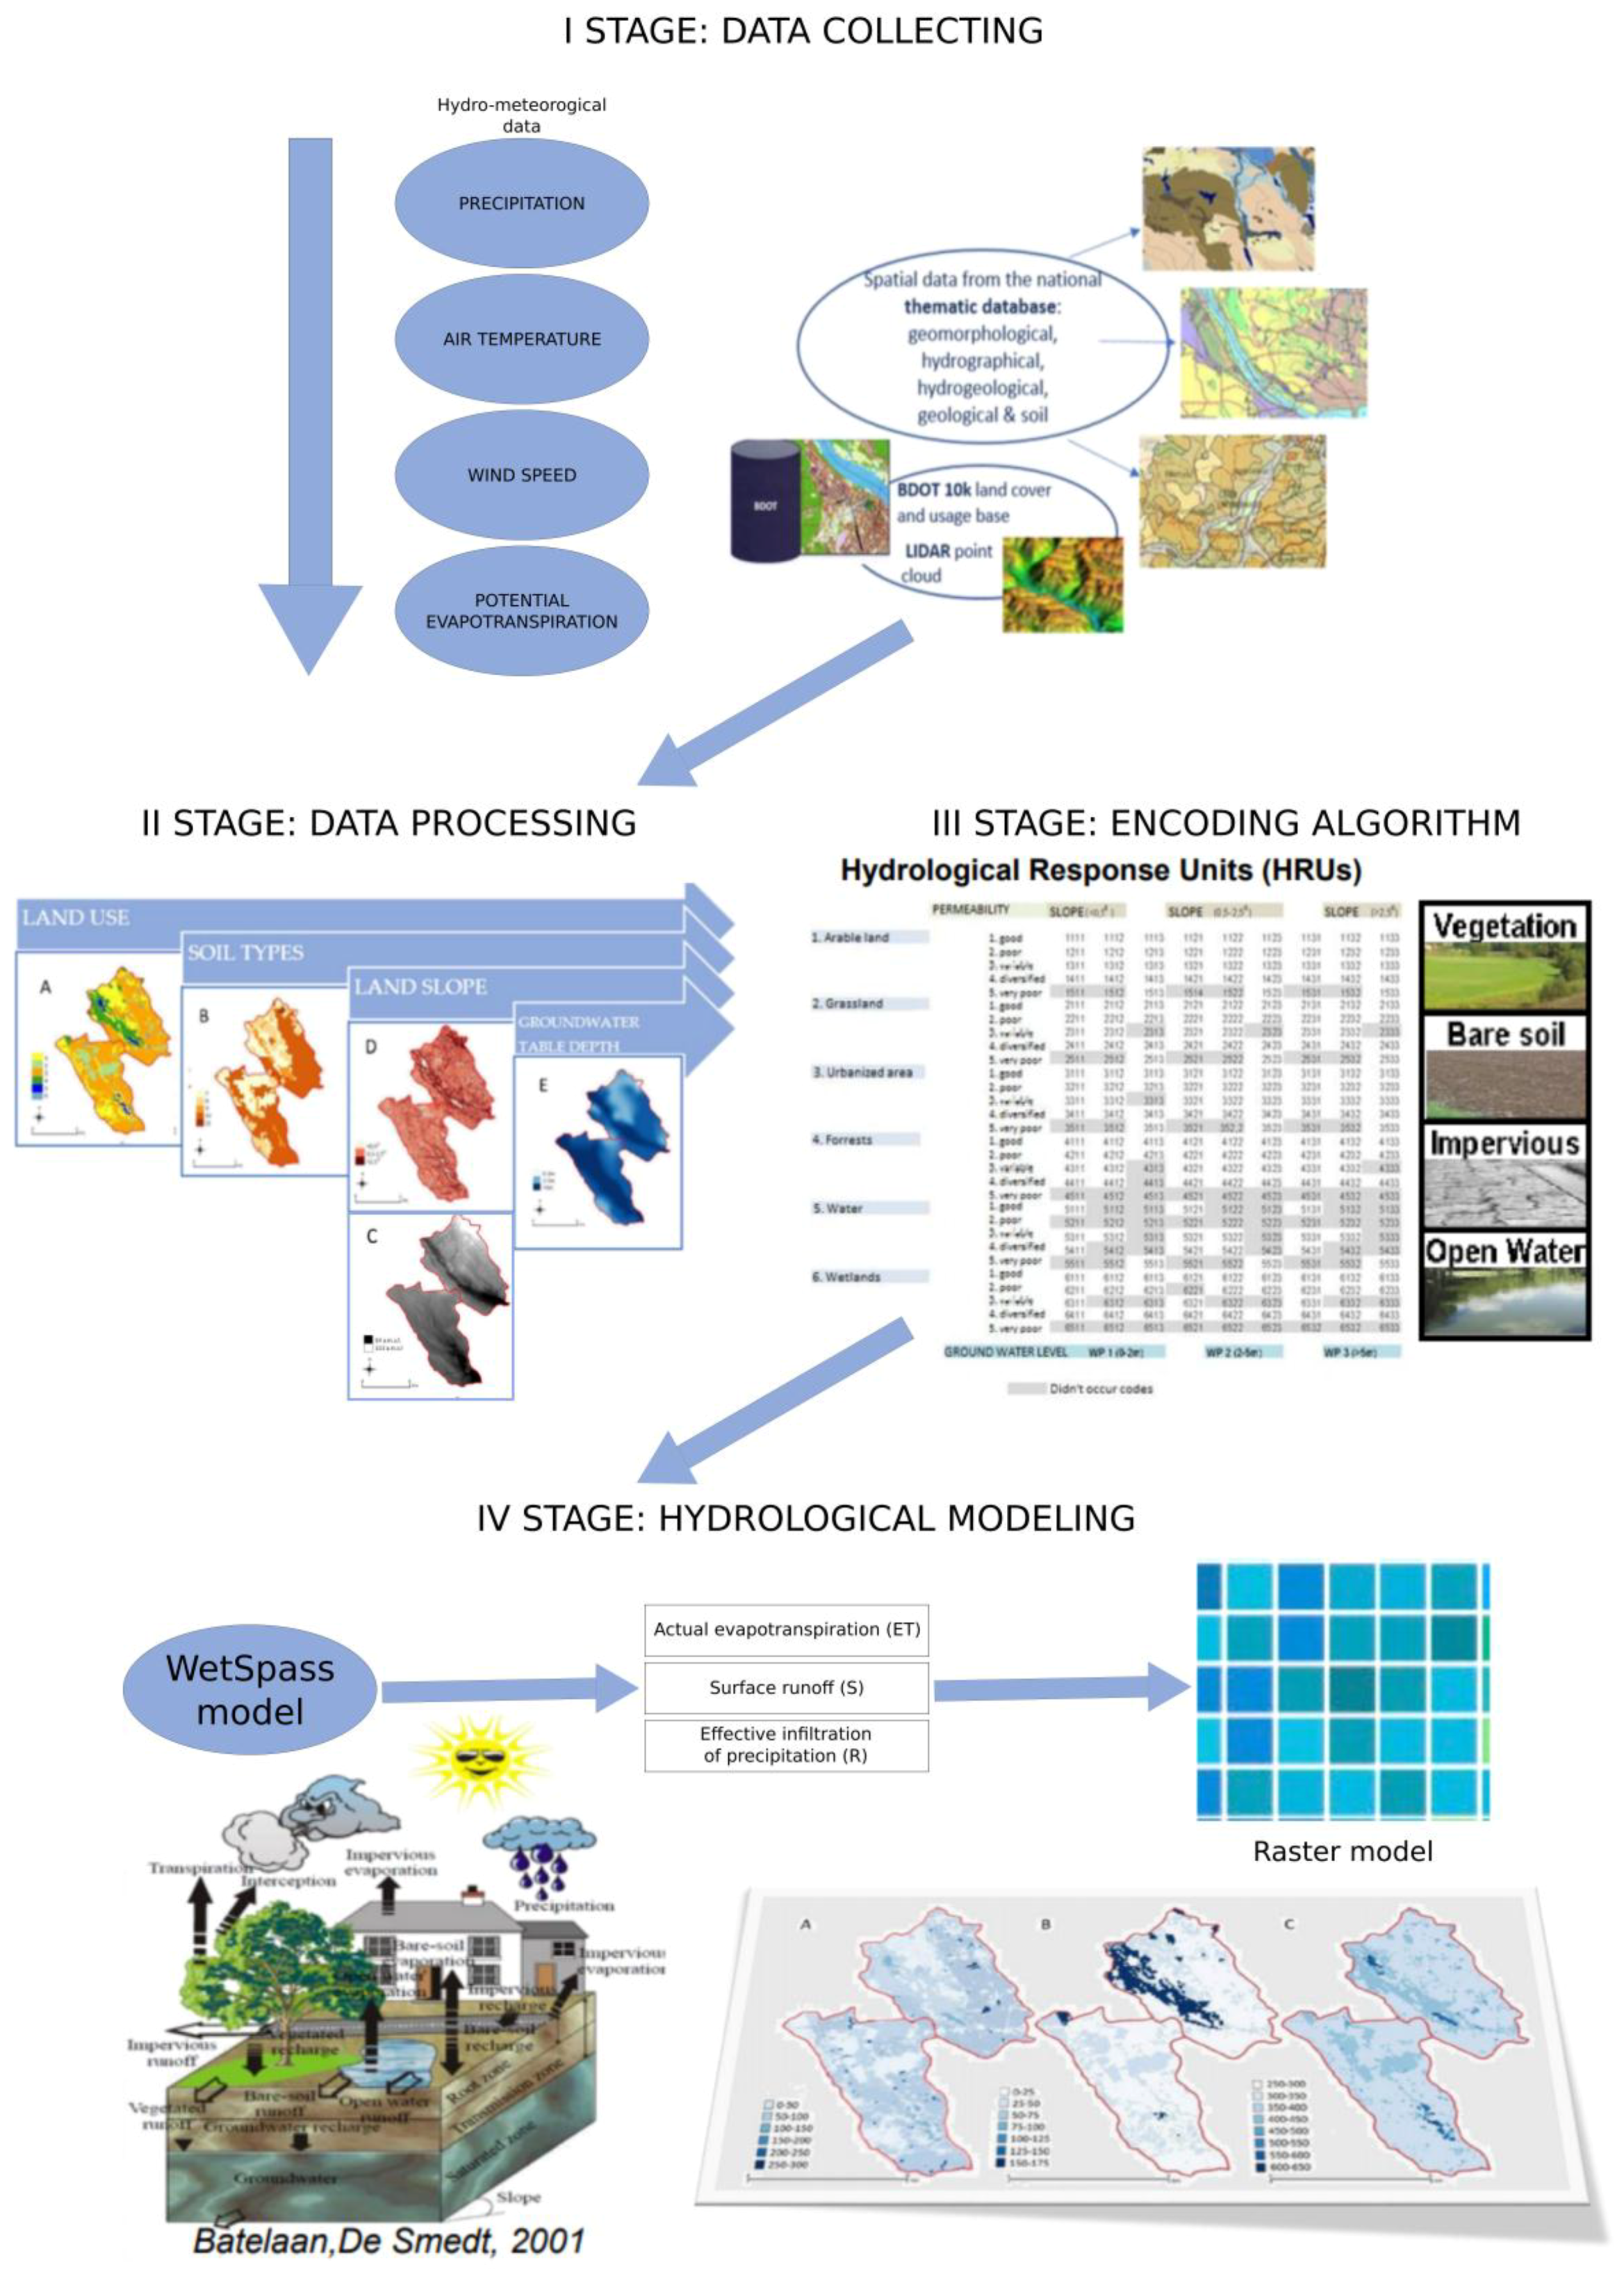
The following catchment areas were selected for research: the Bogdanka River (A = 53.6 km2) and the Junikowski Stream (A = 54.6 km2), which are tributaries of the Warta River, the third longest river in Poland (Figure 1). The rivers dewater the left-bank part of the city of Poznań (Western Poland), which is located on the Poznań Plain, in the most urbanised section of the Greater Poland Lowlands. Poznań (with over 500,000 inhabitants) is a developing city with strongly growing urbanisation which gradually degrades the wedge-ring system of urban greenery unique on a national scale. This system was designed in the 1930s and one of its main assumptions was to maintain the natural continuity in river valleys. This planning idea has survived to this day being the main assumption underlying the city’ spatial structure. The pressure to invest in these areas is still high, and resulting in the reduction of retention, acceleration of surface runoff and the occurrence of flash flooding in the city.
The selected units are differentiated by the degree of urbanisation and the structure of the active surface (Figure 1). The catchment areas of both watercourses have to a considerable extent undergone anthropogenic transformation, with developed and urbanised areas accounting for more than 40% of their surface; these include compact and dispersed settlements, industrial and transport areas, technical infrastructure, and strip mining areas. Arable land, which is located mainly on the fringes of the catchment areas, occupies approximately 22–34% of their surface, with forests and grassland accounting for a smaller area (Figure 1).
The selection of parameters impacting the course of hydrological processes in the catchment area was performed with reference to the criteria and assumptions of the WetSpass model. For the annual and semi-annual forecasts, input data for the model were in the form of raster maps (models) presenting climatic elements and selected physical features of the catchment areas; these are shown in Figure 2. The map of the hydrological potential and response of the catchment areas was elaborated in the form of a raster model on the basis of four physiographical parameters of the catchment areas: land usage (U), soil permeability (G), terrain declivity (S), and the depth to groundwater of the first water-bearing level (Z) in a unified code (U-G-S-Z). The single raster (balance) cell of HRUs had the following dimension: xy = 4 m2 (Figure 2).
When selecting homogeneous HRUs in the catchment areas, use was made of spatial data from the national thematic database (geomorphological, hydrographical, hydrogeological, geological and soil), and the BDOT 10k (Topographic Objects Database) land cover and usage base. The spatial databases were integrated using GIS techniques, among others for the purposes of the WetSpass model. A characterisation of geomorphological conditions was performed on the basis of the Geomorphological Map of the Wielkopolska–Kujawy Lowlands (abbreviation: MGmNWlkp.-Kujaw.), elaborated at the Institute of Palaeogeography and Geoecology of the Adam Mickiewicz University in Poznań in digital format (MGmNWlkp.-Kujaw., 2007). Its scope was supplemented and verified on the basis of a 1:50,000 geological and hydrogeological map of Poland (State Institute of Geology—State Research Institute; Pl. Państwowy Instytut Geologiczny-Państwowy Instytut Badawczy, abbreviation PIG-PIB). The spatial data concerning land cover and usage were obtained from the BDOT 10k database, which was made available by the Head Office of Geodesy and Cartography (Pl. Główny Urząd Geodezji i Kartografii, abbreviation GUGIK) (Figure 2). Information concerning soil permeability was generated from a 1:50,000 hydrographical map of Poland, wherein it is interpreted according to six classes of permeability, taking into consideration the structural properties of soils and their ability to conduct water (GIS-3 Guidelines, 2005). Each class, verified on the basis of data from a soil-agricultural map (1:25,000), corresponds to a group of formations with a specific value of the filtration coefficient, which impacts the degree of soil permeability or the degree of insulation of a surface zone. The database of hydrographical data was also used to map the distribution of the depth of the groundwater water level of the first water-bearing level (Figure 2). The terrain declivity was generated from a LIDAR point cloud obtained under the project IT System for the Protection of the Country against Extraordinary Hazards (ISOK). The ISOK is characterised by the catchment areas with a set of topographical indices obtained from the Numerical Terrain Model (Figure 2). Furthermore, use was made of climatic (hydro-meteorological) data from the Institute of Meteorology and Water Management—State Meteorological Institute in Warsaw (Pl. Instytut Meteorologii i Gospodarki Wodnej—Państwowy Instytut Meteorologiczny w Warszawie, abbreviation IMGW-PIB), comprising: the amount of precipitation, air temperature, wind speed, potential evapotranspiration, and states of the shallow groundwater water level. To make the forecast data from development plan and study (Pl. Studium uwarunkowań i kierunków zagospodarowania przestrzennego; Miejscowy plan zagospodarowania przestrzennego), Central Statistical Office in Warsaw, Poland (Pl. Główny Urząd Statystyczny GUS, Warszawa, Polska) and IMGW-PIB were used.
Furthermore, the analysis has made use of information about local flash flooding zones affecting the city of Poznań during periods of rainstorms. These data were obtained from the Poznań Flash Flood Project geo-service, where they have been gathered since 2006 as Volunteered Geographical Information (VGI).
Detailed descriptions of source materials and studies of spatial data for the WetSpass model have been presented by Batelaan [1] and Batelaan & De Smedt [2], and in many works with reference to conditions existing in Poland [14,21,22,23,25].

3. Research Methods

The procedure of identifying zones susceptible to the generation of a specific hydrological process included an analysis of the distribution of physical features of the catchment areas. A standard flow chart (Figure 3) presents the particular stages and connections from the data collection, through data processing and encoding of spatial information to modelling, and finally to a water balance simulation with WetSpass. Research was applied to three water balance components (effective infiltration, surface runoff, and evapotranspiration) which are calibrated to historical data, used to simulate recharge using HRU. It was assumed that the reference surface model constitutes a sequence of interconnections of four variables. To arrive at a definition thereof, use was made of an algorithm for coding the sequences of interconnections between individual variables (entities)—developed by Graf [14]—when assessing the conditions of supply of shallow groundwater in the Poznań Upland (Table 1). The variables included both qualitative (land usage (U) and soil permeability type (G)) and quantitative data (terrain declivity (S) and depth to the groundwater level (Z)). As regards the coding of quantitative and descriptive information “U-G-S-Z”, use was made of classification and reclassification procedures entailing the connection or separation of groups of source data and the allocation thereof to the WetSpass model base. The models thus elaborated constituted the basis for assessing the hydrological potential.
The input data for the WetSpass model comprise the following: meteorological factors: precipitation, air temperature, wind speed, potential evapotranspiration, ordinates and terrain declivity, soil type, land cover and usage and the depth to the groundwater level (Figure 2). Apart from the input data, the model for calculating the water balance utilises its own application schemas concerning attributes of land usage, surface runoff, and soils [30]. To evaluate human impact by the land use change (see below in detail), the input data in the model were simply replaced at the second stage of the work and the model execution was repeated.
In the WetSpass model, the water balance is calculated for each cell that represents a specific type of reference surface: bare soil (with no vegetation), vegetated soil, open water surface, and an impermeable surface, which makes it possible to take into consideration intracellular structural heterogeneity. The seasonal water balance for a raster cell representing a specific reference surface can be shown by Equations (1)–(4):
P = Hp + IE + IN + TR (vegetated soil, “gr”)
P = Hp + IE + Es (bare soil, with no vegetation, “go”)
P = Hp + IE + Ew (open water surface, “pw”)
P = Hp + IE + En (Impermeable surface, “pn”)
where
  • P is the precipitation (mm);
  • Hp is the surface outflow (runoff) (mm);
  • IE is the infiltrative supply of groundwater (mm);
  • IN is the interception (mm);
  • TR is the actual transpiration (mm);
  • Es is the evaporation from the soil (mm)
  • Ew is the evaporation from the water surface (mm);
  • En is the evaporation from the impermeable surface (mm); and
  • Eta is the actual evapotranspiration (mm).
The total water balance for a raster cell is determined by means of equations where the index “c” designates the sum of balance component values from individual reference surfaces (the “gr”, “go”, “pw” and “pn” indices): surface outflow (Hpc), infiltrative supply of groundwater (IEc) and evapotranspiration (Etc) (5)–(7):
Hpcraster = grHp + goHp + pwHp + pnHp
IEcraster = grIE + goIE + pnIE
ETcraster = grETa + goEs + pwEw + pnEn
The symbols have the same meaning as in Equations (1)–(4).
In the WetSpass model, the precipitation supply potential is interpreted as the average precipitation in a catchment area. Precipitation was calculated using a set of measurement data from 18 catchments surrounding meteorological stations of the IMGW-PIB (data from the period 1961–2000), located within reach of the Poznań Upland. A similar procedure was applied for estimating the spatial distribution of air temperature and wind speed. Potential evapotranspiration was determined by means of the Penman–Monteith method [31], with calculations utilising meteorological data from the Poznań-Ławica meteorological station (1961–2000).
Changes in precipitation related to the reference period 1961–2000 were determined based on the IMGW-PIB data for the Poznań-Ławica rainfall station. The average annual rainfall for the 2000–2015 period was 548 mm for Poznań. To simulate the impact of rainfall on the water balance, it was assumed to increase by an average of about 20 mm in the catchments analysed during the year. The tendency of increasing precipitation recorded at the Poznań station during the period 1981–2015 indicates statistically significant trend (R2 = 0.88) of around 29.9 mm until 2025, which has also been confirmed by other studies [32].
In the WetSpass model, surface runoff undergoes a two-stage simulation. During the first stage, it is calculated as a function of the runoff coefficient, the value of which is identified using the standard application of the model taking into consideration the following: type of vegetation, soil, terrain inclination, and depth to groundwater. In the second stage, surface runoff is also interpreted on the basis of the standard application of the model, as a runoff coefficient, which specifies the part of seasonal precipitation with an intensity greater than the infiltrative capacity of the soil participating in the process, this depending on the type of soil and the depth to groundwater. The infiltrative supply of groundwater is estimated in the WetSpass model on the basis of the balance difference as a function of vegetation, soil texture, terrain inclination, the depth to groundwater, and the precipitation regime. Actual evapotranspiration is calculated in the model taking into consideration the law of conservation of mass and energy and the causality occurring between the main components of the evaporation subsystem: the atmospheric environment, the plant environment, and the soil environment. In the model applied, actual evapotranspiration is interpreted as the sum of evaporation from soils, plant transpiration, and precipitation interception.

4. Results and Discussion

4.1. Dominant HRU Codes

In accordance with the adopted assumption, the structure of the model of the hydrological potential of the researched catchment areas was determined by four factors (U-G-S-Z). Each four-element sequence of coded catchment area features (codes) was allocated a dominant hydrological process. In the final classification schema for models of the Bogdanka River and Junikowski Stream catchment areas, the number of code combinations obtained was 176 and 132, respectively (Figure 4).
In the Bogdanka River catchment area, the following code sequences are present amongst the dominant raster cells are present: 3-4-2-2 (22.5%) and 3-4-3-2 (7.2%) (Figure 4). The Junikowski Stream catchment area follows code sequences: 3-4-2-1 (14.4%) and 3-4-2-2 (12.8%). This means that the structure of the active surface of the municipal catchment areas is dominated by anthropogenic areas (U-3), with a diverse permeability (G-4), a moderately slight terrain declivity of 0.5°–2.5° (S-2), and a shallow (up to 2 m) and moderately shallow (2–5 m) occurrence of groundwater (Figure 2 and Figure 4).
These surfaces are characterised by a predisposition for generating surface runoff and, under favourable conditions, for retaining precipitation on the surface and gather it in terrain depressions. This may contribute to the creation of local flash flooding zones in periods of rainstorms, or in areas of increased evapotranspiration (Figure 5). Anthropogenic terrain, dominant in the area constituting the subject of the present study, was juxtaposed with data concerning historical flash flood phenomena caused by rainstorms.
In watershed zones and at the peripheral sections of the researched catchment areas, an accretion of areas covered with vegetation and bare soils has been observed. This phenomenon manifests itself in the greater share of arable soils (code sequences U-1) and meadows and pastures (code sequences U-2) in the structure of usage of the catchment areas (Figure 4). In the catchment area of the Bogdanka River, an increased share of forested areas (code sequence U-4) was observed, which determines the high retentiveness of an area and may also contribute to an increase in evapotranspiration.
At the classification level adopted for the catchment areas of the Bogdanka River and the Junikowski Stream, 30 possible combinations of codes from a given genetic group of topographical profile and degree of land conversion were determined (Figure 4).
The considerable segmentation and heterogeneity of the active surface of both catchment areas is significantly impacted by the high degree of anthropogenic transformations of the topography and land cover structure, which results in a high urbanisation index [33,34,35,36,37]. A greater probability of occurrence of all possible code combinations is assumed for areas covering a greater surface and with a greater genetic differentiation of the topographical profile.
As regards the infiltrative supply of groundwater, privileged zones in the researched catchment areas were defined as including arable soils and forest complexes on subsoil with a good permeability, or relatively flat, with a slight terrain declivity (up to 0.50) and a shallow occurrence of groundwater, up to 2 m (less frequently 2–5 m), coded according to the following schemas: 1-1-1-(1-2) and 4-1-1-(1-2), respectively (Table 1). Developed areas (code 3-0-0-0) characterised by an increase in the degree of impermeability of the subsoil were regarded as surfaces conducive to the generation of surface runoff. Surface runoff is also facilitated by arable soil surfaces with weak permeability, increased declivity, and deeper occurrence of the groundwater level, these designated with the code: 1-2-(2-3)-(2-3), however to a moderate extent impacting the generation of erosive flows, the creation of which commences at a terrain inclination in excess of 3° [1,14]. In the researched area, we identified a rather small number of zones (test fields) with a declivity in excess of 3°, whereas the maximum declivity registered in a single raster was 6°. A greater predisposition for the generation of surface runoff is characteristic of the watershed zones of both researched catchment areas. Evapotranspiration, being the dominant process, was attributed primarily to surfaces occupied by meadows and pastures present in the valleys of the Bogdanka River and the Junikowski Stream, and also to depressions deprived of outflows that facilitate the gathering of water and evapotranspiration due to the domination in the subsoil of organic soils with variable permeability, a very small declivity (up to 0.50), and a shallow occurrence of groundwater (up to 2 m) (codes 2-3-1-1 and 2-3-2-1).

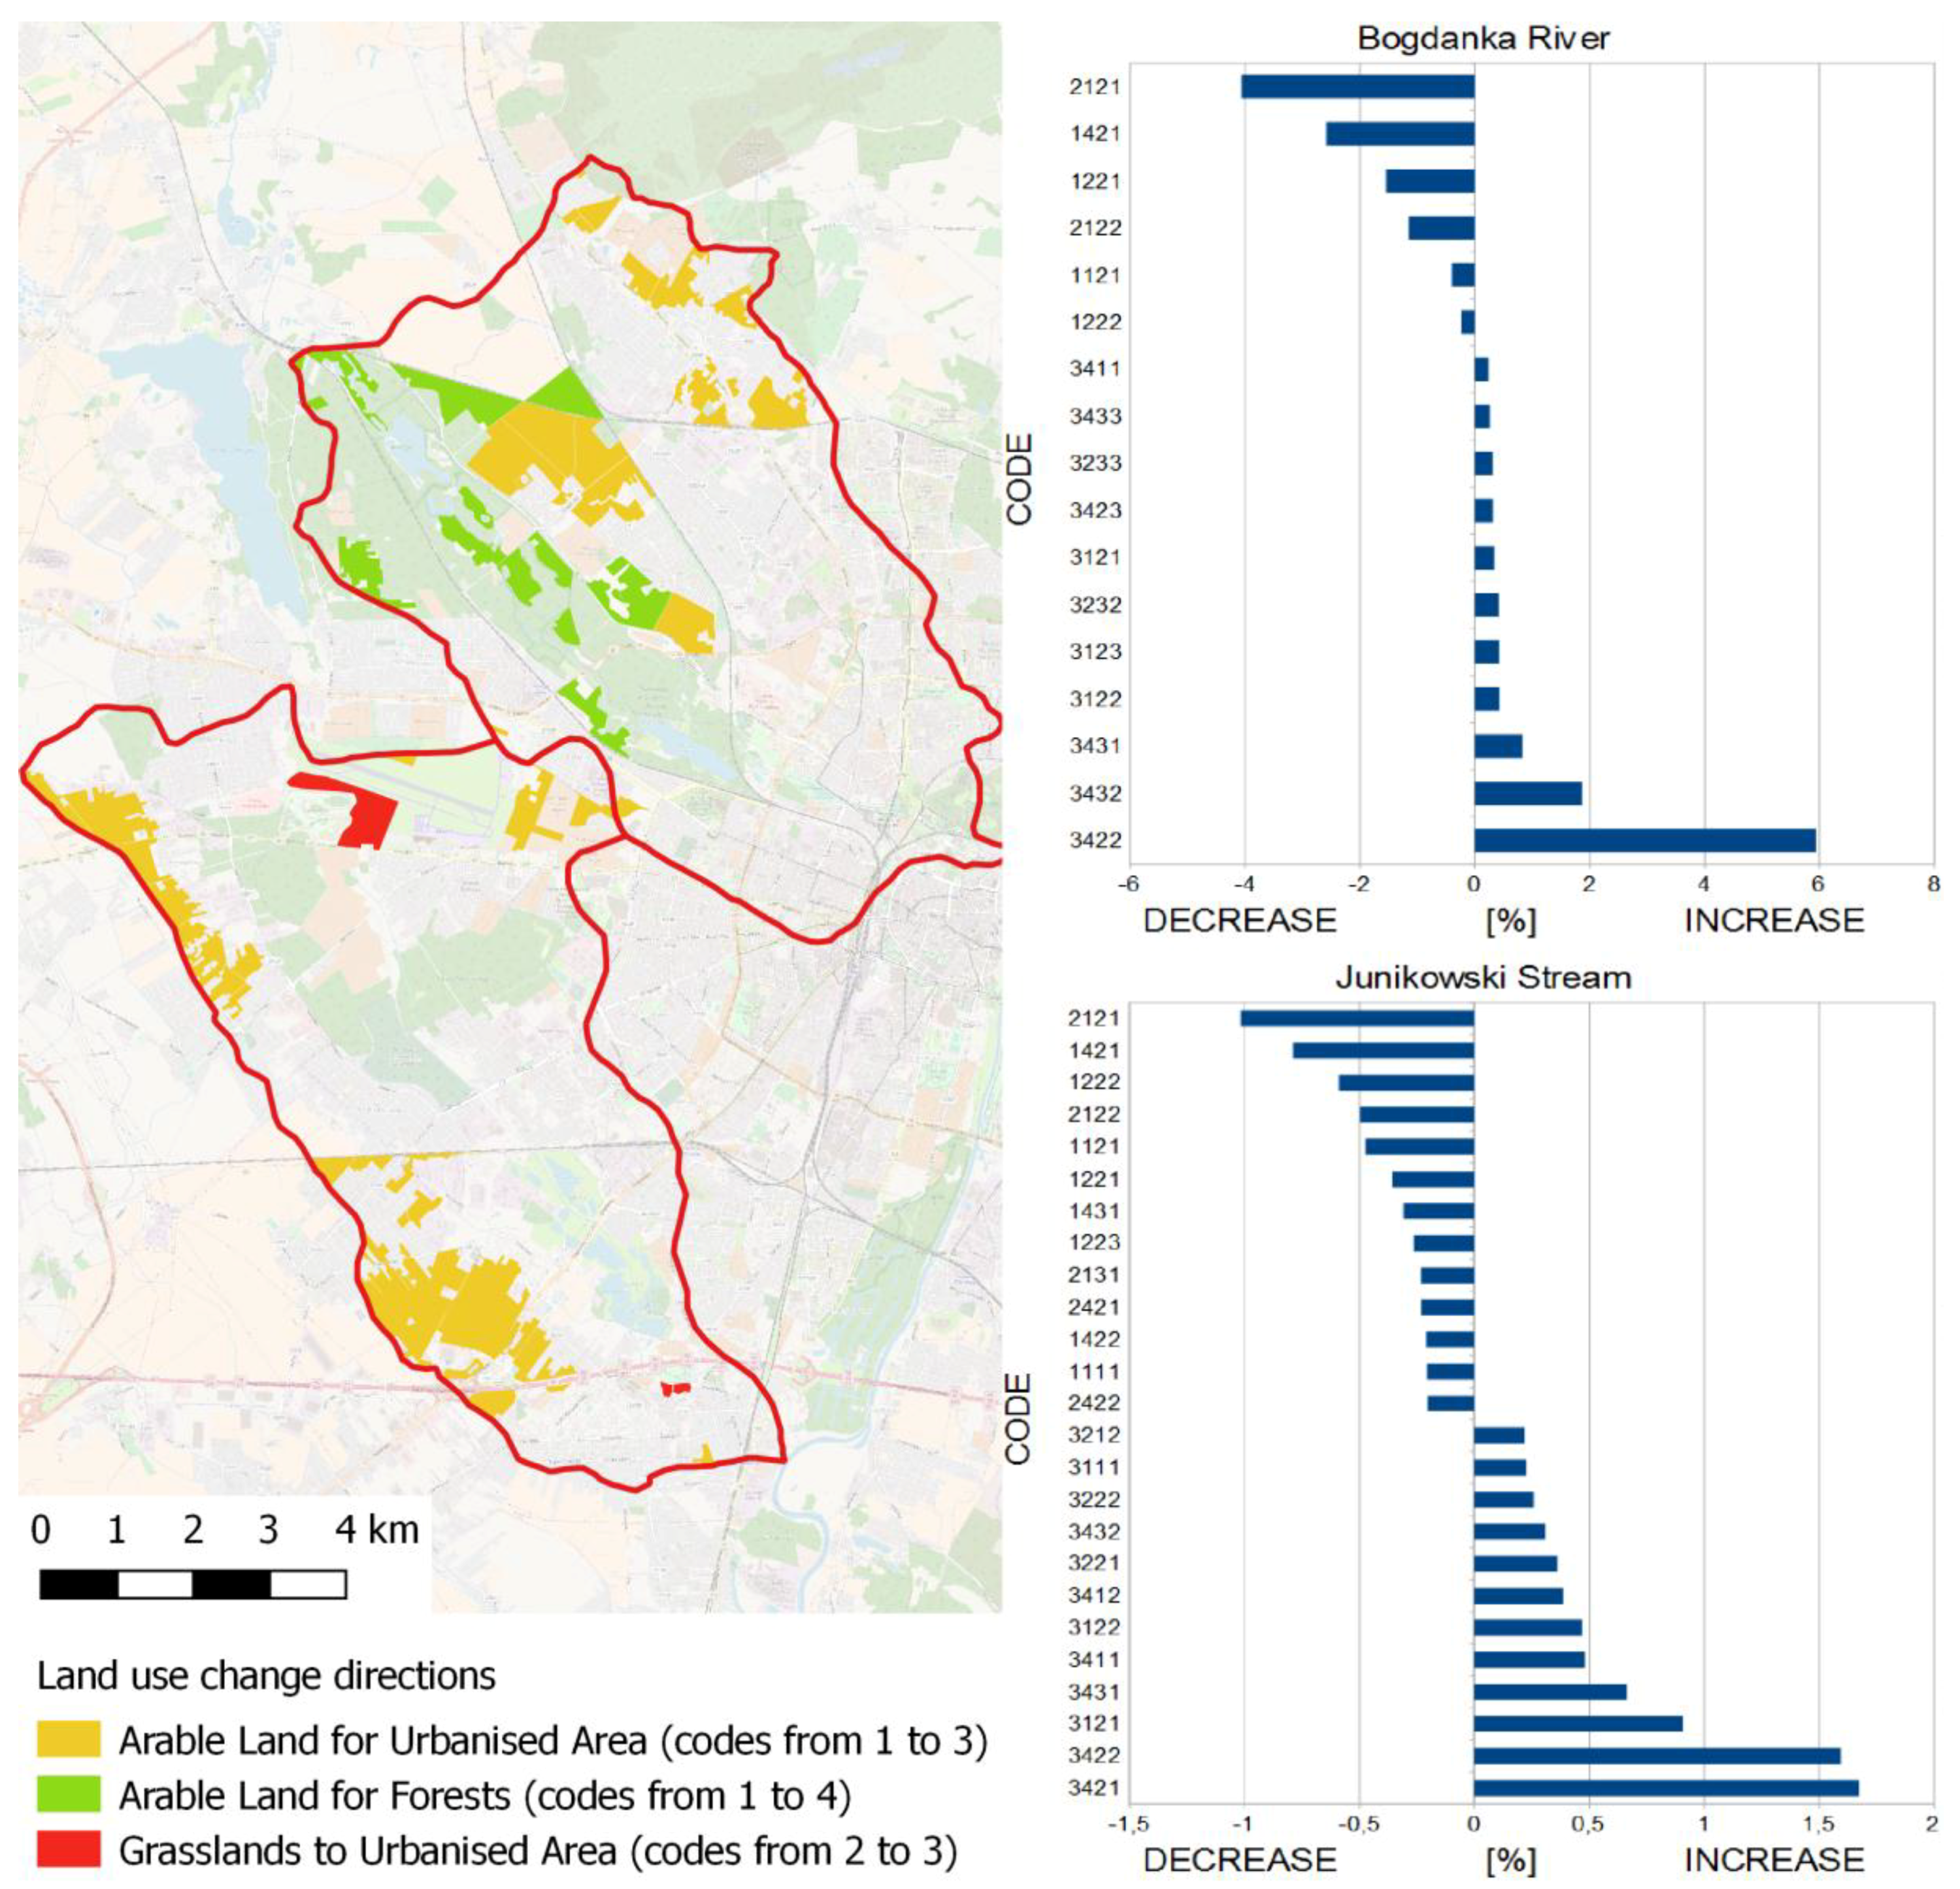
4.2. Changes in Land Use

An analysis of land use changes until 2025 in the study area showed two clear trends in both catchments (Figure 6). The main directions of spatial transformation are the result of progressive urbanization: arable land, as well as grasslands, will be replaced by urbanized areas, which will potentially result in a significant increase of the surface runoff in relation to the decrease of evaporation and infiltration. In the central and western part of the Bogdanka catchment, positive changes were identified, resulting from the arrangement of urban greenery, afforestation and natural succession of forest areas. These changes can potentially contribute to reducing surface runoff and increasing evaporation and infiltration. The area of planned changes in both catchments is similar, and the changes in the land use indicated account for 12.54% (6.72 km2) for the Bogdanka catchment and 12.89% (7.04 km2) for the Junikowski Stream.
The histogram in the Figure 6 shows changes in the share of individual codes (%) in the catchment area resulting from the change in land use. Only those codes whose share has changed by at least 0.2% in relation to the reference period (1961–2000) are presented. In the catchments of Junikowski Stream and Bogdanka, an increase in urbanised areas (3-0-0-0 codes) was reported, respectively, by 0.2–2%/code and 0.2–6%/code. This means that in both catchments the assumed share of developed and compact land areas increases by, respectively, 11.3% and 7.5%. On the other hand, the share of arable lands and grasslands will be reduced by ca. 0.2–1%/code (Junikowski Stream) and ca. 0.2–5%/code (Bogdanka). In the Junikowski Stream catchment, the changes have more diffuse character, and the largest increase in area concerns urban areas with diversified permeability, slopes 0.5–2.5° and depth to groundwater level up to 2 m (code 3-4-2-1) and urbanized areas with good permeability, slopes 0.5–2.5°, depth of groundwater level up to 2 m (code 3-1-2-1) (Figure 6, histogram). In the catchment of Bogdanka, the largest increase was recorded in the case of urbanised areas on land with various permeability, slopes 0.5–2.5° and depth of groundwater level of 2–5 m (code 3-4-2-2). A slight increase in the area also applies to urban areas marked with the remaining code specification (3-0-0-0) (Figure 6, histogram), the explanations of which are presented in Table 1. Results of the spatial analysis show that, in both catchments, the largest decrease of the share of grassland are found on land with good permeability, slopes 0.5–2.5° and depth to groundwater up to 2 m (code 2-1-2-1) (about 1% of the Potok Junikowski catchment and about 4% of the Bogdanka catchment).

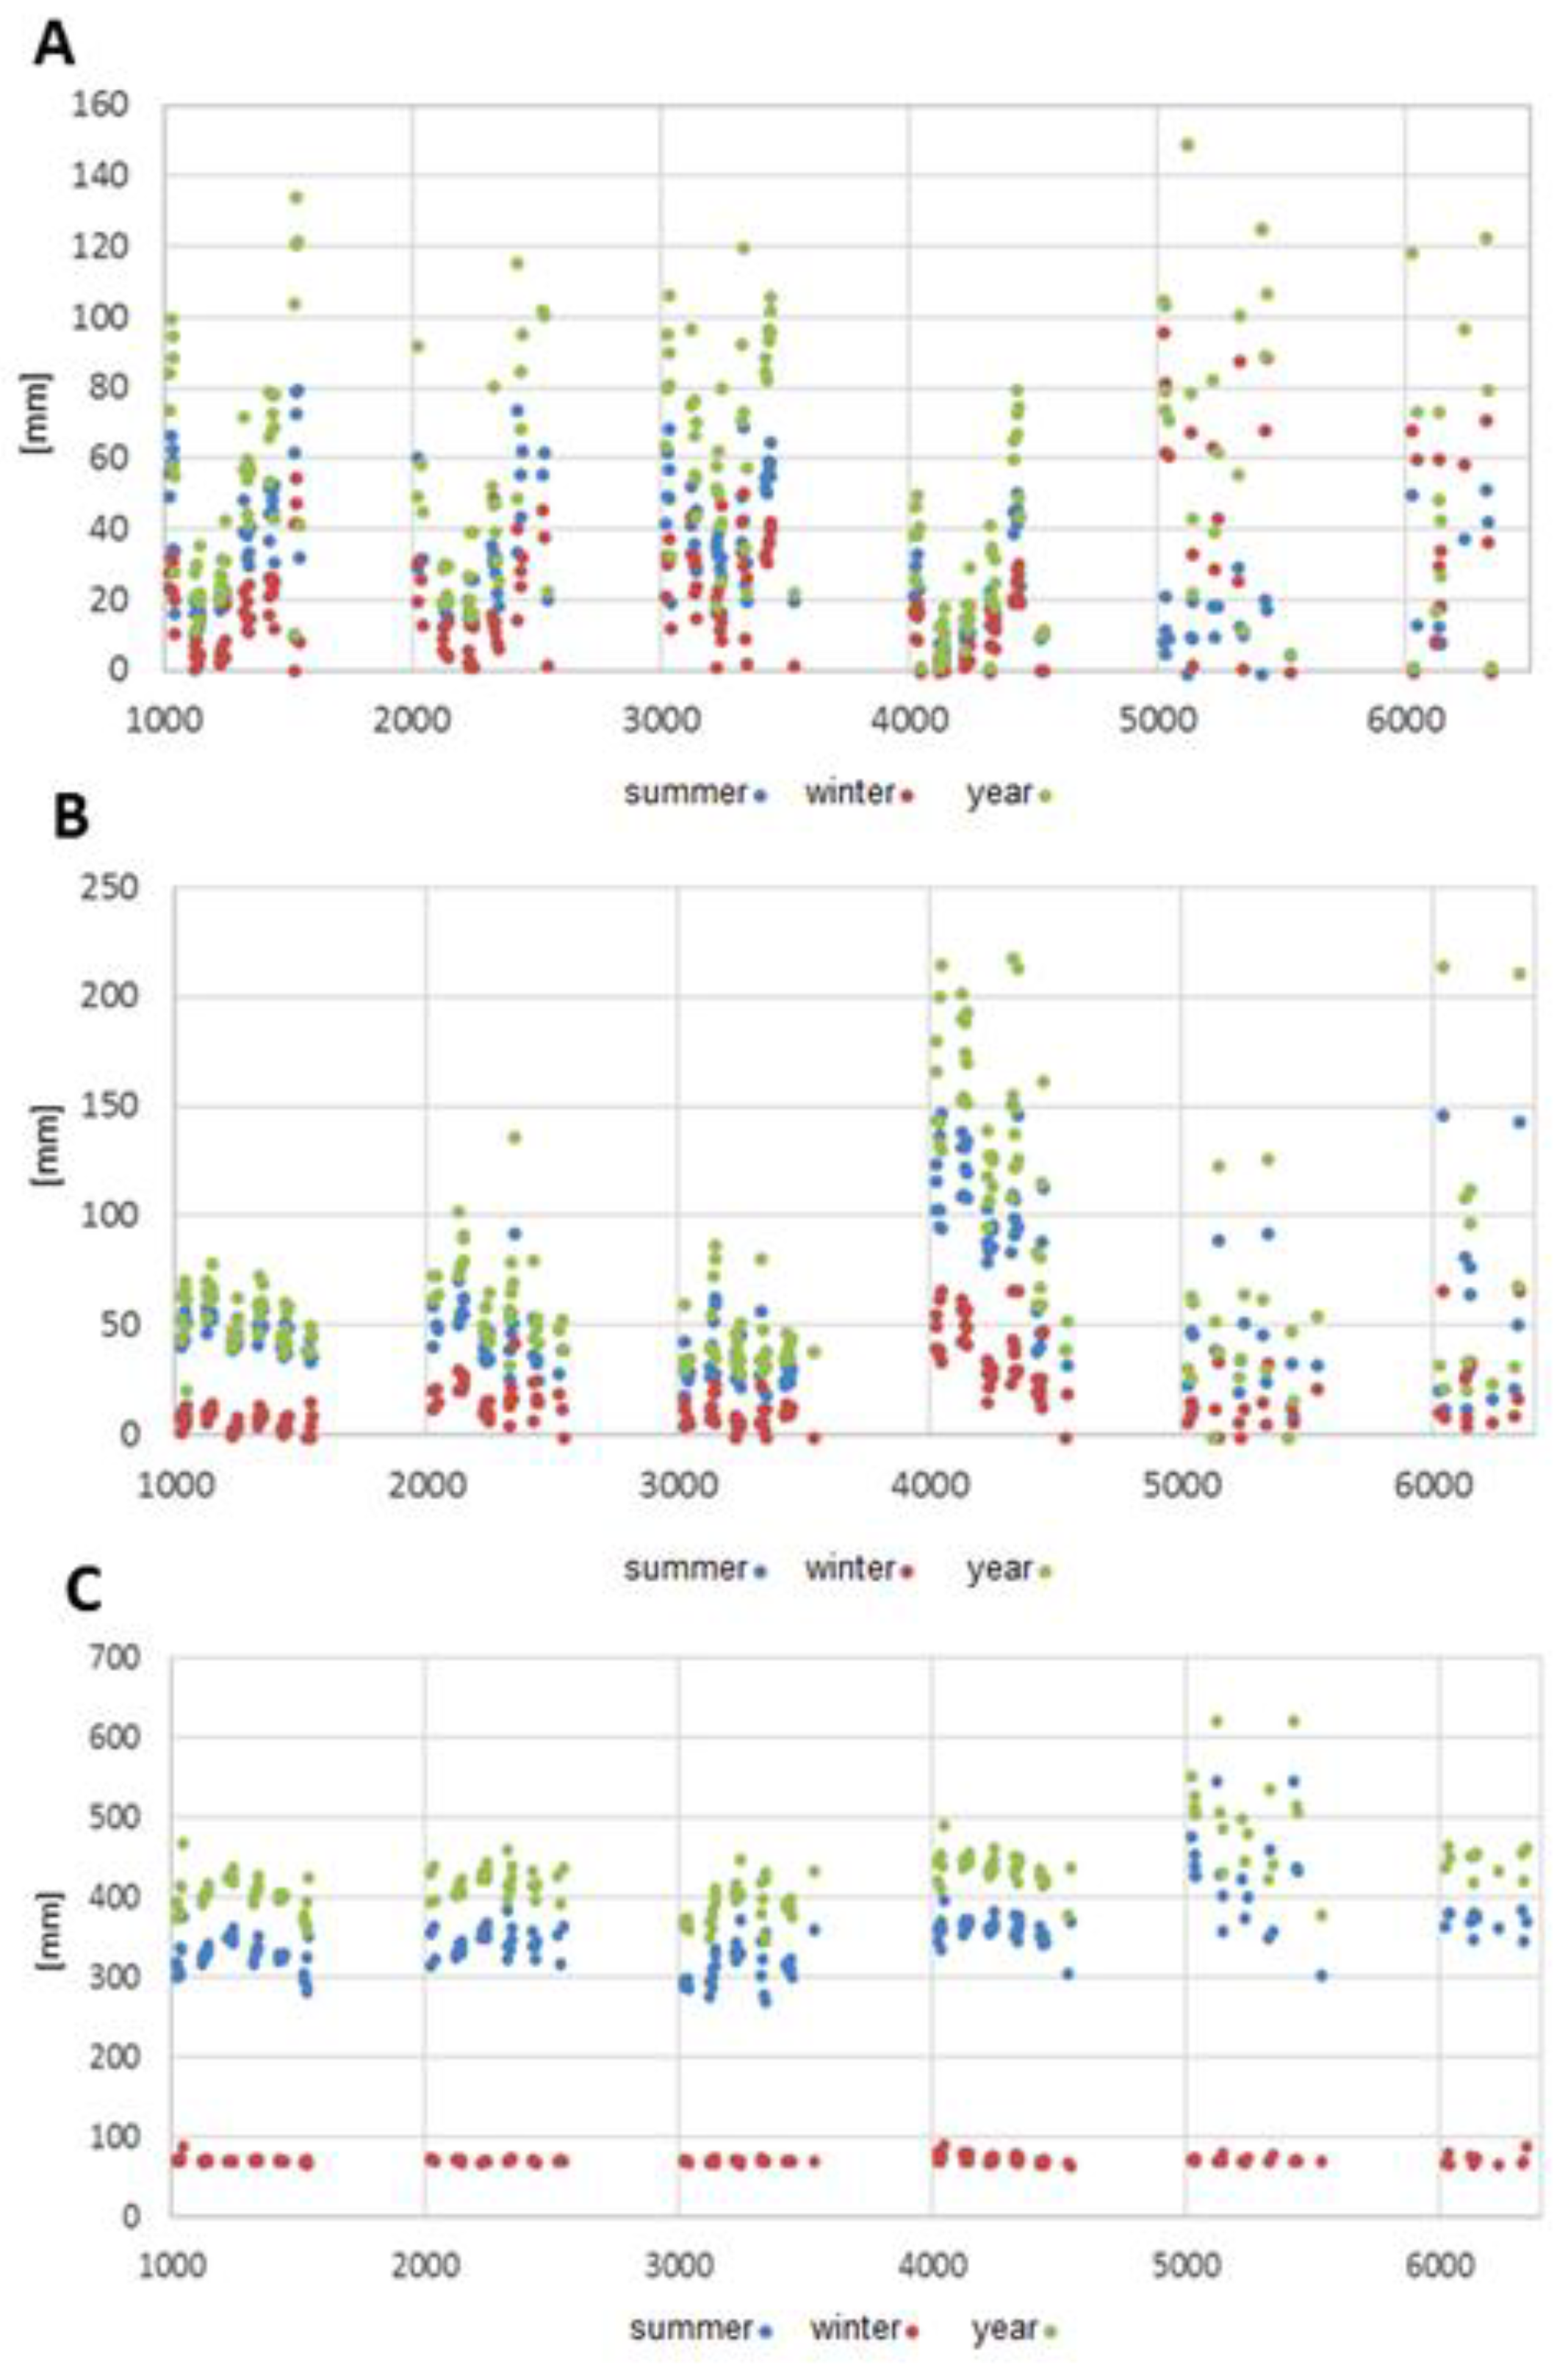
4.3. Seasonal Analysis of Water Balance Components

The average annual precipitation for the researched catchment areas totalled approximately 529 mm, while the catchment areas of the Bogdanka River and the Junikowski Stream are characterised by the lowest supply potential within the boundaries of the city (Table 2). Slightly higher precipitation (535–543 mm) has been recorded in the northern part of Poznań [21]. The presence of distinct valley configurations of the Warta River and its tributaries generates water losses connected with an increase in the intensity of evapotranspiration, which is particularly visible in the water balance elaborated for the summer half-year period (Table 2), where the process of effective infiltration of precipitation does not occur or undergoes a strong reduction. In the winter, semi-annual period relations between components change in favour of effective infiltration through the reduction of evapotranspiration—at some points by more than 40–60% per annum—and surface runoff. The spatial model prepared for the summer half-year showed a uniform zone of negative effective infiltration values which indicates an absence of manifestation of this process, and the activation of evapotranspiration which in the season in question exceeds the amount of precipitation.
The analysis of components of the water balance has shown that a typical feature of the catchment areas of the Bogdanka River and the Junikowski Stream is the predominance of surface runoff over the infiltrative supply of groundwater under average annual conditions and in the summer half-year period (Table 2). The share of surface runoff in the structure of the water balance in municipal catchment areas totals some 13–15%, which is a value decidedly higher than the results obtained in the WetSpass model for catchment areas in peripheral zones of Poznań, where this value does not exceed 5–6% [14].

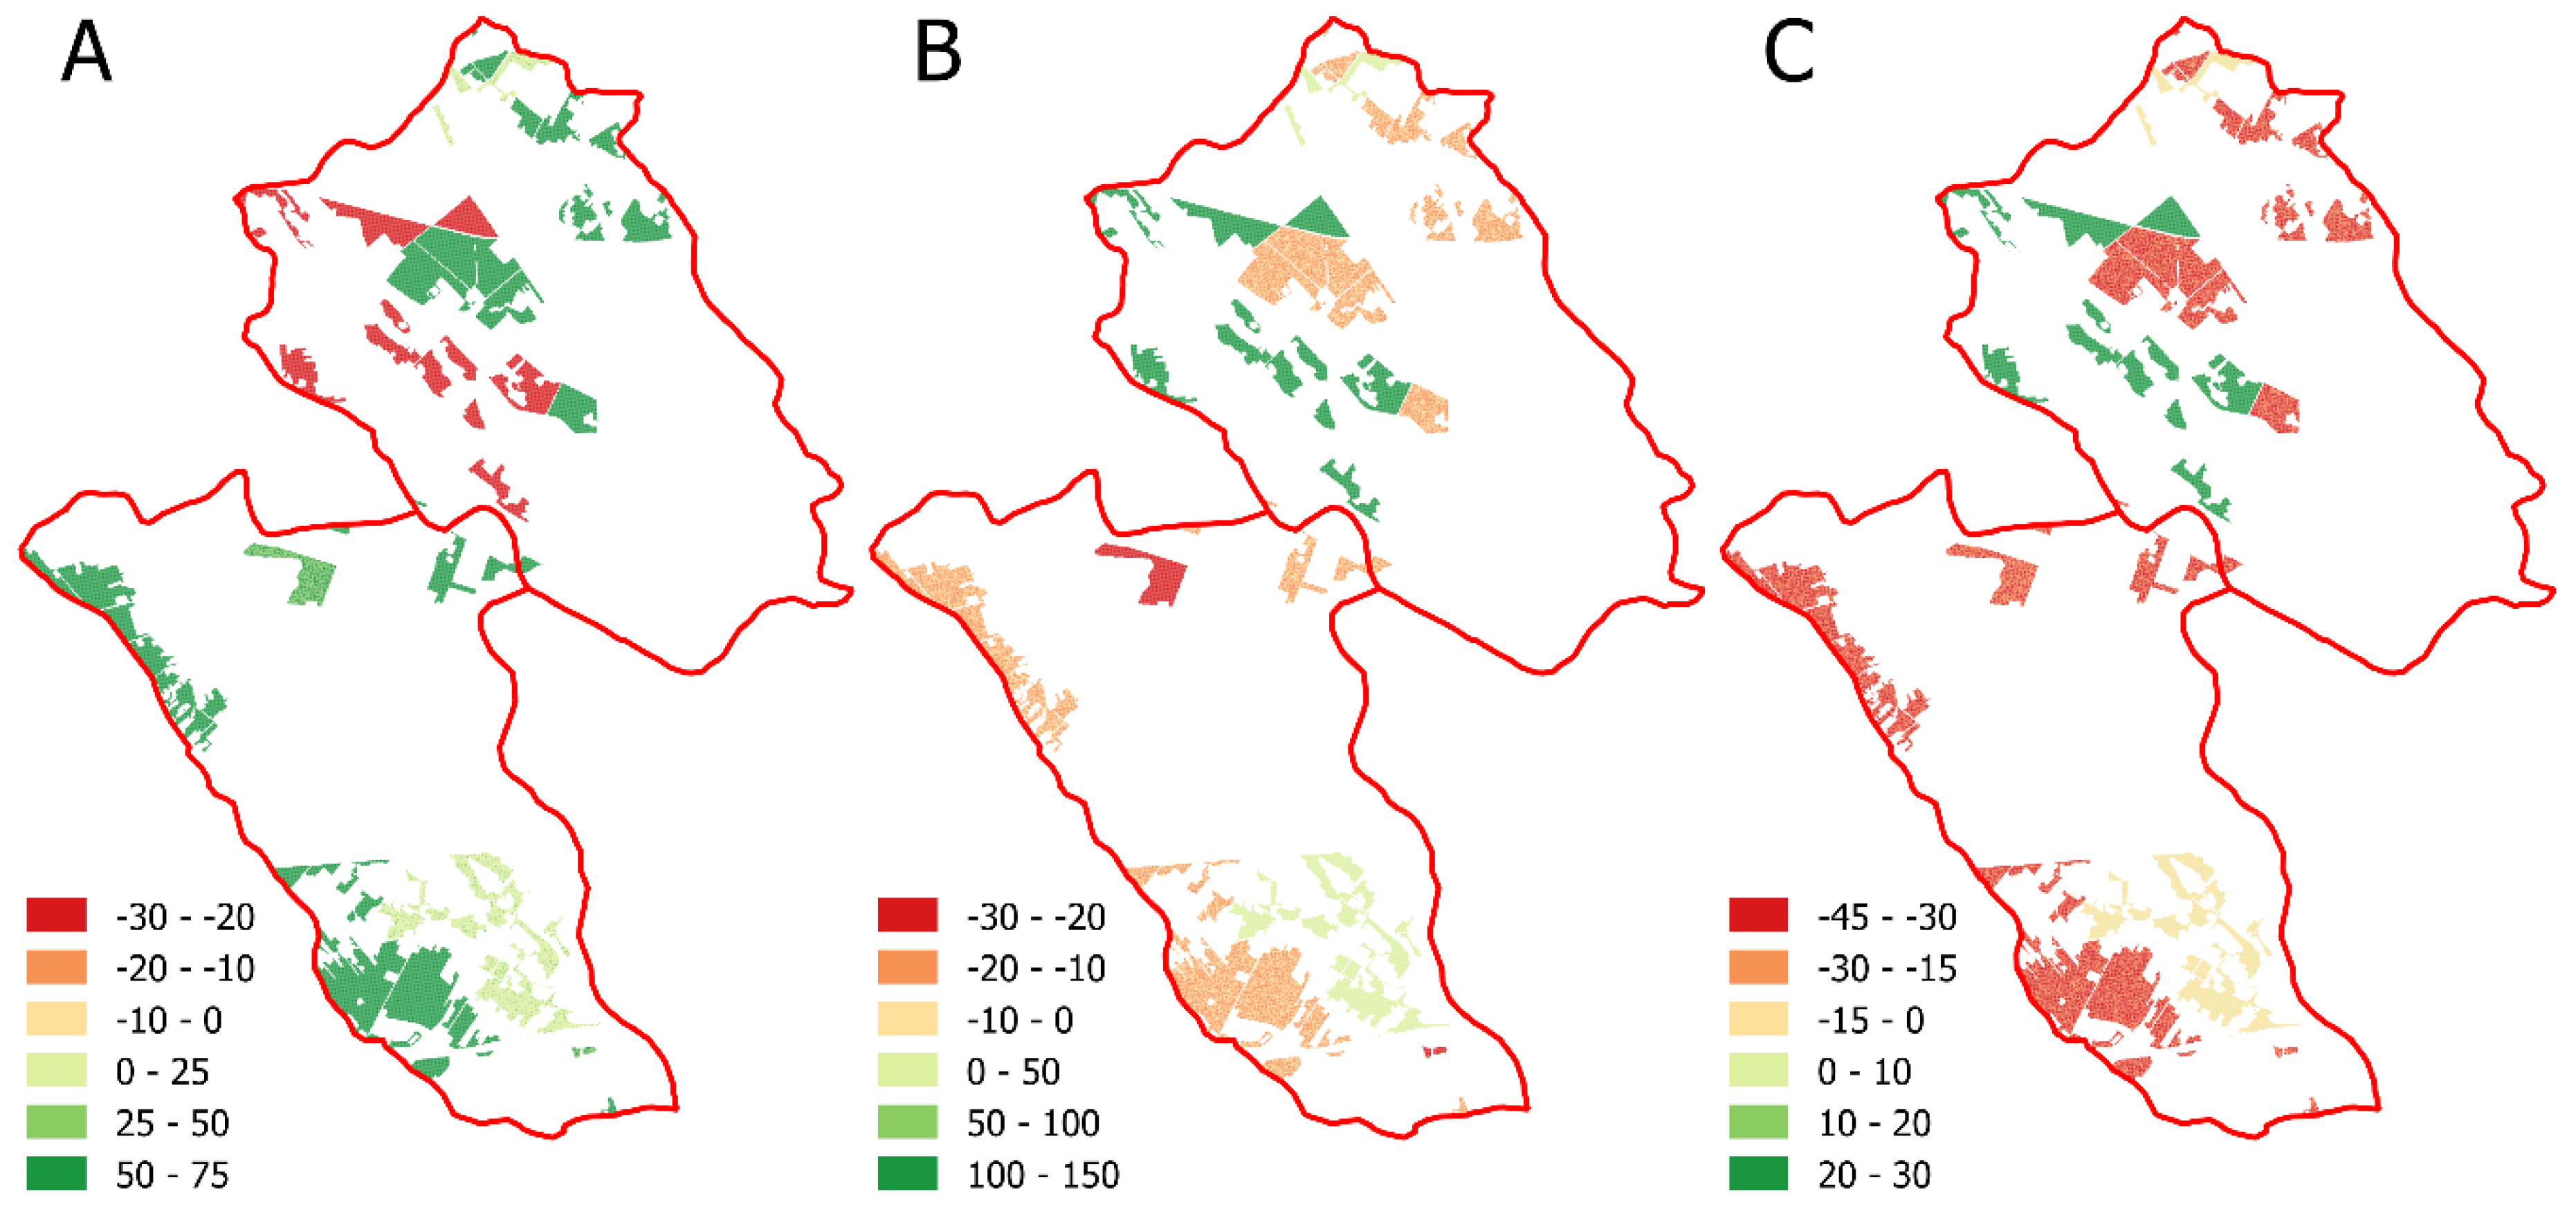
4.4. Spatial Analysis of Water Balance Components

As regards the analysed catchment areas, zones with surface runoff equal to and greater than 80 mm (mm/raster cell) occupy around 30–40% of their surface (Figure 7). In suburban catchment areas of Poznań with a considerable share of forest complexes (e.g., inflow from Łysy Młyn and the Wirynka River), surfaces generating a surface runoff of up to 10 mm are predominant [21].
An analysis of the spatial distribution of average annual values of components attributed to an individual balance cell in raster models has shown their diversification. The surface runoff varies between 0.92–252.9 mm (catchment area of the Bogdanka River) and 0.91–208.1 mm (catchment area of the Junikowski Stream), and a smaller range of diversification is observed in the summer and winter half-year periods (Table 3). Under average conditions, the mean annual infiltration of precipitation specified for a single raster in both catchment areas attained similar values, within the range of 0–163 mm in the catchment area of the Bogdanka River and 0–157 mm in the catchment area of the Junikowski Stream. Evapotranspiration changes in balance cells within the range of 275–630 mm for average conditions during the annual and semi-annual period. In the winter season, evaporation attains low values, under 100 mm, and the degree of variability between the minimum value and the maximum value is also small (Table 3).
The results of simulations conducted using the WetSpass models have confirmed that the lowest runoff values (under 60 mm) occurred in forest areas (code 4-0-0-0) (Figure 8A), while the most compact zones, predestined to its occurrence, are the urbanised areas (code 3-0-0-0). A high surface runoff may also form in zones of open water surfaces [1,12,14], an example of which are the municipal catchment areas of Poznań.
Comparisons of the water balance of the catchment areas of the Bogdanka River and the Junikowski Stream for the winter semi-annual period show the predominance of effective infiltration over surface runoff (Table 2). The relationship between water balance components (semi-annual period) manifest itself in decrease in the volume of effective infiltration and evapotranspiration reduction at some points by more than 50% per annum. The share of the analysed component in the water balance totalled 48–50%. In the summer season, when precipitation is greater than in the winter semi-annual period (frequently by some 50%) and air temperature increases, a reduction of effective infiltration in relation to the annual value is observed (Table 2). A decrease in or indeed the complete lack of infiltrative supply of groundwater in the summer is particularly noticeable in zones where these waters drain into the valley (zones of valley depressions), which is connected with the high transpiration of plants in areas with a shallow water level [2,5,23].
The effective infiltration of precipitation, calculated using the WetSpass model, attained the highest values in forested areas (code 4-0-0-0) (Figure 8B). This concerns both the average annual value, and values calculated for both semi-annual periods. It is confirmed by the considerable predisposition of forest complexes to generate an infiltrative supply of groundwater [1,6,14,22]. In the catchment areas of the Bogdanka River and the Junikowski Stream, the lowest (under average conditions) effective infiltration of precipitation (less than 100 mm for xy = 4 m2) were observed for. There was determined for arable soil surfaces with a varying degree of permeability and varying declivities, and a diverse depth of groundwater. As regards the highly sealed soils of both catchment areas, the reduction of infiltration takes place at the expense of increased surface runoff (Figure 7).
In the structure of the water balance for the entire year, total evapotranspiration in the catchment areas of the Bogdanka River and the Junikowski Street accounts for 74–76% of losses (Table 2). Relations between the quantity of water effectively supplying groundwater and the magnitude of surface runoff undergo change. In the winter semi-annual period, the share of evapotranspiration in the outgoing part of the water balance for the researched catchment areas amounts to 36–37%, whereas in the summer half-year period it exceeds the total amount of precipitation, thereby contributing to an increase in water shortages (Table 2). A comparison of the magnitude of evaporation in both semi-annual periods has shown that it increases in the summer by some 75–78% in relation to the cooler half-year period. As regards the reference surface of the catchment areas, evapotranspiration attained the highest values in open water surfaces (code 5-0-0-0), and also in waterlogged and forested areas (Figure 8C). In the valleys of the Bogdanka River and the Junikowski Stream these values attain >500 mm. The increase in the degree of humidification of soils in river valley zones is conducive to evapotranspiration, whereas the excessively dried organic soils may locally form zones conducive to infiltration [2,3,38,39]. Annual evapotranspiration is accounted for in more than 55% by transpiration dominant in zones overgrown with vegetation, whereas lesser importance is attached to evaporation from bare soil, and interception and evaporation from surfaces with weak permeability, which is emphasised among others in research conducted by [1,14].

4.5. Changes of Water Balance Components Due to Land Use Changes

The increase of urbanization (by 11.3% for the Junikowski Stream and 7.5% for the Bogdanka catchment) contributes to the annual effective infiltration decrease by ca. 1% (a few mm) compared to the reference data (1961–2000) at the expense of a slight increase in the share of surface runoff in the total water balance (also about 1%) (Table 2). Similar changes in the share of individual components are recorded in the water balance calculated for the winter and summer half-year periods. In the summer half-year period, in the absence or reduction of groundwater infiltration process, the relationship between runoff and evapotranspiration changes.
In the simulation taking into account land use changes, differences in the spatial distribution of water balance components are observed (Figure 9). The biggest changes in the spatial distribution of surface runoff in the Bogdanka catchment concern its upper and middle parts. Areas with a decrease of about 20–30 mm/HRU and areas with an increase in the discussed component in the range of 50–75 mm/HRU are shown. This is the effect of transformation of arable areas into urbanized areas (first variant) and arable areas into grassland (second variant). Changes of the land use structure in the Junikowski Stream catchment (Figure 9A) will contribute to the increase in the surface runoff volume up to 50–75 mm/HRU. This is the effect of the development of land at the expense of reduced of agricultural activity and urban greenery. In the catchment of Bogdanka, the largest changes of infiltration will concern the upper and middle part of the catchment. The most commonly observed changes take place in areas with infiltration decrease up to 10 mm/HRU and areas with an increase in the range of 100–150 mm/HRU. In the first case, this is the effect of transformation of arable land into urbanized areas, and in the second one, -the effect of afforestation of the area at the expense of grassland (Figure 6). A small area is occupied by land with an increase in this component of up to 50 mm/HRU. In the Junikowski Stream catchment, changes in the land use are predicted mainly along its western border and may contribute to the reduction of effective infiltration by about 10 mm/HRU. The decrease in the discussed component (about 20–30 mm/HRU) was also visible in the northern part, in the area of the developing Smochowice and Krzyżowniki housing estates. In the central part of the catchment, in the area of post-mining tanks, the planned afforestation will increase the infiltration by about 50 mm/HRU (Figure 9B).
The disturbance of the relationship between groundwater infiltration and surface runoff is also reflected in spatial changes of evapotranspiration. In both catchments, evapotranspiration is expected to be reduced (by about 15–30 mm) (Figure 9C), due to conversion of arable land into forests, so-called afforestation or greenery management planned for the Bogdanka catchment (Figure 6). This will result in increased transpiration (increase by about 20–30%), whose share in the structure of total evaporation in forest complexes may constitute up to 55%. In the Junikowski Stream basin, evapotranspiration changes will also take place in the zone of direct impact of post-excavation water reservoirs, located in its southern part. It can be assumed that the creation of reservoirs at the turn of the 19th and 20th centuries contributed locally to the growth of evapotranspiration in this part of the catchment.
With the assumed variants of land use change in the study area, the relationship between the share of the hydrologically (biologically) active area and built-up areas will change. A higher rate of landscape changes will indicate continuous anthropogenic pressure on the hydrological conditions and disturbance of the relations between quasi-natural and strongly urbanized elements of urban space.

4.6. Evaluation of the Quality of the WetSpass Model
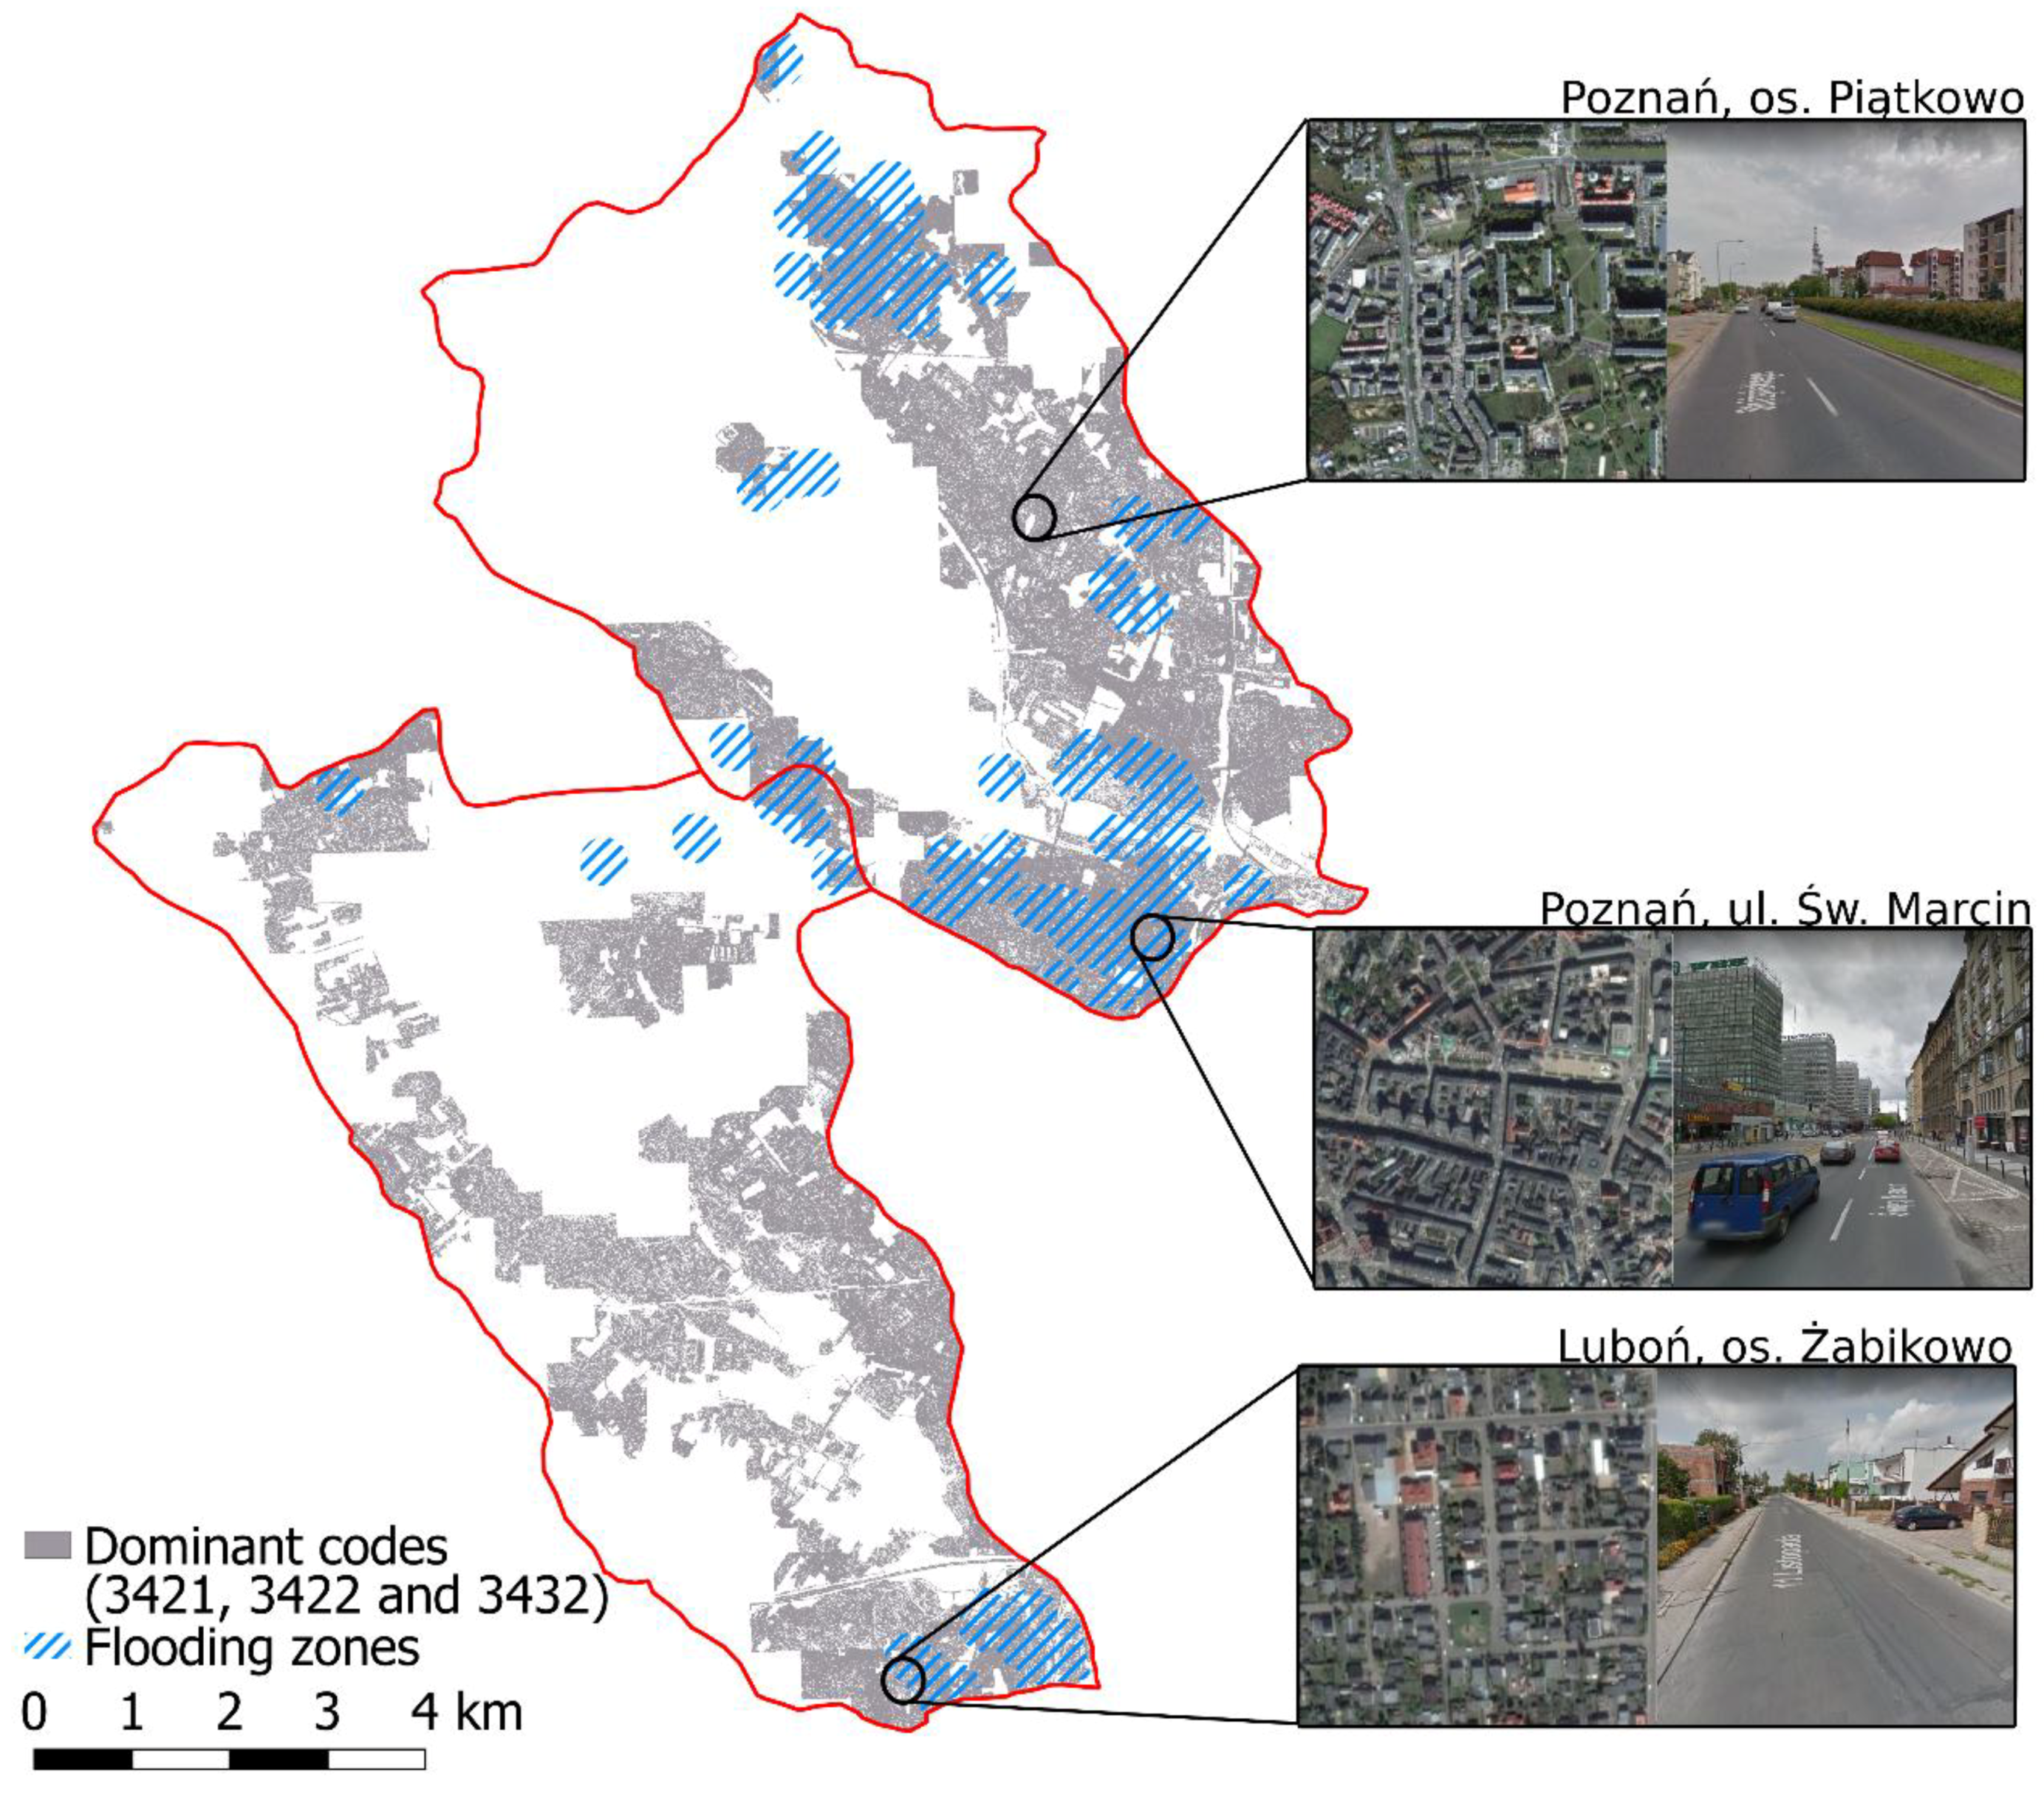
The image of the shallow groundwater depth (WetSpass model) was referred to the map of the Wielkopolska Lowland infiltration types and the water-table fluctuation method [40]. The effective infiltration coefficient which was determined in the model as the average value is reduced by about 30% (Bogdanka catchment) and 45% (the Junikowski Stream catchment), respectively, due to the possibility of infiltration decrease. The range of variability of extreme infiltration values is also changed. In built-up areas with diversified degrees of soil permeability, the precipitation infiltration coefficient obtains very low values, typical of clays areas, or no infiltration takes place. These areas showed high predisposition to generate surface runoff which is confirmed by results of another research [21,41]. The zones of high land sealing and diversified permeability in the Bogdanka and Junikowski Stream catchment are in agreement with the information obtained from the voluntary observations of the Poznań Flash Flood Project of the city of Poznań’s residents (Figure 5).
The results of the WetSpass model were also compared with the effect of hydrogeological modelling (groundwater filtration model) using the Processing MODFLOW for Windows PMWIN ver. 5.x ([42] www.pmwin.net) which was developed for the Poznan Plain [14]. In the groundwater filtration model, water circulation conditions are determined by the hydrodynamic state of the system as well as the zones of recharge and drainage. The effective infiltration module figure (WetSpass) were compared with the value of the underground drain to watercourses (drainage) obtained in the Processing MODFLOW (Table 4) which provides data on infiltration of effective precipitation and filtration parameters (ordinate of groundwater table, conductivity of the aquifer). In the assessment of the underground inflow into local water circulation systems, it was assumed that it originated in a large part from the infiltration inflows supply of shallow aquifers. In the investigated cases, groundwater drainage consists of water from effective infiltration (approximately 66%) and the underground inflow comes from outside of the catchment. The PMWIN models developed for the catchment were found to be reasonable, obtaining the compatibility reconstruction of the shallow groundwater table with an accuracy of 0.5 m [14].

4.7. Implications

The spatially distributed water balance model obtained through simulations performed using the WetSpass model is typical of catchment areas representing anthropogenic conditions of water circulation [14,34,36]. It was shown that the land usage is dominant factor which impacts all of the components of the water balance in the city, which is confirmed by prognostic studies. This factor is to the greatest degree dependent on human activity and may be freely regulated and adjusted [43]. This fact is confirmed by the results of other analyses conducted in the Poznań Upland region by [14,21]. Assuming that the development of the currently discussed zones is determined by an anthropogenic factor, an analysis of changes in the frequency of their occurrence will be of great significance for prognostic research into changes in the water balance in municipal catchment areas. Detached buildings, which occupy some 45.5% of the surface, are usually located on the peripheries of Poznań, where there is a large concentration of agricultural lands and areas earmarked for industrial development. Spatial analyses of the components of the water balance of the urbanised catchment areas of the city of Poznań have demonstrated—and this is particularly true of its centre—the low share of zones with a predominance of the precipitation retention and infiltration process, which serve to shape the magnitude of soil outflow and its relations with surface runoff [1,21].
The increasing degree of urbanisation of the municipal space of Poznań is bringing about the destruction of natural water flow directions and making it singularly difficult for the city itself (and its transport system in particular) to function. Especially visible changes—connected with the uncontrolled displacement of the natural function by the residential function—are taking place in the vicinity of river valleys, among others those of the Bogdanka River and the Junikowski Stream, as a result of the city’s intense growth and the dynamism of urban development processes.

5. Summary and Conclusions

The distribution of components of the water balance and zones with a dominant hydrological process obtained for the catchment areas of the Bogdanka River and the Junikowski Stream closely reflects the state of the city’s spatial management. Two factors were recognised as being of fundamental importance for determining the course of hydrological processes in municipal catchment areas: the structure of land cover and the diversity of soil permeability, with particular consideration being given to the degree of soil sealing. The method of usage and management of municipal systems considerably disturbs the relations between surface runoff and the infiltrative supply of groundwater.
Considerable density of sealed surfaces is typical of the built-up areas in the city centre, which are predisposed to the generation of surface runoff. As regards areas with detached buildings, with a large concentration of agricultural lands and areas earmarked for industrial development, the value of the runoff coefficient also depends on how the land is covered with vegetation and its declivity. The peripheral areas of the abovementioned catchment, more strongly forested, are predisposed to retaining approximately 80% of precipitation and thereafter generating the infiltrative supply of groundwater, which is greater in these areas than in the case of any other type of land usage. Assuming that the development of the currently discussed zones is determined by an anthropogenic factor, an analysis of changes in the frequency of their occurrence will be of great significance for prognostic research into changes in the water balance in municipal catchment areas. Consequently, it may result in the development of new and rare combinations of HRU codes and physiographic features of catchment areas, due to the direction of local anthropogenic influences.
Controlling land usage in municipal space may impact the accretion of urbanised areas or lead to an increase in biologically active surfaces [44,45]. It is important to preserve the hydrological stability of the area, and to compensate the loss of natural areas—as is the case of Bogdanka catchment. The increasing degree of urbanisation of the municipal space of Poznań is bringing about the destruction of natural water flow directions and making it singularly difficult for the city itself (and its transport system in particular) to function. Especially visible changes—connected with the uncontrolled replacement of the natural function by the residential function—are taking place in the vicinity of river valleys, among others those of the Junikowski Stream, as a result of the city’s intense growth and the dynamism of urban development processes. As was shown in the analysis, rational and sustainable development changes are of key importance for the preservation of hydrological homeostasis, therefore it is necessary to adapt the city to the ongoing climate changes.
The identification of the structure of the active surface of two urbanised catchment areas—of the Bogdanka River and the Junikowski Stream—has made it possible to distinguish local factors affecting the circulation of water, which may be useful in planning the spatial development of municipal areas and protecting the natural qualities of the city of Poznań.
The thematic databases developed for the catchment allow for significant improvement of water management and provide the basis for assessing the degree of integration of the water management system in the city. The strategy of integrated water management allows creating and maintaining proper relations among the objectives of water management, water resources and changing external conditions (environmental and climatic conditions). These possibilities are created by the proposed model which defines the spectrum of physiographic factors of urban catchments which shape the water balance. The results may be used in planning scenarios of changes in the urban hydrological system which will define their efficiency and resilience as well as the demographic and climatic changes. With the spatial data on water balance and the relationship between its components and environmental factors available, city decision-makers will have a real opportunity to improve urban planning owing to understanding the interactions of water with other sectors and increasing the resilience of the city system to climate change.

Author Contributions

R.G. supervised, led and conceptualized the research; collected, analysed data and drafted the manuscript; contributed in manuscript improvement. K.J. processed and analysed data; helped in data write-up; contributed in manuscript improvement; prepared Figures.

Funding

The present paper is the result of research on the water balance of urbanised catchment with GIS modelling methods, carried out as part of statutory research at the Department of Hydrology and Water Management of the Adam Mickiewicz University in Poznań, Poland.

Acknowledgments

We would like to thank all reviewers for their valuable comments and constructive suggestions.

Conflicts of Interest

The authors declare no conflict of interest.

References

  1. Batelaan, O. Phreatology: Characterizing Groundwater Recharge and Discharge Using Remote Sensing, GIS, Ecology, Hydrochemistry and Groundwater Modeling. Ph.D. Thesis, Vrije Universiteit Brussels, Belgium, 2006; pp. 1–332. [Google Scholar]
  2. Batelaan, O.; De Smedt, F. WetSpass: A Flexible, GIS Based, Distributed Recharge Methodology for Regional Groundwater Modeling. In Impact of Human Activity on Groundwater Dynamics; Gehrels, H., Peters, J., Hoehn, E., Jensen, K., Leibundgut, C., Griffioen, J., Webb, B., Zaadnoordijk, W.J., Eds.; IAHS: Maastricht, The Netherlands, 2001; Volume 269, pp. 11–17. [Google Scholar]
  3. Jackson, T.J. Remote Sensing of Soil Moisture: Implications for Groundwater Recharge. Hydrogeol. J. 2002, 10, 40–51. [Google Scholar] [CrossRef]
  4. Sophocleous, M.A. Groundwater Recharge Estimation and Regionalization: The Great Bend Prairie of Central Kansas and Its Recharge Statistics. J. Hydrol. 1992, 137, 113–140. [Google Scholar] [CrossRef]
  5. Sophocleous, M.A. Groundwater Recharge and Sustainability in the High Plains Aquifer in Kansas, USA. Hydrogeol. J. 2005, 13, 351–365. [Google Scholar] [CrossRef]
  6. Thangarajan, M. Groundwater Resource Evaluation, Augmentation, Contamination, Restoration, Modeling and Management; Jointly published with Capital Publishing Company; Springer: Cham, The Netherlands, 2007; Volume 10. [Google Scholar]
  7. Von Asmuth, J.R.; Maas, C. The Method of Impulse Response Moments: A New Method Integrating Time Series, Groundwater and Eco-Hydrological Modeling. In Impact of Human Activity on Groundwater Dynamics; Geherls, J.C., Peters, N.E., Hoehn, E., Jensen, K., Leibundgut, C., Griffioen, J., Webb, B., Zaadnoordijk, W.J., Eds.; IAHS Publication: Wallingford, UK, 2001; pp. 51–58. [Google Scholar]
  8. De Boers, D.K. Linking GCMs and Surface Hydrology: The Challenge of Spatial Scale. Can. Geogr. 2001, 45, 79–84. [Google Scholar]
  9. Dillon, P.; Simmers, I. Shallow Groundwater Systems, IAH International Contributions to Hydrogeology; Taylor and Francis: Rotterdam, The Netherlands, 1998; p. 18. [Google Scholar]
  10. Schwartz, F.W.; Zhang, H. Fundamentals of Ground Water. Environ. Geol. 2004, 45, 1037–1038. [Google Scholar]
  11. Sivapalan, M. Pattern, Process and Function: Elements of a Unified Theory of Hydrology at the Catchment Scale. In Encyclopedia of Hydrological Sciences. P. 1. Theory, Organization and Scale; John Wiley & Sons: London, UK, 2005; pp. 193–219. [Google Scholar]
  12. Sorooshian, S.; Hsu, K.L. Hydrological Modelling and the Water Cycle; Springer: Berlin/Heidelberg, Germany, 2008. [Google Scholar]
  13. Behzadian, K.; Kapelan, Z. Advantages of Integrated and Sustainability Based Assessment for Metabolism Based Strategic Planning of Urban Water Systems. Sci. Total Environ. 2015, 527, 220–231. [Google Scholar] [CrossRef] [PubMed] [Green Version]
  14. Graf, R. The Structure and Functioning of Local Groundwater Circulation Systems within the Poznań Plateau; Bogucki Publishing House: Poznań, Poland, 2012. (In Polish) [Google Scholar]
  15. Gutry-Korycka, M. The Scale in the Mathematical Modelling of Geoecosystems. Glob. Chang. 2002, 9, 11–29. [Google Scholar]
  16. Lin, H.; Rathbun, S. Hierarchical Frameworks for Multiscale Bridging in Hydropedology. In Scaling Methods in Soil Physics; Pachepsky, Y., Radcliffe, D.E., Selim, H.M., Eds.; CRC Press: Boca Roton, FL, USA, 2003; pp. 347–371. [Google Scholar]
  17. Long, J.; Nelson, T.; Wulder, M. Regionalization of Landscape Pattern Indices Using Multivariate Cluster Analysis. Environ. Manag. 2010, 46, 134–142. [Google Scholar] [CrossRef] [PubMed] [Green Version]
  18. Vansteenkiste, T.; Tavakoli, M.; Ntegeka, V.; Willems, P.; De Smedt, F.; Batelaan, O. Climate Change Impact on River Flows and Catchment Hydrology: A Comparison of Two Spatially Distributed Models. Hydrol. Process. 2013, 27, 3649–3662. [Google Scholar] [CrossRef]
  19. Neitsch, S.L.; Arnold, J.G.; Kiniry, J.R.; Williams, J.R. Soil and Water Assessment Tool. Theoretical Documentation; Springer: Berlin, Germany, 2005. [Google Scholar]
  20. Neitsch, S.; Arnold, J.G.; Kiniry, J.R.; Williams, J. Soil & Water Assessment Tool Theoretical Documentation Version 2009; Technical Report, No. 406; Texas Water Resources Institute: College Station, TX, USA, 2011. [Google Scholar]
  21. Graf, R. Spatial Differentiation of Surface Runoff in Urbanised Catchments on the Example of Poznan. In Water in the City; Ciupa, T., Suligowski, R., Eds.; UJK Kielce Publishing House: Kielce, Poland, 2014. (In Polish) [Google Scholar]
  22. Graf, R.; Kajewski, I. The Forming of the Water Balance Elements in the Mogilnica Catchment Basis of Simulating Investigations. Sci. Nat. Technol. 2013, 7, 1–11. (In Polish) [Google Scholar]
  23. Graf, R.; Przybyłek, J. Estimation of shallow groundwater recharge using a GIS-based distributed water balance model. Quaest. Geogr. 2014, 33, 27–37. [Google Scholar] [CrossRef]
  24. Kajewski, I. Assessment of regional water balance components with WetSpass model. Adv. Agric. Sci. Probl. 2008, 528, 63–70. (In Polish) [Google Scholar]
  25. Pokojska, P. Application and verification of water balance model with distributed parameters (On the example of Rega River Basin). Misc. Geogr. Wars. 2004, 11, 139–149. [Google Scholar]
  26. Abu-Saleem, A.; Al-Zu’bi, Y.; Rimawi, O.; Al-Zu’bi, J.; Alouran, N. Estimation of water balance components in the Hassa Basin with GIS based WetSpass Model. J. Agron. 2010, 9, 119–125. [Google Scholar]
  27. Aish, A.M.; Batelaan, O.; De Smedt, F. Distributed recharge estimation for groundwater modeling using Wetspass model, case study—Gaza strip, Palestine. Arabian J. Sci. Eng. 2010, 35, 155–163. [Google Scholar]
  28. Al Kuisi, M.; El-Naga, A. GIS based spatial groundwater recharge estimation in the Jafr Basin, Jordan—Application of WetSpass models for arid regions. Revista Mexicana de Ciencias Geológicas 2013, 30, 96–109. [Google Scholar]
  29. Asfaw, M.G. Groundwater Recharge and Water Balance Assessment in Geba Basin, Tigray, Ethiopia. Master’s Thesis, IUPWARE, Vrije Universiteit Brussel, Katholieke Universiteit Leuve, Leuven, Belgium, 2005. [Google Scholar]
  30. Batelaan, O.; Woldeamlak, S.T. Arcview Interface for WetSpass; Version 13-06-2007; Department of Hydrology and Hydraulic Engineering Vrije University: Brussels, Belgium, 2007. [Google Scholar]
  31. FAO Penman–Monteith. Crop Evapotranspiration—Guidelines for Computing Crop Water Requirements; FAO Irrigation and Drainage Paper, 56; FAO: Rome, Italy, 1998; Available online: http://www.fao.org/docrep/X0490E/X0490E00.htm (accessed on 10 September 2017).
  32. Szyga-Pluta, K.; Grześkowiak, K. Pluvial conditions in Poznań in the years 1981–2015. Physiographic research, VII—Series A—Physical Geography (A67). 2016. (In Polish) [Google Scholar] [CrossRef]
  33. Akan, A.O.; Houghtalen, R.J. Urban Hydrology, Hydraulics, and Stormwater Quality: Engineering Applications and Computer Modeling; Wiley: Hoboken, NJ, USA, 2003. [Google Scholar]
  34. Cheng, S.; Wang, R. An Approach for Evaluating the hydrological effects of urbanization and its application. Hydrol. Process. 2002, 16, 1403–1418. [Google Scholar] [CrossRef]
  35. Gutry-Korycka, M. Discharge from Urbanized Catchments. Prace i Studia Geograficzne 2007, 38, 37–56. (In Polish) [Google Scholar]
  36. Haase, D. Effects of Urbanisation on the water balance—A long-term trajectory. Environ. Impact Assess. Review 2009, 29, 211–219. [Google Scholar] [CrossRef]
  37. Jokiel, P. Land Development and Its Role in Water Circulation on the Example of a Small Catchment in the Suburban Area of Łódź; Prace Instytutu Geografii AŚ: Kielce, Poland, 2002; Volume 7, pp. 77–86. (In Polish) [Google Scholar]
  38. Hart, D.J.; Schoephoester, P.R.; Bradbury, K.R. Groundwater recharge in Dane County, Wisconsin: Estimating recharge using a GIS-based water-balance model. Wis. Geol. Nat. Hist. Surv. Bull. 2012, 107, 11. [Google Scholar]
  39. Teklebirhan, A.; Dessie, N.; Tesfamichael, G. Groundwater recharge, evapotranspiration and surface runoff estimation using wetspass modeling method in Illala catchment, northern Ethiopia. Momona Ethiop. J. Sci. (MEJS) 2012, 4, 96–110. [Google Scholar]
  40. Żurawski, M. An Attempt to Isolate the Infiltration Types of the Wielkopolska Lowland; Works of the Geographic and Geological Commission; PTPN: Kuala Lumpur, Malaysia, 1966; Volume 6, pp. 1–53. (In Polish) [Google Scholar]
  41. Jawgiel, K. Application of the VGI Observation in Urban Flash Flood Research on the Example of Poznań. In Proceedings of the Scientific and Technical Conference: Hydrology of the Urban Catchments, Warsaw, Poland, 22–23 September 2016; pp. 115–124. (In Polish). [Google Scholar]
  42. Chiang, W.H.; Kinzelbach, W. 3D-Groundwater Modeling with PMWIN; Springer: Berlin/Heidelberg, Germany; New York, NY, USA, 2001. [Google Scholar]
  43. Lee, J.G.; Heaney, J.P. Estimation of urban imperviousness and its impacts on storm water systems. J. Water Resour. Plan. Manag. 2003, 129, 419–426. [Google Scholar] [CrossRef]
  44. Marsh, W.M. Landscape Planning: Environmental Applications; John Wiley & Sons: Hoboken, NJ, USA, 2005. [Google Scholar]
  45. Krebs, G.; Rimpiläinen, U.M.; Salminen, O. How does imperviousness develop and affect runoff generation in an urbanizing watershed? Fenn.-Intern. J. Geogr. 2013, 191, 143–159. [Google Scholar] [CrossRef]
Figure 1. The Bogdanka River and Junikowski Stream catchment areas with selected physiographic parameters with reference to the city of Poznań.
Ijgi 07 00278 g001
Figure 2. Raster models elaborated for the catchment areas of the Bogdanka River and the Junikowski Stream as input data for the WetSpass model: (A) land usage (source: topographic object database 1:10,000; (B) permeability of soils (source: Hydrographic map of Poland 1:50,000); (C) topographical profile (source: LIDAR); (D) terrain declivity (source: LIDAR); (E) depth to the shallow groundwater level in the summer half-year period (source: Hydrographic map of Poland 1:50,000); and (F) depth to the shallow groundwater level in the winter half-year period (source: Hydrographic map of Poland 1:50,000).
Ijgi 07 00278 g002
Figure 3. Flow chart of main modelling stages.
Ijgi 07 00278 g003
Figure 4. Dominant codes (U-G-S-Z) allocated to the HRU reference surfaces in the Bogdanka River (A) and Junikowski Stream (B) catchment areas.
Ijgi 07 00278 g004
Figure 5. Anthropogenic terrain (dominant codes: 3422, 3421, and 3432) and registered flash flood phenomena brought about by rainstorms in the catchment areas of the Bogdanka River and the Junikowski Stream.
Ijgi 07 00278 g005
Figure 6. Directions of land use.
Ijgi 07 00278 g006
Figure 7. Surface distribution of the average values (mm) of: surface runoff (A); effective infiltration (B); and evapotranspiration (C) in raster models (xy = 4 m2) for the year in the Bogdanka River and the Junikowski Stream catchment areas—results of the WetSpass model (1961–2000).
Ijgi 07 00278 g007
Figure 8. The average annual: surface runoff (A); effective infiltration (B); and evapotranspiration (C) attributed to the structure of the reference surface (coded surface) in the Bogdanka River and Junikowski Stream catchment areas—results from the WetSpass model (1961–2000).
Ijgi 07 00278 g008
Figure 9. Surface distribution of the average changes of water balance components (mm/HRU): surface runoff (A); effective infiltration (B); and evapotranspiration (C) predicted for the year 2025 in the Bogdanka River and the Junikowski Stream catchment areas—results of the WetSpass model.
Ijgi 07 00278 g009
Table 1. Algorithm for coding the sequences of interconnections between diagnostic variables in the adopted classification schema. Order of denotations in the reference code: Usage, Soils (type and permeability class), Terrain declivity, groundwater level; according to Graf [14].
Land UsagePermeability1 Slope (<0.5°)2 Slope (0.5–2.5°)3 Slope (>2.5°)
1
ARABLE LAND
1 Good111111121113112111221123113111321133
2 Poor121112121213122112221223123112321233
3 Variable131113121313132113221323133113321333
4 Diversified141114121413142114221423143114321433
5 Very poor151115121513152115221523153115321533
2
GRASSLAND
1 Good211121122113212121222123213121322133
2 Poor221122122213222122222223223122322233
3 Variable231123122313232123222323233123322333
4 Diversified241124122413242124222423243124322433
5 Very poor251125122513252125222523253125322533
3
URBANISED AREA
1 Good311131123113312131223123313131323133
2 Poor321132123213322132223223323132323233
3 Variable331133123313332133223323333133323333
4 Diversified341134123413342134223423343134323433
5 Very poor351135123513352135223523353135323533
4
FOREST
1 Good411141124113412141224123413141324133
2 Poor421142124213422142224223423142324233
3 Variable431143124313432143224323433143324333
4 Diversified441144124413442144224423443144324433
5 Very poor451145124513452145224523453145324533
5
WATER
1 Good511151125113512151225123513151325133
2 Poor521152125213522152225223523152325233
3 Variable531153125313532153225323533153325333
4 Diversified541154125413542154225423543154325433
5 Very poor551155125513552155225523553155325533
6
WETLANDS
1 Good611161126113612161226123613161326133
2 Poor621162126213622162226223623162326233
3 Variable631163126313632163226323633163326333
4 Diversified641164126413642164226423643164326433
5 Very poor651165126513652165226523653165326533
GROUNDWATER LEVEL(1) 0–2 m(2) 2–5 m (3) >5 m
Codes that were not present in study catchments
Table 2. Components of the water balance of the catchment areas of the Bogdanka River and the Junikowski Stream for the annual period and the winter and summer semi-annual periods—results of the WetSpass model (1961–2000).
Base Version
Catchment Components of the Water Balance
YearWinter Semi-Annual PeriodSummer Semi-Annual Period
P *IEHpETPIEHpETPIEHpET
Bogdanka River(mm)52959694052011012773329−4242332
(%)100111376100501436100-12101
Junikowski Stream(mm)5285978394200963074327−3748320
(%)100111574100481537100-1598
+ Land Use Changes
Catchment Components of the Water Balance
YearWinter Semi-Annual PeriodSummer Semi-Annual Period
P *IEHpETPIEHpETPIEHpET
Bogdanka River(mm)52954714042011002873328−4643331
(%)100101376100501436100-13101
Junikowski Stream(mm)5285579394200953074328−4049320
(%)100101575100481537100-1597
+ Land Use and Climate Changes
Catchment Components of the Water Balance
YearWinter Semi-Annual PeriodSummer Semi-Annual Period
P *IEHpETPIEHpETPIEHpET
Bogdanka River(mm)54965774072071033272342−3444332
(%)100121474100501535100-1397
Junikowski Stream(mm)5486685397208973476340−3151321
(%)100121572100471737100-1594
* P—precipitation, IE—effective infiltration, HP—surface runoff, ET—evapotranspiration.
Table 3. Range of annual and seasonal (winter and summer semi-annual periods) variability of components of the outgoing part of the water balance (mm) for the Bogdanka River and Junikowski Stream catchment areas—results from the WetSpass model (mm).
Components of the Water BalanceSeasonBogdanka RiverJunikowski Stream
MinMaxRangeMeanσMinMaxRangeMeanσ
Surface runoff (HP)Year0.92252.9252.067.9470.91208.1207.276.855
Winter0.11126.1126.025.2230.13128.8128.729.227
Summer0.00148.2148.241.6280.00107.1107.147.233
Effective infiltration (IE)Year0.00163.2163.257.9350.00157.7157.758.742
Winter0.00139.9139.9103.2240.00138.2138.297.427
Summer107.228.4135.6-40.125-107.226.9134.1-34.231
Evapotranspiration (ET = E + T + Ic)Year275.2630.1354.9406.139285.9628.0342.1392.746
Winter60.391.531.272.4560.292.732.574.15
Summer200.2554.2354.0331.740217.5553.6336.1317.945
The data refer to individual raster cells xy = 4 m2.
Table 4. Results of the groundwater balance modelling in catchment (Processing Modflow PMWIN model), (mm).
CatchmentEffective Infiltration IE
By WetSpass
Underground InflowDrainageUnderground OutflowInflow Vector
Σz
Outflow Vector
Σo
Difference
Bogdanka River58.832.889.22.891.692.0−0.37
Junikowski Stream59.131.885.85.590.991.3−0.38

