Abaxial Greening Phenotype in Hybrid Aspen

1
Department of Biological Sciences, University of Toronto Scarborough, 1265 Military Trail, Toronto, ON, M1C 1A4, Canada
2
Botany Department, University of British Columbia, 3529-6270 University Blvd., Vancouver, BC, V6T 1Z4, Canada
*
Author to whom correspondence should be addressed.
Plants 2013, 2(2), 279-301; https://doi.org/10.3390/plants2020279
Submission received: 16 February 2013
/
Revised: 6 April 2013
/
Accepted: 18 April 2013
/
Published: 24 April 2013
(This article belongs to the Special Issue Leaf Development)
Abstract
:The typical angiosperm leaf, as in Arabidopsis, is bifacial consisting of top (adaxial) and bottom (abaxial) surfaces readily distinguishable by the underlying cell type (palisade and spongy mesophyll, respectively). Species of the genus Populus have leaves that are either conventionally bifacial or isobilateral. Isobilateral leaves have palisade mesophyll on the top and bottom of the leaf, making the two sides virtually indistinguishable at the macroscopic level. In poplars this has been termed the “abaxial greening” phenotype. Previous work has implicated ASYMMETRIC LEAVES1 (AS1) as an essential determinant of palisade mesophyll development. This gene, as well as other genes (84 in all) putatively involved in setting the dorsiventral axis of leaves, were investigated in two Populus species: black cottonwood (Populus trichocarpa) and hybrid aspen (P. tremula x tremuloides), representative of each leaf type (bifacial and isobilateral, respectively). Poplar orthologs of AS1 have significantly higher expression in aspen leaf blade and lower in the petiole, suggestive of a potential role in the isobilateral leaf phenotype consistent with the previously observed phenotypes. Furthermore, an ABERRANT TESTA SHAPE (ATS) ortholog has significantly lower expression in aspen leaf tissue, also suggesting a possible contribution of this gene to abaxial greening.
1. Introduction
The genus Populus consists of approximately 29 species [1] containing two main types of leaves: bifacial and isobilateral [2]. Bifacial leaves are usually dark green on the adaxial surface and have a light-colored abaxial surface. These types of leaves are commonly associated with a rigid rounded petiole, which allows the adaxial surface of the leaf to be exposed to the sun. The primary photosynthetic tissues, the palisade mesophyll, are associated with the adaxial surface in bifacial leaves, while the abaxial surface consists of spongy mesophyll that allow the scatter of light due to air spaces and therefore contribute to the lighter coloration. Isobilateral leaves, on the other hand, are more commonly found within the genus [2] and are more or less uniformly green on both adaxial and abaxial leaf surfaces, in contrast to bifacial-leaved species. The petiole of these isobilateral leaves is mediolaterally flattened and unifacial, allowing the leaves to flutter in the wind [3]. Both surfaces of isobilateral leaves are strongly chlorophyllous and palisade or palisade-like mesophyll cells are present on both adaxial and abaxial surfaces. The development of the lower mesophyll cells is variable, from cells almost identical to upper or adaxial palisade mesophyll cells to less elongated palisade-like cells (also termed “abaxial palisade”). This “abaxial greening” or “abaxial greenness” phenotype [4] is thought to contribute to overall carbon gain due to a more even light distribution throughout the tree, improved carbon dioxide fixation following exposure to short sunflecks through the canopy, and decrease in leaf temperature [5,6,7].
1.1. Molecular Genetics of Leaf Variation
The genetic basis of abaxial greening phenotype and the associated unifacial petiole in Populus has been investigated [4], but the molecular genetic basis has not. The abaxial greening phenotype was mapped onto two major quantitative trait loci (QTLs) [4], but the genes responsible for this phenotype were not investigated further. A recent study [8], however, discussed the involvement of several genes in vegetative phase change in leaves of Populus x canadensis (Populus nigra x deltoides). Vegetative phase change or heteroblasty involves the transition from juvenile to adult leaf morphology. The differences in morphology are not always evident, but they are more pronounced when leaves transition from bifacial to isobilateral types during the life of a plant (e.g., P. x canadensis) [8]. In this hybrid, and other isobilateral-leaved poplars (comprising slightly over half of the genus [1]), juvenile leaves are bifacial while the adult leaves are isobilateral. Wang et al. [8] showed that expression levels of squamosa protein binding-like (SPL) genes and their interacting small RNAs are altered during this phase transition. Gene expression patterns contributing to the differences in leaf morphologies between juvenile bifacial and adult isobilateral leaves have not been investigated.
1.2. Objectives
This study was undertaken to determine differences in the patterns of gene expression of bifacial leaves of Populus trichocarpa and isobilateral leaves of Populus tremula x tremuloides (black cottonwood and hybrid aspen, respectively). Hybrid aspen (henceforth “aspen”, except where European aspen, P. tremula, is specified) is used in this study because it is a commercially grown tree and a convenient model organism. The parent species are very closely related (considered subspecies by some authors) and the leaves of the parent species do not differ significantly in anatomy. The genes responsible for palisade and spongy mesophyll development are unknown in poplar, but due to the association of the isobilateral blade with a unifacial petiole in aspen, possible candidate genes are those responsible for setting adaxial–abaxial or dorsiventral polarity in leaves. ASYMMETRIC LEAVES1 (AS1) is one such gene involved in the dorsiventrality pathway. Loss-of-function (LOF) mutants in AS1 and its orthologs (such as PHANTASTICA in Antirrhinum) [9] vary in the extent of the polarity defects they cause, from minimal in Arabidopsis to severe in Antirrhinum. LOF mutations of AS1 orthologs in tomato and tobacco result in abaxialized phenotypes such as the development of a unifacial or abaxialized proximal region in leaves [10,11,12]. In tobacco, AS1 is critical to adaxial patterning, particularly for the formation of palisade mesophyll [11]. AS1 has also been implicated in vegetative phase change [13].
The objective of this study is, therefore, to sample a subset of candidate genes for dorsiventral polarity and investigate the overall differences in expression patterns between aspen and black cottonwood and their leaf blades, paving the way for a future study that can assess detailed expression patterns at the whole genome level and elucidate the genetic and developmental variation leading to the observed phenotypic differences in isobilateral and bifacial-leaved species. Since the aspen blade contains a greater abundance of those cell types that are characteristic of the adaxial surface (i.e., palisade mesophyll) in comparison to black cottonwood leaf blade, it can be predicted that aspen blade tissue will exhibit higher expression of some adaxial cell fate determining genes and/or lower expression of abaxial cell fate determining genes. The black cottonwood leaf blade has typical bifacial adaxial and abaxial anatomy, and therefore is expected to show standard adaxial–abaxial patterning and will be used a template for comparison.
In comparison to black cottonwood, aspen blade tissue may be expected to have higher expression of genes that are responsible for setting adaxial surface polarity due to the presence of adaxial type palisade cells at the abaxial side of the leaf and a decreased expression of some abaxial surface identity genes due to the absence of the spongy mesophyll cells at the abaxial surface. Marked overexpression of all adaxial identity genes (i.e., AE7 [AS1/AS2 ENHANCER 7], AS1/AS2, and others from Figure 1) would be unexpected due to the flatness of the leaf blade, which has clear and distinctive, dorsiventral polarity. If perturbations of the expression patterns of polarity genes were severe, the leaf blade would be malformed or unifacial either strongly adaxialized or abaxialized. A more likely scenario is therefore moderate differential expression of a small subset of abaxial and adaxial polarity genes in leaf blades between the two species. This is a scenario that can be tested against the results reported here.
Figure 1.
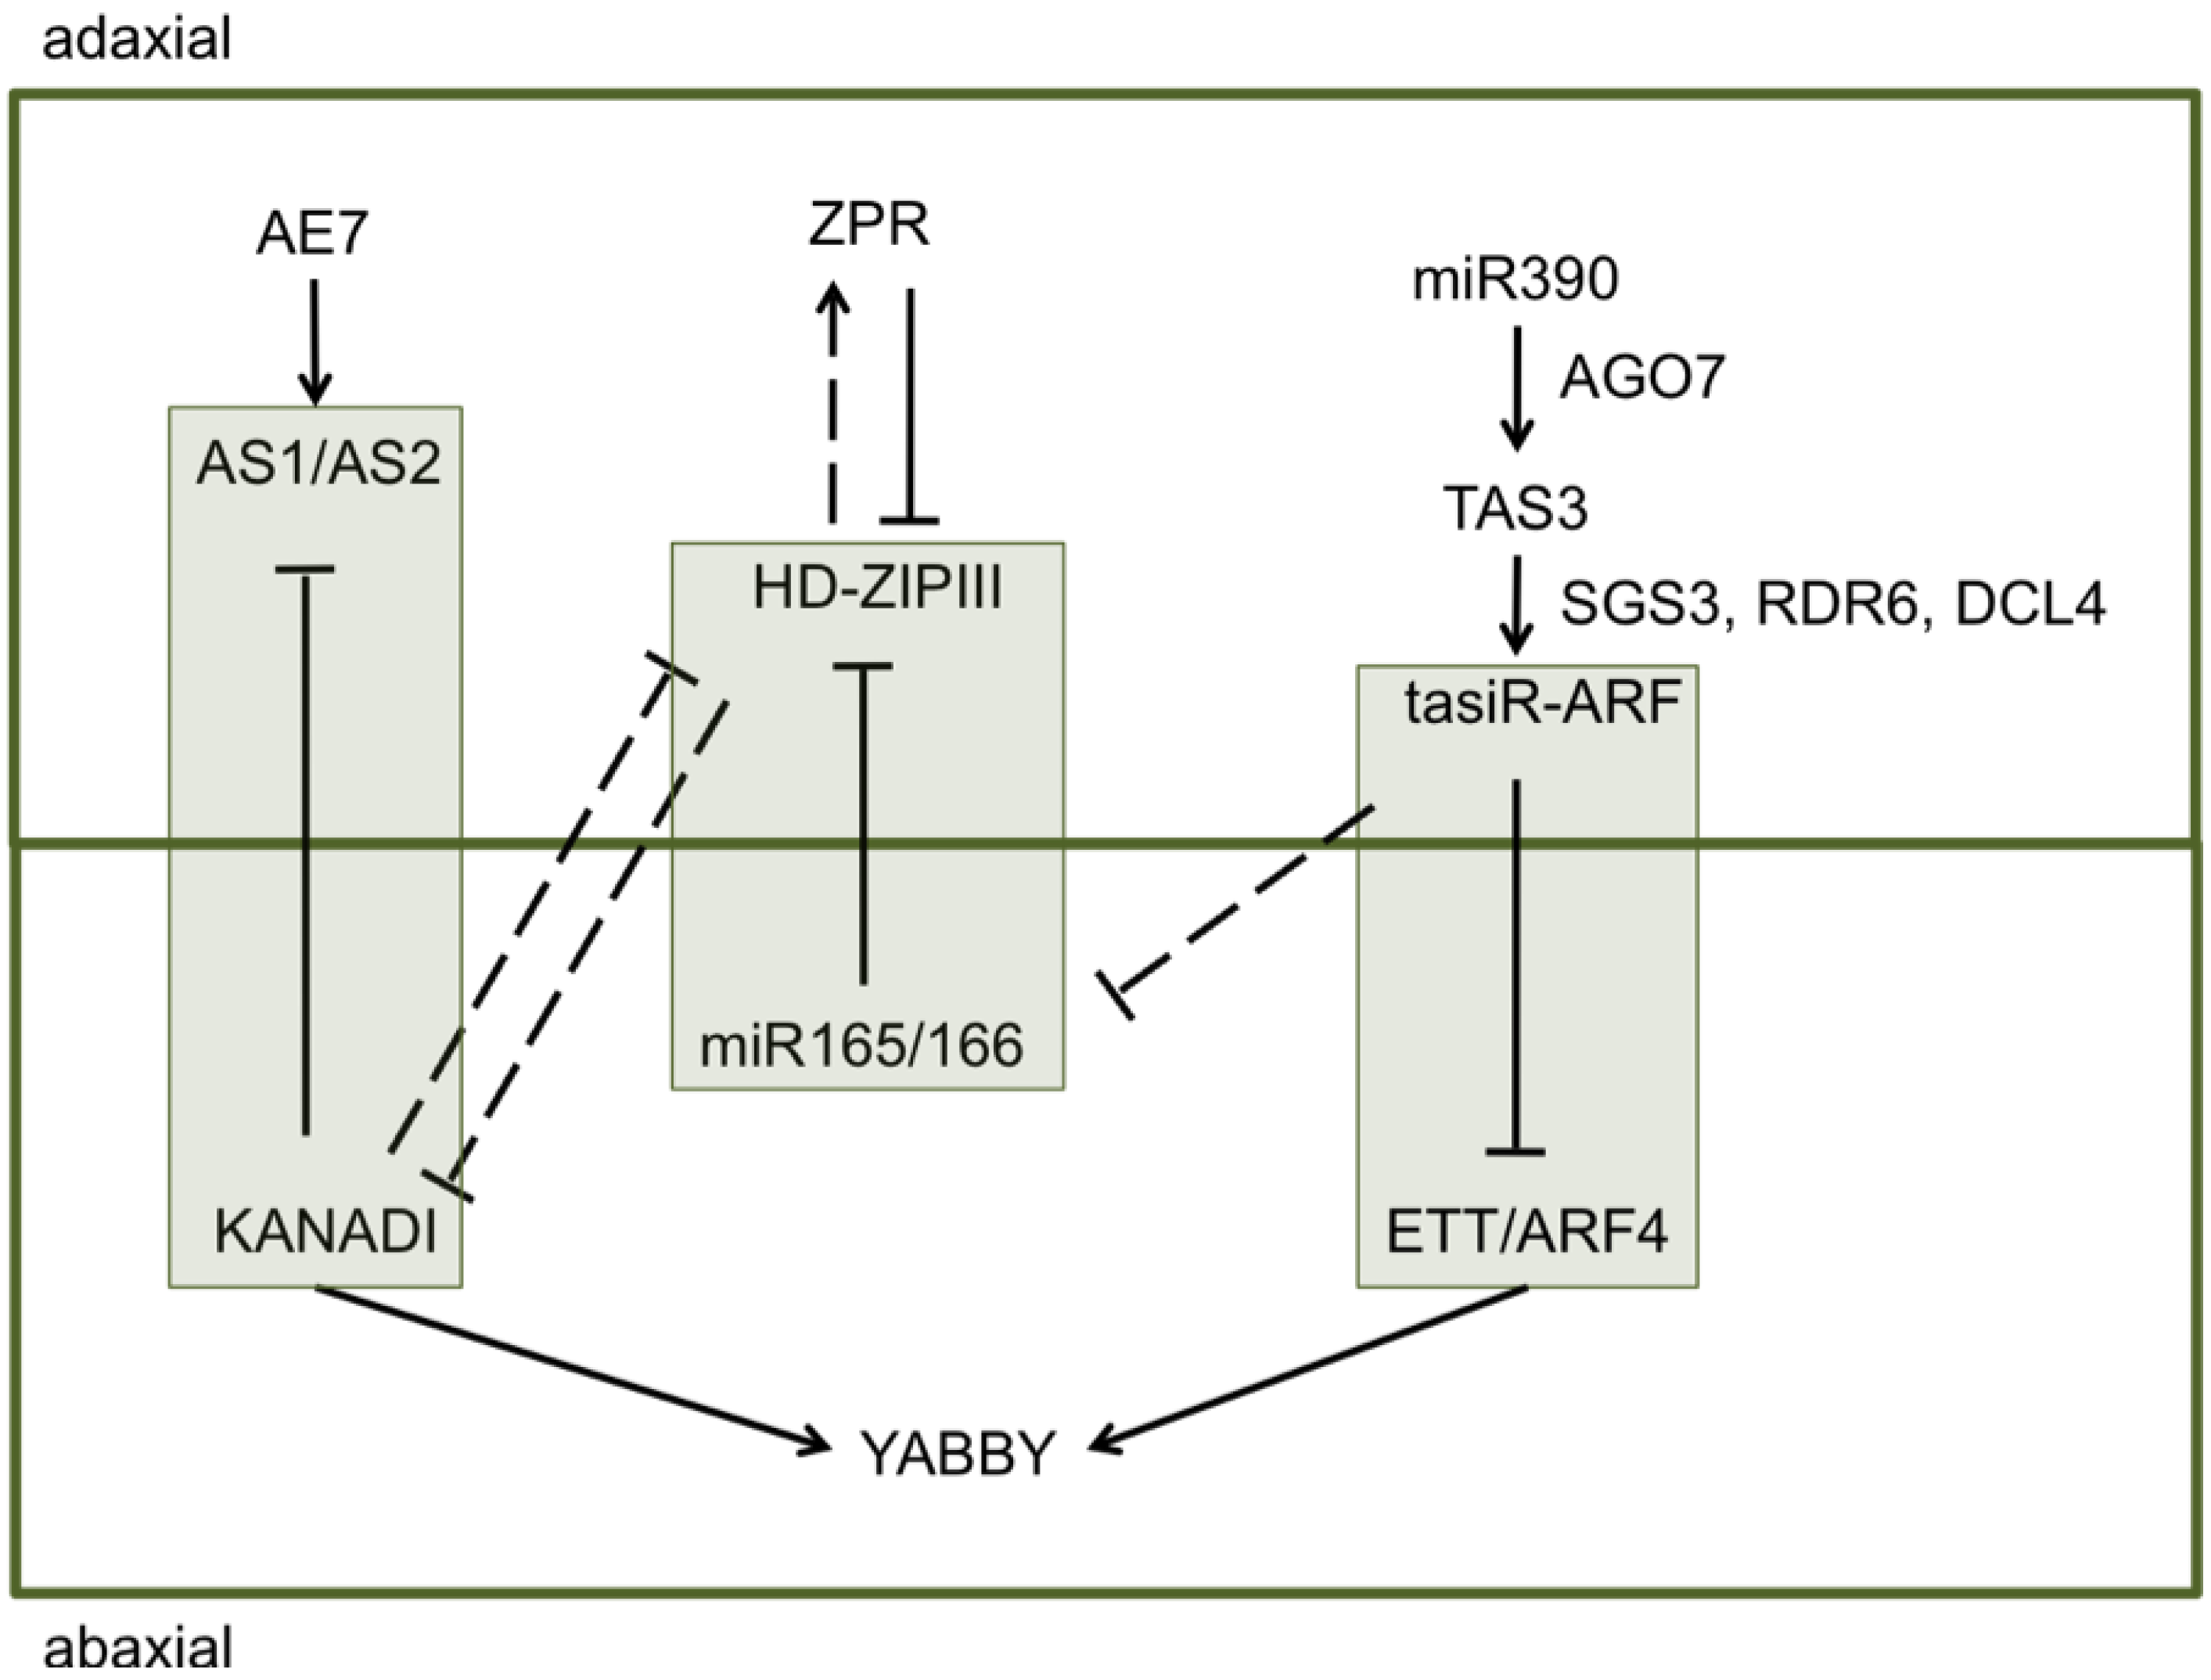
Adaxial–abaxial patterning in leaves is controlled by an array of transcription factors and corresponding small RNAs. Gene pathways enclosed with boxes, specify the major complexes setting dorsiventral polarity: (1) AS1/AS2-KANADI, (2) HD-ZIPIII-miR165/166, and (3) ETT/ARF4-tasiR-ARF. Solid lines indicate direct interactions while dashed lines indicate indirect interactions. Modified from Kidner and Timmermans [14].
Figure 1.
Adaxial–abaxial patterning in leaves is controlled by an array of transcription factors and corresponding small RNAs. Gene pathways enclosed with boxes, specify the major complexes setting dorsiventral polarity: (1) AS1/AS2-KANADI, (2) HD-ZIPIII-miR165/166, and (3) ETT/ARF4-tasiR-ARF. Solid lines indicate direct interactions while dashed lines indicate indirect interactions. Modified from Kidner and Timmermans [14].

2. Results and Discussion
2.1. Leaf Analysis
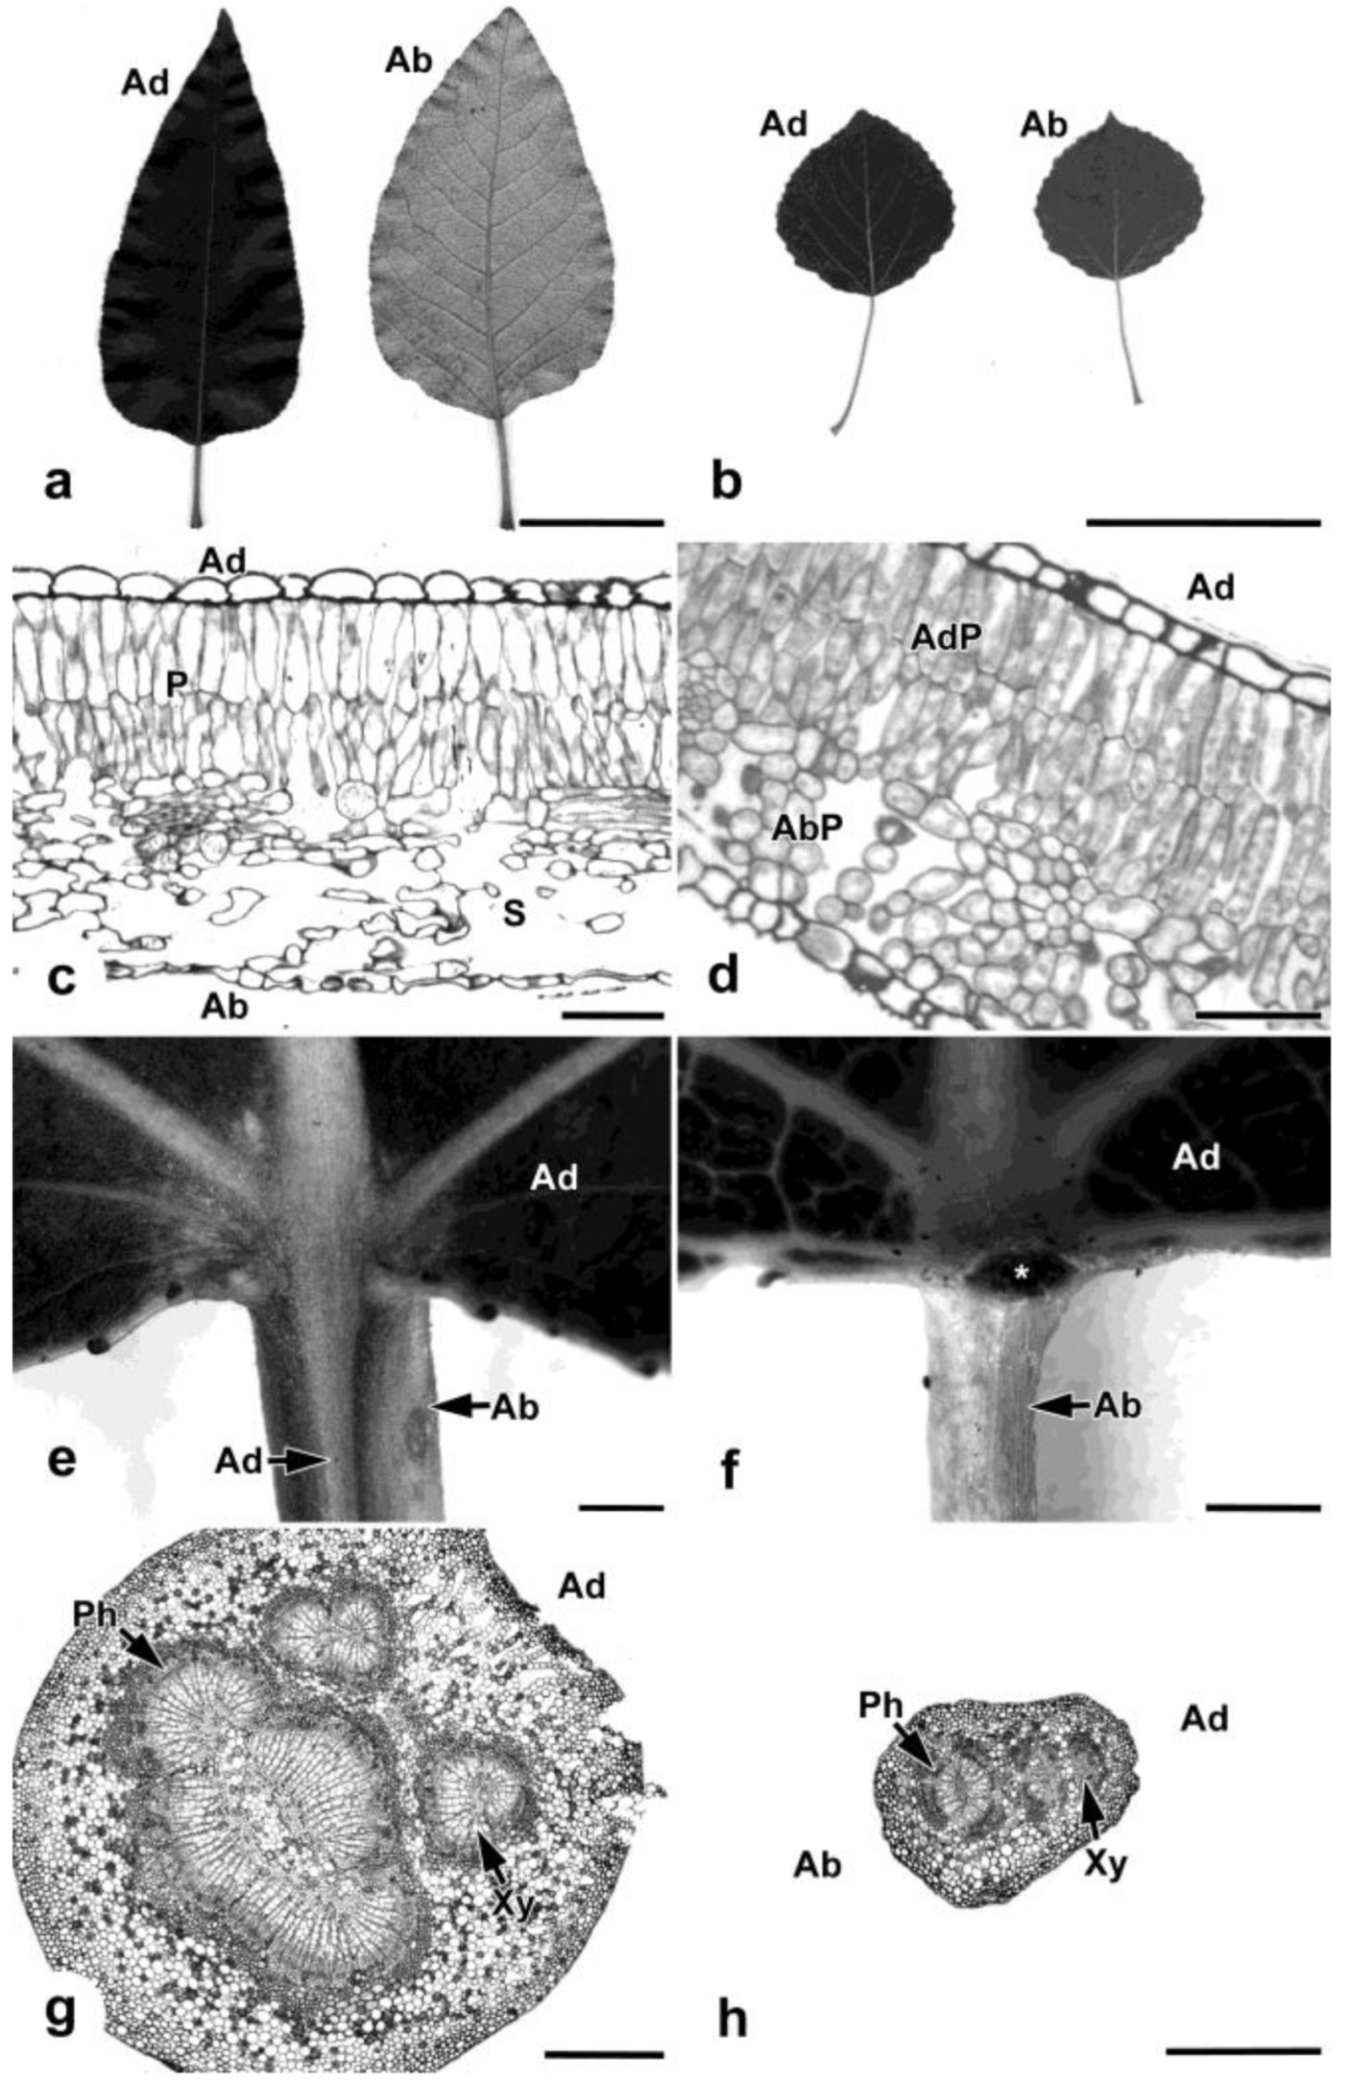
Black cottonwood and aspen are representative of the two major leaf variants in the genus Populus. Black cottonwood leaves are bifacial and contain palisade mesophyll tissues associated with the dark green adaxial side and spongy mesophyll associated with the lighter colored abaxial surface (Figure 2a,c). Aspen petioles are long relative to the leaf blade, with the petiole to total length ratio being smaller in black cottonwood leaves (0.17 ± 0.05) compared to aspen leaves (0.40 ± 0.06). Aspen leaves are isobilateral, exhibit the abaxial greening phenotype, and similar to black cottonwood contain adaxial palisade mesophyll cells, but unlike black cottonwood contain abaxial palisade mesophyll also in association with the abaxial side (Figure 2b,d).
In poplar, bifacial leaves are usually associated with rounded petioles and isobilateral with mediolaterally flattened petioles. Black cottonwood leaves have rounded petioles with a small region of adaxial surface that extends down the petiole (Figure 2e,g). Aspen leaves are associated with mediolaterally flattened petioles, which are bounded entirely by abaxial surface. The adaxial surface in aspen does not extend from the leaf down the petiole but ends at a “cross zone” at the petiole/blade junction where glands and small laminar outgrowths may be present (Figure 2f,h). Both species contain several amphicribral bundles (where phloem surrounds xylem) within the petioles (Figure 2g,h), indicative of abaxialization.
Figure 2.
Black cottonwood (a,c,e,g) and aspen (b,d,f,h) leaf morphology and anatomy. (a) Black cottonwood leaves, showing dark green adaxial surface and lighter abaxialsurface. (b) Aspen leaves showing similarity in coloration of both adaxial and abaxial surfaces. (c) Transverse section of black cottonwood leaf blade showing palisade mesophyll at the adaxial surface and spongy mesophyll at the abaxial. (d) Transverse section of aspen leaf blade showing adaxial palisade mesophyll at the adaxial side and abaxial palisade or palisade-like mesophyll cells at the abaxial side. (e) Higher magnification of the adaxial side of the petiole/blade junction in black cottonwood leaf. The adaxial surface from the leaf blade is continued in the narrow region down the petiole, while the back and majority of the petiole consists of the abaxial surface. (f) Higher magnification of the adaxial side of the petiole/blade junction in aspen leaf. The adaxial surface of the leaf blade does not extend down the petiole, but is instead interrupted by the gland (asterisk) located at the “cross zone”. The petiole, therefore, consists mostly of the abaxial surface. (g) Transverse section of black cottonwood petiole with the adaxial surface labeled. The petiole contains three amphicribral vascular bundles. (h) Transverse section of aspen petiole with the adaxial and abaxial sides, labeled in relation to the shoot. There are two amphicribral vascular bundles within the petiole. Ad: adaxial surface, Ab: abaxial surface, P: palisade mesophyll, S: spongy mesophyll, AdP: adaxial palisade mesophyll, AbP: abaxial palisade mesophyll, Ph: phloem, Xy: xylem. Scale bars = 1 cm (a, b), 50 µm (c, d), 1 mm (e, f), 500 µm (g, h).
2.2. Transcriptome Data Analysis
A collection of 42 Arabidopsis genes was selected for study (Table 1, Table S1). These genes include those that have been implicated in adaxial–abaxial patterning (Figure 1) and vegetative phase change in Arabidopsis and poplar, including AS1/AS2 and SPL orthologs. A large number of poplar candidate genes (84 in total) were initially selected for this study (Table S1) that are involved in the three complexes, including (1) AS1/AS2-KANADI, (2) HD-ZIPIII-miR165/166 (Class III HOMEODOMAIN-LEUCINE ZIPPER—microRNA165/166), and (3) ETT/ARF4-tasiR-ARF (ETTIN/AUXIN RESPONSE FACTOR4—trans-acting small interfering RNAs) (see for example 14 and 15 for more thorough reviews).

Table 1.
Arabidopsis genes names and identified putative P. trichocarpa orthologs, including poplar gene id (for version 2.2 of the genome) and gene name for 18 poplar genes selected for detailed study, out of 84 initially screened. Gene function in Arabidopsis, from various references (cited within text or TAIR), is also presented.
| Arabidopsis gene name | Arabidopsis accession number | Gene function in Arabidopsis | POPTR gene id (v2.2) | Poplar gene name |
|---|---|---|---|---|
| AE7 (AS1/AS2 enhancer 7) | AT1G68310 | Adaxial polarity formation | POPTR_0001s01820 | Pt-AE7.1 |
| POPTR_0003s09670 | Pt-AE7.2 | |||
| AGO1 (argonaute 1) | AT1G48410 | Adaxial/abaxial cell fate specification; vegetative phase change | POPTR_0012s03410 | Pt-AGO1.1 |
| POPTR_0015s05550 | Pt-AGO1.2 | |||
| AS1 (asymmetric leaves 1) | AT2G37630 | Adaxial axis specification | POPTR_0006s08610 | Pt-AS1.1 |
| POPTR_0004s10250 | Pt-AS1.2 | |||
| POPTR_0017s13950 | Pt-AS1.3 | |||
| AS2 (asymmetric leaves 2) | AT1G65620 | Adaxial axis specification | POPTR_0010s18460 | Pt-AS2.1 |
| POPTR_0008s07930 | Pt-AS2.2 | |||
| ATS (aberrant test shape) | AT5G42630 | Integument development; abaxial cell fate | POPTR_0002s13170 | Pt-ATS.1 |
| POPTR_0014s03650 | Pt-ATS.2 | |||
| YAB2 (YABBY 2) | AT1G08465 | Abaxial cell fate specification | POPTR_0001s22180 | Pt-YAB2.1 |
| POPTR_0127s00201 | Pt-YAB2.2 | |||
| POPTR_0016s06760 | Pt-YAB2.3 | |||
| YAB3 (YABBY 3) | AT4G00180 | Abaxial cell fate specification | POPTR_0003s11230 | Pt-YAB3.1 |
| POPTR_0001s00240 | Pt-YAB3.2 | |||
| ZPR3 (little zipper 3) | AT3G52770 | Adaxial cell fate specification | POPTR_0006s08320 | Pt-ZPR3.1 |
| POPTR_0010s24410 | Pt-ZPR3.2 |
In order to access overall expression patterns of these genes, mean RPKM values (reads per kilobase of exon model per million reads mapped) for 84 selected genes in young leaf samples were calculated and expression levels of black cottonwood and European aspen (P. tremula) were compared. A number of genes (28 in total) showed significant differences in expression in leaves between the two species with p-values < 0.05, which may indicate candidate genes for investigating differences in leaf blade types between the two species. Using these genes as a guideline, other putative orthologs were included and used for further RT-PCR analysis (71 genes in total) in order to determine whether there was an indication of differential expression between the two species. Genes that were not included in further analysis were Pt-CRC.1, Pt-CRC.2, Pt-INO.1, Pt-INO.2, Pt-SGS3.3, Pt-SGS3.4, Pt-SGS3.5, Pt-SGS3.6, Pt-SGS3.7, Pt-YUC.1, Pt-YUC.2, Pt-YUC2.1, and Pt-YUC2.2 due to low leaf expression levels (RPKM < 5).
2.3. Leaf Blade and Petiole qRT-PCR Gene Expression Patterns
Differential expression was confirmed by qRT-PCR. Several genes had significantly lower expression in aspen blade tissues compared to the blades of black cottonwood including: Pt-AE7.2, Pt-AGO1.2, Pt-AS2.1, Pt-ATS.2, Pt-YAB2.1, Pt-ZPR3.1, and Pt-ZPR3.2 (Table 2, Table S3). Pt-AS1.2 and Pt-YAB3.2, on the other hand, were significantly more highly expressed in aspen blades compared to black cottonwood (Table 2, Table S3). There were no significant differences in transcript abundance between the leaf blades of the two species in the remaining genes analyzed, with the exception of Pt-SPL43.2 which had lower expression in aspen in comparison to black cottonwood (p-value = 0.012).
Table 2.
Genes showing significant difference in expression between black cottonwood and hybrid aspen/European aspen leaf blades according to transcriptome sequencing (mRNA-seq), RT-PCR, and qRT-PCR (with p-value presented for qRT-PCR) results.
| POPTR gene id (v2.2) | Gene name | Hybrid or European aspen abundance in relation to black cottonwood | |||
|---|---|---|---|---|---|
| mRNA-seq | RT-PCR | qRT-PCR | qRT-PCR p-value | ||
| POPTR_0003s09670 | Pt-AE7.2 | - | - | - | 0.020 |
| POPTR_0015s05550 | Pt-AGO1.2 | NS | + | - * | 0.008 |
| POPTR_0004s10250 | Pt-AS1.2 | NS | NA | + * | 0.009 |
| POPTR_0010s18460 | Pt-AS2.1 | - | - | - | 0.028 |
| POPTR_0014s03650 | Pt-ATS.2 | + | + | - * | 0.030 |
| POPTR_0001s22180 | Pt-YAB2.1 | - | NA | - * | 0.010 |
| POPTR_0001s00240 | Pt-YAB3.2 | + | + | + | 0.00008 |
| POPTR_0006s08320 | Pt-ZPR3.1 | - | - | - | 0.020 |
| POPTR_0010s24410 | Pt-ZPR3.2 | + | + | - | 0.005 |
- denotes lower transcript abundance or expression level in hybrid aspen or European aspen (for mRNA-seq data) in comparison to black cottonwood; + denotes higher transcript abundance or expression level in hybrid aspen or European aspen; NS—not significant; NA—no data available; asterisk (*) denotes resultant gene expression patterns with qRT-PCR consistent with polarity scenarios discussed.
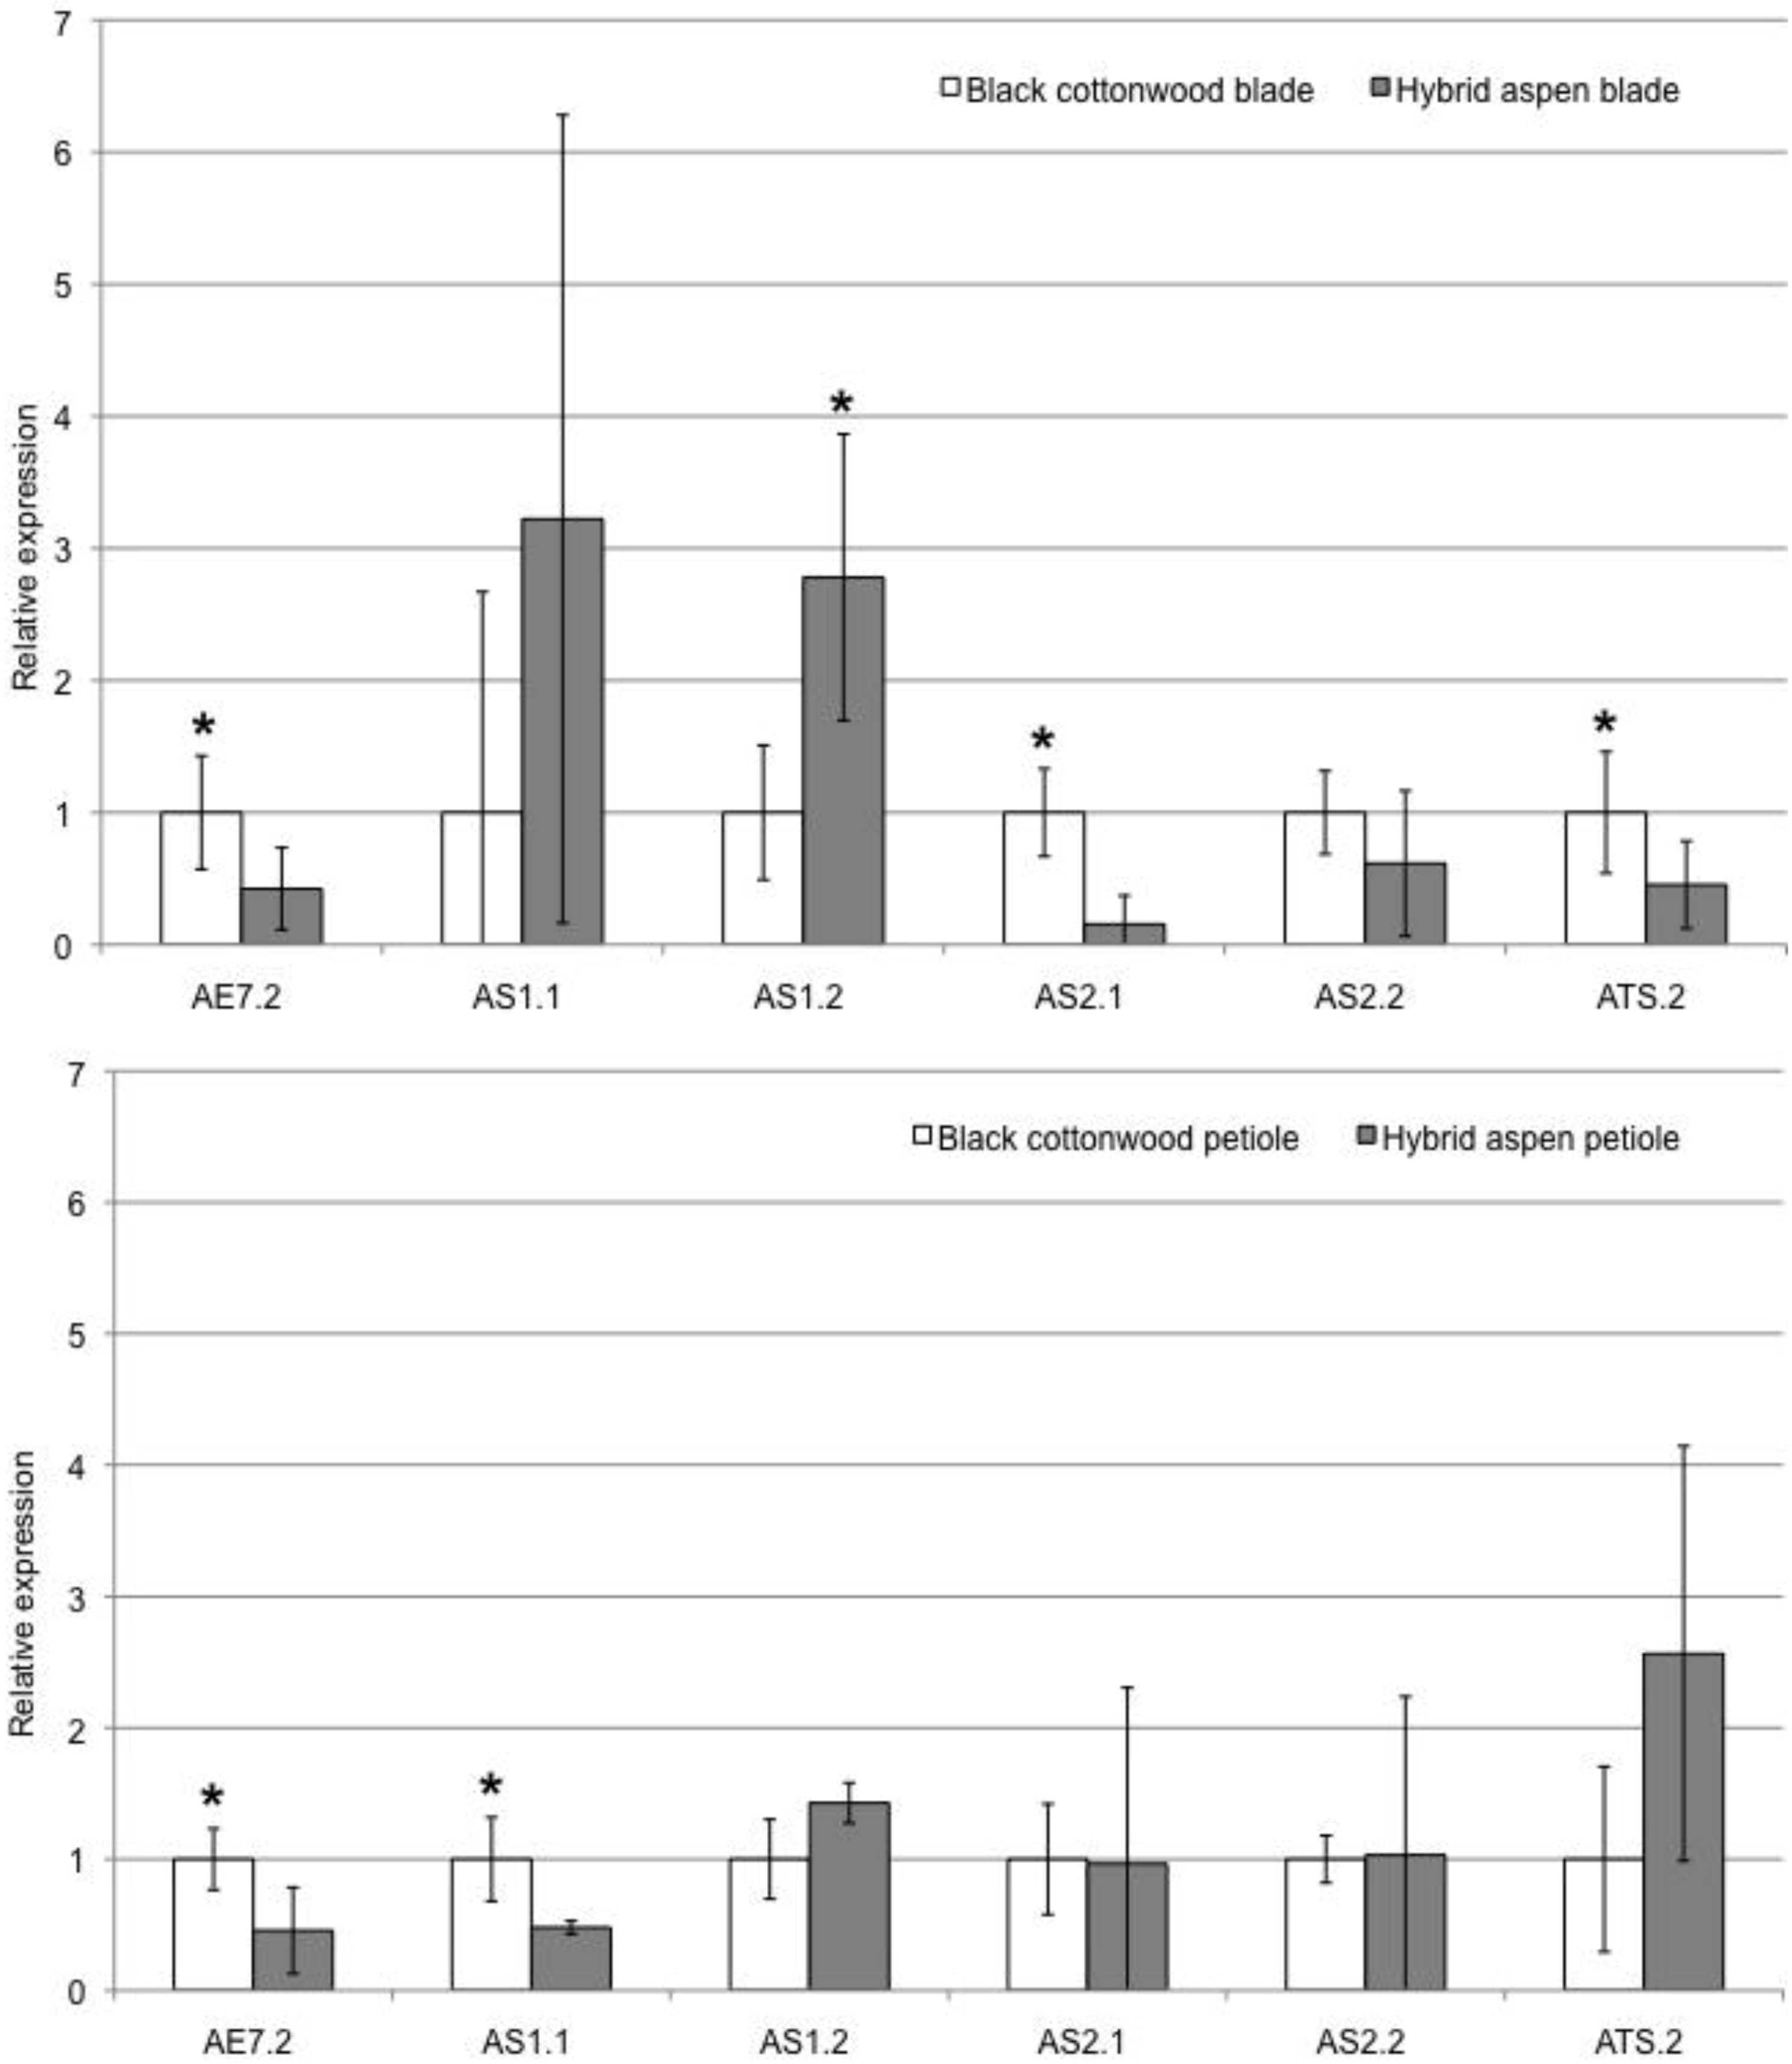
Further analysis revealed that several genes (i.e., Pt-AGO7.4, Pt-RDR6.2, Pt-SPL4.1, Pt -AE7.2) had significantly lower expression in petiole tissue in aspen compared to black cottonwood. Pt-AE7.2 therefore has lower expression in both blade and petiole of aspen, and so this difference in expression may be general and regardless of tissue type (Figure 3). The remaining genes tested did not show a significant difference in transcript abundance between the petioles of the two species. Pt-AS1.1 was significantly lower expressed in aspen petiole compared to black cottonwood (Figure 3). A recent study [16] of AE7 (AS1/AS2 ENHANCER7) in Arabidopsis showed that it interacts with AS1/AS2 and promotes adaxial identity. It is therefore not unexpected for this gene (Pt-AE7.2) to also be downregulated along with Pt-AS2.1 in the blade and Pt-AS1.1 in the petiole (Figure 3).
Pt-AGO1.2, Pt-ATS.2, and Pt-ZPR3.2 expression patterns were not consistent between all analyses (i.e., mRNA-seq, RT-PCR, and qRT-PCR). This was likely due to the tissue variability between leaf samples used in transcriptome sequencing and in RT-PCR, with the former analysis using leaves that are younger than used for the RT-PCR study. The differences between the PCR and transcriptome results could therefore be due to differences in developmental stage of the tissue. This variability could readily be checked in future studies by repeating these experiments on a developmental series (from developing leaf primordia to mature leaves) of black cottonwood and aspen blade and petiole tissues. Developmental variability has already been shown in some of these genes, with expression of ATS in Arabidopsis leaves (for example) increasing as leaves mature [17]. Where variability was observed between RT-PCR and qRT-PCR, results of the latter analysis are given more weight, due to their quantitative nature (e.g., Pt-AGO1.2, see Table 2).
Figure 3.
qRT-PCR results comparing black cottonwood and aspen leaf blade (top) and petiole (bottom) tissues. Asterisks indicate the genes that show a significant difference in expression between the two species, with the asterisk above the gene in the species that has higher expression. White bars show relative expression in black cottonwood, while grey bars show relative expression in aspen. Error bars indicate variability observed across biological and technical replicates.
2.4. Abaxial Determinants in Aspen
In accordance with a simple polarity scenario presented above, some of the genes responsible for abaxial cell fate specification (such as KAN or YAB) were hypothesized be downregulated in the leaf blades of aspen, but this was only observed in Pt-ATS.2 and Pt-YAB2.1.
ATS (KAN4) belongs to the KANADI gene family that is involved in setting abaxial polarity (Figure 1). This gene has not been reported to function in dorsiventral leaf polarity in Arabidopsis, but rather is known to determine polarity in ovule integuments [18,19] and to regulate flavonoid biosynthesis in developing seeds [20]. A recent study has reported an increase in ATS/KAN4 transcript abundance in LOF as1 mutants [21]. This is consistent with our results showing upregulation of Pt-AS1.2 and downregulation of Pt-ATS.2 in aspen blade tissues.
Due to the lack of a documented function of ATS in leaves, high levels of expression such as those detected in both species, particularly with transcriptome sequencing, are rather unexpected. These results may be suggestive of a different function of Pt-ATS.2, in particular, in poplar as compared to Arabidopsis. Pt-ATS.1 did not amplify in RT-PCR analysis, but transcriptome data suggests the absence of differential expression in the two species.
Similar to KANADI genes, YABBY gene expression is restricted to the abaxial domain being responsible for abaxial surface identify specification (Figure 1) [22,23]. Four of the YABBY family members are expressed in Arabidopsis leaves (AFO/FIL [ABNORMAL FLORAL ORGANS/FILAMENTOUS FLOWER], YAB2, YAB3, and YAB5) with AFO/FIL and YAB3 acting in a partially redundant manner and having their highest expression in leaves [22,24]. In Arabidopsis, fil yab3 double mutants cause adaxialization of leaves, while gain-of-function (GOF) mutations cause the inverse, abaxialization of leaves [22,25,26]. Single LOF mutations do not show leaf polarity defects, but fil mutants produce radial floral organs [27]. The predicted downregulation of these genes would be similar to LOF mutations, possibly causing slight effects on leaf polarity, if any. The observed upregulation in aspen blade tissues of Pt-YAB3.2 might be expected to lead to phenotypes suggestive of GOF mutations in Arabidopsis, but abaxialized leaf blades are not observed in aspen. Whatever the function and role of Pt-YAB3.2 it should be noted that its putative paralog, Pt-YAB3.1, does not show significant expression differences between the two species in either qRT-PCR or transcriptome analysis. Furthermore, another YABBY gene (Pt-YAB2.1) has lower expression in aspen blade. YAB2 is the least highly expressed YABBY gene in Arabidopsis leaves with expression patterns overlapping with other genes in the family (i.e., AFO/FIL and YAB3) [22]. Its redundant function and low expression is a possible reason for lack of extensive studies of this gene.
2.5. ARGONAUTE1 in Aspen
AGO1 expression is variable between aspen and black cottonwood. In the qPCR study, it had significantly lower expression in aspen. It is involved with the post-transcriptional regulation of multiple pathways, including RNA silencing and degradation via RNA-induced silencing complex (RISC) assembly [28,29,30]. AGO1 is expressed throughout leaf primordia [31] and interacts with AS1/AS2. LOF ago1 mutations can have a variety of effects, including abaxialized organs and defects in the meristem [30,32]. Most genes within the dorsiventral leaf polarity network are involved in setting either the adaxial or abaxial surface polarity in Arabidopsis. AGO1, on the other hand, appears to be responsible for both abaxial and adaxial cell fate determination in lateral organs [33]. Previous studies have reported its role in abaxial cell fate specification in leaves [28] and adaxial cell fate specification in petals [31]. Due to this variability in cell fate specification in Arabidopsis, it is reasonable to assume that in poplar, Pt-AGO1 genes may be expressed in both the abaxial or adaxial domain in leaves. AGO1 is also required for KNOX repression and juvenile leaf fate maintenance, by delaying vegetative phase change [34]. Functional studies are required to determine the precise role of these genes in poplar in order to predict their effect in the abaxial greening phenotype.
2.6. ASYMMETRIC LEAVES1 in Aspen
Genes that are responsible for adaxial polarity specification in Arabidopsis include AE7, AS1, AS2, and others (Figure 1). Some of these genes might be expected to be upregulated in aspen blade tissue, due to the presence of more adaxial-like cell types (i.e., palisade mesophyll in the lower part of the leaf). The only gene that fits this criterion is Pt-AS1.2.
The gene AS1 (ortholog of PHANTASTICA in Antirrhinum and ROUGH SHEATH2 in maize) has been shown in previous studies to be expressed throughout leaf primordia, and to be associated with AS2 [35] to promote cell determinacy and repress KNOX (KNOTTED-LIKE HOMEOBOX), ETT/ARF3, KANADI2, and YABBY5 genes [14,36,37,38]. In Arabidopsis, overexpression of AS1 does not result in strong dorsiventral polarity defects. Instead, LOF mutants of as1 develop downwardly curled asymmetric leaves without obvious loss of adaxial identity [14,37,39,40]. In other species, including tomato and Antirrhinum, LOF mutations in as1 have more dramatic effects, causing radialization (abaxialization) of the petiole and even the lamina [9,10,11,12,40]. This is potentially consistent with lower expression of Pt-AS1.1 transcript observed in unifacial aspen petioles.
Chua et al. [13] showed a role for AS1 in vegetative phase transition via an interaction with a bromodomain-containing protein GTE6 (GENERAL TRANSCRIPTION FACTOR GROUP E6). AS1 along with GTE6 are upregulated in mature leaves as a plant transitions from the juvenile phase. The abaxial greening phenotype is characteristic of mature (but not seedling) leaf forms, and this is potentially consistent with the higher expression of Pt-AS1.2 in the aspen leaf blade. Along with its contribution to proximal radialization and vegetative phase transition, AS1 has been implicated in the determination of palisade mesophyll cells in tobacco [11]. Tobacco AS1 ortholog NsPHAN is expressed in the middle mesophyll tissue or the tissue between adaxial palisade mesophyll and abaxial spongy mesophyll. Its cell-specific expression is essential to the production of cell divisions that promote palisade development in the mesophyll tissue associated with the adaxial surface [11]. The increased levels of Pt-AS1.2 in aspen blade, therefore, can potentially explain the increased production of palisade cells at the adaxial and abaxial surfaces.
Due to the expression patterns observed for genes encoding members of the AS1/AS2-KANADI complex, these genes are plausible candidate genes to be responsible for the abaxial greening phenotype in aspen. This possibility receives some support from the other differentially expressed genes that interact with AS1, either directly or indirectly, including AE7, which is an enhancer of AS1/AS2 genes [16]. AGO1 also interacts with AS1/AS2 in the adaxial domain [33,34]. Genes of the KANADI family, to which ATS belongs, restrict the expression of AS1/AS2 to the adaxial side of the leaf [14]. KANADI genes also promote YABBY expression [26] and the downregulation of ATS and YAB2 orthologs are therefore consistent with an upregulation of AS1 in aspen leaves. ZPR genes interact indirectly with AS1/AS2 via their repression of HD-ZIPIII genes, which also indirectly repress KANADI genes in Arabidopsis [35,36,41,42,43].
3. Experimental Section
3.1. Leaf Analysis
Leaves of P. trichocarpa and P. tremula x tremuloides were collected from a collection at Totem Field (UBC) and imaged using a flatbed scanner. Whole leaves were also photographed using a Nikon stereomicroscope with a DS-Ri1 camera (Nikon Corp.). Leaf blade and petiole lengths were measured from several different trees in 129 and 75 replicate leaves of black cottonwood and aspen, respectively. Leaf blade pieces from the middle of the blade, on either side of the midvein, and petiole pieces (middle) were cut from fresh leaves, fixed in 70% FAA, embedded in LR White, sectioned, and photographed according to the methods described in Nowak et al. [44].
3.2. Gene Selection
Arabidopsis thaliana amino acid sequences (42 in total) were downloaded from TAIR [45] and were BLASTed (tBLASTn) using Phytozome [46] against Populus trichocarpa v2.2 genome. Final selection of homologous genes was based on the “Gene Ancestry” output results from Phytozome, which list all of the families (with genomes published on Phytozome, including P. trichocarpa) that contain the gene of interest, with the exception of YABBY, KANADI, and HD-ZIPIII orthologs that were identified using a phylogenomics approach [24]. A total of 84 P. trichocarpa genes were selected and used in further analyses, described below.
3.3. mRNA-seq Gene Expression Data Analysis
The transcriptomes of whole expanding and fully expanded leaves from three representative P. trichocarpa and four representative P. tremula (European aspen) individuals were sequenced using the Illumina GAII platform as part of a larger project. P. tremula (European aspen) RNA samples were sequenced rather than P. tremula x tremuloides (hybrid aspen), as this was the preferred tissue in the larger project. Hybrid aspen was used in all other gene expression analyses. Sequencing protocols are as described [47], but the short-read mapping was updated to version 2.2 of Populus trichocarpa genome using methods described in Geraldes et al. [47]. Mean and standard deviation values of normalized transcript expression levels (reads per kilobase of exon model per million reads mapped or RPKM) were calculated for each of the 84 genes identified (Table S2). RPKM data was derived from the sequenced reads for P. trichocarpa and P. tremula replicate samples (three and four replicates, respectively) for young expanding leaves. The mean values for each of the genes between black cottonwood and aspen were compared using a Student’s t-test. The number of genes for further study was narrowed to 71 with the following criteria: (1) genes that showed a significant difference in expression levels between the two species in leaf samples, (2) genes that had expression levels higher than 5 RPKM, and (3) the remaining putative orthologs of genes that satisfy criteria 1 and 2, even if their RPKM was less than 5. For example, if Pt-AE3.1 showed RPKM > 5 and a difference in expression levels between black cottonwood and aspen, but Pt-AE3.2 did not meet either or both of these criteria, both were included in further analyses.
3.4. Reverse Transcriptase PCR
Tissue from the first fully opened leaf on a branch was collected on three separate days over a three-week period from three separate trees for black cottonwood and aspen. Care was taken to sample at the same developmental stage for all samples. Several leaves (blade and petiole collected into separate samples) from each of the three trees were pooled into one sample (per collection day), frozen in liquid nitrogen, and analyzed further using following molecular techniques.
DNA was extracted from black cottonwood and aspen leaf tissues using a modified CTAB protocol [48]. RNA was extracted from each of these species from developing leaf blades and petioles (for tissue comparison) using Invitrogen PureLink Plant RNA Reagent (Burlington, Ontario, Canada). Both DNA and RNA concentrations were measured with a NanoDrop ND-1000 spectrophotometer (Thermo Scientific, Wilmington, DE, USA). Two microliters of RNA was further treated with DNase (TURBO DNA-free, Ambion, Mississauga, Ontario) from which cDNA was synthesized using a RevertAid H Minus First Strand cDNA Synthesis Kit (Fermentas, Burlington, Ontario, Canada). cDNA samples were diluted to similar concentrations, as measured with a NanoDrop spectrophotometer, for further RT-PCR analysis. For each of the 71 genes, primers were designed using Primer3 [49] to amplify 200–500 bp regions in P. trichocarpa. Polymerase chain reactions (PCR) were run with the following PCR program: 94 °C 3 min, (94 °C 30 s, 56 °C 40 s, 72 °C 1 min) × 36, 72 °C 1 min. Poplar translation initiation factor 5A (TIF5A), previously used by Ralph et al. [50], was used as a positive control in all PCR reactions. Each of the 71 primer pairs was run at least three times to determine expression patterns in leaf blade and petiole of black cottonwood and aspen. DNA of each of the species was amplified using these primers to assess whether the primer specificity was poor in contrast to the gene not being expressed. Negative controls were also included in each reaction, which excluded DNA or cDNA template. PCR products were run on 1–2% agarose gels (at 120 V for 30–60 min) to determine fragment sizes and estimate product abundance based on intensity of fragment staining.
Genes that met the following criteria were analyzed further using quantitative RT-PCR (qRT-PCR): (1) RT-PCR products from RNA derived from aspen leaf blades higher putative expression based on staining intensity, compared to RT-PCR products from RNA derived from black cottonwood leaf blade samples or (2) differential expression between the two species in either leaf blade or petiole tissue samples. Genes that did not amplify either in blade or petiole aspen samples were not included in further analysis. In these cases, we postulate that the primers (derived from the P. trichocarpa genome sequence) were too divergent from the aspen sequences to support amplification, and rather than indicating of lack of expression (these results were not further investigated).
Genes selected for further qRT-PCR analysis were labeled under the following categories, according to the RT-PCR results: (1) Higher expression in aspen blade, compared to black cottonwood, (2) Expression not higher in aspen blade, (3) No expression in black cottonwood blade, compared to expression present in aspen, and (4) No amplification of cDNA or DNA in either or both species. Some genes did not amplify, especially in aspen likely due to the lack of primer specificity (as primers were designed based on the P. trichocarpa reference genome sequence).
3.5. Quantitative RT-PCR
Five samples, including black cottonwood blade and petiole, aspen blade and petiole (for tissue comparison), and negative control, were included in each qRT-PCR run for each of the genes. cDNA from three pooled biological replicate samples (described above in Section 3.4.) were all diluted to 1 ng/µL to start each qRT-PCR run with the same amount of starting template. The final cDNA concentration was measured using Qubit 2.0 fluorometer (Invitrogen), using the manufacturer’s protocol. Reactions were prepared using SsoFast EvaGreen Supermix protocol (Bio-Rad, Mississauga, Ontario) and were run using Bio-Rad iCycler iQ5 Real-Time PCR system with the following program: 95 °C 30 s (95 °C 5 s, 56 °C 5 s) × 40, 57 °C 5 s, 57 °C 5 s × 77.
Expression or transcript abundance levels were presented as Cq values or the number of cycles when the template was used up [51]. The lower Cq value, the more template cDNA present and therefore more transcript present. Relative transcript abundance (normalized to TIF5A reference gene) for blade and petiole, separately, was calculated using the difference in Cq values or ∆Cq [Cq (test)—Cq (control)], which is the gene concentration compared to other control samples [52]. The “test” sample (as described in the ∆Cq formula) was designated as aspen as it was compared to the “control” or black cottonwood samples. The final results are graphed and presented as relative expression ratio: 2^-∆∆Cq [52].
4. Conclusions
Isobilateral leaves exhibit abaxial greening where, in its extreme form, the abaxial side of the leaf contains palisade-like mesophyll cells that are normally restricted to the adaxial side. A simple hypothesis is therefore that adaxial identity genes may be upregulated in such leaves, while there might be a reduction in abaxial gene expression relative to “normal” leaves. In this study, most genes that were analyzed had no significant differences in expression between the two species in leaf blades. However, a set of genes was found to be differentially expressed in aspen leaf blades in comparison to black cottonwood. In particular the upregulation of an adaxial identity gene Pt-AS1.2 and the downregulation of abaxial cell fate determinants Pt-ATS.2 and Pt-YAB2.1 in aspen leaf blade, was consistent with this leaf polarity scenario. Similarly, downregulation of Pt-AGO1.2 is interesting, as it is known to promote juvenile leaf fate maintenance, and therefore provides a possible link between leaf morphology and phase change in Populus.
As aspen has abaxialized unifacial petioles, the finding of downregulation of Pt-AS1.1 in aspen petiole is also consistent with the hypothesis. The two poplar AS1 paralogs investigated show differential expression patterns between blade and petiole within a single leaf. This suggests a positional regulation of these paralogs within the leaf for organ determination.
The documented roles of AS1 in petiole abaxialization, vegetative phase change, and promotion of palisade mesophyll development is consistent with a role for AS1 in the abaxial greening phenotype of aspen. However, although the abaxial side of the aspen blade may contain cells that are characteristic of the adaxial domain in other species, the leaf blade maintains its fundamental dorsiventral polarity. Maintaining dorsiventrally flattened leaf blades in aspen, while still allowing for the development of adaxial cell types in the abaxial side of the leaf, is likely to be accomplished by relatively subtle changes in gene regulatory networks. AS1 and its interacting factors, especially the AS1-KANADI antagonistic gene network, are here shown to be good candidates for this, worthy of further investigation.
Acknowledgments
The authors thank Anastasia Kuzmin for qPCR advice, Adam Nowak for technical help, and the Natural Sciences and Engineering Research Council of Canada for funding to JSN (NSERC CGS D studentship). We thank Armando Geraldes (UBC), Johnson Pang and Nina Thiessen (Genome Sciences Centre, Vancouver) for RNA-seq analyses and calculating RPKM values. This research was further supported by an NSERC Discovery Grant (to QCBC), and by Genome BC Applied Genomics Innovation Program project 103BIO (to CJD and QCBC).
References
- Eckenwalder, J.E. Systematics and evolution of Populus. In Biology of Populus and Its Implications for Management and Conservation; Stettler, R.F., Bradshaw, H.D., Jr., Heilman, P.E., Hinckley, T.M., Eds.; NRC Research Press, National Research Council of Canada: Ottawa, Canada, 1996; pp. 7–32. [Google Scholar]
- Van Volkenburgh, E.; Taylor, G. Leaf growth physiology. In Biology of Populus and Its Implications for Management and Conservation; Stettler, R.F., Bradshaw, H.D., Jr., Heilman, P.E., Hinckley, T.M., Eds.; NRC Research Press, National Research Council of Canada: Ottawa, Canada, 1996; pp. 283–299. [Google Scholar]
- Cronk, Q.C.B. Plant eco-devo: The potential of poplar as a model organism. New Phytol. 2005, 166, 39–48. [Google Scholar] [CrossRef]
- Wu, R.; Bradshaw, H.D., Jr.; Stettler, R.F. Molecular genetics of growth and development in Populus (Salicaceae). V. Mapping quantitative trait loci affecting leaf variation. Am. J. Bot. 1997, 84, 143–153. [Google Scholar] [CrossRef]
- Roden, J.S.; Pearcy, R.W. Effect of leaf flutter on the light environment in poplars. Oecologia 1993, 93, 201–207. [Google Scholar] [CrossRef]
- Roden, J.S.; Pearcy, R.W. The effect of leaf flutter on the flux of CO2 in poplar leaves. Funct. Ecol. 1993, 7, 669–675. [Google Scholar] [CrossRef]
- Roden, J.S.; Pearcy, R.W. Photosynthetic gas exchange response of poplars to steady-state and dynamic light environments. Oecologia 1993, 93, 208–214. [Google Scholar] [CrossRef]
- Wang, J.W.; Park, M.Y.; Wang, L.J.; Koo, Y.; Chen, X.Y.; Weigel, D.; Poethig, R.S. MiRNA control of vegetative phase change in trees. PLoS Genet. 2011, 7, e1002012. [Google Scholar]
- Waites, R.; Hudson, A. phantastica: A gene required for dorsoventrality of leaves in Antiffhinum majus. Development 1995, 121, 2143–2154. [Google Scholar]
- Kim, M.; McCormick, S.; Timmermans, M.; Sinha, N. The expression domain of PHANTASTICA determines leaflet placement in compound leaves. Nature 2003, 424, 438–443. [Google Scholar] [CrossRef]
- McHale, N.A.; Koning, R.E. PHANTASTICA regulates development of the adaxial mesophyll in Nicotiana leaves. Plant Cell 2004, 16, 1251–1262. [Google Scholar] [CrossRef]
- Zoulias, N.; Koenig, D.; Hamidi, A.; McCormick, S.; Kim, M. A role for PHANTASTICA in medio-lateral regulation of adaxial domain development in tomato and tobacco leaves. Ann. Bot. 2012, 109, 407–418. [Google Scholar] [CrossRef]
- Chua, Y.L.; Channeliere, S.; Mott, E.; Gray, J.C. The bromodomain protein GTE6 controls leaf development in Arabidopsis by histone acetylation at ASYMMETRIC LEAVES1. Genes Dev. 2005, 19, 2245–2254. [Google Scholar] [CrossRef]
- Kidner, C.A.; Timmermans, M.C. Signaling sides: Adaxial-abaxial patterning in leaves. Curr. Top. Dev. Biol. 2010, 91, 141–168. [Google Scholar] [CrossRef]
- Townsley, B.T.; Sinha, N.R. A new development: Evolving concepts in leaf ontogeny. Annu. Rev. Plant Biol. 2012, 63, 535–562. [Google Scholar] [CrossRef]
- Yuan, Z.; Luo, D.; Li, G.; Yao, X.; Wang, H.; Zeng, M.; Huang, H.; Cui, X. Characterization of the AE7 gene in Arabidopsis suggests that normal cell proliferation is essential for leaf polarity establishment. Plant J. 2010, 64, 331–342. [Google Scholar] [CrossRef]
- Schmid, M.; Davison, T.S.; Henz, S.R.; Pape, U.J.; Demar, M.; Vingron, M.; Scholkopf, B.; Weigel, D.; Lohmann, J.U. A gene expression map of Arabidopsis thaliana development. Nat. Genet. 2005, 37, 501–506. [Google Scholar] [CrossRef]
- McAbee, J.M.; Hill, T.A.; Skinner, D.J.; Izhaki, A.; Hauser, B.A.; Meister, R.J.; Reddy, G.V.; Meyerowitz, E.K.; Bowman, J.L.; Gasser, C.S. ABERRANT TESTA SHAPE encodes a KANADI family member, linking polarity determination to separation and growth of Arabidopsis ovule integuments. Plant J. 2006, 46, 522–531. [Google Scholar] [CrossRef]
- Kelley, D.R.; Skinner, D.J.; Gasser, C.S. Roles of polarity determinants in ovule development. Plant J. 2009, 57, 1054–1064. [Google Scholar] [CrossRef]
- Gao, P.; Li, X.; Cui, D.; Wu, L.; Parkin, I.; Gruber, M.Y. A new dominant Arabidopsis transparent testa mutant, sk21-D, and modulation of seed flavonoid biosynthesis by KAN4. Plant Biotechnol. J. 2010, 8, 979–993. [Google Scholar] [CrossRef]
- Nakagawa, A.; Takahashi, H.; Kojima, S.; Sato, N.; Ohga, K.; Cha, B.Y.; Woo, J.T.; Nagai, K.; Horiguchi, G.; Tsukaya, H.; et al. Berberine enhances defects in the establishment of leaf polarity in asymmetric leaves1 and asymmetric leaves2 of Arabidopsis thaliana. Plant Mol. Biol. 2012, 79, 569–581. [Google Scholar] [CrossRef]
- Siegfried, K.R.; Eshed, Y.; Baum, S.F.; Otsuga, D.; Drews, D.N.; Bowman, J.L. Members of the YABBY gene family specify abaxial cell fate in Arabidopsis. Development 1999, 128, 4117–4128. [Google Scholar]
- Bowman, J.L. The YABBY gene family and abaxial cell fate. Curr. Opin. Plant Biol. 2000, 3, 17–22. [Google Scholar] [CrossRef]
- Nowak, J.S. Effects of Adaxial-Abaxial Signalling on Leaf Polarity. Ph.D. Dissertation, University of British Columbia, Vancouver, Canada, 2012. [Google Scholar]
- Sawa, S.; Watanabe, K.; Goto, K.; Liu, Y.G.; Shibata, D.; Kanaya, E.; Morita, E.H.; Okada, K. FILAMENTOUS FLOWER, a meristem and organ identity gene of Arabidopsis, encodes a protein with a zinc finger and HMG related domains. Genes Dev. 1999, 13, 1079–1088. [Google Scholar] [CrossRef]
- Eshed, Y.; Baum, S.F.; Perea, J.V.; Bowman, J.L. Establishment of polarity in lateral organs of plants. Curr.Biol. 2001, 11, 1251–1260. [Google Scholar] [CrossRef]
- Szakonyi, D.; Moschopoulos, A.; Byrne, M.E. Perspectives on leaf dorsoventral polarity. J. Plant Res. 2010, 123, 281–290. [Google Scholar] [CrossRef]
- Kidner, C.A.; Martienssen, R.A. Spatially restricted microRNA directs leaf polarity through ARGONAUTE1. Nature 2004, 428, 81–84. [Google Scholar] [CrossRef]
- Vaucheret, H.; Vazquez, F.; Crété, P.; Bartel, D.P. The action of ARGONATUE1 in the miRNA pathway and its regulation by the miRNA pathway are crucial for plant development. Genes Dev. 2004, 18, 1187–1197. [Google Scholar] [CrossRef]
- Baumberger, N.; Baulcombe, D.C. Arabidopsis ARGONAUTE1 is an RNA Slicer that selectively recruits microRNAs and short interfering RNAs. Proc. Natl. Acad. Sci USA 2005, 102, 11928–11933. [Google Scholar] [CrossRef]
- Lynn, K.; Fernandez, A.; Aida, M.; Sedbrook, J.; Tasaka, M.; Masson, P.; Barton, M.K. The PINHEAD/ZWILLE gene acts pleiotropically in Arabidopsis development and has overlapping functions with the ARGONAUTE1 gene. Development 1999, 126, 469–481. [Google Scholar]
- Bohmert, K.; Camus, I.; Bellini, C.; Bouchez, D.; Caboche, M.; Benning, C. AGO1 defines a novel locus of Arabidopsis controlling leaf development. EMBO J. 1998, 17, 170–180. [Google Scholar] [CrossRef]
- Xu, L.; Yang, L.; Pi, L.; Liu, Q.; Ling, Q.; Wang, H.; Poethig, R.S.; Huang, H. Genetic interaction between the AS1-AS2 and RDR6-SGS3-AGO7 pathways for leaf morphogenesis. Plant Cell Physiol. 2006, 47, 853–863. [Google Scholar] [CrossRef]
- Yang, L.; Liu, Z.; Lu, F.; Dong, A.; Huang, H. SERRATE is a novel nuclear regulator in primary microRNA processing in Arabidopsis. Plant J. 2006, 47, 841–850. [Google Scholar] [CrossRef]
- Semiarti, E.; Ueno, Y.; Tsukaya, H.; Iwakawa, H.; Machida, C.; Machida, Y. The ASYMMETRIC LEAVES2 gene of Arabidopsis thaliana regulates formation of a symmetric lamina, establishment of venation and repression of meristem-related homeobox genes in leaves. Development 2001, 128, 1771–1783. [Google Scholar]
- Byrne, M.E.; Barley, R.; Curtis, M.; Arroyo, J.M.; Dunham, M.; Hudson, A.; Martienssen, R.A. ASYMMETRIC LEAVES1 mediates leaf patterning and stem cell function in Arabidopsis. Nature 2000, 408, 967–971. [Google Scholar] [CrossRef]
- Lin, W.C.; Shuai, B.; Springer, P.S. The Arabidopsis LATERAL ORGAN BOUNDARIES-domain gene ASYMMETRIC LEAVES2 functions in the repression of KNOX gene expression and in adaxial-abaxial patterning. Plant Cell 2003, 15, 2241–2252. [Google Scholar] [CrossRef]
- Kojima, S.; Iwasaki, M.; Takahashi, H.; Imai, T.; Matsumura, Y.; Fleury, D.; Lijsebettens, M.V.; Machida, Y.; Machida, C. ASYMMERTIC LEAVES2 and elongator, a histone acetyltransferase complex, mediate the extablishment ofpolarity in leaves of Arabidopsis thaliana. Plant Cell Physiol. 2011, 52, 1259–1273. [Google Scholar] [CrossRef]
- Iwakawa, H.; Ueno, Y.; Semiarti, E.; Onouchi, H.; Kojima, S.; Tsukaya, H.; Hasebe, M.; Soma, T.; Ikezaki, M.; Machida, C.; et al. The ASYMMETRIC LEAVES 2 gene of Arabidopsis thaliana, required for formation of a symmetric flat leaf lamina, encodes a member of a novel family of proteins characterized by cysteine repeats and a leucine zipper. Plant Cell Physiol. 2002, 43, 467–478. [Google Scholar] [CrossRef]
- Byrne, M.E. Networks in leaf development. Curr. Opin. Plant Biol. 2005, 8, 59–66. [Google Scholar] [CrossRef]
- Emery, J.F.; Floyd, S.K.; Alvarez, J.; Eshed, Y.; Hawker, N.P.; Izhaki, A.; Baum, S.F.; Bowman, J.L. Radial patterning of Arabidopsis shoots by class III HD-ZIP and KANADI genes. Curr. Biol. 2003, 13, 1768–1774. [Google Scholar] [CrossRef]
- Li, H.; Xu, L.; Wang, H.; Yuan, Z.; Cao, X.; Yang, Z.; Zhang, D.; Xu, Y.; Huang, H. The putative RNA-dependent RNA polymerase RDR6 acts synergistically with ASYMMETRIC LEAVES1 and 2 to repress BREVIPEDICELLUS and microRNA165/166 in Arabidopsis leaf development. Plant Cell 2005, 17, 2157–2171. [Google Scholar] [CrossRef]
- Fu, Y.; Xu, L.; Xu, B.; Yang, L.; Ling, Q.; Wang, H.; Huang, H. Genetic interaction between leaf polarity-controlling genes ASYMMETRIC LEAVES1 and 2 in Arabidopsis leaf patterning. Plant Cell Physiol. 2007, 48, 724–735. [Google Scholar] [CrossRef]
- Nowak, J.; Dengler, N.G.; Posluszny, U. The role of abscission during leaflet separation in Chamaedorea elegans (Arecaceae). Int. J. Plant Sci. 2007, 168, 533–545. [Google Scholar] [CrossRef]
- Arabidopsis Information Resource (TAIR). Available online: http://www.arabidopsis.org/ (accessed on 30 September 2011).
- Goodstein, D.M.; Shu, S.; Howson, R.; Neupane, R.; Hayes, R.D.; Fazo, J.; Mitros, T.; Dirks, W.; Hellsten, U.; Putnam, N.; et al. Phytozome: A comparative platform for green plant genomics. Nucleic Acids Res. 2011, 40, D1178–D1186. [Google Scholar]
- Geraldes, A.; Pang, J.; Thiessen, N.; Cezard, T.; Moore, R.; Zhao, Y.; Tam, A.; Wang, S.; Friedmann, M.; Birol, I.; et al. SNP discovery in black cottonwood (Populus trichocarpa) by population transcriptome resequencing. Mol. Ecol. Resour. 2011, 11, 81–92. [Google Scholar] [CrossRef]
- Doyle, J.J.; Doyle, J.L. A rapid DNA isolation procedure for small quantities of fresh leaf tissue. Phytochem. Bull. 1987, 19, 11–15. [Google Scholar]
- Rozen, S.; Skaletsky, H.J. Primer3 on the WWW for general users and for biologist programmers. In Bioinformatics Methods and Protocols: Methods in Molecular Biology; Krawetz, S., Misener, S., Eds.; Humana Press: Totowa, NJ, USA, 2000; pp. 365–386. [Google Scholar]
- Ralph, S.; Oddy, C.; Cooper, D.; Yueh, H.; Jancsik, S.; Kolosova, N.; Philippe, R.N.; Aeschliman, D.; White, R.; Huber, D.; et al. Genomics of hybrid poplar (Populus trichocarpa x deltoides) interacting with forest tent caterpillars (Malacosoma disstria): Normalized and full-length cDNA libraries, expressed sequence tags, and a cDNA microarray for the study of insect-induced defenses in poplar. Mol. Ecol. 2006, 15, 1275–1297. [Google Scholar] [CrossRef]
- Bustin, S.A.; Benes, V.; Garson, J.A.; Hellemans, J.; Huggett, J.; Kubista, M.; Mueller, R.; Nolan, T.; Pfaffl, M.W.; Shipley, G.L.; et al. The MIQE guidelines: Minimum information for publication of quantitative real-time PCR experiments. Clin. Chem. 2009, 55, 611–622. [Google Scholar]
- Pfaffl, M.W. Relative quantification. In Real-Time PCR; Dorak, M.T., Ed.; Taylor & Francis Group: New York, NY, USA, 2006; pp. 63–82. [Google Scholar]
Supplementary Materials
Table S1.
Arabidopsis genes names and identified putative P. trichocarpa orthologs, including poplar gene id and gene name. Gene function in Arabidopsis, from various references (cited within text or TAIR), is also presented.
| Arabidopsis gene name | Arabidopsis accession number | Gene function in Arabidopsis | POPTR gene id (v2.2) | Poplar gene name |
|---|---|---|---|---|
| AE3 (AS1/AS2 enhancer 3) | AT5G05780 | Adaxial leaf identity specification | POPTR_0008s06540 | Pt-AE3.1 |
| POPTR_0008s06550 | Pt-AE3.2 | |||
| AE7 (AS1/2 enhancer 7) | AT1G68310 | Adaxial polarity formation | POPTR_0001s01820 | Pt-AE7.1 |
| POPTR_0003s09670 | Pt-AE7.2 | |||
| AFO (abnormal flower organ) | AT2G45190 | Abaxial cell fate specification | POPTR_0014s06210 | Pt-AFO.1 |
| POPTR_0002s14600 | Pt-AFO.2 | |||
| AGO1 (argonaute 1) | AT1G48410 | Adaxial/abaxial cell fate specification; vegetative phase change | POPTR_0012s03410 | Pt-AGO1.1 |
| POPTR_0015s05550 | Pt-AGO1.2 | |||
| AGO7 (argonaute 7) | AT1G69440 | Regulation of vegetative phase change | POPTR_0009s00660 | Pt-AGO7.1 |
| POPTR_0010s17100 | Pt-AGO7.4 | |||
| AGO10 (argonaute 10) | AT5G43810 | Primary SAM specification; miRNA binding | POPTR_0008s15860 | Pt-AGO10.1 |
| POPTR_0010s09150 | Pt-AGO10.2 | |||
| AN3 (angustifolia 3) | AT5G28640 | Leaf development | POPTR_0013s04090 | Pt-AN3.1 |
| POPTR_0019s02320 | Pt-AN3.2 | |||
| ARF4 (auxin response factor 4) | AT5G60450 | Abaxial cell fate specification | POPTR_0009s01700 | Pt-ARF4.1 |
| AS1 (asymmetric leaves 1) | AT2G37630 | Adaxial axis specification | POPTR_0006s08610 | Pt-AS1.1 |
| POPTR_0004s10250 | Pt-AS1.2 | |||
| POPTR_0017s13950 | Pt-AS1.3 | |||
| AS2 (asymmetric leaves 2) | AT1G65620 | Adaxial axis specification | POPTR_0010s18460 | Pt-AS2.1 |
| POPTR_0008s07930 | Pt-AS2.2 | |||
| CNA (corona) | AT1G52150 | Adaxial identity determination; vascular histogenesis | POPTR_0003s04860 | Pt-ATHB.11 |
| POPTR_0001s18930 | Pt-ATHB.12 | |||
| ATS (aberrant test shape) | AT5G42630 | Integument development; abaxial cell fate | POPTR_0002s13170 | Pt-ATS.1 |
| POPTR_0014s03650 | Pt-ATS.2 | |||
| CRC (crabs claw) | AT1G69180 | Abaxial axis specification; floral meristem determinacy | POPTR_0008s09740 | Pt-CRC.1 |
| POPTR_0010s16410 | Pt-CRC.2 | |||
| DCL4 (dicer-like 4) | AT5G20320 | Vegetative phase change | POPTR_0006s20310 | Pt-DCL4.1 |
| DUF59 (domain of unknown function 59) | AT3G50845 | Adaxial polarity formation (AE7-like) | POPTR_0005s12480 | Pt-DUF59.1 |
| ETT (ettin) | AT2G33860 | Abaxial cell fate specification | POPTR_0004s04970 | Pt-ETT.1 |
| POPTR_0011s05830 | Pt-ETT.2 | |||
| ATHB8 (Arabidopsis thaliana homeobox 8) | AT4G32880 | Xylem development | POPTR_0018s08110 | Pt-HB1.5 |
| POPTR_0006s25390 | Pt-HB1.6 | |||
| REV (revoluta) | AT5G60690 | Adaxial axis specification; vascular pattern formation | POPTR_0004s22090 | Pt-HB1.7 |
| POPTR_0009s01990 | Pt-HB1.8 | |||
| HYL (hyponastic leaves 1) | AT1G09700 | Vegetative phase control (Li et al. 2012) | POPTR_0005s19650 | Pt-HYL1.1 |
| POPTR_0002s11200 | Pt-HYL1.2 | |||
| INO (inner-no-outer) | AT1G23420 | Abaxial cell fate specification; ovule development | POPTR_0008s19330 | Pt-INO.1 |
| POPTR_0010s05220 | Pt-INO.2 | |||
| KAN (KANADI 1) | AT5G16560 | Abaxial identity specification | POPTR_0017s02220 | Pt-KAN.1 |
| POPTR_0004s08070 | Pt-KAN.2 | |||
| POPTR_0015s05340 | Pt-KAN.3 | |||
| POPTR_0012s03900 | Pt-KAN.4 | |||
| KAN2, KAN3 (KANADI 2, KANADI3) | AT1G32240 AT4G17695 | Abaxial cell fate specification; ovule development | POPTR_0003s09490 | Pt-KAN2/3.1 |
| POPTR_0001s02010 | Pt-KAN2/3.2 | |||
| PHB (phabulosa)PHV (phavoluta) | AT2G34710 AT1G30490 | Adaxial cell fate specification | POPTR_0011s10070 | Pt-PHB.1 |
| POPTR_0001s38120 | Pt-PHB.2 | |||
| PGY1 (piggyback 1) | AT2G27530 | Adaxial pattern specification; AS1 enhancer | POPTR_0007s11880 | Pt-PGY1.1 |
| PGY2 (piggyback 2) | AT1G33140 | Adaxial pattern specification; AS1 enhancer | POPTR_0001s45810 | Pt-PGY2.1 |
| POPTR_0011s15170 | Pt-PGY2.2 | |||
| PGY3 (piggyback 3) | AT3G25520 | Adaxial pattern specification | POPTR_0013s13220 | Pt-PGY3.1 |
| RDR6 (RNA-dependent RNA polymerase 6) | AT3G49500 | Leaf development | POPTR_0006s26980 | Pt-RDR6.1 |
| POPTR_0018s01670 | Pt-RDR6.2 | |||
| SE (serrate) | AT2G27100 | Adaxial/abaxial pattern regulation | POPTR_0004s20730 | Pt-SE.1 |
| POPTR_0009s16020 | Pt-SE.2 | |||
| SGS3 (suppressor of gene silencing 3) | AT5G23570 | Vegetative phase change | POPTR_0019s00300 | Pt-SGS3.1 |
| POPTR_0001s07410 | Pt-SGS3.2 | |||
| POPTR_0001s07420 | Pt-SGS3.3 | |||
| POPTR_0003s18660 | Pt-SGS3.4 | |||
| POPTR_0003s18670 | Pt-SGS3.5 | |||
| POPTR_0003s18680 | Pt-SGS3.6 | |||
| POPTR_0003s18690 | Pt-SGS3.7 | |||
| POPTR_0003s01530 | Pt-SGS3.8 | |||
| SPL4 (squamosa promoter binding-like 4) | AT1G53160 | Vegetative phase change | POPTR_0001s40870 | Pt-SPL4.1 |
| POPTR_0011s11770 | Pt-SPL4.2 | |||
| SPL4, SPL3 (squamosa promoter binding-like 3) | AT2G33810 (SPL3) | Vegetative phase change regulation | POPTR_0004s04630 | Pt-SPL43.1 |
| POPTR_0011s05480 | Pt-SPL43.2 | |||
| SPL9 (squamosa promoter binding-like 9) | AT2G42200 | Vegetative to reproductive phase change transition | POPTR_0016s04890 | Pt-SPL9.1 |
| YAB2 (YABBY 2) | AT1G08465 | Abaxial cell fate specification | POPTR_0001s22180 | Pt-YAB2.1 |
| POPTR_0127s00201 | Pt-YAB2.2 | |||
| POPTR_0016s06760 | Pt-YAB2.3 | |||
| YAB3 (YABBY 3) | AT4G00180 | Abaxial cell fate specification | POPTR_0003s11230 | Pt-YAB3.1 |
| POPTR_0001s00240 | Pt-YAB3.2 | |||
| YAB5 (YABBY 5) | AT2G26580 | Abaxial cell fate specification | POPTR_0006s06700 | Pt-YAB5.1 |
| Abaxial cell fate specification | POPTR_0018s12990 | Pt-YAB5.2 | ||
| YUC (yucca) | AT4G32540 | Auxin biosynthesis; regulation of leaf development | POPTR_0006s26430 | Pt-YUC.2 |
| POPTR_0018s01210 | Pt-YUC.1 | |||
| YUC2 (yucca 2) | AT4G13260 | Auxin biosynthesis | POPTR_0006s26000 | Pt-YUC2.1 |
| POPTR_0018s00840 | Pt-YUC2.2 | |||
| ZPR1 (little zipper 1) | AT2G45450 | Adaxial cell fate specification; interacts with REV | POPTR_0003s11710 | Pt-ZPR1.1 |
| POPTR_0001s08220 | Pt-ZPR1.2 | |||
| ZPR2 (little zipper 2) | AT3G60890 | Adaxial cell fate specification | POPTR_0002s15060 | Pt-ZPR2.1 |
| POPTR_0014s06690 | Pt-ZPR2.2 | |||
| ZPR3 (little zipper 3) | AT3G52770 | Adaxial cell fate specification | POPTR_0006s08320 | Pt-ZPR3.1 |
| POPTR_0010s24410 | Pt-ZPR3.2 |
Table S2.
Transcriptome data for leaf tissues comparing black cottonwood (Ptr) and hybrid aspen (Ptmx) expression levels (RPKM) analyzed using RT-PCR. Grey shading denotes genes that have higher expression (RPKM) in hybrid aspen, compared to black cottonwood. A significant difference in expression levels between two species is determined with p-value < 0.05 (underlined). Bolded genes indicate RPKM > 5 in either species. Asterisks (*) indicate genes that were analyzed further with qRT-PCR.
| Gene id | Gene name | Ptr mean RPKM | Ptmx mean RPKM | p-value |
|---|---|---|---|---|
| POPTR_0008s06540 | Pt-AE3.1 | 57.44 ± 8.16 | 40.04 ± 6.03 | 0.0221 |
| POPTR_0008s06550 | Pt-AE3.2 | 130.53 ± 7.99 | 95.61 ± 12.10 | 0.0077 |
| POPTR_0001s01820 | Pt-AE7.1 | 14.13 ± 4.50 | 11.69 ± 0.74 | 0.3228 |
| POPTR_0003s09670 | Pt-AE7.2 * | 26.16 ± 6.35 | 16.34 ± 1.34 | 0.0268 |
| POPTR_0014s06210 | Pt-AFO.1 | 98.67 ± 16.85 | 52.38 ± 25.72 | 0.0437 |
| POPTR_0002s14600 | Pt-AFO.2 | 115.90 ± 22.05 | 58.60 ± 24.51 | 0.0244 |
| POPTR_0012s03410 | Pt-AGO1.1 | 68.79 ± 21.07 | 80.39 ± 13.30 | 0.4085 |
| POPTR_0015s05550 | Pt-AGO1.2* | 32.07 ± 11.43 | 30.67 ± 6.36 | 0.8422 |
| POPTR_0009s00660 | Pt-AGO7.1 | 7.09 ± 2.27 | 7.05 ± 0.88 | 0.9738 |
| POPTR_0010s17100 | Pt-AGO7.4 * | 29.99 ± 5.89 | 24.16 ± 14.50 | 0.5471 |
| POPTR_0008s15860 | Pt-AGO10.1 * | 12.84 ± 5.27 | 21.34 ± 6.48 | 0.1241 |
| POPTR_0010s09150 | Pt-AGO10.2 | 30.49 ± 10.63 | 17.88 ± 8.20 | 0.1343 |
| POPTR_0013s04090 | Pt-AN3.1 | 44.23 ± 11.87 | 33.86 ± 14.80 | 0.3674 |
| POPTR_0019s02320 | Pt-AN3.2 | 94.75 ± 41.53 | 76.91 ± 43.04 | 0.6057 |
| POPTR_0009s01700 | Pt-ARF4.1 | 25.40 ± 9.95 | 24.31 ± 4.08 | 0.8477 |
| POPTR_0006s08610 | Pt-AS1.1 * | 52.68 ± 7.63 | 82.05 ± 41.07 | 0.2857 |
| POPTR_0004s10250 | Pt-AS1.2 * | 25.90 ± 13.53 | 7.36 ± 5.93 | 0.0544 |
| POPTR_0017s13950 | Pt-AS1.3 | 51.14 ± 9.22 | 40.39 ± 11.10 | 0.2334 |
| POPTR_0010s18460 | Pt-AS2.1 * | 23.81 ± 5.22 | 9.81 ± 6.46 | 0.0282 |
| POPTR_0008s07930 | Pt-AS2.2 * | 4.85 ± 0.24 | 1.07 ± 0.75 | 0.0004 |
| POPTR_0003s04860 | Pt-ATHB.11 | 13.90 ± 4.42 | 16.57 ± 6.17 | 0.5555 |
| POPTR_0001s18930 | Pt-ATHB.12 | 14.90 ± 4.21 | 36.77 ± 12.95 | 0.0399 |
| POPTR_0002s13170 | Pt-ATS.1 | 5.59 ± 0.60 | 4.54 ± 2.29 | 0.4815 |
| POPTR_0014s03650 | Pt-ATS.2 * | 13.96 ± 3.14 | 35.83 ± 7.50 | 0.0055 |
| POPTR_0008s09740 | Pt-CRC.1 | 0.00 | 0.02 ± 0.03 | 0.2751 |
| POPTR_0010s16410 | Pt-CRC.2 | 0.00 | 0.00 | n/a |
| POPTR_0006s20310 | Pt-DCL4.1 | 2.54 ± 1.04 | 4.97 ± 1.47 | 0.0592 |
| POPTR_0005s12480 | Pt-DUF59.1 | 23.32 ± 9.89 | 21.87 ± 3.62 | 0.7928 |
| POPTR_0004s04970 | Pt-ETT.1 | 17.98 ± 5.65 | 20.09 ± 2.29 | 0.5199 |
| POPTR_0011s05830 | Pt-ETT.2 | 6.33 ± 1.56 | 8.77 ± 2.76 | 0.2322 |
| POPTR_0018s08110 | Pt-HB1.5 (ATHB8) | 6.76 ± 2.39 | 19.63 ± 6.46 | 0.0234 |
| POPTR_0006s25390 | Pt-HB1.6 (ATHB8) | 32.29 ± 7.56 | 23.22 ± 3.89 | 0.0897 |
| POPTR_0004s22090 | Pt-HB1.7 (REV) | 6.04 ± 2.20 | 10.26 ± 3.55 | 0.1330 |
| POPTR_0009s01990 | Pt-HB1.8 (REV) | 25.92 ± 8.83 | 9.02 ± 1.62 | 0.0118 |
| POPTR_0005s19650 | Pt-HYL1.1 | 16.41 ± 5.81 | 19.42 ± 2.47 | 0.3851 |
| POPTR_0002s11200 | Pt-HYL1.2 | 5.71 ± 1.29 | 8.58 ± 0.69 | 0.0121 |
| POPTR_0008s19330 | Pt-INO.1 | 0.01 ± 0.01 | 0.00 | 0.2856 |
| POPTR_0010s05220 | Pt-INO.2 | 0.01 ± 0.02 | 0.00 | 0.2856 |
| POPTR_0017s02220 | Pt-KAN.1 | 4.80 ± 0.39 | 7.01 ± 5.89 | 0.5545 |
| POPTR_0004s08070 | Pt-KAN.2 | 15.22 ± 1.36 | 9.80 ± 0.67 | 0.0009 |
| POPTR_0015s05340 | Pt-KAN.3 | 2.61 ± 1.64 | 6.26 ± 1.94 | 0.0471 |
| POPTR_0012s03900 | Pt-KAN.4 | 3.27 ± 2.60 | 2.48 ± 0.85 | 0.5828 |
| POPTR_0003s09490 | Pt-KAN2/3.1 | 8.34 ± 0.93 | 1.08 ± 0.29 | 2.281 × 10−05 |
| POPTR_0001s02010 | Pt-KAN2/3.2 | 5.48 ± 1.11 | 7.81 ± 2.46 | 0.1925 |
| POPTR_0011s10070 | Pt-PHB.1 | 27.16 ± 5.37 | 45.01 ± 8.31 | 0.0238 |
| POPTR_0001s38120 | Pt-PHB.2 | 25.69 ± 9.86 | 8.84 ± 1.02 | 0.0171 |
| POPTR_0007s11880 | Pt-PGY1.1 | 197.62 ± 39.30 | 99.77 ± 34.79 | 0.0174 |
| POPTR_0001s45810 | Pt-PGY2.1 | 61.44 ± 25.32 | 41.11 ± 19.57 | 0.2812 |
| POPTR_0011s15170 | Pt-PGY2.2 | 129.11 ± 57.05 | 63.09 ± 17.23 | 0.0746 |
| POPTR_0013s13220 | Pt-PGY3.1 * | 406.38 ± 60.21 | 428.42 ± 107.56 | 0.7654 |
| POPTR_0006s26980 | Pt-RDR6.1 * | 5.83 ± 2.12 | 15.81 ± 1.06 | 0.0004 |
| POPTR_0018s01670 | Pt-RDR6.2 * | 1.13 ± 0.39 | 8.05 ± 2.57 | 0.0063 |
| POPTR_0004s20730 | Pt-SE.1 | 19.68 ± 2.93 | 24.42 ± 3.09 | 0.0956 |
| POPTR_0009s16020 | Pt-SE.2 | 25.06 ± 2.54 | 26.09 ± 5.93 | 0.7938 |
| POPTR_0019s00300 | Pt-SGS3.1 | 49.70 ± 3.60 | 44.12 ± 10.69 | 0.4333 |
| POPTR_0001s07410 | Pt-SGS3.2 | 20.06 ± 9.14 | 15.20 ± 15.20 | 0.3650 |
| POPTR_0001s07420 | Pt-SGS3.3 | 0.27 ± 0.22 | 0.39 ± 0.07 | 0.3351 |
| POPTR_0003s18660 | Pt-SGS3.4 | 2.06 ± 0.65 | 1.84 ± 0.54 | 0.6411 |
| POPTR_0003s18670 | Pt-SGS3.5 | 0.30 ± 0.07 | 0.10 ± 0.04 | 0.0061 |
| POPTR_0003s18680 | Pt-SGS3.6 | 3.56 ± 0.07 | 2.99 ± 0.89 | 0.4061 |
| POPTR_0003s18690 | Pt-SGS3.7 | 0.41 ± 0.14 | 0.15 ± 0.06 | 0.0188 |
| POPTR_0003s01530 | Pt-SGS3.8 | 2.22 ± 1.37 | 9.80 ± 6.01 | 0.0898 |
| POPTR_0001s40870 | Pt-SPL4.1 * | 28.12 ± 3.72 | 60.65 ± 8.68 | 0.0019 |
| POPTR_0011s11770 | Pt-SPL4.2 | 9.61 ± 0.10 | 11.10 ± 7.10 | 0.7370 |
| POPTR_0004s04630 | Pt-SPL43.1 | 2.70 ± 0.96 | 9.59 ± 9.15 | 0.2605 |
| POPTR_0011s05480 | Pt-SPL43.2 * | 51.31 ± 15.58 | 65.37 ± 24.85 | 0.4335 |
| POPTR_0016s04890 | Pt-SPL9.1 | 4.74 ± 1.95 | 9.24 ± 4.78 | 0.1914 |
| POPTR_0001s22180 | Pt-YAB2.1 | 102.90 ± 13.76 | 1.97 ± 1.53 | 2.352 × 10−05 |
| POPTR_0127s00201 | Pt-YAB2.2 | 16.82 ± 5.87 | 58.12 ± 30.25 | 0.0717 |
| POPTR_0016s06760 | Pt-YAB2.3 | 75.42 ± 16.33 | 64.62 ± 29.43 | 0.5962 |
| POPTR_0003s11230 | Pt-YAB3.1 | 61.42 ± 10.31 | 114.00 ± 51.14 | 0.1470 |
| POPTR_0001s00240 | Pt-YAB3.2 * | 14.74 ± 2.50 | 66.94 ± 10.40 | 0.0004 |
| POPTR_0006s06700 | Pt-YAB5.1 | 47.58 ± 19.28 | 60.05 ± 2.61 | 0.2434 |
| POPTR_0018s12990 | Pt-YAB5.2 | 220.13 ± 18.32 | 0.01 ± 0.01 | 1.959 × 10−06 |
| POPTR_0006s26430 | Pt-YUC.2 | 1.35 ± 0.63 | 1.08 ± 0.77 | 0.6348 |
| POPTR_0018s01210 | Pt-YUC.1 | 3.45 ± 1.59 | 1.27 ± 0.88 | 0.0652 |
| POPTR_0006s26000 | Pt-YUC2.1 | 2.91 ± 0.39 | 4.94 ± 1.81 | 0.1211 |
| POPTR_0018s00840 | Pt-YUC2.2 | 1.01 ± 0.67 | 0.76 ± 0.45 | 0.5844 |
| POPTR_0003s11710 | Pt-ZPR1.1 | 2.81 ± 1.35 | 2.76 ± 0.68 | 0.9491 |
| POPTR_0001s08220 | Pt-ZPR1.2 | 3.20 ± 1.47 | 1.47 ± 0.65 | 0.0845 |
| POPTR_0002s15060 | Pt-ZPR2.1 | 4.29 ± 3.00 | 3.35 ± 1.11 | 0.5780 |
| POPTR_0014s06690 | Pt-ZPR2.2 | 17.75 ± 13.61 | 2.07 ± 1.45 | 0.0643 |
| POPTR_0006s08320 | Pt-ZPR3.1 * | 18.88 ± 10.63 | 5.15 ± 1.65 | 0.0467 |
| POPTR_0010s24410 | Pt-ZPR3.2 * | 0.47 ± 0.19 | 2.62 ± 0.80 | 0.0066 |
Table S3.
Mean Cq values (from qRT-PCR) used to calculate relative expression (aspen relative to black cottonwood) in leaf blades and petioles, graphed in Figure 3 and TIF5A control.
| Gene name | Leaf blade | Leaf petiole | ||||
|---|---|---|---|---|---|---|
| Expression difference | Mean Cq value in black cottonwood | Mean Cq value in aspen | Expression difference | Mean Cq value in black cottonwood | Mean Cq value in aspen | |
| Pt-AE7.2 | - * | 32.28 | 34.69 | - * | 31.62 | 34.11 |
| Pt-AS1.1 | NS | 35.01 | 34.54 | - * | 32.15 | 34.44 |
| Pt-AS1.2 | + * | 32.92 | 32.27 | NS | 34.04 | 33.81 |
| Pt-AS2.1 | - * | 31.01 | 36.12 | NS | 36.30 | 35.90 |
| Pt-AS2.2 | NS | 32.10 | 33.80 | NS | 34.10 | 36.37 |
| Pt-ATS.2 | - * | 32.97 | 35.11 | NS | 36.71 | 36.53 |
| TIF5A | NS | 28.33 | 28.97 | NS | 27.07 | 28.39 |
- denotes lower transcript abundance or expression level in hybrid aspen or European aspen (for mRNA-seq data) in comparison to black cottonwood; + denotes higher transcript abundance or expression level in hybrid aspen or European aspen; asterisk (*) denotes significant difference in gene expression; NS – not significant.
© 2013 by the authors; licensee MDPI, Basel, Switzerland. This article is an open access article distributed under the terms and conditions of the Creative Commons Attribution license (http://creativecommons.org/licenses/by/3.0/).
Share and Cite
MDPI and ACS Style
Nowak, J.S.; Douglas, C.J.; Cronk, Q.C.B. Abaxial Greening Phenotype in Hybrid Aspen. Plants 2013, 2, 279-301. https://doi.org/10.3390/plants2020279
AMA Style
Nowak JS, Douglas CJ, Cronk QCB. Abaxial Greening Phenotype in Hybrid Aspen. Plants. 2013; 2(2):279-301. https://doi.org/10.3390/plants2020279
Chicago/Turabian StyleNowak, Julia S., Carl J. Douglas, and Quentin C.B. Cronk. 2013. "Abaxial Greening Phenotype in Hybrid Aspen" Plants 2, no. 2: 279-301. https://doi.org/10.3390/plants2020279