Article

Molecular Mapping of D1, D2 and ms5 Revealed Linkage between the Cotyledon Color Locus D2 and the Male-Sterile Locus ms5 in Soybean

1
Department of Biology, University of Wisconsin-Stevens Point, Stevens Point, WI 54481, USA
2
Department of Agronomy, Iowa State University, Ames, IA 50011, USA
3
Department of Genetics, Development and Cell Biology, Ames, IA 50011, USA
4
Microscopy and NanoImaging Facility, Iowa State University, Ames, IA 50011, USA
*
Author to whom correspondence should be addressed.
Plants 2013, 2(3), 441-454; https://doi.org/10.3390/plants2030441
Submission received: 2 May 2013 / Revised: 15 June 2013 / Accepted: 26 June 2013 / Published: 5 July 2013
(This article belongs to the Special Issue Developmental Biology and Biotechnology of Plant Sexual Reproduction)

Abstract

:
In soybean, genic male sterility can be utilized as a tool to develop hybrid seed. Several male-sterile, female-fertile mutants have been identified in soybean. The male-sterile, female-fertile ms5 mutant was selected after fast neutron irradiation. Male-sterility due to ms5 was associated with the “stay-green” cotyledon color mutation. The cotyledon color trait in soybean is controlled by two loci, D1 and D2. Association between cotyledon color and male-sterility can be instrumental in early phenotypic selection of sterility for hybrid seed production. The use of such selection methods saves time, money, and space, as fewer seeds need to be planted and screened for sterility. The objectives of this study were to compare anther development between male-fertile and male-sterile plants, to investigate the possible linkages among the Ms5, D1 and D2 loci, and to determine if any of the d1 or d2 mutations can be applied in hybrid seed production. The cytological analysis during anther development displayed optically clear, disintegrating microspores and enlarged, engorged pollen in the male-sterile, female-fertile ms5ms5 plants, a common characteristic of male-sterile mutants. The D1 locus was mapped to molecular linkage group (MLG) D1a and was flanked by Satt408 and BARCSOYSSR_01_1622. The ms5 and D2 loci were mapped to MLG B1 with a genetic distance ~12.8 cM between them. These results suggest that use of the d2 mutant in the selection of male-sterile line may attenuate the cost hybrid seed production in soybean.

1. Introduction

Mutations that affect microsporogenesis and microgametogenesis leading to male sterility have been described for many plant species [1]. Several meiotic mutations have been identified in soybean (Glycine max (L.) Merrill) [2]. These include mutations affecting male and female meiosis (st mutants), mutations that affect only male development and cause male-sterility by cytoplasmic genes (cms) or nuclear genes (ms mutants), and mutations that affect only the female and cause female partial sterility (fsp mutants) [2].
Manual cross-pollination for the production of large quantities of hybrid soybean seeds can be difficult and time consuming. Male-sterile mutants are considered a powerful tool in hybrid breeding programs. A cytoplasmic male sterility (CMS) system is the ideal for hybrid seed production [1]. Several cms systems have been reported in soybean, and are being studied for their potential in hybrid seed production [3,4,5,6,7].
Alternatively, several methods have been proposed to use nuclear genic male-sterile plants to produce hybrid seed [8,9]. Genic male sterility in soybean is used to improve efficiency of hybridization by eliminating tedious hand emasculations, to enhance random mating for population development [10,11,12] and recurrent selection [13], and to facilitate the development of testers for inbred line evaluation and development [12,14]. So far, in soybean, eleven nuclear male-sterile, female-fertile mutants have been reported [2,15].
There are several reports of DNA markers linked to male-sterile, female-fertile genes in soybean. The Midwest Oilseed male-sterile (msMOS) was positioned on MLG D1b of the USDA-ARS-ISU map and segregated as a single recessive Mendelian locus [15]. Male-sterile, female-fertile mutant ms3 (T284) was also positioned on MLG D1b [16], in the same chromosomal region as msMOS, and female-partial sterile I (FspI) mutant [17]. The ms2 and ms9 mutants were positioned on MLG O and MLG N, respectively [16]. Two additional, environmentally sensitive male-sterile, female-fertile mutants, msp and ms8, that showed variable fertility based on the night temperature, were mapped to MLG D1b and M, respectively [18]. All male-sterile, female-fertile genes are non-allelic.
Recent soybean heterosis studies revealed 42% increased seed yield over that of the mean parent yield [19,20,21]. Positive heterosis values for seed yield from cytoplasmic male-sterile systems have been reported in a recent International Conference on Utilization of Heterosis in Crops [22,23,24,25]. Recent discoveries of nuclear male-sterile and cytoplasmic-genetic male-sterile systems have enhanced the feasibility of F1 hybrids in commercial soybean production. In the final analysis, the success of F1 hybrid soybean will require the efficient transfer of fertile pollen from the male parents to the male-sterile, female-fertile parents. As soybean flower morphology is adapted for self-pollination, a well-developed functional nectary [26], together with a suitable insect pollen vector system, is a practical solution for F1 seed production in soybean. Insect-mediated cross-pollination has been improved through phenotypic recurrent selection for enhancing hybrid seed production in soybean [14,27].
The ms5 male-sterile, female-fertile mutant (T277) was the result of fast neutron irradiation [28]. The mutant is inherited as a single-gene recessive trait; however, no cytological studies have been conducted. The cotyledon color trait in soybean is controlled by two loci: D1 and D2 [29,30]. Carter and Burton [31] discovered an association between the green cotyledon trait and the ms5 locus. Due to the distinctive nature of the cotyledon color phenotype, this association can play an important role in screening for true hybrid seed. A male-sterile line that had the green cotyledon trait could be used as female parent with any yellow-seeded male parent. Selfed seeds on the green cotyledon female parent will be green. However, hybrid seeds from pollination with pollen from yellow cotyledon plants will be yellow. Thus F1 hybrid seeds can be identified prior to planting [32]. Cooper and Tew [33] demonstrated use of the linkage between ms5 and green cotyledon, to produce seed homozygous for male sterility, which may become instrumental in facilitating hybrid seed production in soybean [2]. The objectives of this study were to compare anther development between male-fertile and male-sterile plants, to investigate the possible linkages among the Ms5, D1 and D2 loci and to determine if any of the d1 or d2 mutations can be applied in hybrid seed production.

2. Materials and Methods

2.1. Microscopy: ms5

Near-anthesis anthers were collected in Carnoy’s fixative and then stained with iodine-potassium iodide to identify both filled and empty pollen grains [34]. Stained anthers were squashed between a slide and coverslip to expose the pollen for bright-field microscopy.
Both Ms5Ms5 and ms5ms5 anthers were dissected from very young buds through open flowers to obtain the full range of microsporogenesis (from sporogenous mass stage to late microspore stage) and microgametogenesis (young to dehiscing pollen). Whole anthers at all stages were immediately immersed in fixative at room temperature (RT), consisting of 2% glutaraldehyde and 2% paraformaldehyde in a 0.1 M cacodylate buffer (v/v), pH 7.24, and stored at 4 °C for 48 h [35]. Anthers were thoroughly rinsed in 3 changes of cold buffer for 30 min each, followed by a secondary fixative of 1% osmium tetroxide in the same buffer at room temperature for 4 h. Anthers were washed several times in deionized water for a total of 1 h and then placed in a 2% aqueous solution of uranyl acetate (bulk staining) for 4 h. Anthers were rinsed in deionized water for about 1 h and then subjected to an ascending acetone dehydration series (10%, 20%, 30%, 50%, 70%, 90%, 100%, 100% ultrapure). Spurr’s resin (hard) [36] infiltration steps of 5:1 (acetone:resin mixture), 3:1, 1;1, 1:3, and 1:5 were carried out over several days and were followed by 2 changes of pure resin mixture before flat casting and polymerization at 60 °C for 2 d [35].
Anthers were cut out of the casts and oriented to produce cross sections. One-micrometer-thick sections were cut with a diamond knife using a Leica Ultracut S Ultramicrotome, placed on droplets of deionized water on glass slides and dried down on a warming tray. Sections were stained with a dilute solution of toluidine blue O and dried. Permount mounting medium was added along with a coverslip.
Anther sections and pollen grain squashes were viewed with either an Olympus BH10 or a Zeiss Axioplan II light microscope in the bright-field mode and imaged using 20× and 40× objectives and images were captured with an attached Zeiss MrC digital camera on each microscope. Captured black and white images were processed in CSS Adobe PhotoShop and Illustrator for display.

2.2. Mapping Population: ms5

A segregating F2 population derived from self-pollination of F1 seed was developed from the cross of cultivar Manchu (PI 30593; Ms5Ms5) × T277H, Ms5ms5. Fertile plants from segregating progeny of T277H were used as male parents. Manchu was used as the female parent.
During the summer of 2005, F2 plants of the cross Manchu × T277H were grown at the Bruner Farm near Ames, Iowa. About 220 seeds of each F2 family were planted with 15 cm between plants within a row. At the beginning of flowering, stage R1 [37], flowers of 10 plants per F2 family were collected to identify ms5 segregation by the presence of aborted pollen grains. On that basis, one segregating F2 family was selected as the mapping population, which consisted of 103 plants (Table 1). At maturity, each F2 plant was phenotypically scored as either fertile or sterile. The fertile plants were single-plant threshed.
Table 1. F2 and F2:3 segregation patterns, Chi-square and P-values for populations of Manchu (Ms5Ms5) × T277H (Ms5ms5).
PopulationNo. F2 plantsNo. F2:3 families
FertileSterileχ2 (3:1)PAll fertileSegregatingχ2 (1:2)P
A12-g-8A76270.080.7825510.010.94

2.3. Progeny Testing: ms5

The F3 seeds from individual F2 fertile plants were harvested, and seeds planted in the summer of 2006 at the Bruner Farm. Segregation for fertility/sterility in the F2-derived progeny rows was used to determine the genotype of each fertile F2 plant. The expected phenotypic ratio in the F2 generation was 3:1 (male-fertile:male-sterile plants), and the expected genotypic ratio of the F2:3 population was 1:2:1 (Ms5Ms5:Ms5ms5:ms5ms5).

2.4. Mapping Population: d1d2

Segregating F2 populations were derived from self-pollination of three F1 plants and were developed from the cross of cultivar Minsoy (D1D1D2D2; PI 27890) × cultivar Harosoy isoline for green cotyledon (d1d1d2d2; L69-4267) (Table 2). Minsoy was used as the female parent.
During the summer of 2009, F2 plants of the cross Minsoy × Harosoy (d1d1d2d2) were grown at the Bruner Farm near Ames, Iowa.
Table 2. F2 and F2:3 segregation patterns for cotyledon color, Chi-square and P-values for three populations of Minsoy (D1D1D2D2; PI 27890) × Harosoy (d1d1d2d2; L69-4267).
PopulationNo. F2 plantsχ2 (15:1)PNo. F2 familiesχ2 (7:4:4:1)P
YellowGreenAll yellow15:13:1All green
A09-308118510.3261312652.640.45
A09-30911870.010.7648264476.990.07
A09-31011790.170.6855293390.430.94
Total353211.180.2816486103211.810.61

2.5. Progeny Testing: d1d2

F2 and F2:3 seed was phenotypically scored in the field. The expected segregation ratio of 15:1 (yellow:green) was observed for the F2 seed. The expected segregation ratio of 7:4:4:1 (D1_D2_, D1D1__ or __D2D2:D1d1D2d2:D1d1d2d2 or d1d1D2d2:d1d1d2d2) was observed for the F2:3 seed (Table 2). The d1d1d2d2 (green cotyledon color) genotype was true breeding green cotyledon color.
For progeny scoring, the families that were showing all green plants in F2:3 progeny test were scored as “B”. The families that segregated 3:1 in F2:3 were scored as “C”: either D1d1 was heterozygous and d2d2 was homozygous or d1d1 was homozygous and D2d2 was heterozygous. The F2:3 families that segregated 15:1, indicating D1d1 and D2d2, both were heterozygous, were scored as “H”. The F2 plants (D1D1D2D2, D1D1D2d2, D1D1d2d2, D1d1D2D2, d1d1D2D2) that did not segregate for yellow and green cotyledon color in the F2:3 generation were not used for mapping analysis.

2.6. Molecular Analysis

Two young leaves were collected from each parent and F2 plants of the Ms5 and D1D2 mapping populations. A CTAB protocol for DNA extractions described in previous research was followed [38]. The initial SSR screening was done using the bulked segregant analysis (BSA) method [39]. Two green cotyledon bulks were prepared using DNA from 10 green cotyledon plants each. DNA bulks were prepared by pooling 0.5 μg DNA from each of the selected F2 plants. Each bulk was diluted to a final concentration of 50 ng DNA/μL. A total of 600 simple sequence repeat (SSR) markers from the 20 soybean chromosomes were used (Supplemental Table S1). The markers showing polymorphisms between Minsoy and green cotyledon bulks were used to screen 210 selected F2 plants. Additional markers in the regions showing segregation were also used to screen individuals.
A similar method was used for ms5. Two bulks, consisting of 10 male-sterile plants each, were prepared. The markers showing polymorphisms between Manchu and the two male-sterile bulks were used to screen 103 F2 plants. Additional polymorphic markers in the region were also used to screen individuals.
Sequence information for developing SSR markers was obtained from Song et al. (2004) [40] and SoyBase [41]. For SSR analysis, 30 ng DNA was used as the template in a 10 μL reaction containing 1× reaction buffer (10 mM Tris-HCl, 50 mM KCl, pH 8.3), 2.0 mM MgCl2; 0.25 μM of each primer; 200 μM of each dNTP and 0.25 units of Biolase DNA polymerase (Bioline, USA Inc., Taunton, MA, USA). The PCR conditions were as follows: 2 min at 94 °C; 35 cycles of 30 s at 94 °C, 30 s at 47 °C, 1 min at 72 °C; followed by 8 min at 72 °C. The amplification products were separated on a 4% agarose gel and the DNA products were photographed using UV light.

2.7. Data Analysis

Each plant in the F2 population was scored according to its SSR alleles at the locus, for Minsoy or Manchu depending upon the F2 population, i.e., a score of “A” was assigned if the plant was homozygous for the alleles from Minsoy or Manchu, “B” if it was homozygous for the alleles from mutant, and “H” if it was heterozygous. After scoring the population, recombination values were calculated to determine if each given SSR marker was linked to the gene of interest. Mapmaker V3.0 was used to make the final map that included all linked SSR markers [42]. A minimum logarithm of the odd ratio (LOD) score of 3 was used for accepting linkage between two markers. Recombination frequencies were converted to map distances in cM using the Kosambi map function [43].

3. Results

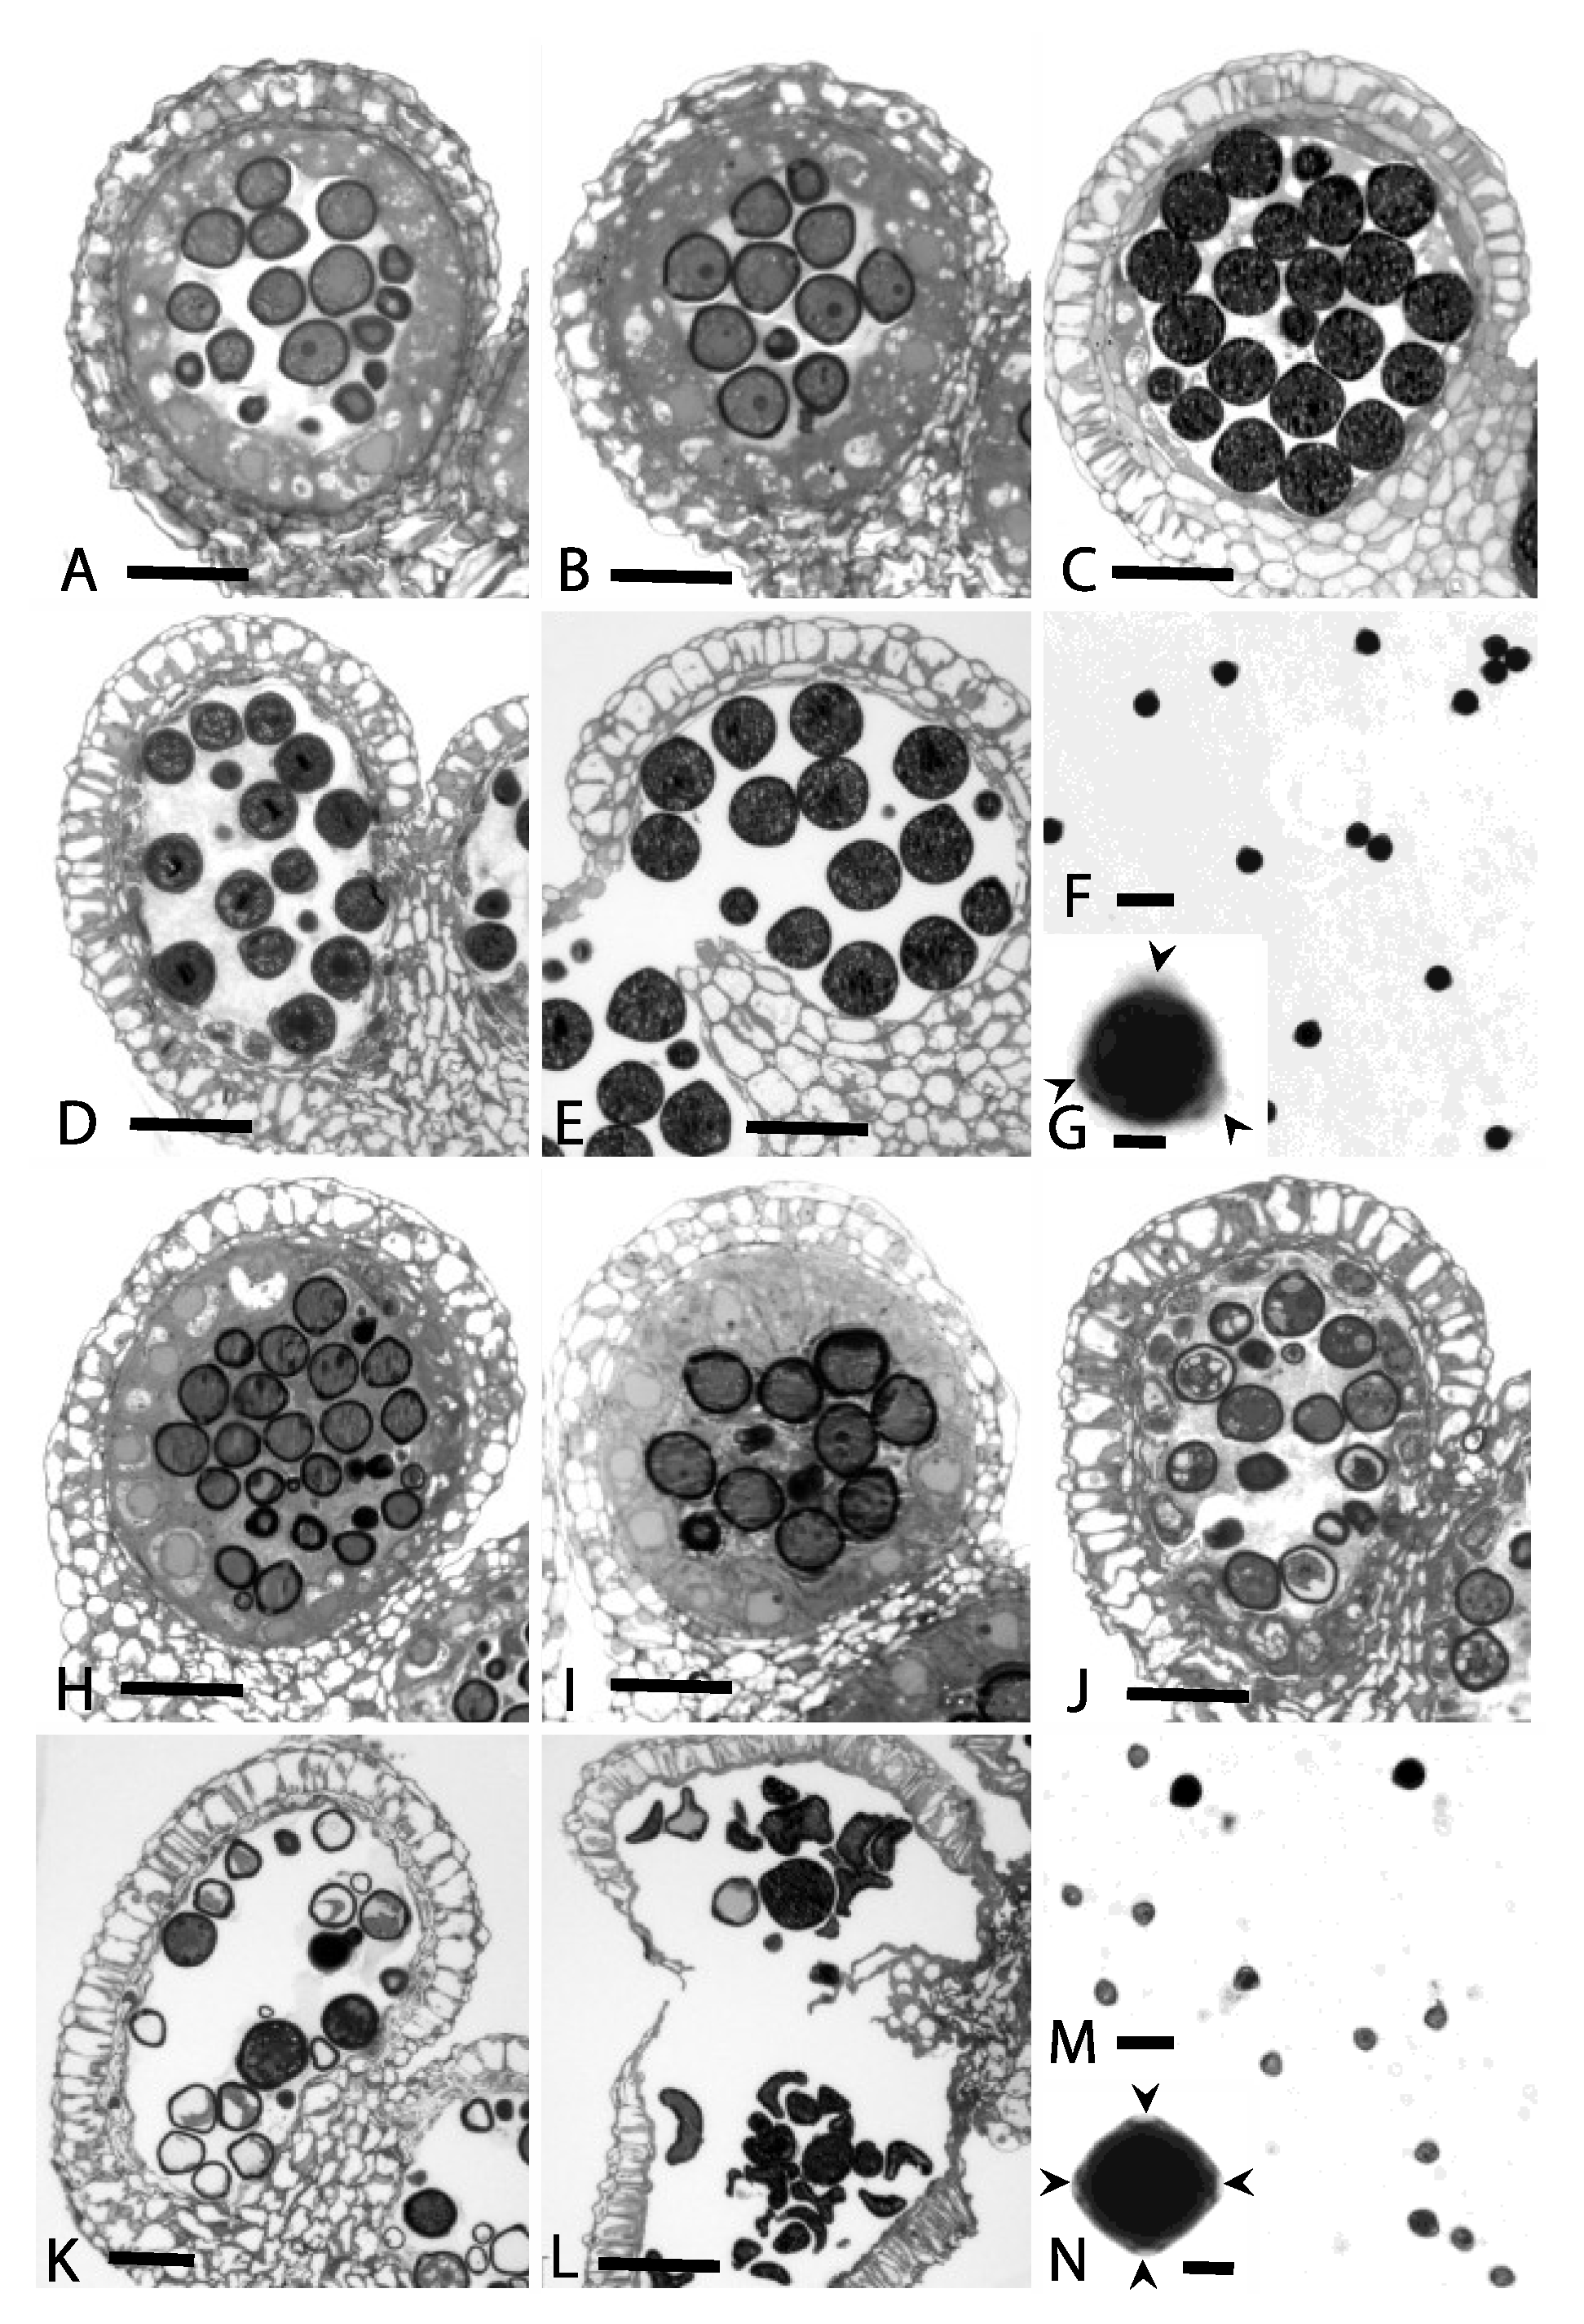
3.1. Cytological Analyses

A microscopic study was conducted to compare the anther development at various stages in male-fertile (Ms5Ms5) versus male-sterile (ms5ms5) floral buds. The male-fertile (MF) line goes through both normal microsporogenesis (Figure 1A,B) and microgametogenesis (Figure 1C–G) ending with dehiscence and pollen release. This normal development contrasts with the ms5ms5 (ms) line (Figure 1H–N) that begins to show abnormal development at the late-microspore/early pollen stage (Figure 1J) with disintegrating microspores and enlarged pollen (male cells). The tapetum surrounding the male cells at this stage is vacuolate and disintegrating. At a slightly later stage (Figure 1K) more vacuolated microspores and enlarged pollen are visible. The tapetum is disintegrated. Near the time of dehiscence (Figure 1L), both collapsed microspores and enlarged pollen are visible in the locules.
The male-fertile line squashes show heavily stained, engorged pollen. These pollen grains are tricolporate (Figure 1G, arrowheads). In contrast, the ms5ms5 squashes show many degenerated and optically clear microspores and enlarged, engorged pollen (Figure 1M). Some of the enlarged, stained pollen display four distinct colpi (Figure 1N, arrowheads).

3.2. Progeny Testing: ms5

The F2 and F2:3 populations from the Manchu (Ms5Ms5) × Ms5ms5 cross showed monogenic inheritance of the ms5 gene. Self-pollination of heterozygous F1 plants from the crosses of Manchu (Ms5Ms5) × Ms5ms5 segregated 3 fertile:1 sterile plant in the F2 generation (Table 1). Each fertile F2 plant, generated from the heterozygous F1 plant, was threshed individually and progenies of each plant were tested for segregation into sterility and fertility phenotypes. The F2:3 family segregation fit the expected 1 homozygous fertile:2 heterozygous ratio (Table 1).
Figure 1. One-μm thick cross sections through male-fertile (MF = A–E) and ms5ms5 (ms = H–L) anthers depicting stages from early-mid microspores through pollen dehiscence, and anther squashes showing both normal (MF = F and G) and aborted or abnormal (ms = M and N) microspores/pollen from both lines. (A) MF = mid-microspore stage with tapetum; (B) MF = late-microspore stage with tapetum; (C) MF = pollen stage with disintegrating tapetum; (D) MF = pollen stage with disintegrated pollen; (E) MF = late pollen stage near dehiscence. Adjacent locules have fused; (F) MF = anther squash showing viable, stained pollen grains; (G) MF = single tricolporate pollen grain with three arrowheads pointing to pore regions; (H) ms = mid-microspore stage with tapetum; (I) ms = mid- to late-microspore stage with tapetum; (J) ms = late-microspore/early pollen stages showing both aborting microspores and enlarged pollen; (K) ms = late-microspore stage with many aborted microspores, an enlarged pollen, and a disintegrated tapetum; (L) ms = disintegrated and collapsed microspores and pollen from two adjacent, fused locules. Tapetum is absent and anther wall has split open; (M) ms = anther squash showing non-staining, non-viable microspores and several abnormal, engorged enlarged pollen; (N) ms = single, engorged pollen with four arrowheads pointing to four colpi. Scale bars = 40 μm on A-E, H-L; 50 μm on F and M; and 25 μm on G and N.
Plants 02 00441 g001

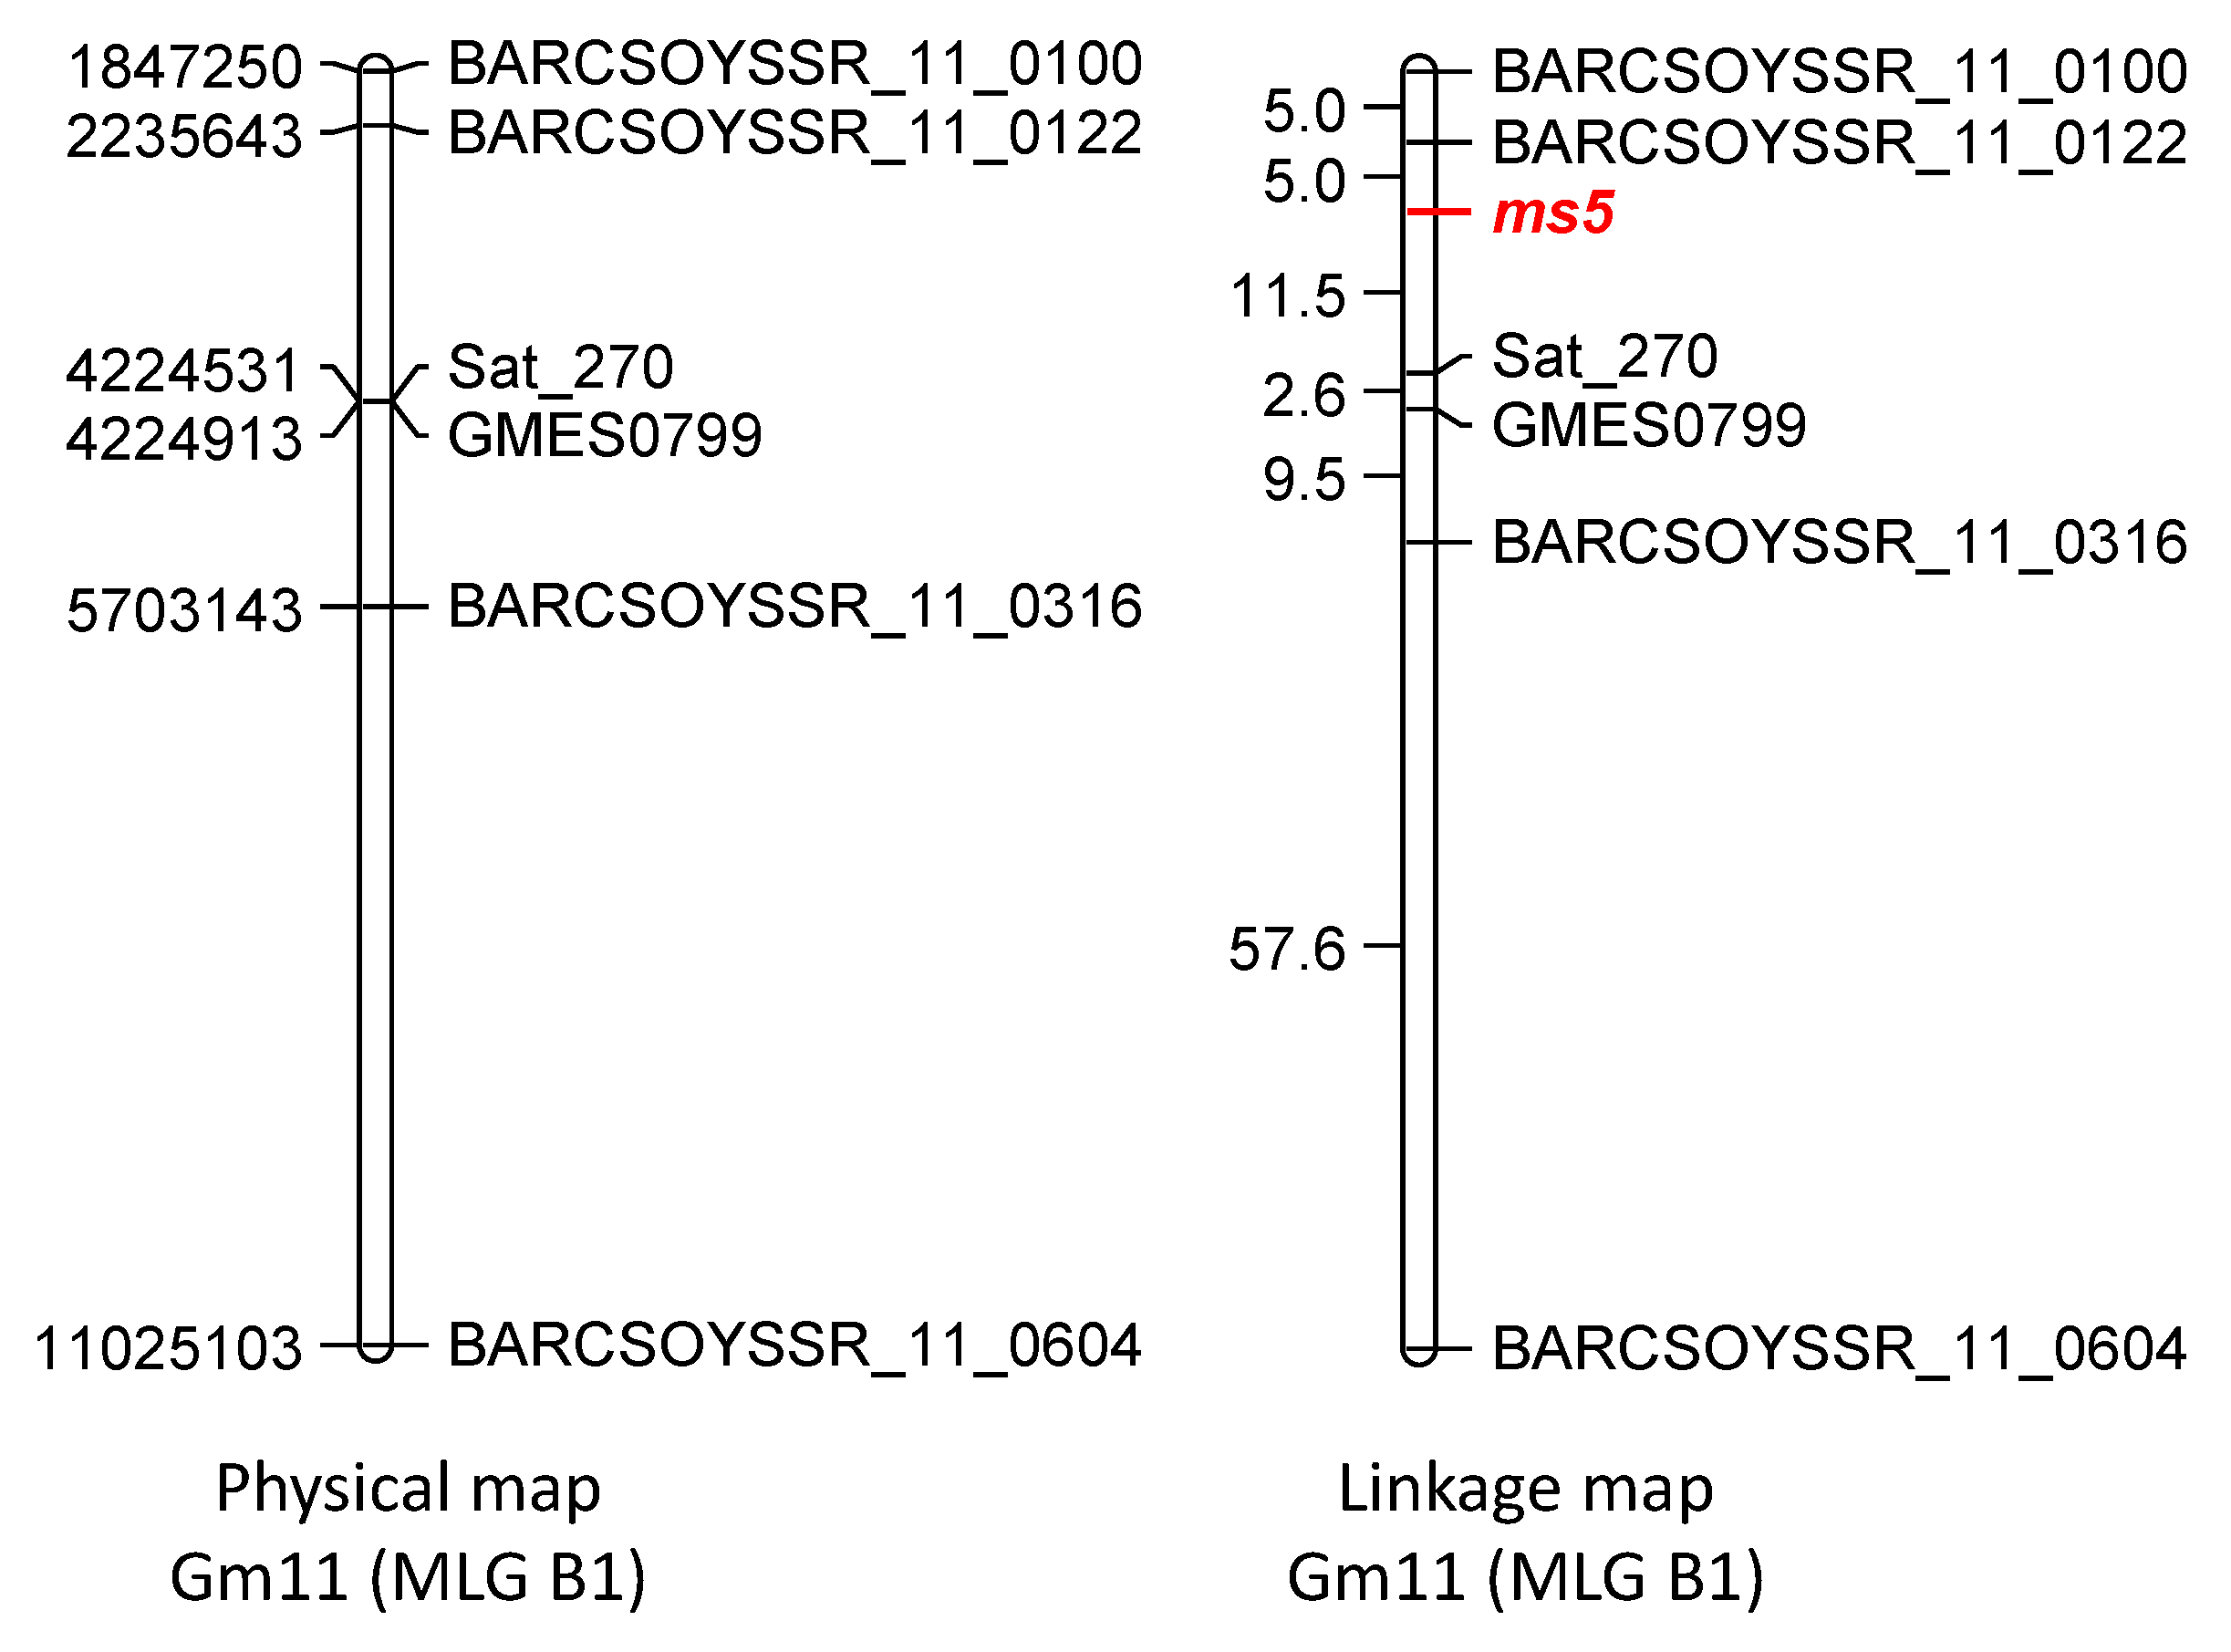
3.3. Molecular Mapping of ms5

BSA was used to map the ms5 gene using 600 SSR markers representing all 20 MLGs (Supplementary Table S1). Sat_270, located on MLG B1, showed putative linkage to ms5. An additional 20 markers from MLG B1 were tested for polymorphisms between parents. Only six markers (BARCSOYSSR_11_0100, BARCSOYSSR_11_0122, Sat_270, GMES0799, BARCSOYSSR_11_0316, and BARCSOYSSR_11_0604) were polymorphic. Analysis of these six polymorphic markers on 103 individual F2 plants allowed generation of a genetic linkage map of the ms5 region. The ms5 locus was positioned between BARCSOYSSR_11_0122 and Sat_270, with the closest marker BARCSOYSSR_11_0122 mapped at a 5.0 cM distance from ms5 (Figure 2).
Figure 2. Genetic linkage mapping of the ms5 gene from the cross Manchu (PI 30593) × T277H; Ms5ms5. Genetic and physical maps of soybean chromosome Gm11 (MLG B1) showing location of the ms5 locus. Genetic distances are shown in centiMorgans (cM) and physical distances are shown in base pairs (bp).
Plants 02 00441 g002

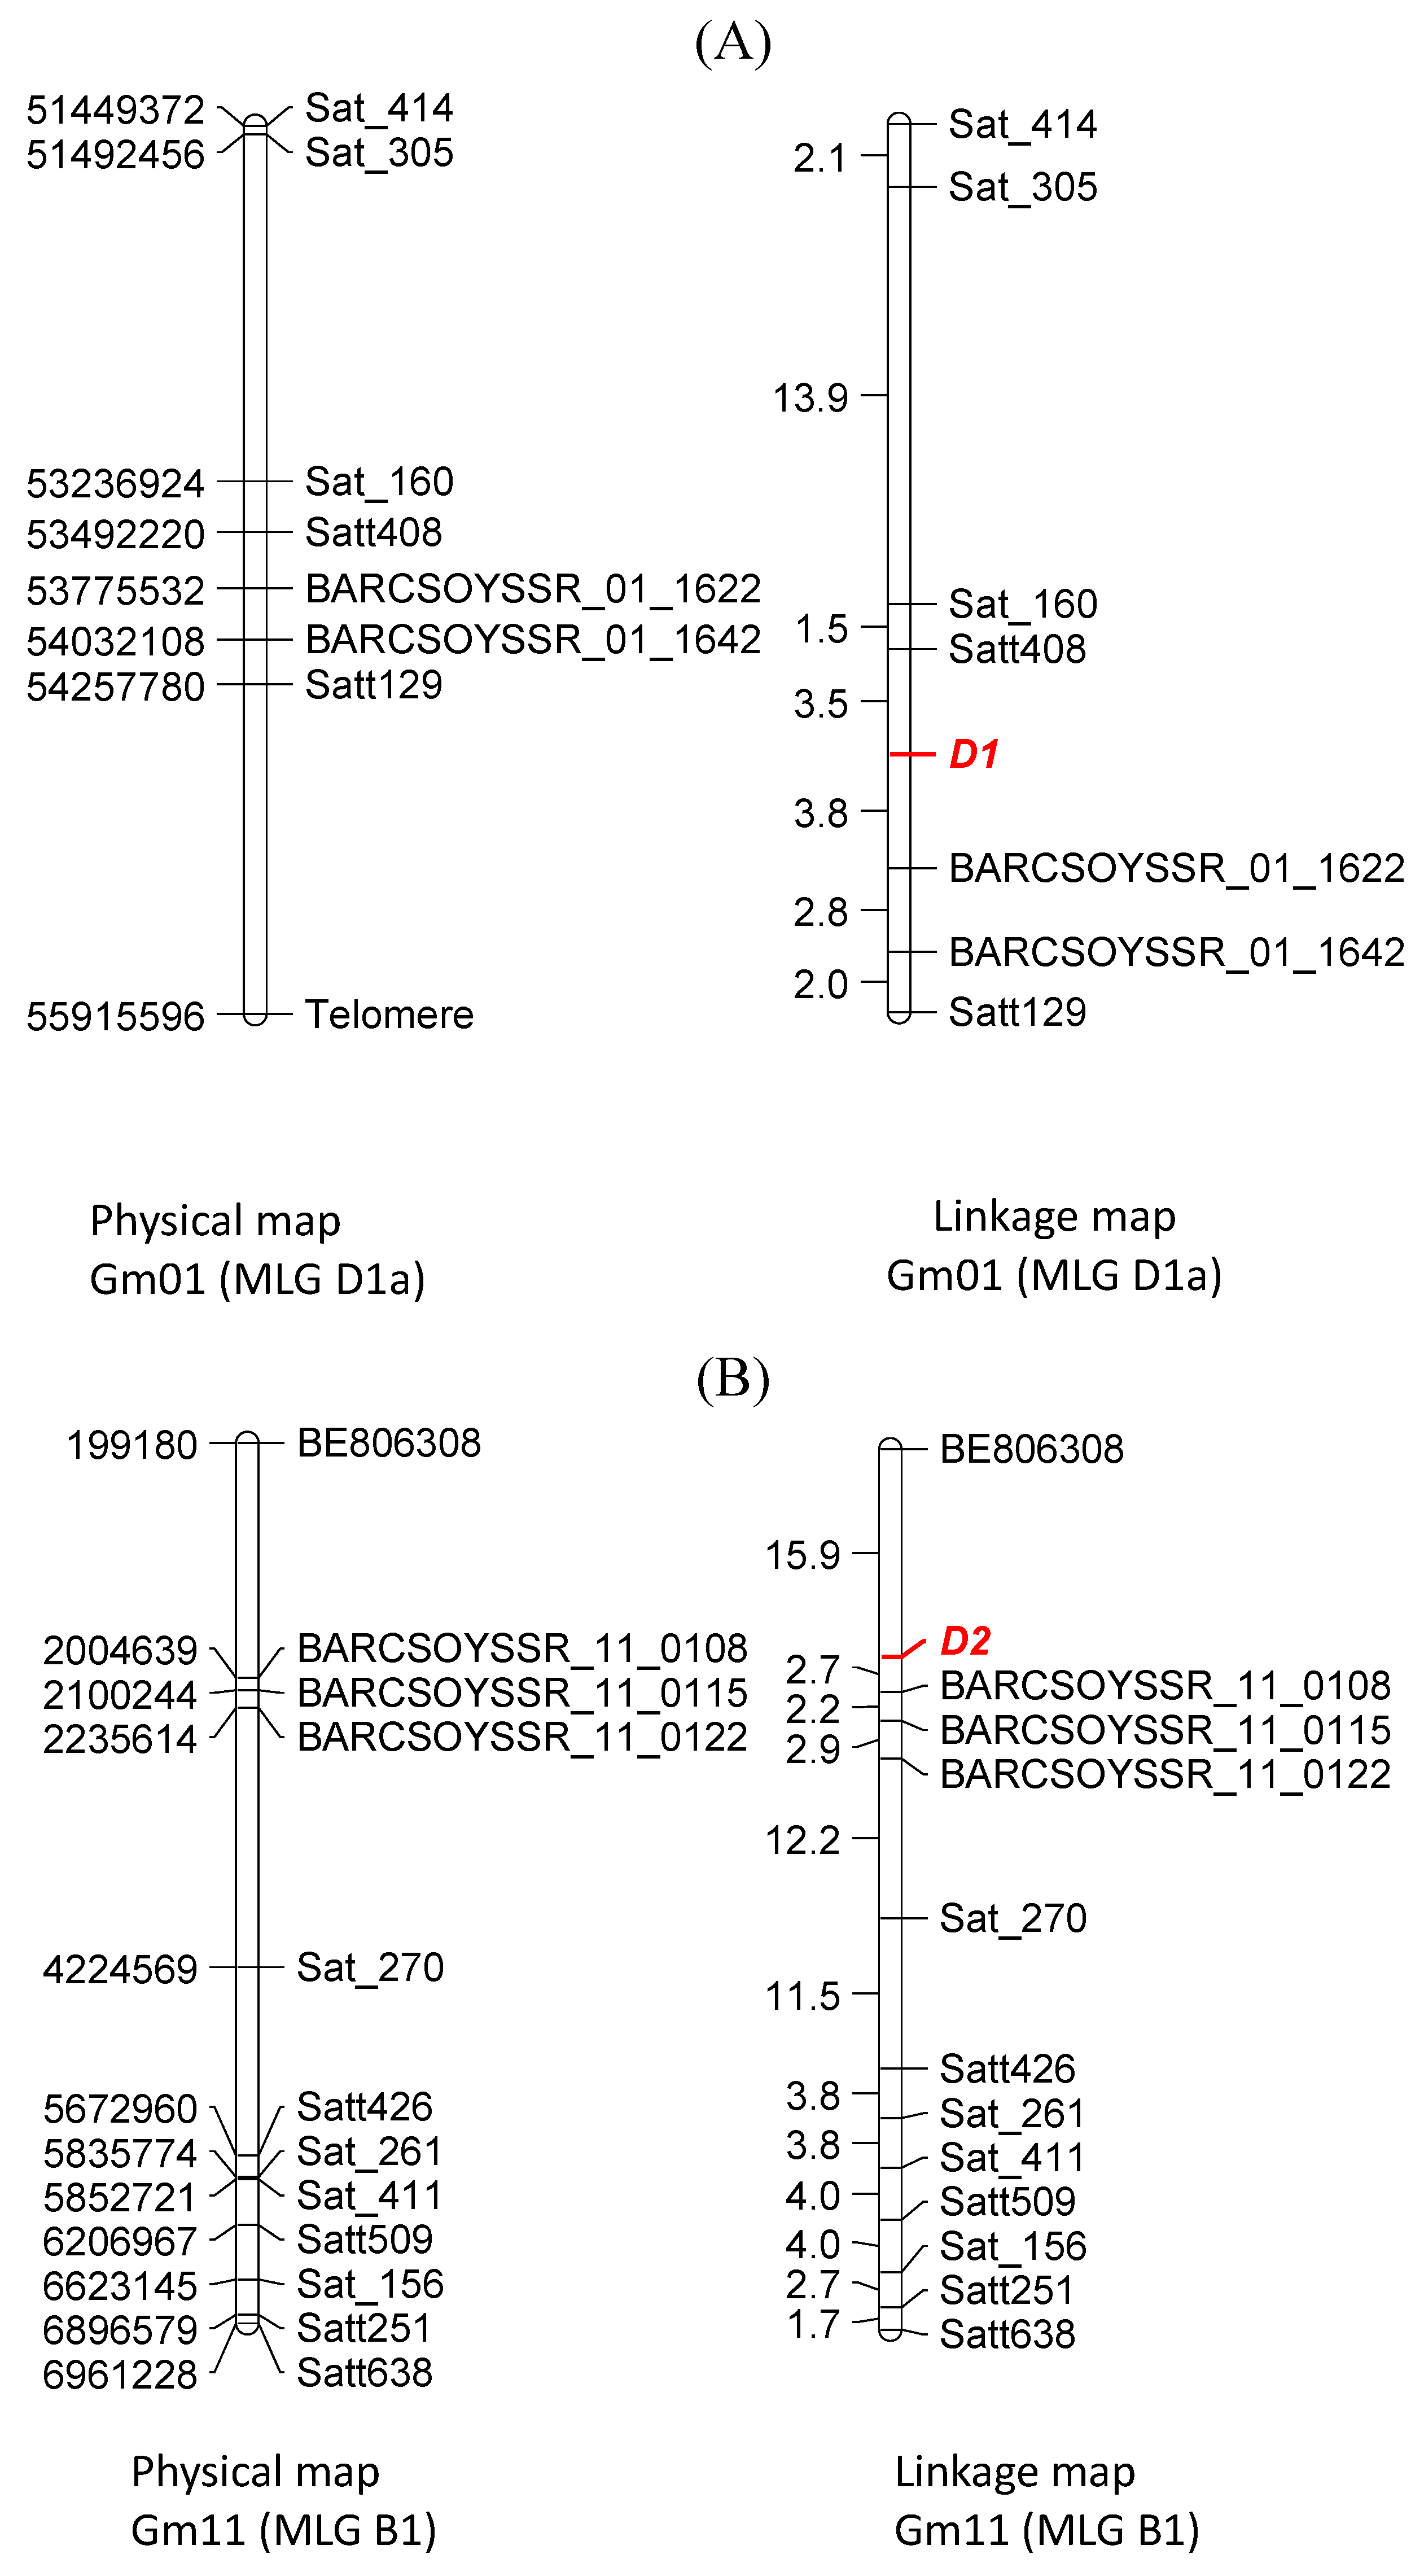
3.4. Molecular Mapping of D1 and D2

The χ2 calculations for the d1d1d2d2-segregating population showed a good fit to the genotypic ratio of 15 yellow cotyledon:1 green cotyledon in all three F2 populations. Segregation of the F2:3 generation showed a good fit of 7:4:4:1 homozygous yellow cotyledon:segregating 15 yellow to 1 green cotyledon: Segregating 3 yellow to 1 green cotyledon:all homozygous green cotyledon ratio (Table 2). These data confirm duplicate dominance epistasis between D1 and D2.
Initial BSA results using Minsoy and the two green cotyledon bulks indicated linkage of cotyledon colorwith Satt129 and Sat_270. Satt129 is located on Gm01 (MLG D1a) and Sat_270 is located on Gm11 (MLG B1) [40]. A previous study showed that the D1 locus is linked with seed coat color gene G that is mapped to MLG D1a [30]. Twenty-one SSR markers on MLG D1a (chromosome Gm01) were tested on the parents for polymorphism, and seven (Satt129, BARCSOYSSR_01_1622, BARCSOYSSR_01_1642, Satt408, Sat_160, Sat_305, and Sat_414) detected polymorphism. Thirty-three markers on chromosome Gm11 were tested on the parents for polymorphism, and twelve (BE806308, BARCSOYSSR_11_0108, BARCSOYSSR_11_0115, BARCSOYSSR_11_0122, Satt251, Satt426, Satt509, Satt638, Sat_156, Sat_261, Sat_270, and Sat_411) showed polymorphism. Polymorphic markers were used to assay DNA of 210 individual F2 plants that segregated 15:1 or 3:1 or were all green (Figure 3). The map for Gm01 showed that the D1 locus was flanked by Satt408 and BARCSOYSSR_01_1622 (Figure 3A). Mapping results for Gm11 revealed the location of D2 between BARCSOYSSR_11_0108 and BE806208 on MLG B1 (Figure 3B).
Figure 3. Genetic linkage mapping of cotyledon color genes from the cross Minsoy (D1D1D2D2; PI 27890) × Harosoy (d1d1d2d2; L69-4267). (A) Genetic and physical maps of soybean chromosome Gm01 (MLG D1a) showing location of the D1 locus. (B) Genetic and physical maps of soybean chromosome Gm11 (MLG B1) showing location of the D2 locus. Genetic distances are shown in centiMorgans (cM) and physical distances are shown in base pairs (bp).
Plants 02 00441 g003
By using the known physical locations of the markers, putative gene candidates were explored [44]. The 283 Kb interval around D1 contains 33 annotated genes. The 1.8 Mb interval around D2 contains 243 annotated genes.

4. Discussion

4.1. Cytological Analyses

Male-fertile, female-fertile Ms5Ms5 and Ms5ms5 plants displayed normal microsporogenesis and microgametogenesis, as expected. Sterile plants, ms5ms5, showed abnormal development at the late-microspore/early pollen stage, typical of many male-sterile mutants [1]. Another characteristic of many male-sterile plants is tapetum disintegration, which was observed in ms5ms5 plants [1]. Aborted pollen grains displayed various degrees of staining with I2KI and shapes. Four distinct colpi were observed occasionally and are characteristic of 2n pollen from tetraploid (80 chromosome) soybean plants (Figure 1N) [45]). Occasionally, outcrossed seed was observed on field-grown sterile plants. The few seed observed may indicate some degree of female sterility [28], lower levels of insect-pollinator attraction, or both. Megasporogenesis and megagametogenesis were not studied.
A previous investigation suggested association between cotyledon color (either D1 or D2) and Ms5 [30,31]. In this study we mapped Ms5 to ~2 Mb region on MLG B1 (Figure 2). The close linkage between Ms5 and one of the genes for green cotyledon color is explained as D2 also mapped to MLG B1 (Figure 3B). One marker in particular, BARCSOYSSR_11_0122, showed linkage to both Ms5 and D2. D2 mapped distally to BARCSOYSSR_11_0122 while Ms5 mapped proximally to the same marker. Based on their distances from BARCSOYSSR_11_0122, D2 and Ms5 are estimated to be approximately 12.8 cM apart, indicating fair linkage. D1 was mapped to a 283 kb region on MLG D1a (Figure 3A).
The mutations d1 and d2 affect cotyledon color by the prevention of thylakoid protein degradation, thus retaining the green color in the double mutant d1d1d2d2 [46]. Previous studies have not succeeded in determining the exact gene products of the D1 and D2 genes, though cytokinin or auxin regulation may be involved [47]. The region where d2 mapped contains three cytochrome-related genes, which may be putative gene candidates. However, the region where d1 mapped contains no genes with annotated functions directly related to these pathways.
Linkages between traits of interest and morphological markers have been used with great success in plant breeding, particularly in wheat. In Australian wheat breeding, stem rust resistance conferred by the recessive Sr2 gene was selected for by screening for pseudo-black chaff [48]. Two other morphological traits, glume color and leaf-tip necrosis, also were used to select for rust resistance [48]. Morphological markers also were used to track chromosomal introgression during backcrossing [49].
One of the main limitations of morphological markers is the developmental stage at which they appear [50]. Seed color or cotyledon color, however, can be used to score for fertility before the seeds are planted, thus allowing for very early screening. In addition, the visual scoring method is simple and inexpensive.
Continued mapping efforts for easily scored phenotypic traits, such as color, provide important resources for the research and breeding community. In particular, seed traits that can be scored before planting have the potential to save valuable land resources and growing time. The linkage between D2 and Ms5 is especially useful, because the green cotyledon phenotype encoded by the d1d1d2d2 genotype will particularly be suitable in identifying putative male-sterile plants for generating F1 hybrids. Although identification of male-sterile plants based on green cotyledons will not be perfect, growing only green cotyledon seeds will significantly increase the recovery of the male-sterile plants. Furthermore, use of pollen donors with yellow cotyledons will facilitate identifying true F1 seeds from the male-sterile female parents following insect pollinations. The study also set the stage for molecular cloning of the Ms5, D1, and D2 genes to broaden understanding the mechanisms of male fertility and regulation of chlorophyll biogenesis, respectively.

5. Conclusions

Characterization of pollen from sterile ms5ms5 plants showed tapetum degradation and abnormal development at the late-microspore/early pollen stage, in contrast to normal microsporogenesis and microgametogenesis. Using SSR markers, the male-sterile mutant, ms5, and two cotyledon color mutants, d1 and d2, were mapped to MLG B1, D1a and B1 respectively. Linkage between Ms5 and D2 can facilitate identification of male-sterile plants for hybrid seed production based on green cotyledons. Knowing the genetic position of these genes will assist in the molecular cloning of these genes.

Acknowledgements

The authors thank Tracey Pepper for processing and Randy Den Adel (Microscopy and NanoImaging Facility, ISU) for sectioning the anthers, and making the squash preparations for observation. This research project was supported by the UWSP Undergraduate Education Initiative and the UWSP Student Research Funds.

Abbreviations

SSR
Simple Sequence Repeat
PCR
Polymerase Chain Reaction
BSA
Bulked Segregant Analysis
cM
centiMorgan
MLG
Molecular Linkage Group

Conflict of Interest

The authors declare no conflict of interest.

References

  1. Kaul, M.L.H. Male Sterility in Higher Plants; Springer-Verlag: New York, NY, USA, 1988. [Google Scholar]
  2. Palmer, R.G.; Pfeiffer, T.W.; Buss, G.R.; Kilen, T.C. Qualitative genetics. In Soybeans: Improvement, Production, and Uses, Agronomy Monograph 16, 3rd ed.; American Society of Agrnomy, Inc.: Madison, WI, USA, 2004; pp. 137–233. [Google Scholar]
  3. Bai, Y.N.; Gai, J.Y. Development of a new cytoplasmic-nuclear male-sterility line of soybean and inheritance of its male-fertility restorability. Plant Breed. 2006, 125, 85–88. [Google Scholar] [CrossRef]
  4. Davis, W.H. Route to hybrid soybean production. US 4545146 A, 8 October 1985. [Google Scholar]
  5. Ding, D.; Gai, J.; Cui, Z.; Qiu, J. Development of a cytoplasmic-nuclear male-sterile line of soybean. Euphytica 2002, 124, 85–91. [Google Scholar] [CrossRef]
  6. Sun, H.; Zhao, L.; Huang, M. Cytoplasmic-Nuclear Male Sterile Soybean Line from Interspecific Crosses between G. max and G. soja. In Proceedings World Soybean Research Conference V: Soybean Feeds the World, Chiang Mai, Thailand, 1994; Chainuvat, C., Sarobol, N., Eds.; Kasetsart University Press: Chiang Mai, Thailand, 1997; pp. 99–102. [Google Scholar]
  7. Zhao, T.J.; Gai, J.Y. Discovery of new male-sterile cytoplasm sources and development of a new cytoplasmic-nuclear male-sterile line NJCMS3a in soybean. Euphytica 2006, 152, 387–396. [Google Scholar] [CrossRef]
  8. Horner, H.T.; Palmer, R.G. Mechanisms of genic male sterility. Crop Sci. 1995, 35, 1527–1535. [Google Scholar] [CrossRef]
  9. Rao, M.K.; Devi, K.U.; Arundhati, A. Applications of genic male sterility in plant breeding. Plant Breed. 1990, 105, 1–25. [Google Scholar] [CrossRef]
  10. Specht, J.E.; Graef, G.L. Registration of soybean germplasm SG1E6. Crop Sci. 1992, 32, 1080–1082. [Google Scholar] [CrossRef]
  11. Specht, J.E.; Williams, J.H.; Kenworthy, W.J.; Orf, J.H.; Helsel, D.G.; St. Martin, S.K. Registration of SG1 soybean germplasm. Crop Sci. 1985, 25, 717–718. [Google Scholar] [CrossRef]
  12. St. Martin, S.K.; Ehounou, N.E. Randomness of intermating in soybean populations containing male-sterile plants. Crop Sci. 1989, 29, 69–71. [Google Scholar] [CrossRef]
  13. Lewers, K.S.; Palmer, R.G. Recurrent selection in soybean. Plant Breed. Rev. 1997, 15, 275–314. [Google Scholar]
  14. Ortiz-Perez, E.; Wiley, H.; Horner, H.T.; Davis, W.H.; Palmer, R.G. Insect-mediated cross-pollination in soybean [Glycine max (L.) Merrill]: II. Phenotypic recurrent selection. Euphytica 2008, 162, 269–280. [Google Scholar]
  15. Jin, W.; Palmer, R.G.; Horner, H.T.; Shoemaker, R.C. Molecular mapping of a male-sterile gene in soybean. Crop Sci. 1998, 38, 1681–1685. [Google Scholar] [CrossRef]
  16. Cervantes-Martinez, I.; Xu, M.; Zhang, L.; Huang, Z.; Kato, K.K.; Horner, H.T.; Palmer, R.G. Molecular mapping of male-sterility loci ms2 and ms9 in soybean. Crop Sci. 2007, 47, 374–379. [Google Scholar] [CrossRef]
  17. Kato, K.K.; Palmer, R.G. Genetic identification of a female partial-sterile mutant in soybean. Genome 2003, 46, 128–134. [Google Scholar] [CrossRef]
  18. Frasch, R.M.; Weigand, C.; Perez, P.T.; Palmer, R.G.; Sandhu, D. Molecular mapping of 2 environmentally sensitive male-sterile mutants in soybean. J. Hered. 2010, 102, 11–16. [Google Scholar]
  19. Burton, J.W.; Brownie, C. Heterosis and inbreeding depression in two soybean single crosses. Crop Sci. 2006, 46, 2643–2648. [Google Scholar] [CrossRef]
  20. Perez, P.T.; Cianzio, S.R.; Ortiz-Perez, E.; Palmer, R.G. Agronomic performance of soybean hybrids from single, three-way, four-way, and five-way crosses, and backcross populations. J. Crop Improv. 2009, 23, 95–118. [Google Scholar] [CrossRef]
  21. Perez, P.T.; Cianzio, S.R.; Palmer, R.G. Evaluation of soybean [Glycine max (L.) Merr.] F1 hybrids. J. Crop Improv. 2009, 23, 1–18. [Google Scholar]
  22. Li, J.; Zhang, L.; Huang, Z.; Zhang, L.; Zhu, L. Yield heterosis and its utilization of F1 and F2 generations of CMS-type hybrid soybean. In International Conference on Utilization of Heterosis in Crops, Xi’an, China, 19–22 August 2012.
  23. Sun, H. Progress and problems of hybrid soybean development. In International Conference on Utilization of Heterosis in Crops, Xi’an, China, 19–22 August 2012.
  24. Yang, S.; Zhao, T.; Gai, J. Studies on the utilization of heterosis at the National Center for Soybean Improvement. In International Conference on Utilization of Heterosis in Crops, Xi’an, China, 19–22 August 2012.
  25. Zong, R.; Li, H.; Li, F.; Li, H.; Xu, M. Research progress on three-line hybrid soybean and prospects of soybean heterosis application. In International Conference on Utilization of Heterosis in Crops, Xi’an, China, 19–22 August 2012.
  26. Horner, H.T.; Healy, R.A.; Palmer, R.G. Floral nectary fine structure and development in Glycine max L. (Fabaceae). Int. J. Plant Sci. 2003, 164, 675–690. [Google Scholar]
  27. Palmer, R.G.; Perez, P.T.; Ortiz-Perez, E.; Maalouf, F.; Suso, M.J. The role of crop-pollinator relationship in breeding for pollinator-friendly legumes: From a breeding perspective. Euphytica 2009, 170, 35–52. [Google Scholar] [CrossRef]
  28. Buss, G.R. Inheritance of a male-sterile mutant from irradiated Essex soybeans. Soybean Genet. Newsl. 1983, 10, 104–108. [Google Scholar]
  29. Woodworth, C.M. Inheritance of cotyledon, seed-coat, hilum and pubescence colors in soy-beans. Genetics 1921, 6, 487. [Google Scholar]
  30. Lohnes, D.G.; Specht, J.E.; Cregan, P.B. Evidence for homoeologous linkage groups in soybean. Crop Sci. 1997, 37, 254–257. [Google Scholar] [CrossRef]
  31. Carter, T.E., Jr.; Burton, J.W. A Tight Linkage between the ms5 Male-Sterility Gene and the Green Cotyledon Trait in Soybean. In Agron. Abst.; American Society of Agronomy, Inc.: Madison, WI, USA, 1992; p. 91. [Google Scholar]
  32. Burton, J.W.; Carter, T.E.J. A method for production of experimental quantities of hybrid soybean seed. Crop Sci. 1983, 23, 388–390. [Google Scholar] [CrossRef]
  33. Cooper, R.L.; Tew, J. Use of leaf cutter bees in the production of hybrid soybean seed. In Annual Meeting Abstracts; [CD-ROM]; ASA, CSSA, and SSSA: Madison, WI, USA, 2001. [Google Scholar]
  34. Ruzin, S.E. Plant Microtechnique and Microscopy; Oxford University Press: New York, NY, USA, 1999. [Google Scholar]
  35. Horner, H.T.; Healy, R.A.; Ren, G.; Fritz, D.; Klyne, A.; Seames, C.; Thornburg, R.W. Amyloplast to chromoplast conversion in developing ornamental tobacco floral nectaries provides sugar for nectar and antioxidants for protection. Am. J. Bot. 2007, 94, 12–24. [Google Scholar] [CrossRef]
  36. Spurr, A.R. A low-viscosity epoxy resin embedding medium for electron microscopy. J. Ultrastruct. Res. 1969, 26, 31–34. [Google Scholar] [CrossRef]
  37. Fehr, W.R.; Caviness, C.E. Stages of soybean development. In Special Report 80; Iowa State University, Coop. Ext. Serv.; Iowa State University of Science and Technology: Ames, IA, USA, 1977. [Google Scholar]
  38. Sandhu, D.; Gao, H.; Cianzio, S.; Bhattacharyya, M.K. Deletion of a disease resistance nucleotide-binding-site leucine-rich-repeat-like sequence is associated with the loss of the Phytophthora resistance gene Rps4 in soybean. Genetics 2004, 168, 2157–2167. [Google Scholar] [CrossRef]
  39. Michelmore, R.W.; Paran, I.; Kesseli, R.V. Identification of markers linked to disease-resistance genes by bulked segregant analysis: a rapid method to detect markers in specific genomic regions by using segregating populations. Proc. Natl. Acad. Sci. USA 1991, 88, 9828–9832. [Google Scholar] [CrossRef]
  40. Song, Q.J.; Marek, L.F.; Shoemaker, R.C.; Lark, K.G.; Concibido, V.C.; Delannay, X.; Specht, J.E.; Cregan, P.B. A new integrated genetic linkage map of the soybean. Theor. Appl. Genet. 2004, 109, 122–128. [Google Scholar] [CrossRef]
  41. Grant, D.; Nelson, R.T.; Cannon, S.B.; Shoemaker, R.C. SoyBase, the USDA-ARS soybean genetics and genomics database. Nucleic Acids Res. 2010, 38, D843–D846. [Google Scholar] [CrossRef]
  42. Lander, E.S.; Green, P.; Abrahamson, J.; Barlow, A.; Daly, M.J.; Lincoln, S.E.; Newburg, L. MAPMAKER: An interactive computer package for constructing primary genetic linkage maps of experimental and natural populations. Genomics 1987, 1, 174–181. [Google Scholar] [CrossRef]
  43. Kosambi, D.D. The estimation of map distances from recombination values. Ann. Eugen. 1943, 12, 172–175. [Google Scholar] [CrossRef]
  44. Schmutz, J.; Cannon, S.B.; Schlueter, J.; Ma, J.; Mitros, T.; Nelson, W.; Hyten, D.L.; Song, Q.; Thelen, J.J.; Cheng, J.; et al. Genome sequence of the palaeopolyploid soybean. Nature 2010, 463, 178–183. [Google Scholar] [CrossRef]
  45. Palmer, R.G. A desynaptic mutant in the soybean. J. Hered. 1974, 65, 280–286. [Google Scholar]
  46. Guiamet, J.J.; Schwartz, E.; Pichersky, E.; Nooden, L.D. Characterization of cytoplasmic and nuclear mutations affecting chlorophyll and chlorophyll-binding proteins during senescence in soybean. Plant Physiol. 1991, 96, 227–231. [Google Scholar] [CrossRef]
  47. Chao, W.S.; Liu, V.; Thomson, W.W.; Platt, K.; Walling, L.L. The impact of chlorophyll-retention mutations, d1d2 and cyt-G1, during embryogeny in soybean. Plant Physiol. 1995, 107, 253–262. [Google Scholar]
  48. Eagles, H.A.; Bariana, H.S.; Ogbonnaya, F.C.; Rebetzke, G.J.; Hollamby, G.J.; Henry, R.J.; Henschke, P.H.; Carter, M. Implementation of markers in Australian wheat breeding. Crop Pasture Sci. 2001, 52, 1349–1356. [Google Scholar] [CrossRef]
  49. Rawat, N.; Neelam, K.; Tiwari, V.K.; Randhawa, G.S.; Friebe, B.; Gill, B.S.; Dhaliwal, H.S.; Somers, D. Development and molecular characterization of wheat, Aegilops kotschyi addition and substitution lines with high grain protein, iron, and zinc. Genome 2011, 54, 943–953. [Google Scholar] [CrossRef]
  50. Andersen, J.R.; Lubberstedt, T. Functional markers in plants. Trends Plant Sci. 2003, 8, 554–560. [Google Scholar] [CrossRef]

Supplementary Material

Table S1. Chromosomal distribution of microsatellite markers tested for Bulked Segregant Analysis.
Molecular Linkage GroupChromosome NumberNumber of markers
A1535
A2835
B11125
B21428
C1420
C2623
D1a146
D1b254
D21721
E1523
F1339
G1845
H1222
I2028
J1620
K925
L1924
M737
N325
O1025
TOTAL600

