
Plant Responses to Climate Change: The Case Study of Betulaceae and Poaceae Pollen Seasons (Northern Italy, Vignola, Emilia-Romagna)


Abstract
:1. Introduction
2. Results
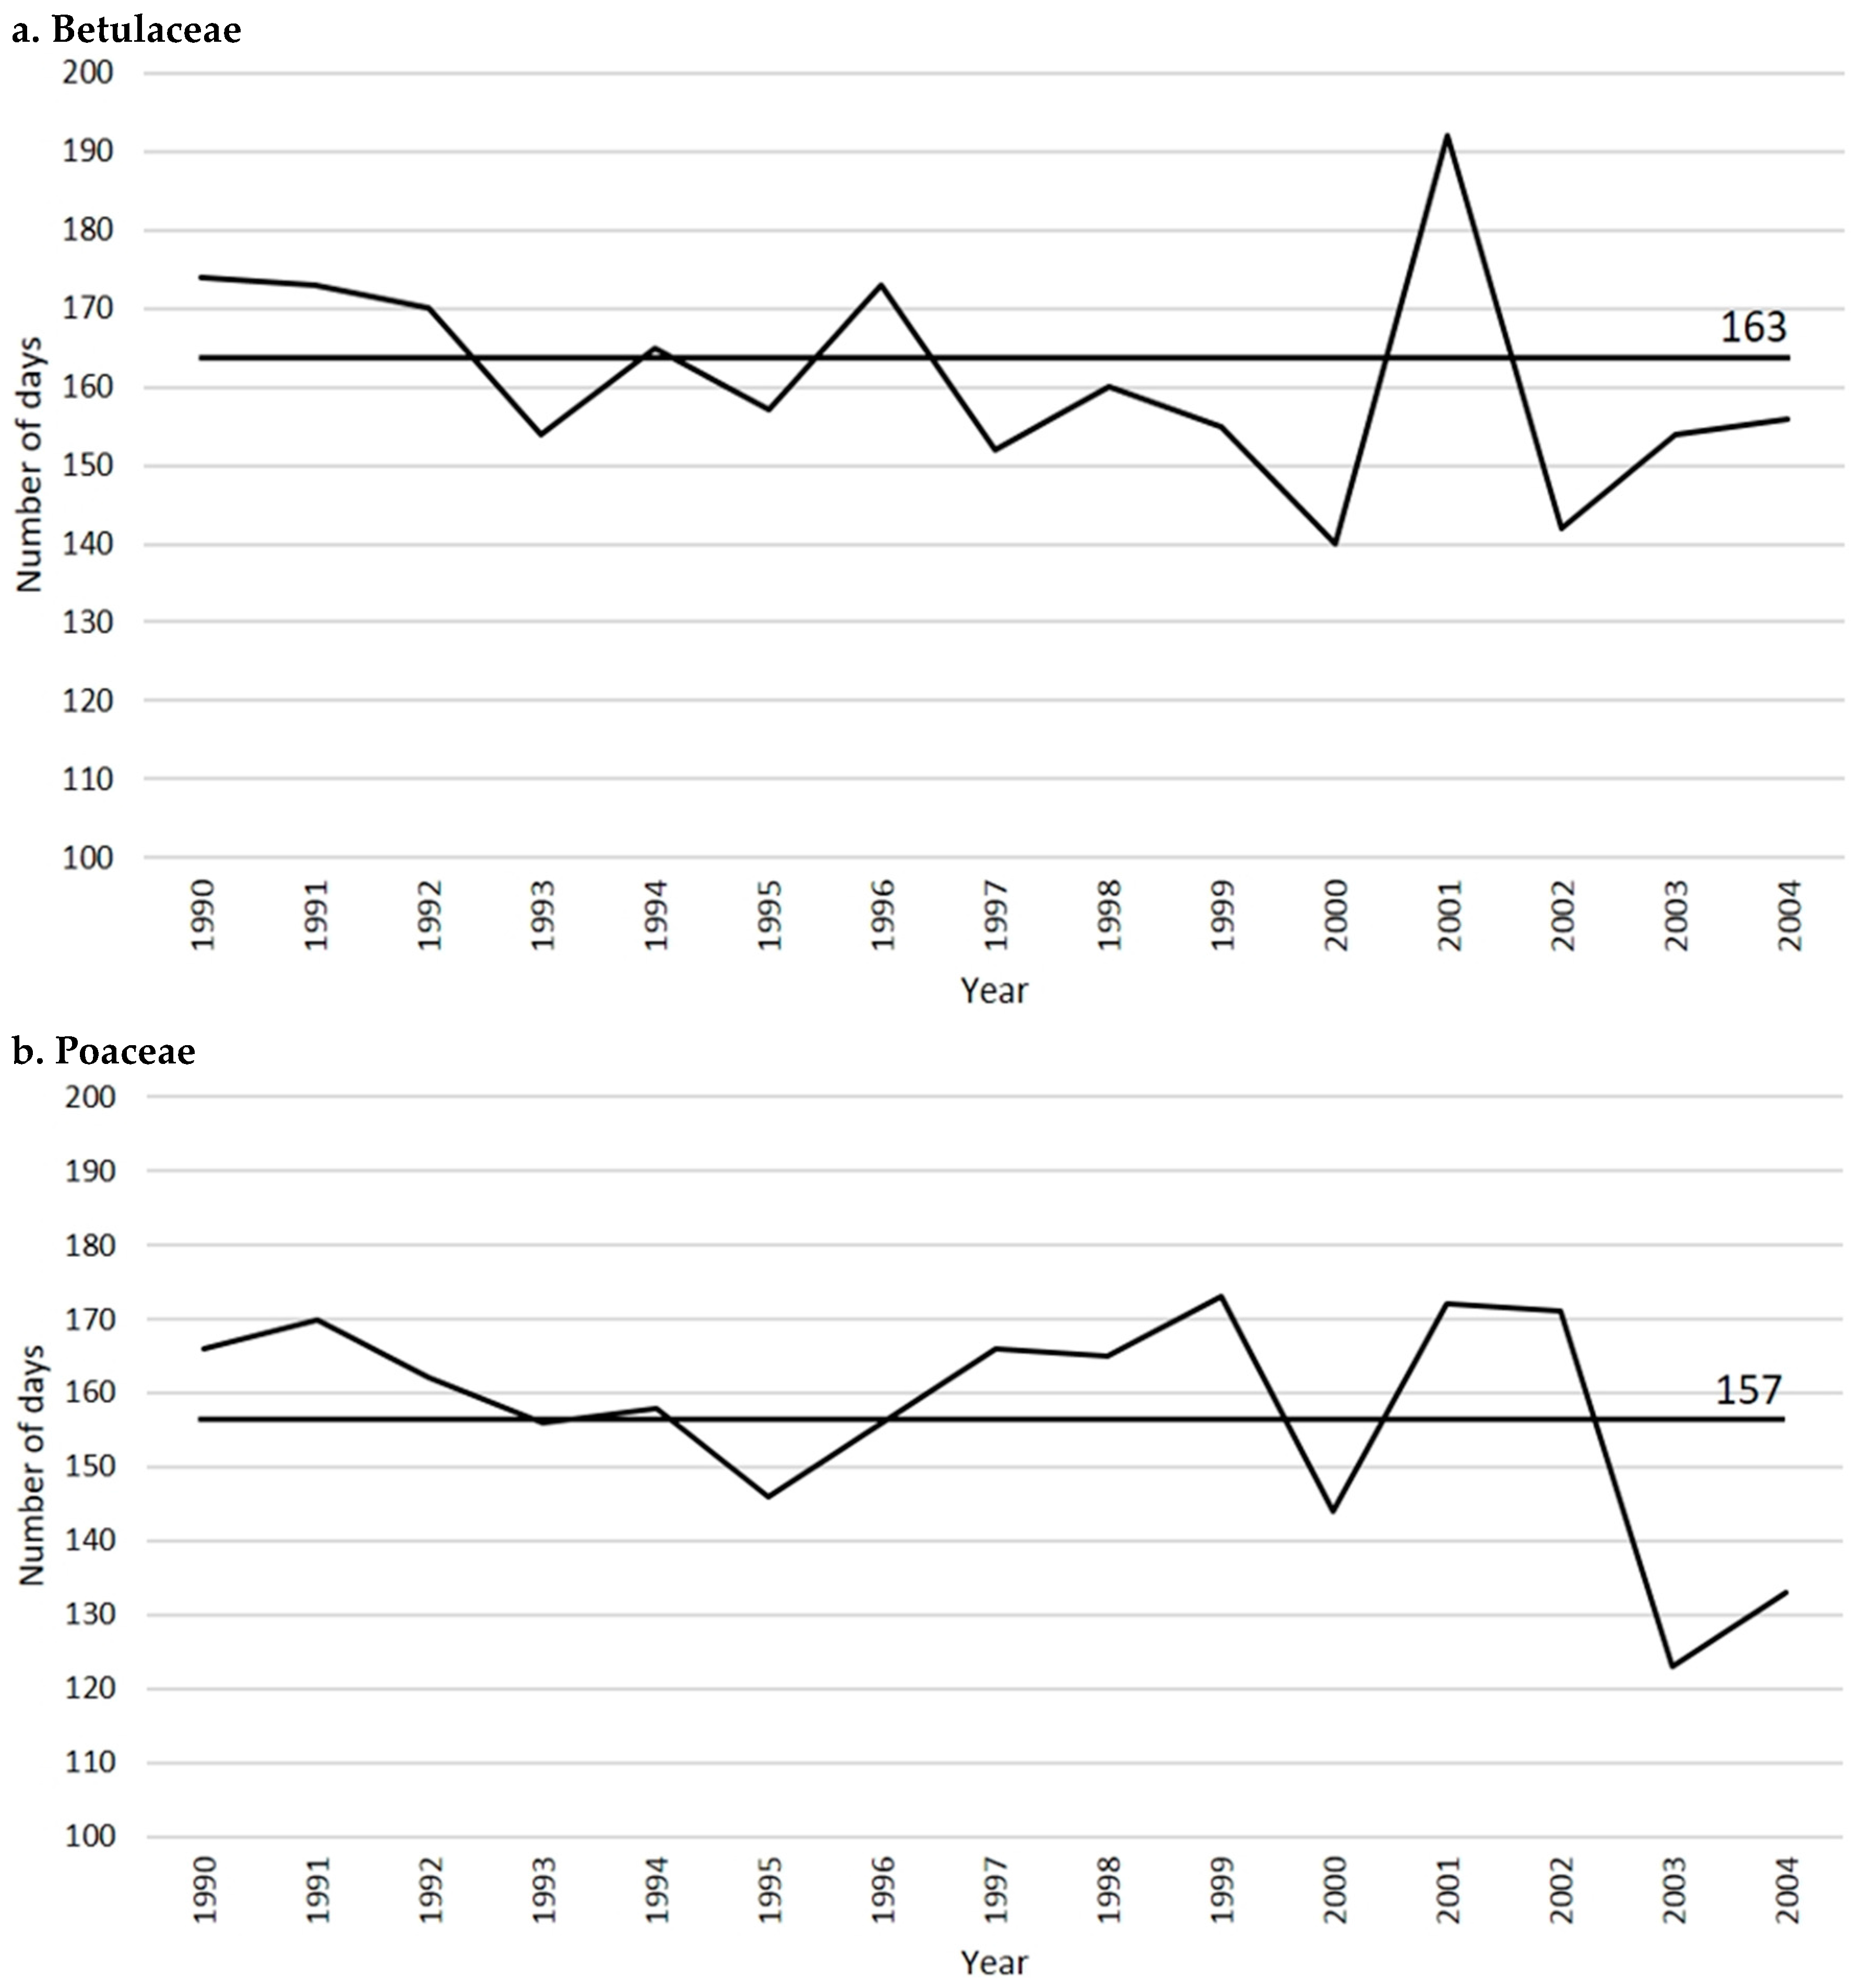
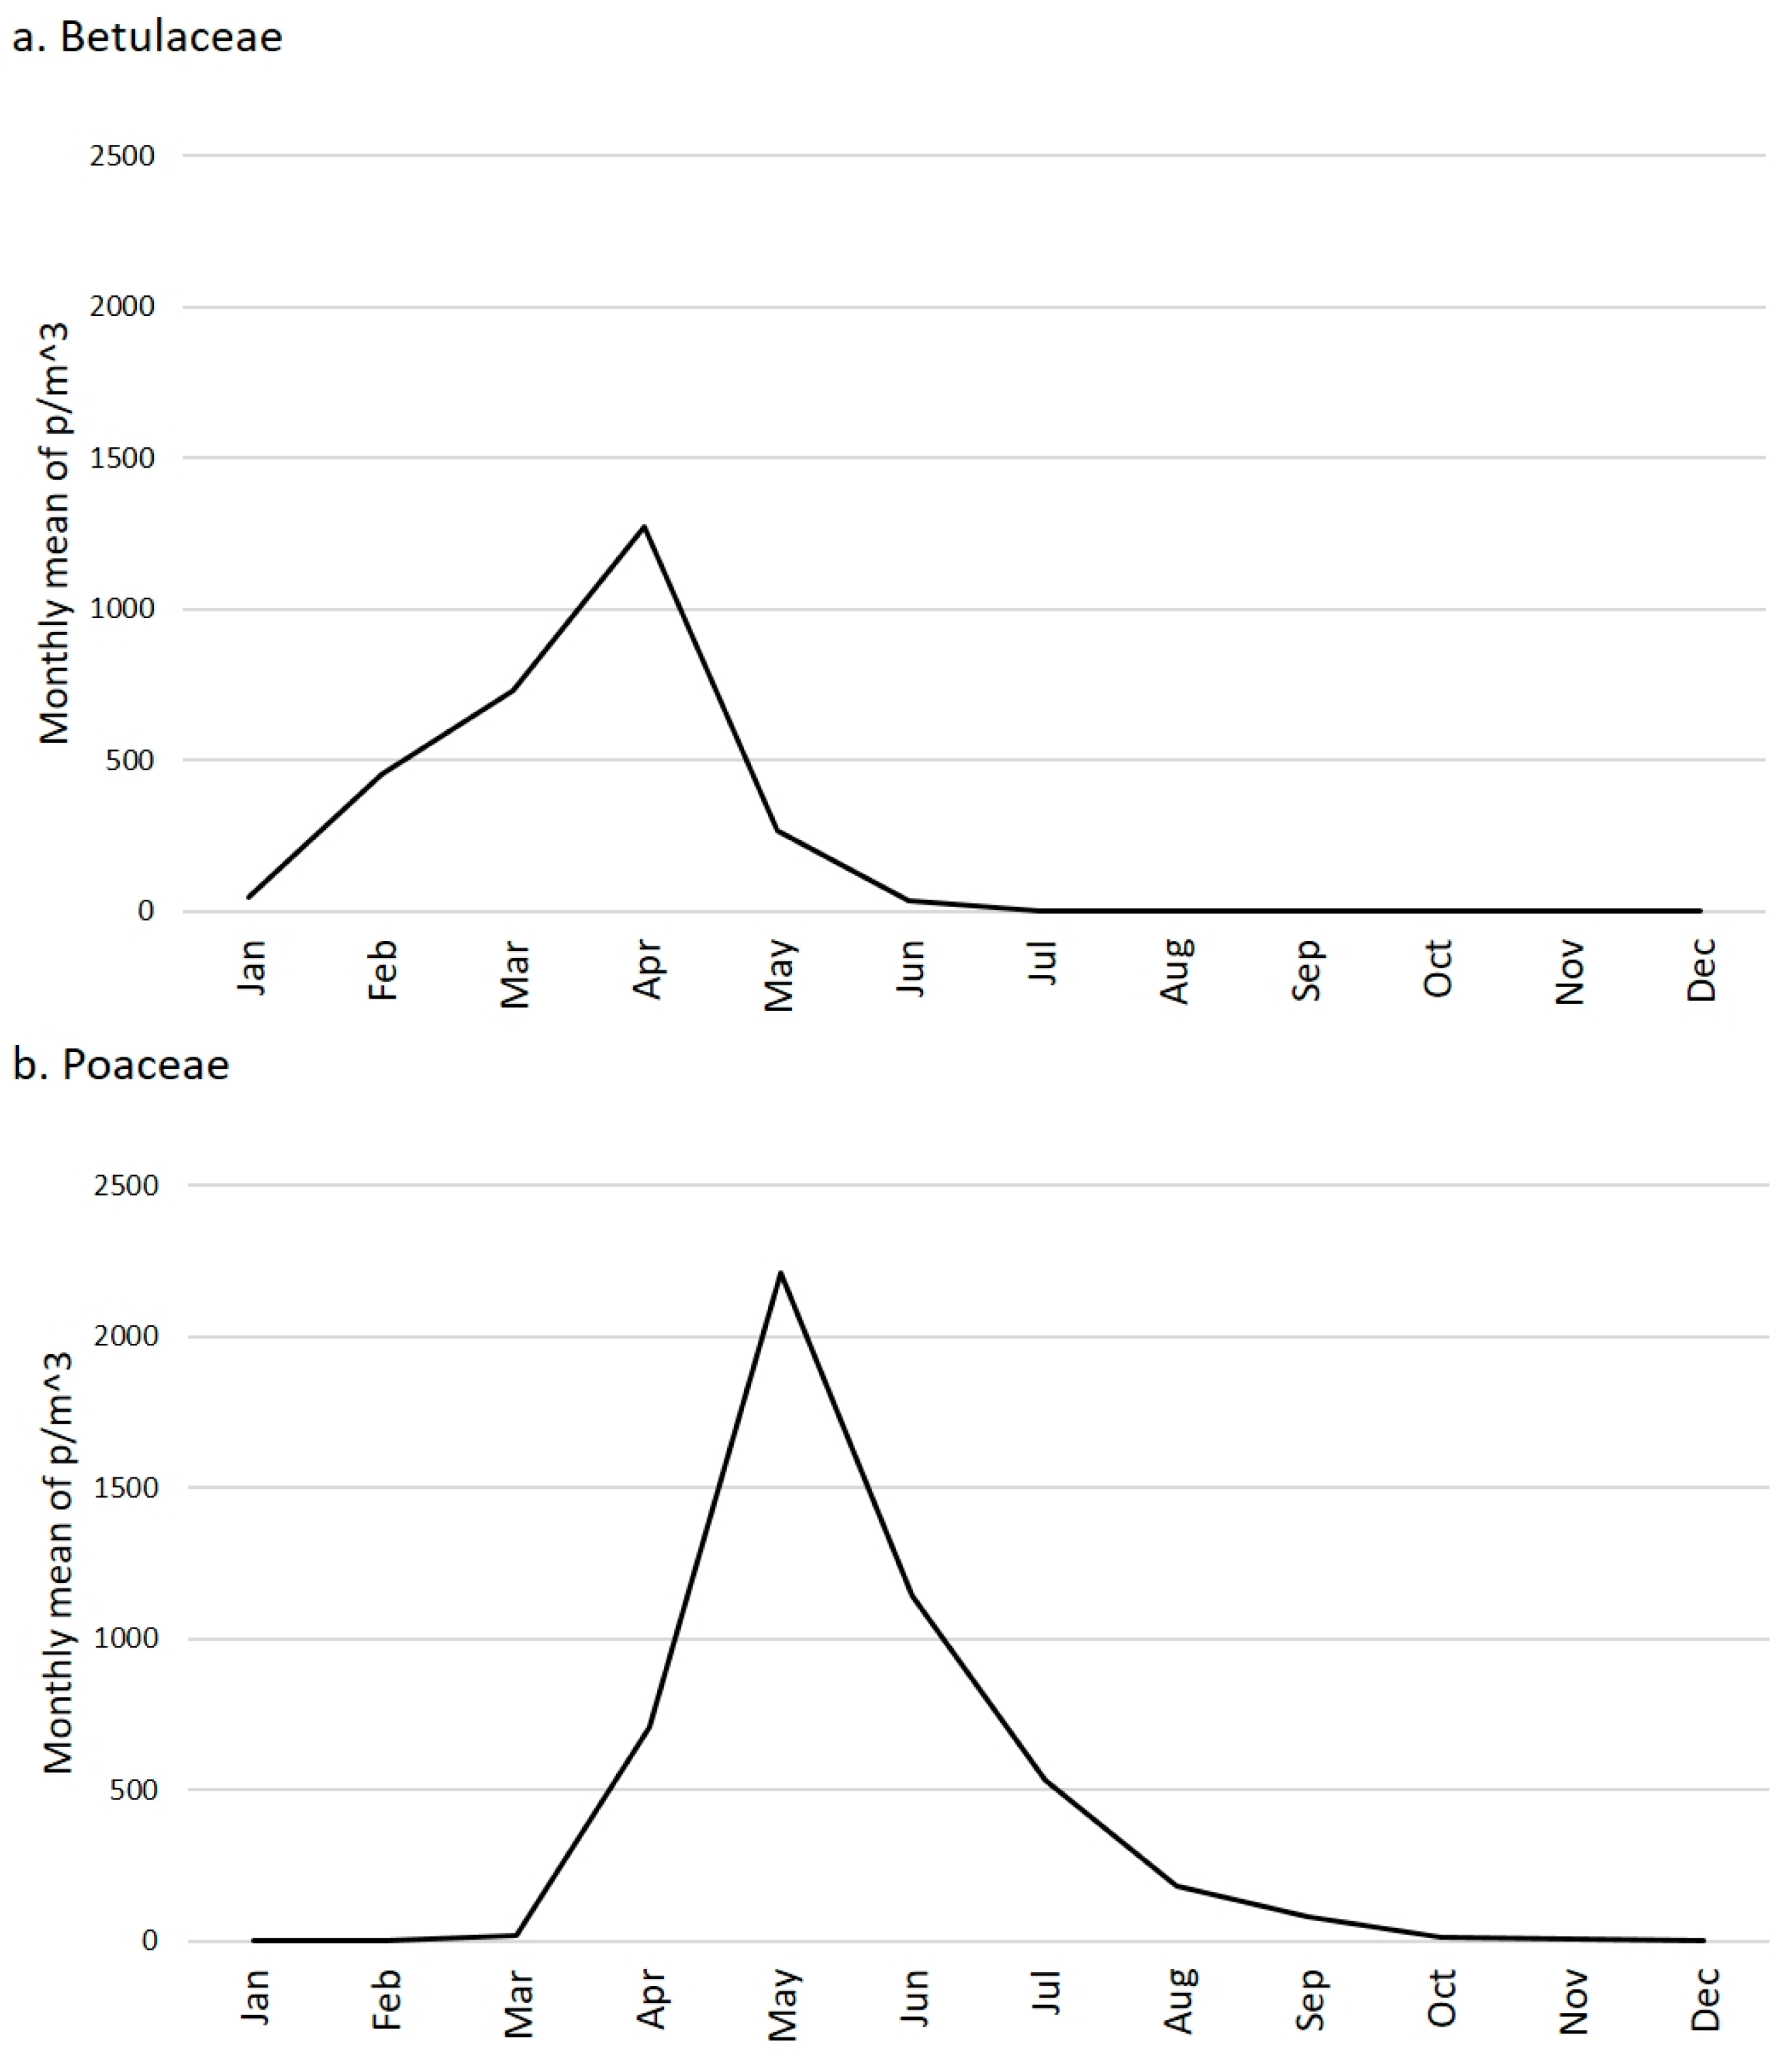
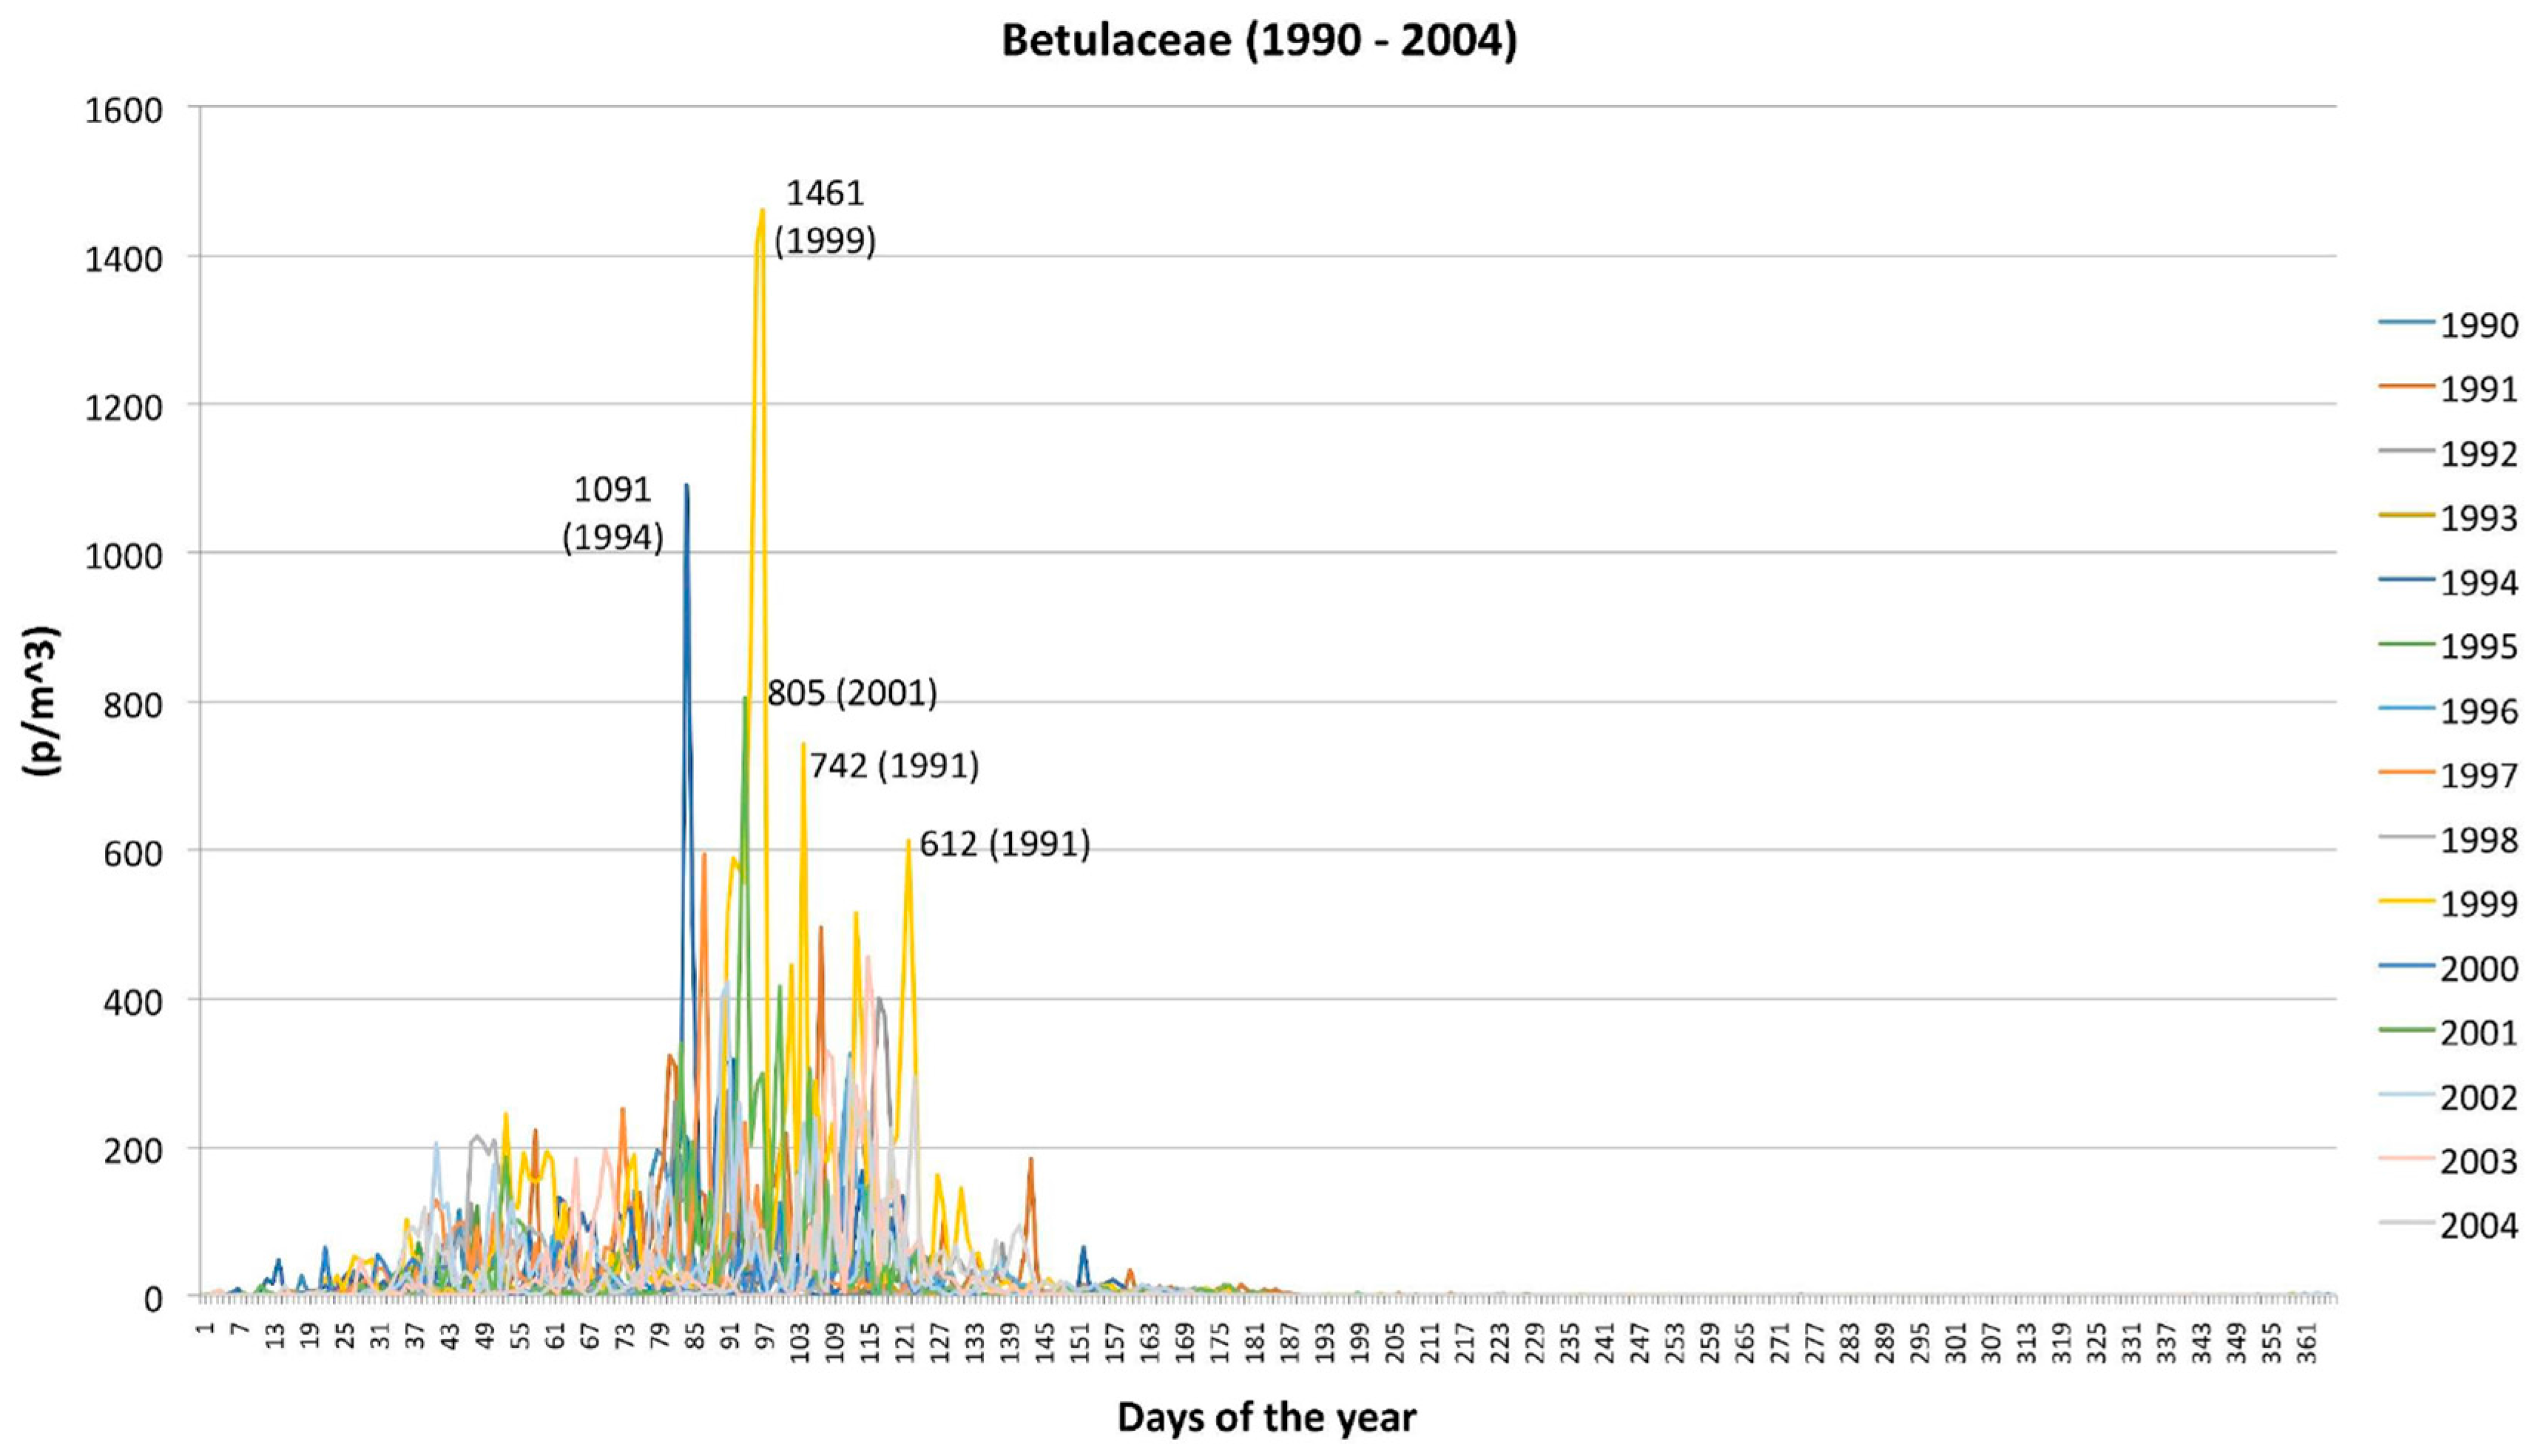
2.1. Betulaceae
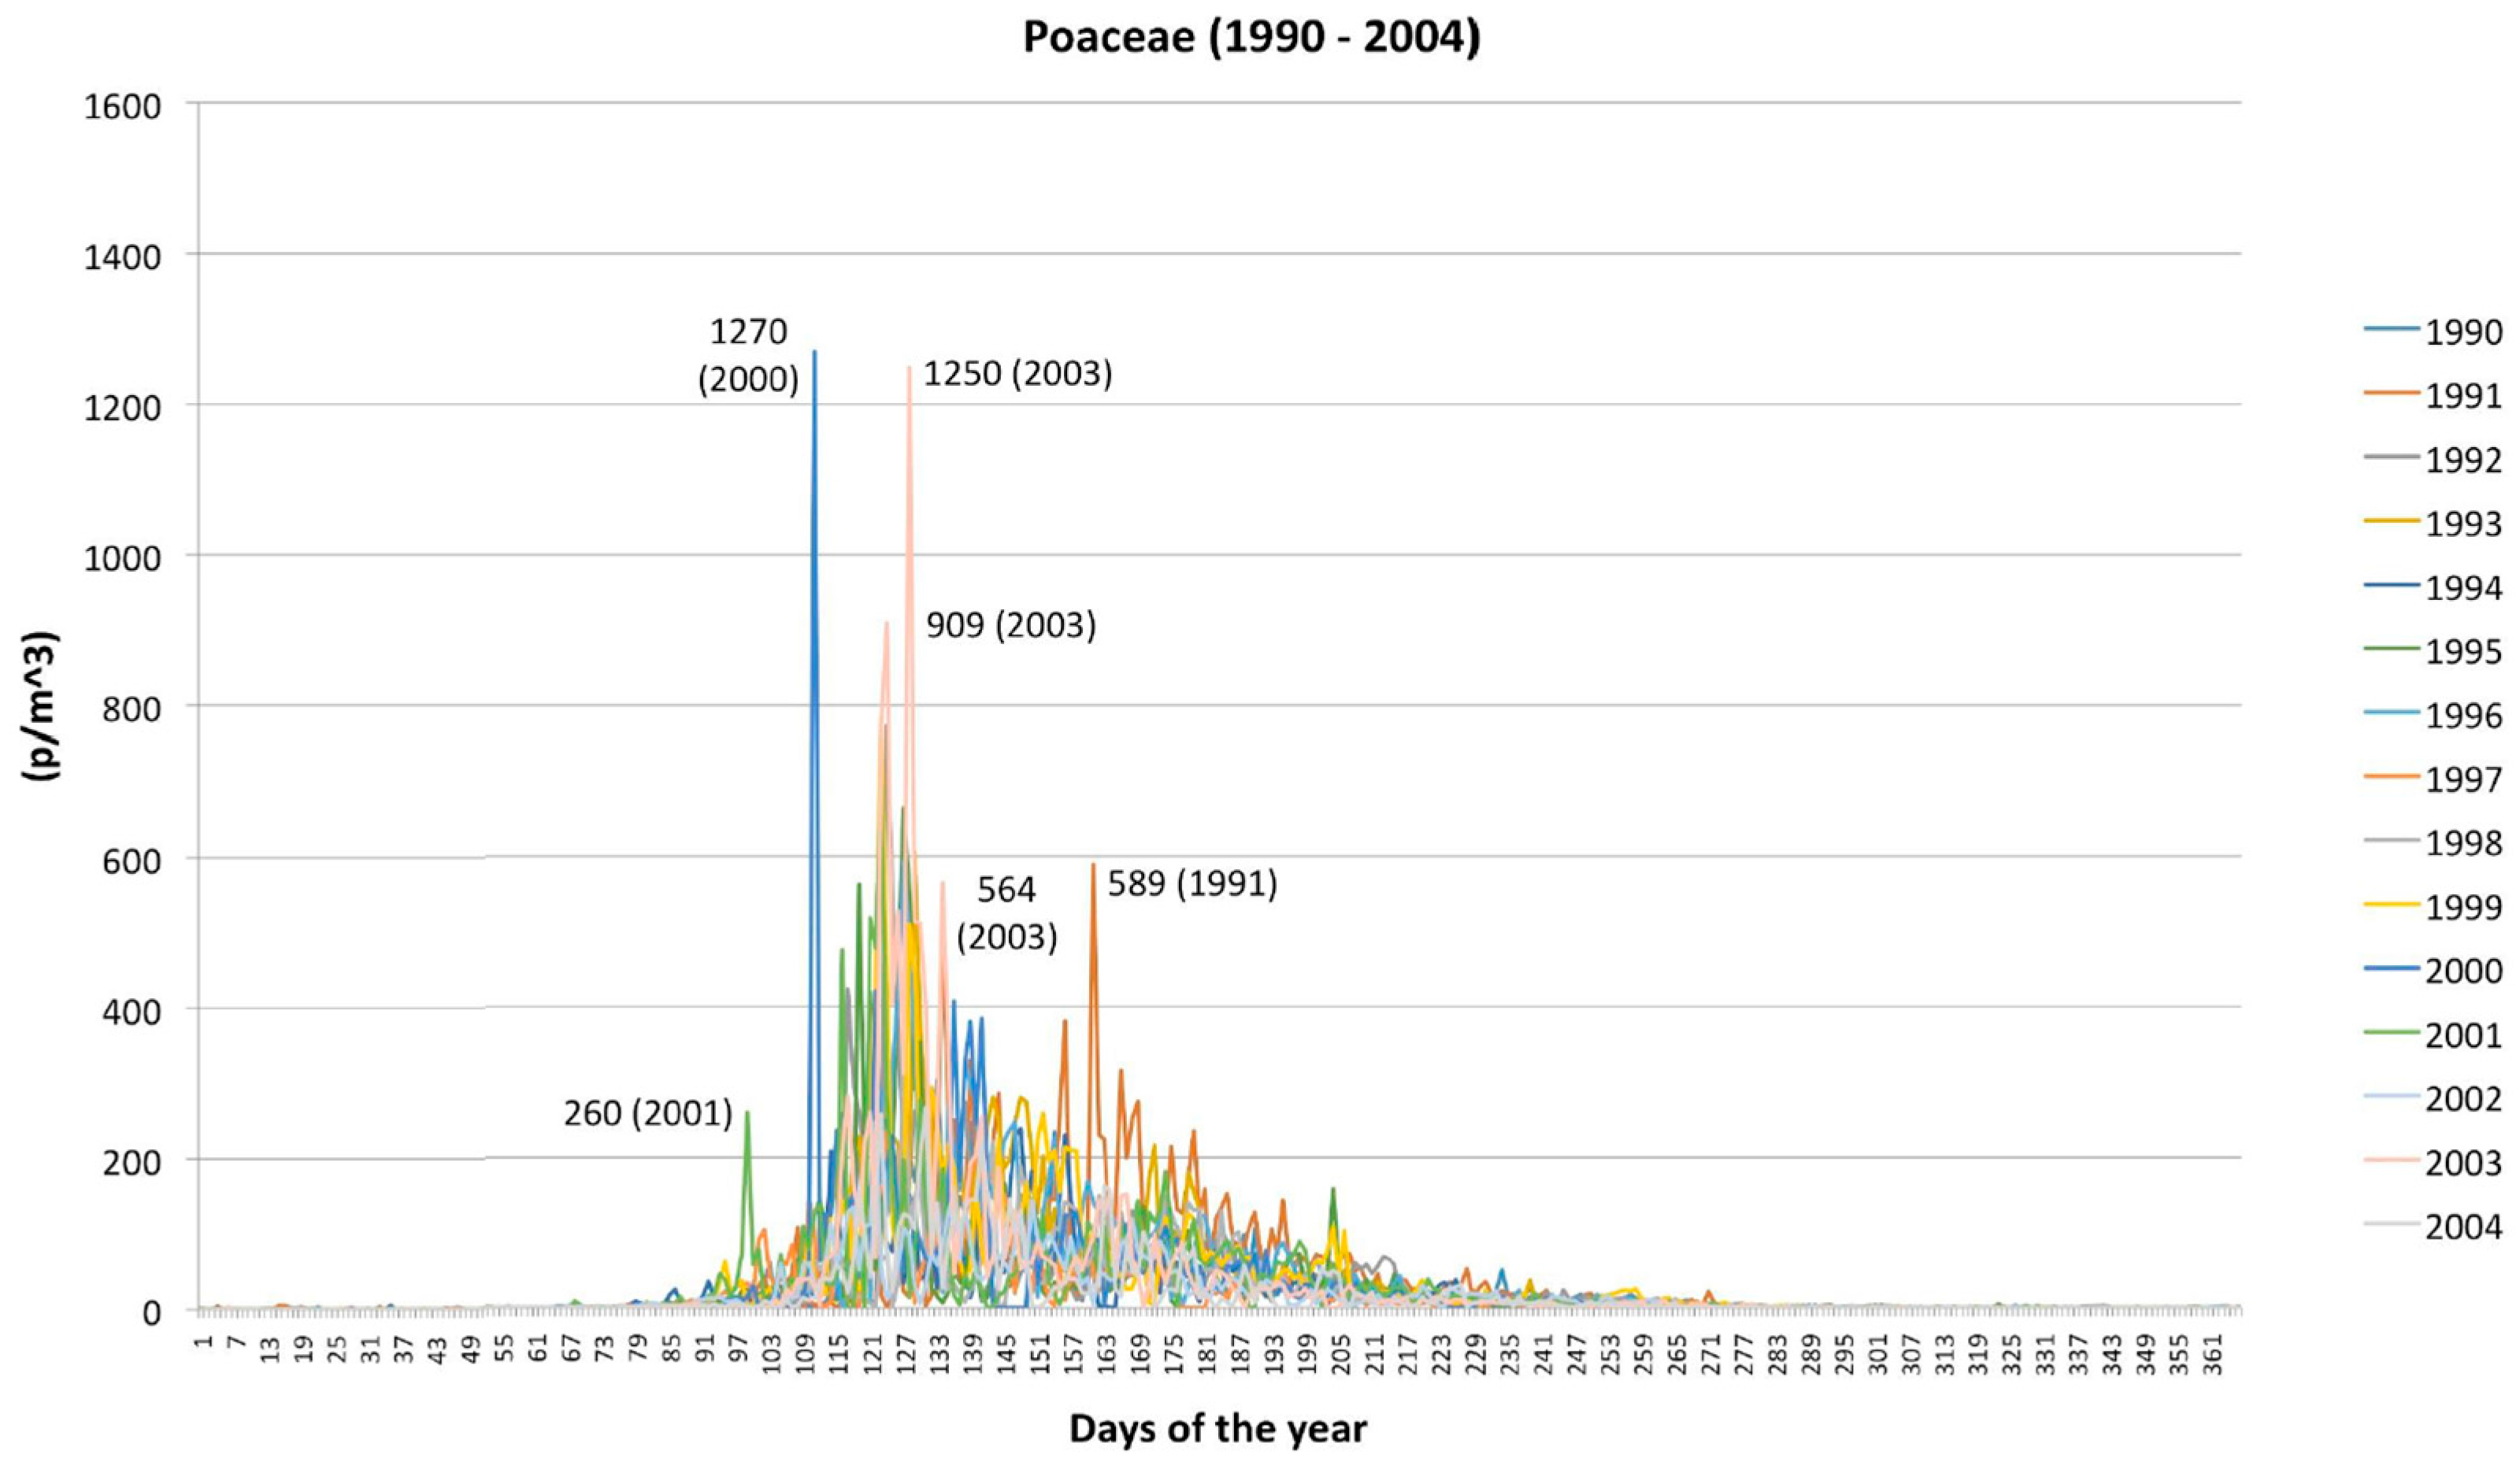
2.2. Poaceae
3. Discussion
4. Materials and Methods
5. Conclusions
Acknowledgments
Author Contributions
Conflicts of Interest
References
- Jump, A.; Penuelas, J. Running to stand still: Adaptation and the response of plants to rapid climate change. Ecol. Lett. 2005, 8, 1010–1020. [Google Scholar] [CrossRef]
- Hedhly, A. Sensitivity of flowering plant gametophytes to temperature fluctuations. Environ. Exp. Bot. 2011, 74, 9–16. [Google Scholar] [CrossRef] [Green Version]
- Hedhly, A.; Hormaza, J.I.; Herrero, M. The effect of temperature on pollen germination, pollen tube growth, and stigmatic receptivity in peach. Plant Biol. 2005, 7, 476–483. [Google Scholar] [CrossRef] [PubMed]
- Zinn, K.E.; Tunc-Ozdemir, M.; Harper, J.F. Temperature stress and plant sexual reproduction: Uncovering the weakest links. J. Exp. Bot. 2010, 61, 1959–1968. [Google Scholar] [CrossRef] [PubMed]
- NOAA Climate of 2005—Annual Report. National Climatic Data Center, 2006. Available online: http://www.ncdc.noaa.gov/oa/climate/research/2005/ann/global.html#top (accessed on 24 October 2016).
- Frenguelli, G. Interaction between climatic changes and allergenic plants. Monaldi Arch. Chest Dis. 2002, 57, 141–143. [Google Scholar] [PubMed]
- Ariano, R.; Canonica, G.W.; Passalacqua, G. Possible role of climate changes in variations in pollen seasons and allergic sensitizations during 27 years. Ann. Allergy Asthma Immunol. 2010, 104, 215–222. [Google Scholar] [CrossRef] [PubMed]
- Ziska, L.; Knowlton, K.; Rogers, C.; Dalan, D.; Tierney, N.; Elder, M.A.; Filley, W.; Shropshire, J.; Ford, L.B.; Hedberg, C.; et al. Recent warming by latitude associated with increased length of ragweed pollen season in central North America. PNAS 2011, 108, 4248–4251. [Google Scholar] [CrossRef] [PubMed]
- Mercuri, A.M.; Torri, P.; Casini, E.; Olmi, L. Climate warming and the decline of Taxus airborne pollen in urban pollen rain (Emilia Romagna, Northern Italy). Plant Biol. 2013, 15, 70–82. [Google Scholar] [CrossRef] [PubMed]
- Smith, M.; Jäger, S.; Berger, U.; Šikoparija, B.; Hallsdottir, M.; Sauliene, I.; Bergmann, K.-C.; Pashley, C.H.; de Weger, L.; Majkowska-Wojciechowska, B.; et al. Geographic and temporal variations in pollen exposure across Europe. Allergy 2014, 69, 913–923. [Google Scholar] [CrossRef] [PubMed]
- Galán, C.; Alcázar, P.; Oteros, J.; García-Mozo, H.; Aira, M.J.; Belmonte, J.; de la Guardia, C.D.; Fernández-González, D.; Gutierrez-Bustillo, M.; Moreno-Grau, S.; et al. Airborne pollen trends in the Iberian Peninsula. Sci. Total Environ. 2016, 550, 53–59. [Google Scholar] [CrossRef] [PubMed]
- Sofiev, M.; Siljamo, P.; Ranta, H.; Linkosalo, T.; Jaeger, S.; Rasmussen, A.; Rantio-Lehtimaki, A.; Severova, E.; Kukkonen, J. A numerical model of birch pollen emission and dispersion in the atmosphere. Description of the emission module. Int. J. Biometeorol. 2013, 57, 45–58. [Google Scholar] [CrossRef] [PubMed] [Green Version]
- Kmentaa, M.; Bastla, K.; Kramerc, M.F.; Hewingsc, S.J.; Mwangec, J.; Zetterb, R.; Bergera, U. The grass pollen season 2014 in Vienna: A pilot study combining phenology, aerobiology and symptom data. Sci. Total Environ. 2016, 566–567, 1614–1620. [Google Scholar] [CrossRef] [PubMed]
- Van Vliet, A.J.H.; Overeem, A.; de Groot, R.S.; Jacobs, A.F.G.; Spieksma, F.T.M. The influence of temperature and climate change on the timing of pollen release in the Netherlands. Int. J. Climatol. 2002, 22, 1757–1767. [Google Scholar] [CrossRef]
- Tormo-Molina, R.; Gonzalo-Garijo, M.A.; Silva-Palacios, I.; Muñoz-Rodríguez, A.F. General trends in airborne pollen production and pollination periods at a Mediterranean site (Badajoz, Southwest Spain). J. Investig. Allergol. Clin. Immunol. 2010, 20, 567–574. [Google Scholar] [PubMed]
- Frenguelli, G. L’influenza dei cambiamenti climatici sulla presenza dei pollini in atmosfera. Aria Ambient. Salut. 2004, 4, 23–25. (In Italian) [Google Scholar]
- Bortenschlager, S.; Bortenschlager, I. Altering airborne pollen concentrations due to the Global Warming. A comparative analysis of airborne pollen records from Innsbruck and Obergurgl (Austria) for the period 1980–2001. Grana 2005, 44, 172–180. [Google Scholar] [CrossRef]
- Gehrig, R. The influence of the hot and dry summer 2003 on the pollen season in Switzerland. Aerobiologia 2006, 22, 27–34. [Google Scholar] [CrossRef]
- Tedeschini, E.; Rodríguez-Rajo, F.J.; Caramiello, R.; Jato, V.; Frenguelli, G. The influence of climate changes in Platanus spp. pollination in Spain and Italy. Grana 2006, 45, 222–229. [Google Scholar] [CrossRef]
- Ianovici, N. Relation between Poaceae pollen concentrations and meteorological factors during 2000–2010 in Timisoara, Romania. Acta Agrobot. 2015, 68, 373–381. [Google Scholar] [CrossRef]
- Aguilera, F.; Ruiz-Valenzuela, L. Forecasting olive crop yields based on long-term aerobiological data series and bioclimatic conditions for the southern Iberian. Span. J. Agric. Res. 2014, 12, 215–224. [Google Scholar]
- Cunha, M.; Ribeiro, H.; Costa, P.; Abreu, I. A comparative study of vineyard phenology and pollen metrics extracted from airborne pollen time series. Aerobiologia 2015, 31, 45–56. [Google Scholar] [CrossRef]
- Chen, K.; Clonek, G.; Hansen, A.; Peng Bi, L. The effects of air pollution on asthma hospital admissions in Adelaide, South Australia, 2003–2013: Time-series and case-crossover analyses. Clin. Exp. Allergy 2016, 46, 1416–1430. [Google Scholar] [CrossRef] [PubMed]
- Van Leuken, J.P.G.; Swart, A.N.; Droogers, P.; van Pul, A.; Heederik, D.; Havelaar, A.H. Climate change effects on airborne pathogenic bioaerosol concentrations: A scenario analysis. Aerobiologia 2016, 32, 607–617. [Google Scholar] [CrossRef] [PubMed]
- Accorsi, C.A.; Bandini Mazzanti, M.; Lombroso, L.; Santangelo, R.; Torri, P. La stazione meteorologica-aeropollinica di Modena (Nord-Italia): Il caso di Alnus viridis. In Studi in Ricordo di Daria Bertolani Marchetti. Deputazione di Storia Patria per le Antiche Province Modenesi; Accorsi, C.A., Bandini Mazzanti, M., Labate, D., Trevisan Grandi, G., Eds.; Aedes Muratoriana: Modena, Italy, 1998; Volume 150, pp. 205–212. [Google Scholar]
- D’Amato, G.; Cecchi, L.; Bonini, S.; Nunes, C.; Annesi-Maesano, I.; Behrendt, H.; Liccardi, G.; Popov, T.; van Cauwenberge, P. Allergenic pollen and pollen allergy in Europe. Allergy 2007, 62, 976–990. [Google Scholar] [CrossRef] [PubMed]
- Mercuri, A.M. Applied palynology as a trans-disciplinary science: The contribution of aerobiology data to forensic and palaeoenvironmental issues. Aerobiologia 2015, 31, 323–339. [Google Scholar] [CrossRef]
- Aboulaich, N.; Bouziane, H.; Kadiri, M.; Trigo, M.M.; Riadi, H.; Kazzaz, M.; Merzouki, A. Pollen production in anemophilous species of the Poaceae family in Tetouan (NW Morocco). Aerobiologia 2009, 25, 27–38. [Google Scholar] [CrossRef]
- García-Mozo, H.; Galan, C.; Alcazar, P.; de la Guardia, C.D.; Nieto-Lugilde, D.; Recio, M.; Hidalgo, P.; Gonzalez-Minero, F.; Ruiz, L.; Domínguez-Vilches, E. Trends in grass pollen season in southern Spain. Aerobiologia 2010, 26, 157–169. [Google Scholar] [CrossRef]
- Peternel, R.; Srnec, L.; Čulig, J.; Zaninović, K.; Mitić, B.; Vukušić, I. Atmospheric pollen season in Zagreb (Croatia) and its relationship with temperature and precipitation. Int. J. Biometeorol. 2004, 48, 186–191. [Google Scholar] [CrossRef] [PubMed]
- Ranta, H.; Hokkanen, T.; Linkosalo, T.; Laukkanen, L.; Bondestam, K.; Oksanen, A. Male flowering of birch: Spatial synchronization, year-to-year variation and relation of catkin numbers and airborne pollen counts. For. Ecol. Manag. 2008, 255, 643–650. [Google Scholar] [CrossRef]
- Emberlin, J.; Detandt, M.; Gehrig, R.; Jaeger, S.; Nolard, N.; Rantio-Lehtimäki, A. Responses in the start of Betula (birch) pollen seasons to recent changes in spring temperatures across Europe. Int. J. Biometeorol. 2002, 46, 159–170. [Google Scholar] [PubMed]
- Ziello, C.; Sparks, T.H.; Estrella, N.; Belmonte, J.; Bergmann, K.C.; Bucher, E.; Brighetti, M.A.; Damialis, A.; Detandt, M.; Galán, C.; et al. Changes to airborne pollen counts across Europe. PLoS ONE 2012, 7, e34076. [Google Scholar] [CrossRef] [PubMed] [Green Version]
- Pignatti, G. Forest vegetation in view of some scenarios of climate change in Italy. Forest@ 2011, 8, 1–12. [Google Scholar] [CrossRef]
- Frenguelli, G.; Mandrioli, P. Airborne pollen monitoring in Italy. Rev. Palaeobot. Palynol. 1990, 64, 41–43. [Google Scholar] [CrossRef]
- Mandrioli, P. The Italian aeroallergen network: Report 1990. Aerobiologia 1990, 6, 2–59. [Google Scholar]
- Galán, C.; Smith, M.; Thibaudon, M.; Frenguelli, G.; Oteros, J.; Gehrig, R.; Berger, U.; Clot, B.; Brandao, R.; EAS QC Working Group. Pollen monitoring: Minimum requirements and reproducibility of analysis. Aerobiologia 2014, 30, 385–395. [Google Scholar] [CrossRef]
- Mercuri, A.M.; Accorsi, C.A.; Bandini Mazzanti, M.; Ferrarini, S.; Venturi, L. Aerobiologia 2.0: A software program for processing Aerpollen Data. J. Environ. Pathol. Toxicol. Oncol. 1997, 16, 191–194. [Google Scholar] [PubMed]
- Clot, B. Forecast of the Poaceae pollination in Zurich and Basle (Switzerland). Aerobiologia 1998, 14, 267–268. [Google Scholar] [CrossRef]
- Jato, V.; Rodríguez-Rajo, F.J.; Alcázar, P.; de Nuntiis, P.; Galán, C.; Mandrioli, P. May the definition of pollen season influence aerobiological results? Aerobiologia 2006, 22, 13–25. [Google Scholar] [CrossRef]
- Lombroso, L.; Quattrocchi, S. Il Clima e le Misure Meteo-Climatiche a Modena; Memorie Dell’accademia di Scienze, Lettere ed Arti: Modena, Italy, 2002; pp. 391–401. [Google Scholar]
- Nowosad, J. Spatiotemporal models for predicting high pollen concentration level of Corylus, Alnus and Betula. Int. J. Biometeorol. 2016, 60, 843–855. [Google Scholar] [CrossRef] [PubMed]
- Puc, M.; Kasprzyk, I. The patterns of Corylus and Alnus pollen seasons and pollination periods in two Polish cities located in different climatic regions. Aerobiologia 2013, 29, 495–511. [Google Scholar] [CrossRef] [PubMed]


© 2016 by the authors; licensee MDPI, Basel, Switzerland. This article is an open access article distributed under the terms and conditions of the Creative Commons Attribution (CC-BY) license (http://creativecommons.org/licenses/by/4.0/).
Share and Cite
Mercuri, A.M.; Torri, P.; Fornaciari, R.; Florenzano, A. Plant Responses to Climate Change: The Case Study of Betulaceae and Poaceae Pollen Seasons (Northern Italy, Vignola, Emilia-Romagna). Plants 2016, 5, 42. https://doi.org/10.3390/plants5040042
Mercuri AM, Torri P, Fornaciari R, Florenzano A. Plant Responses to Climate Change: The Case Study of Betulaceae and Poaceae Pollen Seasons (Northern Italy, Vignola, Emilia-Romagna). Plants. 2016; 5(4):42. https://doi.org/10.3390/plants5040042
Chicago/Turabian StyleMercuri, Anna Maria, Paola Torri, Rita Fornaciari, and Assunta Florenzano. 2016. "Plant Responses to Climate Change: The Case Study of Betulaceae and Poaceae Pollen Seasons (Northern Italy, Vignola, Emilia-Romagna)" Plants 5, no. 4: 42. https://doi.org/10.3390/plants5040042