
Pastoralism versus Agriculturalism—How Do Altered Land-Use Forms Affect the Spread of Invasive Plants in the Degraded Mutara Rangelands of North-Eastern Rwanda?

Abstract
:
1. Introduction
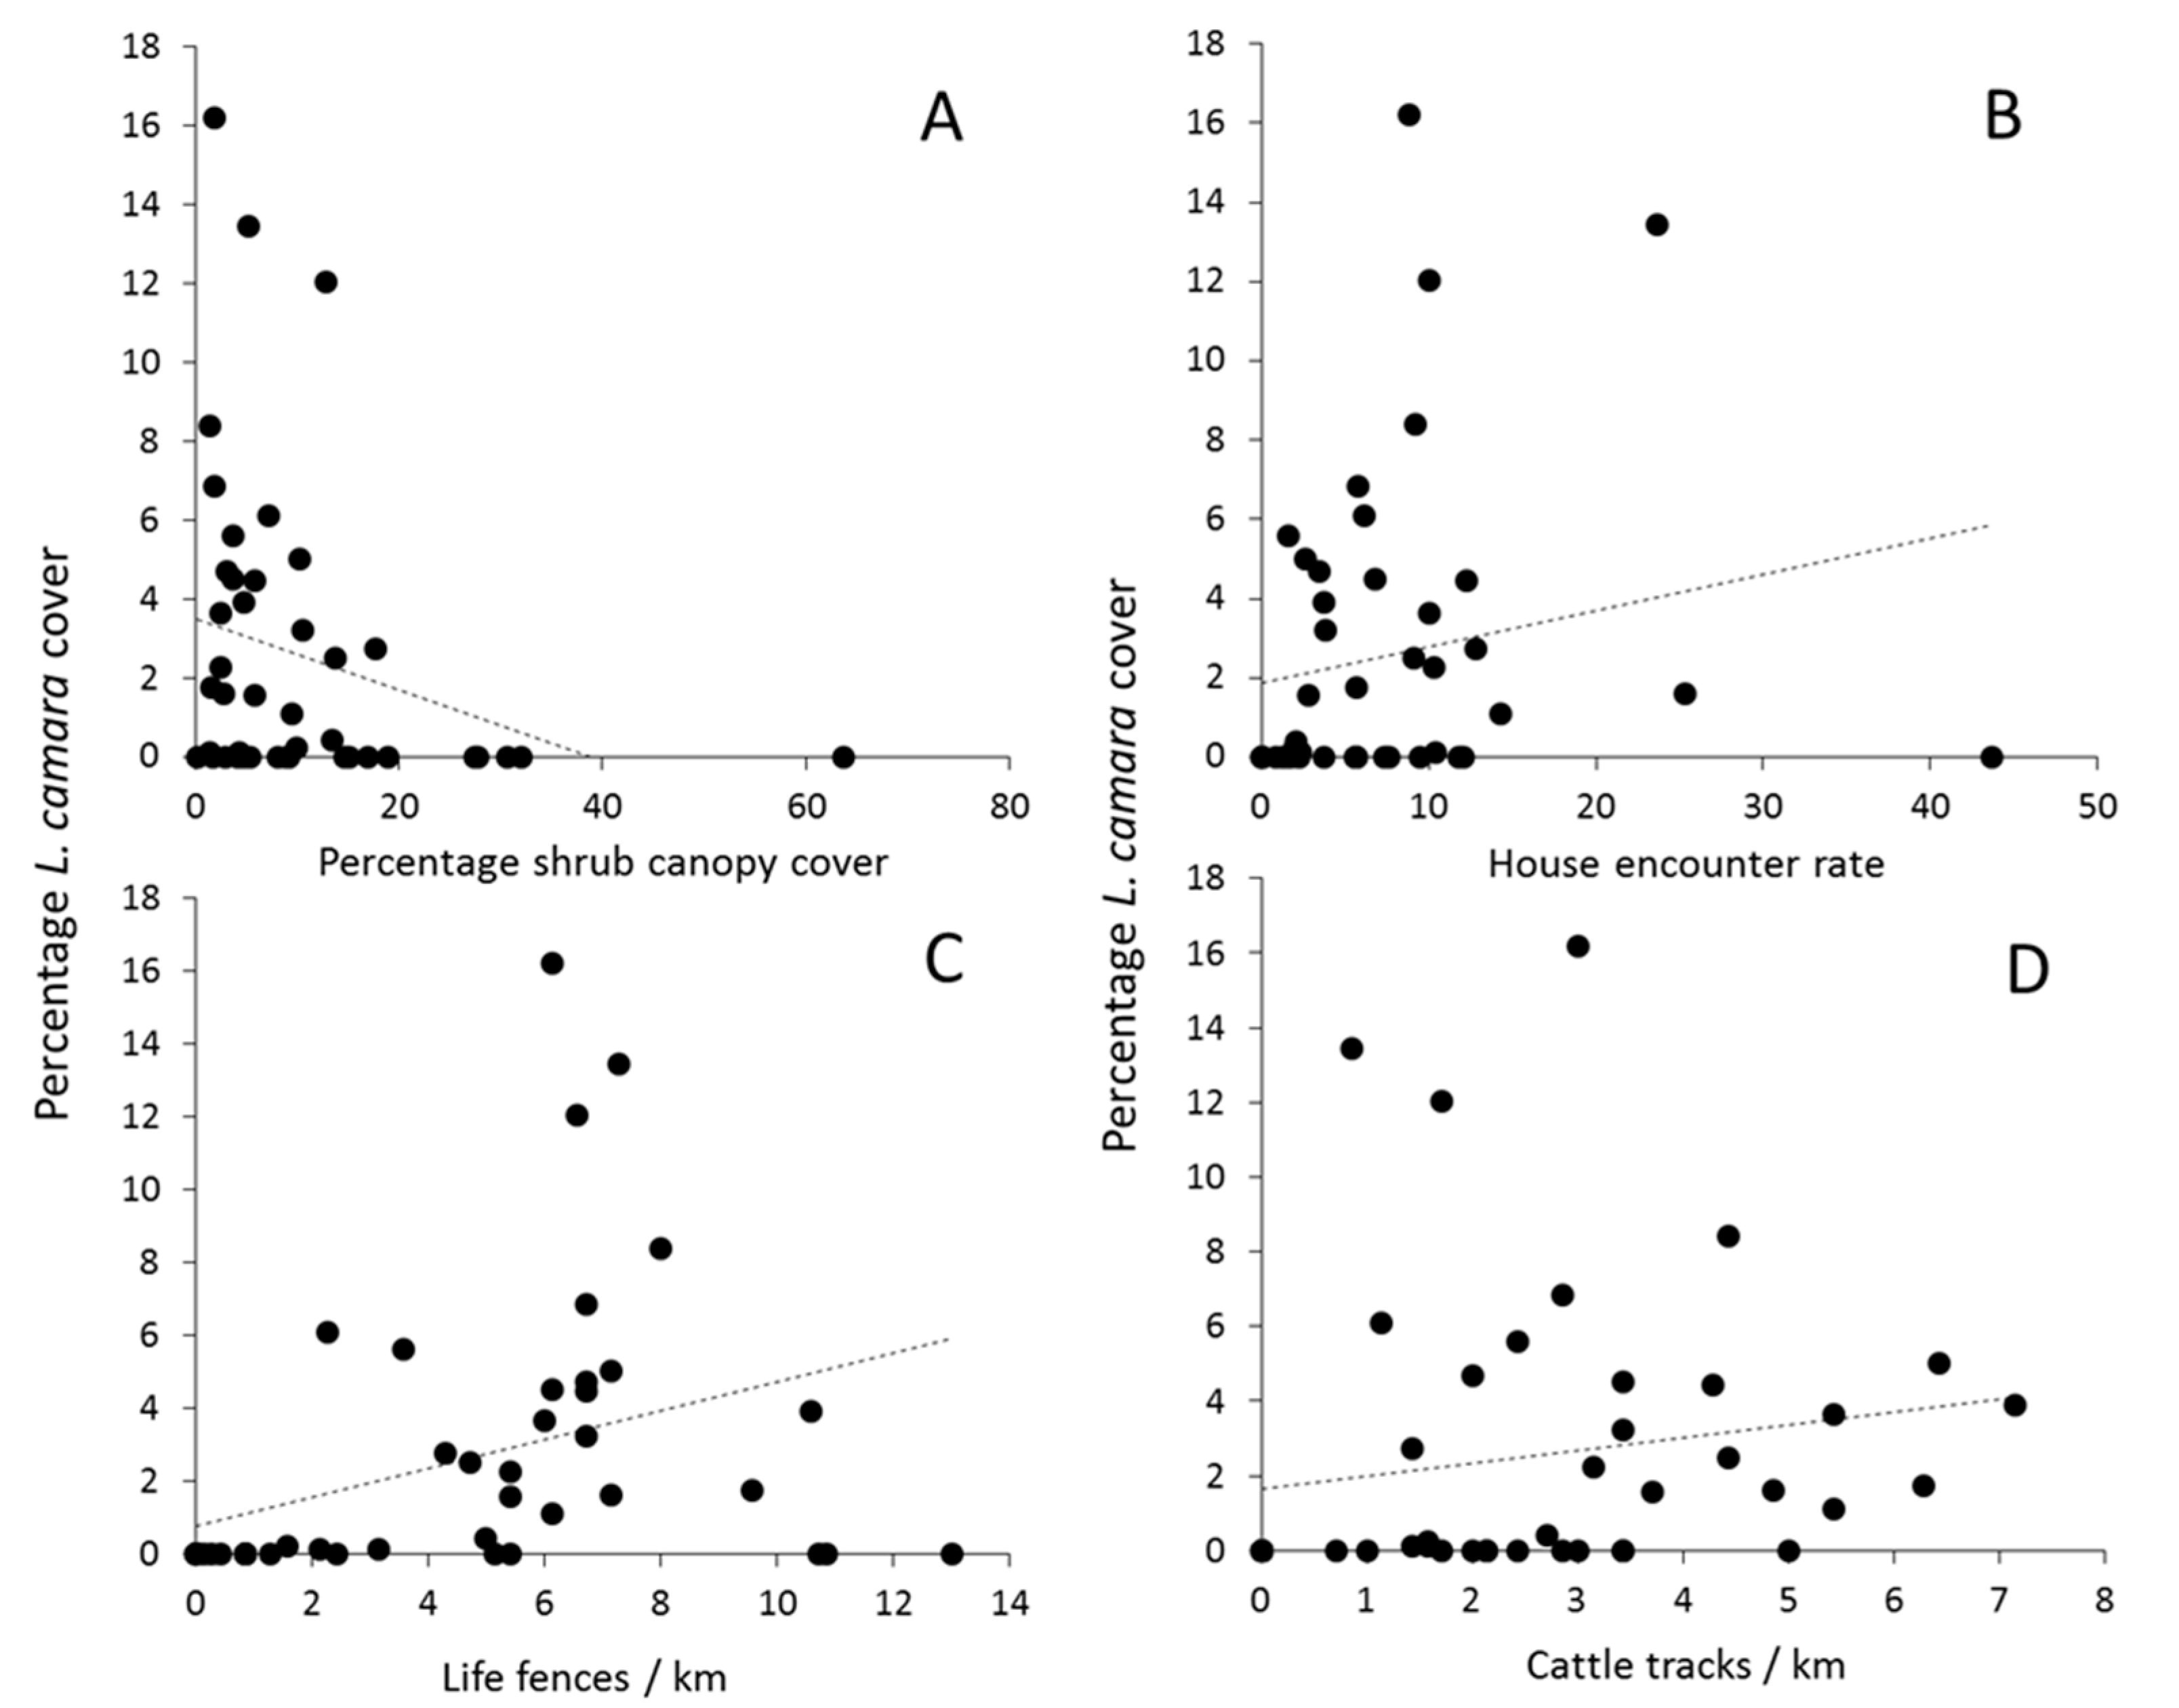
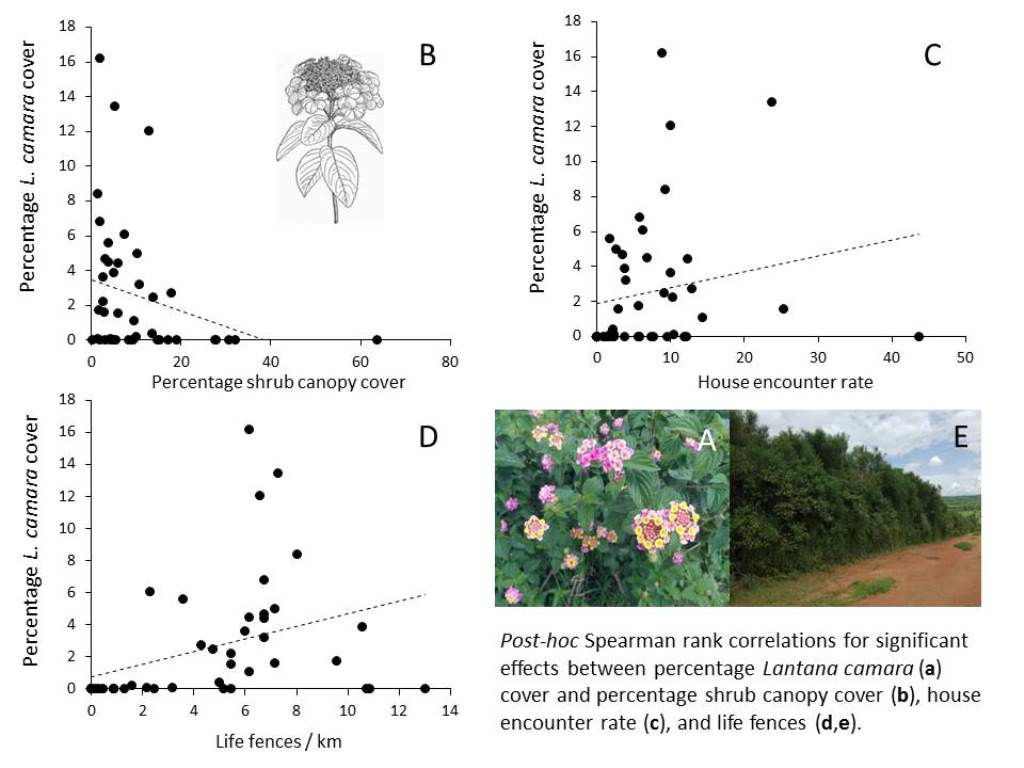
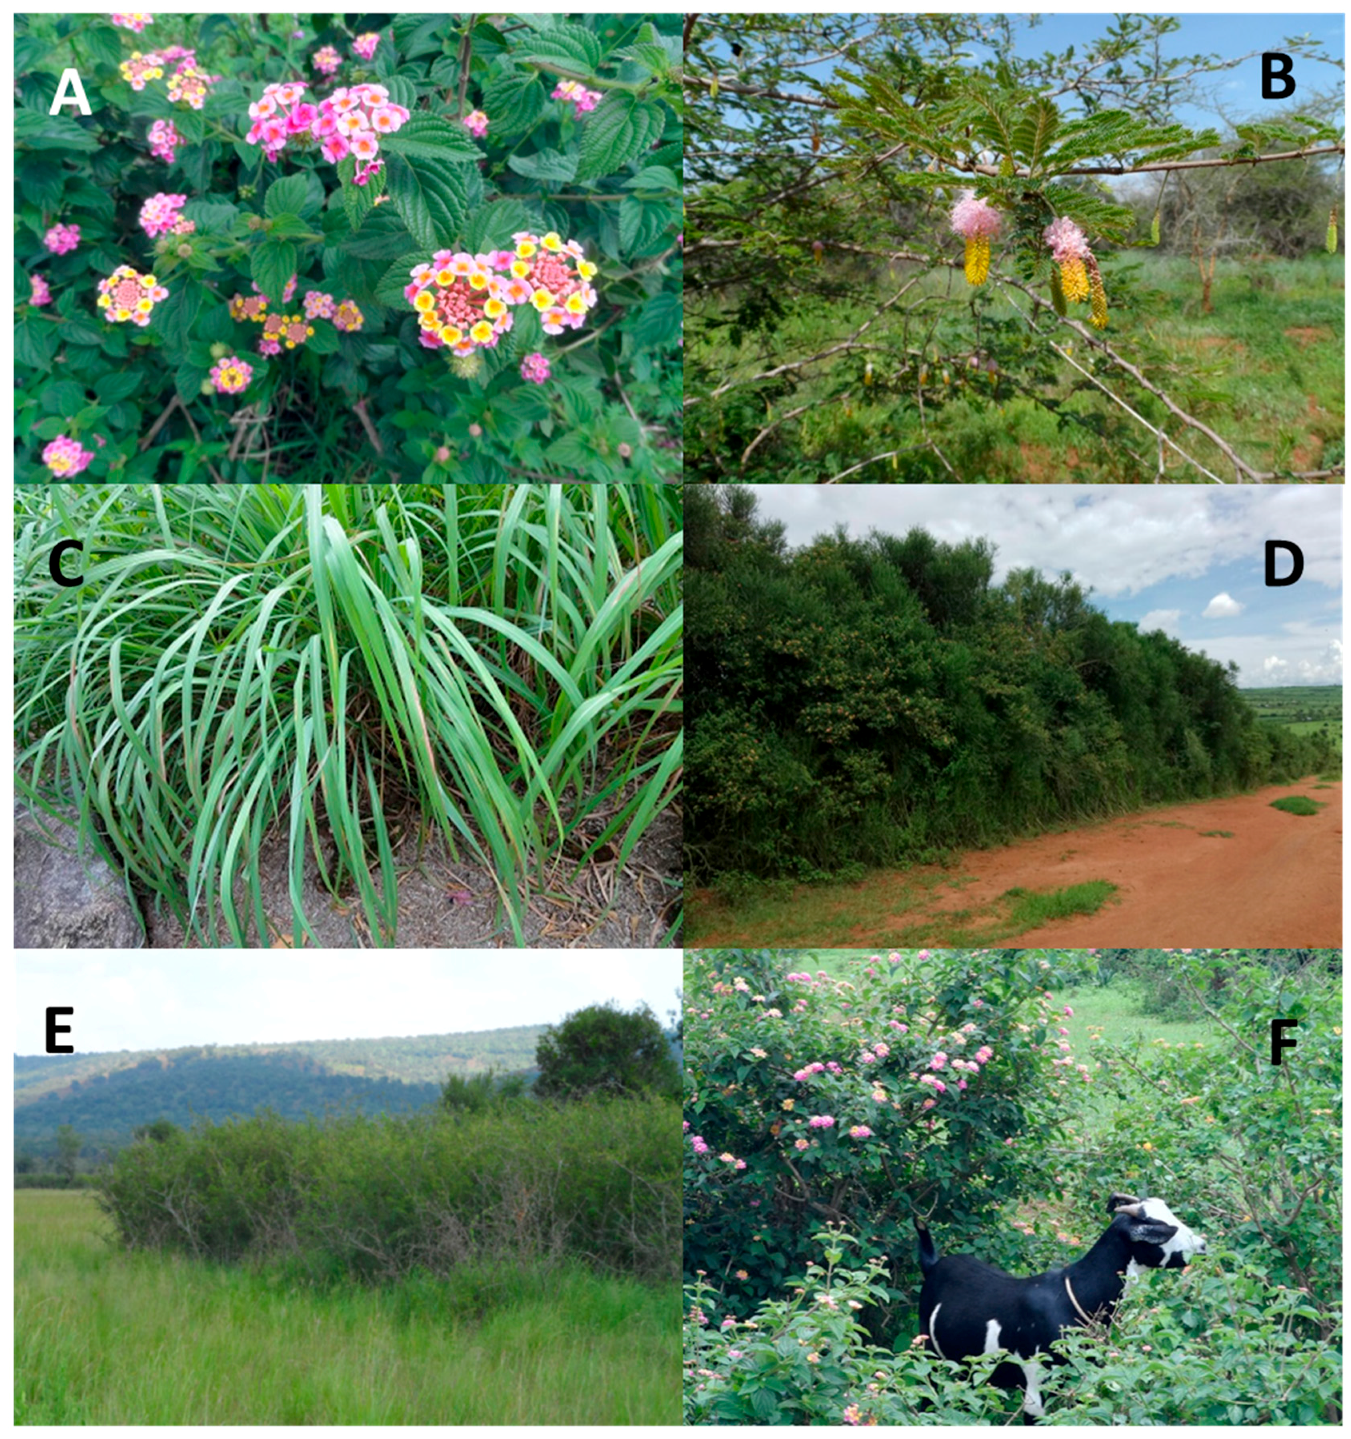
2. Results
3. Discussion
4. Material and Methods
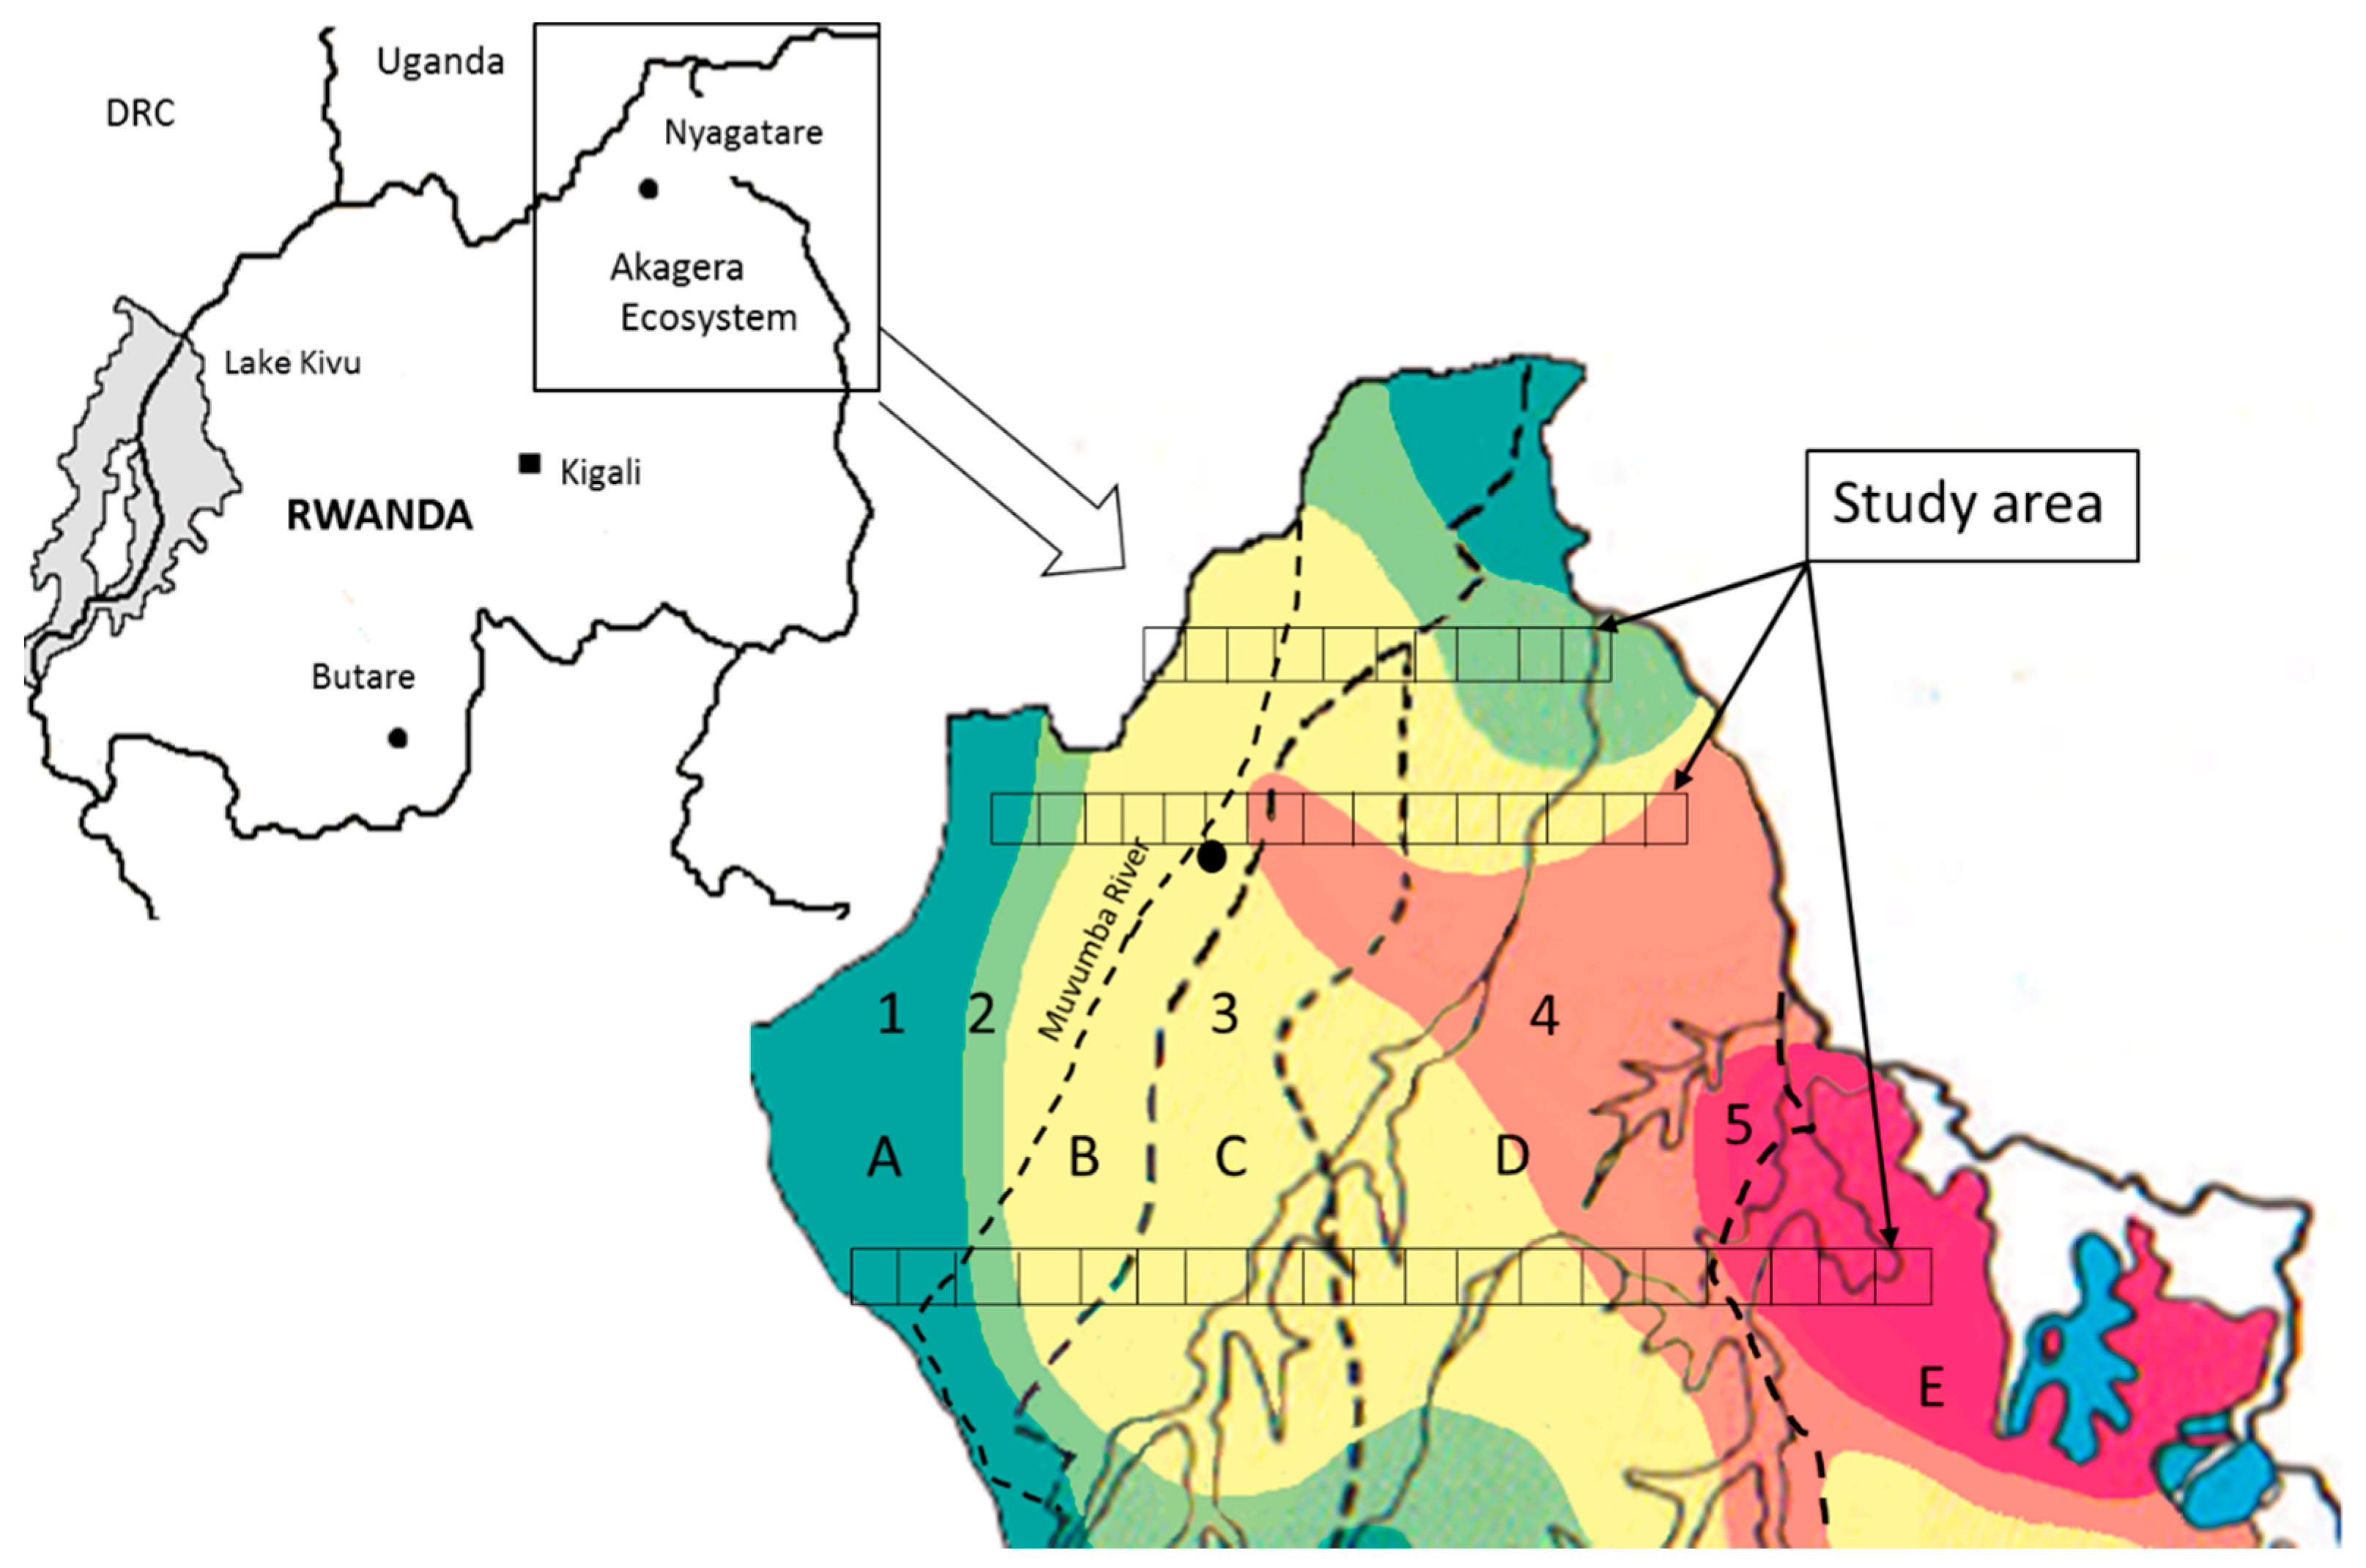
4.1. Study Area
4.2. Assessment of Invasive Plant Species (Dependent Variables)
4.3. Ecological Predictor Variables (Independent Variables)
4.3.1. Conservation-Political History and Eco-Climatic Data
4.3.2. Livestock Density
4.3.3. Wildlife Encounters Frequency and Bird Richness
4.3.4. Degree of Grassland Fragmentation
4.3.5. Human Disturbance
4.3.6. Water-Holding Capacity and Soil Porosity
4.3.7. Above-Ground Monocotyledonous Biomass
4.3.8. Grass and Herb Frequency
4.4. Data Analysis
Supplementary Materials
Acknowledgments
Author Contributions
Conflicts of Interest
References
- Mooney, H.A.; Cleland, E.E. The evolutionary impact of invasive species. Proc. Natl. Acad. Sci. USA 2001, 98, 5446–5451. [Google Scholar] [CrossRef] [PubMed]
- Davis, M.A. Biotic globalization: Does competition from introduced species threaten biodiversity? BioScience 2003, 53, 481–489. [Google Scholar] [CrossRef]
- Weber, E. Invasive Plant Species of the World: A Reference Guide to Environmental Weeds; CABI Publishing: Wallingford, UK, 2003; p. 560. [Google Scholar]
- Williamson, M. Biological Invasions; Chapman and Hall: London, UK, 1996; p. 244. [Google Scholar]
- Mooney, H.A.; Hofgaard, A. Biological invasions and global change. In Invasive Species and Biodiversity Management. Based on a Selection of Papers Presented at the Norway/UN Conference on Alien Species, Trondheim, Norway; Population and Community Biology Series; Sandlund, O.T., Schei, P.J., Viken, Å., Eds.; Kluwer Academic Publishers: Dordrecht, The Netherlands, 1999; Volume 24, pp. 139–148. [Google Scholar]
- Mooney, H.A.; Hobbs, R.J. Invasive Species in a Changing World; Island Press: Washington, DC, USA, 2000; p. 384. [Google Scholar]
- Moore, B.A. Alien Invasive Species: Impacts on Forests and Forestry—A Review; Forest Health & Biosecurity Working Paper 8; Forest Resources Division FAO: Rome, Italy, 2005; p. 115. [Google Scholar]
- Zettler, J.A.; Taylor, M.D.; Allen, C.R.; Spira, T.P. Consequences of forest clear-cuts for native and nonindigenous ants (Hymenoptera: Formicidae). Ann. Entomol. Soc. Am. 2004, 97, 513–518. [Google Scholar] [CrossRef]
- Crooks, J.A.; Chang, A.L.; Ruiz, G.M. Aquatic pollution increases the relative success of invasive species. Biol. Invasions 2011, 13, 165–176. [Google Scholar] [CrossRef]
- Arnold, A. Eingebürgerte Fischarten: Zur Biologie und Verbreitung Allochthoner Wildfische in Europa; A. Ziemsen: Wittenberg, Germany, 1990; p. 144. (In German) [Google Scholar]
- Deacon, A.E.; Ramnarine, I.W.; Magurran, A.E. How reproductive ecology contributes to the spread of a globally invasive fish. PLoS ONE 2011, 6, e24416. [Google Scholar] [CrossRef] [PubMed]
- Perrings, C.; Williamson, M.; Barbier, E.B.; Delfino, D.; Dalmazzone, S.; Shogren, J.; Simmons, P.; Watkinson, A. Biological invasion risks and the public good: An economic perspective. Conserv. Ecol. 2002, 6, 1. [Google Scholar] [CrossRef]
- Taylor, B.W.; Irwin, R.E. Linking economic activities to the distribution of exotic plants. Proc. Natl. Acad. Sci. USA 2004, 101, 17725–17730. [Google Scholar] [CrossRef] [PubMed]
- Wilcove, D.S.; Rothstein, D.; Dubow, J.; Phillips, A.; Losos, E. Quantifying threats to imperiled species in the United States. BioScience 1998, 48, 607–615. [Google Scholar] [CrossRef]
- Pimentel, D.; Lach, L.; Zuniga, R.; Morrison, D. Environmental and economic costs of nonindigenous species in the United States. BioScience 2000, 50, 53–65. [Google Scholar] [CrossRef]
- Čuda, J.; Skálová, H.; Janovský, Z.; Pyšek, P. Competition among native and invasive Impatiens species: The roles of environmental factors, population density and life stage. AoB Plants 2015, 7, plv033. [Google Scholar] [PubMed]
- Ayres, D.R.; Smith, D.L.; Zaremba, K.; Klohr, S.; Strong, D.R. Spread of exotic cordgrasses and hybrids (Spartina sp.) in the tidal marshes of San Francisco Bay, California. USA. Biol. Invasions 2004, 6, 221–231. [Google Scholar] [CrossRef]
- Whisenant, S.G. Changing fire frequencies on Idaho’s Snake River plains: Ecological and management implications. In Proceedings of the Symposium on Cheat Grass Invasion, Shrub Die-Off, and Other Aspects of Shrub Biology and Management, Las Vegas, NV, USA, 5–7 April 1989; McArthur, E.D., Romney, E.M., Smith, S.D., Tueller, P.T., Eds.; USDA Forest Service, Intermountain Research Station: Ogden, UT, USA, 1990; pp. 4–10. [Google Scholar]
- Ehrenfeld, J. Effects of exotic plant invasions on soil nutrient cycling processes. Ecosystems 2003, 6, 503–523. [Google Scholar] [CrossRef]
- Stromberg, J.C.; Lite, S.J.; Marler, R.; Paradzick, C.; Shafroth, P.B.; Shorrock, D.; White, J.M.; White, M.S. Altered stream-flow regimes and invasive plant species: The Tamarix case. Glob. Ecol. Biogeogr. 2007, 16, 381–393. [Google Scholar] [CrossRef]
- Pimentel, D.; Zuniga, R.; Morrison, D. Update on the environmental and economic costs associated with alien-invasive species in the United States. Ecol. Econ. 2005, 52, 273–288. [Google Scholar] [CrossRef]
- Witte, F.; Goldschmidt, T.; Wanink, J.; van Oijen, M.; Goudswaard, K.; Witte-Maas, E.; Bouton, N. The destruction of an endemic species flock: Quantitative data on the decline of the haplochromine cichlids of Lake Victoria. Environ. Biol. Fishes 1992, 34, 1–28. [Google Scholar] [CrossRef]
- Keane, R.M.; Crawley, M.J. Exotic plant invasions and the enemy release hypothesis. Trends Ecol. Evol. 2002, 17, 164–170. [Google Scholar] [CrossRef]
- Torchin, M.E.; Lafferty, K.D.; Dobson, A.P.; McKenzie, V.J.; Kuris, A.M. Introduced species and their missing parasites. Nature 2003, 421, 628–630. [Google Scholar] [CrossRef] [PubMed]
- Emde, S.; Kochmann, J.; Kuhn, T.; Plath, M.; Klimpel, S. Getting what is served? Feeding ecology influencing parasite-host interactions in invasive round goby Neogobius melanostomus. PLoS ONE 2014, 9, e109971. [Google Scholar] [CrossRef] [PubMed]
- Parker, I.M.; Rodriguez, J.; Loik, M.E. An evolutionary approach to understanding the biology of invasions: Local adaption and general-purpose genotypes in the weed Verbascum thapsus. Conserv. Biol. 2003, 17, 59–72. [Google Scholar] [CrossRef]
- Ellstrand, N.C.; Schierenbeck, K.A. Hybridazation as a stimulus for the evolution of invasiveness in plants? Proc. Natl. Acad. Sci. USA 2000, 97, 7043–7050. [Google Scholar] [CrossRef] [PubMed]
- Ministère des Terres, de la Réinstallation et de la Protection de l’Environnement (MINITERE). Etudes Relatives à la Protection Intégrée et Conservation des Ressources Naturelles des Zones Humides Critiques du Rwanda: Evaluation de la Diversité Biologique des Zones Humides; Ministère des Terres, de la Réinstallation et de la Protection de l’Environnement (MINITERE): Kigali, Rwanda, 2003; p. 78. [Google Scholar]
- Rwanda Environment Management Authority (REMA). Study to Assess the Impacts of Invasive Alien Species (Flowering Plants, Fish and Insects) in Natural Forest, Agro-Ecosystems, Lakes and Wetland Ecosystems in Rwanda and Develop Their Management Plans; Rwanda Environment Management Authority (REMA): Kigali, Rwanda, 2015; p. 100. [Google Scholar]
- Sanders, R.W. Taxonomy of Lantana sect Lantana (Verbenaceae). J. Bot. Res. Inst. Tex. 2012, 6, 403–442. [Google Scholar]
- Bhagwat, S.A.; Breman, E.; Thekaekara, T.; Thornton, T.F.; Willis, K.J. A battle lost? Report on two centuries of invasion and management of Lantana camara L. in Australia, India and South Africa. PLoS ONE 2012, 7, e32407. [Google Scholar] [CrossRef] [PubMed]
- Barceloux, D.G. Medical Toxicology of Natural Substances: Foods, Fungi, Medicinal Herbs, Plants, and Venomous Animals; Wiley & Sons: Oxford, UK, 2008; p. 1155. [Google Scholar]
- Haruna, S.S.; Ahmed, O.; Titilayo, J.O. Nutritional and anti-nutritional composition of Lantana camara leaf. J. Investig. Biochem. 2015, 4, 58–60. [Google Scholar] [CrossRef]
- Taylor, S.; Kumar, L.; Reid, N.; Kriticos, D.J. Climate change and the potential distribution of an invasive shrub, Lantana camara L. PLoS ONE 2012, 7, e35565. [Google Scholar] [CrossRef] [PubMed]
- Goncalves, E.; Herrera, I.; Duarte, M.; Bustamante, R.O.; Lampo, M.; Velásquez, G.; Sharma, G.P.; García-Rangel, S. Global invasion of Lantana camara: Has the climatic niche been conserved across continents? PLoS ONE 2014, 9, e111468. [Google Scholar] [CrossRef] [PubMed]
- Cronk, Q.C.B.; Fuller, J.L. Plant Invaders: The Threat to Natural Ecosystems; Chapman & Hall: London, UK, 1995; p. 241. [Google Scholar]
- Sharma, G.P.; Raghubanshi, A.S.; Singh, J.S. Lantana invasion: An overview. Weed Biol. Manag. 2005, 5, 157–165. [Google Scholar] [CrossRef]
- Moleele, N.M.; Ringrose, S.; Matheson, W.; Vanderpost, C. More woody plants? The status of bush encroachment in Botswana’s grazing areas. J. Environ. Manag. 2002, 64, 3–11. [Google Scholar] [CrossRef]
- Archer, S.R. Rangeland conservation and shrub encroachment: New perspectives on an old problem. In Wild Rangelands: Conserving Wildlife While Maintaining Livestock in Semi-Arid Ecosystems; du Toit, J.T., Kock, R., Deutsch, J.C., Eds.; Wiley-Blackwell: Oxford, UK, 2010; pp. 53–97. [Google Scholar]
- Vande weghe, J.P. Akagera, Land of Water, Grass and Fire; WWF: Brussels, Belgium, 1990; p. 256. [Google Scholar]
- Roques, K.G.; O’Connor, T.G.; Watkinson, A.R. Dynamics of shrub encroachment in an African savanna: Relative influences of fire, herbivory, rainfall and density dependence. J. Appl. Ecol. 2001, 38, 268–280. [Google Scholar] [CrossRef]
- Bredon, R.M.; Torell, B.; Marshall, B. Measurement of selective grazing of tropical pastures using esophageal fistulated steers. J. Range Manag. 1967, 20, 317–320. [Google Scholar] [CrossRef]
- Sankaran, M. Fire, grazing and the dynamics of tall-grass savannas in the Kalakad-Mundanthurai Tiger Reserve, South India. Conserv. Soc. 2005, 3, 4–25. [Google Scholar]
- Byenkya, G.S. Impact of Undesirable Plant Communities on the Carrying Capacity and Livestock Performance in Pastoral Systems of South-Western Uganda. Ph.D. Thesis, Texas A&M University, College Station, TX, USA, May 2004. [Google Scholar]
- Fynn, R.; Morris, C.; Ward, D.; Kirkman, K. Trait–environment relations for dominant grasses in South African mesic grassland support a general leaf economic model. J. Veg. Sci. 2011, 22, 528–540. [Google Scholar] [CrossRef]
- Byenkya, G.S.; Gumisiriza, G.; Kasigwa, H. Evaluation of control strategies for Cymbopogon nardus in grazing areas of Uganda. J. Agric. Sci. Technol. B 2013, 3, 656–660. [Google Scholar]
- Kanyamibwa, S. Impact of war on conservation: Rwandan environment and wildlife in agony. Biodivers. Conserv. 1998, 7, 1399–1406. [Google Scholar] [CrossRef]
- Plumptre, A.J.; Masozera, M.; Vedder, A. The Impact of Civil War on the Conservation of Protected Areas in Rwanda; WCS Biodiversity Support Program: Washington, DC, USA, 2001; p. 28. [Google Scholar]
- Schoene, C. Rwanda—Conservation in a Haunted Country. Projet de Protection des Réssources Naturelles; Technical Report GTZ-PRORENA-AKAGERA; Gesellschaft für Technische Zusammenarbeit (GTZ): Kigali, Rwanda, 2003; p. 37. [Google Scholar]
- Bariyanga, J.D.; Wronski, T.; Plath, M.; Apio, A. Effectiveness of electro-fencing for restricting the ranging behavior of wildlife: A case study in the degazetted parts of Akagera National Park. Afr. Zool. 2016, 51, 183–191. [Google Scholar] [CrossRef]
- Corlett, R.T. Frugivory and seed dispersal by vertebrates in the Oriental (Indomalayan) Region. Biol. Rev. Camb. Philos. Soc. 1998, 73, 413–448. [Google Scholar] [CrossRef] [PubMed]
- Umapathy, G.; Kumar, A. Impacts of the habitat fragmentation on time budget and feeding ecology of lion-tailed macaque (Macaca silenus) in rain forest fragments of Anamalai Hills, South India. Primate Rep. 2000, 58, 67–82. [Google Scholar]
- Vardien, W.; Richardson, D.M.; Foxcroft, L.C.; Thompson, G.D.; Wilson, J.R.U.; le Roux, J.J. Invasion dynamics of Lantana camara L. (sensu lato) in South Africa. S. Afr. J. Bot. 2012, 81, 81–94. [Google Scholar] [CrossRef]
- Thomas, S.E. Datasheet Invasive Species Compendium: Lantana camara (Lantana); Centre for Agriculture and Bioscience International (CABI): Wallingford, Oxon, UK, 2015; Available online: http://www.cabi.org/isc/datasheet/29771 (accessed on 22 January 2017).
- Day, M.; Grice, T.; Carter, R.; Clarke, A.; Eldershaw, G.; Sloane, J.; Thorp, J. Weed Management Guide Lantana—Lantana camara; Cooperative Research Centre (CRC) Australian Weed Management, University of Adelaide: Glen Osmond, Australia, 2003; p. 6. [Google Scholar]
- Sharma, G.P.; Raghubanshi, A.S. Lantana invasion alters soil nitrogen pools and processes in the tropical dry deciduous forest of India. Appl. Soil Ecol. 2009, 42, 134–140. [Google Scholar] [CrossRef]
- Fensham, R.J.; Fairfax, R.J.; Cannell, R.J. The invasion of Lantana camara L. in Forty Mile Scrub National Park, North Queensland. Austral J. Ecol. 1994, 19, 297–305. [Google Scholar] [CrossRef]
- Duggin, J.A.; Gentle, C.B. Experimental evidence on the importance of disturbance intensity for invasion of Lantana camara L. in dry rainforest-open forest ecotones in north-eastern NSW, Australia. For. Ecol. Manag. 1998, 109, 279–305. [Google Scholar] [CrossRef]
- August-Schmidt, E.M.; Haro, G.; Bontrager, A.; D’Antonio, C.M. Preferential associations of invasive Lantana camara (Verbenaceae) in a seasonally dry Hawaiian woodland. Pac. Sci. 2015, 69, 385–397. [Google Scholar] [CrossRef]
- Rodriguez, L. A Global Perspective on the Total Economic Value of Pastoralism: Global Synthesis Report Based on Six Country Valuations; World Initiative for Sustainable Pastoralism: Nairobi, Kenya, 2008; p. 25. [Google Scholar]
- CBD, Secretariat of the Convention on Biological Diversity. Pastoralism, Nature Conservation and Development: A Good Practice Guide; CBD: Montreal, QC, Canada, 2010; p. 43. [Google Scholar]
- WISP, World Initiative for Sustainable Pastoralism. Forgotten Services, Diminished Goods: Understanding the Agroecosystem of Pastoralism; WISP Policy Note No. 8; IUCN-WISP: Gland, Switzerland, 2008; p. 4. [Google Scholar]
- Holechek, J.L.; Cibils, A.F.; Bengaly, K.; Kinyamario, J.I. Human population growth, African pastoralism, and rangelands: A perspective. Rangel. Ecol. Manag. 2016. [Google Scholar] [CrossRef]
- Behnke, R.H.; Fernandez-Gimenez, M.E.; Turner, M.D.; Stammler, F. Pastoral migration: mobile systems of livestock husbandry. In Animal Migration; Milner-Gulland, E.J., Fryxell, J.M., Sinclair, A.R.E., Eds.; Oxford University Press: Oxford, UK, 2011; p. 257. [Google Scholar]
- Turner, M.D.; McPeak, J.G.; Gillin, K.; Kitchell, E.; Kimambo, N. Reconciling flexibility and tenure security for pastoral resources: The geography of transhumance networks in Eastern Senegal. Hum. Ecol. 2016, 44, 199–215. [Google Scholar] [CrossRef]
- Qu, T.; Du, W.; Yuan, X.; Yang, Z.; Liu, D.; Wang, D.; Yu, L. Impacts of grazing intensity and plant community composition on soil bacterial community diversity in a steppe grassland. PLoS ONE 2016, 11, e0159680. [Google Scholar] [CrossRef] [PubMed]
- Ren, H.; Schönbach, P.; Wan, H.; Gierus, M.; Taube, F. Effects of grazing intensity and environmental factors on species composition and diversity in typical steppe of Inner Mongolia, China. PLoS ONE 2012, 7, e52180. [Google Scholar] [CrossRef] [PubMed]
- Davies, J.; Nori, M. Managing and mitigating climate change through pastoralism. Policy Matters 2008, 16, 127–162. [Google Scholar]
- Homewood, K.M.; Rodgers, W.A. Pastoralism and conservation. Hum. Ecol. 1984, 12, 431–441. [Google Scholar] [CrossRef]
- Averbeck, C.; Plath, M.; Wronski, T.; Apio, A. Effect of human nuisance on the social organisation of large mammals: Group sizes and compositions of seven ungulate species in Lake Mburo National Park and the adjacent Ankole Ranching Scheme. Wildl. Biol. 2012, 18, 180–193. [Google Scholar] [CrossRef]
- Averbeck, C. Incorporating local people through economic incentives at Lake Mburo National Park, Uganda—Africa works! In Stakeholder Dialogues in Natural Resources Management; Stollkleemann, S., Welp, M., Eds.; Springer: Berlin, Germany, 2012; pp. 325–343. [Google Scholar]
- Wrobel, M.L.; Redford, K.H. A review of rangeland conservation issues in an uncertain future. In Wild Rangelands: Conserving Wildlife While Maintaining Livestock in Semi-Arid Ecosystems; du Toit, J.T., Kock, R., Deutsch, J.C., Eds.; Wiley-Blackwell: Oxford, UK, 2010; pp. 1–12. [Google Scholar]
- Kabasa, J.D. The Nutritional Ecology and Effects of Brows Polyphenols in Goats of the Ankole Range Land Ecosystem in Uganda; Cuvillier: Göttingen, Germany, 1999; p. 190. [Google Scholar]
- Langdale-Brown, I. The Vegetation of Uganda (Excluding Karamoja); Mem. Uganda Department Agriculture Research Division, Government of Uganda: Kampala, Uganda, 1960; Volume 2, pp. 1–45.
- Williams, S.D.; Ntayombya, P. Akagera Biodiversity Project—Final Report; Zoological Society of London & Ministry of Agriculture, Livestock, Environment & Rural Development: London, UK; Kigali, Rwanda, 1999; p. 138. [Google Scholar]
- Williams, S.D.; Ntayombya, P. Rwanda: Akagera National Park; Antelope Survey—Update no. 8; IUCN/SSC Antelope Specialist Group: Gland, Switzerland, 2001; pp. 46–51. [Google Scholar]
- Vande Weghe, J.P.; Vande weghe, G.R. Birds in Rwanda; Rwanda Development Board: Kigali, Rwanda, 2011; p. 336. [Google Scholar]
- Apio, A.; Umuntunundi, P.; Lerp, H.; Bierbach, D.; Plath, M.; Wronski, T. Persistence of two small antelope species in the degraded Mutara Rangelands (Akagera Ecosystem) based on pastoralists ’and farmers’ perceptions. Hum. Ecol. 2015, 43, 613–620. [Google Scholar] [CrossRef]
- Canfield, R.H. Application of the line interception method in sampling range vegetation. J. For. 1941, 39, 388–394. [Google Scholar]
- Kent, M.; Coker, P. Vegetation Description and Analysis—A Practical Approac; Wiley & Sons: New York, NY, USA, 1992; p. 428. [Google Scholar]
- Thornes, J.B. Modelling soil erosion by grazing: Recent developments and new approaches. Geogr. Res. 2007, 45, 13–26. [Google Scholar] [CrossRef]
- Wronski, T.; Mosfer, A.N.; Plath, M. Endemic Farasan gazelle (Gazella gazella farasani) enhance the dispersal of invasive Prosopis juliflora on Farasan Islands, Saudi Arabia. Rev. Ecol. 2012, 67, 329–337. [Google Scholar]
- Thomas, L.; Laake, J.L.; Strindberg, S.; Marques, F.F.C.; Buckland, S.T.; Borchers, D.L.; Anderson, D.R.; Burnham, K.P.; Hedley, S.L.; Pollard, J.H.; et al. Distance 5.0; Research Unit for Wildlife Population Assessment, University of St. Andrews: St. Andrews, UK, 2005. [Google Scholar]
- Thomas, L.; Buckland, S.T.; Rexstad, E.A.; Laake, J.L.; Strindberg, S.; Hedley, S.L.; Bishop, J.R.B.; Marques, T.A.; Burnham, K.P. Distance software: Design and analysis of distance sampling surveys for estimating population size. J. Appl. Ecol. 2010, 47, 5–14. [Google Scholar] [CrossRef] [PubMed]
- Stock, D.; Johnson, K.; Clark, A.; van Oosterhout, E. Lantana Best Practice Manual and Decision Support Tool; The State of Queensland, Department of Employment, Economic Development and Innovation: Yeerongpilly, Australia, 2009; p. 121. [Google Scholar]
- Baskin, C.C.; Baskin, J.M. Seeds: Ecology, Biogeography, and Evolution of Dormancy and Germination; Academic Press: San Diego, CA, USA, 2014; p. 1600. [Google Scholar]
- Mares, M.E.; Rosenzweig, M.L. Granivory in North and South American deserts: Rodents, birds and ants. Ecology 1978, 59, 235–241. [Google Scholar] [CrossRef]
- Ahmad, S.; Call, C.A.; Schupp, E.W. Regeneration ecology of Chrysopogon aucheri and Cymbopogon jwarancusa in upland Balochistan: II. Dispersal, predation and soil reserves of seeds (Spikelets). Pak. J. Biol. Sci. 2000, 3, 1880–1883. [Google Scholar]
- Doichinova, V.; Zhiyanski, M.; Hursthouse, A. Impact of urbanisation on soil characteristics. Environ. Chem. Lett. 2006, 3, 160–163. [Google Scholar] [CrossRef]
- Steinman, A.D.; Lamberti, G.A. Biomass and pigments of benthic algae. In Methods in Stream Ecology; Hauer, F.R., Lamberti, G.A., Eds.; Academic Press: San Diego, CA, USA, 1996; pp. 357–379. [Google Scholar]
- Trollope, W.S.W.; Potgieter, A.L.F.; Zambatis, N. Assessing veld condition in the Kruger National Park South Africa using key grass species. Koedoe 1989, 32, 67–94. [Google Scholar] [CrossRef]
- Du Plessis, W.P.; Bredenkamp, G.J.; Trollope, W.S.W. Development of a technique for assessing veld condition in Etosha National Park, Namibia, using key herbaceous species. Koedoe 1998, 41, 19–29. [Google Scholar] [CrossRef]
- O’Higgins, R.C. Savannah woodland degradation assessments in Ghana: Integrating ecological indicators with local perceptions. Earth Environ. 2007, 3, 246–281. [Google Scholar]
- Fatunbi, A.O.; Dube, S. Land degradation in a game reserve in Eastern Cape of South Africa: Soil properties and vegetation cover. Sci. Res. Essays 2008, 3, 111–119. [Google Scholar]


| Variable | PC1 | PC2 | PC3 | PC4 | PC5 | PC6 |
|---|---|---|---|---|---|---|
| Eigenvalue | 5.43 | 3.75 | 2.74 | 2.11 | 1.68 | 1.35 |
| % variance explained | 23.62 | 16.29 | 11.90 | 9.18 | 7.31 | 5.89 |
| Eco-climate | 0.825 | −0.202 | −0.023 | 0.244 | −0.027 | 0.202 |
| Conservation-political history | 0.648 | 0.076 | −0.351 | −0.015 | −0.416 | 0.029 |
| Cattle density | −0.053 | 0.198 | 0.021 | 0.760 | 0.137 | 0.043 |
| Goat density | −0.066 | 0.025 | −0.100 | 0.333 | 0.744 | 0.386 |
| Ungulate encounter frequency | 0.906 | −0.005 | −0.134 | −0.113 | −0.012 | −0.172 |
| Primate encounter frequency | 0.883 | 0.033 | −0.076 | −0.214 | 0.066 | −0.140 |
| Bird species richness | 0.587 | 0.002 | −0.140 | 0.236 | −0.349 | 0.286 |
| House encounter rate | −0.247 | −0.080 | 0.855 | −0.082 | −0.137 | 0.068 |
| Human encounter rate | −0.287 | −0.034 | 0.854 | −0.056 | −0.076 | −0.151 |
| Ranch/garden ratio | 0.829 | −0.103 | −0.197 | −0.095 | 0.069 | −0.057 |
| Living fences | −0.212 | −0.288 | 0.569 | 0.434 | 0.039 | 0.471 |
| Cattle tracks | −0.201 | −0.012 | 0.217 | 0.456 | −0.015 | 0.667 |
| Tree cutting | 0.125 | 0.753 | −0.158 | 0.352 | −0.274 | 0.245 |
| Charcoal burning | 0.136 | 0.776 | 0.012 | 0.258 | −0.100 | 0.074 |
| Watering troughs | 0.024 | 0.093 | 0.689 | 0.356 | 0.300 | 0.297 |
| Erosion | −0.101 | 0.072 | 0.018 | −0.053 | −0.026 | 0.799 |
| Tree canopy cover | 0.606 | 0.397 | −0.117 | 0.100 | −0.091 | 0.310 |
| Shrub canopy cover | −0.219 | 0.727 | −0.132 | −0.123 | 0.062 | −0.171 |
| Monocotyledonous biomass | −0.231 | 0.391 | −0.036 | 0.004 | 0.539 | −0.309 |
| Grass frequency | 0.096 | −0.642 | −0.212 | 0.494 | −0.140 | −0.077 |
| Herb frequency | −0.018 | 0.015 | −0.066 | −0.751 | 0.252 | −0.101 |
| Soil water holding potential | −0.019 | −0.068 | 0.061 | −0.093 | 0.668 | −0.460 |
| Soil porosity | 0.056 | −0.231 | −0.050 | −0.323 | 0.728 | 0.068 |
| Factor | df | Mean Square | F | p |
|---|---|---|---|---|
| Lantana camara | ||||
| PC1 | 1 | 1.454 | 2.291 | 0.139 |
| PC2 | 1 | 3.150 | 4.964 | 0.032 |
| PC3 | 1 | 3.899 | 6.145 | 0.018 |
| PC4 | 1 | 1.491 | 2.350 | 0.134 |
| PC5 | 1 | 0.003 | 0.005 | 0.943 |
| PC6 | 1 | 0.853 | 1.345 | 0.254 |
| PC3 × PC6 | 1 | 9.334 | 14.712 | 0.0001 |
| Error | 36 | 0.634 | ||
| Dichrostachys cinerea | ||||
| PC1 | 1 | 0.799 | 0.760 | 0.389 |
| PC2 | 1 | 2.018 | 1.919 | 0.174 |
| PC3 | 1 | 0.079 | 0.075 | 0.786 |
| PC4 | 1 | 0.569 | 0.541 | 0.467 |
| PC5 | 1 | 1.235 | 1.175 | 0.285 |
| PC6 | 1 | 0.399 | 0.380 | 0.542 |
| Error | 37 | 1.051 | ||
| Cymbopogon nardus | ||||
| PC1 | 1 | 2.223 | 2.284 | 0.139 |
| PC2 | 1 | 4.769 | 4.901 | 0.033 |
| PC3 | 1 | 0.281 | 0.289 | 0.594 |
| PC4 | 1 | 0.105 | 0.108 | 0.745 |
| PC5 | 1 | 0.326 | 0.335 | 0.566 |
| PC6 | 1 | 0.289 | 0.297 | 0.589 |
| Error | 37 | 0.973 | ||
| Lantana camara | ||||
| PC2 | Tree Cutting | Charcoal Burning | Shrub Canopy Cover | Grass Frequency |
| r | +0.147 | −0.071 | −0.348 | +0.014 |
| p | 0.341 | 0.648 | 0.021 | 0.926 |
| PC3 | House encounter rate | People encounter rate | Living fences | Watering troughs |
| r | +0.333 | +0.211 | +0.558 | +0.227 |
| p | 0.027 | 0.167 | <0.0001 | 0.137 |
| PC6 | Cattle tracks | Erosion | ||
| r | +0.398 | +0.276 | ||
| p | 0.008 | 0.069 | ||
| Cymbopogon nardus | ||||
| PC2 | Tree cutting | Charcoal burning | Shrub canopy cover | Grass frequency |
| r | +0.203 | +0.097 | +0.157 | −0.172 |
| P | 0.184 | 0.532 | 0.307 | 0.264 |
© 2017 by the authors. Licensee MDPI, Basel, Switzerland. This article is an open access article distributed under the terms and conditions of the Creative Commons Attribution (CC BY) license (http://creativecommons.org/licenses/by/4.0/).
Share and Cite
Wronski, T.; Bariyanga, J.D.; Sun, P.; Plath, M.; Apio, A. Pastoralism versus Agriculturalism—How Do Altered Land-Use Forms Affect the Spread of Invasive Plants in the Degraded Mutara Rangelands of North-Eastern Rwanda? Plants 2017, 6, 19. https://doi.org/10.3390/plants6020019
Wronski T, Bariyanga JD, Sun P, Plath M, Apio A. Pastoralism versus Agriculturalism—How Do Altered Land-Use Forms Affect the Spread of Invasive Plants in the Degraded Mutara Rangelands of North-Eastern Rwanda? Plants. 2017; 6(2):19. https://doi.org/10.3390/plants6020019
Chicago/Turabian StyleWronski, Torsten, Jean Damascene Bariyanga, Ping Sun, Martin Plath, and Ann Apio. 2017. "Pastoralism versus Agriculturalism—How Do Altered Land-Use Forms Affect the Spread of Invasive Plants in the Degraded Mutara Rangelands of North-Eastern Rwanda?" Plants 6, no. 2: 19. https://doi.org/10.3390/plants6020019