Article

Energy-Efficient Packet Relaying in Wireless Image Sensor Networks Exploiting the Sensing Relevancies of Source Nodes and DWT Coding

1
DTEC-UEFS, State University of Feira de Santana, Feira de Santana, 44036-900, Brazil
2
DCA-CT-UFRN, Federal University of Rio Grande do Norte, Natal, 59072-970, Brazil
3
IDMEC-FEUP-UP, University of Porto, Porto, 4200-465, Portugal
4
INESC TEC-FEUP-UP, University of Porto, Porto, 4200-465, Portugal
*
Author to whom correspondence should be addressed.
J. Sens. Actuator Netw. 2013, 2(3), 424-448; https://doi.org/10.3390/jsan2030424
Submission received: 24 May 2013 / Revised: 19 June 2013 / Accepted: 26 June 2013 / Published: 10 July 2013

Abstract

:
When camera-enabled sensors are deployed for visual monitoring, a new set of innovative applications is allowed, enriching the use of wireless sensor network technologies. In these networks, energy-efficiency is a highly desired optimization issue, mainly because transmission of images and video streams over resource-constrained sensor networks is more stringent than transmission of conventional scalar data. Due to the nature of visual monitoring, that follows a directional sensing model, camera-enabled sensors may have different relevancies for the application, according to the desired monitoring tasks and the current sensors’ poses and fields of view. Exploiting this concept, each data packet may be associated with a priority level related to the packet’s origins, which may be in turn mapped to an energy threshold level. In such way, we propose an energy-efficient relaying mechanism where data packets are only forwarded to the next hop if the associated energy threshold level is below the current energy level of the relaying node. Thus, packets from low-relevant source nodes will be silently dropped when the current energy level of intermediate nodes run below the pre-defined thresholds. Doing so, energy is saved potentially prolonging the network lifetime. Besides the sensing relevancies of source nodes, the relevance of DWT subbands for reconstruction of original images is also considered. This allows the creation of a second level of packet prioritization, assuring a minimal level of image quality even for the least relevant source nodes. We performed simulations for the proposed relaying mechanism, assessing the expected performance over a traditional relaying paradigm.

1. Introduction

In recent years, Wireless Sensor Networks (WSNs) have raised a lot of attention of both industry and academic communities. Typically, WSNs are composed of self-organizing electronic devices equipped with a short-range wireless transceiver, limited energy supply (usually batteries), a sensing unity and processing and memory resources [1,2], addressing applications as surveillance, tracking, disaster monitoring, home automation, industrial control, battlefield surveillance, among others.
The use of low-cost, low-power and low-resolution cameras to retrieve visual information of an area of interest can strongly enhance the monitoring capability of such networks, allowing the development of Visual Sensor Networks (VSNs) [3,4]. In general, VSNs are composed of one or more camera-enabled source nodes for a series of innovative multimedia sensing functions, where visual information retrieved from the monitored field in the form of video streaming, conventional snapshots, infrared or thermal images can significantly enhance a large set of monitoring applications [5,6]. Due to the stringent requirements of video streaming over sensor nodes, transmission of still images will be frequently a more feasible option, defining Wireless Image Sensor Networks (WISNs) [7].
Typically, much more energy is expected to be consumed in the transmission of visual data packets over wireless links than in storing and processing operations [8,9]. Images captured by visual sensors are packetized and transmitted to the sink of the network, where data packets are relayed by intermediate nodes in a hop-by-hop many-to-one manner. As packet relaying consumes energy and transmission paths may be disabled due to energy depletion of intermediate nodes, the total amount of information transmitted over the network should be minimized, saving energy with reduction of packet relaying and potentially prolonging the network lifetime.
Energy-efficient packet relaying is highly desired in resource-constrained visual sensor networks. A reasonable and feasible approach to achieve this goal is to limit the number of packets that may cross the network. Besides optimizations strategies that early discard packets in source nodes [10,11], packets may be discarded in intermediate nodes in a controlled way according to some prioritization strategy. In [9], each intermediate node decides if it has to relay image packets to the next hop according to its residual energy level and to the packets’ priorities. Transferring the dropping decision to intermediate nodes is a flexible solution that does not require constant monitoring of the network condition by source nodes, reducing the overall complexity.
The work in [9] assigns a priority level to each data packet according to the relevance of Discrete Wavelet Transform (DWT) subbands. Intermediate nodes check their residual energy to decide if an incoming packet must be relayed to the next hop or silently dropped, based on an optimization policy that associates packets’ priorities to energy thresholds. Doing so, the quality of images transmitted from any source node will be degraded when the residual energy of intermediate nodes runs bellow a predefined threshold. However, energy saving is achieved, potentially prolonging the network lifetime. Such relaying approach is especially beneficial for braided-paths, where a single intermediate node will relay packets from more than one source [12]. As hub nodes (which belong to more than one path) will typically receive more combined upstream traffic than other intermediate nodes, these nodes are more critical for the network operation, demanding an energy-efficient packet relaying approach as presented in [9].
We propose in this paper an energy-efficient packet relaying mechanism, where packets are also relayed to the next hop according to the residual energy level of intermediate nodes and predefined energy thresholds. However, and differently from the approach proposed in [9], the packets’ priorities are assigned based on the sensing relevancies of the active source nodes, instead of the payloads’ relevancies for the reconstruction of the original visual data. In many cases, source nodes may have different relevancies for the monitoring functions of the applications, where the significance of each source node is a function of the expected targets to be monitored (what is being covered), instead of the deployed network characteristics [13]. In the proposed mechanism, packets originated from the most relevant source nodes are more likely to be preserved, resulting in lower impact to the overall monitoring quality but still saving energy. In fact, as monitoring quality depends on what is viewed by source nodes instead of how good is the received visual data, our proposed relaying solution may perform better than mechanisms based only on payloads’ relevancies, as in [9].
Besides the exploitation of the novel concept of sensing relevance in wireless image sensor networks, we also consider 2D DWT coding over original raw images as a second level of prioritization. When incoming packets are originated from a source node whose sensing relevance indicates that those packets must be silently dropped for a determined residual energy level, packets carrying the highest relevant DWT subband will be preserved, assuring a minimal quality for the corresponding active source node. Although less energy savings are expected when compared with the relaying approach based only on sensing relevance, visual information from all source nodes will be always received, potentially assuring higher overall monitoring quality. We performed extensive simulations over both approaches in order to highlight the expected energy savings of the proposed energy-efficient relaying mechanism over a traditional relaying paradigm.
The remainder of this paper is organized as follows. Section 2 presents some related works. Section 3 brings fundaments of packet relaying and formulates the concept of sensing relevance in visual sensor networks. The statements and definitions of the proposed mechanism are described in Section 4. Simulation results and performance analyzes are presented in Section 5, followed by conclusions and references.

2. Related Works

The sensing relevancies of source nodes and optimizations based on such information are a novel concept that can enhance the performance of visual sensor networks, at the cost of a small monitoring quality loss. As energy is a major optimization issue, the differentiation of source nodes based on their monitoring importance for the application may allow the development of application-driven energy-efficient solutions. However, practical exploitation of such concept is not straightforward, since many issues are related with the establishment of the sensing relevance of each active visual sensor. An extensive discussion over such issues and a novel specialized protocol to support the assignment of sensing relevance indexes are presented in [13].
The innovative concept of sensing relevance has not been considered by the academic community for optimizations in visual sensor networks: most works have been concerned with optimizations of the number, field of view and energy preservation of active source nodes after deployment [14,15] and optimizations in the way packets are treated by the network, exploiting only the relevance of encoded multimedia data [11,16,17]. Recently, we exploited this concept to propose different optimizations to reduce energy consumption in wireless image sensor networks, adapting the transmission frequencies of source nodes [18] and the retransmission of corrupted packets [19]. In this last case, those proposed approaches endorse the use of global and local relevancies as the basis for network QoS, in the same way we support in this work.
Many other papers on literature influence our investigation in different ways, especially when they are related with network optimizations in visual sensor networks. Sensor nodes are expected to operate using non-rechargeable batteries, thus the network lifetime is a direct function of the energy consumption in nodes. As we aim to reduce energy consumption, there are many aspects of the network operation that can be optimized to achieve energy saving. For example, when network faces congestion, the current transmission rate of source nodes may be reduced, relieving congested nodes and indirectly reducing the energy consumption due to packet relaying [10]. Multiple paths from the source to the sink may also be exploited to reduce the amount of information that some intermediate nodes have to relay, as described in [20]. The work in [21] proposes an adaptive reduction of energy consumption exploiting image compression, according to the acceptable quality of the reconstructed images at the destination. In that work, energy saving is achieved adjusting the source coding rate and the error resilience scheme. Other recent works concerning optimizations to reduce energy consumption also contributed to our investigation [6,17,22].
Packets’ priorities have been also exploited to save energy with reduced impact on the quality of received data, but with small or absent concern with the overall quality of the visual monitoring functions of the applications. Lee and Jun [11] mitigate congestion by reducing data transmission rate with low impact to the quality of the received data. When necessary, fewer packets containing lower relevant information for the decoding process are transmitted to the sink, reducing the overall transmission rate of a particular source node and saving energy avoiding some packet relaying by intermediate nodes. The work in [23] proposes the splitting of each source stream in image and audio substreams, where each resulting substream receives a particular priority according to the application requirements and the current monitoring functions. A different approach may also reduce the average number of packets to be relayed, when some corrupted packets are not retransmitted, considering the relevance of DWT subbands [24]. At last, as described earlier, the work in [9] exploit the relevancies of DWT subbands to establish priorities to image packets, using that information when deciding if packets can be relayed to the next hop toward the sink.
In this paper, we propose a packet relaying approach based on the sensing relevancies of source nodes and DWT image coding. In a different way of previous works, both the residual energy of intermediate nodes and the packets’ priorities are considered to decide if incoming packets must be relayed to the next hop or silently dropped. Moreover, and in a different way of [9], we exploit the sensing relevancies of source nodes to assign packets’ priorities, achieving an energy-efficient packet relaying mechanism with high accordance with applications monitoring requirements.

3. Fundamental Concepts

In this section, we present some of the fundamental concepts related to the proposed energy-efficient relaying mechanism. We initially discuss packet relaying and energy consumption in wireless sensor networks. Then, the concept of sensing relevance in visual sensor networks is defined.

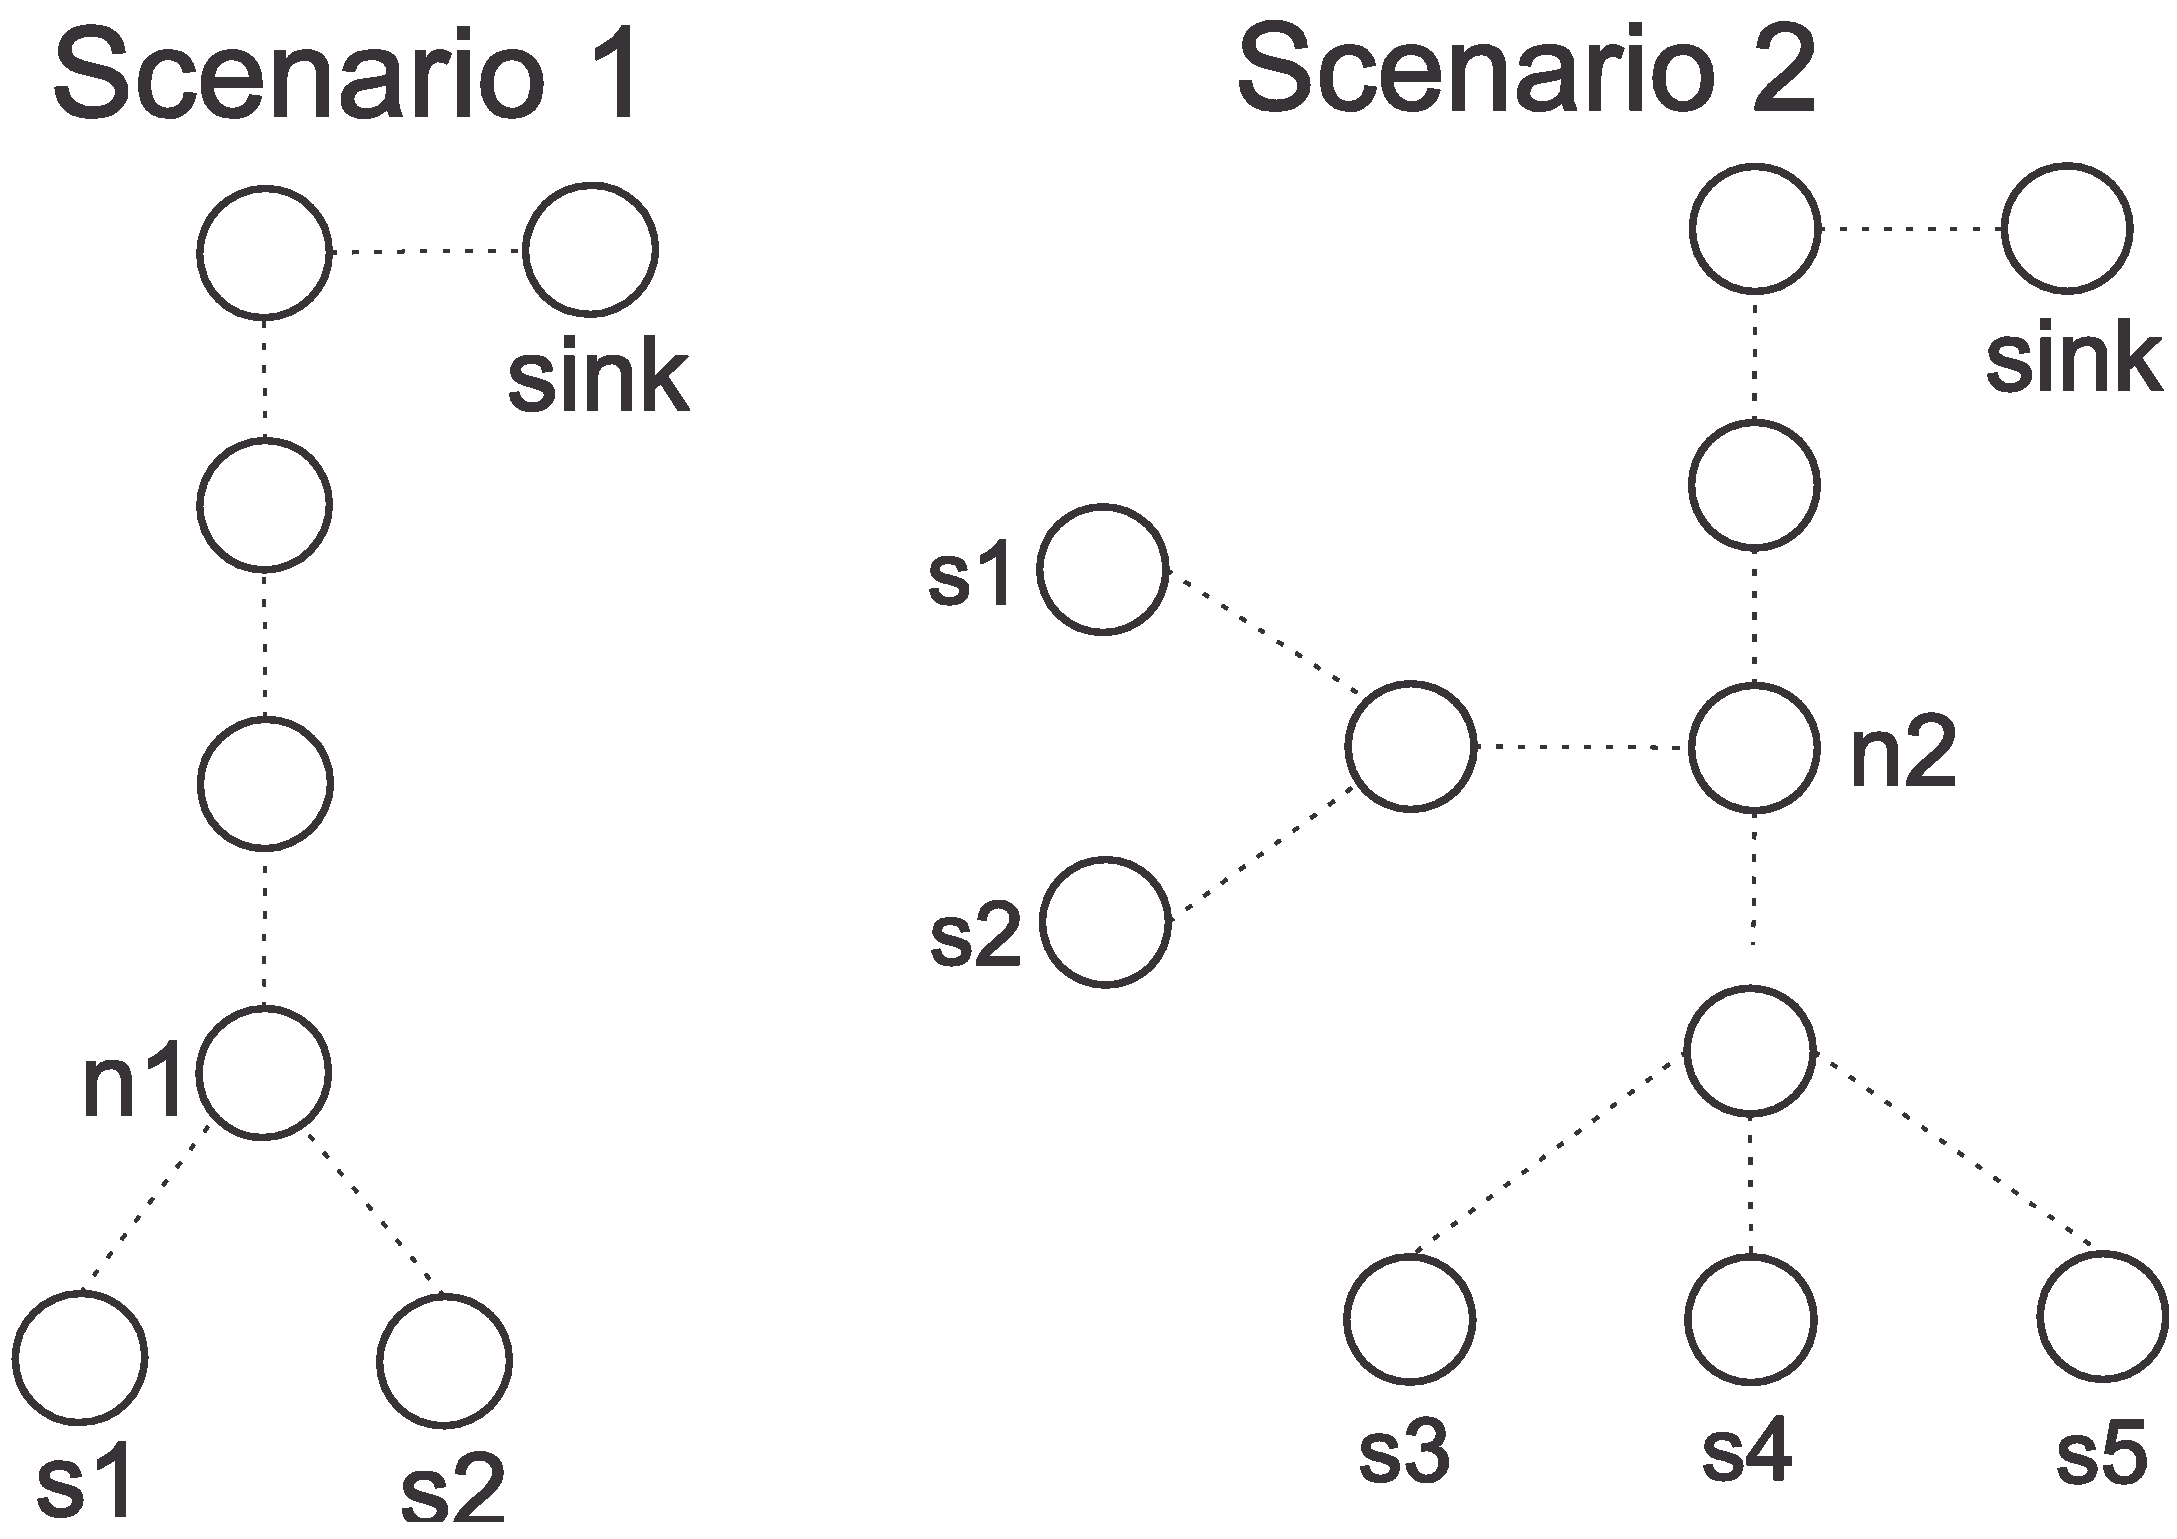
3.1. Packet Relaying and Energy Consumption

After network deployment, source nodes will transmit some type of data according to the expected monitoring functions of the considered application, which may be visual (retrieving still images or video streams) or scalar (as humidity, pressure or temperature). The remaining nodes are employed for packet relaying, since the low-range wireless hardware of sensor nodes and the expected lack of communication infrastructure demand a multihop transmission network. Packets have some sort of destination address that is used by intermediate notes to forward (relay) them over the network, depending on the nature of the adopted MAC (Medium Access Control) and routing protocols. In fact, the way packets are relayed may vary considerably, depending on the hardware resources and the employed algorithms for congestion control and error recovery [1,2]. For example, a relaying node may establish a timeout and wait for an ACK message from the next hop for every transmitted packet, while the receiving node may send back an ACK message for positive acknowledgment purposes. On the other hand, ACK messages may be employed for block acknowledgement, altering the way corrupted packets are transmitted and possibly retransmitted.
The actual energy consumption in each node due to packet relaying functions depends on many factors, as the employed radio, the transmission power and the physical and MAC protocols. In the latter case, duty-cycle MAC protocols are often used in wireless sensor networks to avoid idle listening, which play an import role in energy wasting [25]. Completing such complex scenario, synchronization messages may be transmitted among nodes to optimize the sleeping time. As a result, mathematical formulations considering specific details of physical and MAC operations are very complex, pushing mathematic models to incorporate some level of simplifications [7,26,27]. Nevertheless, numeric analyses based on mathematical formulations are useful in initial verifications, when the performance of protocols and algorithms need to be assessed concerning the expected average energy consumption.
We consider a WSN composed of P hop-by-hop wireless paths and S source nodes. Each path p, p = 1, …, P, comprises H(p) intermediate nodes, where data packets flow from the source node (h = 0) to the (unique) sink of the network (h = H(p) + 1). Every source node s, s = 1, …, S, is a camera-enabled sensor connected to the sink through at least one path p. In each path p will be transmitted control and data packets. The size of the transmitted data packets may vary according to the link layer technology and the application requirements, but we expect small data packets (reducing the error probability [28]) with the same size. If we consider that most wireless sensor motes communicates through IEEE 802.15.4 wireless link-layer technology [2], the maximum frame size is 127 bytes, computing both useful payload and all packet overhead [28]. Excluding the MAC header and the overhead for network, transport and/or application layer protocols, as well as the image fragmentation header required for image decoding at the receiver size, the effective data size in each packet may be lower than 90 bytes in this link-layer technology [29]. In such way, it is natural to expect transmission of packets with maximum size to achieve minimal packet overhead. Thus, we consider that every data packet has the same size in bits, k, corresponding to the entire packet, since all transmitted bits should be considered when estimating energy consumption.
Over the considered visual sensor network will be transmitted I images of the same size, where each image i, i = 1, …, i = I, sizes B(i) bits. If the packet header regarding all employed protocols sizes x bits, x < k, the maximum effective payload size for every transmitted packet is (kx) bits. As B(i) >> (kx) in most cases, the original image i will be fragmented, and a fragmentation header with f bits containing information for the decoding at the receiver side (at least the image id and the fragment offset) will be added to every transmitted packet. Moreover, an image i may have an image header, with o(i) bits, providing information as the width and height of the image and the number of bits used to represent a pixel. Thus, an original image i will be packetized in (B(i) + o(i))/(kxf) packets, with packets carrying data information to their maximum payload excepting the last one, which may be carrying less data than its capacity. We define W(p,i) as the number of packets sizing k bits to be transmitted in path p, resulting from the packetization of image i. The last packet has kl(p,i) as the payload size, klpi < (kxf ). If we define the maximum packet payload as y, y = (kxf ), we achieve the values for W(p,i) and kl(p,i) as expressed in Equation (1).
Jsan 02 00424 i001
Regarding that it is likely that all intermediate nodes of a path p are homogeneous (excepting the source and the sink), we will assume that all nodes have same hardware characteristics and energy consumption patterns. We can define D(p,i,h) as the total amount of bits to be transmitted for image i from hop h to the hop (h + 1) in path p, as presented in Equation (2). Due to packet loss and retransmission procedures, D(p,i,h) may be different than W(p,i).k for h > 0 and kl(p,i) = 0, but we are assuming a lossless communication scenario.
Jsan 02 00424 i002
The energy consumption is directly related with the transmission power of sensor nodes, Pwt(p,h), the power for packet reception, Pwr(p,h), and the time for transmission of one bit, tx(p,h) [30,31]. We define Et(p,h) as the energy consumption in joules for packet transmission from hop h to hop (h + 1) in path p and Er(p,h) as the energy consumption for packet reception in hop h in the same path. The formulation in Equation (3) presents the energy consumption in each hop.
Jsan 02 00424 i003
The values for Pwt(p,h) and Pwr(p,h) can be easily computed in conventional sensor motes since most of them are powered by two AA batteries (3.3 V) and the energy consumed to transmit each bit is a known characteristic depending on the desired transmission range. For example, the MICAz mote draws 17.4 mA when the transmission power is 0 dBm (57.42 mW), and 14 mA for the transmission power of −5 dBm (46.2 mW). The value for tx(p,h) is also known depending on the packet transmission rate: for IEEE 802.15.4 sensors equipped with the CC24200 chipset, tx(p,h) = 4 μs for the transmission of a single bit [32].
In wireless communications, the radio of the sensor nodes will have to switch between at least the transmission and reception modes. In duty-cycle protocols, the radio may also be in the sleep mode. We simplified considering that the radio may be only in transmission or reception mode at each moment and for each packet transmission or reception it is required a mode switch operation. Our resulted energy consumption model in Equation (4) assumes Pws(p,h) as the power for mode switching and ts(p,h) as the time required for a switching operation (typically much lower than 0.1 ms).
Jsan 02 00424 i004
As most energy consumption is expected in transmission and reception procedures instead of processing and storage [7,8,33], we can roughly state the total energy consumption in path p as expressed in Equation (5). The total consumed energy is the sum of the energy consumption in transmission and reception in all intermediate nodes (h = 1,…,H(p)), plus the energy for transmissions from the source node (h = 0) and reception of data packets at the sink (h = H(p) + 1).
Jsan 02 00424 i005
The basic formulation in Equation (5) could be even more extended to incorporate the energy costs for transmission and reception of 1-hop ACK messages. Moreover, the average packet error rates and retransmissions could also be accounted, as expressed in [7,24]. A useful approach to estimate the average number of retransmissions is to incorporate a Gilbert/Elliot error model [34], as expressed in [7]. In that model, the error probability is a function of the size of the packets. Although such additional elements can improve the presented energy consumption model, the basic idea that more energy is expected to be consumed when more packets have to be relayed through more intermediate nodes will not change. Analyzing the presented formulation, we can then conclude that energy savings may be achieved when some packet relaying operations are avoided, reducing the value for D(p,i,h) over segments of the network.
Energy consumption in sensors depends mostly on the time wireless radio is turned on. Thereby, idle listening and sleeping time have a major role when estimating the energy consumption. In such way, analyses of the expected energy saving must consider a more realistic model, as provided by discrete event simulators. Section 5 presents simulation results for the energy consumption when employing the proposed relaying mechanism, considering a realistic duty-cycle MAC protocol.

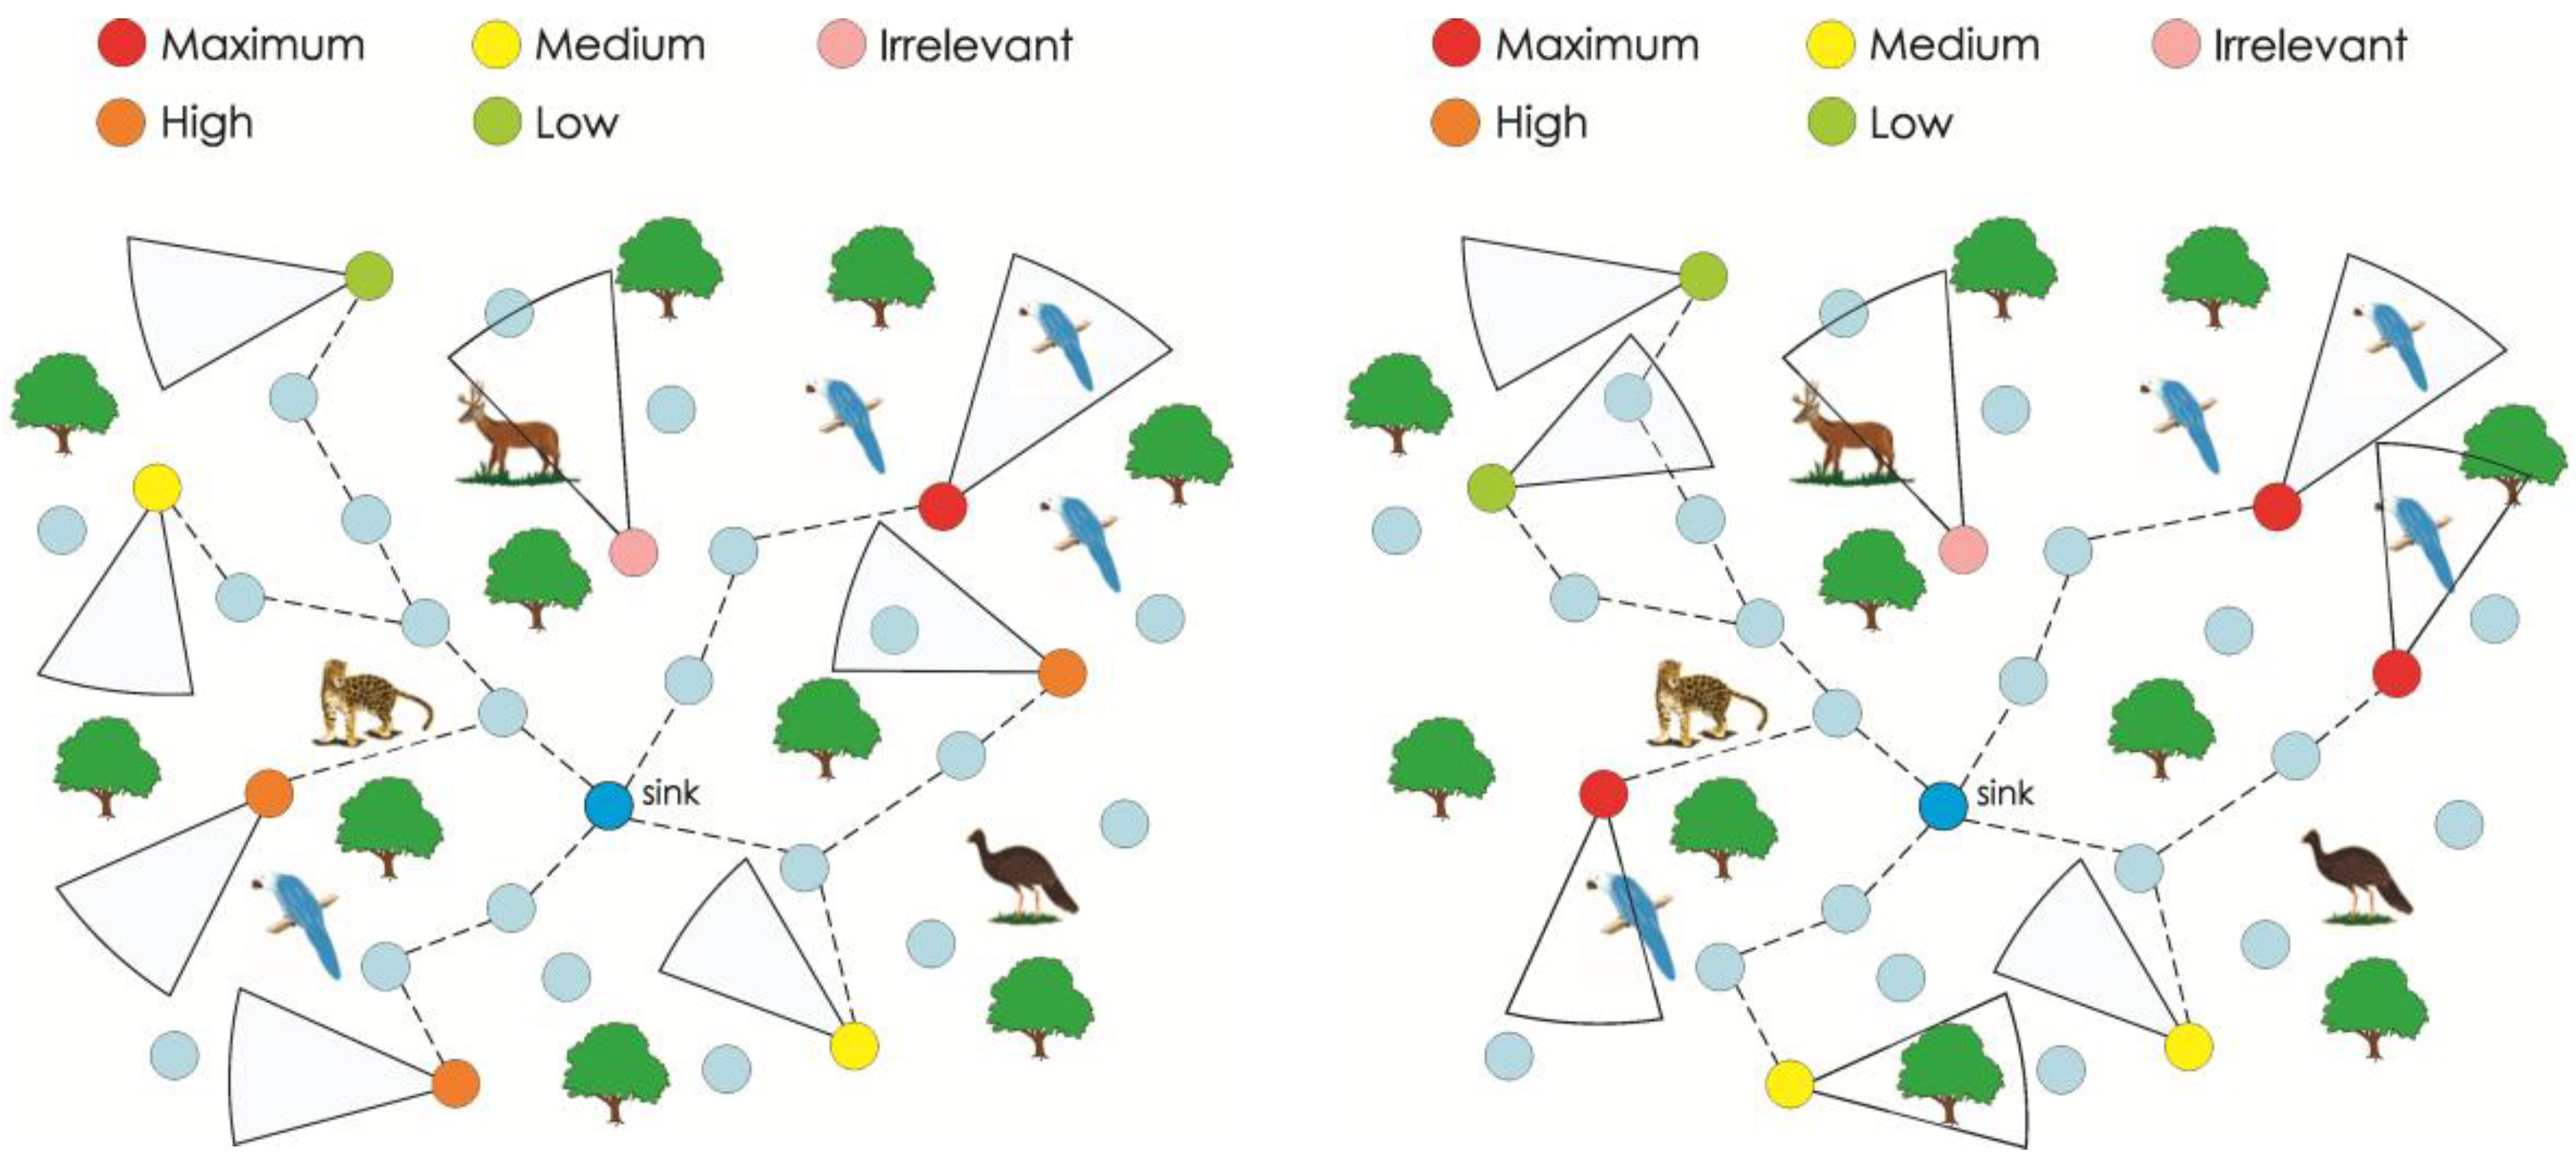
3.2. Sensing Relevance

For many applications, quality of the deployed visual sensor network will be a function of how well an area of interest is viewed by source nodes. And such quality depends on the actual application requirements, which dictate what, when and with which constraints a set of static or moving targets must be monitored by the deployed camera-enabled sensors. This is an innovative concept aimed at the quality of viewing of the visual sensor network, directly related with the concept of Quality of Experience (QoE) [35]. In fact, many works in the literature have been concerned with sensing coverage, connectivity and energy preservation [5,22], but such issues have been treated in a generic way, with small or absent concern on the application requirements in terms of the actual targets that need to be monitored by deployed sensors.
In many cases, source nodes may have different relevancies for a particular application, and such notion of relevance is more evident when source nodes follow a directional sensing model as in visual sensor networks. In fact, neighbor nodes in scalar wireless sensor networks tend to collect similar information, but that is not necessarily true for neighbor camera-enabled source nodes [5]. This particularity makes the sensing relevance an inner characteristic of visual sensors that is directed related with the applications monitoring requirements, whatever are their current positions. Thus, at a given time, source nodes with different relevancies for the application may be transmitting packets with encoded visual information, and such relevancies may be exploited to optimize the network operation [13]. Among the optimization strategies, the sensing relevancies may be used to prioritize data packets, granting higher relevance to packets transmitted from more relevant visual sensors. As energy is a major optimization issue, low relevant packets may be discarded to save energy, enhancing the performance of the network but still assuring that high relevant packets will (probably) reach the sink. We presented a broad discussion of sensing relevance in visual sensor networks and practical exploitation of such concept in [13].
The sensing relevance of each source node s is defined as a 4-bit numeric value, referred as the Sensing Relevance index (SR(s)) [13]. The sensing relevancies and, more precisely, the values of SR(s) are assigned to each source node according to two groups of information: the significance of the retrieved visual data for the application and the available monitoring resources in the considered source node. The significance of the retrieved visual data is used to classify each source node in a Group of Relevance (GR), where the final value of SR(s) is computed using GR and information about the available monitoring resources. The groups of relevance are described in Table 1.
Considering the assigned GR, each source node s computes a final value for SR(s). For such computation, some parameters as residual energy, visual resolution and zooming capabilities can be accounted, computing a final value for SR(s) between 0 and 15. As presumed, the sensing relevance is a subjective concept that cannot be automatically computed only based on the network topology, requiring identification of the groups of relevance for each source node. Automatic and manual approaches to identify groups of relevance are described in [13], but we summarized the main computing approaches in Table 2.
Table 1. Groups of relevance and the associated Sensing Relevance index (SR).
Group of RelevanceSR(s)Description
Irrelevant0When the source node has no relevance for the application.
Source sensors should turn off their camera’s hardware,
acting only as relay nodes.
Low relevance1–4Source sensors are transmitting complementary visual
information with low impact to the application monitoring quality.
Medium relevance5–10This is the initial relevance group, when source nodes are turned on.
The transmitted information is relevant, but some quality
loss can be accepted.
High relevance11–14Some sensors will have higher relevance for the application,
requiring prioritized treating in packet processing, congestion
control, error recovery and multipath selection algorithms.
Maximum relevance15This is the highest level of relevance that should be attributed
to a very small group of source sensors, if any. Monitoring quality is highly dependent on visual data transmitted by these source nodes.
Table 2. Some approaches for computation of the groups of relevance.
ApproachAdvantages Drawbacks
ManualDeterministic establishment of the groups of relevance. Source nodes are assigned to a GR before deployment.No computational costs.Source nodes are statically assigned to a group of relevance.Useful only for deterministic deployment. May not adapt to changes in the network topology and in the targets positions.
Visual identification of the groups of relevance by a human operator.Sensing relevancies of source nodes strongly reflect the application requirements. Minimal computational costs.Requires a human operator to interpret the visual information retrieved from the monitored field.Subject to unconscious psychological factors [35].
AutomaticComputer vision algorithms are employed to identify the targets viewed by source nodes. The GR is indirectly established according to the relevance of the targets.Automatic establishment of sensing relevancies very close to the application requirements.High computational cost. Depends on the nature of the targets and the monitored field.
Mathematical analyses and localization algorithms are used to identify areas of interest. The GR is established if source nodes view the defined area.Groups of relevance may be established for regions.Provides a very acceptable solution, with low cost.Depends on camera-enabled node localization algorithms.More suitable for scene/area monitoring [5].
The sensing relevance is a global QoS parameter. Source nodes are classified in groups of relevance, which are indeed computed by the sink (or some element at the sink side), which has a global view of the network. In other works, the SR of each camera-enabled sensor has significance for the entire network, since it is computed based on the monitoring requirements of applications. Moreover, it is easier to compute and implement, requiring only an specialized application-layer protocol to allow the proper communication between source nodes and the sink, as the one proposed in [13].
Figure 1 presents a practical example of how the sensing relevancies of source nodes may be established according to application monitoring requirements. Two representations of the exactly same forest are showed, where the figures of animals indicate the places where they are more likely to appear. The field of view of source nodes is represented by a pyramidal area. In each of the presented monitoring scenarios, a VSN is deployed for monitoring of blue macaws. The sources nodes will be associated to a group of relevance according to the viewing probability of blue macaws, and source nodes that cover areas where blue macaws have never been seen before are assigned to the irrelevant group of relevance. Note that the GR could be computed using a determinist approach (if we already knew the monitored field and the behaviors of the blue macaws), using human operators to visually classify the retrieved visual information, processing a set of images in a period of time to find visual patterns and then determine the relevance of visual sensors (statistic relevance) or identifying regions of interest.
Figure 1. Different relevancies according to the application requirements and cameras’ poses.
Jsan 02 00424 g001
Considering that the deployed visual sensor network should monitor blue macaws, source nodes that can entirely view them are assigned to the maximum group of relevance. If the remaining source nodes are monitoring other kind of animals, they will have lower sensing relevancies. In fact, all information is relevant for the application, but with different priorities (blue macaws may appear in regions with low probability).
We are mainly concerned in this work in how the sensing relevancies of source nodes can be exploited to save energy over the network with the lowest impact on applications monitoring quality. Thus, we assume herewith that camera-enabled source nodes are already assigned to a group of relevance and that those nodes can compute a final SR. Moreover, we also assume that the corresponding SR is included in the packets’ headers of every transmitted data packet. Adding this additional information to every transmitted packet has low impact to the energy consumption of the network, as investigated in [7].

4. Proposed Energy-Efficient Relaying Mechanism

In multihop wireless sensor networks, packets are transmitted from sources to the sink following the ad hoc communication paradigm. Intermediate nodes are deployed to relay packets in a hop-by-hop fashion, especially due to the expected limited communication range imposed by the employed wireless radio hardware, the energy constraints of the nodes and the characteristics of physical and MAC protocols. Incoming uncorrupted packets will be typically inserted into a FIFO queue and processed for relaying purposes by different protocol layers or following a cross-layer approach. Commonly, intermediate nodes will employ the same techniques for every incoming packet.
We propose an energy-efficient packet relaying mechanism, where intermediate nodes relay packets according to their current energy resources and the packets’ priorities. The proposed mechanism is composed of two different approaches, according to the use of DWT coding as a local QoS parameter.

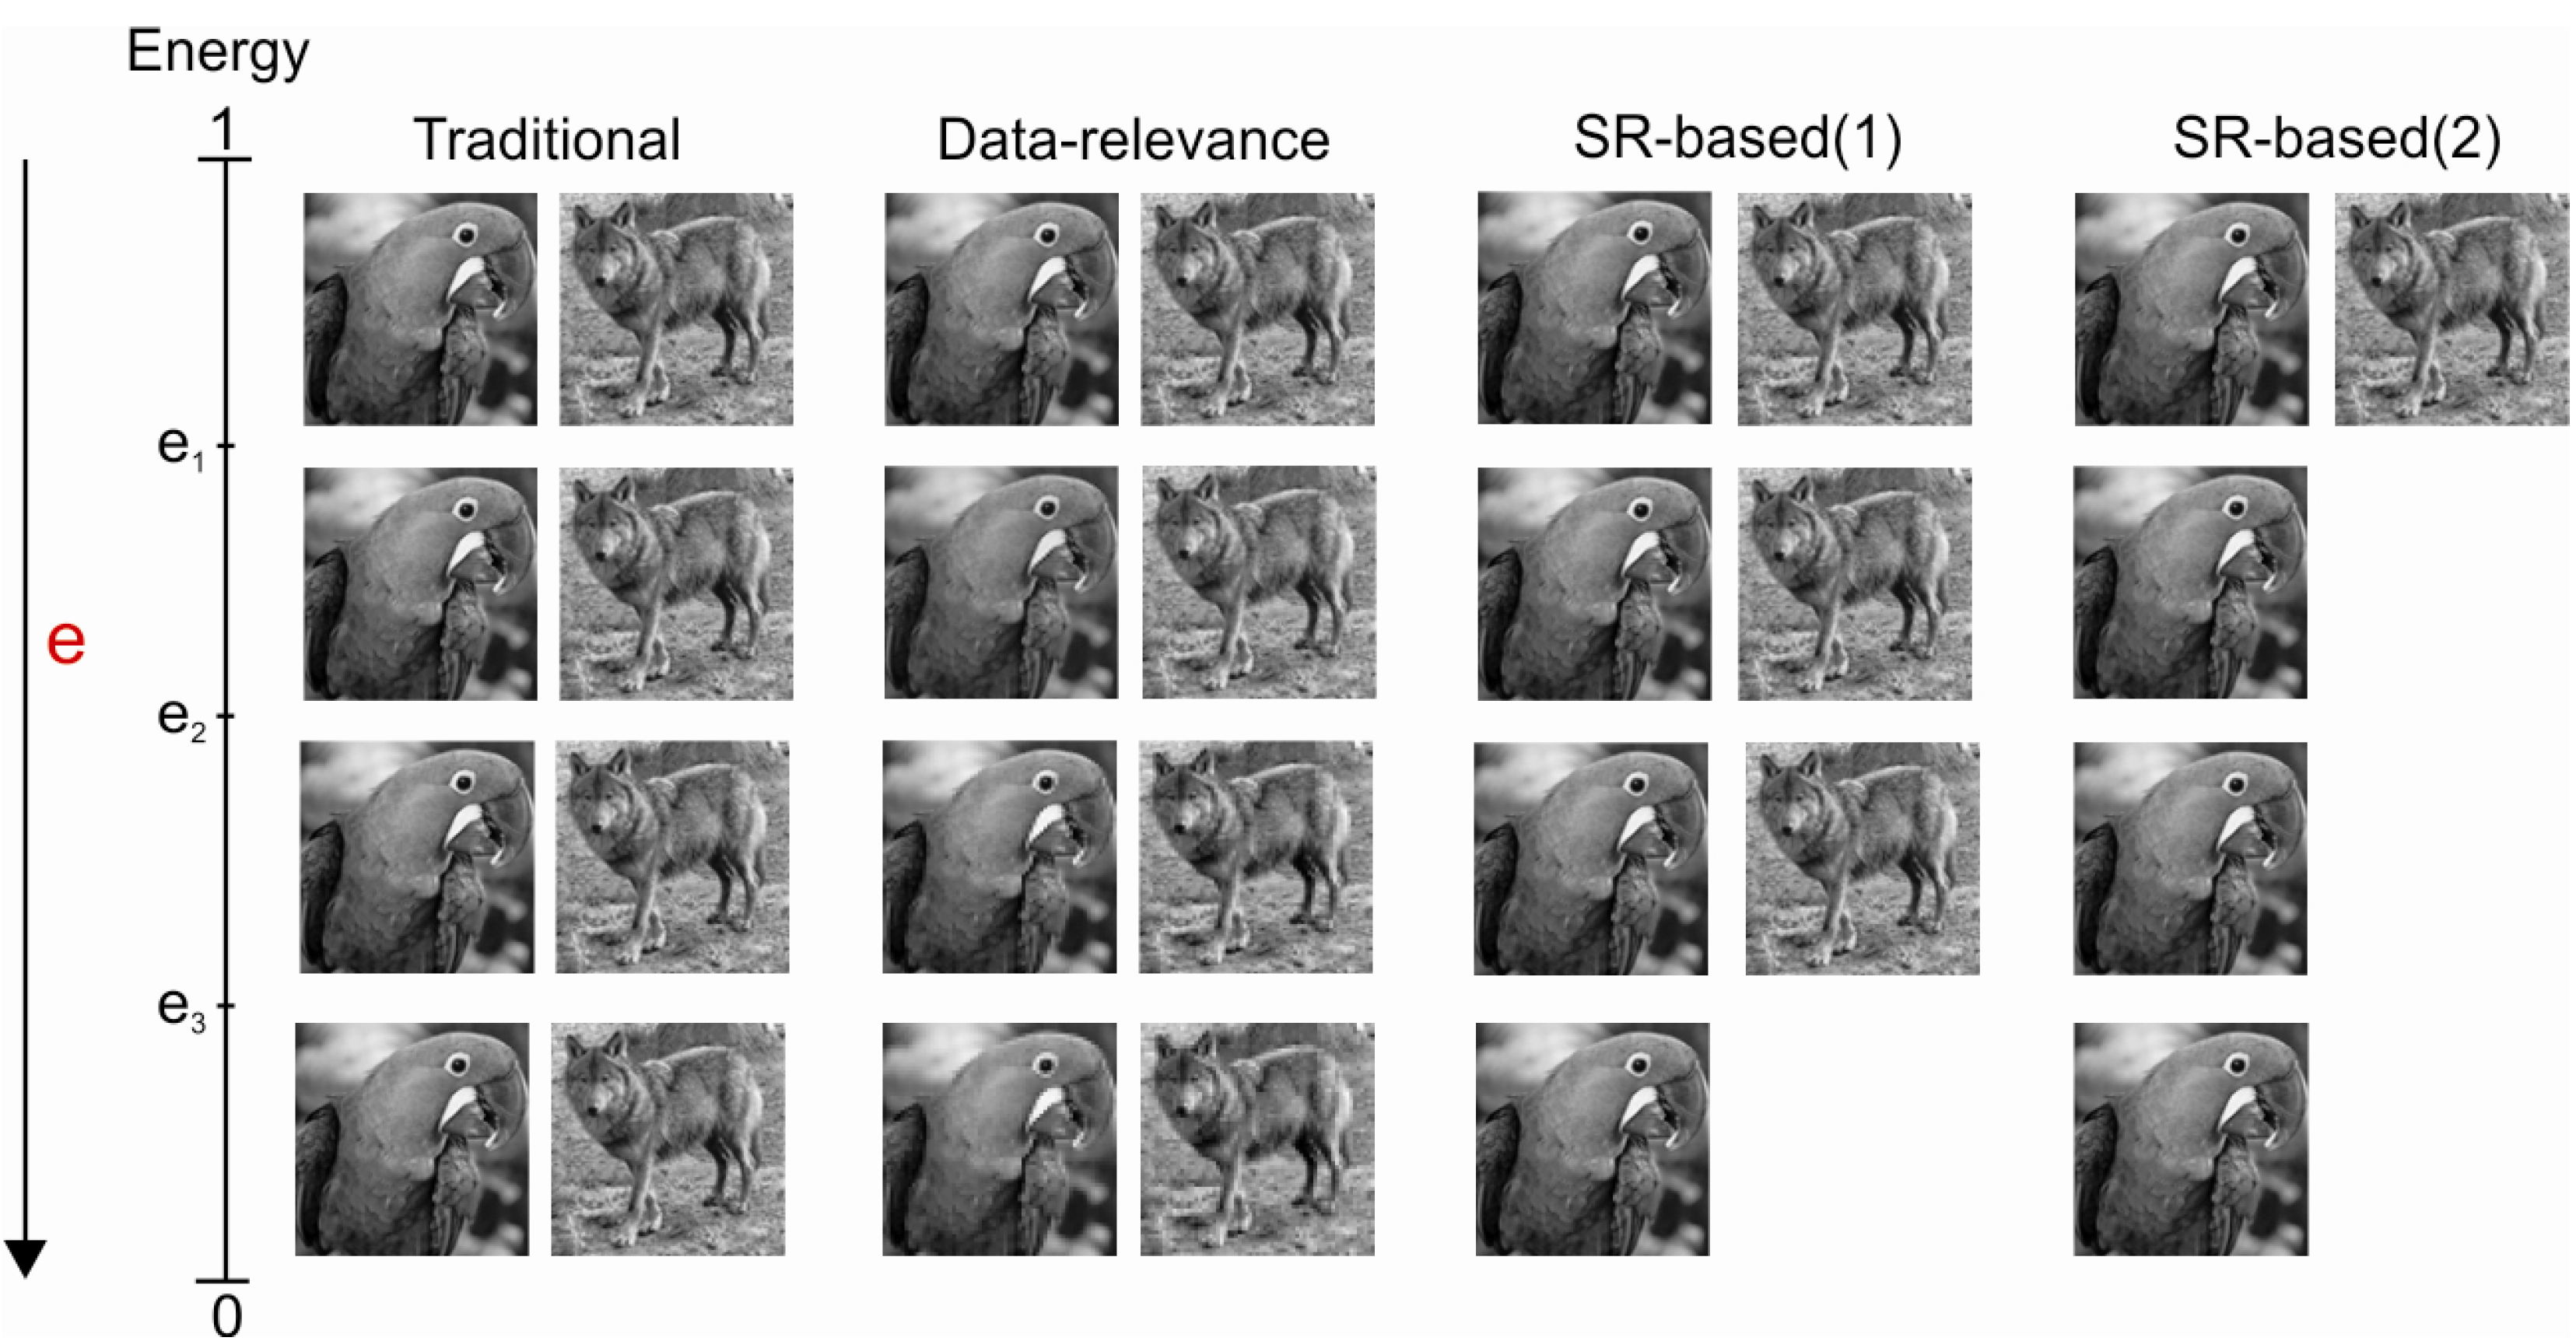
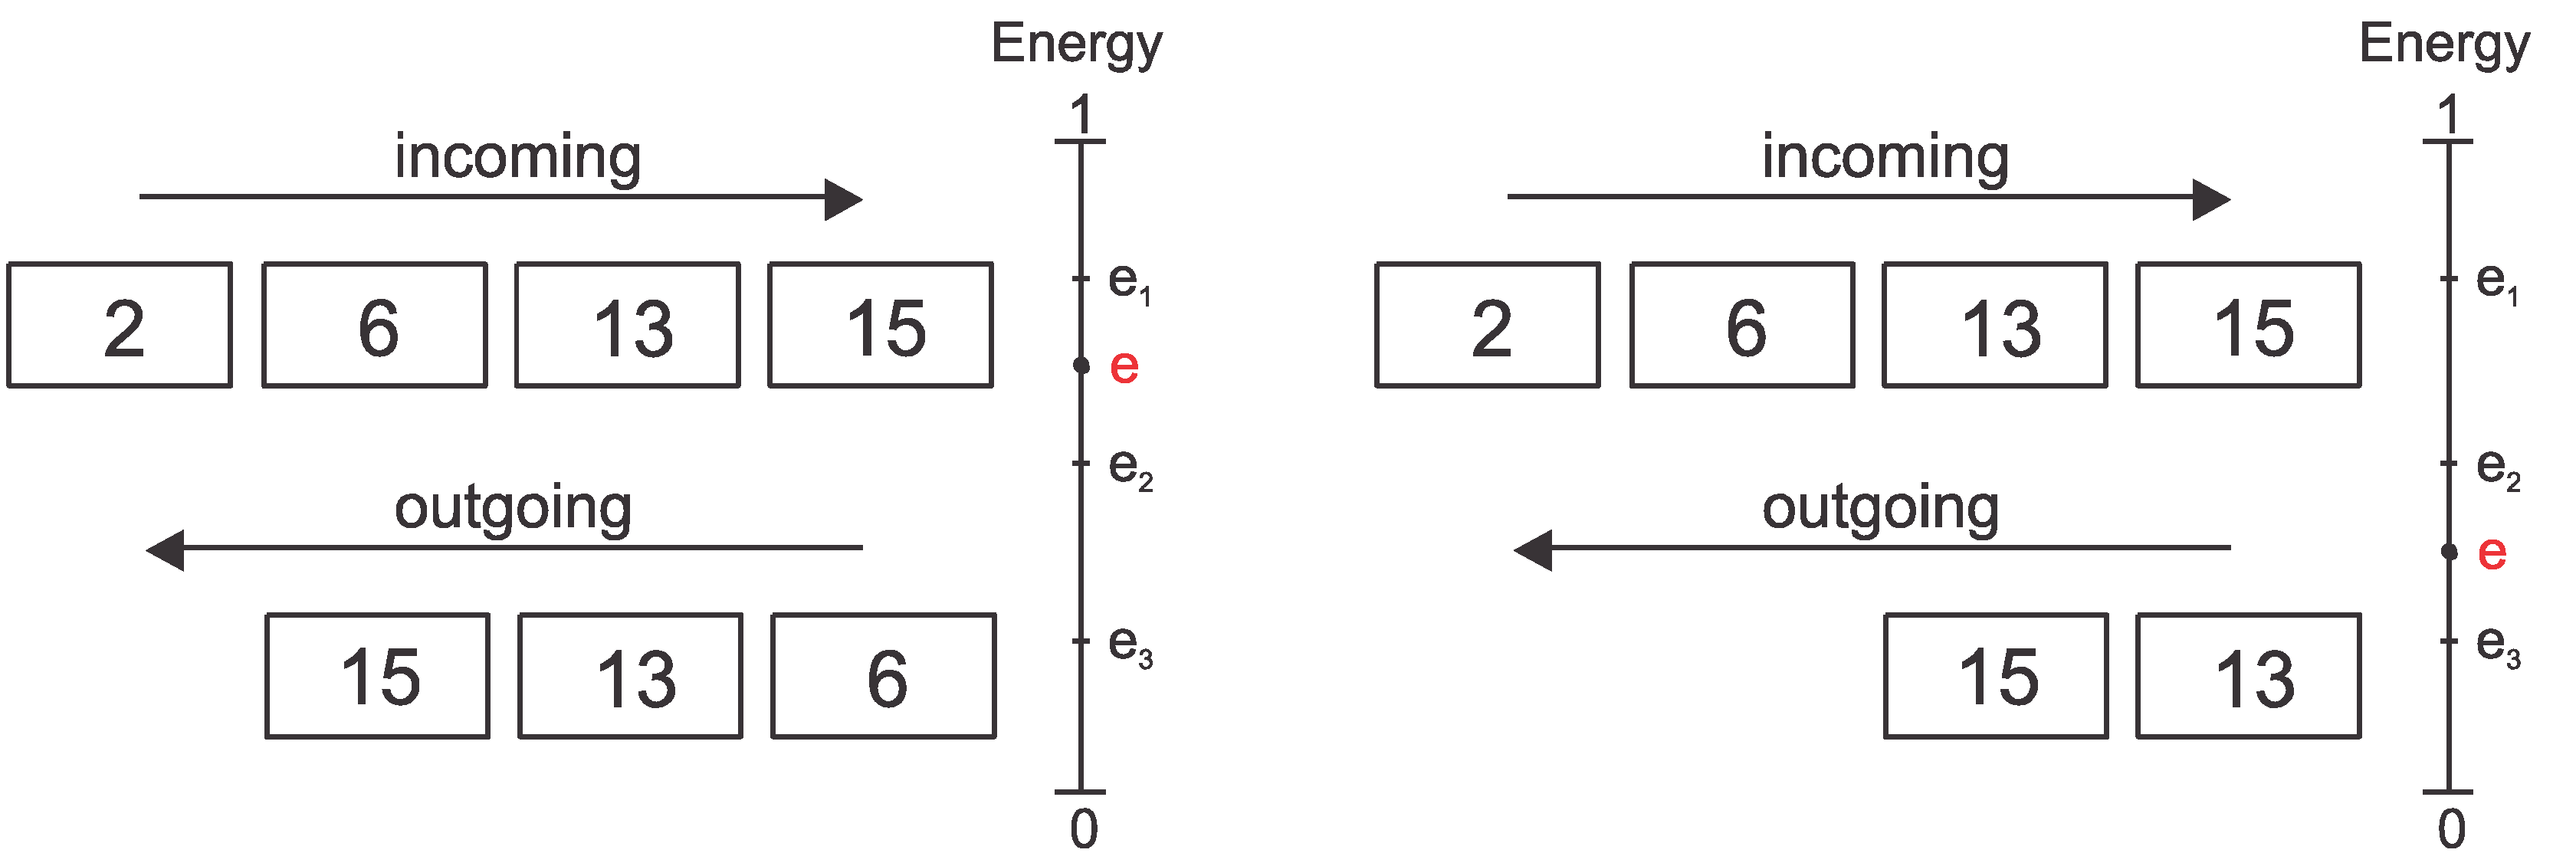
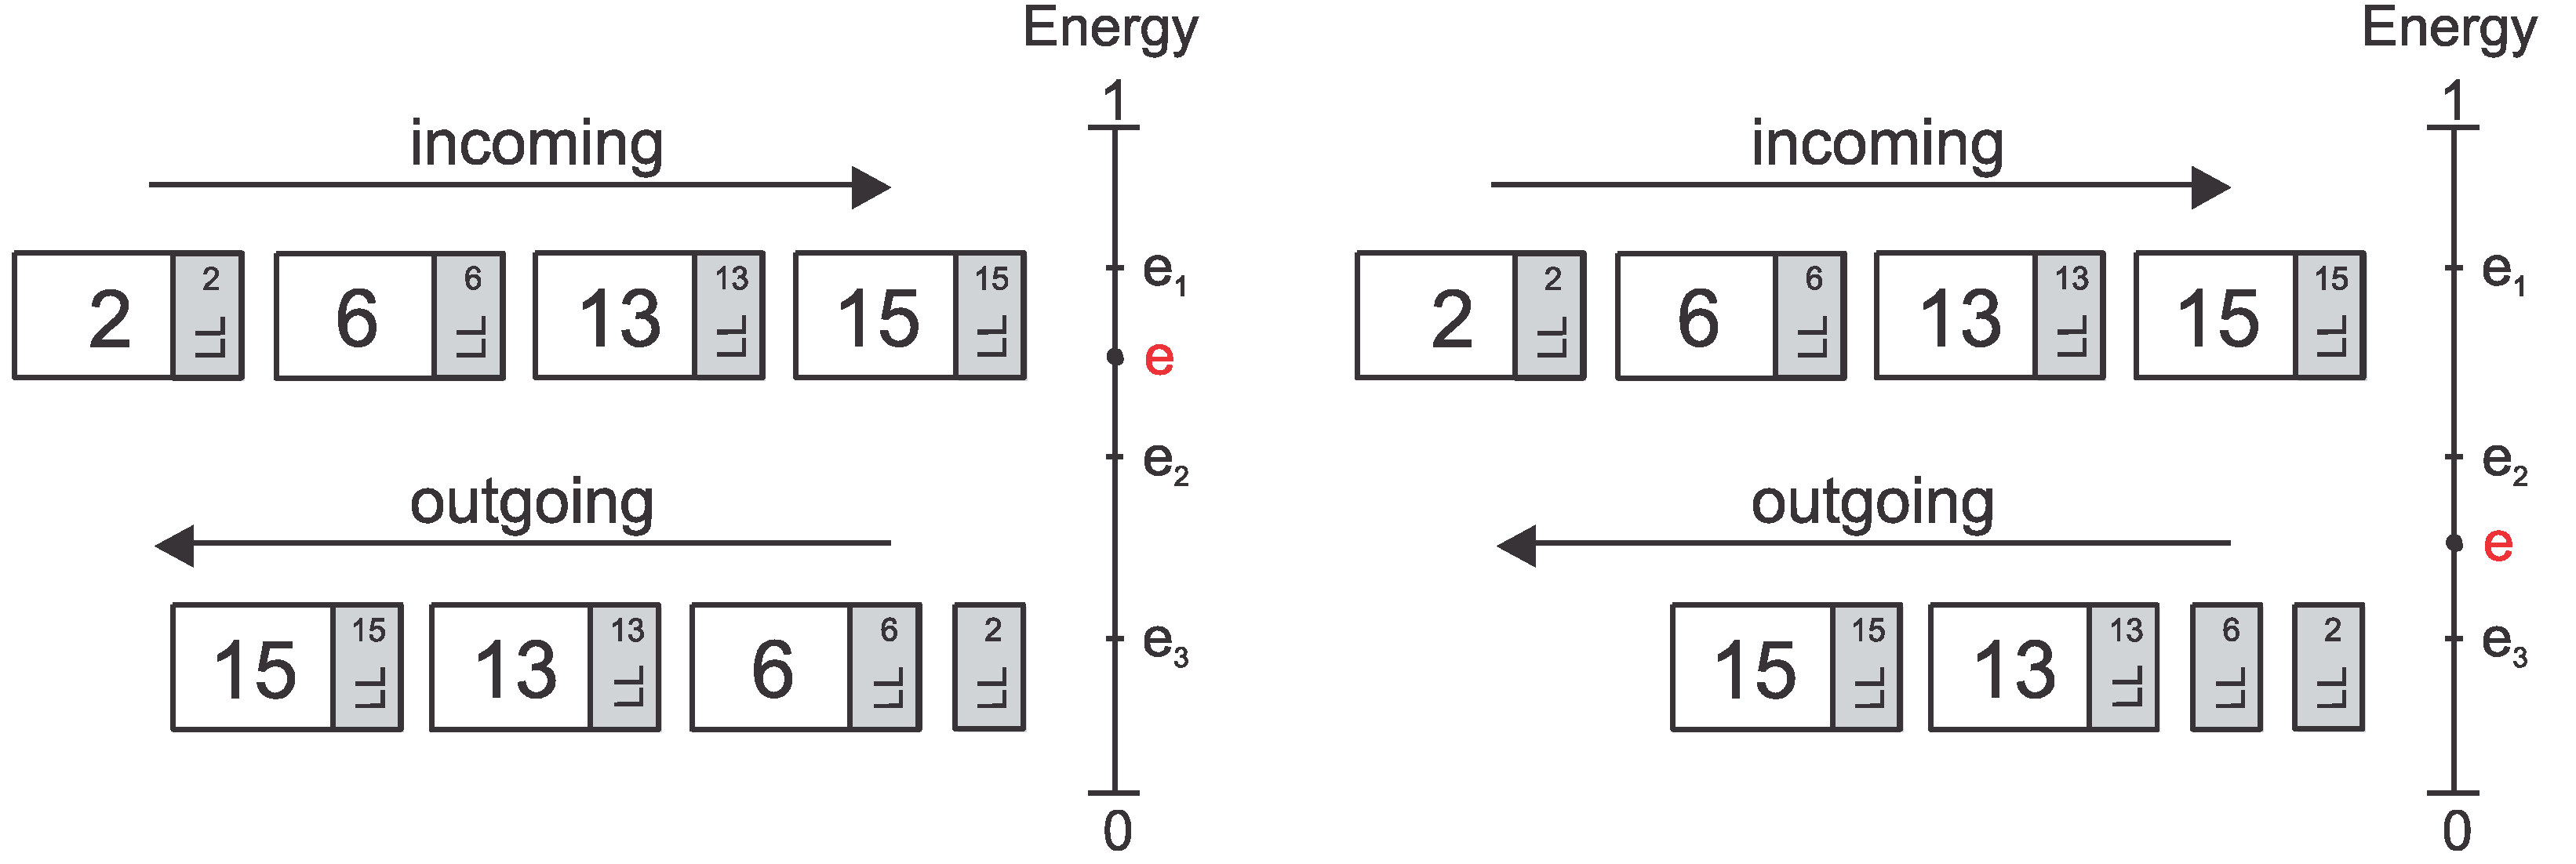
4.1. SR-Based Packet Relaying

After deployment and initial configuration of a particular wireless image sensor network, packets carrying visual data retrieved from the monitored field will be transmitted from source nodes to the sink through the multihop ad hoc structure created by the intermediate nodes. We assume that in the initial configuration each source node will compute a SR(s) and that each transmitted data packet will include the SR(s) of the transmitting source s in its header, as expressed before.
In usual transmission, each packet may be acknowledged by a 1-hop ACK message during the multihop communication. When a packet is successfully received and acknowledged by an intermediate node, it is typically forwarded to the next hop in the path toward the sink. When employing the proposed relaying mechanisms, packets may be silently dropped in order to save energy in the relaying node and throughout the remaining path. Although monitoring quality may be somehow negatively impacted, dropping packets at intermediate nodes may turn the network active for a longer time.
We propose a threshold-based dropping scheme where the current energy level of the relaying nodes (referred as e) indicates which packets can flow over the network. The SR(s) included in each data packet defines the packet’s priority, which is checked by relaying nodes when deciding if packets will be forwarded or silently dropped. Adopting energy thresholds and a SR-based dropping scheme creates an adaptive behavior of the network, potentially enlarging the network lifetime.
Table 3. Energy thresholds for the SR-based relaying approach.
Energy LevelPackets that MUST be relayed to the next hop
Group of RelevanceSR
ee1 All packets1–15
e2 e < e1Medium, high and maximum relevance packets5–15
e3 ≤ e < e2High and maximum relevance packets11–15
e < e3Maximum relevance packets15
Three different energy thresholds are defined: e1, e2 and e3. Each energy threshold will be associated with one or more groups of relevance, indicating which packets must be forwarded to the next hop, as described in Table 3. When e is below one of the thresholds, only a subset of packets will be relayed, while the remaining packets are silently dropped. Considering that in the initial state of the network all intermediate nodes have a maximum energy level (e = 1) and that intermediate nodes become inoperative when they run out of energy (e = 0), we expect that 0 ≤ e3e2e1 ≤ 1.
All incoming packets will be forwarded to the next hop when ee1. Low relevance packets are the first to be dropped, since they will not be forwarded when e < e1. Following this transmission scheme, packets from the most relevant source nodes are the last to be discarded, increasing theirs probability of successfully reaching the sink. As application monitoring quality is directly related to the sensing relevancies of the nodes, the proposed relaying mechanism is expected to have a reduced impact on the monitoring quality when compared with optimization algorithms based only on the relevancies of packets’ payloads, as in [9].
Figure 2 shows two examples of packet relaying following the proposed approach. Consider that each square represents a data packet from a source node s with SR(s) as represented by the indicated number. The energy thresholds and the current energy level of a hypothetical intermediate node are graphically presented in a vertical bar graduated from 0 to 1. Based on the current energy level and the values of e1, e2 and e3, only a subset of data packets is allowed to be relayed to the next hop.
Figure 2. Threshold-based packet relaying regarding the sensing relevancies of source nodes.
Jsan 02 00424 g002
It must be noticed that each intermediate node takes the decision of relaying or dropping based only on its residual energy, in an open-loop manner. In such way, intermediate nodes do not need to know the energy status of other nodes, avoiding the transmission of feedback messages. As intermediate “hub” nodes (which belong to more than one active path) in braided paths are crucial for network transmissions flows [36], the proposed relaying approach should be implemented only by those nodes. Such decision is motivated by the fact that the entire network may become inoperative if hub nodes run out of energy. Therefore, employing the proposed optimization approach in only critical intermediate nodes turns open-loop processing a proper option.
As a final comment, there might be different approaches to establish the energy thresholds e1, e2 and e3. Besides configuration before deployment, the same SR assignment protocol presented in [13] could be employed to define the energy thresholds to be adopted by intermediate nodes, which would read this information while forwarding control packets between source nodes and the sink.

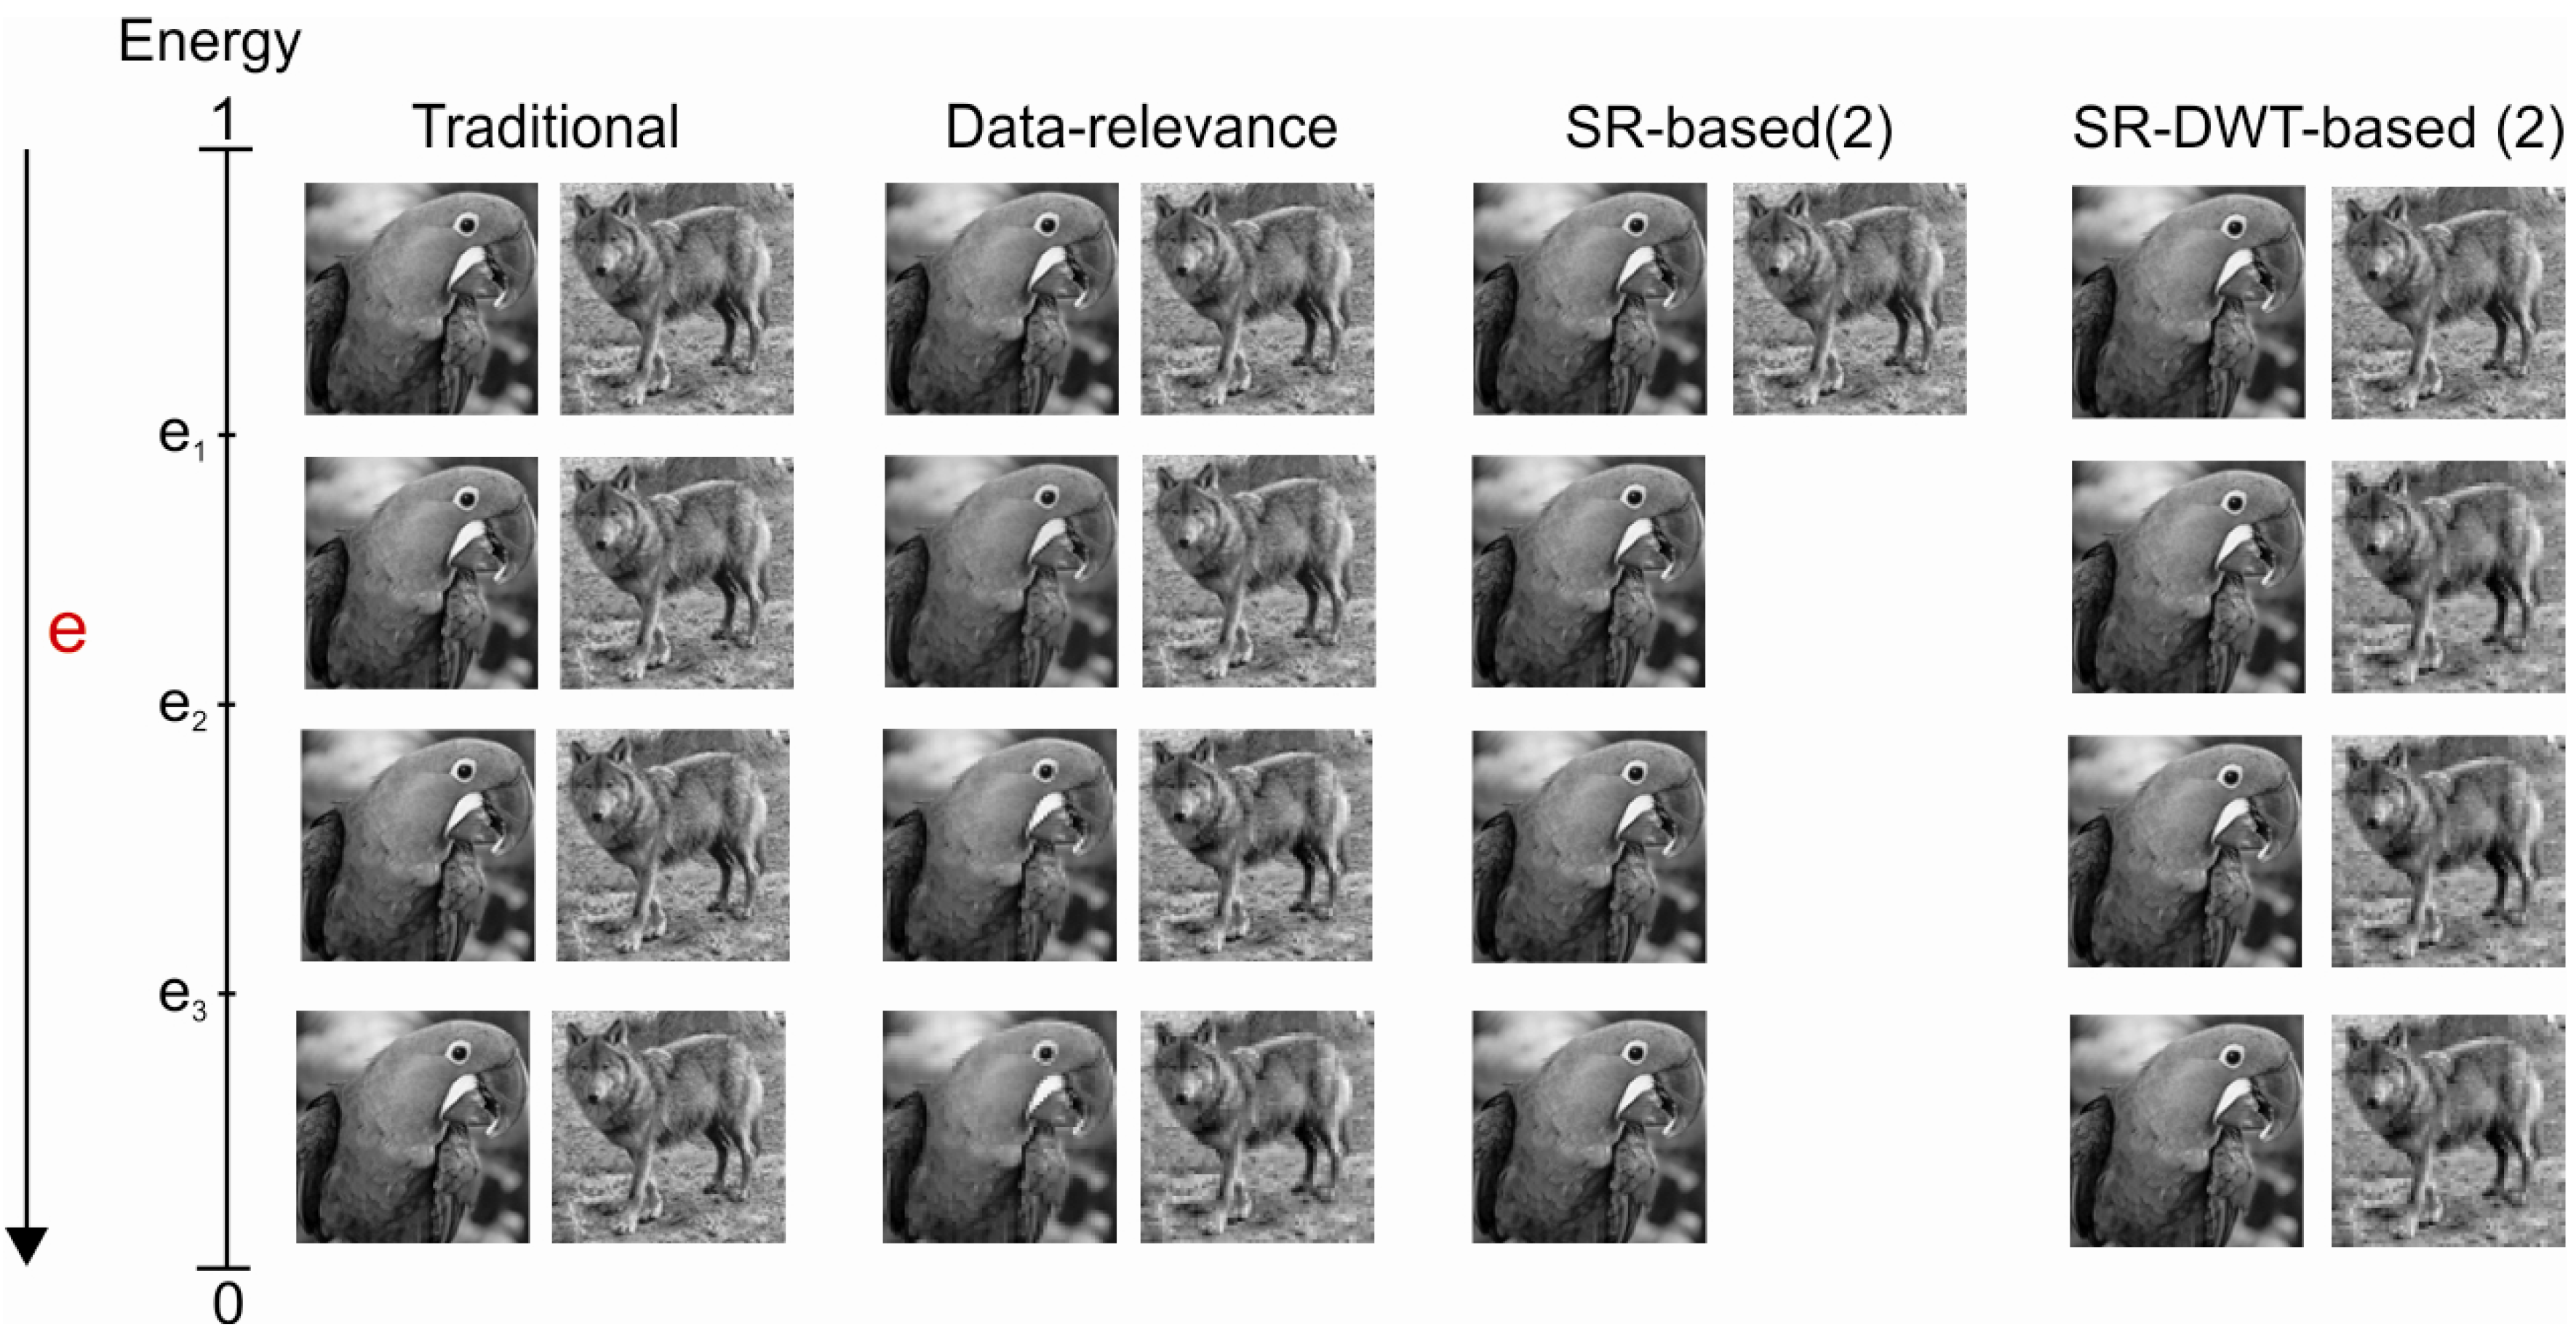
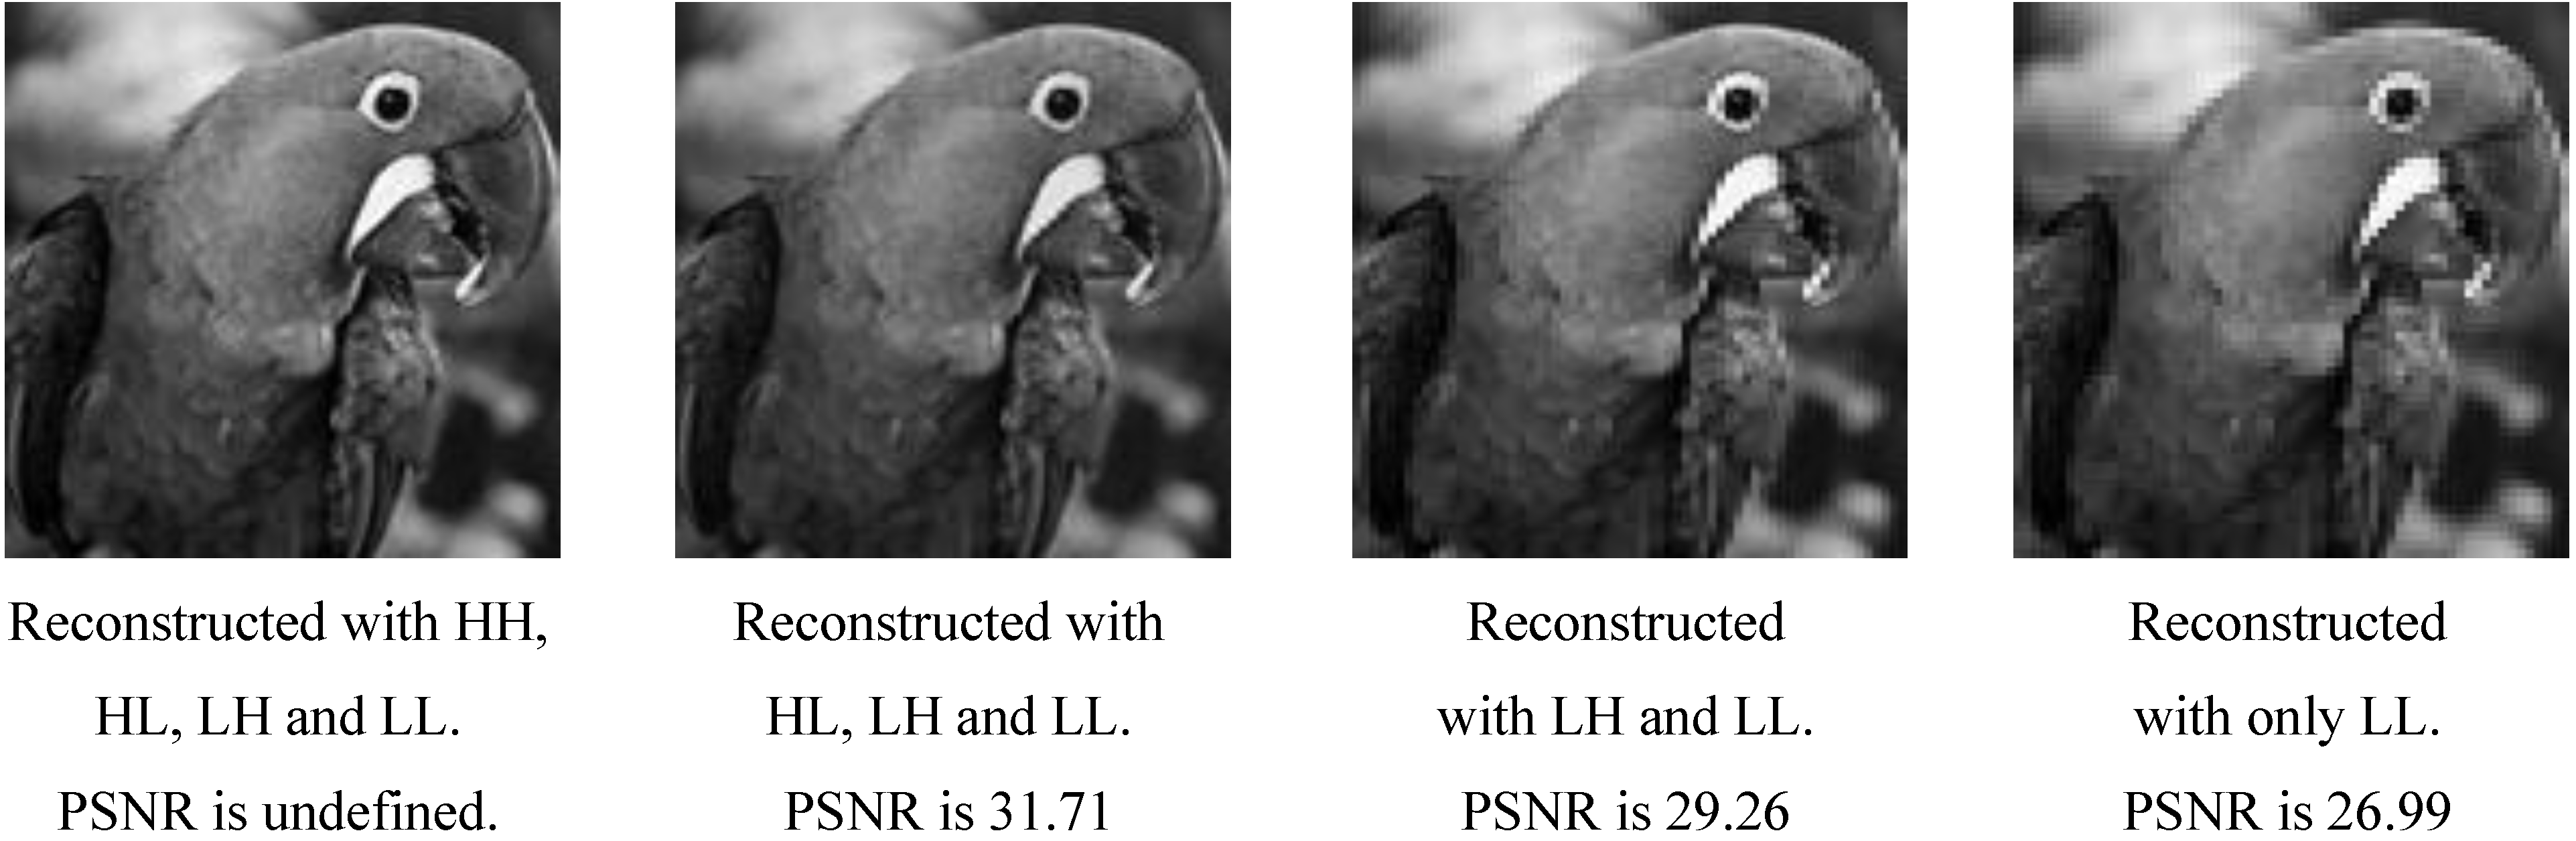
4.2. SR and DWT-Based Packet Relaying
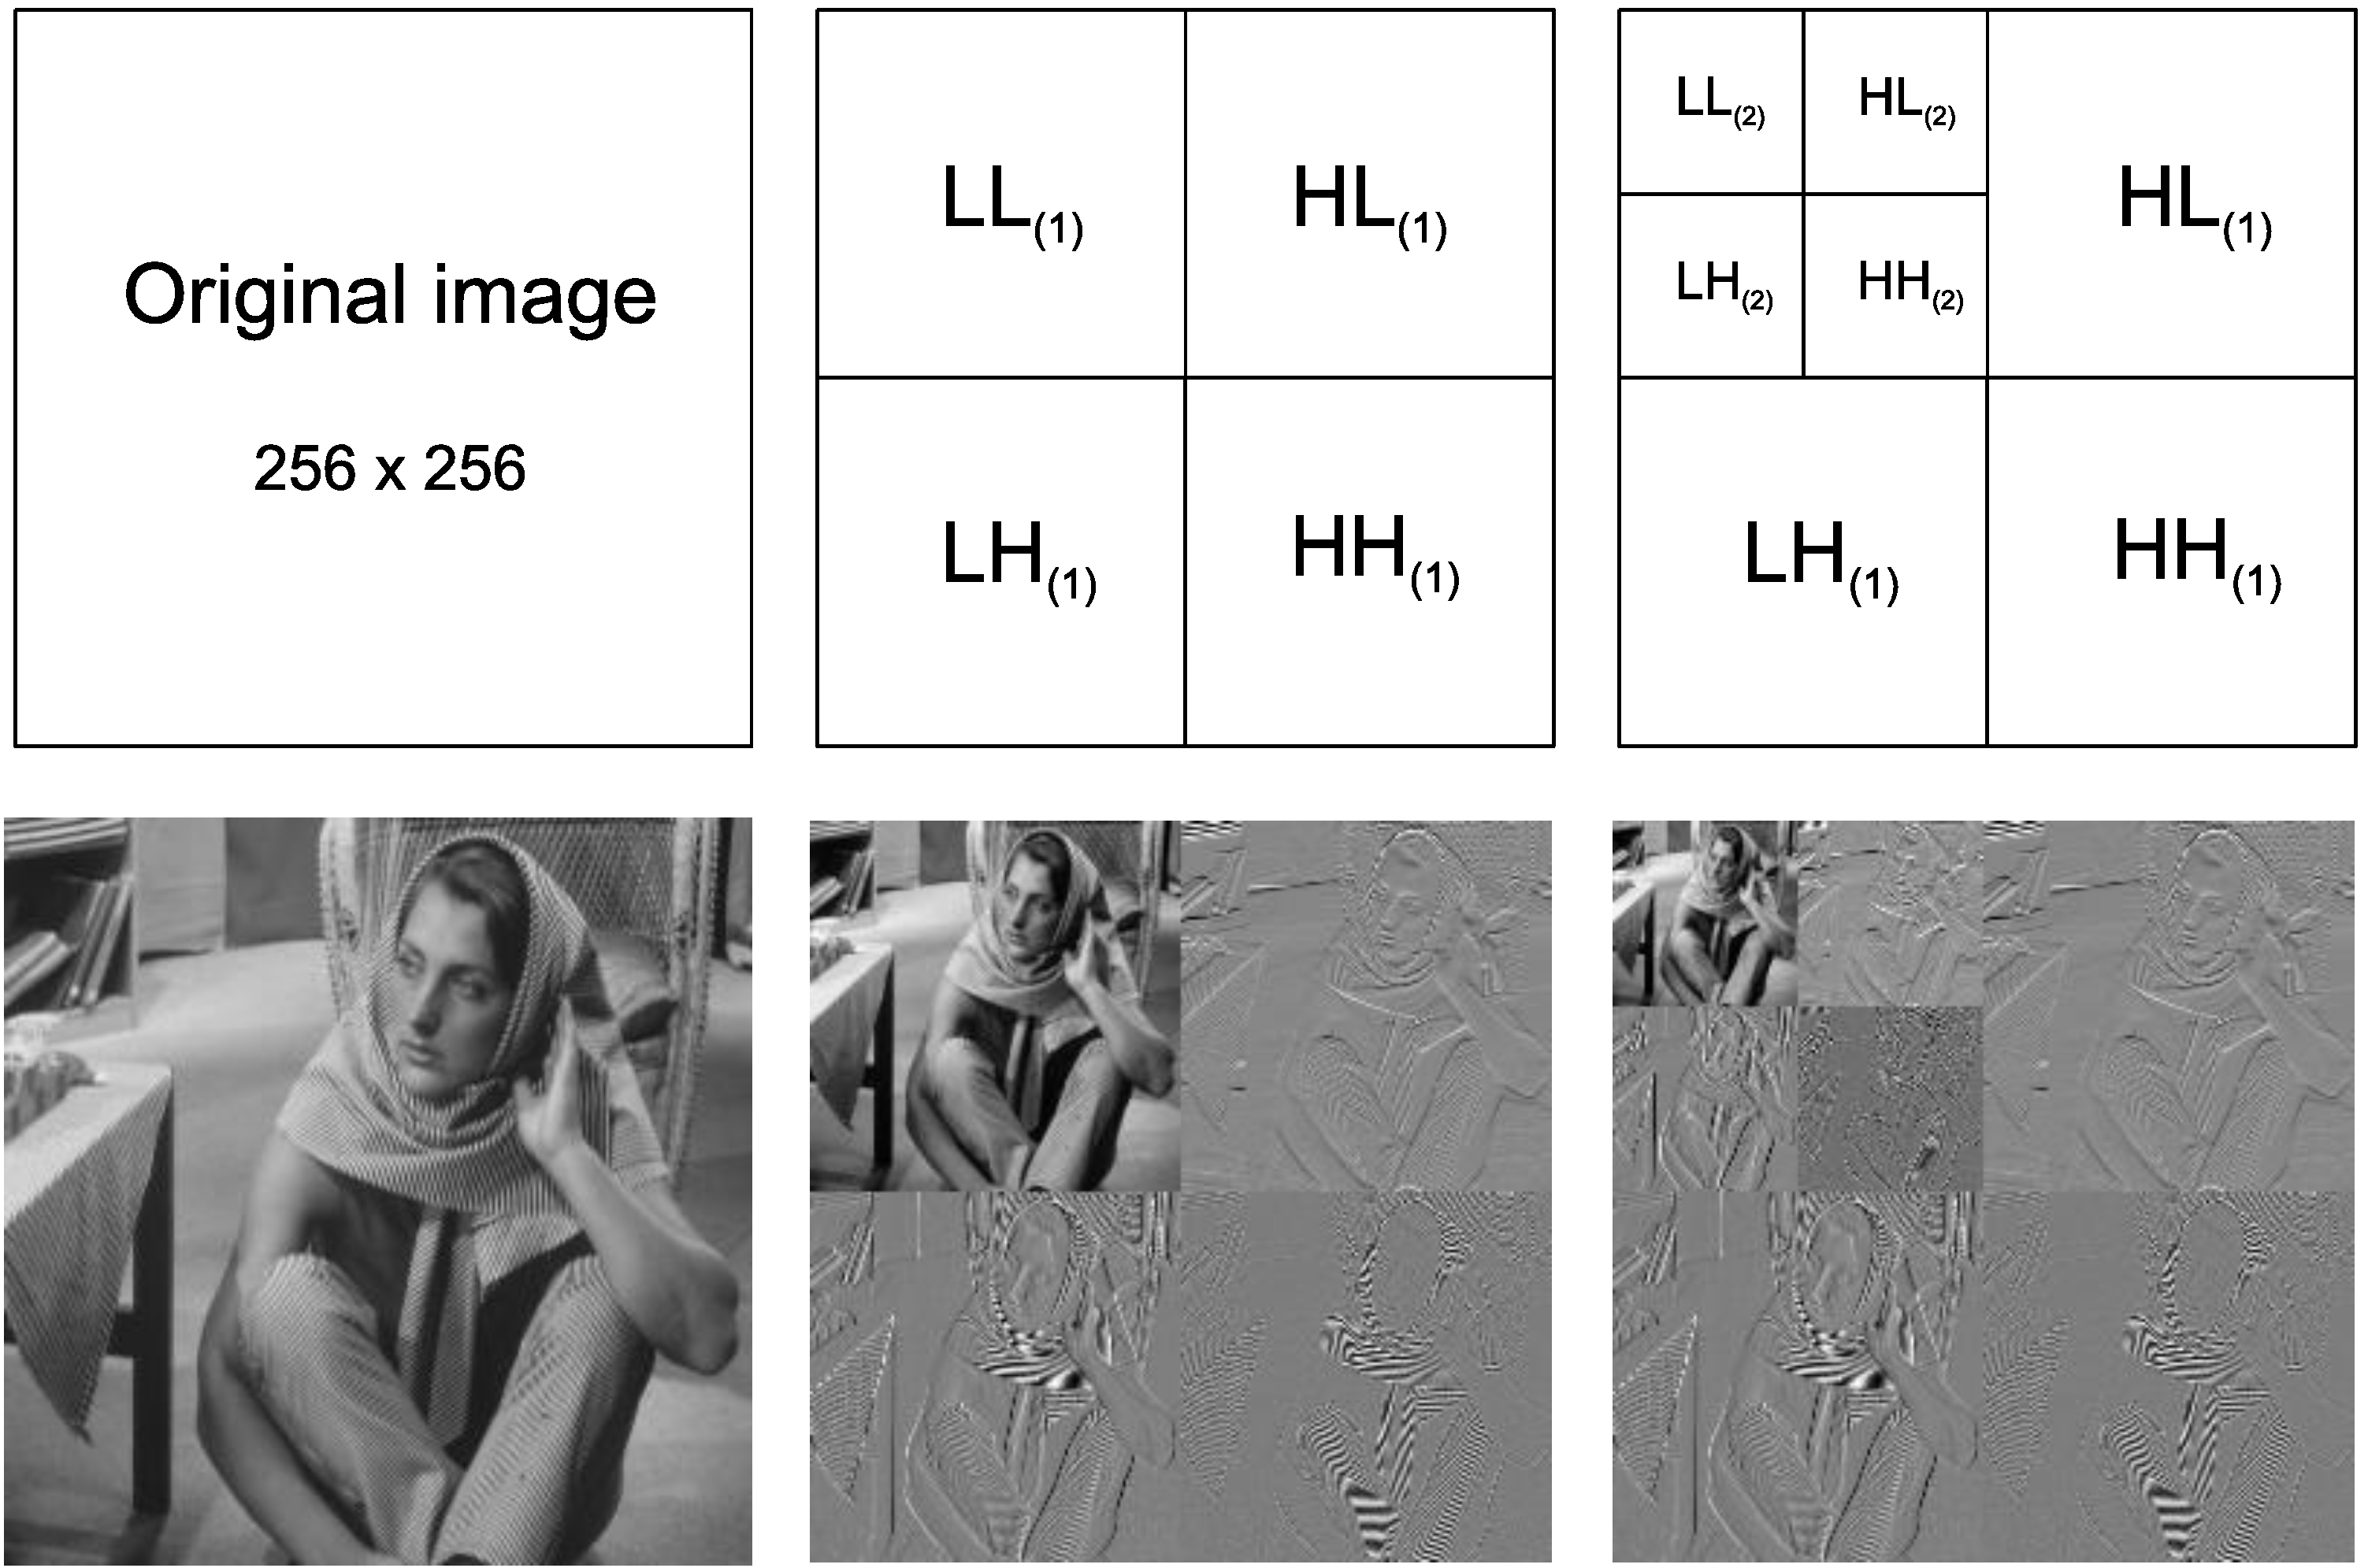
Besides exploitation of sensing relevancies for energy-efficient packet relaying, visual data payloads may be also considered when defining the packets’ priorities. We consider that camera-enabled source nodes are transmitting still images retrieved from the monitored field and that each image is processed by a 2D DWT before transmission.
Wavelet transforms provide data decomposition in multiple levels of resolution, where DWT is achieved discretely sampling the wavelets. DWT decomposes a signal by passing it through two filters: a lowpass filter L and a highpass filter H. Digital images are two-dimensional signals, usually represented as a matrix of pixels. A 1-level 2D DWT processes such signal considering rows and columns, generating four subbands: LL, LH, HL and HH. The LL subband represents the lowest resolution and a half-sized version of the original image. In fact, it is the most significant information for the decoding process, while the remaining subbands contains vertical, horizontal and diagonal details for the decoding process. Such processing produces two groups of relevance, but LL subband can be transformed again to generate more levels of resolution. Figure 3 presents an original image that is processed by a DWT applied once and twice, resulting in two and three levels of resolution, respectively from left to right.
Figure 3. Discrete Wavelet Transform (DWT) processing generating two and three levels of resolution.
Jsan 02 00424 g003
We propose a SR and DWT-based packet relaying approach, where data relevance is considered as a second level of packet’s priority. Images captured from the monitored field are encoded by a 1-level 2D DWT and transmitted (fragmented in many packets) to the sink of the network. When incoming data packets have to be forwarded to the next hop by a particular intermediate node that implements the proposed approach, the residual energy level of this node is compared with the three pre-defined energy thresholds to select packets that will be relayed according to the value of SR(s), in the same way as presented in Section 4.1. However, if packets within a range of SR are selected to be silently dropped, packets carrying the LL subband are always preserved and forwarded to the next hop. Doing so, it is ensured that low-quality playable images are still received by the sink even from the least sensing-relevant source nodes. We can roughly expect that 25% of data packets generated for a single image after a 1-level 2D DWT are transmitting the LL subband.
Intermediate nodes need to know the type of packets’ payloads, in order to perform the appropriate action. A simple way to provide such information is to include a numerical index in the packets’ headers. A 4-bit Data Relevance (DR) numerical value could be inserted just after the SR, as defined in Table 4. A 4-bit DR allows 16 different configurations, which could be extended to represent up to a 4-level 2D DWT (15 subbands).
Table 4. Data Relevance for a 1-level 2D DWT.
DWT SubbandDR
HH0
HL1
LH2
LL3
The value of DR represents a local QoS parameter, since it is generated exclusively by the transmitting source node and its significance is restricted to the transmission flows it belongs to. In such way, putting together SR and DR creates global and local scopes of relevance, which may be exploited for network optimizations with high accordance to applications monitoring requirements and to the encoding relevance of parts of transmitted images [18,19].
Figure 4 shows two examples of packet relaying following the proposed approach, where DWT coding is also considered to define the packets’ priorities. Similarly to the scenario represented in Figure 2, sensing relevancies are indicated by numerical values inside the squares (packets). Additionally, some packets carry visual data of LL subbands from transmitted images, and those packets will always be relayed to the next hop.
Figure 4. Threshold-based packet relaying, regarding the sensing relevancies of source nodes and DWT subbands.
Jsan 02 00424 g004
Preserving the most relevant data for the reconstruction of the original images may enhance overall monitoring quality, still preserving energy over the network. When applying a 1-level 2D DWT, only 25% of the original data in average will reach the sink, depending on the current energy level of intermediate nodes and the pre-configured energy thresholds. Figure 5 presents the reconstruction of the same image when using different subbands generated by a 1-level 2D DWT. In fact, applications may tolerate images with poorer quality, allowing us to enhance the relaying optimization with more levels of DWT decompositions. If a 2D DWT is applied twice over a single image, 7 subbands are produced and intermediate nodes could consider the relaying of only the LL(2) subband (6.25% of the original data).
Figure 5. Different reconstructed images according to the considered 1-level 2D DWT subbands.
Jsan 02 00424 g005

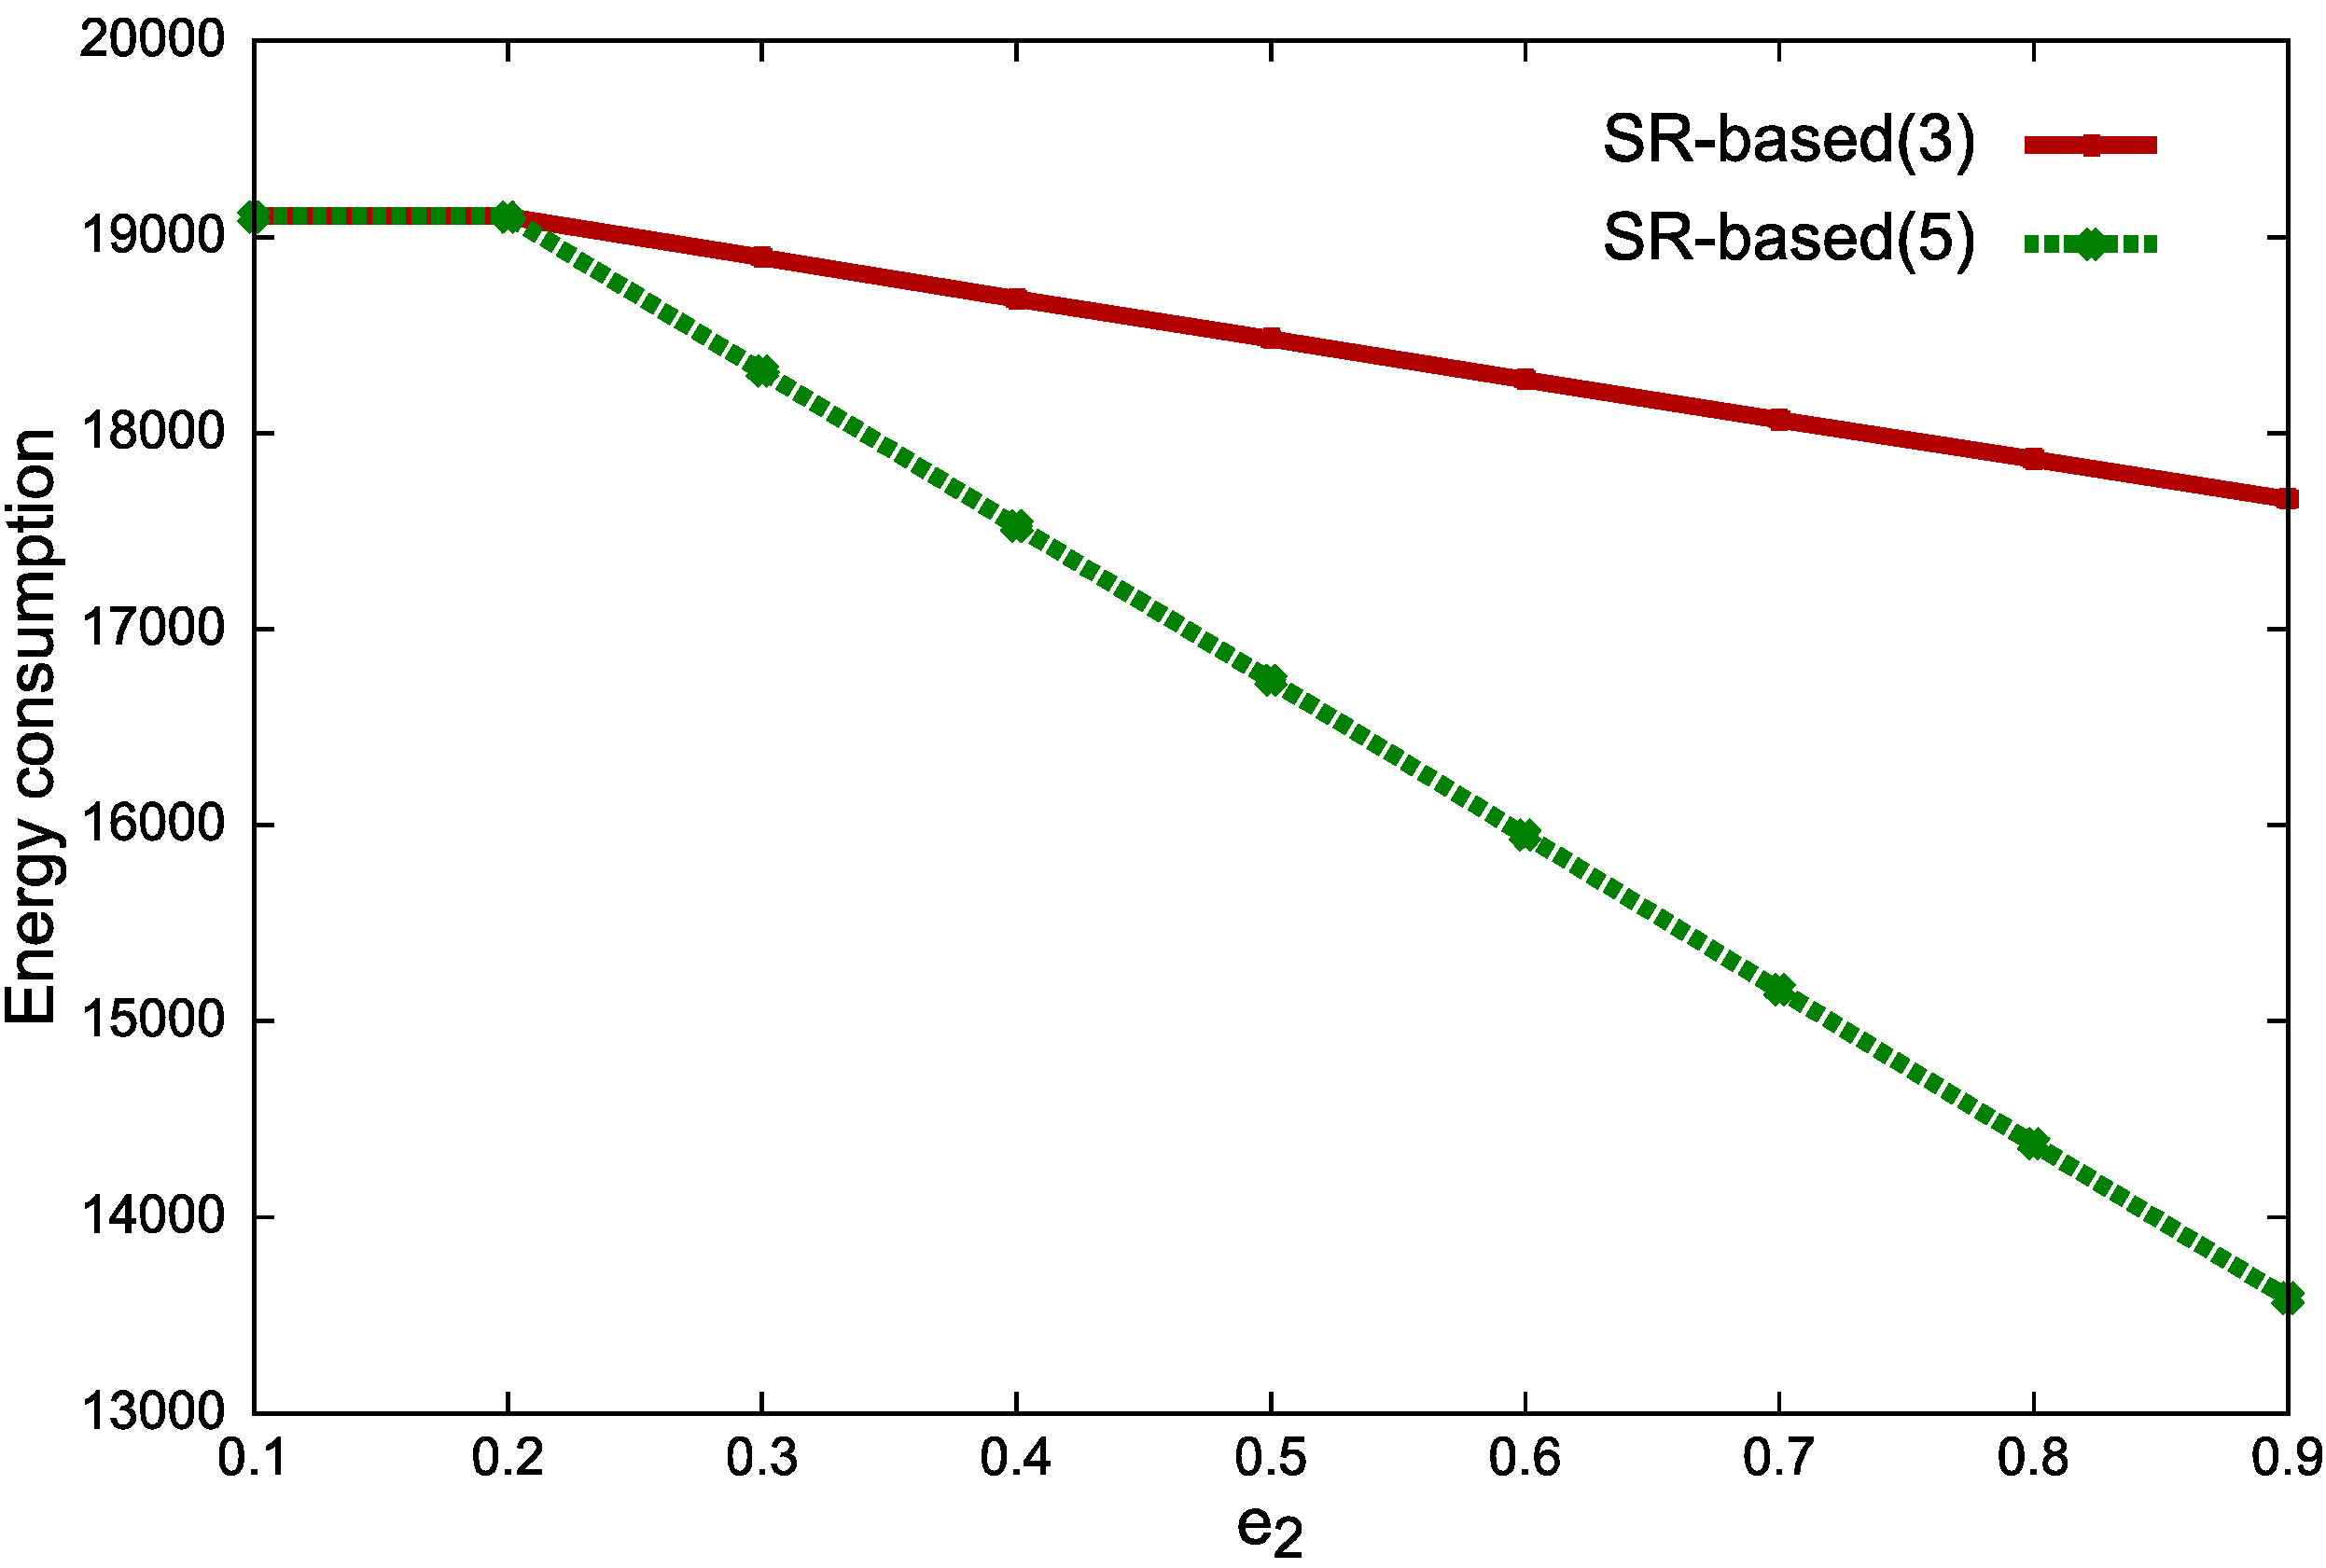
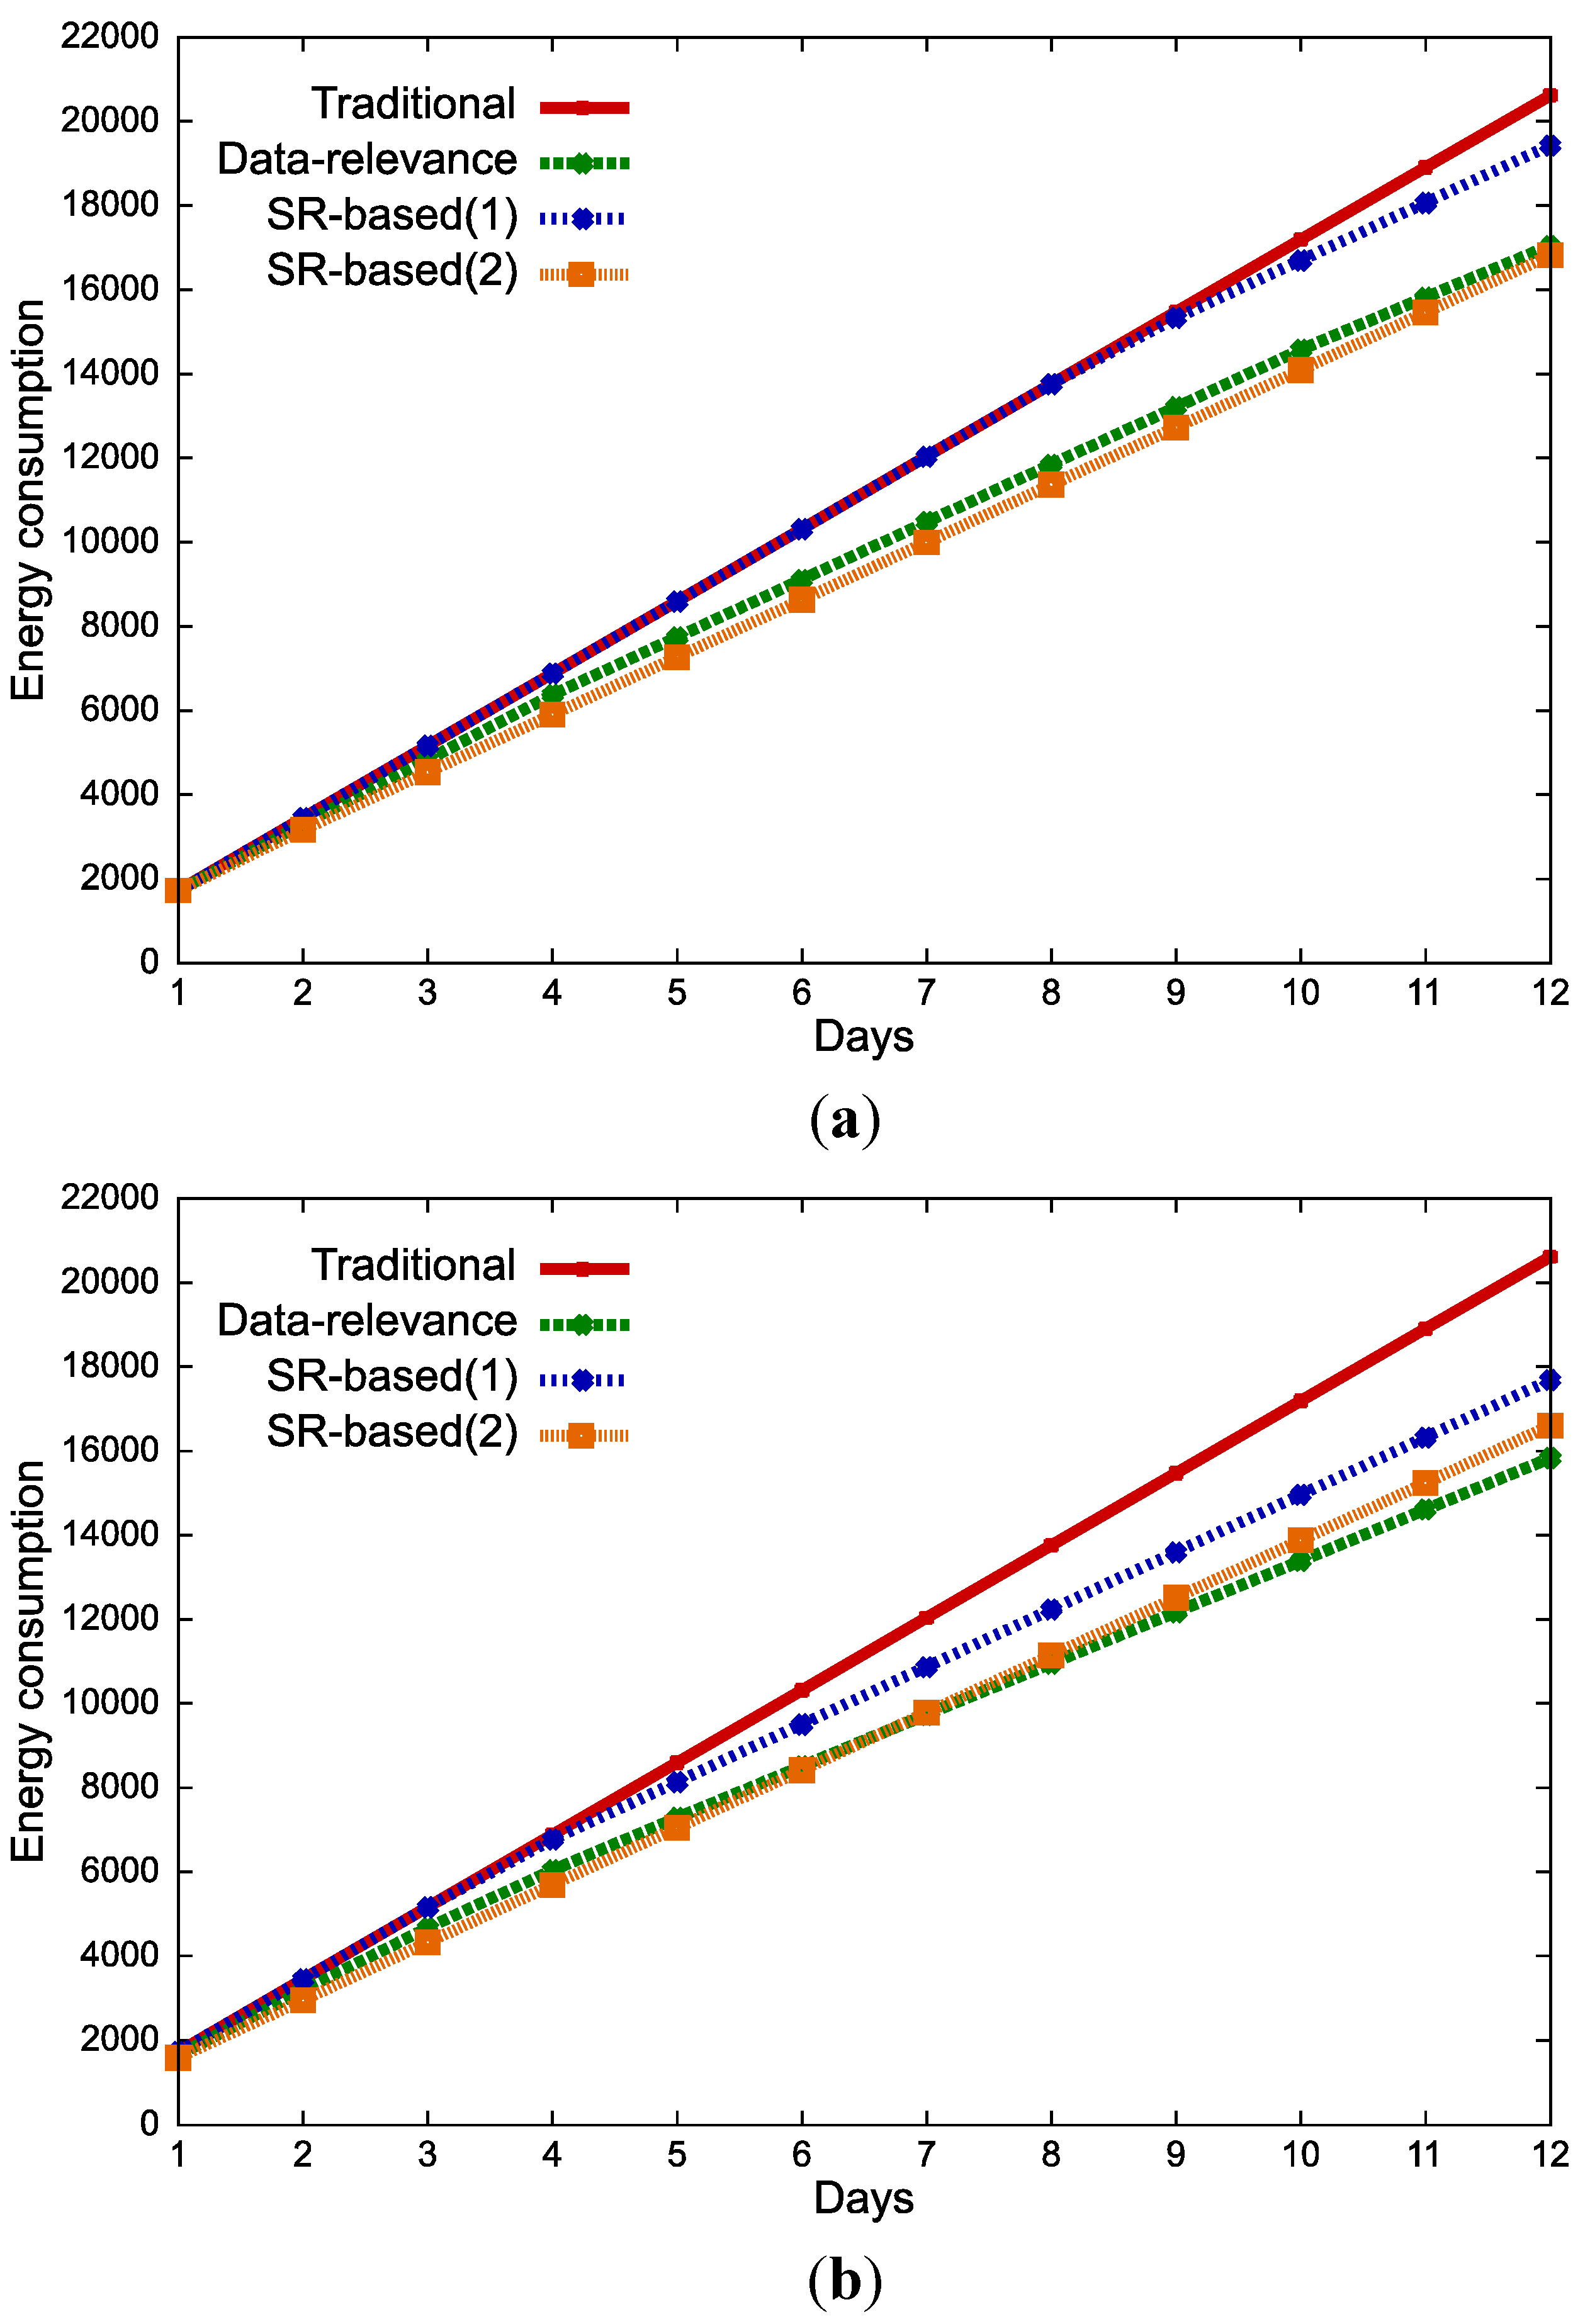
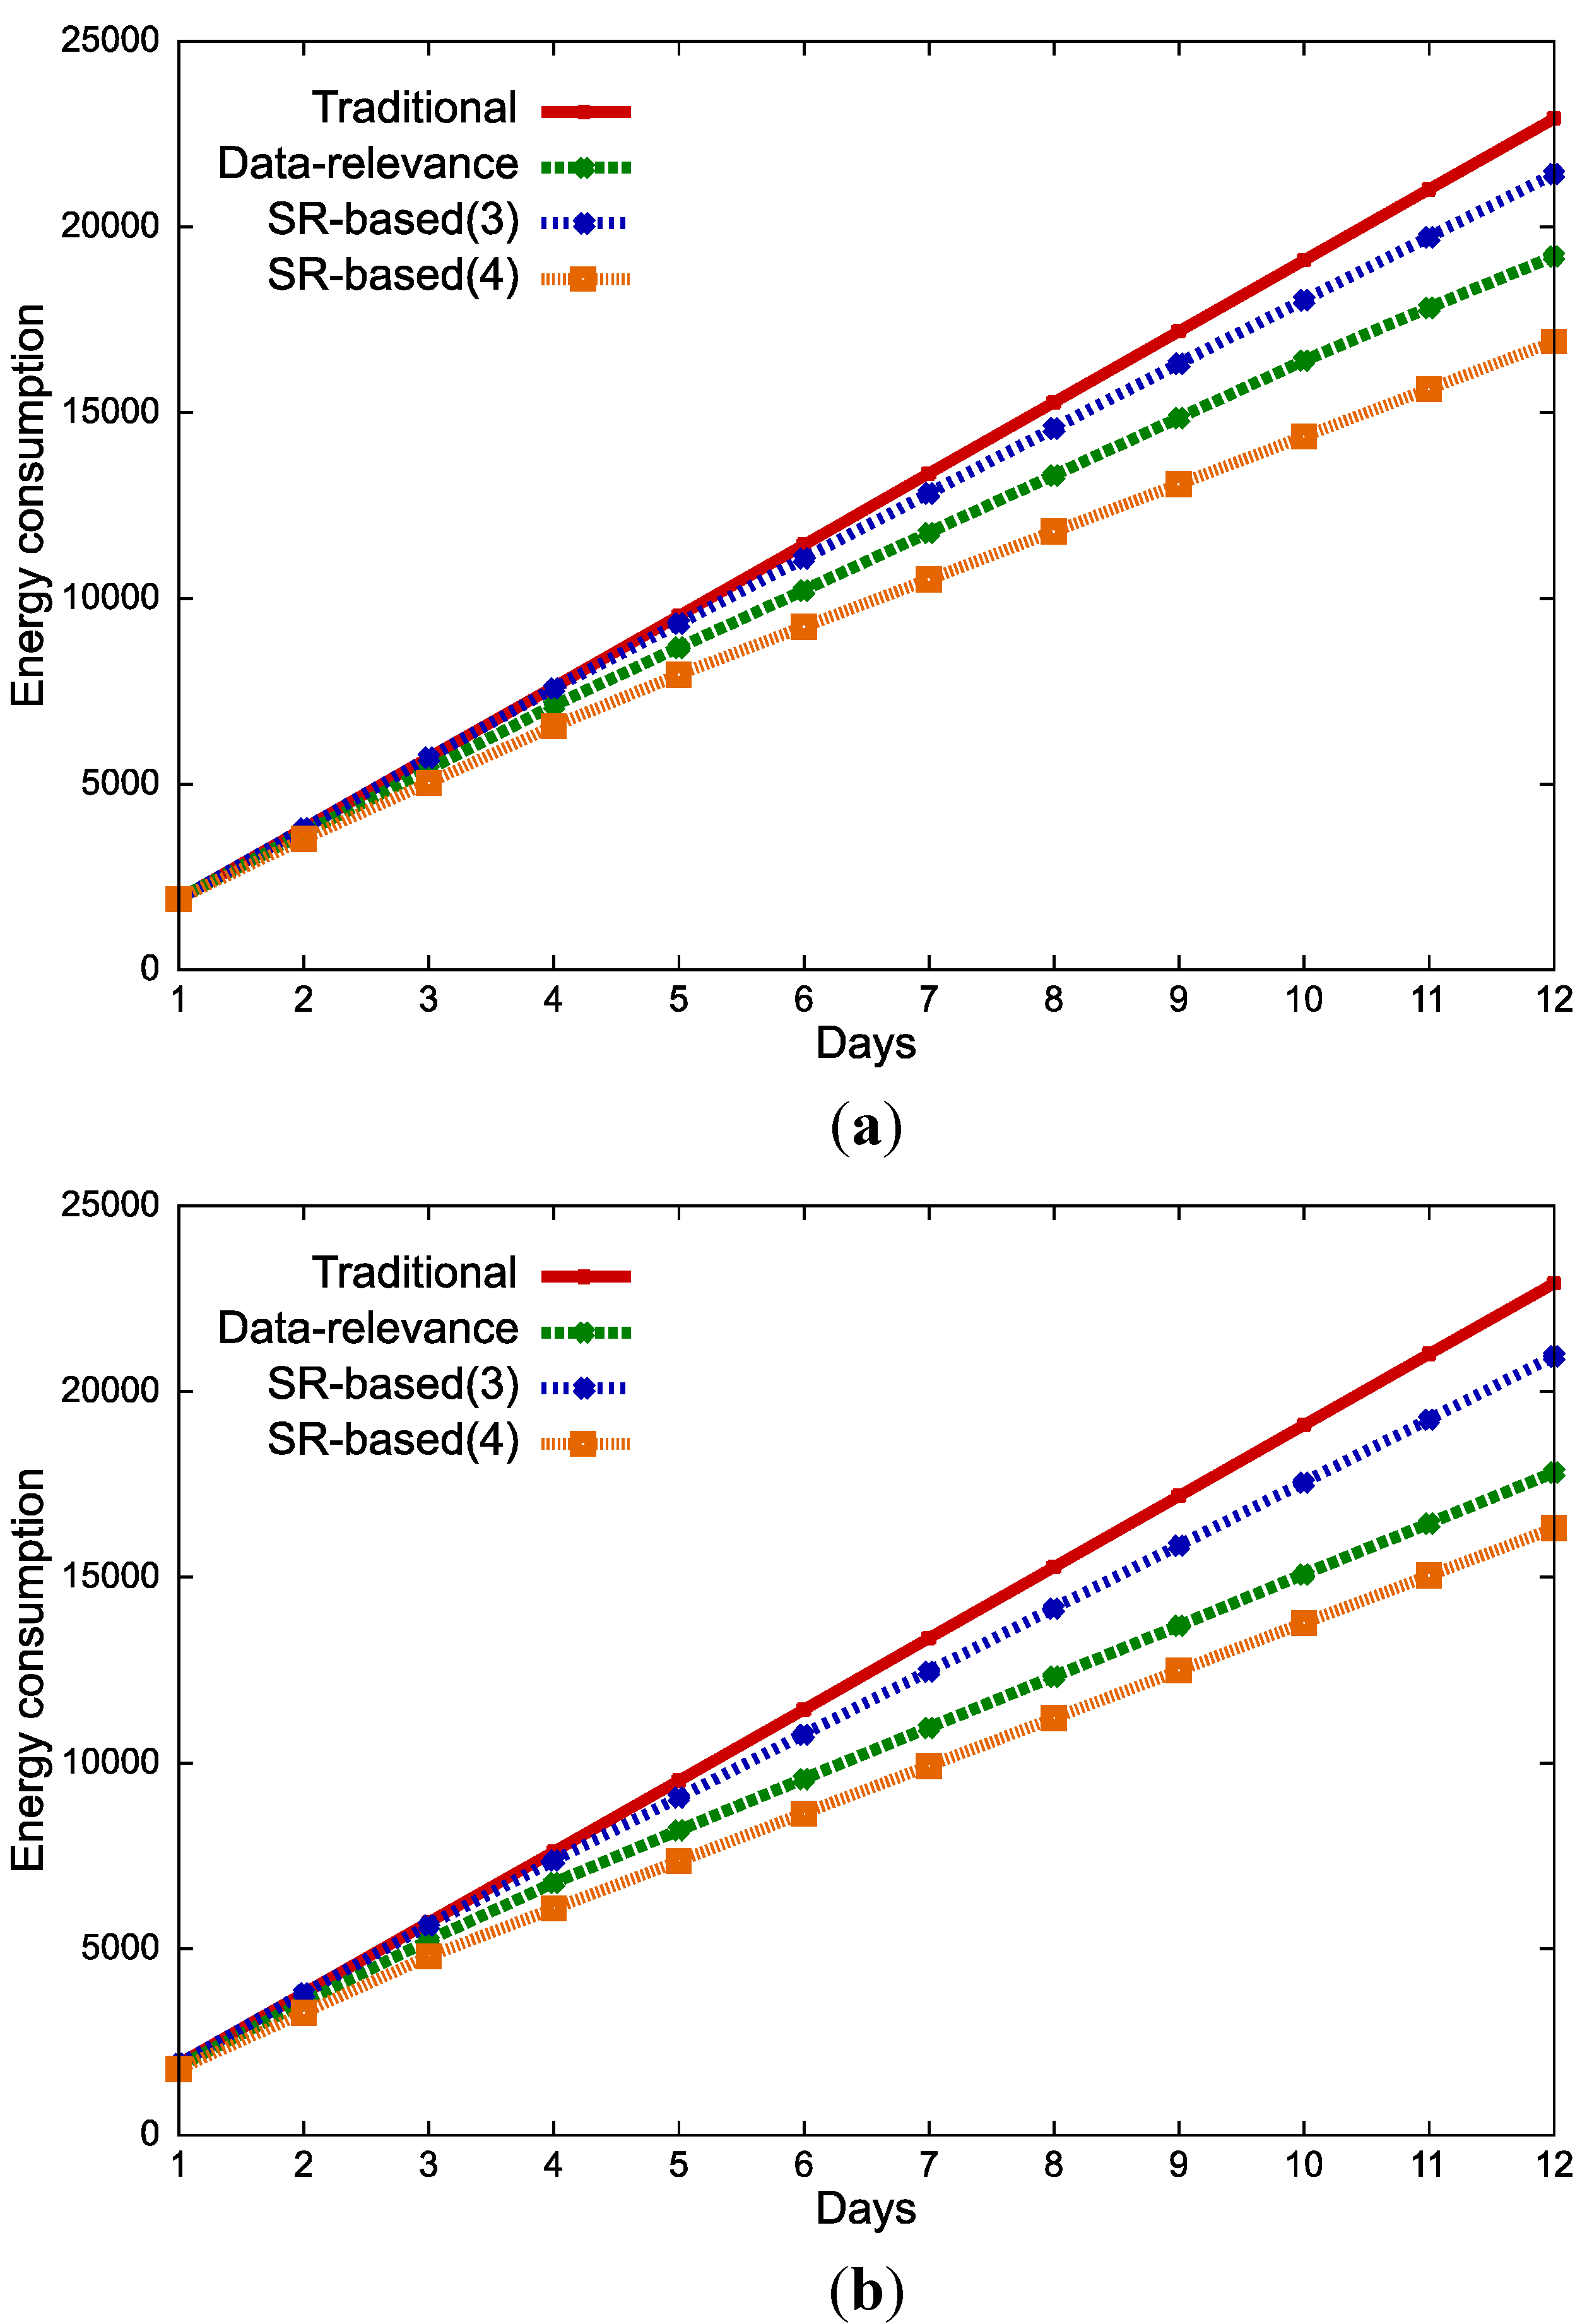
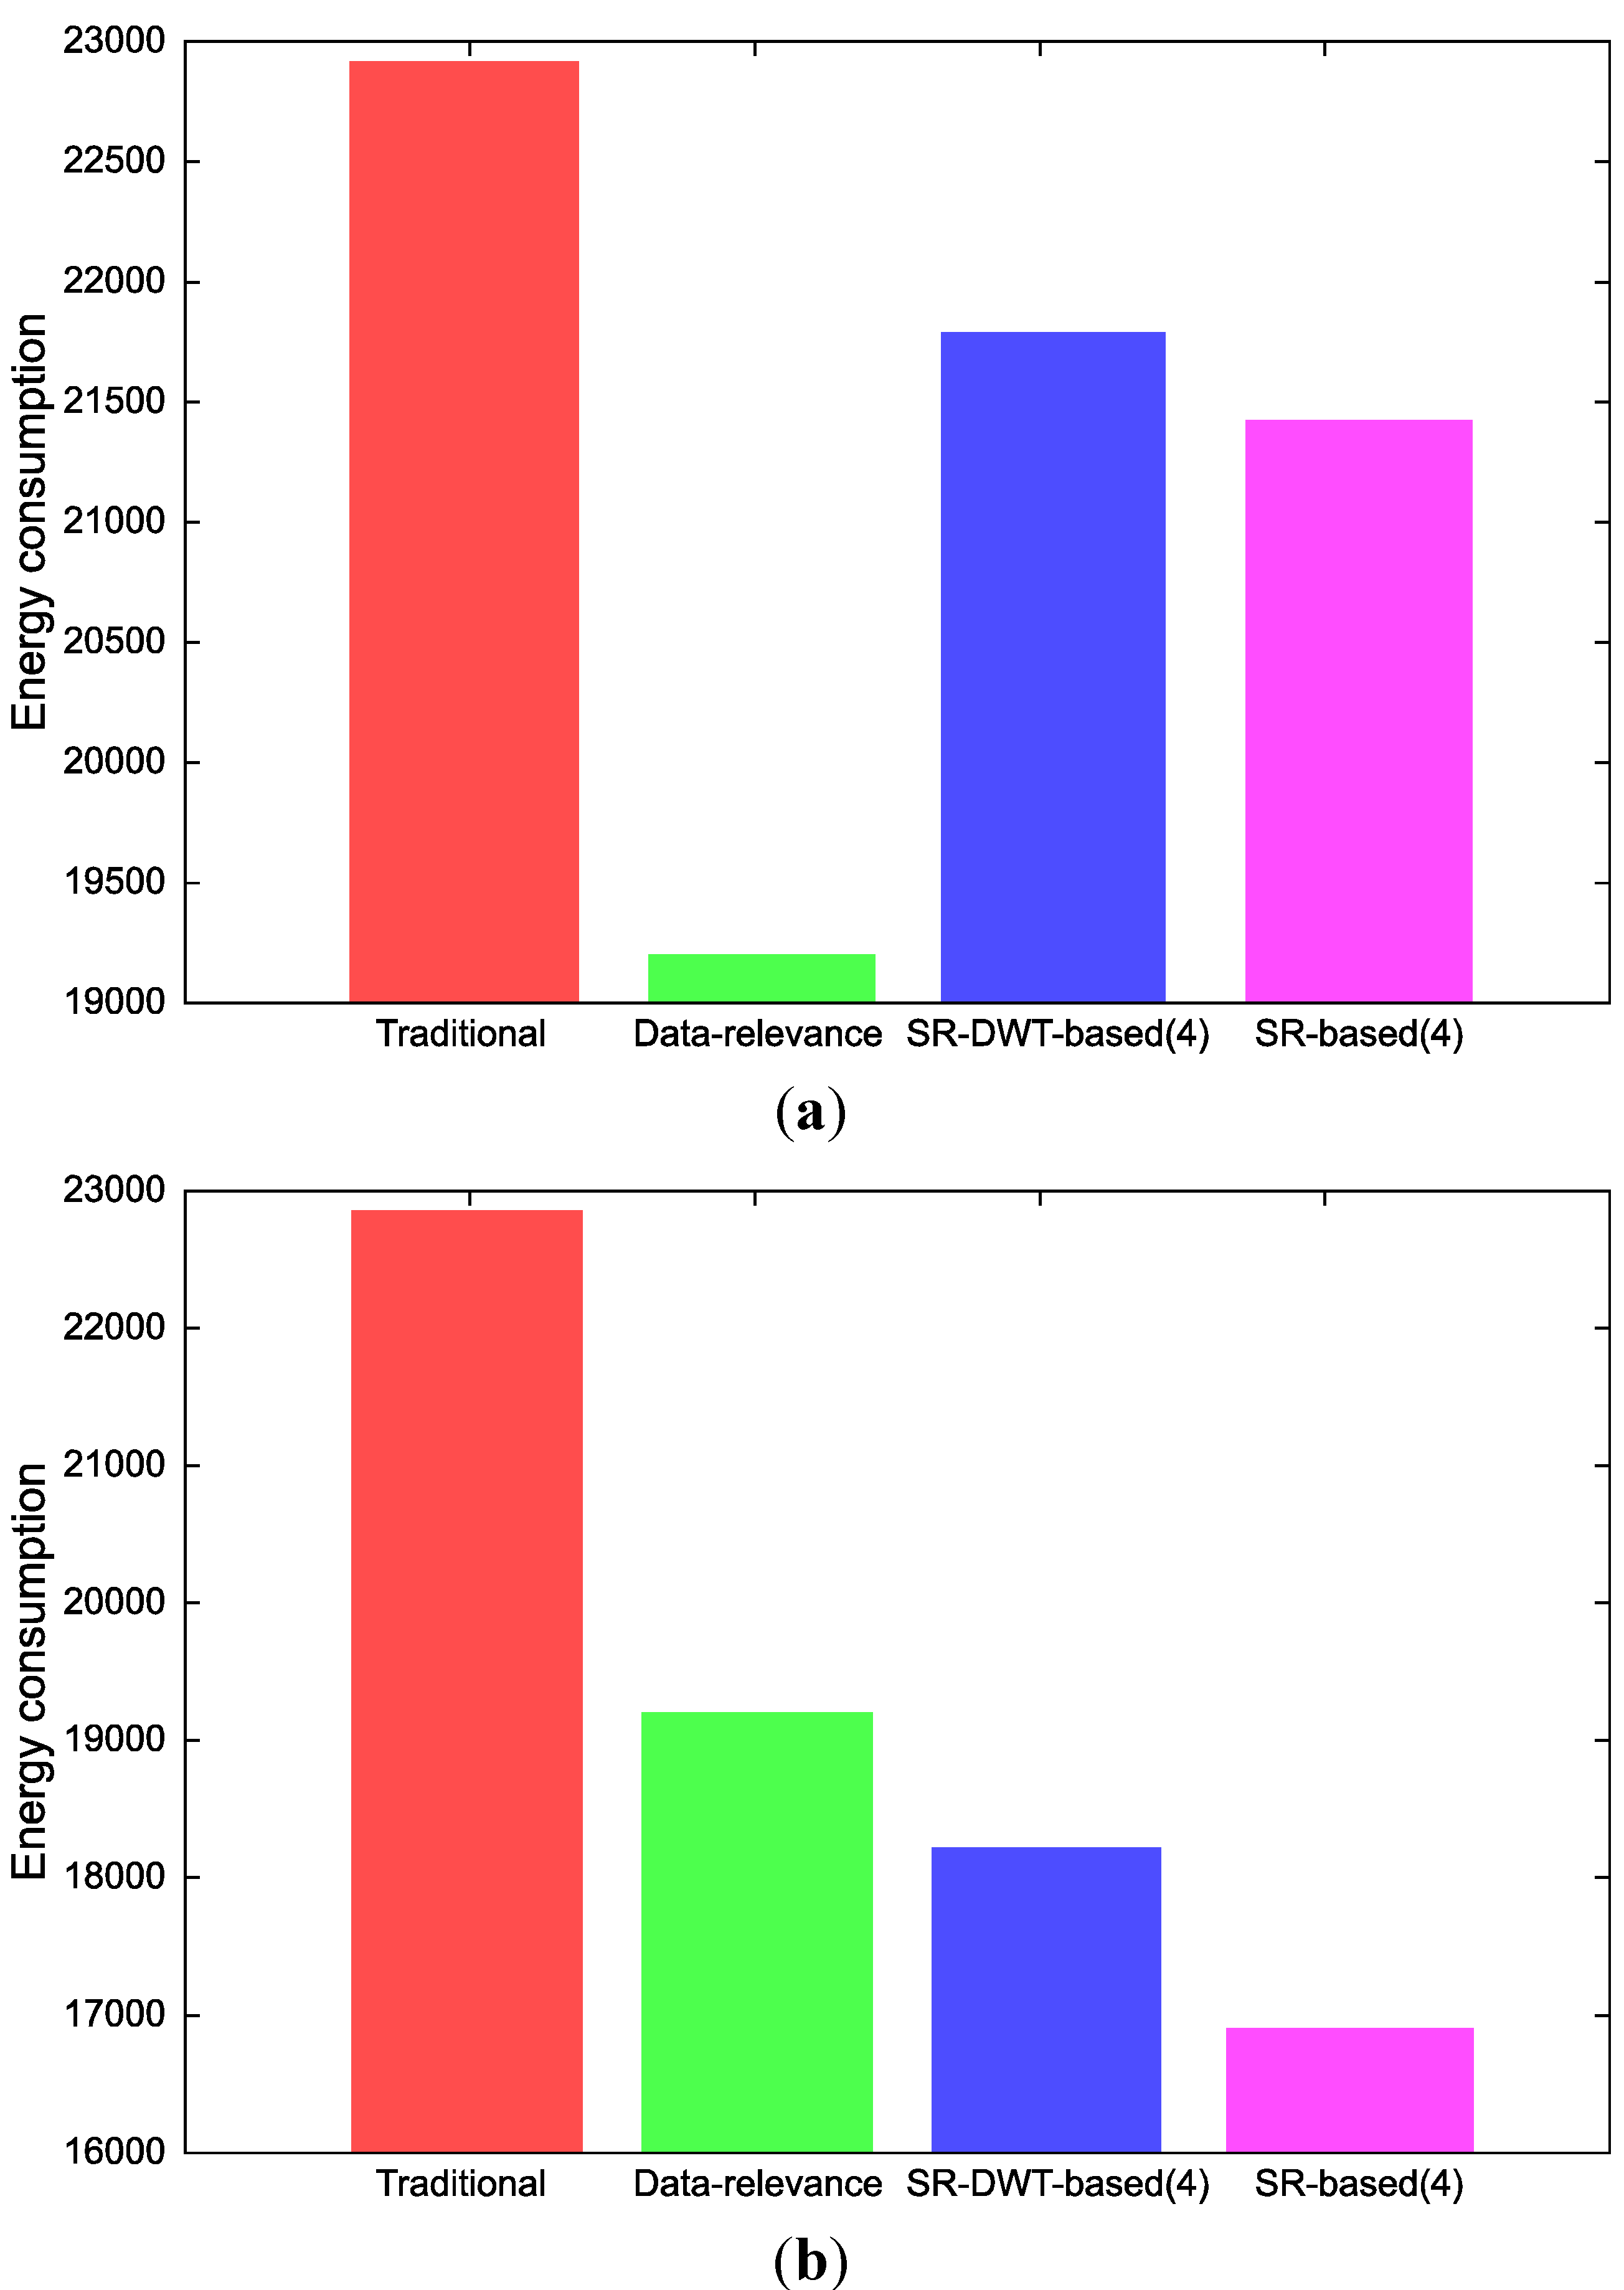
5. Simulation Results

We expect that the proposed energy-efficient relaying mechanism can be employed to save energy in real-world wireless image sensor networks, bringing valuable contributions in this area. As the sensing relevancies of source nodes are exploited to assign relaying priorities to data packets, the network will preserve packets with higher impact to the applications overall quality, potentially performing better than optimization approaches based only on packets’ payloads.
In order to assess the proposed approaches in what concerns energy consumption, we conducted a series of simulations where source nodes with different sensing relevancies are deployed. The standard relaying functionality in the framework Castalia [37] was adapted to execute our packet selection algorithms. Basically, they read the SR(s) included in each data packet to decide if it will be forwarded to the next hop or silently dropped, according to the current energy level and predefined energy thresholds. Castalia is a C++ discrete event simulator based on the OMNet++ platform [37].
Two different communication scenarios were considered for the simulations, as presented in Figure 6. Those networks are composed of few nodes for simplicity, which are improbable for real-world wireless sensor networks, but are useful to verify packet relaying in braided-paths since they follow the same principles of large networks. The first scenario is composed of two source nodes (s1 and s2) and one intermediate node that implements the proposed approaches (n1), while the Scenario 2 is composed of 5 source nodes (s1, s2, s3, s4 and s5) and 5 intermediate nodes, where the proposed approaches are implemented only in node n2. The maximum distance between neighbor nodes is established in 20 meters.
For the experiments, we considered source nodes transmitting a single generic 64 × 64 uncompressed grayscale image snapshot every 10 s. For an effective payload size of 104 bytes, 40 data packets are transmitted by source nodes for a single snapshot. The visual sensor nodes will be transmitting data packets in a maximum transmission rate of 250 kbps and with a transmission power of −5 dBm. A simple interference model is assumed (interferences are resulted from transmissions from neighbor nodes), where packet collisions are handled by MAC-layer protocols. In [37], the packet reception probabilities are calculated based on the transmission power of the transmitting nodes, keeping some level of similarity with real-world communications. The MAC functionalities are supported by T-MAC [25], a duty-cycle protocol that dynamically adjusts the sleeping time for higher efficiency (better adapting to higher transmission rates), also performing retransmission of corrupted packets. Default T-MAC parameters were considered for the experiments, according to the definitions in Castalia WSN discrete-event simulator (version 3.2).
Figure 6. Communication scenarios for the simulations.
Jsan 02 00424 g006
We defined different configurations different configurations of sensing relevancies, as depicted in Table 5. The SR-based(1) and SR-based(2) configurations are intended for simulations over the Scenario 1, while the remaining configurations are aimed at simulations over Scenario 2. The SR-based relaying is concerned only with the SR in each packet (Section 4.1), while the SR-DWT-based approaches also exploits DWT subbands relevancies (Section 4.2).
Table 5. Sensing relevancies configurations.
Configuration of the SourcesSR(1)SR(2)SR(3)SR(4)SR(5)
SR-based(1)1512---
SR-based(2)153---
SR-DWT-based(2)153---
SR-based(3)71511158
SR-based(4)263115
SR-DWT-based(4)263115
SR-based(5)691587
We initially conducted simulations comparing the SR-based relaying approach with a traditional SR-unaware relaying mechanism (every incoming packet is forwarded) and a standard Data-relevance approach where only the payloads’ relevancies (DWT subbands) are considered for energy-efficient relaying, in a similar way as expressed in [9]. In the latter, the original images are encoded by a 1-level 2D DWT and packets are prioritized using only the value of DR, as defined in Table 6.
Table 6. Packet forwarding for the Data-relevance relaying approach.
Energy LevelPackets that MUST be relayed to the next hop
DRDWT Subband
ee1 0, 1, 2 and 3HH, HL, LH and LL
e2 ≤ e < e11, 2 and 3HL, LH and LL
e3 ≤ e < e22 and 3LH and LL
e < e33LL
The energy consumption in node n1 after 12 days of continuous transmission in Scenario 1 is presented in Figure 7, for different configurations of the three energy thresholds.
Figure 7. Energy consumption for Scenario 1. (a) e1 = 0.9, e2 = 0.7 and e3 = 0.3. (b) e1 = 0.95, e2 = 0.8 and e3 = 0.7.
Jsan 02 00424 g007
As expected, the worse results in terms of energy consumption are achieved when traditional SR-unaware relaying mechanism is employed. Note that the same energy is consumed whatever the values of e1, e2 and e3. In a different way, the SR-based approach performs differently depending on the sensing relevancies of the source nodes (s1 and s2). The Data-relevance relaying approach has a good performance concerning energy consumption, being slightly better in Figure 7b. Note, however, that all snapshots are lower-bounded when the Data-relevance approach is employed, whatever the relevancies of the source nodes. In a different way, the SR-based approach will always delivery high-quality images for the highest relevant source nodes, potentially enhancing applications overall monitoring quality.
A visual scheme of the expected quality of the received images at the sink side is represented in Figure 8. High-quality images will be always delivered for a traditional relaying approach, while images with decreasing quality will reach the sink for the Data-relevance approach according to the energy thresholds and the current energy resources of intermediate nodes. For the SR-based approach, only images from the maximum-relevant source node (SR(1) = 15) will always reach the sink without loss of quality.
Figure 8. Average quality of the images that reach the sink for different transmission configurations.
Jsan 02 00424 g008
The monitoring quality when employing the proposed SR-based relaying approach will decrease along the time, according to the energy level and pre-defined thresholds. In initial states of the network, images from all source nodes will be transmitted to the receiving end, but the amount of visual information that will reach the sink will decrease along the time. However, images from maximum relevance source nodes will be always relayed without interference, preserving data with highest significance for the application.
The energy consumption of node n2 for transmissions over Scenario 2 is presented in Figure 9 for the source nodes configurations SR-based(3) and SR-based(4).
Once more, the energy consumption of the proposed SR-based relaying approach is highly related to the sensing relevancies of source nodes. When all source nodes have maximum relevance, the performance is similar to a traditional relaying paradigm. However, energy savings are achieved when low-relevant sources nodes are identified. Visual data transmitted from those source nodes are indeed important, but applications can afford some data losses if visual data from high-relevant source nodes are received for longer time.
Figure 9. Energy consumption for Scenario 2. (a) e1 = 0.9, e2 = 0.7 and e3 = 0.3. (b) e1 = 0.95, e2 = 0.8 and e3 = 0.7.
Jsan 02 00424 g009
Figure 10. Relation between energy consumption and the defined energy thresholds.
Jsan 02 00424 g010
Figure 10 relates energy consumption with the energy thresholds e1, e2 and e3 for node n2 in Scenario 2, for the source nodes configurations SR-based(3) and SR-based(5) and 12 days of transmissions. We define e1 = 0.95 and e3 = 0.05, varying the value of e2.
There is a tradeoff between energy saving and monitoring quality, when employing the proposed energy-efficient relaying mechanism. In fact, energy consumption is inversely proportional to the values of the energy thresholds. Higher values for them incur in earlier dropping of low-relevant packets, reducing energy consumption. Thus, when we achieve higher energy saving, the monitoring quality is somehow prejudiced, since low-relevant packets are dropped in initial stages of the network lifetime.
We also assessed the energy consumption in node n2, when the SR-DWT-based approach is employed in Scenario 2. We presented in Figure 11 the energy consumption after 12 days of image transmissions.
Figure 11. Energy consumption after 12 days. (a) e1 = 0.9, e2 = 0.7 and e3 = 0.3. (b) e1 = 0.95, e2 = 0.8 and e3 = 0.7.
Jsan 02 00424 g011
The SR-DWT-based approach consumes more energy than the SR-based relaying approach, for the same configuration of sensing relevancies, since at least data packets carrying LL subbands from all source nodes will reach the sink (and all packets from source nodes with SR = 15). However, higher monitoring quality is expected for the SR-DWT-based approach. In general words, if applications require low-quality versions of the images transmitted by all source nodes, the SR-DWT-based approach should be employed. One should also note that, as in previous experiments, the Data-relevance approach may not be the best energy-efficient relaying approach, depending on the sensing relevancies of the source nodes.
Figure 12 presents a visual scheme for the received images at the sink side, but now considering the SR-DWT-based relaying approach. Note that the optimal monitoring configuration is achieved when the proposed SR-DWT-based relaying is employed. Although the Data-relevance relaying approach achieves some energy savings, the quality of all received images decreases along the time, uniformly prejudicing the quality for all visual source nodes.
Figure 12. Average quality of the images that reach the sink for different transmission configurations and also considering the SR-DWT-based relaying approach.
Jsan 02 00424 g012
The expected energy savings when employing the proposed relaying approaches are significant. If source nodes are powered by two AA batteries providing 20,000 J or more, the sensor network lifetime could be 3 days longer than the traditional SR-unaware relaying paradigm, depending on source nodes and network configurations. However, the network monitoring quality is somehow harmed when comparing with traditional relaying. In fact, the inner characteristics of visual sensor networks impose the need for a new understanding of QoS guarantees and monitoring quality. We can expect that the visual monitoring quality depends on the compliance of the performed monitoring with the application requirements, and such requirements are defined by users. Thus, the monitoring quality is related with the Quality of Experience [35] of the deployed wireless image sensor network. We proposed the concept of Quality of Viewing (QoV) as a metric to assess the loss of monitoring quality when exploiting the sensing relevance concept for network optimizations [38], but it is also a subjective concept.
If source nodes are strictly assigned to groups of relevance according to the monitoring requirements, we can achieve high monitoring quality even with some data losses. However, how to compute a quality index to be used for comparison purposes is still a complex issue, turning prohibitive a direct relation between energy preservation and final monitoring quality [38]. Since it can not be said that a maximum-relevant source node is twice or three times more important than a high-relevant source, a different notion of quality must be designed. In such way, conventional measurements as data loss ratio and PSNR are equally not sufficient for assessment of the monitoring quality when employing the proposed relaying approaches.
After simulations and initial verifications, we expect that the proposed energy-efficient relaying mechanism performs better than traditional relaying paradigms and optimizations based only on local relevance. The energy savings are significant and losses on monitory quality are concentrated in visual data originated from lower relevant source nodes. This is different from the Data-relevance relaying approach, where all images are lower-bounded along the time. In this context, we expect the SR-DWT-based relaying approach as the best optimization solution for visual sensor networks, assuring high monitoring quality but still bringing significant energy savings.
As a final comment, we have not assessed the impact in storage and processing when employing the proposed approaches on resource-constrained nodes. The values of SR and DR in data packets will be considered when forwarding packets and such processing should be accounted when estimating the overall performance. In fact, conventional intermediate nodes in wireless sensor networks will employ some routing protocol that will process information in data packets and thus packet processing in such nodes is already expected. We are proposing only slight additional processing in nodes that implement the proposed approaches, which is the comparison of the values of SR and DR according to predefined energy thresholds and dropping of packets according to the current energy level. In such way, we believe that this additional processing can be tolerable when energy saving is achieved over the network.
In general words, we expect that wireless visual sensor networks will be composed of sensor motes with limited resources, depending on the network budget and the application requirements [39,40]. In such way, different performance may be perceived depending on the deployed sensor motes, turning difficult to achieve a cost function for all types of sensors. Nevertheless, future works will be concerned with assessment of processing and storage costs when employing the proposed relaying approaches.

6. Conclusions

We have proposed two energy-efficient packet relaying approaches, where the sensing relevancies of source nodes are exploited to assign relaying priorities to data packets. Three different energy thresholds are established for some intermediate nodes, where the current energy level of the nodes is compared to the energy thresholds in order to indicate the type of packets that must not be relayed to the next hop. Doing so, energy savings are achieved with reduced impact on the overall quality of visual monitoring applications.
A series of simulations were conducted to assess the expected performance of the proposed approaches in terms of energy consumption. Future works will be concerned with assessment of the application monitoring quality when source nodes are assigned to groups of relevance and data packets from least relevant source nodes are silently dropped during transmission over the network. We also want to assess the processing costs of the proposed approaches. Moreover, more robust algorithms for DWT computation will be considered in future developments [41], potentially reducing the impact of image coding in source nodes. At last, additional schemes for the SR and DWT-based relaying approaches will be validated, where different levels of 2D DWT will be applied over the original images.

Acknowledgments

The authors would like to acknowledge the support of research agencies CAPES (grant no. 9014-11-0) and FCT (project ref. PTDC/EEA-TEL/104185/2008), that partially funded this work.

Conflict of Interest

The authors declare no conflict of interest.

References

  1. Akyildiz, I.; Su, W.; Sankarasubramaniam, Y.; Cayirci, E. Wireless sensor networks: A survey. Comput. Netw. 2002, 38, 393–422. [Google Scholar] [CrossRef]
  2. Baronti, P.; Pillai, P.; Chook, V.; Chessa, S.; Gotta, A.; Hu, Y. Wireless sensor networks: A survey on the state of the art and the 802. 15.4 and ZigBee standards. Comput. Commun. 2006, 30, 1655–1695. [Google Scholar]
  3. Soro, S.; Heinzelman, W. A survey of visual sensor networks. Adv. Multimed 2009, 2009. [Google Scholar] [CrossRef]
  4. Charfi, Y.; Canada, B.; Wakamiya, N.; Murata, M. challenging issues in visual sensor networks. IEEE Wirel. Commun. 2009, 16, 44–49. [Google Scholar] [CrossRef]
  5. Costa, D.; Guedes, L. The coverage problem in video-based wireless sensor networks: A survey. Sensors 2010, 10, 8215–8247. [Google Scholar] [CrossRef]
  6. Almalkawi, I.; Zapata, M.; Al-Karaki, J.; Morillo-Pozo, J. Wireless multimedia sensor networks: Current trends and future directions. Sensors 2010, 10, 6662–6717. [Google Scholar] [CrossRef]
  7. Costa, D.; Guedes, L.; Vasques, F.; Portugal, P. Effect of Frame Size on Energy Consumption in Wireless Image Sensor Networks. In Proceedings of 2012 IEEE International Conference on Imaging Systems and Techniques (IST), Manchester, UK, 16–17 July 2012; pp. 239–244.
  8. Qaisar, S.; Radha, H. Multipath Multi-stream Distributed Reliable Video Delivery in Wireless Sensor Networks. In Proceedings of 43rd Annual Conference on Proceeding of the Information Sciences and Systems, CISS 2009, Baltimore, MD, USA, 18–20 March 2009; pp. 207–212.
  9. Lecuire, V.; Duran-Faundez, C.; Krommenacker, N. Energy-efficient transmission of wavelet-based images in wireless sensor networks. EURASIP J. Image Video Process 2007, 2007. [Google Scholar] [CrossRef]
  10. Yaghmaee, M.; Adjeroh, D. A New Priority Based Congestion Control Protocol for Wireless Multimedia Sensor Networks. In Proceeding of the WoWMoM 2008. 2008 International Symposium on a World of WirelessMobile and Multimedia Networks, Newport Beach, CA, USA, 23–26 June 2008; pp. 1–8.
  11. Lee, J.-H.; Jun, I.-B. Adaptive-compression based congestion control technique for wireless sensor networks. Sensors 2010, 10, 2919–2945. [Google Scholar] [CrossRef]
  12. Chen, B.; Jamieson, K.; Balakrishnan, H.; Morris, R. SPAN: An energy efficient coordination algorithm for topology maintenance in ad hoc wireless networks. Wirel Netw. 2002, 8, 481–494. [Google Scholar] [CrossRef]
  13. Costa, D.; Guedes, L. Exploiting the sensing relevancies of source nodes for optimizations in visual sensor networks. Multimed. Tools Appl. 2013, 64, 549–579. [Google Scholar] [CrossRef]
  14. Chow, K.-Y.; Lui, K.-S.; Lam, E. Achieving 3600 Angle Coverage with Minimum Transmission Cost in Visual Sensor Networks. In Proceedings IEEE Wireless Communications and Networking Conference, Cancun, Mexico, 28–31 March 2011; pp. 4112–4116.
  15. Ai, J.; Abouzeid, A. Coverage by directional sensors in randomly deployed wireless sensors networks. J. Comb. Optim. 2006, 11, 21–41. [Google Scholar] [CrossRef]
  16. Politis, I.; Tsagkaropoulos, M.; Dagiuklas, T.; Kotsopoulos, S. Power efficient video multipath transmission over wireless multimedia sensor networks. Mob. Netw. Appl. 2008, 13, 274–284. [Google Scholar]
  17. Costa, D.; Guedes, L. A survey on multimedia-based cross-layer optimization in visual sensor networks. Sensors 2011, 11, 5439–5468. [Google Scholar] [CrossRef]
  18. Costa, D.; Guedes, L.; Vasques, F.; Portugal, P. Energy-Efficient Visual Monitoring Based on the Sensing Relevancies of Source Nodes for Wireless Image Sensor Networks. In Proceedings of IEEE Sensors Applications Symposium, Brescia, Italy, 7–9 February 2012; pp. 1–6.
  19. Costa, D.; Guedes, L.; Vasques, F.; Portugal, P. A Semi-Reliable Energy-Efficient Retransmission Mechanism Based on the Sensing Relevancies of Source Nodes for Wireless Image Sensor Networks. In Proceedings of International Symposium on Wireless Communication Systems, Paris, France, 28–31 August 2012; pp. 506–510.
  20. Maimour, M.; Pham, C.; Amelot, J. Load Repartition for Congestion Control in Multimedia Wireless Sensor Networks with Multipath Routing. In Proceedings of International Symposium on Wireless Pervasive Computing, Santorini, Greece, 7–9 May 2008; pp. 11–15.
  21. Yu, W.; Sahinoglu, Z.; Vetro, A. Energy Efficient JPEG 2000 Image Transmission over Wireless Sensor Networks. In Proceedings of Globecom, Dallas, TX, USA, 29 November–3 December 2004; pp. 2738–2743.
  22. Akyildiz, I.; Melodia, T.; Chowdhury, K. A survey on wireless multimedia sensor networks. Comput. Netw. 2007, 51, 921–960. [Google Scholar] [CrossRef]
  23. Zhang, L.; Hauswirth, M.; Shu, L.; Zhou, Z.; Reynolds, V.; Han, G. Multi-Priority Multi-Path Selection for Video Streaming in Wireless Multimedia Sensor Networks. In Proceedings of International Conference on Ubiquitous Intelligence and Computing, Oslo, Norway, 23–25 June 2008; pp. 439–452.
  24. Costa, D.; Guedes, L. A discrete wavelet transform (DWT)-based energy-efficient selective retransmission mechanism for wireless image sensor networks. J. Sens. Actuator Netw. 2012, 1, 3–35. [Google Scholar] [CrossRef]
  25. Dam, T.; Langendoe, K. An Adaptive Energy-Efficient MAC Protocol for Wireless Sensor Networks. In Proceedings of ACM Conference on Embedded Networked Sensor Systems, Los Angeles, CA, USA, 5–7 November 2003; pp. 171–180.
  26. Heinzelman, W.; Chandrakasan, A.; Balakrishnan, H. An application-specific protocol architecture for wireless microsensor networks. IEEE Trans. Wirel. Commun. 2002, 1, 660–670. [Google Scholar]
  27. Bajaber, F.; Awan, I. Adaptive decentralized re-clustering protocol for wireless sensor networks. J. Comput. Syst. Sci. 2011, 77, 282–292. [Google Scholar] [CrossRef]
  28. Korhonen, J.; Wang, Y. Effect of Packet Size on Loss Rate and Delay in Wireless Links. In Proceedings of the 2005 IEEE Wireless Communications and Networking Conference, New Orleans, LA, USA, 13–17 March 2005; pp. 1608–1613.
  29. Pekhteryev, G.; Sahinoglu, Z.; Orlik, P.; Bhatti, G. Image Transmission over IEEE 802.15.4 and ZigBee Networks. In Proceeding of the IEEE International Symposium on Circuits and Systems, Kobe, Japan, 23–26 May 2005; pp. 539–3542.
  30. Wu, H.; Abouzeid, A. Error resilient image transport in wireless sensor networks. Comput. Netw. 2006, 50, 2873–2887. [Google Scholar] [CrossRef]
  31. Lecuire, V.; Duran-Faundez, C.; Krommenacker, N. Energy-efficient image transmission in sensor networks. Int. J. Sens. Netw. 2008, 4, 37–47. [Google Scholar]
  32. Latré, B.; Mil, P.; Moerman, I.; Dhoedt, B.; Demeester, P. Throughput and delay analysis of unslotted IEEE 802.15.4. J. Netw. 2006, 1, 20–28. [Google Scholar]
  33. Liang, Y.; Peng, W. Minimizing energy consumptions in wireless sensor networks via two-modal transmission. ACM SIGCOMM Comput. Commun. Rev. 2010, 40, 12–18. [Google Scholar] [CrossRef]
  34. Han, B.; Lee, S. Efficient Packet Error Rate Estimation in Wireless Networks. In Proceedings of Conference on Testbeds and Research Infrastructure for the Development of Networks and Communities, Orlando, FL, USA, 21–23 May 2007; pp. 1–9.
  35. Brooks, P.; Hestnes, B. User measures of quality of experience: Why being objective and quantitative is important. IEEE Netw. 2010, 24, 8–13. [Google Scholar] [CrossRef]
  36. Ganesan, D.; Govindan, R.; Shenker, S.; Estrin, D. Highly-resilient, energy-efficient multipath routing in wireless sensor networks. Mob. Comput. Commun. Rev. 2001, 4, 10–24. [Google Scholar]
  37. Tselishchev, Y.; Boulis, A.; Libman, L. Experiences and Lessons from Implementing a Wireless Sensor Network MAC Protocol in the Castalia Simulator. In Proceedings of the 2010 IEEE Wireless Communications and Networking Conference (WCNC), Sydney, Australia, 18–21 April 2010; pp. 1–6.
  38. Costa, D.; Guedes, L.; Vasques, F.; Portugal, P. QoV: Assessing the Monitoring Quality in Visual Sensor Networks. In Proceedings of the2012 IEEE 8th International Conference on Wireless and Mobile ComputingNetworking and Communications (WiMob), Barcelona, Spain, 8–10 October 2012; pp. 667–674.
  39. Tavli, B.; Bicakci, K.; Zilan, R.; Barcelo-Ordinas, J. A survey of visual sensor network platforms. Multimed. Tools Appl. 2012, 60, 689–726. [Google Scholar] [CrossRef]
  40. Seema, A.; Reisslein, M. Towards efficient wireless video sensor networks: A survey of existing node architectures and proposal for A Flexi-WVSNP design. IEEE Commun. Surv. Tut. 2011, 13, 462–486. [Google Scholar] [CrossRef]
  41. Rein, S.; Reisslein, M. Low-memory wavelet transforms for wireless sensor networks: A tutorial. IEEE Commun. Surv. Tut. 2011, 13, 291–307. [Google Scholar] [CrossRef]

