Article

Lesson Learned from Collecting Quantified Self Information via Mobile and Wearable Devices

1
Department of Computer Science and Engineering, University of California Riverside, Riverside 92521, CA, USA
2
Faculty of Computer Science, University of Vienna, Vienna A-1090, Austria
3
Department of Computer Science, Liverpool John Moores University, Liverpool L33AF, UK
4
Institute of Technology, University of Ontario, Oshawa L1H7K4, ON, Canada
5
Islamic Azad University Central Tehran Branch, Tehran 1469669191, Iran
*
Author to whom correspondence should be addressed.
J. Sens. Actuator Netw. 2015, 4(4), 315-335; https://doi.org/10.3390/jsan4040315
Submission received: 12 September 2015 / Revised: 27 October 2015 / Accepted: 27 October 2015 / Published: 5 November 2015
(This article belongs to the Special Issue Mobile Computing and Applications)

Abstract

:
The ubiquity and affordability of mobile and wearable devices has enabled us to continually and digitally record our daily life activities. Consequently, we are seeing the growth of data collection experiments in several scientific disciplines. Although these have yielded promising results, mobile and wearable data collection experiments are often restricted to a specific configuration that has been designed for a unique study goal. These approaches do not address all the real-world challenges of “continuous data collection” systems. As a result, there have been few discussions or reports about such issues that are faced when “implementing these platforms” in a practical situation. To address this, we have summarized our technical and user-centric findings from three lifelogging and Quantified Self data collection studies, which we have conducted in real-world settings, for both smartphones and smartwatches. In addition to (i) privacy and (ii) battery related issues; based on our findings we recommend further works to consider (iii) implementing multivariate reflection of the data; (iv) resolving the uncertainty and data loss; and (v) consider to minimize the manual intervention required by users. These findings have provided insights that can be used as a guideline for further Quantified Self or lifelogging studies.

1. Introduction

The advent of sensor rich pervasive devices, including smartphones and wearables, promises a significant shift in the paradigm of human behavior studies. As a result, this has led to the introduction of new concepts, such as the Quantified Self, and has allowed us to re-focus existing concepts such as lifelogging and wearable computing. Lifelogging can be defined as, “a form of pervasive computing, consisting of a unified digital record of the totality of an individual’s experiences, captured multi-modally through digital sensors and stored permanently as a personal multimedia archive” [1]. In other words, lifelogging allow us to capture, from a variety of data sources, rich information about our environment and ourselves [2] and has several use cases such as memory augmentation [3]. Quantified Self is a more general term that has been used for a movement to collect daily information, via digital devices. Lifelogging could be interpreted as a subset of Quantified Self.
Both smartphones and wearable devices (e.g., smartwatches) can be used to collect information on human behavior. However, wearable devices such as fitness trackers and smartwatches have two major advantages over smartphones: (i) they are constantly connected to the skin and (ii) their location on the body is fixed [4]. These features make them more capable than smartphones to collect physiological data, such as heart rate and physical activity.
Although wearable devices can be seen as an ideal platform to collect data, there have been few efforts that have explored this avenue of wrist mounted wearable data collection in comparison to smartphones. In contrast, several research efforts have benefited from collecting contextual information from users’ smartphones such as Eagle et al. [5], Aharony et al. [6], Kiukkonen et al. [7] and Wagner et al. [8]. One argument suggests, despite the success and market acceptability of wearables, these devices have a short lifespan, with some studies suggesting that many wearable users churn (abandon, or upgrade the device) after as little as six months [9]. An older argument suggests that both wearables and smartphones are too focused on data collection (continuous context sensing) and that there is a lack of compelling and useful applications or even efficient data visualization for end users [10]. Despite efforts in filtering the content to wearable displays and improving the usability of wearables [11], recent critiques on the usability of wearables [12], demonstrates that this argument could be still valid.
We believe the short lifespan of wearables [13] originates from a lack of meaningful reflection outlets and appropriate data analysis methods that result in applications that have not been widely accepted by the end-user. For example, existing tools often provide limited visualization mechanisms, such as single variable visualization, but users are seeking correlations between their activities [14]. Furthermore, there is a body of research that focuses on only analyzing single pieces of specific information, such as activity [15] and location recognition through mobile devices [16]. However, whilst they do provide promising results, these data analytical approaches are still not widely adopted in the end-user market.
In this article, we have provided our overview of the difficulties that researchers and developers may face while developing these systems. In doing so, we report on three lifelogging data collection studies that we have undertaken. Two of these studies utilized smartphones, where participants were required to install the lifelogging app UbiqLog [17] on their phones. These studies included fourteen different brands of phones, among 57 participants (three participants were repeated in both studies). The third study used a smartwatch, as an information collection tool to collect physical activity, location and self-reported mood.
During these studies, we have faced several common challenges, including user-centric and technical obstacles. As a result, this often forced a re-design of the data collection requirements on-the-fly or occasionally we have had to terminate the study (as was the case for the first study with smartphones). Therefore, we believe that by classifying and describing these challenges, it will be helpful for future research effort that involve personal information collection, such as the quantified self, lifelogging, and personal informatics.
Our studies were designed to collect a significant number of traces among users in an environment near to the real-world setting. In this context, we have (i) relied on participants’ devices, which are diverse in terms of different software and hardware configurations; (ii) participants are able to change the configuration of the data collection module and disable/enable a sensor, which is similar to the real world and no mandatory configuration is required (the next section describes more about our data collection tools); and (iii) we recruited volunteers with the understanding there will be no reward for their participation in the study. Therefore, volunteers who were generally interested in using such a system were recruited, with the goal to get closer to how users interact with these applications in the real world. One can argue that this approach would introduce some bias if those interested in the study are mainly not individuals with low IT skills. However, this is the same scenario when a user installs an application from the market. Moreover, our smartphone based study settings are much closer to the real-world settings than previous experiments, which hand over specific devices to users, or support the experiment with rewards [5,6,7].). However, due to the lack of wide availability of smartwatches at the time of running our studies, the smartwatch study hands over a device to the users.
This paper contributes by discussing the main findings of our studies as follows: (i) to reduce churn, it is useful if the developer can minimize the need for manual intervention, while continuously collecting information, even optional annotation. (ii) While mobile and wearable devices collect data, there is an element of uncertainty and data loss that originates from manual sensor configuration changes (e.g., disabling WiFi to preserve battery) or sensor quality (e.g., geographical coordinates read from Cell ID). This should be considered while analyzing the collected data. (iii) There is a lack of multivariate reflection methods to analyze the collected daily life information, e.g., visualizing incoming calls based on the location and time of the day. Privacy issues [18] and battery limitations [19,20] are important but known issues, and thus we do not list them as our novel findings. Nevertheless, we have tackled them from another perspective, which is worth further explanation. In particular, we have summarized these challenges in a single report, which we think could benefit the community and further research in this area.
The remainder of this paper is organized as follows: the next section describes the related work in the field. This is then followed by a description of our study materials and methods. Afterwards, we explore the challenges that the area faces. This is followed by discussions of our findings, before concluding.

2. Related Work

Here, we list related works from three different categories: wrist-mounted wearable data collection, smartphone data collection and quantified self user studies.

2.1. Wrist-Mounted Wearables

In comparison to smartphones, there have been fewer studies for collecting users’ data from smartwatches or wrist-mounted wearable devices. Such existing studies are not multipurpose and focus on specific use cases, such as electrodermal activity recognition [21], long term physical activity and sleep recognition [22], Parkinson diseases monitoring [23], eating habit tracking [24], indoor location estimation [25], and anomalous activity detection [26]. However, to our knowledge, these works do not provide a detailed discussion about the challenges of collecting the data for the experiments. Moreover, due to a lack of widely accepted wearable operating systems (at the time of our experiments), there was not a market for large-scale deployment of these approaches. Furthermore, these efforts were delivered to the user with specific pre-configured hardware.

2.2. Smartphone Data Collection

Several experiments have been undertaken that have utilized large-scale smartphone data collection. One of the first studies that has benefited from the use of smartphones, and has resulted in the formation of a dataset, was Reality Mining [5]. This approach relied on a customized version of an early smartphone, the Nokia N6600. Next to the Reality Mining dataset, the same group introduced SocialfMRI [6], which collected context sensing data and subjective input from users (e.g., Facebook activities) plus purchasing information, from 150 participants. Another well-known experiment is the Lausanne Data Collection Campaign [7], which uses another early version of a smartphone, the Nokia N95. It contains smartphone data of about 170 participants. As such, these efforts have (i) collected user data from the device (user-centric) as opposed from the network and (ii) provided some information about the method of this data collection.
Market deployment for smartphone data collection has recently gotten the attention of the community [8,26,27]. As a result, a new category of user experiment is emerging, which is based on market deployed data collection. An advantage of this approach is that these data collection experiments have been conducted in real-world settings and have benefited from a large number of users. For instance, Device Analyzer [8] has conducted the largest market-based mobile data collection, such as hardware settings, from approximately 23,000 Android devices. Since their focus is on large-scale data collection, they face challenges in scalability, consistency and privacy. Ferreira et al. [28] and Henze et al. [27] have both deployed their application into the market and describe their “lessons learned” for market deployment. For instance, they mention a lack of control over users, validity of their findings among lab settings and the users’ ranked impact on the installation of their application.
Similarly, our studies also rely on utilizing the phones of our users. As a result, we need to take into account restrictions and challenges that each phone brand poses, such as differences in operating systems. Although we have not undertaken our experiment through market deployment, we do have the advantage of collecting participant feedback through interviews. Having the chance to receive and analyze such feedback has enabled us to identify prominent challenges, such as multivariate reflection and manual intervention, which have not been uncovered in mass market deployment or previous research efforts. This advantage makes our study different than market deployment studies, which do not have a chance of interviewing users.
The most similar approach to our work is provided by Blanke et al. [29]. They describe lessons learned while collecting “location data” in large scales. For instance, they suggest best practices on marketing a data collection smartphone application with incentivizing elements such as friend finder and unlocking badges. Nevertheless, our approach is more holistic and not focused only on location data. Table 1 shows different sensor types that have been used for each device and study in our studies.
Table 1. Overview of the studies and their settings.
ExperimentSensorsManual Task/DataDurationNumber of Participants
mobileStd 1Application usage, Location (GPS), WiFi, Bluetooth, Activity, SMS, CallRemoving or Changing Data28 days25
mobileStd 2Application usage, Location (GPS), WiFi, Bluetooth, Activity, SMS, Call, Sleep, MoodMood, Sleep60 days35
watchStdPhysical Activity, Mood, LocationLocation, Mood32 days14

2.3. Quantified Self User Studies

In another group of work [30,31,32,33,34], Quantified Self application users have been the focus, as opposed to the device or underlying applications. For instance, Li et al. [30] provide one of the early works on the Quantified Self and try to understand users’ queries from a Quantified Self system, and how they get the answer and identify challenges. However, since that time new Quantified Self applications have emerged and recent work from Oh and Lee [31] and Choe et al. [32] both use available web documents in the quantifiedself.com repository. Choe et al. [32] have analyzed videos in that webpage to understand the motivations and challenges of Quantified Self users and categorize them. They acknowledge the lack of scientific rigor and the problem of too many things as the main challenges in Quantified Self technologies. Oh and Lee [31] have analyzed the motivation of using Quantified Self applications and also categorize users and challenges of existing systems based on user reviews in the www.quantifiedself.com forum. Rooksby et al. [33] characterize Quantified Self application users, based on what they are tracking. Fritz et al. [34] have studied the user’s experiences for those who use Fit-Bit activity tracking devices. Their focus has been on understanding users’ evolvement during this time (users who were not churned from the system).
Our work has two main differences: (i) Instead of focusing on the Quantified Self in general, we have focused on the specific Quantified Self “Data Collection” phase and thus our findings include technical challenges in addition to user-centric challenges. (ii) Unlike the aforementioned works, our users are new to the Quantified Self system and not already the user of these systems. Therefore, identified challenges do not belong only to users who are familiar to use these systems. Bargas-Avila and Hornbæk [35] provide a discussion about the importance of considering unfamiliar users while conducting a user study.
Nevertheless, there are some challenges that have not been analyzed in this paper. For instance, information access between different tools or exporting data to personal storage is still an ongoing discussion with personal information.

3. Materials and Methods

This section briefly describes the tools that have been utilized for our studies. Afterward, to give an overview about the data collection process, a summary for each study has also been included. In total, we have conducted three user studies. Two studies utilized the Android smartphones of the participants (mobileStd(s) 1 and 2) and the other study (watchStd) used a specific brand of smartwatch, with a customized version of the Android operating system, named i’m Droid. It is important to note that the objectives of mobileStd(s) are different than watchStd. In other words, there will be no unique generalizable hypothesis among our studies. In contrast, challenges and difficulties that we have encountered are common among these studies.

3.1. Study Instruments

For mobileStd(s) 1 and 2, we used UbiqLog [17]. UbiqLog [36] is an open source smartphone based lifelogging tool. It provides an interface that enables users to access the list of available sensors and also allows them to enable/disable specific sensors or even change the sampling interval. It also provides visualizations to users about their past activities. In particular, it includes Application usage, Calls, SMS, Physical Activity, Location traces, and Bluetooth proximity visualizations.
To preserve the users’ privacy, participants in mobileStd 1 could manipulate or remove the data before uploading it to the server. They could export their data and annonymize/pseduonymize them through a tool called LiDSec [37]. However, due to user feedback, mobileStd 2 performed the annonymization and pseudonymization process automatically, and thus there is no need for this type of intervention.
In terms of manual data entry, mobileStd 1 only requires manual data manipulation for the sake of privacy at the data at the end of the data collection phase. However, mobileStd 2 and watchStd both required manual data entry during the data collection phase. The manual interventions in mobileStd 2 are manual “mood” data entry and controlling the “sleep-monitoring” app, SleepBot [38]. SleepBot requires users to click a button while they go to sleep and click the wakeup button after waking up. mobileStd 2 uses Positive and Negative Affect Schedule (PANAS) [
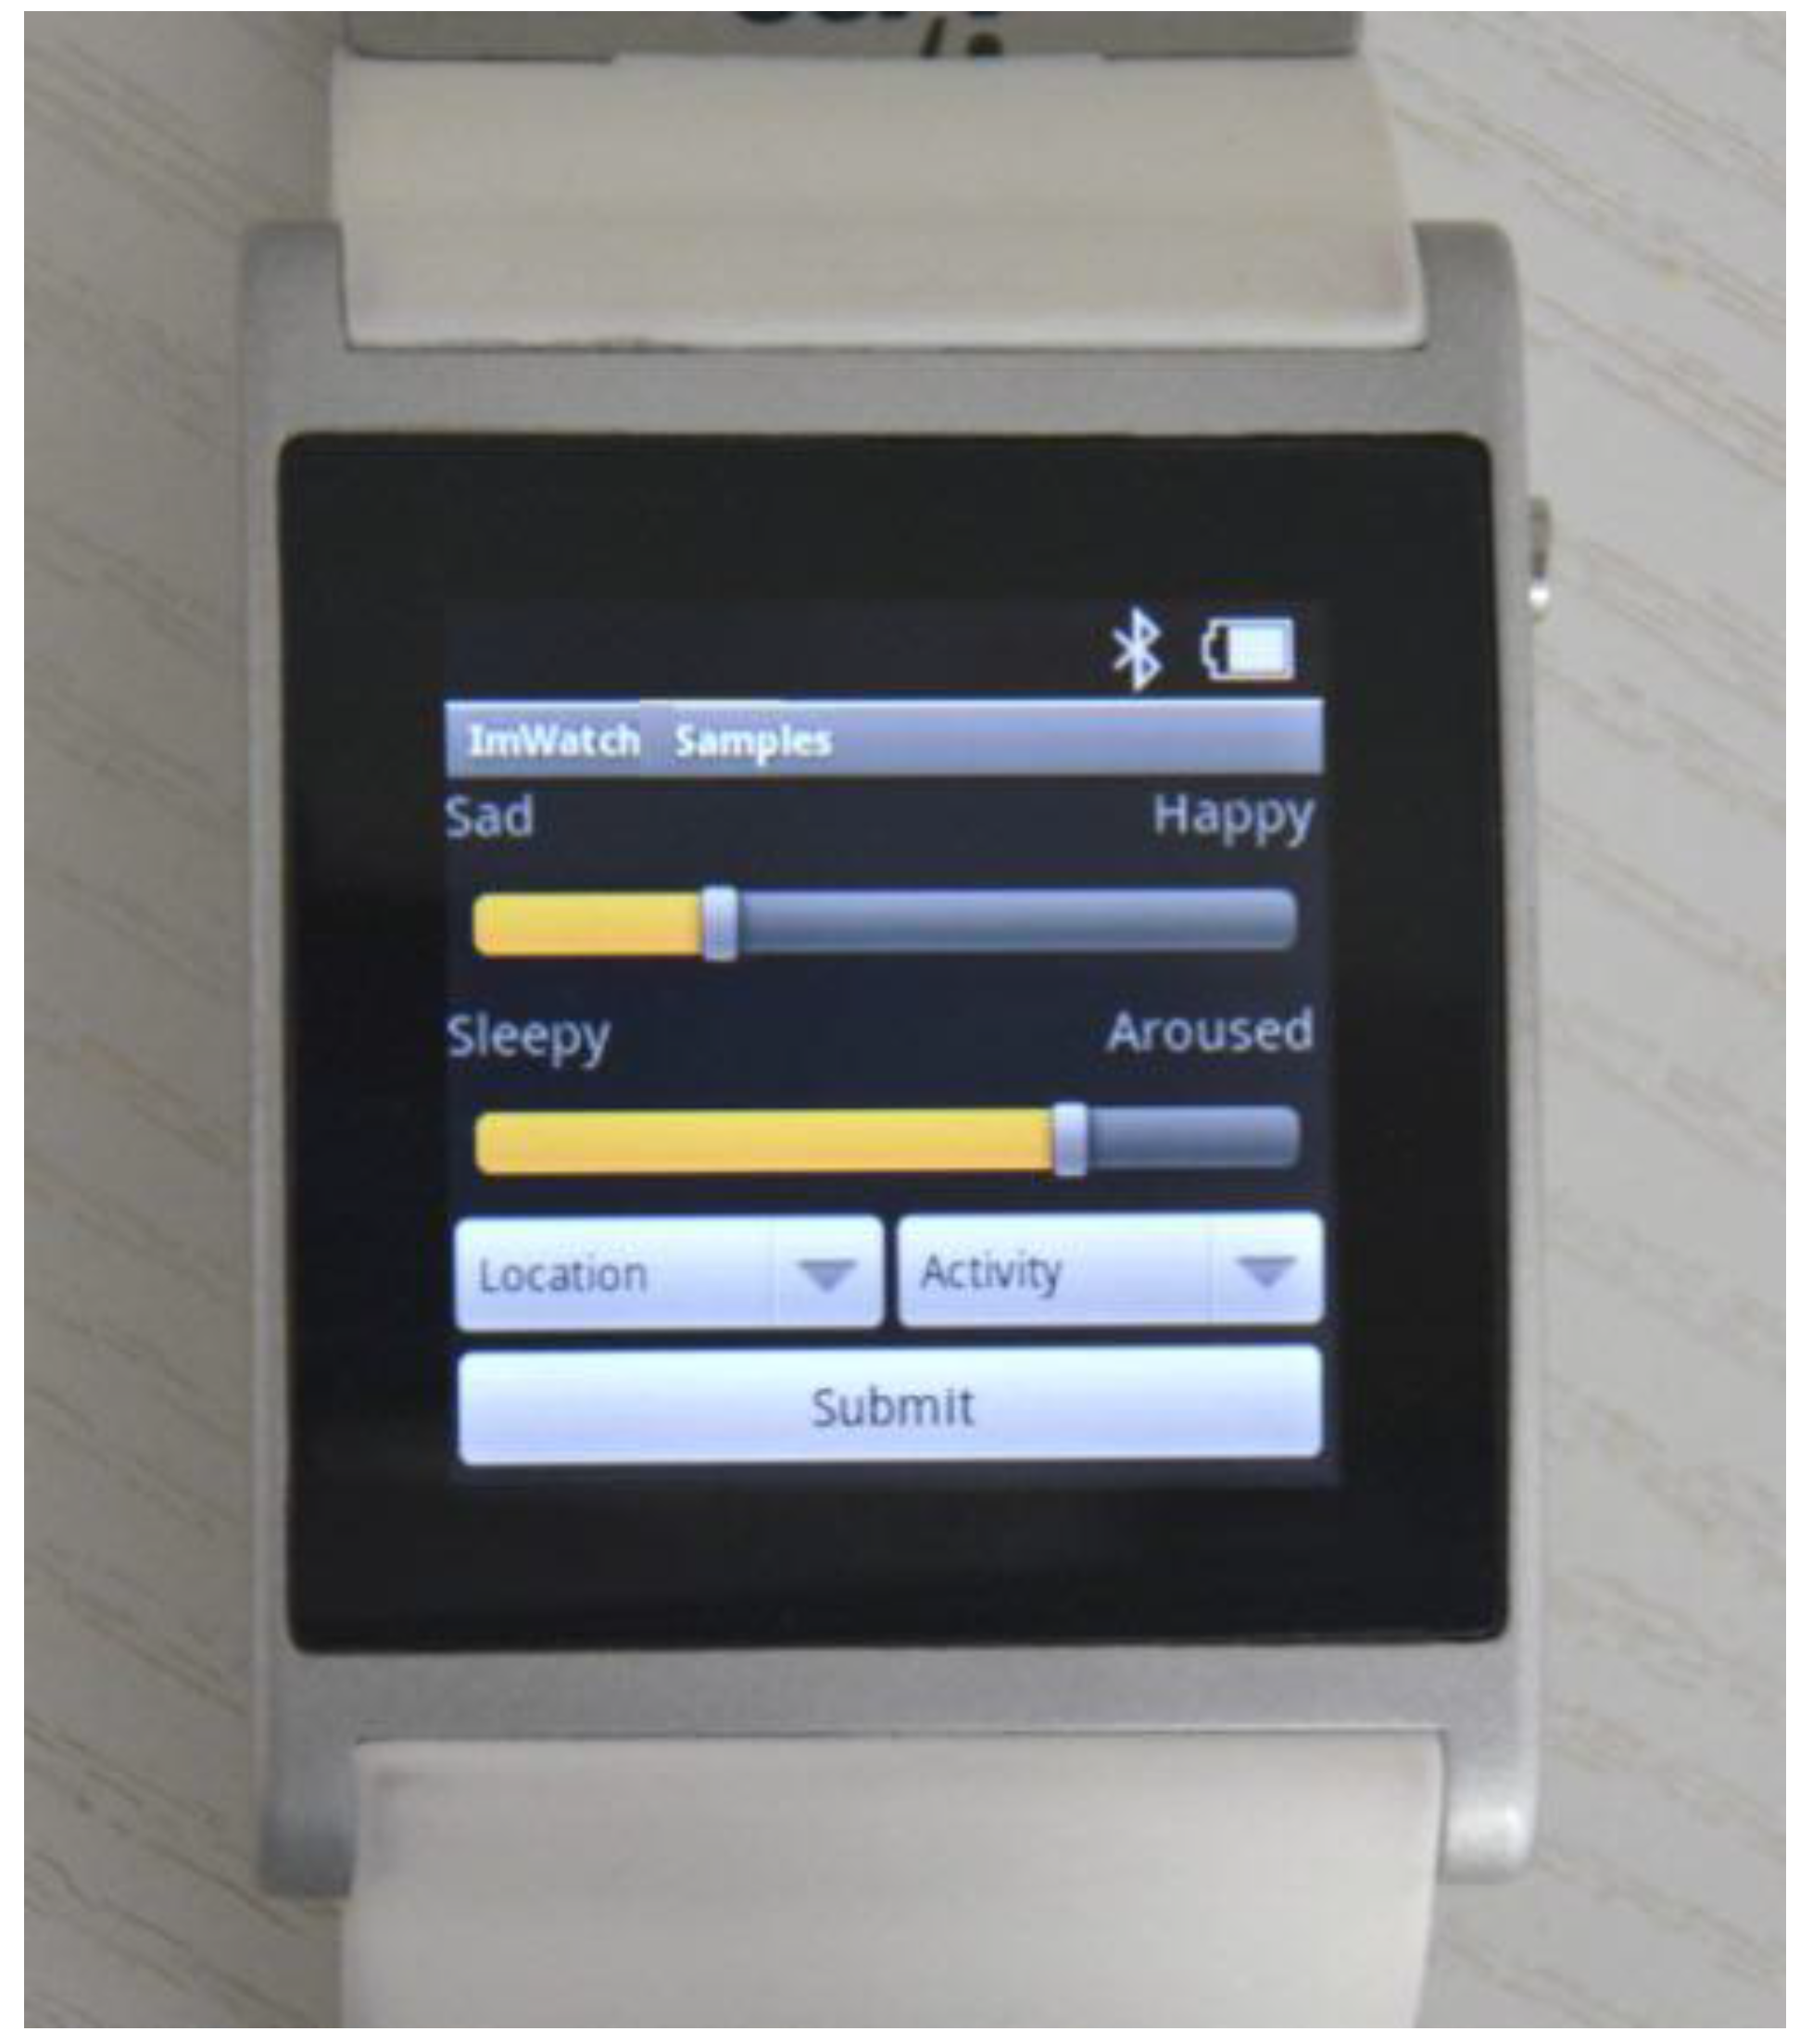
39] data collection protocol, which is used for describing emotion. Once a day, users were required to summarize their mood using the five terms from the given PANAS scale. Similarly, watchStd also asked users four times per day to explicitly enter their current mood, as well as location (home, work, leisure), and activity data. However, watchStd uses Circumplex affect model for manual mood data collection, due to the difficulties of PANAS scale terms, which will be explained later. In terms of data entry, for the watchStd study, a simple smartwatch data collection application has been implemented (see Figure 1).
As a development platform, we used i’m Watch smartwatch [40], as this was the only brand available at the time of development (2013 and early 2014). This device uses a custom built Android version of i’m Droid, and collects users’ moods and locations as explicit inputs within the users’ physical activities as implicit inputs. Physical activity terms are inspired by Google Play API services, and collected by using the accelerometer sensor, automatically. Mood annotation terms are adopted from the Circumplex affect model [41], with two orthogonal dimensions: pleasure (from sad to happy), and activeness (from sleepy to aroused). If the user shakes the watch, then a pop-up will appear to let them enter both mood and location manually.
Table 1 summarizes the data collection elements, the duration spent on collecting data, and the number of participants in each study. The Manual Task/Data column shows tasks or data entries that users should do manually.
Before the commencement of all studies, participants have been briefed about the privacy implications that they may face as a result of participating. In all instances, we have sought their agreement by the administration and signing of ethics consent forms.
Figure 1. Smartwatch manual data collection interface.
Jsan 04 00315 g001

3.2. Study Setup for mobileStd(s) 1 and 2

Objective: With the exception of camera images, one limitation for lifelogging research is the lack of robust data analytical methods [10]. Although a multi-sensor data collection applications has been deployed in the wild [29], there is still no open and accessible dataset available. As a result, this makes such experiments not deployable in the real-world, because in the real-world different people use different devices. It has been this distinct lack of a real-world dataset that motivates us to conduct both mobile phone based studies. We believe that a large dataset could benefit several mobile-based human-centric applications, such as personal transportation quantification, daily habit mining, health monitoring, etc. A preliminary requirement of these use cases is a set of data analytical methods. However, discussing such methods has not been the scope of this paper. We have described the need for such a dataset to volunteers and have also described Quantified Self systems (for the ones who are not familiar). We then requested that individuals who are interested in using lifelogging applications that collect/share their smartphone data to participate in our studies (with no reward).
As previously stated, mobileStd(s) 1 and 2 have utilized the UbiqLog application to collect data. In particular, these studies have created a large mobile phone lifelogging dataset with real-world settings. mobileStd 1 produced 6.1 million and mobileStd 2 produced about 9.8 million records of contextual information about the users. Each record represents a sample from the observation in the dataset, as opposed to just raw sensor data, such as raw accelerometer data. For instance, the following are two sample records:
{“Application”: {
“ProcessName”: “com.skype.raider”,
“start_time”: “15 October 2013 11:21:40 AM”, “end_time”: “15 October 2013 11:29:12 AM”,}}
{“SMS”: {“Address”: “9999999”, “Type”: “send”,
“Time”:“24 December 2013 11:23:01 PM”, “Body”: “anonymized”}}
Participants: The mobileStd study has been conducted twice, firstly with 25 participants, age range 19–22, (mean = 21.1, SD = 1.4) consisting of 18 females and 7 males, and secondly with 35 participants, again age range 19–32, (mean = 22.5, SD = 5.6) consisting of 25 females and 10 males. All participants were university students and volunteered to participate in the study. To simulate real-world deployment, mobileStd relies only on users who own a smartphone. Moreover, there is no reward for participation and we asked only for participants that volunteered. One major obstacle that we faced was the fragility of having a no reward study, and thus 19 participants withdrew from the study. We started mobileStd 2 study with 54 participants and by the end had 35 left. Moreover, mobileStd 1 started with 32 participants and when we terminated the study only 25 participants remained.
During the volunteer enrollment process, we described to them about the privacy implications and asked them to sign an ethical consent form, to give us access to their data.
Procedure: As previously stated, in order to collect the data, participants were required to install UbiqLog, on their phone. They were also required to report daily on their mood, via the PANAS scale [39], and use a sleep tracking app, SleepBot.
We repeated the study twice for two reasons: (i) Obtrusiveness of WiFi and Bluetooth sensors were turned on automatically by the application; and (ii) privacy issues that cause participants to leave the study and thus forced us to suspend the first study. Both reasons will be explained in more detail in the next section. This means that both mobileStd(s) 1 and 2 have unique motivations and objectives, but because of the aforementioned reasons, we have been forced to repeat the study.
After the second study, we conducted a short (10 to 15 min) semi-structured interview. During this time we asked the participants about their general experiences of using the app and how they might get a reflection of their data through visualizations. The interview text was then analyzed, through theme extraction [42], which assisted us in identifying challenges that were associated with the data collection.
Collecting mood and sleep data, was more challenging task. Due to the nature and burden of manually entering data, participants lacked motivation to complete these tasks. As a result, not enough data were able to be collected. Hence we cannot provide any argument for these types of information.

3.3. Study Setup for watchStd

Objective: As it has been previously stated, the ubiquity of smartwatches makes them an ideal candidate for continuously collecting vital signs and contextual information. Our objective in this study was to understand the correlation, if any, between three variables: mood, physical activity, and location. As such, the following study reports about the challenges and capabilities of using smartwatches for lifelogging. Therefore we have created and used the simple smartwatch app that has been described previously. Findings of this study have been used to create a resource efficient smartwatch framework for contextual data collection [20].
Participants: The watchStd study has been conducted on 14 participants, age range 20–44, mean = 33, and SD = 9.72. Eight participants were students (graduate students) and five were other professionals, such as business consultants, biologist and lecturers. Participant selection is based on a formative pilot study. This study enabled us to identify volunteers who would like to know more about the origins of their stress and the correlation of stress to other spatio-temporal factors. Moreover, participants believe quantifying their emotions, might improve their control over stressful situation.
Procedure: As previously stated, for this study we have implemented a simple smartwatch data collection application that has been described on the i’m Watch smartwatch. We lent each participant a smartwatch for a period of about 30 days. Although we have argued that restricting the experiment to a specific hardware brand limits the acceptability of the results in the real-world, at the time of running our study (2013 and early 2014) the only programmable watch available in the market of the target city was the i’m Watch. Therefore, unlike mobileStd, watchStd participants are not using their own device and the study is limited to using a specifically configured piece of hardware.
Similar to mobileStd 2, after the study we conducted a short (10 to 15 min) semi-structured interview to learn about the users’ experiences with using the watch and its data collection application. We then analyzed the interview text through theme extraction to identify challenges associated with smartwatch data collection.

4. Challenges

This section describes the challenges that we have identified in our watchStd and two mobileStd studies. We have grouped challenges into two categories: user-centric and technical. Most of these challenges originated from the mobileStd 1 and 2 rather than the watchStd. The reason could be attributed to the (i) duration of the study and the number of participants, which are larger in both mobileStd studies; and/or (ii) novelty of the smartwatch in the market and therefore lack of experience in using a watch, e.g., frequent charging of the device. In general, our findings are able to assist future wearable data collection approaches. More specifically, smartwatch approaches as they are becoming more popular, this will provide a more in-depth insight into the challenges that researchers are facing.

4.1. User-Centric Challenges

4.1.1. Manual Input and Intervention

Digital Sensors have not advanced enough to sense all aspects of our life. Therefore some data, such as valence of emotion [4], is required to be entered manually into these systems.
The results of mobileStd 2 illustrated that manually entering data resulted in users failing to provide their mood data (through PANAS). At the beginning of the mobileStd 2 study, seven out of 35 participants stopped providing their mood information. The main reasons they gave were: (i) the complexity of matching their mood with PANAS terms, (ii) the hassle of data entry, and (iii) forgetting to enter the data manually. As a result of such problems with the PANAS data entry system, this has prompted us to use the Circumplex affect model in watchStd, which is simpler.
Sleep data was even more restricted. During the first week of the study, 21 out of 35 participants agreed to share their sleep data and 14 participants churned (left the system). At the end, only two out of 35 participants provided a complete set of data, whilst two other participants provided less than 10 days’ worth of data (study duration was ~60 days). Participants who did not provide sleep data gave one of the following reasons: (i) privacy issues that they realized later during the study (although they have been briefed before the study); or (ii) they forgot to start and stop the sleep tracking application frequently. However, since UbiqLog performs unobtrusive sensing (no need for manual interaction), this feature enabled all participants to complete the study. In contrast, we have seen a significant churn in tasks that require manual intervention, such as providing mood and sleep tracking data. Figure 2 presents the number of participants that churned each week to provide mood information and using the sleep monitoring tool, in mobileStd 2. This figure does not cover participants that partially provided their data and only plots participants who churned from that part of experiment.
Figure 2. The number of participants who churned providing their mood or sleep data in mobileStd 2. This figure represents the problem of manual intervention requirements in a voluntary setting that participants will not receive reward while experimenting.
Jsan 04 00315 g002
In contrast to the mobile studies, watchStd did not have such churn problems. Users were motivated to use the app during the study and responded to the popup that appeared four times a day. The study comprised 14 users, four of which responded partially to mood and location data, and they continued until the end of experiment. Our post study interviews revealed that the reason for this motivation is because of a sense of responsibility was created among users, while keeping a device that is not owned by them. In simple words, having a device that they did not own created a sort of responsibility to provide the data, as opposed to just having software.
As a conclusion, we can argue that daily information collection, which requires users’ to manual input data, is not going to be accepted among the majority of users, unless there is a strong motivation or reward for it. In addition, we have learned that intervention in changing the sensor settings, i.e., enabling/disabling or asking users to explicitly change them (for improving the application operability) is not accepted among users.

4.1.2. Behavior Changes

The initial version of UbiqLog included visualizations. Five participants out of 25 (mobileStd 1) reported that they were impressed by these visualizations, and that they affected their behaviors. For instance, one participant reported that he changed his gaming habits after he had realized that he was spending more than two hours per day playing mobile games. In another example, a participant has asked for another installation of the UbiqLog to track her sister’s calls and SMS, to prove that she spends less time on these activities than her. However, since our goal is to identify the daily behavior of participants, and we do not intend to change their behavior, we have disabled all the visualizations in the mobileStd 2 study. It is important to note that the real system’s final goal, in most cases, is to change the users’ behavior, and thus reflection methods are necessary. However, our data collection focus was not on behavior changes. Therefore, we disabled such motivational elements (visualizations) in mobileStd 2.
Within the studies there are two parties involved in the collection of data: bystanders and users. Bystanders are defined as other individuals who appeared in the user’s dataset. Another issue worth mentioning is the behavioral changes that affected the bystanders (it is outward effect, such as bystanders changing the content of the SMS to the target user because of their own privacy). The person who is a subject of collecting data will benefit from inward effect, e.g., getting an insight into themselves. Except one case that has enabled the picture sensor, there is no report about outward effects or argument for data collection. Pictures are the most sensitive and probably valuable digital data assets. However, our studies did not cover pictures, because smartphones are not convenient enough to be used for continuous body mounted picture collection.

4.1.3. Privacy

Any system that records personal information is subject to privacy concerns. This problem makes the process of data collection and sharing cumbersome [43]. An issue that occurred with the mobileStd 1 was that data was sent to the server without being automatically anonymized. In this instance, users had to manually anonymize their own data before uploading it to our server. This occurred by using the wizard-based user interface tool described in [34]. This means that anonymization and/or pseudonymization was the concern of user. However, we observed in a few instances that SMS content and phone number, data that was uploaded to the server, illustrated that some users failed to apply the right pseudonymization, which is evidence for the complexity of the tool in terms of usability. Since the content of SMS can be considered as highly private and sensitive we had to remove the data from our server. Moreover, some participants chose to completely remove several information objects (i.e., app usage, SMS, Call and Location), which made their data unusable. Another problem in this study is the Bluetooth and WiFi sensing policy. In mobileStd 1, UbiqLog turns Bluetooth and Wi-Fi automatically on in six minute time intervals. It then scans the environment for 30 s and records the identified Bluetooth or WiFi devices that are near the participants, and turns off automatically. During the study, it was possible to manually disable any sensor and most users disabled the Bluetooth and WiFi scanners. Due to privacy reasons and battery issues, most participants kept their Bluetooth off or set it to invisible during the study. However, the introduction of Bluetooth 4.1 and Bluetooth Low Energy (BLE) protocol (which is more battery efficient in comparison to its previous versions) plus the need for a Bluetooth connection for smartwatches, could change the habit of turning off Bluetooth in the near future.
As a result of these issues, we have redesigned the sensing and anonymization components, and repeated the experiment. The second study (mobileStd 2) performs pseudonymization automatically on the phone, before uploading the files to the server. Likewise, the UbiqLog code has been changed so that it no longer starts WiFi or Bluetooth automatically. If they are available, then it will collect their data in six minute intervals. Otherwise, it waits until they are turned on again.
watchStd participants also shared their concerns about the privacy of their data, with 9/14 participants asking about the privacy of their information in the interview. They asked if they would be expected to not keep the identified correlation between mood and home location private (disregarded to the existence of any correlation) and about not handing over the collected data to a third party.
In summary, based on our findings we recommend that researchers: (i) train users about the sensor activity and the data they collect; (ii) preferably perform the privacy and security requirements automatically, since there is no guarantee that participants can perform them correctly themselves; and (iii) provide a clean and open data usage policy to users that enables them to choose whether they want to use the system. This is due to the fact that handing over the control to participants does not necessarily increasing their awareness about the information they are sharing.

4.2. Technical Challenges

4.2.1. Silent Sensing and Unobtrusiveness

UbiqLog has demonstrated to be resource efficient through a resource-benchmarking tool [44]. The first deployment of UbiqLog, i.e., mobileStd 1, raised some critiques that the application drains the battery quickly. With mobileStd 1, UbiqLog uses an icon on top of the status bar to indicate it is running. It also notified the user about the data being logged. In the next study we removed this icon, due to some critiques that it occupies too much of the status bar. Moreover, again due to users’ feedback, we changed the code to not turn on/off WiFi and Bluetooth automatically. If the user turns them on, then Ubiqlog recognizes the change and will start collecting information, otherwise it waits until they are turned on. Seven of the 25 participants using mobileStd 1 criticized the battery draining issue. This complaint reduced to six out of 35 users in the second run.
This leads us to suggest that the continuous sensing process should be silent and unobtrusive to satisfy users. In this instance, silence refers to not displaying a notification that asks the user to turn on a sensor, i.e., “Do you want to turn on location sensing?” Unobtrusive refers to not turning on/off a sensor from the application without the users’ consent.

4.2.2. Uncertainty and Data Loss

Participants who have used visualizations report the lack of precision in their data and significant data loss in both mobileStd 1 (12 from 25 participants) and mobileStd 2 (10 from 35 participants). Therefore, we investigated this issue and changed the UbiqLog code to make it open source, to have more community contribution. Opening the source code results in two new volunteers who have helped improving the code. We then performed the mobileStd 2 study. In this instance, the problem was not resolved completely but it has been improved. For instance, participants reported about the precision of location data (by checking the visualizations), which is evidence that the location sensor does not work well while it is running in the background and has no connection to the foreground user interface.
Since GPS consumes battery, Android OS suspends it, which resulted in data not being available 24/7. This has happened for other sensors too. For instance, when a user plays a 3D game, which is CPU intensive, many background services are suspended. Nevertheless, Android versions 2.0 and later provide START_STICKY service runs, which means if the service gets suspended, once the resources are available again the OS resumes the suspended service automatically. We used this type of service call in mobileStd 2, and this resulted in more data being available.
As stated by both Android and iOS documentation, the operating system suspends and kills background services while the CPU is under intensive processing or battery is low. Therefore, all or part of the sensing services will turn off. This illustrates that, within current mobile operating systems, there is no guarantee for a 24/7 sensing applications. We call this uncertainty from a data analytical perspective and uncertainty is the product of data loss.
Figure 3 provides an overview about the data availability, based on the time of day, for five sample sensors in mobileStd 2. Due to the large number of WiFi and location logs, we have removed them for the sake of readability. This figure also highlights the data unavailability at particular times of day (e.g., midnight), which corresponds to times when the phones were turned off. In other words, this figure shows 24/7 data analysis and reflection is not possible.
Figure 3. Overview of five sensor data for all users collected in mobileStd 2 based on time of the day.
Jsan 04 00315 g003
Uncertainty can be also perceived from Figure 4, which shows that there is no continuous data available during the day, even with Location and WiFi. Figure 4 can presents the data loss issue. There are continuous streams of location data during leisure time. However, during working hours there is no location data and WiFi available. WiFi data points are shown as blue triangles ( ) and locations are red dots ( ). A similar issue has been reported by watchStd too. As it has been described, users forget to enter data, and this introduces an uncertainty in the collected data.
Figure 4. Three days visualization of user lifelog data in mobileStd 2.
Jsan 04 00315 g004
Table 2. Identified challenges and their occurrences in each study.
Identified ChallengeCategory of ChallengeExperiment
Complicated PANAS mood data keyword selectionManual User InterventionmobileStd 2
Forgetting to enter mood dataManual User Intervention, Data UncertaintymobileStd 2, watchStd
Forgetting to enter sleep dataManual User Intervention, Data UncertaintymobileStd 2
Data loss due to device specificationsData UncertaintymobileStd 1, mobileStd 2
Lack of data in the proposed visualizationsData UncertaintymobileStd 1
Lack of data in the dataset logsData UncertaintymobileStd 2
Lack of a single visualization or reflection method for all collected dataMultivariate ReflectionmobileStd 1, mobileStd 2, watchStd
Forgetting to anonymize dataManual User Intervention, PrivacymobileStd 1
Forgetting to Enter Location or MoodManual User Intervention, Obtrusive sensingwatchStd
Constant notification iconObtrusive sensingmobileStd 1
Constant data collectionBatterymobileStd 1, mobileStd 2, watchStd
Sensitivity of sharing mood or sleep dataPrivacymobileStd 2
Not sharing correlation between mood and locationPrivacywatchStd
This issue is apparent in similar works as well. For instance, other experiments such as Dey et al. [45], which have used customized hardware, can only provide GPS or WiFi data 57% of the time. They report that the problem of phone proximity to users occurs approximately 88% of the time during the day. Additionally, Lee et al. [46] reports the lack of data precision in consumer market, even with fitness trackers. Meanwhile, Lane and Georgiev [47] propose to apply “deep learning” to overcome the challenge of uncertainty in contextual data.
Therefore, we can learn that with existing technologies and applications we cannot perform ideal continuous data collection 24/7, because of both manual intervention and sensor related issues. This reveals a need for data analytical approaches to “fill the gaps” of uncertainty and data loss.
Table 2 summarizes the challenges that have been described for the three aforementioned studies. These have been based on the post-study interviews of participant’s recommendation and concerns that have been raised during the interviews. Since “Behavior Changes” (Section 4.1.2) are not a challenge and usually the goal of a Quantified Self application is to promote behavior changes we do not list it in Table 2. Moreover, it is important to note we cannot prioritize challenges based on the number of repeats. For instance, both Battery and Multivariate Reflection challenges exist in all studies, but we report them only once in Table 2.

5. Discussion and Findings

We have conducted three studies that collect daily life information through devices capable of such a requirement; two were based on smartphones and one was based on smartwatches. These studies have helped us to identify the challenges associated with continuous data collection from pervasive mobile devices.
It is important to note that battery and privacy issues have been stated in other research, and we have faced them too. Since there has been an extensive amount of research that focuses on these two topics, we do not repeat them here. Although we do acknowledge that they exist, they have been described as our challenges because we have faced them from another perspective. Furthermore, we have only listed findings that are not yet widely explored, and that we believe are novel. Based on our identified challenges, we recommend that the following topics are important to consider for further analysis.

5.1. Resolving Uncertainty and Data Loss

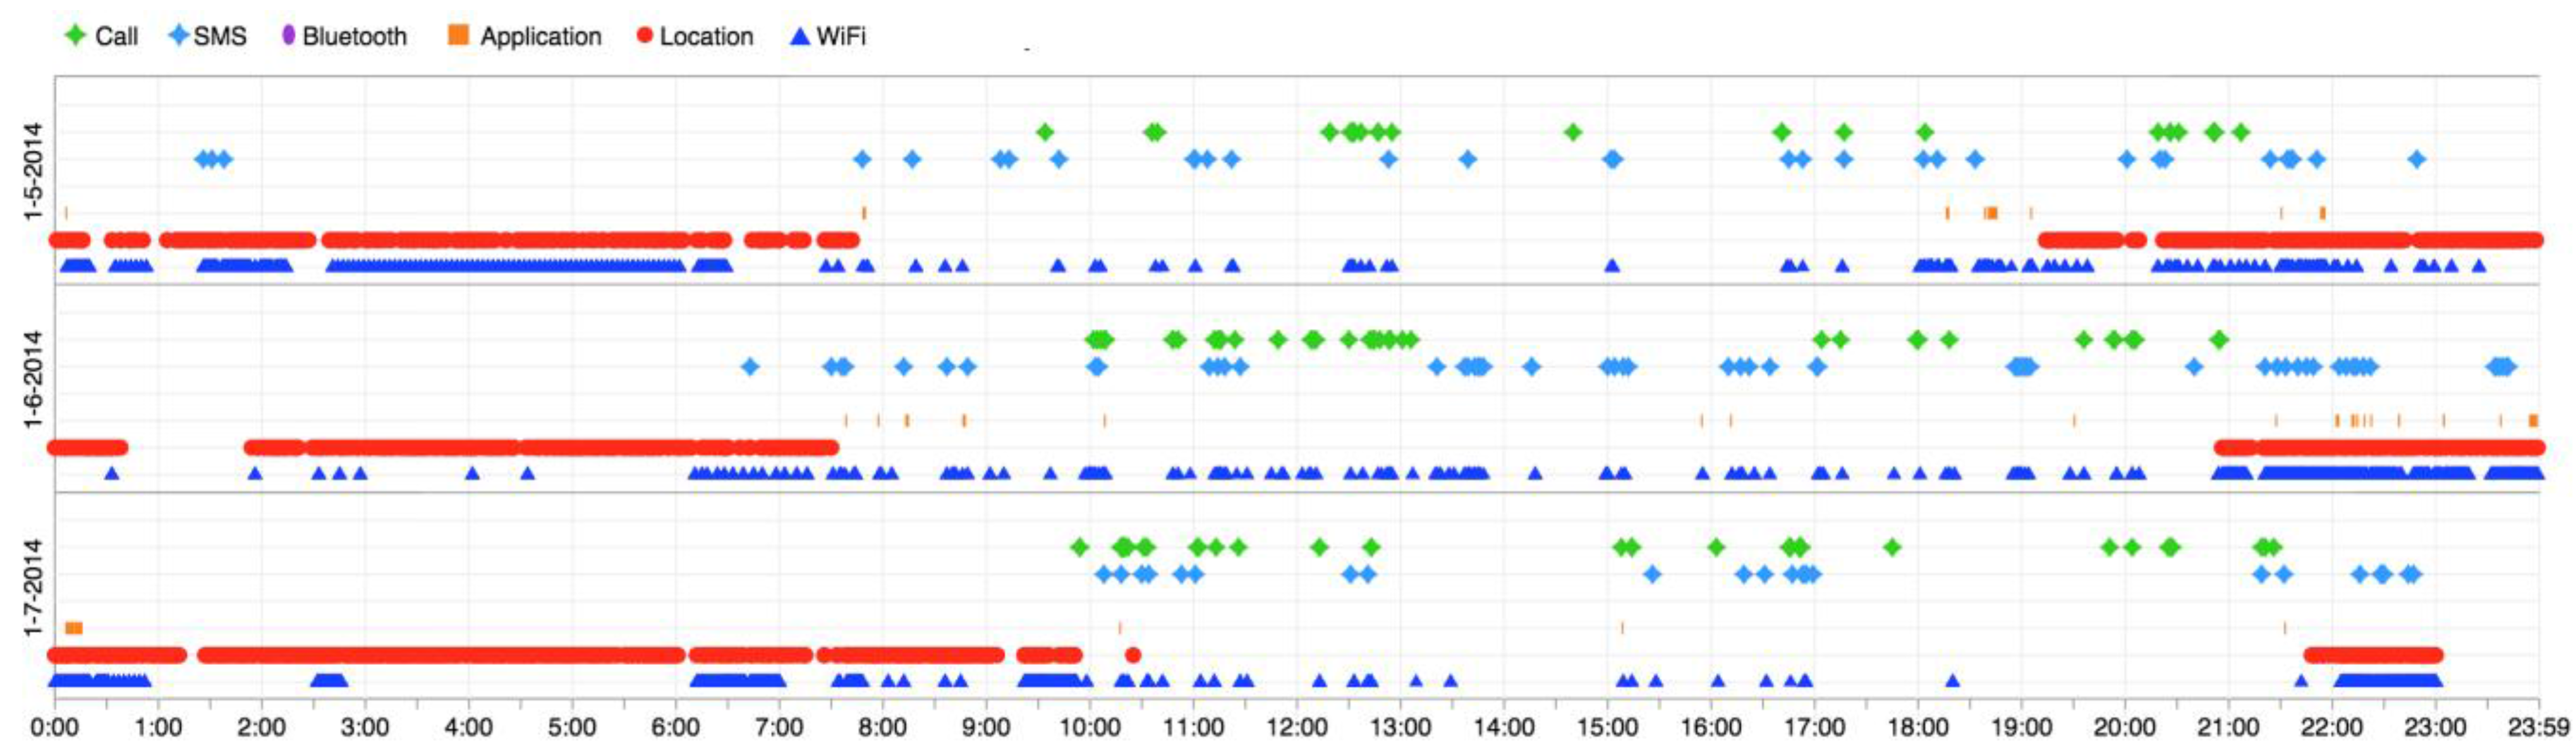
The three experimental studies that we have undertaken reveal that simply reading and storing the sensed information is not enough for collecting useful information about the user, unless it is not a specifically configured device with a guarantee about the quality of data. To have a realistic scenario, we need more rigorous data analysis methods to deal with the uncertainty of the data and to be able to estimate lost data. For instance, Figure 4 shows the WiFi and Location coordinates detected by a user in three days. As it can be seen, there are daily repetitive data points from location and WiFi sensors in approximately between 8:00 p.m. to 8:00 a.m. This could be fed into a data mining mechanism to augment the quality of the data and resolve the uncertainty, via levering the history. However, delving deeper into analyzing the data is not in the scope of this paper.
We also suggest other reflection methods. For example, visualizations should consider reflection with uncertainty and sparsity. This is due to the fact that uncertainty affects the reflection (visualization) too. For instance, when Cell-ID location coordinates are being used instead of GPS they cannot easily be shown on a map, due to 800–1000 m precision. Uncertainty of location data have been considered by some continuous context sensing applications such as Moves [48], but only for location data.

5.2. Minimizing Manual Intervention

Our studies show that users are not behaving according to our initial assumption when there is a requirement for manual intervention or they are able to manually change a sensor settings. For instance, the complexity of scientific mood data collection, such as PANAS, causes them to stop providing data. They also use a very small amount of words to describe their emotions. Furthermore, clicking a button for going to sleep and waking up is not widely accepted among users, unless there is a strong motivation behind it.
The same issue occurred in watchStd, with participants frequently forgetting to input their information. Manual input is also prone to errors and is subjective. There are still several Quantified Self efforts that rely on manual intervention [49]. We can argue that this is an open topic for these applications and even this could be one of the reasons of significant churn [9] from using wearable devices. The challenge of manual intervention has been recognized in some domain-specific user studies, such as food quantification [50]. However, we believe it should be considered in all user-centric data collection approaches, irrespective of the motivation of the data collection process.
Recently, Nintendo announced a “touchless” sleep monitoring device [51], which does not need manual user intervention while digitally tracking sleep. This illustrates the need to develop sensing devices with silent and unobtrusive sensing capabilities. In other words, manual input and controlling should be kept to a minimum.
However, since it is not always possible to completely remove manual intervention, persuasive approaches for manual intervention, such as incentification and gamifications, have been used by quantified self applications. For instance, Foursquare (Swarm) supports socializing manual check-ins and awards users with badges.

5.3. Multivariate Reflection

One of the reasons for suspending mobileStd 1 was due to a high interest of using Ubiqlog visualizations and its impact on users’ behavior. The interview session included questions about further improvements of such a system. One of the most received feedbacks was a need for multivariate visualizations (or other reflection methods). During theme extraction, nine of 25 participants answered the further improvement questions with a visualization that could show what they have done in each location and time. The watchStd participants also expressed a desire to have a system that can automatically predict their mood. In other words, participants were looking for a reflection method that shows them correlations between their mood and social activity or locations. For instance, if visualization used as a reflection method, it should provide different data objects in the same screen, similar to Figure 5a.
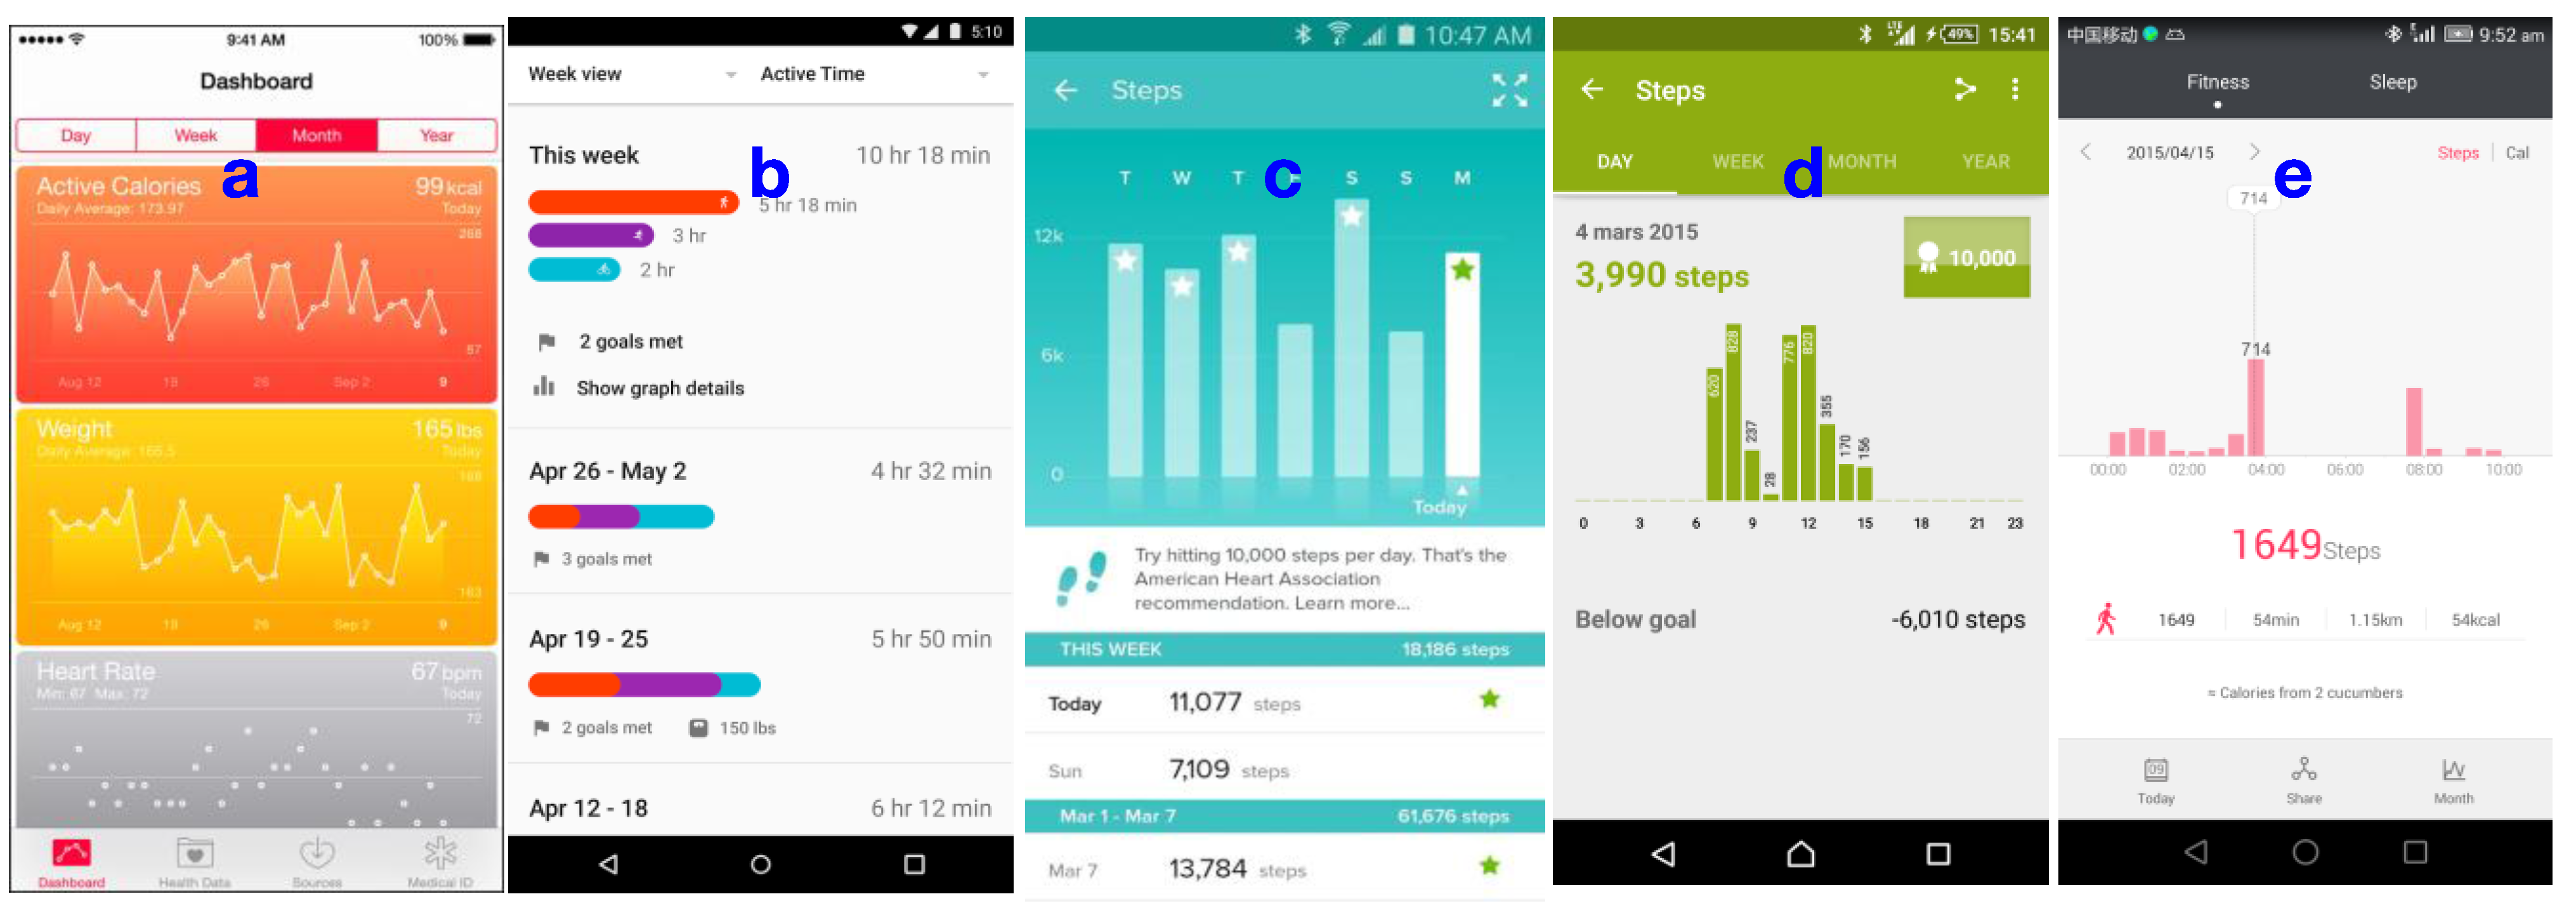
Figure 5 shows well-known activity tracking, Lifelogging and Quantified Self applications that are currently available in the market. Although all of the listed applications are capable of collecting more than one data object, except Apple Health, all of them provide a single variable visualization for historical data. For instance, Google API collects different forms of activities (running, walking, cycling, being inside vehicle, being still, heart rate), but visualizes only physical activities (partially multivariate) (Figure 5b). Fitbit collects both physical activity and sleep, but visualizes them separately (Figure 5c). Sony Lifelog collects physical activities, application usage, transport behavior, sleep, pictures taken, and communication, but its history-based visualization (retrospective view) only supports single variable visualizations (Figure 5d). Nevertheless, Sony Lifelog time-line visualization supports multivariable visualization but only for one day. Huawei wear is similar to Fitbit, it collects both physical activities and sleep, but supports only single variable visualization (e).
Figure 5. Five examples of Lifelogging and Quantified Self applications that are currently available in the market. (a) Apple Health; (b) Google Fit; (c) Fitbit; (d) Sony Lifelog; and (e) Huawei Wear. All of these applications are capable collecting data from multiple source of information, but only Apple Health provides multivariate visualization on its historical data. Google Fit also fuses different physical activities, but use separate visualizations for other data such as heart rate.
Jsan 04 00315 g005
Recently, the need to sense and analyze multiple information objects together has been identified. For instance, images in a Lifelogging scenario [18] were recorded with location, timestamps and annotations such as emotions of faces pictured. Based on the user feedback of nine individuals, we have identified two appropriate links to connect different sources of information together, i.e., time and location. However, since location is not always available, time could be used to link several information objects together. Figure 3 and Figure 4 are visualizations examples that are based on linking information objects through time.

6. Conclusions

In conclusion, due to the advent of sensor-rich wearable devices and the proliferation of smartphones, data collection and analysis approaches are becoming more popular and thus the field of lifelogging and quantified self are growing rapidly. This paper discusses the main novel findings of our studies from two perspectives of user-centric and technical as follows: (i) the need to minimize as much as possible manual interventions, including optional annotations, while collecting continuous information. In this instance, if users required to continuously input data they will churn from using the system. (ii) While mobile and wearable devices collect data, there is a level of uncertainty and data loss that originates from manual changes or sensor quality. This should be considered while analyzing the collected data. (iii) There is a lack of multivariate reflection methods to analyze the collected daily life information, e.g., visualizing incoming calls based on the location and time of the day. In addition, we have also encountered battery limitations and privacy issues. However, since they are not novel findings we did not list them as novel findings.
There are several quantified self or lifelogging applications that have been released in the market and suspended after few months. We believe that the challenges that we have identified play an important role in the suspension of those apps. We recommend that developers and researchers: (i) Consider reflections that are not based on a single variable. Instead, information objects should be linked through timestamps and/or locations, and the system should recognize the correlation between information objects automatically. (ii) Remove manual user interactions where possible. (iii) Resolve the problem of uncertainty and data loss through the continued use of data analysis and data mining methods. Perhaps data analysis should be done on the device so it is not affected by privacy and network issues that occur from handing over this process to the cloud. As a future work, we plan to analyze on device data analysis, its drawbacks and advantages versus traditional cloud data analysis.

Acknowledgments

Authors acknowledge Michael Pazzani and Eamonn Keogh for their helpful review. Moreover, authors acknowledge participants who have helped us in developing user studies without any reward.

Author Contributions

Reza Rawassizadeh drafted the idea, constructed the paper and conducted the smartphone user studies. Elaheh Momeni helped in drafting the paper and conducted the smartwatch user study. Chelsea Dobbins helped in improving text and drafting both smartphone and smartwatch user studies. Pejam Mirza-babaei helped in constructing both smartphone and smartwatch user studies. Ramin Rahnamoun prepared the platform for implementing the smartphone user study.

Conflicts of Interest

The authors declare no conflict of interest.

References

  1. Dodge, M.; Kitchin, R. Outlines of a world coming into existence: Pervasive computing and the ethics of forgetting. Environ. Plan. 2007, 34, 431–445. [Google Scholar] [CrossRef]
  2. Dobbins, C.; Merabti, M.; Fergus, P.; Llewellyn-Jones, D. Augmenting Human Digital Memories with Physiological Data. In Proceedings of the 3rd IEEE International Conference on Network Embedded Systems for Every Application (NESEA), Liverpool, UK, 13–14 December 2012; pp. 35–41.
  3. Dobbins, C.; Merabti, M.; Fergus, P.; Llewellyn-Jones, D. Capturing Human Digital Memories for Assisting Memory Recall. In Advances in Physiological Computing; Springer: London, UK, 2014; pp. 211–234. [Google Scholar]
  4. Rawassizadeh, R.; Price, B.A.; Petre, M. Wearables: Has the age of smartwatches finally arrived? Commun. ACM 2015, 58, 45–47. [Google Scholar] [CrossRef]
  5. Eagle, N.; Pentland, A. Reality mining: Sensing Complex Social Systems. Pers. Ubiquitous Comput. 2006, 10, 255–268. [Google Scholar] [CrossRef]
  6. Aharony, N.; Pan, W.; Ip, C.; Khayal, I.; Pentland, A. Social fMRI: Investigating and Shaping Social Mechanisms in the Real World. Pervasive Mob. Comput. 2011, 7, 643–659. [Google Scholar] [CrossRef]
  7. Kiukkonen, N.; Blom, J.; Dousse, O.; Gatica-Perez, D.; Laurila, J. Towards Rich Mobile Phone Datasets: Lausanne Data Collection Campaign. In Proceedings of the International Conference on Pervasive Services, Berlin, Germany, 13–15 July 2010.
  8. Wagner, D.T.; Rice, A.; Beresford, A.R. Device analyzer: Largescale Mobile Data Collection. ACM SIGMETRICS Perform. Eval. Rev. 2014, 41, 53–56. [Google Scholar] [CrossRef]
  9. Leger, D. Inside Wearables Part 2: A Look at the Uncertain Future of Smart Wearable Devices, and Five Industry Developments that Will Be Necessary for Meaningful Mass Market Adoption and Sustained Engagement; Technical Report; Endeavour Partners: Cambridge, MA, USA, 2014. [Google Scholar]
  10. Whittaker, S.; Kalnikaitė, V.; Petrelli, D.; Sellen, A.; Villar, N.; Bergman, O.; Clough, P.; Brockmeier, J. Socio-technical lifelogging: Deriving design principles for a future proof digital past. Hum. Comput. Interact. 2012, 27, 37–62. [Google Scholar]
  11. Hasan, M.; Kashyap, A.; Hristidis, V.; Tsotras, V. User Effort Minimization through Adaptive Diversification. In Proceedings of the 20th ACM SIGKDD International Conference on Knowledge Discovery and Data Mining, New York, NY, USA, 24–27 August 2014; pp. 203–212.
  12. Wearables are Totally Failing the People Who Need them Most. Available online: http://www.wired.com/2014/11/where-fitness-trackers-fail (accessed on 3 November 2015).
  13. Shih, P.C.; Han, K.; Poole, E.S.; Rosson, M.B.; Carroll, J.M. Use and Adoption Challenges of Wearable Activity Trackers. In Proceedings of the iConference, Newport Beach, CA, USA, 24–27 March 2015.
  14. Marcengo, A.; Rapp, A. Visualization of Human Behavior Data: The Quantified Self. In Innovative Approaches of Data Visualization and Visual Analytics; IGI Global: Hershey, PA, USA, 2013; pp. 236–265. [Google Scholar]
  15. Reiss, A.; Stricker, D. Personalized mobile physical activity recognition. In Proceedings of the 2013 International Symposium on Wearable Computers, Zurich, Switzerland, 8–12 September 2013; pp. 25–28.
  16. Bao, H.; Wong, W.C. A Novel Map-based Dead-Reckoning Algorithm for Indoor Localization. J. Sens. Actuator Netw. 2014, 3, 44–63. [Google Scholar] [CrossRef]
  17. Rawassizadeh, R.; Tomitsch, M.; Wac, K.; Tjoa, A.M. UbiqLog: A generic mobile phone-based life-log framework. Pers. Ubiquitous Comput. 2013, 17, 621–637. [Google Scholar] [CrossRef]
  18. Gurrin, C.; Smeaton, A.F.; Doherty, A.R. LifeLogging: Personal big data. Found. Trends Inform. Retr. 2014, 8, 1–125. [Google Scholar] [CrossRef]
  19. Chon, Y.; Wanchang, R.; Hojung, C. Predicting smartphone battery usage using cell tower ID monitoring. Pervasive Mob. Comput. 2014, 13, 99–110. [Google Scholar] [CrossRef]
  20. Rawassizadeh, R.; Tomitsch, M.; Nourizadeh, M.; Momeni, E.; Peery, A.; Ulanova, L.; Pazzani, M. Energy-Efficient Integration of Continuous Context Sensing and Prediction into Smartwatches. Sensors 2015, 15, 22616–22645. [Google Scholar] [CrossRef] [PubMed]
  21. Poh, M.Z.; Swenson, N.C.; Picard, R.W. A Wearable Sensor for Unobtrusive, Long-term Assessment of Electrodermal Activity. IEEE Trans. Biomed. Eng. 2007, 57, 1243–1252. [Google Scholar]
  22. Berlin, E.; Laerhoven, K.V. Detecting Leisure Activities with Dense Motif Discovery. In Proceedings of the 2012 ACM Conference on Ubiquitous Computing, Pittsburgh, PA, USA, 5–8 September 2012; pp. 250–259.
  23. Mankodiya, K.; de la Torre, F.; Zhang, A.; Ryan, N.; Ton, T.G.; Ganhdi, R.; Jain, S. SPARK: Personalized Parkinson Disease Interventions through Synergy between a Smartphone and a Smartwatch. In Design, User Experience, and Usability. User Experience Design for Everyday Life Applications and Services; Springer International Publishing: Crete, Greece, 2014; pp. 103–114. [Google Scholar]
  24. Dong, Y.; Hoover, A.; Scisco, J.; Muth, E. A new method for measuring meal intake in humans via automated wrist motion tracking. Appl. Psychophysiol. Biofeedback 2012, 37, 205–215. [Google Scholar] [CrossRef] [PubMed]
  25. Maurer, U.; Rowe, A.; Smailagic, A.; Siewiorek, D.P. eWatch: A wearable sensor and notification platform. In Proceedings of the IEEE Workshop on Wearable and Implantable Body Sensor Networks, Cambridge, MA, USA, 3–5 April 2006.
  26. Begum, N.; Keogh, E. Rare Time Series Motif Discovery from Unbounded Streams. Proc. VLDB Endow. 2014, 8, 149–160. [Google Scholar] [CrossRef]
  27. Henze, N.; Poppinga, B.; Pielot, M.; Schinke, T.; Boll, S. My app is an experiment: Experience from user studies in mobile app stores. Int. J. Mob. Hum. Comput. Interact. 2011, 3. [Google Scholar] [CrossRef]
  28. Ferreira, D.; Kostakos, V.; Dey, A.K. Lessons learned from large-scale user studies: Using android market as a source of data. Int. J. Mob. Hum. Comput. Interact. 2012, 4, 28–43. [Google Scholar] [CrossRef]
  29. Blanke, U.; Troster, G.; Franke, T.; Lukowicz, P. Capturing crowd dynamics at large scale events using participatory GPS-localization. In Proceedings of the International Conference on Intelligent Sensors, Sensor Networks and Information Processing, Singapore, 21–24 April 2014; pp. 1–7.
  30. Li, I.; Dey, A.K.; Forlizzi, J. Understanding my Data, Myself: Supporting Self-Reflection with Ubicomp Technologies. In Proceedings of the 13th International Conference on Ubiquitous Computing, Beijing, China, 17–21 September 2011; pp. 405–414.
  31. Oh, J.; Lee, U. Exploring UX issues in Quantified Self technologies. In Proceedings of the Eighth International Conference on Mobile Computing and Ubiquitous Networking (ICMU), Hakodate, Japan, 20–22 January 2015; pp. 53–59.
  32. Choe, E.K.; Lee, N.B.; Lee, B.; Pratt, W.; Kientz, J.A. Understanding Quantified-Selfers’ Practices in Collecting and Exploring Personal Data. In Proceedings of the 32nd Annual ACM Conference on Human Factors in Computing Systems, Toronto, ON, Canada, 26 April–1 May 2014; pp. 1143–1152.
  33. Rooksby, J.; Rost, M.; Morrison, A.; Chalmers, M.C. Personal Tracking as Lived Informatics. In Proceedings of the 32nd Annual ACM Conference on Human Factors in Computing Systems, Toronto, ON, Canada, 26 April–1 May 2014; pp. 1163–1172.
  34. Fritz, T.; Huang, E.M.; Murphy, G.C.; Zimmermann, T. Persuasive technology in the real world: A study of long-term use of activity sensing devices for fitness. In Proceedings of the SIGCHI Conference on Human Factors in Computing Systems, Toronto, ON, Canada, 26 April–1 May 2014; pp. 487–496.
  35. Bargas-Avila, J.; Hornbæk, K. Foci and Blind Spots in User Experience Research. ACM Interact. 2012, 19, 24–27. [Google Scholar]
  36. UbiqLog. Available online: http://github.com/rezar/ubiqlog (accessed on 3 November 2015).
  37. Rawassizadeh, R.; Heurix, J.; Khosravipour, S.; Tjoa, A.M. LiDSec—A Lightweight Pseudonymization Approach for Privacy-Preserving Publishing of Textual Personal Information. In Proceedings of the Sixth International Conference on Availability, Reliability and Security, Vienna, Austria, 22–26 August 2011; pp. 603–608.
  38. SleepBot. Available online: http://mysleepbot.com (accessed on 3 November 2015).
  39. Watson, D.; Lee, A.C.; Auke, T. Development and validation of brief measures of positive and negative affect: The PANAS scales. J. Personal. Soc. Psychol. 1998, 54, 1063–1070. [Google Scholar] [CrossRef]
  40. I’m Watch smartwatch. Available online: http://www.imsmart.com (accessed on 3 November 2015).
  41. Russell, J.A. A Circumplex Model of Affect. J. Personal. Soc. Psychol. 1980, 39, 1161–1178. [Google Scholar] [CrossRef]
  42. Paradis, F.; Berrut, C. Experiments with theme extraction in explanatory texts. In Proceedings of the Second International Conference on Conceptions of Library and Information Science, CoLIS, Copenhagen, Denmark, 13–16 October 1996; pp. 433–437.
  43. Rawassizadeh, R. Towards sharing life-log information with society. Behav. Inform. Technol. 2012, 31, 1057–1067. [Google Scholar] [CrossRef]
  44. Rawassizadeh, R. Mobile application benchmarking based on the resource usage monitoring. Int. J. Mob. Comput. Multimed. Commun. 2009, 1, 64–75. [Google Scholar] [CrossRef]
  45. Dey, A.K.; Wac, K.; Ferreira, D.; Tassini, K.; Hong, J.H.; Ramos, J. Getting closer: An empirical investigation of the proximity of user to their smart phones. In Proceedings of the 13th International Conference on Ubiquitous Computing, Beijing, China, 17–21 September 2011; pp. 163–172.
  46. Lee, J.M.; Youngwon, K.; Gregory, J.W. Validity of Consumer-based Physical Activity Monitors. Med. Sci. Sports Exerc. 2014, 46, 1840–1848. [Google Scholar] [CrossRef] [PubMed]
  47. Lane, N.D.; Georgiev, P. Can Deep Learning Revolutionize Mobile Sensing? In Proceedings of the 16th International Workshop on Mobile Computing Systems and Applications, Santa Fe, NM, USA, 12–13 February 2015; pp. 117–122.
  48. Moves. Available online: http://movestheapp.com (accessed on 3 November 2015).
  49. Swan, M. Sensor mania! The internet of things, wearable computing, objective metrics, and the quantified self 2.0. J. Sens. Actuator Netw. 2012, 1, 217–213. [Google Scholar] [CrossRef]
  50. Cordeiro, F.; Epstein, D.A.; Thomaz, E.; Bales, E.; Jagannathan, A.K.; Abowd, G.D.; Fogarty, J. Barriers and Negative Nudges: Exploring Challenges in Food Journaling. In Proceedings of the 33rd Annual ACM Conference on Human Factors in Computing Systems, Seoul, Korea, 18–23 April 2015; pp. 1159–1162.
  51. Sleep Monitoring Device. Available online: http:// www.wired.com/2014/10/nintendo-sleep-qol-health (accessed on 3 November 2015).

