A Social Environmental Sensor Network Integrated within a Web GIS Platform


1
Department of Informatics, Ionian University, 7 Tsirigoti Square, 49100 Corfu, Greece
2
Institute of Informatics and Telecommunications, NCSR Demokritos, Neapoleos 10, 15310 Ag. Paraskevi, Greece
*
Author to whom correspondence should be addressed.
J. Sens. Actuator Netw. 2017, 6(4), 27; https://doi.org/10.3390/jsan6040027
Submission received: 1 October 2017
/
Revised: 5 November 2017
/
Accepted: 15 November 2017
/
Published: 21 November 2017
(This article belongs to the Special Issue Sensors and Actuators in Smart Cities)
Abstract
:We live in an era where typical measures towards the mitigation of environmental degradation follow the identification and recording of natural parameters closely associated with it. In addition, current scientific knowledge on the one hand may be applied to minimize the environmental impact of anthropogenic activities, whereas informatics on the other, playing a key role in this ecosystem, do offer new ways of implementing complex scientific processes regarding the collection, aggregation and analysis of data concerning environmental parameters. Furthermore, another related aspect to consider is the fact that almost all relevant data recordings are influenced by their given spatial characteristics. Taking all aforementioned inputs into account, managing such a great amount of complex and remote data requires specific digital structures; these structures are typically deployed over the Web on an attempt to capitalize existing open software platforms and modern developments of hardware technology. In this paper we present an effort to provide a technical solution based on sensing devices that are based on the well-known Arduino platform and operate continuously for gathering and transmitting of environmental state information. Controls, user interface and extensions of the proposed project rely on the Android mobile device platform (both from the software and hardware side). Finally, a crucial novel aspect of our work is the fact that all herein gathered data carry spatial information, which is rather fundamental for the successful correlation between pollutants and their place of origin. The latter is implemented by an interactive Web GIS platform operating oversight in situ and on a timeline basis.
1. Introduction
The methodology of identifying and recording natural parameters is straightly connected to environmental degradation, while modern technological achievements have created new prospects of interaction between human and their living environment [1]. Technological solutions derive from complex scientific processes, which offer integrity, scientific relevance and applied continuously could also serve as a stepping stone to minimize environmental impact [2]. The increased accessibility to cutting edge technologies and the variety of skill-set held by the average citizen, generate prospects of novel methodology for protecting and preserving the environment. This study focuses on the development of a prototype platform that records the environmental state of any given place. Open-source technologies (software and hardware) are playing a pivotal role on the implementation of the platform. More specifically, the proposed platform is supported by recording devices based on the Arduino family of boards. Code development take place at all stages of the project and have been implemented exclusively through open-source applications. The monitoring device is calibrated prior deployment, taking into consideration the parameters of each component (software and hardware).
The scarcity and degradation of renewable or non-renewable natural resources are signaling disturbances in the planet’s geochemical cycles as well as the reduction of biological diversity and genetic stock [3]. Human activities are characterized as the main source of climate change [4]. It is commonly accepted that the ecosystems of major cities have played an important role on the environmental crisis due to the unceasing accumulation of population within them. Moreover, cities present particular vulnerabilities to climate change and its effects [4]. The multidimensional concept of a human’s Quality of Life (QoL) [5] is shaped, among others, by the perceived environmental nuisance, under subjective criteria. QoL deals with the study and documentation of the concept of quality of everyday life, through the synergy of both subjective and objective criteria.
Enriching human activities with technological solutions may act as a springboard to minimize environmental impacts on everyday life. Towards this goal, one of the most promising, yet affordable solutions is the concept of the “Internet-of-Things” (IoT) [6]. IoT denotes the computerization and the utilization of everyday digital objects for the further enrichment of Internet data. It presents new means of interaction between man, machines and computers, indicating natural and essential modus operandi for humans and their environment. Moreover, recent advances in the fields of electronics have allowed consumer mobile Internet-enabled devices (e.g., smart-phones, tablets, smart-watches, etc.) to be equipped or even expandable with numerous features, that allow or facilitate interdisciplinary applications related to human and natural activities. The embodiment of GPS receivers within the aforementioned devices, the usage of novel methods of analytics, as well as means of presentation of geographical data have keenly contributed on broadening environmental science applications in conjunction with the advanced computing.
Finally, the notion of “participatory sensing” [7] has allowed the contribution and access of individuals and or groups to a single core knowledge, allowing users to become active members within digital communities. The rapid growth of computing power on mobile devices has realized large scale environmental sensing, mainly through broad access and visualization provided by web GIS applications.
The herein presented research methodology includes both design and implementation steps. Principles of environmental monitoring [1] guide the deterministic modeling that encloses certain research variables of the case study [8]. In addition to the theoretical approach, software structures are designed according to the system’s demand. Accurate environmental sensing depends on the appropriate design and function of hardware elements. Furthermore, communication infrastructure is essential for seamlessly feeding the system from end to end. Subsequently, the recording device is manufactured according to the type of studied physical quantities and networking restrictions. The device needs to be developed and calibrated accordingly in order to follow the system’s standardized procedures. Further visualization and analysis is essential to this work because in order to locate and possibly recognize sources of environmental degradation. This purpose serves a Geographic Information System (GIS) platform which is integrated to a web interface developed specifically for this study.
The rest of this paper is organized as follows: In Section 2, we present related research work concerning various applications of remote sensor networks. Then, in Section 3, we present the details regarding hardware components that have been used. Section 4 presents in detail the implementation framework of the of the proposed platform. Results that occurred upon the deployment of the platform into real-life use cases are presented in Section 5 and the proof-of-concept is laid out in Section 6. Finally, the discussion regarding the conclusions and future prospects of the proposed framework is presented in Section 7.
2. Related Work
Recent technology advancements have driven Wireless Sensor Network (WSN) systems to become a feasible solution for many innovative applications [9,10]. Several systems that rely on low-power embedded micro-controller platforms have been proposed [9,11]. Such systems make use of the digital and analog I/O ports of platforms for sensor extensions alongside with custom or open source software components. For instance, Ferdoush and Li [10] proposed a system based upon several hardware and software elements. They focused on the development and integration processes. The overall architecture of their system included a base station and a number of distributed wireless sensor nodes. On the hardware side, both nodes and the base station are developed in an assemblage of micro-controllers (uC), a radio transceiver and an environmental sensor measuring humidity and temperature. Specifically, base stations are implemented using a Raspberry Pi Model B [11], taking advantage of its advanced processing capabilities compared to the Arduino Uno [12], which has been used to incorporate the sensors. Connectivity is established with the help of XBee Pro S2B module [13] Data manipulation is performed by applications that have been installed in both sensors and base station. A gateway application that has been installed in the micro-controllers assists the on-board functionality and acts as an intermediate for the sensor network and the MySQL database. Furthermore, the whole system is monitored by a web application which is controlled by the end user and offers data visualization capabilities. Overall, the system proposed by Ferdoush and Li is low cost, compact and could be easily managed with reduced complexity. On the other hand it has only been deployed for indoor monitoring of temperature and relative humidity and the end user is provided with low data visualization capabilities. Although it shares several fundamental characteristics with our proposed system, we believe that it is strongly differentiated on many aspects. Within our approach, communication is based on Bluetooth protocol and GPRS/WiFi connectivity. Moreover, our approach is structured around cloud computing services and its main aspect is the transmission of produced environmental information; i.e., it has been designed for outdoor use producing seven environmental variables. Finally, our approach strongly focuses on spatial characteristics of natural phenomena and we integrate this on every aspect of our deployment.
Similarly, Kumar and Kumaraswamy [14] developed a WSN using open-source hardware platforms for small-scale ecological monitoring and knowledge collection. Both Raspberry pi and a microcontroller were used as a sensor node and base station setup. Each node has embedded software capable to handle recordings to the base station, which is supported by a user friendly web application. Communication is executed by ZigBee protocol (IEEE 802.15.4 standard), which complies to three types of network topology (star, cluster-tree and mesh). Their proposal is adaptive to many ecological monitoring applications due to its compatibility with several open source hardware and software platforms.
Indoor Environmental Quality (IEQ) is a concept which concerns the work of Salamone et al. [15]. Therein, a WSN has been developed on the purpose of aggregating a set of different categories of comfort, well-being and satisfaction of users of buildings. Sensor nodes were based on an Arduino Uno and monitored air speed, radiant temperature, luminosity and CO2. Their system, namely nEmOs project, is implemented for recurrence monitoring and improvement of conditions and energy efficiency of buildings. The network’s communication is based on WiFi and sensor readings are sent to the Xively [16] cloud service. The notion of base stations is not adopted; instead, an Android App has been developed for the purposes of data distribution and node management. Comparison of the proposed sensor nodes with existing commercial tools indicated a difference of more than 5% in accuracy. Overall, nEmOs may be characterized as a useful monitoring model for confined spaces. The main differences with the proposed system is that contains further sensing complexity which is also applied outdoors. However both approaches aim at the estimation of environmental quality through a series of low cost and open source tools.
The direction of sensing the natural outdoor environment has been adopted by [9]. Their work refers to small distance dense deployment strategy of automated early fire detection through cluster distributed sensor nodes operating with low energy demands. The sensors are deployed to fixed positions in forest areas, feeding base stations (cluster-heads) with specific metrics, which, on their turn, forward the gathered information to a data sink. Network topology includes “adaptive mechanisms” related to fire detection and uses both flat and hierarchical structure. An important technical aspect of the project is the correlation between energy consumption and network performance due to the remote exposure of sensors in adverse conditions. This is achieved by sensing temperature and humidity fluctuations that point out fire threat. An integrated automated monitoring system that relies on network design and implementation has been implemented. It showcases the depth of functional capabilities in automated sensing methodology. The data used are spatial aware and obtain specific fixed positions in the research area. From our perspective, geographical location offers correlated information regarding location and time depending on the environmental aspect in question (humidity or temperature). Likewise, user related capabilities of event aware sensors offer reactive mechanisms. In the proposed system, nodes adjust their sensing parameters according to spatial transitions and warn the end user for abnormal or dangerous fluctuations of the environmental quality.
Sensor related applications and services in automotive vehicles is a direction followed by corporate industries [17]. A moving vehicle can be a source of sensory data that are difficulty acquired by a single system or network. Produced variables benefit drivers and third parties gathering information for environment monitoring, passenger awareness and vehicle operation. Sensory data derive from embedded hardware and network functions supported by vehicles ECU (Electronic Control Unit) and are supported by Global Positioning System’s (GPS) operation. The dissemination of data support further implementation on urban and public sensing provide benefits to global information sharing and access with the aid of mobile phones and handled devices, opening novel application domains. Automated environmental data generation through vehicles may considerably widen the source of sensing data while enabling further development of supporting infrastructures (e.g., networking). Built in sensing in vehicles fails to support hardware customization due to restricted production. Nevertheless, social aware passengers convey the potential expansion of environmental sensing inter-connectivity by integrating portable sensor technology into vehicle capabilities [18].
Precision agriculture is a wealthy field of application for automated monitoring as it has been highlighted by both Srbinova et al. [19] and Keshtgary and Delijoo [20] which have both developed WSN systems for improved quality in farming. They both followed the common WSN schema of nodes and base stations while showcasing efficient processes of gathering and distributing environmental parameters. Both studies engaged into the structure of network topologies, attempting to optimize quality in arable areas. More specifically, Srbinova et al. used communication protocols with low connection rates based on energy efficient time frames. Also, Keshtgary and Delijoo concentrated on the creation of performance metric typeset for a bivariate topological model. The initial iteration locates nodes at edge of each field and the latter distributes them randomly. Precision agriculture through WSN distinguishes external factors of monitoring to provide profundity on this field of study. Sensor networks require input from complementary components to complete monitoring and operational routines such as an irrigation system to control water level and humidity.
Hur and Eisenstadt [21] proposed a “low power wireless monitoring system” for mosquito and pathogen related research. The system’s purpose is to transmit information regarding humidity, temperature, wind speed and direction and location data for better control of mosquito populations and to prevent the spread related diseases. They’ve deployed a set of fixed, power autonomous and weather proof wireless climate monitoring devices based on a microcontroller that communicates to a Web based service through a low power Adaptive Network Technology (ANT) module. Moreover, the device security is enhanced through a radio-frequency identification unit (RFID) for secure control and manual user login of the module. The series of data is presented to a web browser application equipped with extensive graphical capabilities, and therein location related information is presented to a Google Maps based platform. Although our project embodies similar concepts, this work is specialized in population control and disease prevention. Additionally, sensors are geostationary and do not feature open source software and hardware properties.
The three year design and deployment of WSN by Naumowicz et al. [22] aimed at seabird monitoring on Skomer Island (a UK National Reserve, located off the west coast of Pembrokeshire, Wales). The research team developed a real-world deployable sensor network to investigate the habitat of Manx Shearwater (Puffinus puffinus) seabird. The project is based on battery powered sensor nodes communicating bi-directionally via Micro-Mesh-Protocol. The sealed devices were based on generic extension boards (MSB430MS) and installed near the entrance of the bird’s habitat (burrow) monitoring air temperature and humidity, movement on the entrance (passive infrared PIR), identity of individual bird (were marked previously with RFID tags) and weight of individual gird (with custom made scales). Recordings were initially saved in a SD card and selectively parsed to the repository through Micro-Mesh. Data and nodes were controlled by a custom built firmware with low level API based on ScatterWeb of Freie Universitat Berlin. Remote deployed and custom developed WSNs offer dependable recordings on specific implementations, but lack repeatability and broad applicability.
More et al. [23] proposed a “test-bed for real-world Habitat Monitoring System (HMS)” by acquiring remote physical environmental data. Their project can be implemented in any remote location using the Arduino Uno board, WI-FI connectivity and a Graphical User Interface (GUI). The nodes are consisted by a sensing, a power and a communication unit, which are monitoring temperature, humidity and light, while transmitting them towards a base station. The platform supports live data visualization on a hourly basis and the GUI manages the recorded data through a database built for this purpose. The project of More et al. is an adaptable platform focused in easy deployment at specific remote areas. Our project is concentrated in the spatial aspect of monitoring, proffers portable operation and is compatible with modern mobile devices.
Simbeye et al. [24] dealt with the development of special nodes in order to monitor environmental parameters in aquaculture. Their method concerned the evaluation of monitoring an aquaculture system by deploying for the duration of six months two sensor network nodes in fish ponds. The overall framework consists three monitoring components: “smart sensor nodes”, gateway/coordinator nodes—both based on the ZigBee platform—and a PC as monitoring center. The environmental conditions were analyzed through specific software operating on every system component and presented real-time and total recordings in a GUI. The methodology of water monitoring allows to avoid fish mortality and could be applied in various fields of environmental sensing.
The adherence of proper hygiene practices in public health institutions is a subject studied by Bal and Abrishambaf [25] through the implementation of IoT and WSN technologies. Their prototype system aims at monitoring hand hygiene compliance rates through cloud-connected monitoring stations to monitor hand hygiene events in real-time and in large scale. The proposed platform is consisted by a network of “smart hand washing” nodes, which are embedded in a wireless domain through Zigbee communication protocol and UHF-RFID modules. The nodes are divided into Soap Dispenser and Faucet categories that both integrate embedded microprocessors, various sensors and actuators. The automatic soap dispenser, based on Arduino PRO-mini, initiates the hygiene sequence once it is actuated by the user and it is followed by the faucet, based on Raspberry Pi 3, which finalizes the hygiene activity. Networking is based on wireless local area network that establishes communication among nodes and cloud services (Database and Clients) where lower and higher level programming languages have employed on the purpose to measure compliance while counting hand-hygiene occurrences and their total duration. Bal and Abrishambaf proposed a novel approach on public health related human actuated events, outwit the scope of environmental sensing and outdoor monitoring.
The survey of Noel et al. [26] dealt with applications of WSN to Structural Health Monitoring (SHM) which is referred to the monitoring of critical infrastructures in order to expand their lifespan through “early damage detection”. This application requires the deployment of numerous sensors throughout a structure for damage localization. Applied WSN for SHM are based on the selection of sensor and sensed parameters—mainly focused on structure’s acceleration and velocity through piezoelectric accelerometers. SHM requires the management of a large amount of data with dense population of sensor nodes. Delay in sampling rate depends on the prospect of the monitoring procedure, e.g., long-term allows long delays. Network scalability is highlighted as an important factor in meeting each SHM application quality due to the required “sheer quantity of data collection and transmission” and is related to the maximum network node time-synchronization step. Network architecture is improved through hierarchical relationship between a base station and several sensor nodes. Synchronization among the nodes and the base station is implemented by specialized algorithms that are dependent to Time Synchronization Error (TSE) factor. Furthermore, optimal placing of sensor nodes originate from civil engineering perspective and determines the effectiveness of structural information collection. Relatively to scalability, placement is related to network’s lifespan, overall connectivity, robustness and decision regarding the implemented routing protocol. Energy efficiency determines network lifespan and affects system operation. Clustering is highlighted as a common technique to improve scalability, simplify routing, extend network lifespan and conserve bandwidth. In addition to the aforementioned, an SHM is capable of carrying several features such as Mobile Phone Sensing (MPS) that extends the system to the capabilities of smartphones (e.g., GPS, accelerometers, cameras etc). WSN consist an effective tool with SHM applications that requires extensive research prior deployment. The common ground between environmental monitoring and SHM is found on sensor locality, network architecture and communication protocols.
System intelligence in supply chain is provided by the integration among RFID and WSN. Mirsahi et al. [27] suggested an identification and detection system with intercommunicated devices that fulfil several requirements of the user. Based on the analytical Petri Net toolbox the authors proposed a system of “smart nodes” capable of environmental monitoring, location identification and organizing products. Their system is performance oriented by impromptu providing different functions related to the operation of automated guided vehicles (AGV).
Recent research work on the subject of environmental sensing and WSN indicates the popular applicability of IoT projects in several fields of application. In contrast to most of the aforementioned works we consider the significance of spatial and temporal elements in environmental monitoring. Non-linearity of natural phenomena is optimally monitored through the recognition of environmental processes over time and space [28]. Therefore embedded location tracking arise as the distinctive factor of our integrated system along with the potential of widespread implementation by public and private bodies. We propose an adaptable monitoring system based on integrated IoT, web services and popular development platforms that utilizes off the shelf hardware components and portable devices. The system functionality is based on the deployment of sensor nodes in conjunction with an ever available android compatible device. Furthermore, it is adaptable in terms of power supply and communication protocols. The monitoring procedure can be implemented by non-expert users and mainly focuses on qualitative assessment of the perceived environment. Environmental physical quantities are visualized and simplified onto geographical overlay on the prospect of rapid decision making. In conclusion, the proposed platform could be adapted to various environmental sensing applications and is capable for further customization.
3. Implementation
As expected, the proposed integrated system is based on the application of Information and Communication Technologies (ICT). As a result the technical aspect of this work is divided into two distinct parts: hardware development and networking. These allow the system to obtain, carry and disseminate physical variables through a tree type network topology comprised by sensor nodes, base stations and a server (as message broker). Additionally, the conjunction between sensor nodes and base stations operates through merging measurements and location tracking in order to detect spatial trends in reference to environmental deterioration factors. Also, the network supports on the fly visualization capabilities through numerical and cartographic representation. The latter is implemented by heat maps that provide an optimal apprehension of environmental quality on any given location through variable clustering. In this study the heat map is considered to be an environmental assessment system, visualizing the synchronization of physical quantities and spatial position.
Individual values of each variable are aggregated into a geographical matrix on which data are graphically represented through a color scheme. Warmer color variations commonly correspond to dense data concentration and therefore density is related to higher values. The proposed platform is based on distributed recording that assist the aggregation of data, hence the indication of spatial fluctuations in concentration of pollution factors. Each variable refers to its corresponding range (Noise Pollution: 30 to 80 dbA) and is categorized accordingly on the map. Beside individual metrics, integrated environmental quality can be detected through a Global variable. Global Environmental Quality is an assessment methodology attempting to integrate the total of measured variables into a heat map visualization on which non-dense data are considered as noise.
3.1. Hardware
The system developed within this study may be seen as an extension of a wireless sensor network and consists of several hardware parts. The system aims at monitoring the immediate conditions related to the perceived environment. Its hardware components consisted by a control unit and several sensors able to record and disseminate the ambient conditions of a given area. The components need to comply with the conditions of replace-ability, availability and programmability in order to facilitate ease of operation and reproduction. Electronic prototyping offer several off the shelf solutions that follow the aforementioned criteria.
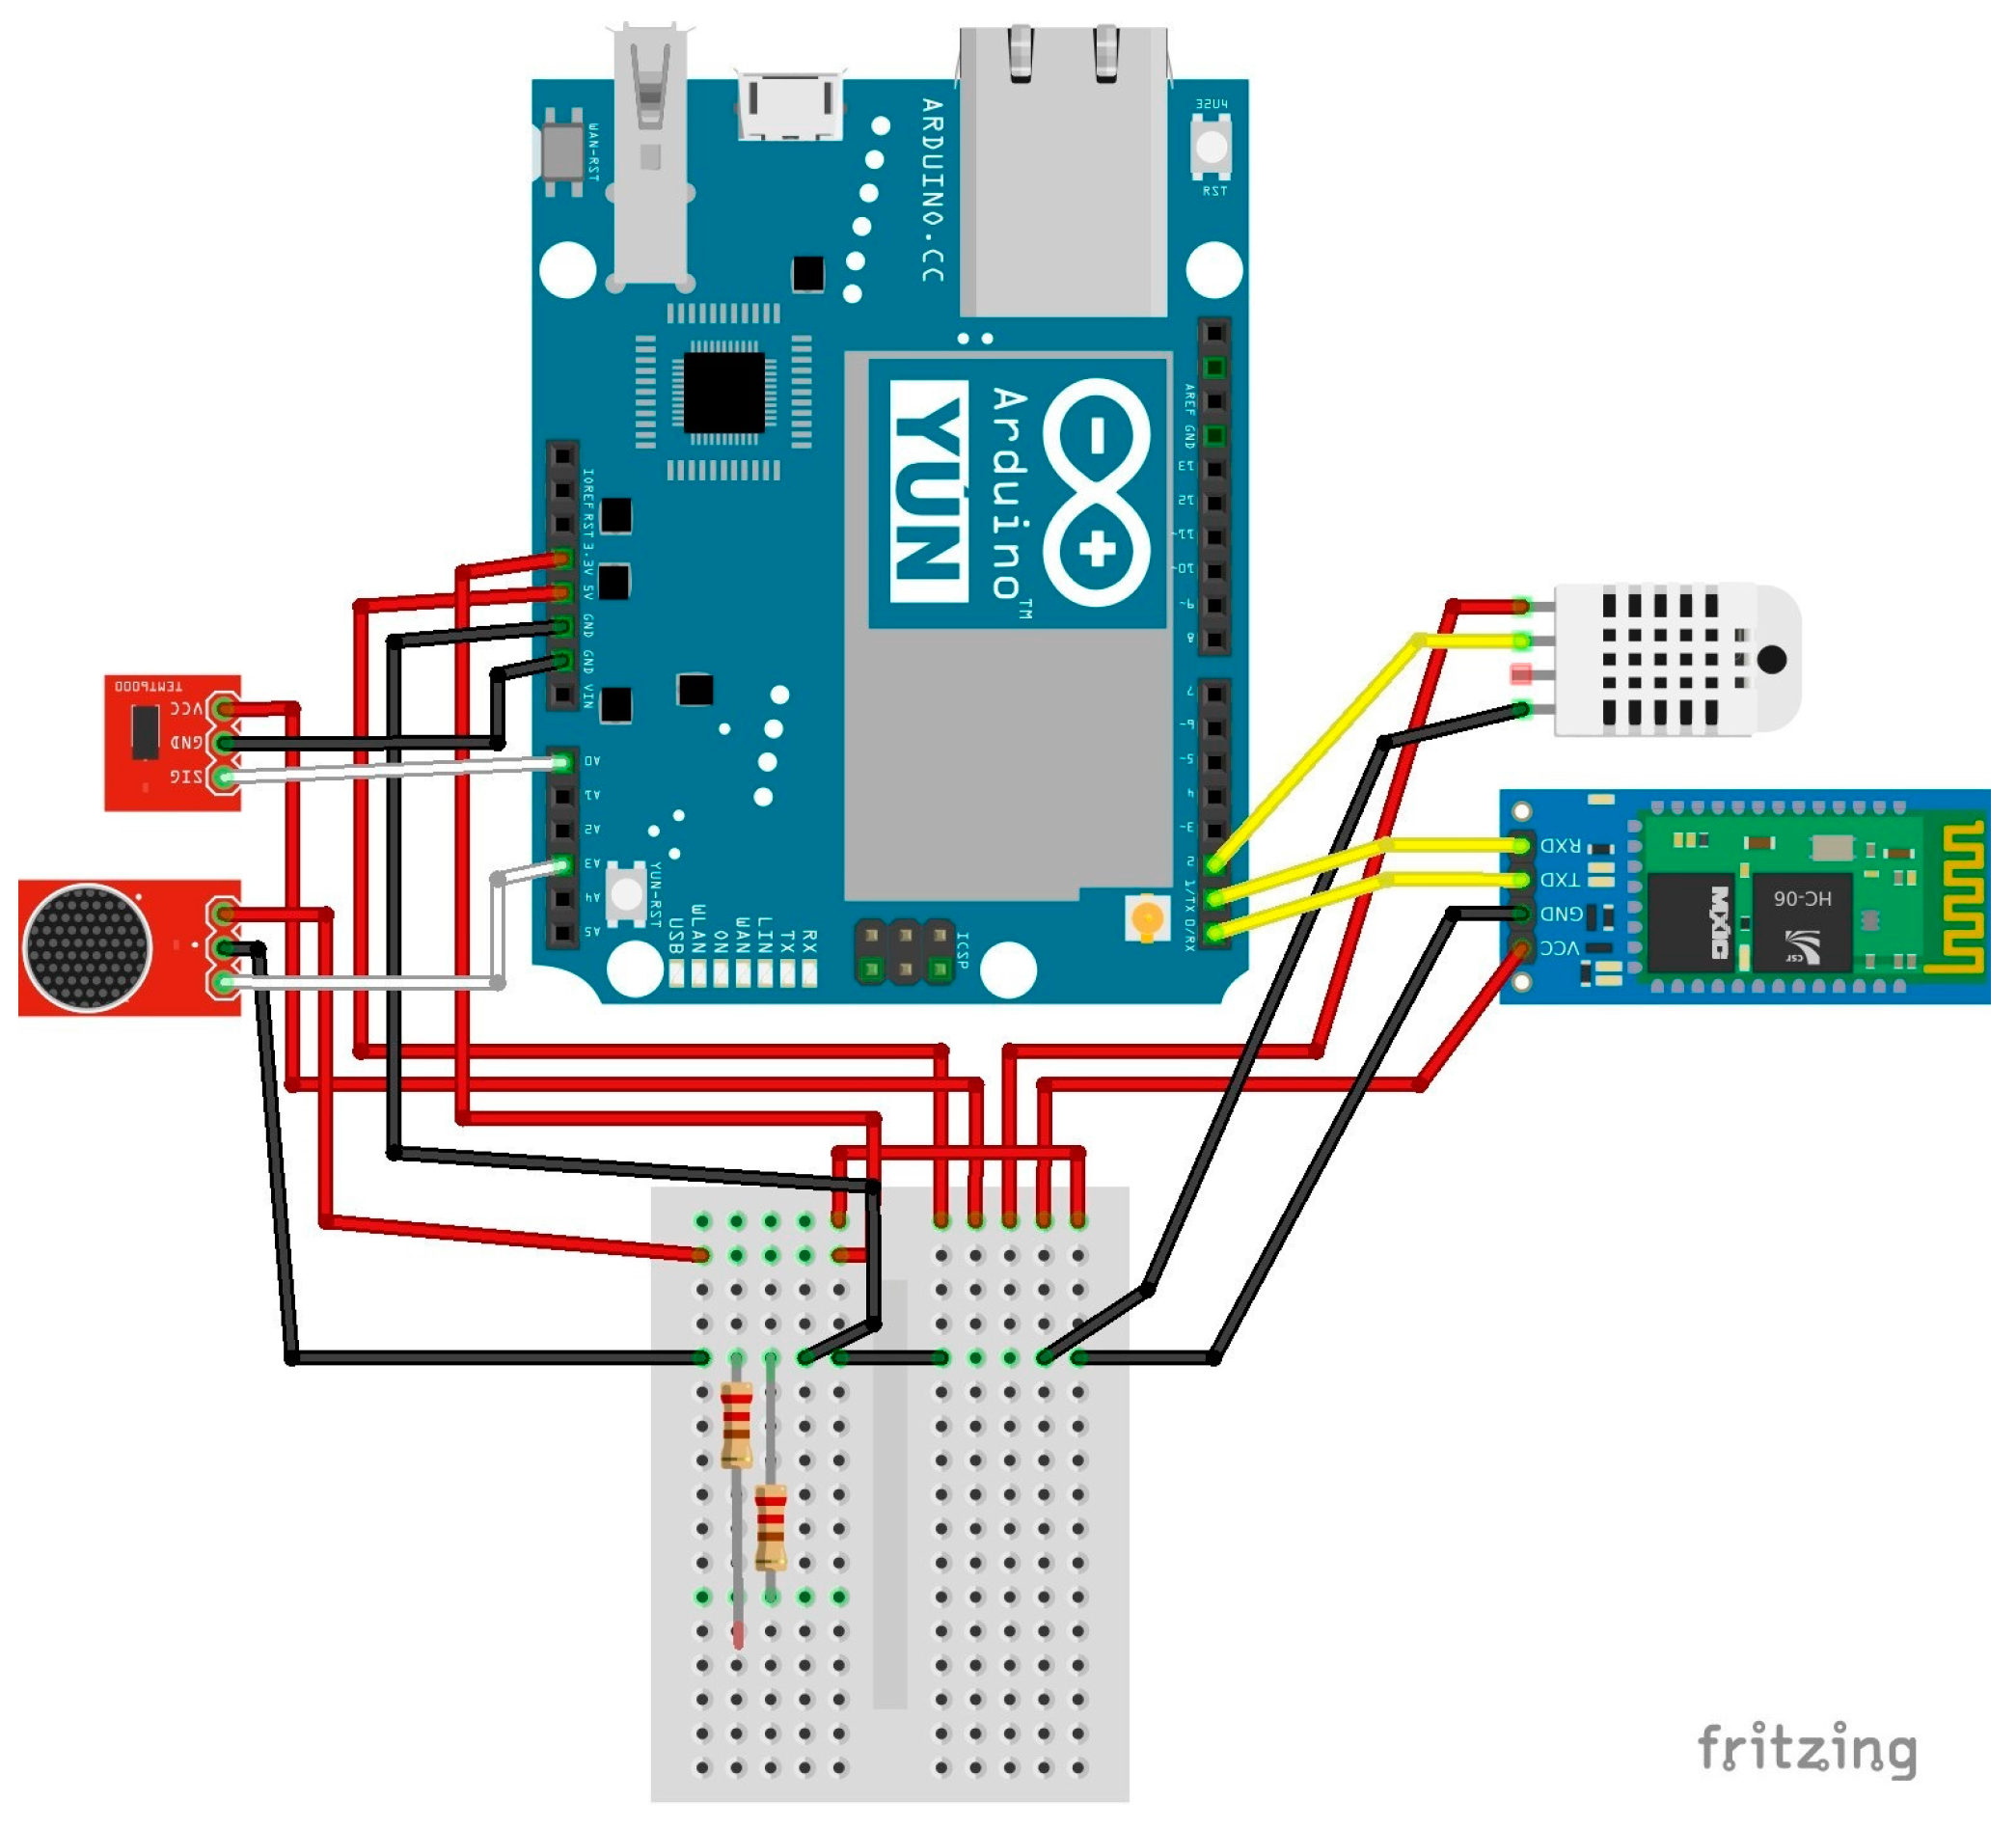
The sensing device is developed using an Arduino developing board. More specifically, we opted for the Arduino YUN [29] which may be easily deployed for both portable and fixed operation due to its networking capabilities and expand-ability. Arduino platform offers low power consumption among popular open source development boards. Additionally, Arduino offers distinctive Digital and Analogue pins, enabling connectivity with several sensors, actuators and modules. The YUN model offers extensive wired and wireless connectivity capabilities along with Arduino’s Integrated Development Environment (IDE). The latter is based on C and C++ languages, which loads cyclic programming loops directly through the device’s firmware. Physical quantities of specific environmental variables are produced by 5 sensor modules that have been connected on the YUN (Table 1). In addition to monitoring tasks the YUN operates as a communication node that transmits the measurements through WiFi (while being fixed) and Bluetooth (while being mobile). The selected sensor modules have been selected based on low cost and their range of calibration, taking into consideration as many variables as possible. The schematic of the sensor node, built using an Arduino YUN is illustrated in (Figure 1). The selected components are depicted in Table 1 and they have been selected based on their low price and adequate accuracy for the proposed application, i.e., accuracy was sufficient for the goal of qualitative assessment of environmental parameters. We should note that the necessary source code for the sensor node and the mobile phone has been made publicly available (Mobile Sensor: https://goo.gl/oKqw5a, Fixed Sensor: https://goo.gl/9RJvRU, Android App: https://goo.gl/BuPUoh.
When being fixed, the system is directly connected to WiFi, while being portable, An Android device (i.e., a typical smart-phone) complements the system’s hardware in order to provide connection to the Internet. More specifically, the smart-phone acts as a base station that receives and transmits flow of data from the sensors to the server. Furthermore it may also offer extensive control and real-time visualization features for the purpose of complete monitoring operation.
The selection of the aforementioned hardware components attempts to tackle the common problem of insufficient energy resources, especially in mobile operation (Figure 2). The Arduino platform is known to offer several solutions for connecting to power sources, while having a relatively small energy footprint. In our case, the YUN is connected to a typical power bank via USB. This way, the system is able to provide portability, elongated operating times as long as effortless connectivity.
In normal conditions each node’s energy requirements averaging 10 mA/h. Using a portable power supply with a nominal power of 2000 mAh it is estimated that each node can reach optimal operation of 200 h. Unfortunately, an external battery cannot be used in full capacity thus mobile operating life of the sensor module is estimated between 12 to 17 h.
3.2. Network Architecture
Data management and storage are the main activities of the proposed sensor network and are supported by exploiting both preexisting hardware capabilities and also extensions of the YUN. It is worth noting that several distribution methodologies exist for both portable and fixed monitoring devices. Portable sensors are dependable to the Android device in order to assert its networking capabilities (Figure 3). Consequently the YUN transmits the data via Bluetooth connection to the mobile device, which then is responsible to forward these readings to the server for further manipulation. On the other hand, fixed nodes set aside Android connectivity and directly forward the readings through WiFi. Both module types are time synchronous through a Unix Timestamp [30] function that is embedded on deployment. Additionally, during mobile monitoring the system validates time-stamp with satellite timing provided by GPS Atomic Clock [31]. This technique expands the recording accuracy of the system’s recognition of time related patterns.
A Client-Server schema has been developed for the purpose of the study, utilizing open source software and Cloud Computing technologies. Supportively an MQTT [32] broker has been set up in order to insure the continuity of operation between base station and the server. Heroku [33] is a cloud platform-as-a-service (PaaS) on which a server has been deployed through Node.js [34] to host the operation of the database. Both database design and implementation have been developed through the non-relational Database Management System MongoDB [35]. Therein, every recording is handled as a GeoJSON [36] element by the database to be used subsequently by the Android app. A fragment of the transmitted data in GeoJSON format is depicted below:
{ "_id": {
        "$oid": "58188b45914b700011f6dbf1"
   },
   "deviceId": "mob001",
   "sensorType": "mobile",
   "timestamp": {
       "$date": "2016-11-01T14:32:03.000Z"
   },
   "geo": {
       "type": "Point",
	   "coordinates": [
	       23.77108281,
	       37.94333254
	       ]
	   },
	   "humidity": 38.2,
	   "temperature": 24.8,
	   "heatIndex": 24.33,
	   "luminocity": 56,
	   "methane": 4.73,
	   "co": 38.66,
	   "noise": 39
}
4. Application Framework
The Android platform has been designed to offer numerous hardware and software capabilities to assist development and functioning of heterogeneous types of applications. Upon investigation, the aforementioned capabilities have been proven to fulfill the requirements of the proposed system and its dependencies on complex tasks that require hardware components and are related to the flow of collected data. The implemented app has been designed to exploit the Bluetooth, GPRS, WiFi and GPS capabilities of the mobile phone, which are the prerequisites in terms of the phone’s specifications so as to enable data acquisition and collection from the YUN, location tracking and data transmission. Data may then be forwarded to services for database provisioning and cartographic representation.
To avoid message flooding, the app’s operating sequence is initiated by the pairing between the sensor and the Android device via Bluetooth and consists of several intervals of predefined duration. Each recording consisting of a set of measurements from all sensors is instantly transmitted as a string message to the phone. This message is enhanced with the exact geographic location of the device and a time stamp (Figure 4). The message is then transformed to the GeoJSON format and transmitted to the MQTT broker, which then forwards it to the server. This flow of data to the dynamic repository enables the interactive mapping operations that allow cartographic representation of the recorded data. The latter is implemented in the server that stores all recordings to the MongoDB database and additionally manages and analyzes the content through logical queries.
The two-way communication among fixed sensor nodes and the server is implemented using the MQTT protocol, which enables message interchange through topics using a publishing subscribing procedure. Moreover, since MQTT is an extremely lightweight protocol, designed to require small code footprint and network bandwidth, guarantees a significantly small message size. Moreover, it is available for many heterogeneous devices and programming languages and fully compatible with all platforms that have been used within our system. Data sharing infrastructure is based on a network server acting as a web service. It consists of a Node.js server and an MQTT broker, both deployed on the Heroku cloud development platform. Ultimately, a non relational database model has been selected for data management and storage of the recordings. MonogDB manages data as individual text documents (JSON) with distinct structure (field and values). In addition to the server, database is based on mLab [37] cloud storage service. Finally, the Android App is developed with Ionic framework [38] that offers simplicity whereas supporting Angular.Js front-end development standard. Ionic utilizes ngCordova [39] framework which functions on top of npm Javascript package [40]. The app is equipped with functional and visualization capabilities, allowing the user to control, monitor and assess environmental quality (Figure 5).
Base station’s role on this application is to collect and transmit data to a repository. In addition to this, our project exploits the plethora of android platform capabilities. It offers the user live reading and control alongside with geographical overlay of the recordings. The embedded Web Map is developed through the Mapbox platform that represents current and past recordings along with their spatial representation (Figure 6). It provides user an extended apprehension of environmental quality in any given place and time the sensors are deployed.
5. Use Case Scenarios
The system has at its disposal multiversal capabilities which allows repeatability among various cases. Assessing environmental quality is a complex multi-parameter procedure and a deployment schema has been created for the purpose of the specific research work. At the operational level, the recording device may be used for both portable and fixed operation while on both occasions requires Internet access for data transmission. Portable sensors depend on Android for spatial recordings and network connection. While being fixed, they have predefined location and autonomous connectivity.
The latter is fastened in specific building infrastructures with the aim of providing the system with continuous baseline data. This operates as a filtering mechanism that minimizes the possibility of spatial errors. On the other hand mobile measurements supply the monitoring system with risk indicators on a given route the sensor has “passed through”. Repeated traverses on the same route or on specific spatial points could possibly indicate spatial propagation of nuisance derivatives. The main idea is situated at the operation of the sensor on systematic itineraries by frequent commuters based on un-complicated reproduction of methodology.
Human is an indispensable factor on implementing the aforementioned complex monitoring procedure. The evaluation of the receptive environment is based on criteria originating from qualitative measurements [5]. Small scale implementation and minimum resources restrict wider operation with several nodes dispatched into different locations. The application requires continuous operation of at least two sensing devices (portable and fixed) in order to replete the database with spatial and numerical records and subsequently produce optimal representation and highlight probable system errors or weaknesses. Therefore three realizable user oriented scenarios are determined, depending on spatial dispersion of the sensor nodes.
5.1. Individual
Based on the aforementioned every individual may implement the proposed monitoring methodology on his everyday commute. Sensing could be applied by vehicle users, cyclists, walkers or hikers who follow specific itineraries thus to enrich the repository with spatial oriented data. The screen of the Android device projects an immediate visualization of environmental quality of the crossed area.
5.2. Social
Project’s low cost and ease reproduction into multiple iterations facilitate further propagation on a larger scale. Their data inputs will be gathered in clusters, improve collection and enhance interpretation. Beyond hobbyists and enthusiasts the proposed WSN possibly attracts citizen and community groups. Widely employed Android devices urge large scale monitoring processes in residential areas. The proposed WSN could be implemented by local community and school groups, NGOs, tour operators and in general groups with interest into environmental sensing methodology.
5.3. Smart City Infrastructure
The increase of world’s population and the shortage of natural resources incline towards the widespread use of information and communication technology (ICT) [41] in everyday life. Efficient changes in urban environments are powered by the trends of Smart Cities under the condition of meeting the needs of the city and its citizens while assisting the management of infrastructure and services [41].
Promoting involvement of state supported facilities in educational and environmental awareness activities. Public buildings and infrastructures operate constantly and are network connected. These edifices consist the ideal point of research interest, thus accommodate a vast number of activities and services. On the other hand private organizations will meliorate their image on environmental corporate social responsibility and assist on further environmental awareness activities.
The adoption by state owned vehicles (e.g., refuse trucks) and public transportation (e.g., bus, tram) services generate surplus value in relation to public service. Most of public vehicles follow the same routes on a daily basis creation a dynamic field of operation that potentially produces baseline data.
6. Validation
The proposed WSN was carried out in a broad area of Athens, Greece employing a deployed pair of fixed and portable sensors. The area of study was mostly set at central Athens region for both node types. Data emanated from recordings deployed on recurrent itineraries by car, bicycle or pedestrian use. Likewise a fixed node was set on different positions for varied time periods. This indicates that the comprehensive implementation of the system requires continuous operation of two or more devices (portable and stationary) in order to replete the Database of records (spatial and numerical). The minimum number of deployed devices used on this research as a detection mechanism for outlying erroneous factors. Subsequently, the expected number of recordings function positively for the further development of the platform, in order to egress errors and reveal system weaknesses for future implementation.
On strictly technical terms, there were few initial inconsistencies between modules and Arduino YUN, which impaired the sensing functionality. Eventually, debugging help solve some of these issues, nevertheless the complex configuration caused erroneous recordings. MQ sensors (Gasses micro-particles) use an internal heater in order to operate in temperatures higher than 50 C [42], therefore are particularly affected by extreme temperature fluctuations and often produce inaccurate readings. Joint operation with a temperature sensor scale down potential inconsistencies. Additionally, noise pollution is a complex variable that needs specialized equipment [43]. A thirty-second stride per measure was applied so to increase accuracy of noise nuisance responsiveness by the microphone module. The effectiveness of each time step was validated with controlled measurements of a calibrated decibel meter. In addition to sensory there were few connectivity issues between YUN and the Android device. This came as a result of firmware incompatibilities, which resolved by further debugging and the use of different Android devices, with no measurable documentation on this matter.
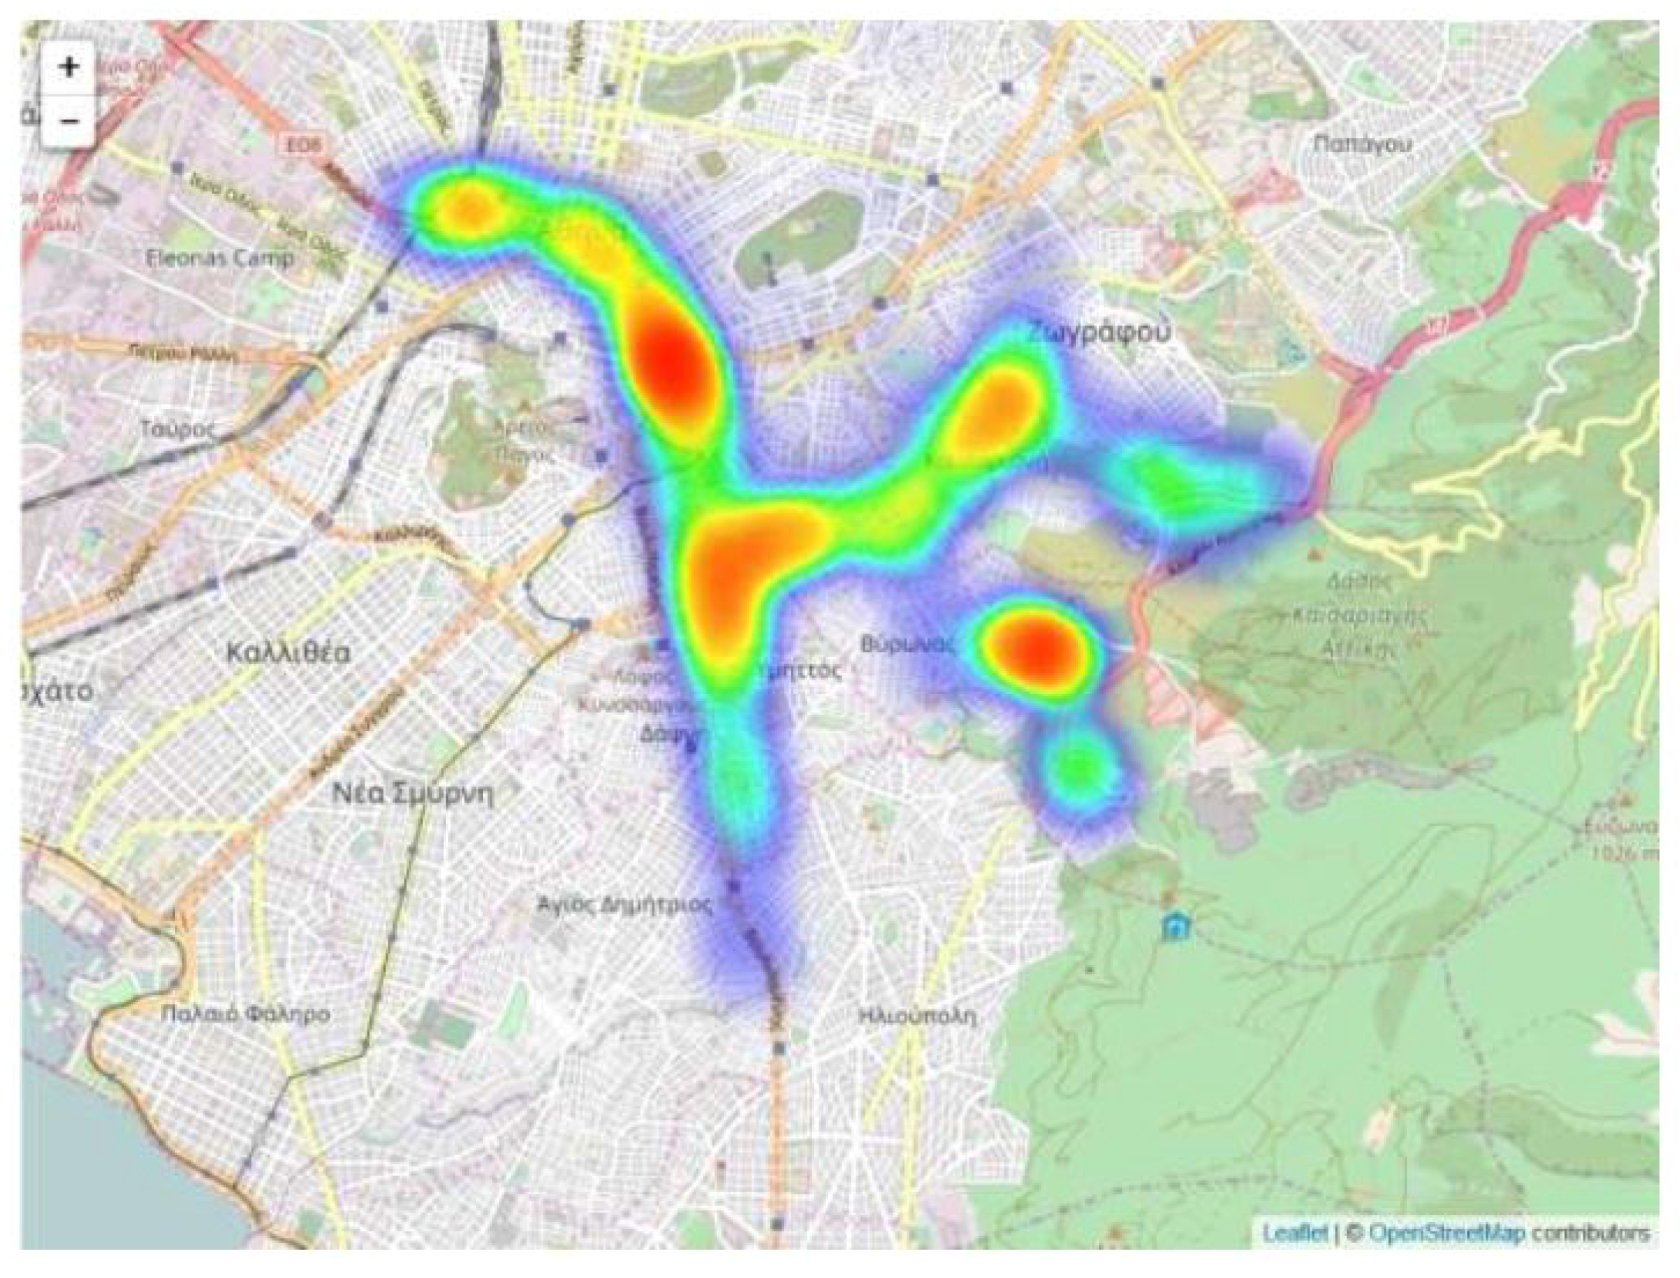
The most considerable barrier the research came up against is incomplete data, which lead to challenging endeavors regarding automated environmental assessment. Ultimately manual data normalization allowed the production of a final assessment map (Figure 7), carried out by data aggregation (Global Environmental Quality) according to heat map methodology.
7. Conclusions and Future Work
The proposed system offers an automated methodology of monitoring the environmental quality. The system’s potential is emphasized through the continuous network supply from several devices (nodes) simultaneously, the low resources and energy requirements and both its quantitative and qualitative assessment capabilities. Furthermore it supports various hardware extensions with the derived variables to offer dynamic representation capabilities on a Web GIS environment. Data generalizations caused measurement inaccuracies and hardware–software compatibility issues, which are assessed specifically on every occasion. We should emphasize herein that towards a cost-efficient and open source solution, with minimal implementation time, the way to go is a bottom up approach, such as the one we have followed, i.e., to select off-the-shelf tested solutions in order to compose the full system. We also feel that such an approach may be easily adopted by everyone, e.g., hobbyists, enthusiasts, students, researchers etc., who may easily and at a low cost create their own nodes and connect them to the platform, towards a fully social environmental network. Of course, we should emphasize that any single-board open platform such as the Raspberry Pi [44] or any other platfrom that supports digital and analog sensors and the MQTT protocol may be used for the construction of the sensor node.
The results prospect for further continuation of the research work. Map visualization of geographical variables in web GIS may be further optimized. Additionally, the system allows greater specialization capabilities on recording and development of both hardware and software structures. The implementation scenarios are capable to broaden in many other applications. The importance of channeling the research methodology to the public through crowd-sourcing is appearing while embedding big data methodology. The construction of an integrated Spatial Sensor Web Network requires the adoption of SensorML [45] standard and Sensor Web Enablement SWE [46] action to further support and enrich existing repositories. Implementing manual normalization generated the need for further research on machine learning methodology outward of the server in favor of big data aggregation techniques. Finally, the proposed system could be integrated with small effort on an IoT-ready platform that supports the MQTT protocol, such as the SYNAISTHISI platform [47], which is an integrated platform that allows humans, systems, machines, and devices for the creation and management of services. Initial experiments indicated that the proposed sensors may be seamlessly integrated within the SYNAISTHISI ecosystem. Also, transformation of all processing units into services is straightforward within SYNAISTHISI. This way, the desirable scalability should be guaranteed.
Author Contributions
Yorghos Voutos conceptualized and implemented the research work. Phivos Mylonas contributed to the implementation of application development and programming. Evaggelos Spyrou designed and assisted the implementation of the monitoring devices. Eleni Charou assisted the analysis of the data. All contributors facilitated to the writing of the paper.
Conflicts of Interest
The authors declare no conflict of interest.
References
- Lein, J.K. Environmental Sensing. In Environmental Sensing: Analytical Techniques for Earth Observation; Springer: New York, NY, USA; Dordrecht, The Netherlands; Heidelberg, Germany; London, UK, 2012; Chapter 2; pp. 23–50. ISBN 978-1-46-140142-1. [Google Scholar]
- Gomarasca, M.A. Basics of Geomatics; Springer: New York, NY, USA, 2009; ISBN 978-1-40-209014-1. [Google Scholar]
- Reed, D.H. Impact of Climate Change on Biodiversity. In Handbook of Climate Change Mitigation and Adaptation, 2nd ed.; Chen, W.-Y., Seiner, J., Suzuki, T., Lackner, M., Eds.; Springer: New York, NY, USA, 2012; pp. 505–530. [Google Scholar]
- Intergovernmental Panel on Climate Change (IPCC). Climate Change 2014: Synthesis Report. Contribution of Working Groups I, II and III to the Fifth Assessment Report of the Intergovernmental Panel on Climate Change; Core Writing Team, Pachauri, R.K., Meyer, L.A., Eds.; IPCC: Geneva, Switzerland, 2014; 151p. [Google Scholar]
- Mohit, M.A. Quality of Life in Natural and Built Environment An Introductory Analysis. Procedia-Soc. Behav. Sci. 2013, 101, 33–43. [Google Scholar] [CrossRef]
- Atzori, L.; Iera, A.; Morabito, G. The Internet of things: A survey. Comput. Netw. 2010, 54, 2787–2805. [Google Scholar] [CrossRef]
- Burke et al 2006 Participatory Sensing. Available online: http://remap.ucla.edu/jburke/publications/Burke-et-al-2006_Participatory-sensing.pdf (accessed on 12 September 2017).
- Uusitalo, L.; Lehikoinen, A.; Helle, I.; Myrberg, K. An overview of methods to evaluate uncertainty of deterministic models in decision support. Environ. Model. Softw. 2015, 63, 24–31. [Google Scholar] [CrossRef]
- Emre Aslan, Y.; Korpeoglou, I.; Ulusoy, O. A framework for use of wireless sensor networks in forest fire detection and monitoring. Comput. Environ. Urban Syst. 2012, 36, 614–625. [Google Scholar] [CrossRef] [Green Version]
- Ferdoush, S.; Li, X. Wireless Sensor Network System Design using Raspberry Pi and Arduino for Environmental Monitoring Applications. Procedia Comput. Sci. 2014, 34, 103–110. [Google Scholar] [CrossRef]
- Raspberry Pi Model B+—Raspberry Pi. Available online: https://www.raspberrypi.org/products/raspberry-pi-1-model-b/ (accessed on 20 October 2017).
- Arduino Uno Rev3. Available online: https://store.arduino.cc/arduino-uno-rev3 (accessed on 20 October 2017).
- Digi XBee/XBee-PRO ZigBee Modules (S2B)—Formerly ZB Product Detail—Digi International. Available online: https://www.digi.com/support/productdetail?pid=4549 (accessed on 20 October 2017).
- Kumar, V.V.; Kumaraswamy, G. Wireless Sensor Network for Environmental Monitoring using Rasberri Pi. Int. J. Adv. Technol. Innov. Res. 2016, 8, 2084–2086, ISSN 2348-2370. [Google Scholar]
- Salamone, F.; Belussi, L.; Danza, L.; Ghellere, M.; Meroni, I. Design and Development of nEMoS, an All-in-One, Low-Cost, Web-Connected and 3D-Printed Device for Environmental Analysis. Sensors 2015, 15, 13012–13027. [Google Scholar] [CrossRef] [PubMed]
- IoT Platform for Connected Devices|Xively by LogMeIn. Available online: https://www.xively.com/ (accessed on 20 October 2017).
- Abdelhamid, S.; Hassanein, H.S.; Takahara, G. Vehicle as a Mobile Sensor. Procedia Comput. Sci. 2014, 34, 286–295. [Google Scholar] [CrossRef]
- Rawat, P.; Singh, K.D.; Chaouchi, H.; Bonnin, J.M. Wireless sensor networks: A survey on recent developments and potential synergies. Supercomput 2014, 68, 1–48. [Google Scholar] [CrossRef]
- Srbinovska, M.; Gavrovski, C.; Dimcev, V.; Krkoleva, A.; Borozan, V. Environmental parameters monitoring in precision agriculture using wireless sensor networks. J. Clean. Prod. 2014, 88, 297–307. [Google Scholar] [CrossRef]
- Keshtgary, M.; Deljoo, A. An Efficient Wireless Sensor Network for Precision Agriculture. Can. J. Multimed. Wirel. Netw. 2012, 3, 1–5. [Google Scholar]
- Hur, B.; Eisenstadt, W.R. Low power Wireless Climate Monitoring System with RDIF Security Access Feature for Mosquitto and Pathogen Research. In Proceedings of the 1st Conference on Mobile and Secure Services, (MOBISECSER), Gainesville, FL, USA, 20–21 February 2015. [Google Scholar]
- Naumowicz, T.; Freeman, R.; Kirk, H.; Dean, B.; Calsyn, M.; Liers, A.; Braendle, A.; Guilford, T.; Schiller, J. Wireless Sensor Network for habitat monitoring on Skomer Island. In Proceedings of the 35th Annual IEEE Conference on Local Computer Networks, LCN 2010, Denver, CO, USA, 10–14 October 2010; pp. 882–889. [Google Scholar]
- More, A.; Wagh, S.; Joshi, K. A test-bed for habitat monitoring system using Wi-Fi in Wireless Sensor Networks. In Proceedings of the IEEE International Conference on Computational Intelligence and Computing Research (ICCIC), Madurai, India, 10–12 December 2015; pp. 1–6. [Google Scholar]
- Simbeye, D.S.; Zhao, J.; Yang, S. Design and deployment of wireless sensor networks for aquaculture monitoring and control based on virtual instruments. Comput. Electron. Agric. 2014, 102, 31–42. [Google Scholar] [CrossRef]
- Bal, M.; Abrishambaf, R. A System for Monitoring Hand Hygiene Compliance based-on Internet-of-Things. In Proceedings of the IEEE International Conference on Industrial Technology (ICIT 2017), Toronto, ON, Canada, 22–25 March 2017; p. 18. [Google Scholar]
- Noel, A.; Abdaoui, A.; Badawy, A.; El-Fouly, T.; Ahmed, M.; Shehata, M. Structural Health Monitoring using Wireless Sensor Networks: A Comprehensive Survey. IEEE Commun. Surv. Tutor. 2017, 19, 1403–1423. [Google Scholar] [CrossRef]
- Mirshahi, S.; Uysal, S.; Akbari, A. Integration of RFID and WSN for supply chain intelligence system. In Proceedings of the Electronics, Computers and Artificial Intelligence (ECAI), Pitesti, Romania, 27–29 June 2013; pp. 1–6. [Google Scholar]
- Lein, J.K. Sensors and Systems. In Environmental Sensing: Analytical Techniques for Earth Observation; Springer: New York, NY, USA; Dordrecht, The Netherlands; Heidelberg, Germany; London, UK, 2012; Chapter 3; pp. 51–82. ISBN 978-1-46-140142-1. [Google Scholar]
- ARDUINO YÚN. Available online: https://store.arduino.cc/arduino-yun (accessed on 12 September 2017).
- Epoch Converter—Unix Timestamp Converter. Available online: https://www.epochconverter.com (accessed on 20 October 2017).
- GPS.gov: Timing Applications. Available online: https://www.gps.gov/applications/timing (accessed on 20 October 2017).
- MQTT. Available online: http://mqtt.org/ (accessed on 12 September 2017).
- Cloud Application Platform|Heroku. Available online: https://www.heroku.com/ (accessed on 12 September 2017).
- Node.js. Available online: https://nodejs.org/en/ (accessed on 12 September 2017).
- MongoDB for GIANT Ideas|MongoDB. Available online: https://www.mongodb.com (accessed on 12 September 2017).
- GeoJSON. Available online: http://geojson.org (accessed on 12 September 2017).
- MongoDB Hosting: Database-as-Service by mLab. Available online: https://mlab.com/ (accessed on 12 September 2017).
- Build Amazing Native Apps and Progressive Web Apps with Ionic Framework and Angular. Available online: https://ionicframework.com/ (accessed on 12 September 2017).
- GitHub—Ionic Team/ng-Cordova. Available online: https://www.npmjs.com (accessed on 12 September 2017).
- npm. Available online: https://www.npmjs.com (accessed on 12 September 2017).
- Pellicer, S.; Santa, G.; Bleda, A.L.; Maestre, R.; Jara, A.J.; Skarmeta, A.G. A Global Perspective of Smart Cities: A Survey. In Proceedings of the Seventh International Conference on Innovative Mobile and Internet Services in Ubiquitous Computing, Taichung, Taiwan, 3–5 July 2013. [Google Scholar]
- Arduino Playground—MQGasSensors. Available online: http://playground.arduino.cc/Main/MQGasSensors/#heater (accessed on 20 October 2017).
- Cho, D.S.; Kim, J.H.; Manvell, D. Noise mapping using measured noise and GPS data. Appl. Acoust. 2007, 68, 1054–1061. [Google Scholar] [CrossRef]
- Raspberry Pi—Teach, Learn, and Make with Raspberry Pi. Available online: https://www.raspberrypi.org/ (accessed on 20 October 2017).
- Sensor Model Language (SensorML)|OGC. Available online: http://www.opengeospatial.org/standards/sensorml (accessed on 12 September 2017).
- Sensor Web Enablement (SWE)|OGC. Available online: http://www.opengeospatial.org/ogc/markets-technologies/swe (accessed on 12 September 2017).
- Pierris, G.; Kothris, D.; Spyrou, E.; Spyropoulos, C. SYNAISTHISI: An Enabling Platform for the Current Internet of Things Ecosystem. In Proceedings of the Panhellenic Conference on Informatics (PCI), Athens, Greece, 1–3 October 2015. [Google Scholar]
Figure 1.
Sensor Circuit schema.

Figure 2.
Sensor node in bulk form.
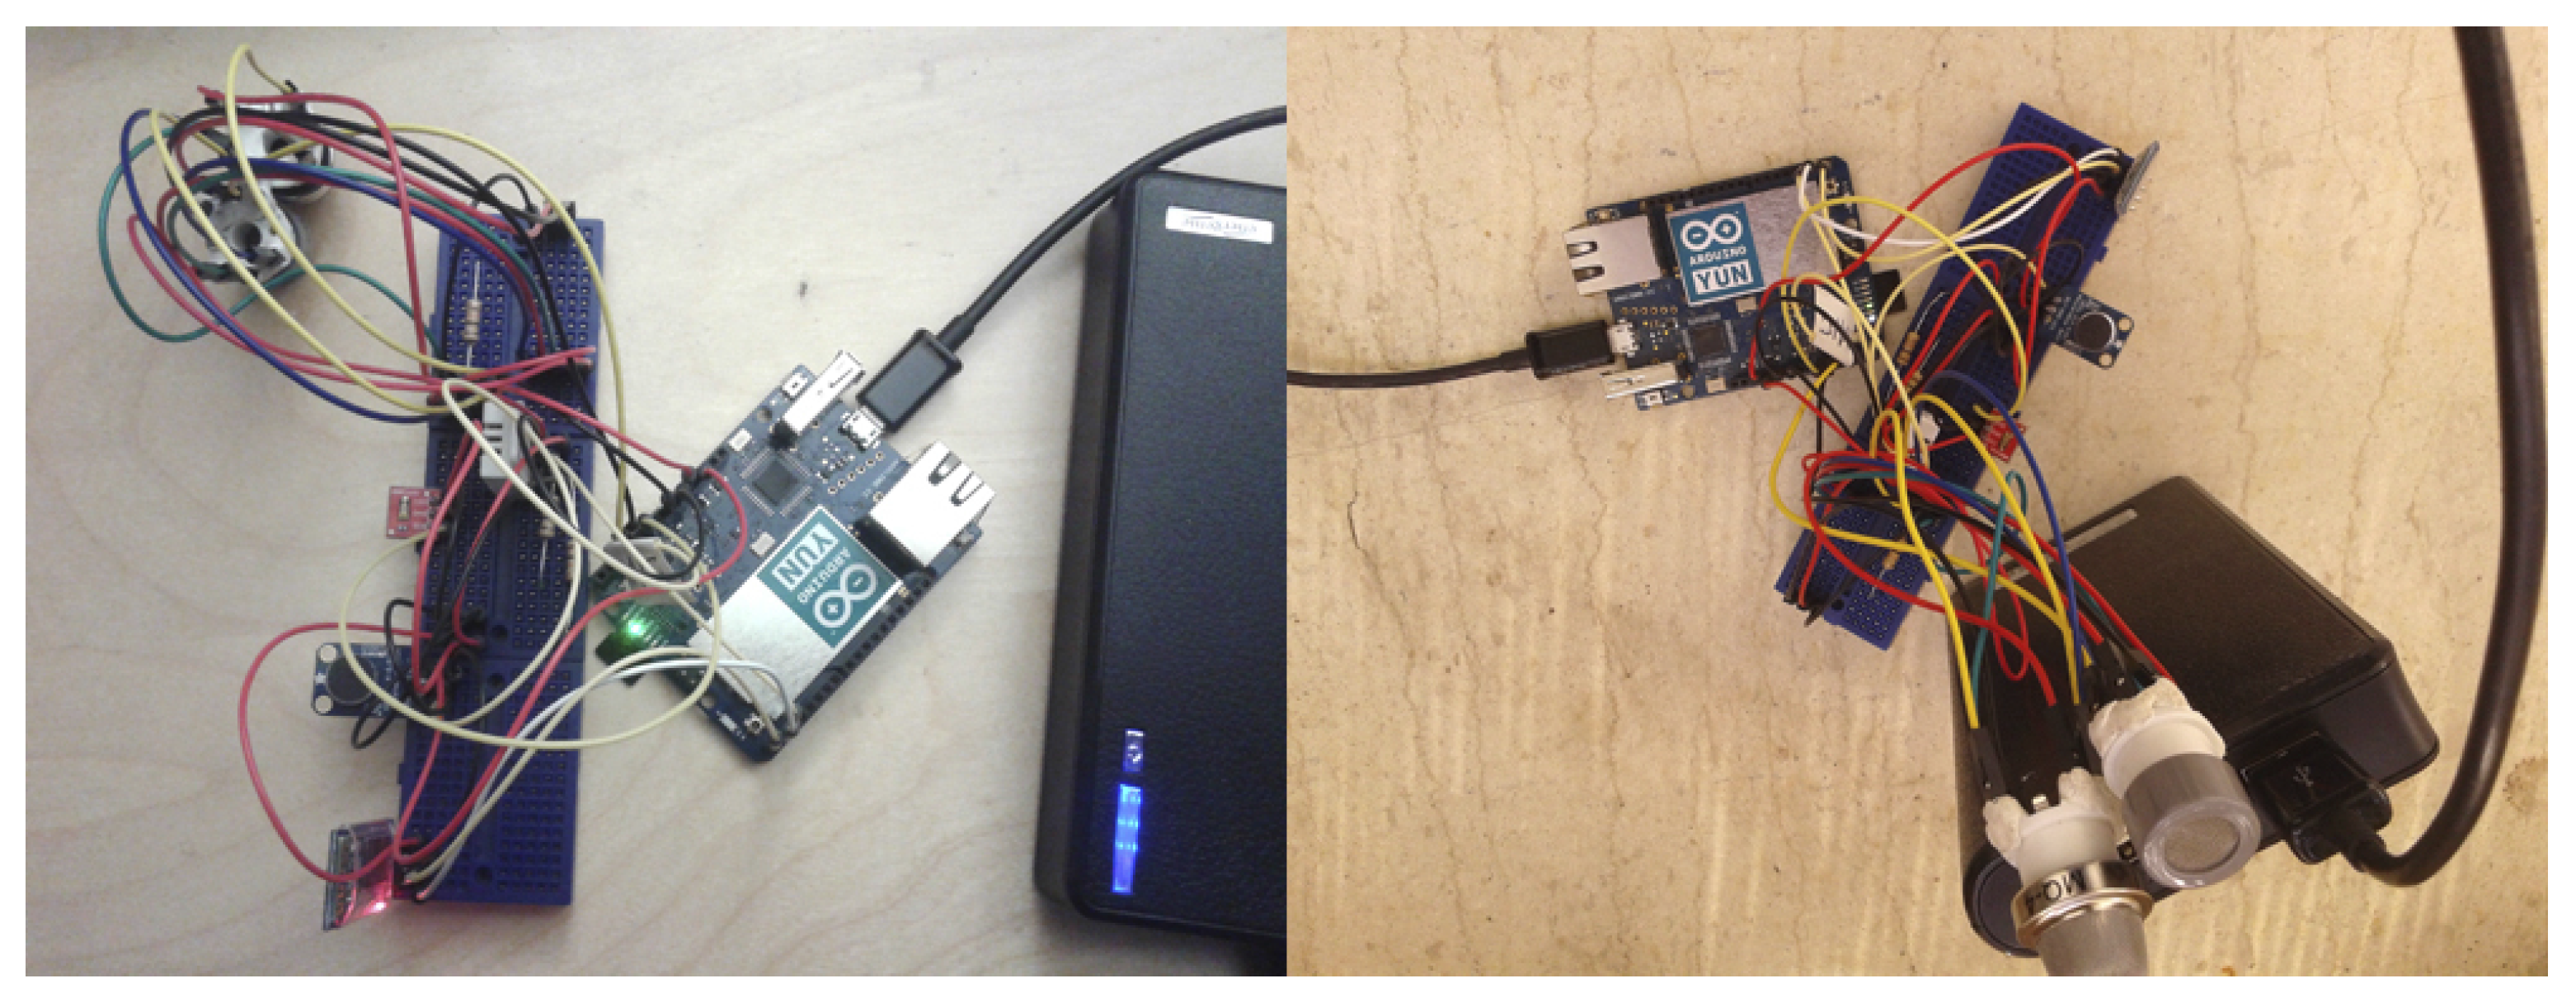
Figure 3.
Communication architecture.
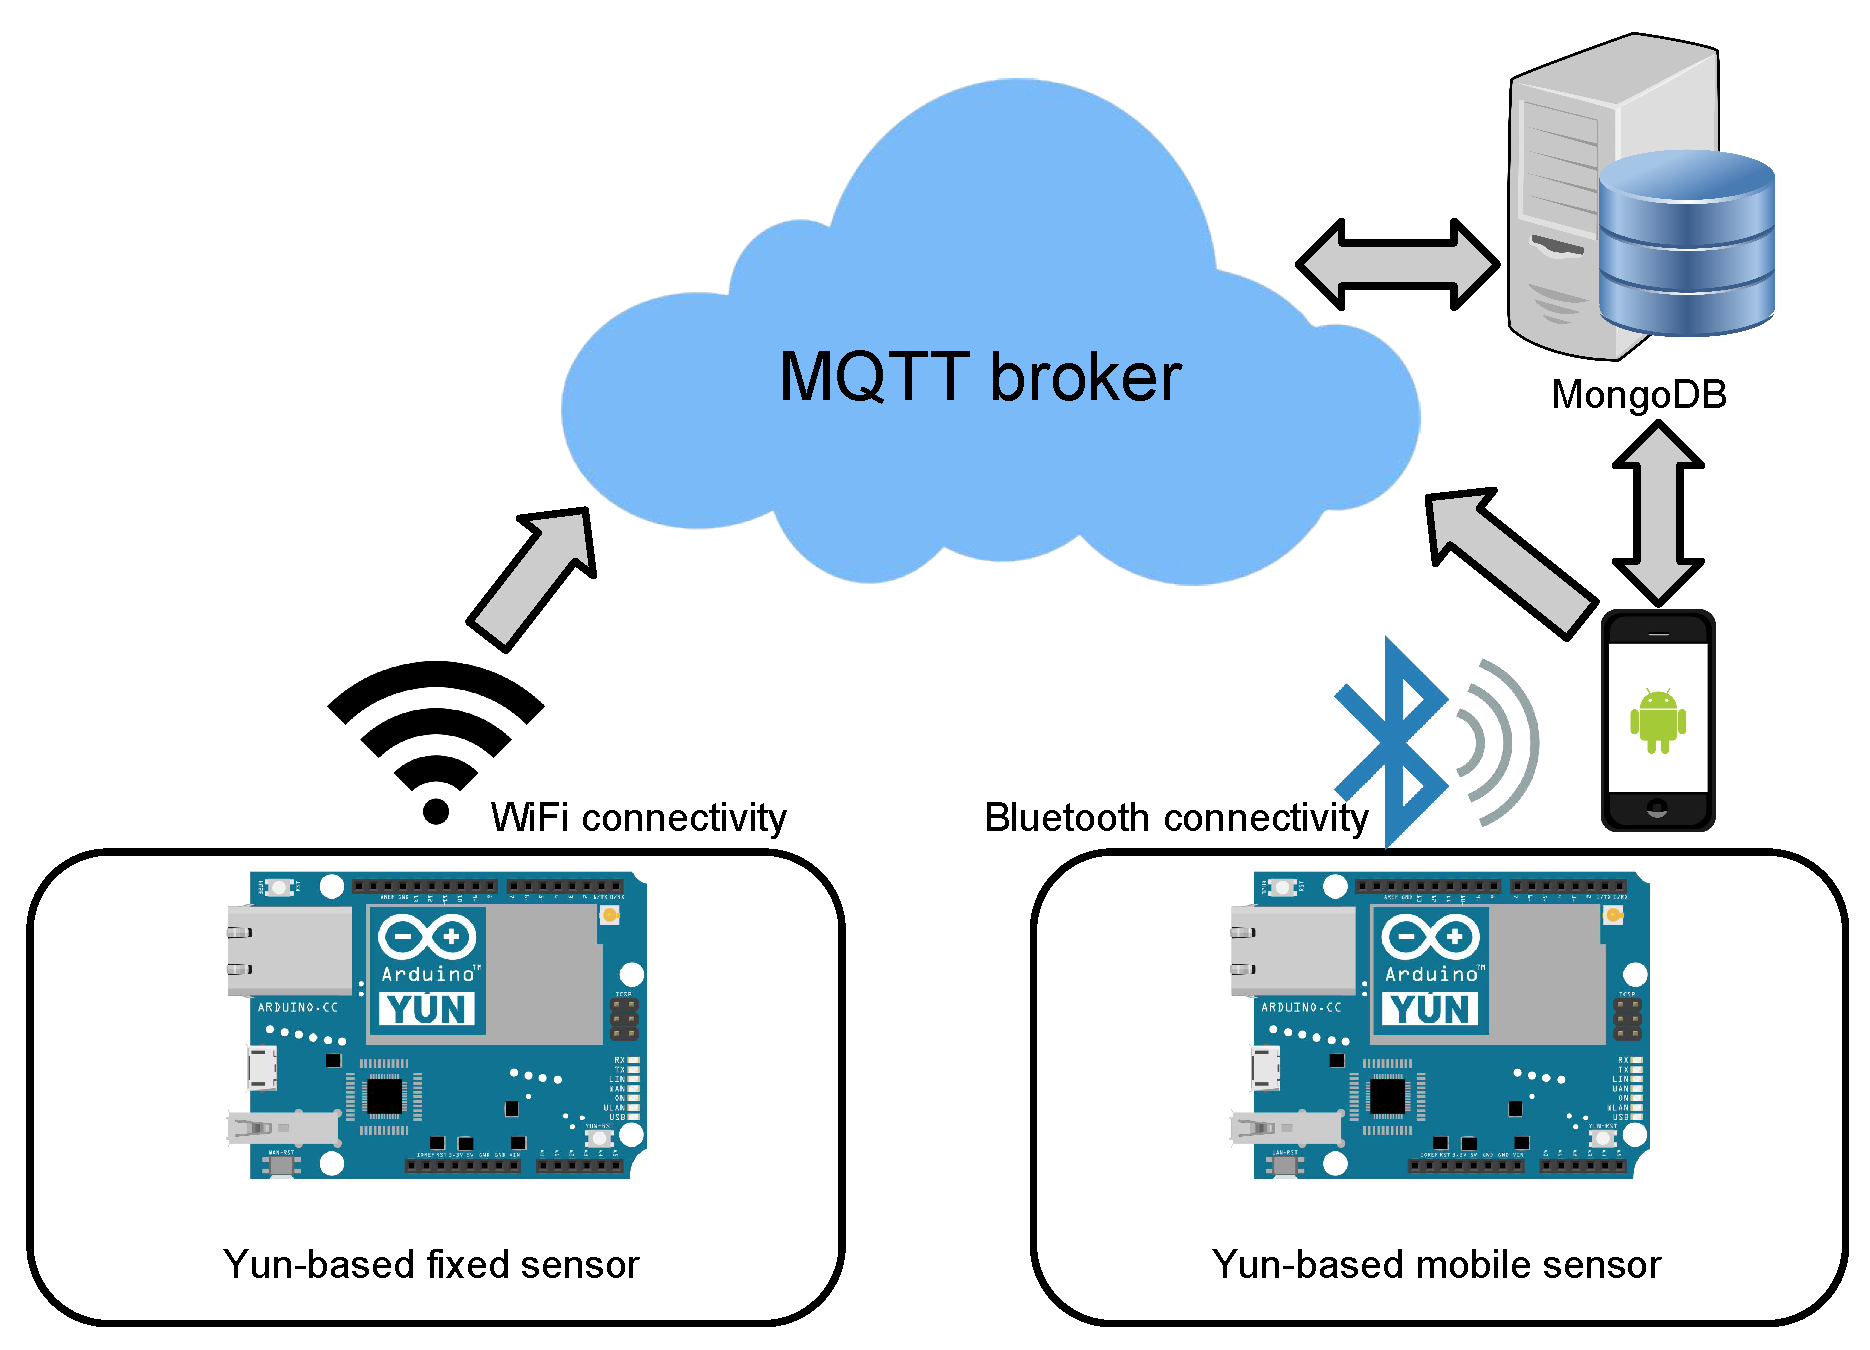
Figure 4.
Android App schema.
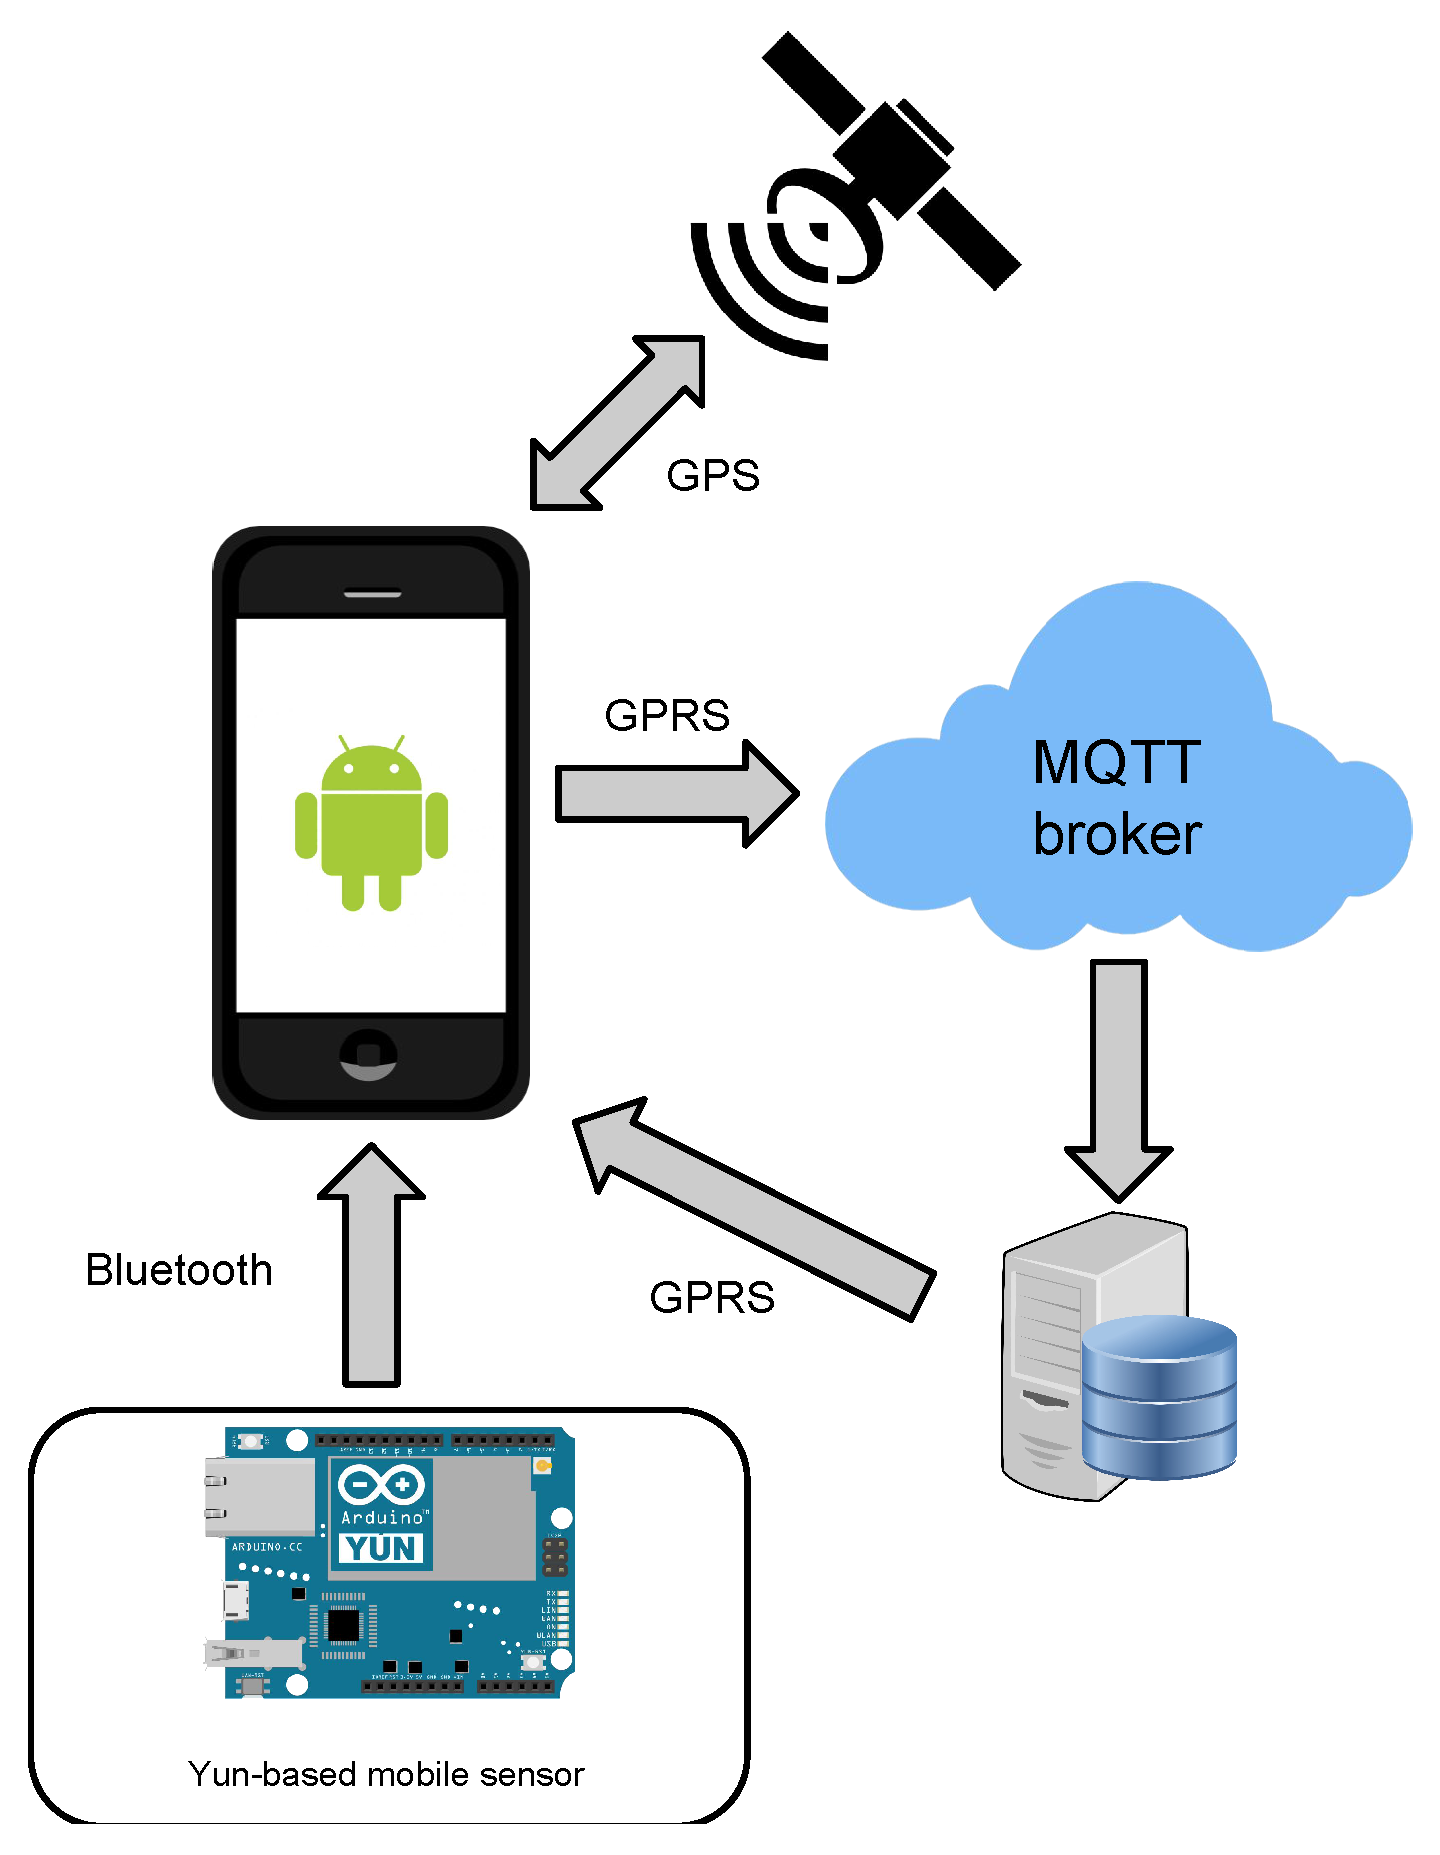
Figure 5.
Data Acquisition on the Android application; Presented values within each line are: Relative Humidity, Temperature, Heat Index, Luminosity, CH4 ppm, CO ppm, dB, longitude, latitude.
Figure 5.
Data Acquisition on the Android application; Presented values within each line are: Relative Humidity, Temperature, Heat Index, Luminosity, CH4 ppm, CO ppm, dB, longitude, latitude.
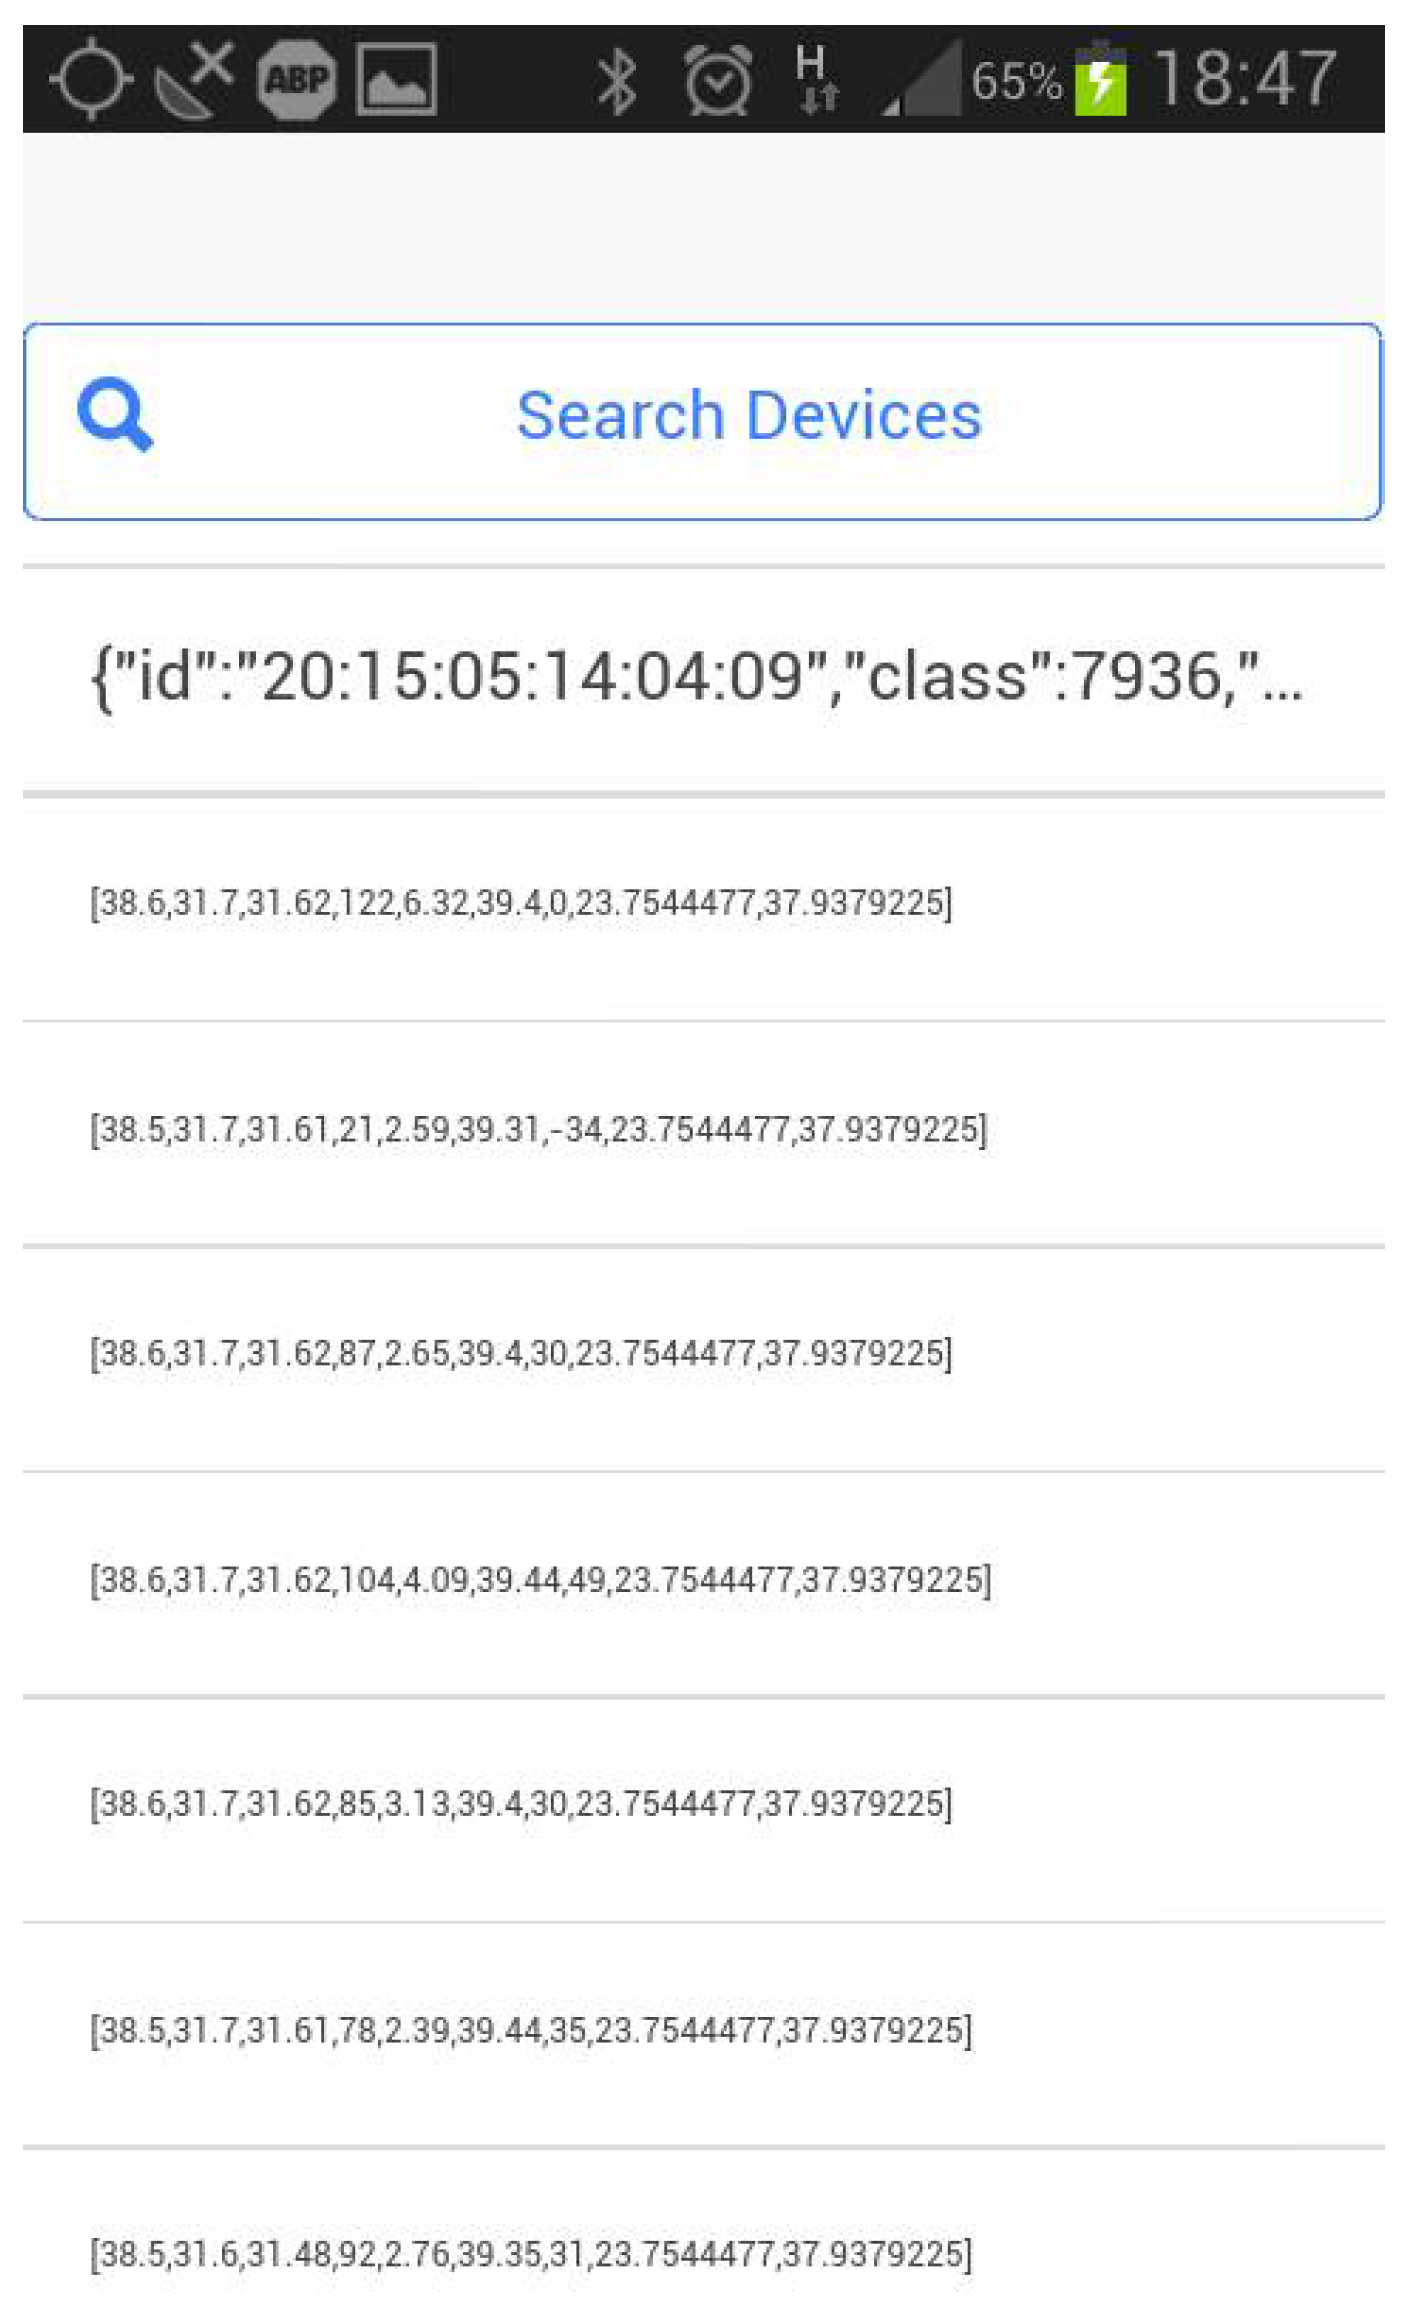
Figure 6.
Luminosity map, Athens.
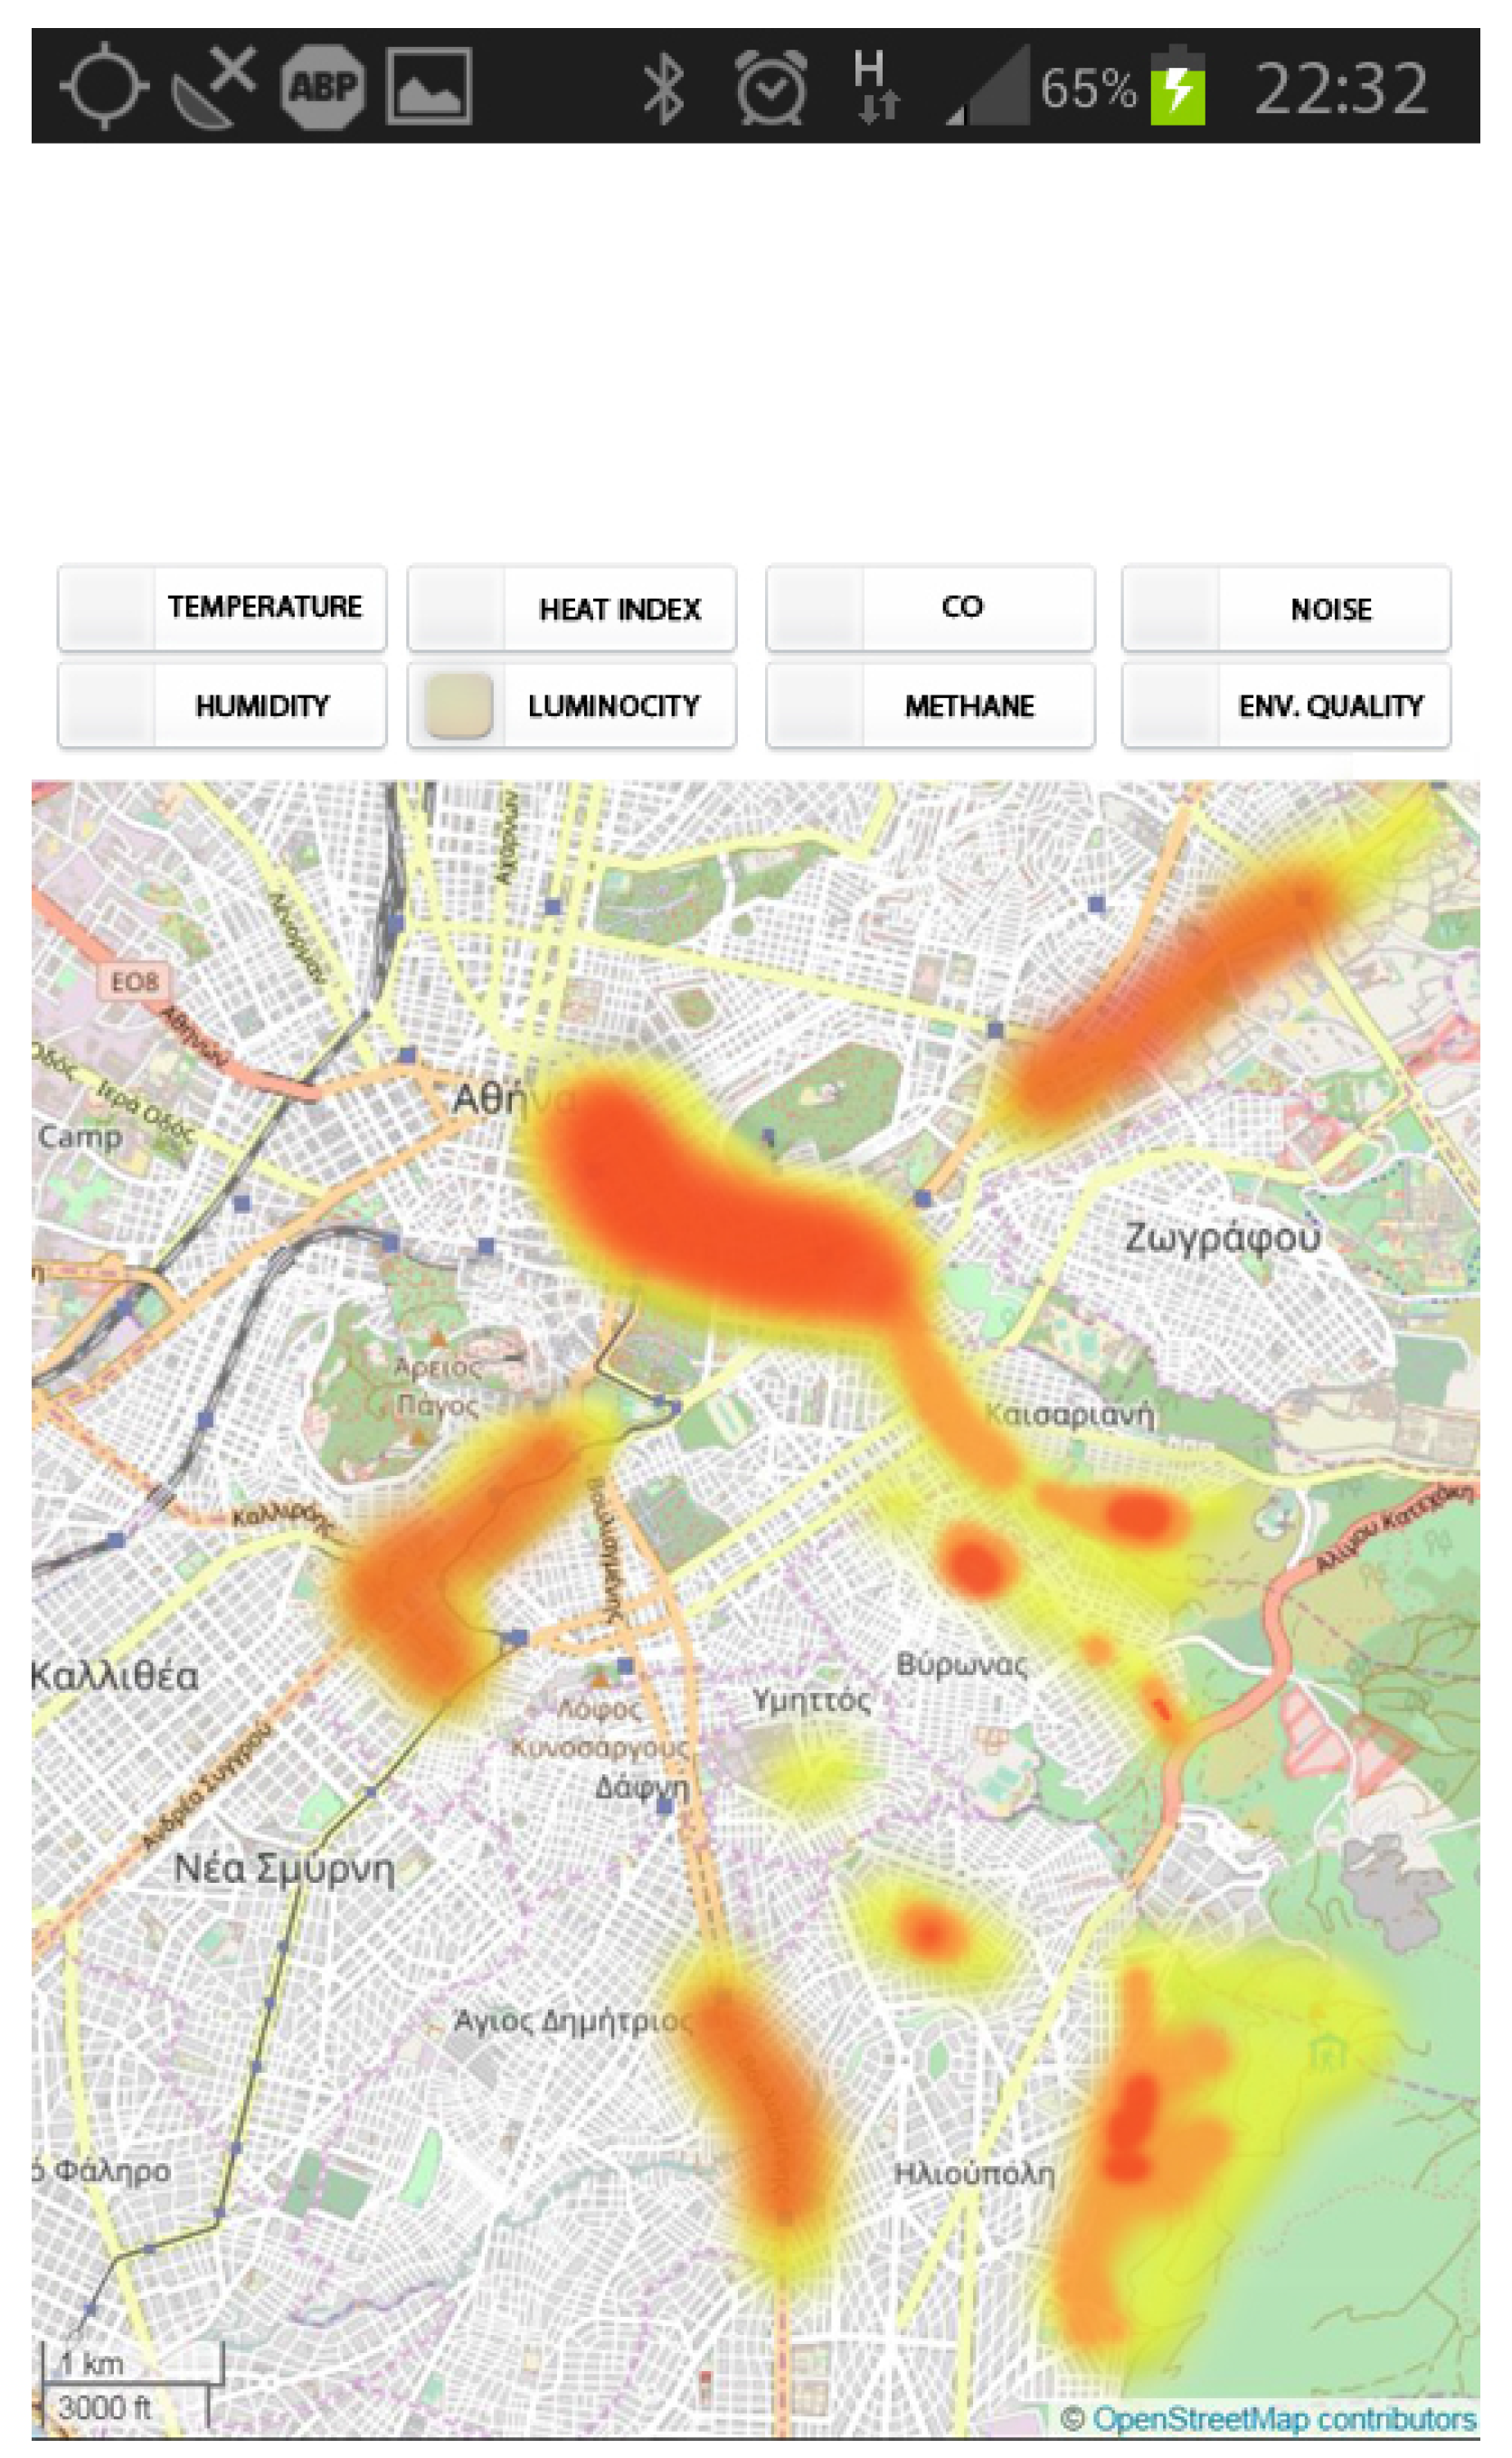
Figure 7.
Global Environmental Quality Assessment map, Athens.


Table 1.
Expansions, Functions and Units used on the recording devices.
| Expansion Type | Model | Function | Measurement Unit |
|---|---|---|---|
| Temperature, Humidity | DHT 22 | Temperature, Rel. Humidity, Heat Index | C, % Humidity, % C |
| Photometer | TEMT 2000 | Luminosity | Lux (lx) |
| Microphone | MAX 4466 | Noise Pollution/ Noise Intensity | dBm |
| Gasses microparticles | MQ-7 | Carbon Monoxide (CO) | ppm |
| Gasses microparticles | MQ-4 | Methane (CH4) | ppm |
© 2017 by the authors. Licensee MDPI, Basel, Switzerland. This article is an open access article distributed under the terms and conditions of the Creative Commons Attribution (CC BY) license (http://creativecommons.org/licenses/by/4.0/).
Share and Cite
MDPI and ACS Style
Voutos, Y.; Mylonas, P.; Spyrou, E.; Charou, E. A Social Environmental Sensor Network Integrated within a Web GIS Platform. J. Sens. Actuator Netw. 2017, 6, 27. https://doi.org/10.3390/jsan6040027
AMA Style
Voutos Y, Mylonas P, Spyrou E, Charou E. A Social Environmental Sensor Network Integrated within a Web GIS Platform. Journal of Sensor and Actuator Networks. 2017; 6(4):27. https://doi.org/10.3390/jsan6040027
Chicago/Turabian StyleVoutos, Yorghos, Phivos Mylonas, Evaggelos Spyrou, and Eleni Charou. 2017. "A Social Environmental Sensor Network Integrated within a Web GIS Platform" Journal of Sensor and Actuator Networks 6, no. 4: 27. https://doi.org/10.3390/jsan6040027
Note that from the first issue of 2016, this journal uses article numbers instead of page numbers. See further details here.