Wearable-Based Human Activity Recognition Using an IoT Approach


Department of Electronics, School of Engineering, Pontificia Universidad Javeriana, Cr. 7 No. 40-62 Bldg. Jose Gabriel Maldonado, Bogota 110111, Colombia
*
Author to whom correspondence should be addressed.
J. Sens. Actuator Netw. 2017, 6(4), 28; https://doi.org/10.3390/jsan6040028
Submission received: 30 September 2017
/
Revised: 15 November 2017
/
Accepted: 17 November 2017
/
Published: 24 November 2017
(This article belongs to the Special Issue Sensors and Actuators in Smart Cities)
Abstract
:This paper presents a novel system based on the Internet of Things (IoT) to Human Activity Recognition (HAR) by monitoring vital signs remotely. We use machine learning algorithms to determine the activity done within four pre-established categories (lie, sit, walk and jog). Meanwhile, it is able to give feedback during and after the activity is performed, using a remote monitoring component with remote visualization and programmable alarms. This system was successfully implemented with a 95.83% success ratio.
1. Introduction
The Internet of Things, IoT, is a new concept in which all sensing objects can be connected to the internet to have remote and constant access to its measurements (data). This access allows for taking action in a faster way, with better results and much more data involved [1,2]. The data that compose these kinds of systems can go from temperature [3], outdoor location [4], indoor location [5], storage stock, humidity or other industry related variables [6]. In short, any sensor that can be connected to the Internet makes part of an IoT paradigm [7].
In such a way, classical applications of pervasive computing can be upgraded to an IoT scheme for an activity recognition application: Human Activity Recognition (HAR). These applications, in their classical approach, have been researched, evaluated and developed to the point that several commonly available products have HAR systems built in. This can be seen on some fitness trackers, references [8,9], which have HAR systems built into the mobile applications of their manufacturer. These applications usually register and analyze daily and sleep activity [10]. The HAR system consists of sensing the person’s positioning and movement, performing a feature extraction and a classification of those features to decide which activity was performed in a pre-selected list of activities [11,12,13]. The HAR systems have several methods to perform recognition, the most common one being an artificial vision assisted system [14,15]. This kind recognition can be seen in commercial products such as the Microsoft KinectTM [16]. Despite the many benefits and high popularity, in both usability and research, of vision assisted HAR, it presents several disadvantages for subjects such as accuracy, coverage and cost. Another method that can overcome these challenges are on-body sensors systems or wearable assisted HAR [17]. This kind of approach relies on wearable sensors present throughout the body, which help to perform the recognition [18]. This method can either require that the subject wear one [19,20] or more [21] for pre-established periods of time. Some systems even require that the device(s) have to be permanently worn by the person [22]. These devices could be those within another device such as a smartphone [23,24].
In this paper, we present a more detailed and novel version of an HAR-IoT system that employs a single device with occasional usage, as seen in [20] presented at the International Conference on Future Networks and Distributed Systems (ICFNDS) 2017. This system is intended to be used by patients with chronic heart diseases, patients that have their health status in a non-critical condition but still need constant monitoring. The presented system focuses on the daily routine, activity and physical therapy that each patient must have as part of their recuperation process. Although an IoT approach needs a security analysis [25,26], our approach to the IoT does not rely on a wireless sensor network (WSN) [27], the data information is not sensitive to outside listeners [28] and, as previously stated, the focus of the paper is to validate the presented approach to HAR-IoT systems.
The HAR-IoT system uses a specialized hardware for vital signs monitoring including embedded heart, respiration and body acceleration sensors. The activity recognition was implemented using a classifier that uses the information gathered by this hardware. Two different methods were implemented for the classifiers: Bayes [29] and C4.5 [30]. An (IoT) cloud based component was integrated [31,32] to perform different tasks, such as: remote consultation [33], feedback and therapy control for both duration and quality [34] or even an online classification service [35]. This component also grants remote access to the data and configurable alerts for the activity done, if needed. This paper presents a novel interaction between a traditional HAR system and an IoT system with a different approach to the classical feature extraction in an HAR system, which resulted in a 95.83% success ratio with a notable small training data set.
This work will be presented as follows: in Section 2, the system architecture is explained and complemented with the system description in Section 3. Section 4 focuses on explaining the feature extraction method and the classifier information. The experiments and results are presented in Section 5, and, finally, the conclusions are shown in Section 6.
2. System Architecture
The proposed system is composed of two main modules: a traditional HAR system that can be implemented on any mobile and non-mobile device, and an e-health application of any recognition or surveillance system used in a health care related subject. These modules work independently, but the novelty of the approach lays with the increase of availability and decrease response times.
2.1. HAR Systems
An HAR system is a specific application of pattern recognition and expert systems. This recognition works in two phases: a training phase and a recognition phase. Although both have similar steps, the training phase has a priori information of the activities done and the recognition phase uses the knowledge of the training phase to have accurate recognition. This means that the recognition phase is highly dependent on the training phase success.
2.1.1. Learning/Training Phase
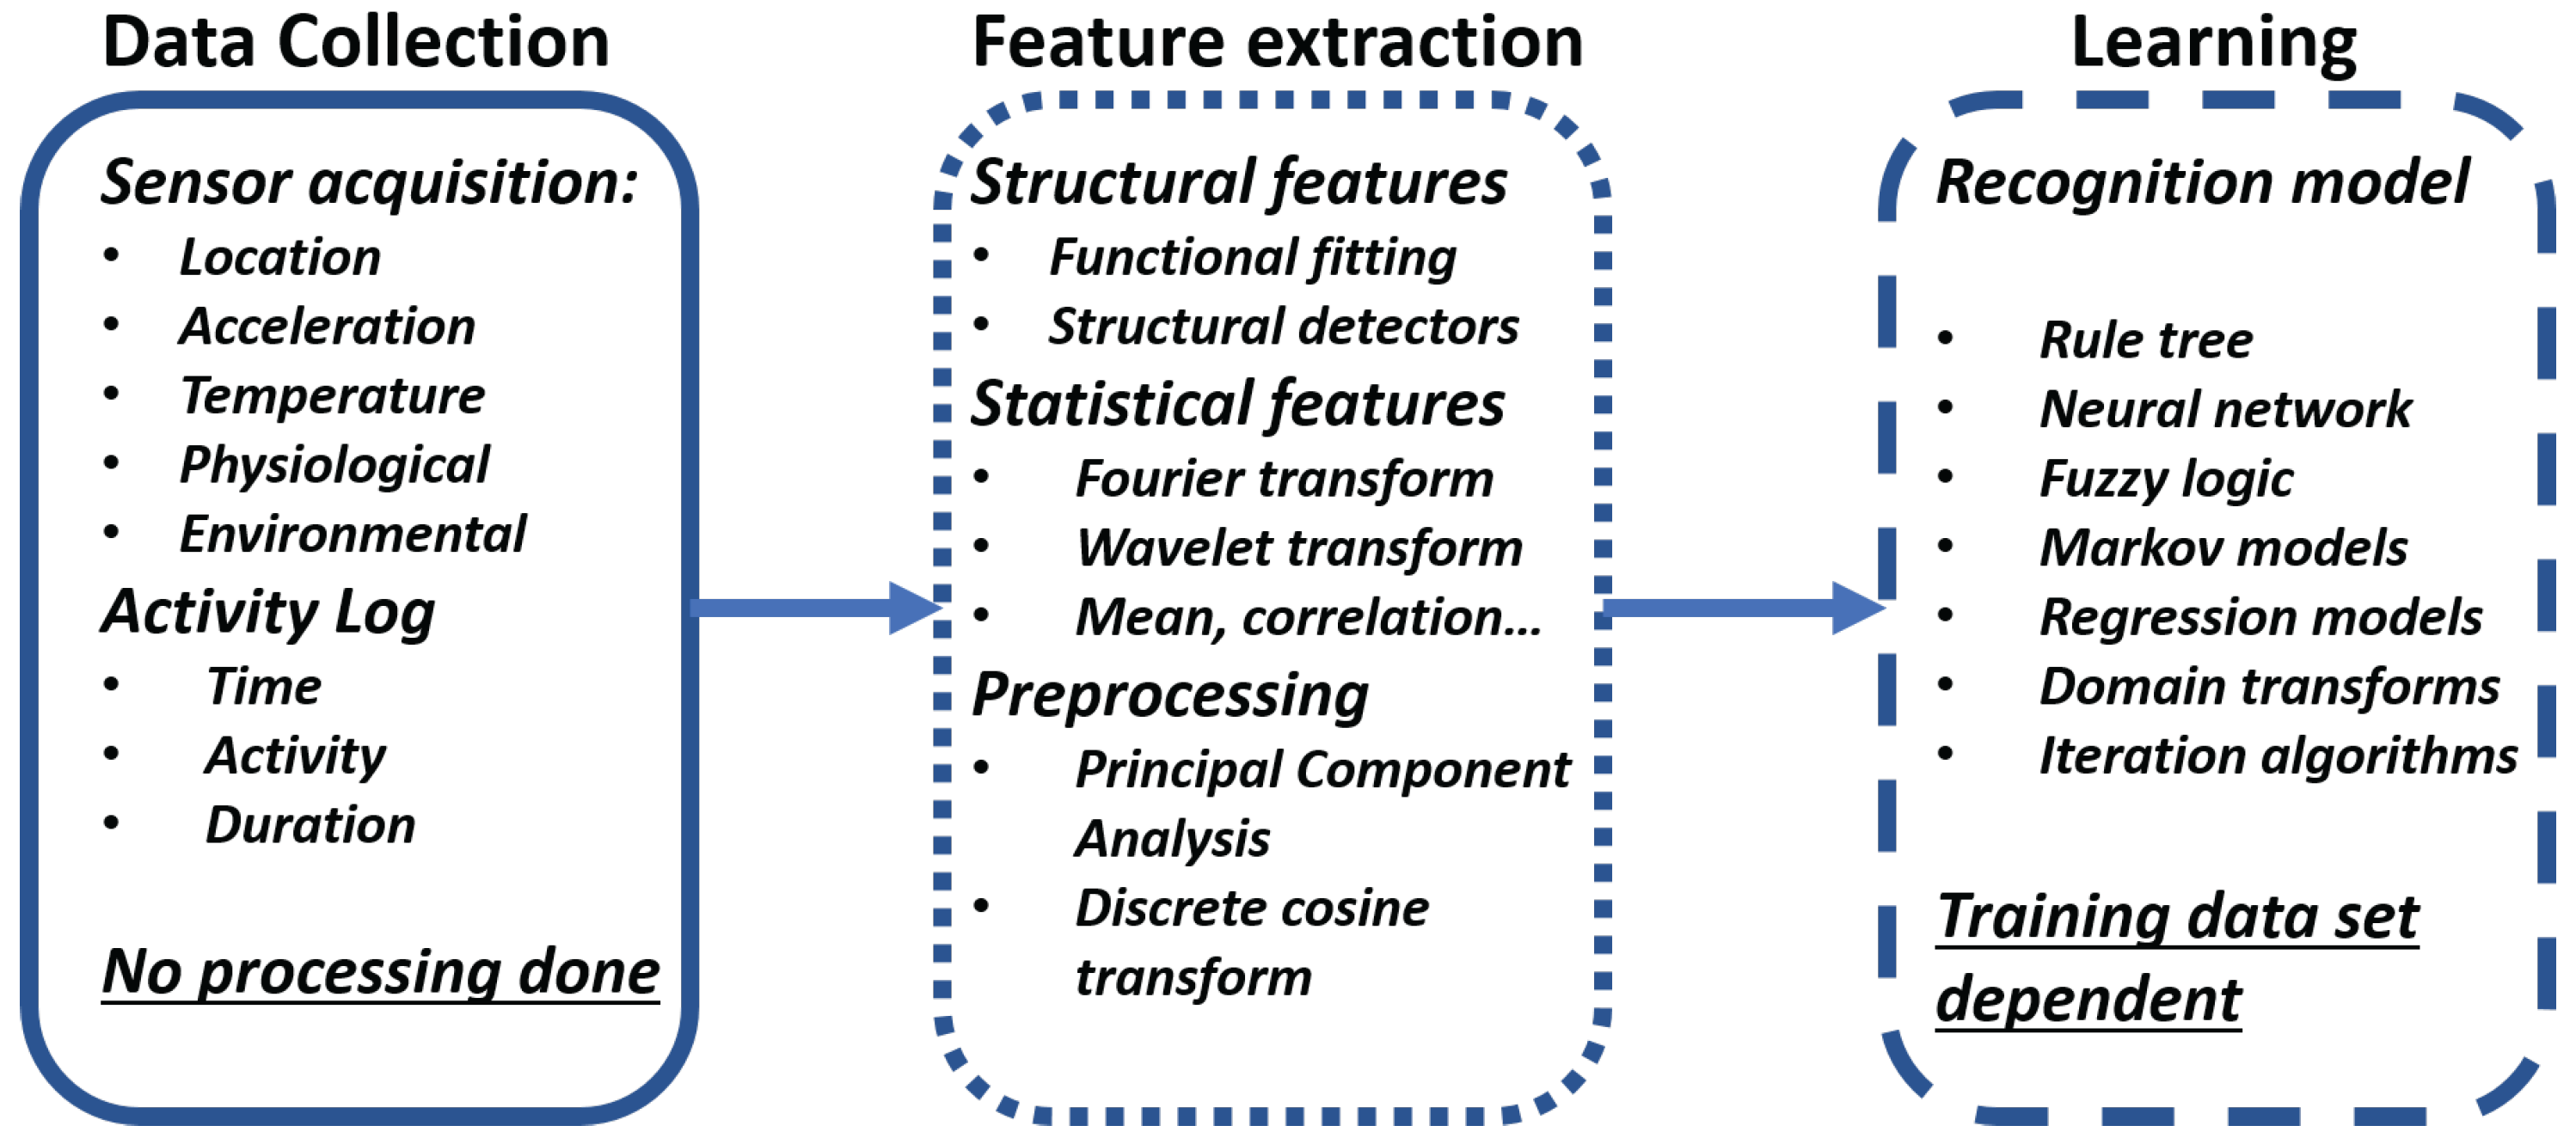
The learning or training phase is the first phase of any recognition algorithm. This phase is in charge of establishing the relations between the data and the activities. It has three main steps (Figure 1):
- Data collection: The data collection step conducts the data acquisition from all the sensors available for the system. The sensor available will be dependent on the kind of device that the recognition is built for. This step needs an activity log of every activity performed detailing the time, the type and duration. The training phase must consider all possible activities, needing all to be performed, preferably, in an aleatory manner without a correlation in activity, duration or any other factor that might be involved in the recognition. It is important to note that the data collection is done without any signal processing as all processing and analysis is done during the feature extraction step.
- Feature extraction: The feature extraction step has several possibilities depending on the kind of sensors and variables types that are involved during the data collection step. There can be structural features and statistical features. The structural features are those that try to find interrelation or correlation between the signals. This also means that the signal can fit a previously defined mathematical function to the current state of the variables. The statistical feature extraction performs a transformation on the signal using statistical information. These features could be the mean of the signal, standard deviation, correlation, etc. The most common transformations performed are the Fourier and Wavelet transforms. During this step, it is common to perform signal processing to eliminate noise, reduce the range of the signal or perform other kinds of processing to better extract the relevant features for each activity.
- Learning: The learning or the final step of the training phase is the development of a recognition model that is learned from the data set, the activity log and the relevant features to properly recognize any activity. This step is highly dependent on the training data set, which is the reason for the strict methodology and rigorous logging on the data collection step. There are many recognition models that can go from a rule tree based on signal parameters, neural networks, statistical base algorithms or fuzzy logic, each one having their advantages and disadvantages. Based on the complexity, response time and available resources, the model must be selected to best fit the system demands.
2.1.2. Recognition Phase
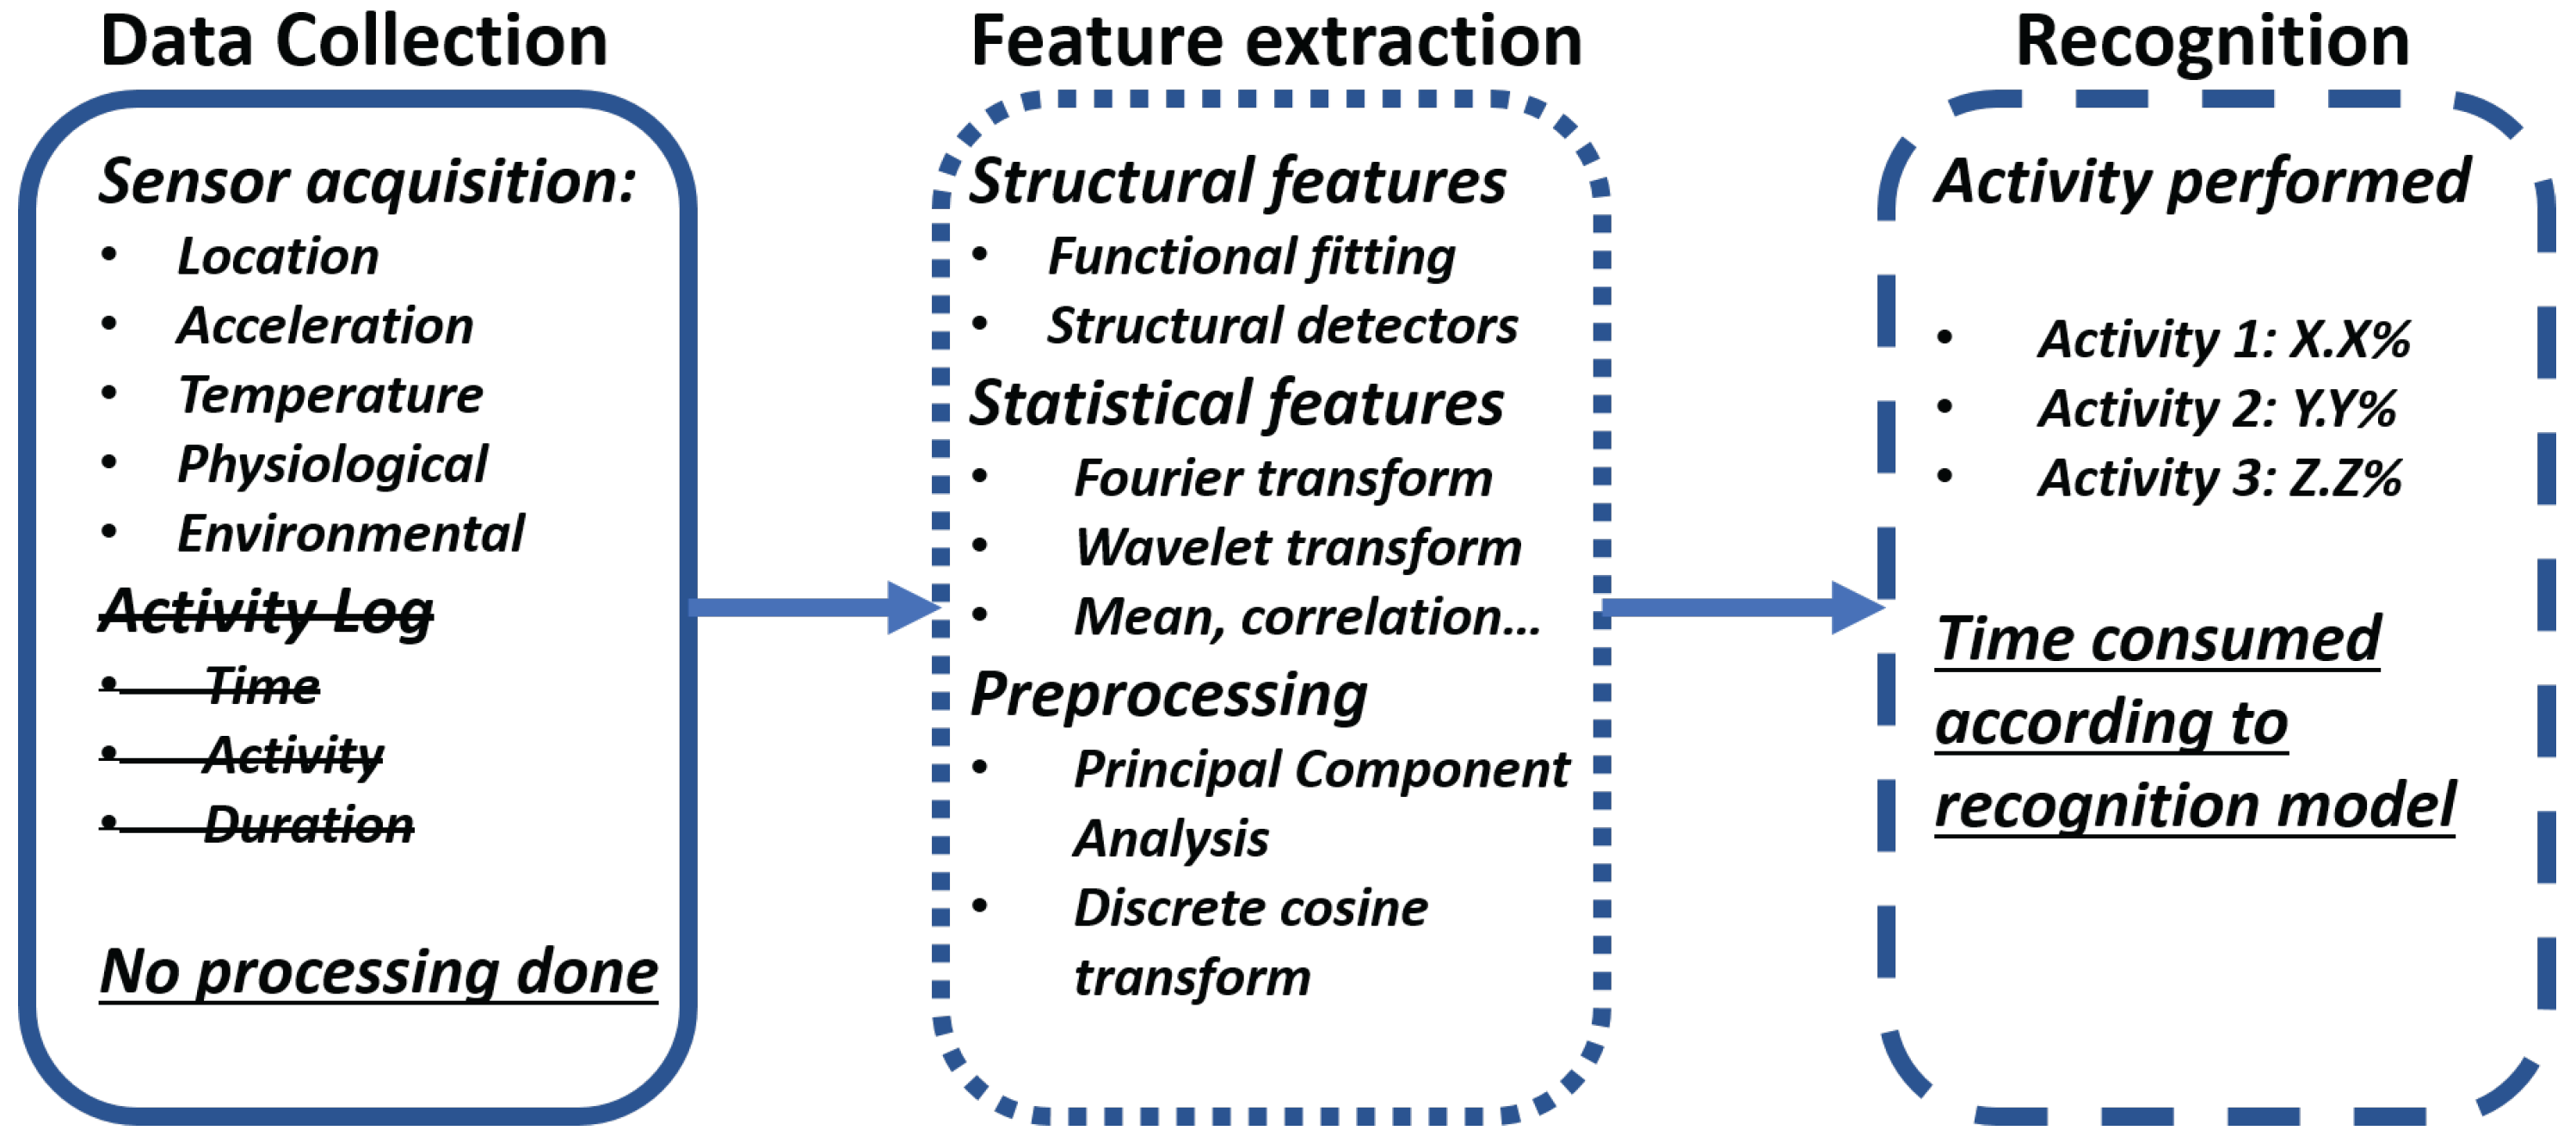
The recognition phase is the final phase of an HAR system. It does the recognition of the activity performed using the training phase result. The recognition phase has three main steps (Figure 2):
- Data collection: The data collection step does the data acquisition of all the sensors available for the recognition. The sensor available will be dependent on the kind of device that the recognition is built for. Unlike the learning phase, there is not any prior knowledge of the activities performed, so there is no need, either choice, to have an activity log. It is important to note that the data collection is done without any signal processing, as all processing and analysis is done during the feature extraction step.
- Feature extraction: The feature extraction step has several possibilities according to the kind of sensors and variable types that are involved during the data collection step. There can be structural features and statistical features. The structural features are those that try to find interrelation or correlation between the signals. This also means that the signal can fit a previously defined mathematical function to the current state of the variables. The statistical feature performs transformation on the signal using statistical information. This could be using the mean of the signal, standard deviation, correlation, etc. The most common transformations performed are the Fourier and Wavelet transforms. During this step, it is common to perform signal processing to eliminate noise, reduce the range of the signal or perform other kinds of processing to better extract the relevant features for each activity.
- Recognition: The recognition or the final step of the training phase is the inference of the activity performed using the gathered data and extracted features on the previous steps using the recognition model of the training phase. This step decides which of the possible activities were done with a percentage of accuracy, which depends on the recognition model. This step is the most time-consuming part of any HAR system and, according to the selected model and available resources, this time and accuracy change.
2.2. E-Health Applications
An IoT solution gathers information from the available sensors, people and/or electronic devices. If the data source, application, user or place of implementation are related to the healthcare industry, it is called an e-health solution. These kinds of applications provide a novel approach to the healthcare system, which bring new and better services such as constant monitoring of patients and remote consultation services. All of these services provide a faster and reliable healthcare industry with almost zero waiting time, changing the classical approach of the healthcare system from a reactive service to a preemptive industry.
In this project, the main focus is to improve the healthcare services that take care of patients for which their health status is not in a critical condition, but they still need constant monitoring. To better understand the proposed solution, it is necessary to discuss and understand the general scheme of a remote patient service, especially home remote patient monitoring. The general architecture of a remote patient service (Figure 3) includes a variety of sensor and/or medical devices to measure relevant variables of the patient that include but are not limited to:
- Heart Rate.
- Respiration rate.
- Weight.
- Oxygen saturation.
- Posture.
According to the signal properties and signal availability, the data is transmitted via the Internet to a database. Inside the database, the data can be constantly analyzed, displayed or even take action, usually in the form of alarms, to give a better healthcare service. The constant availability of the data implies a full time monitoring of the relevant data of the patient, which makes it easier to detect an abnormality on the patient. This also means that the medical record of the patient gets a huge amount of data, opening the possibility of performing a more integral and objective medical diagnosis. This will reduce the cost service, improve the recuperation time and will improve the efficiency on the healthcare system overall.
The lower cost service is associated with the fact that the patient will assume the high expenses related to it, accommodation and infrastructure related costs. There is also a reduction in staffing cost, as the remote monitoring implicates that the qualified personnel for the care services does not need to be present at the patient location, and one person can be in charge of the tracking of more than one patient at a time, with the help of the data analytics of the system. In addition, at their homes, the patient’s recuperation process can be accelerated, as a remote care service greatly minimizes the exposure of the patient to others’ diseases, comparing this scenario to a classical hospitalization environment.
Having the patient data in real time will improve any treatment, as the adjustments of the quantity, methodology and other factors of the treatment can be adjusted in the same manner. This follows a paradigm to change from a situational response to a situation prevention and avoid high risk scenarios. This real-time management allows the procedures to be simpler and more efficient. Consequently, there will be great improvement on the quality of life of patients undergoing remote monitoring services, with stress levels lowering because of their home accommodation rather than in a hospital. The implemented solution will be described in further sections.
3. System Description
The goal of this prototype is to implement an HAR-IoT system, which needs to be able to measure physiological variables, have an HAR component that works according to the sensor data, and implement a cloud system for data storage and remote display. Intelligent alarms can be programmed according to different levels following the hospital requirements.
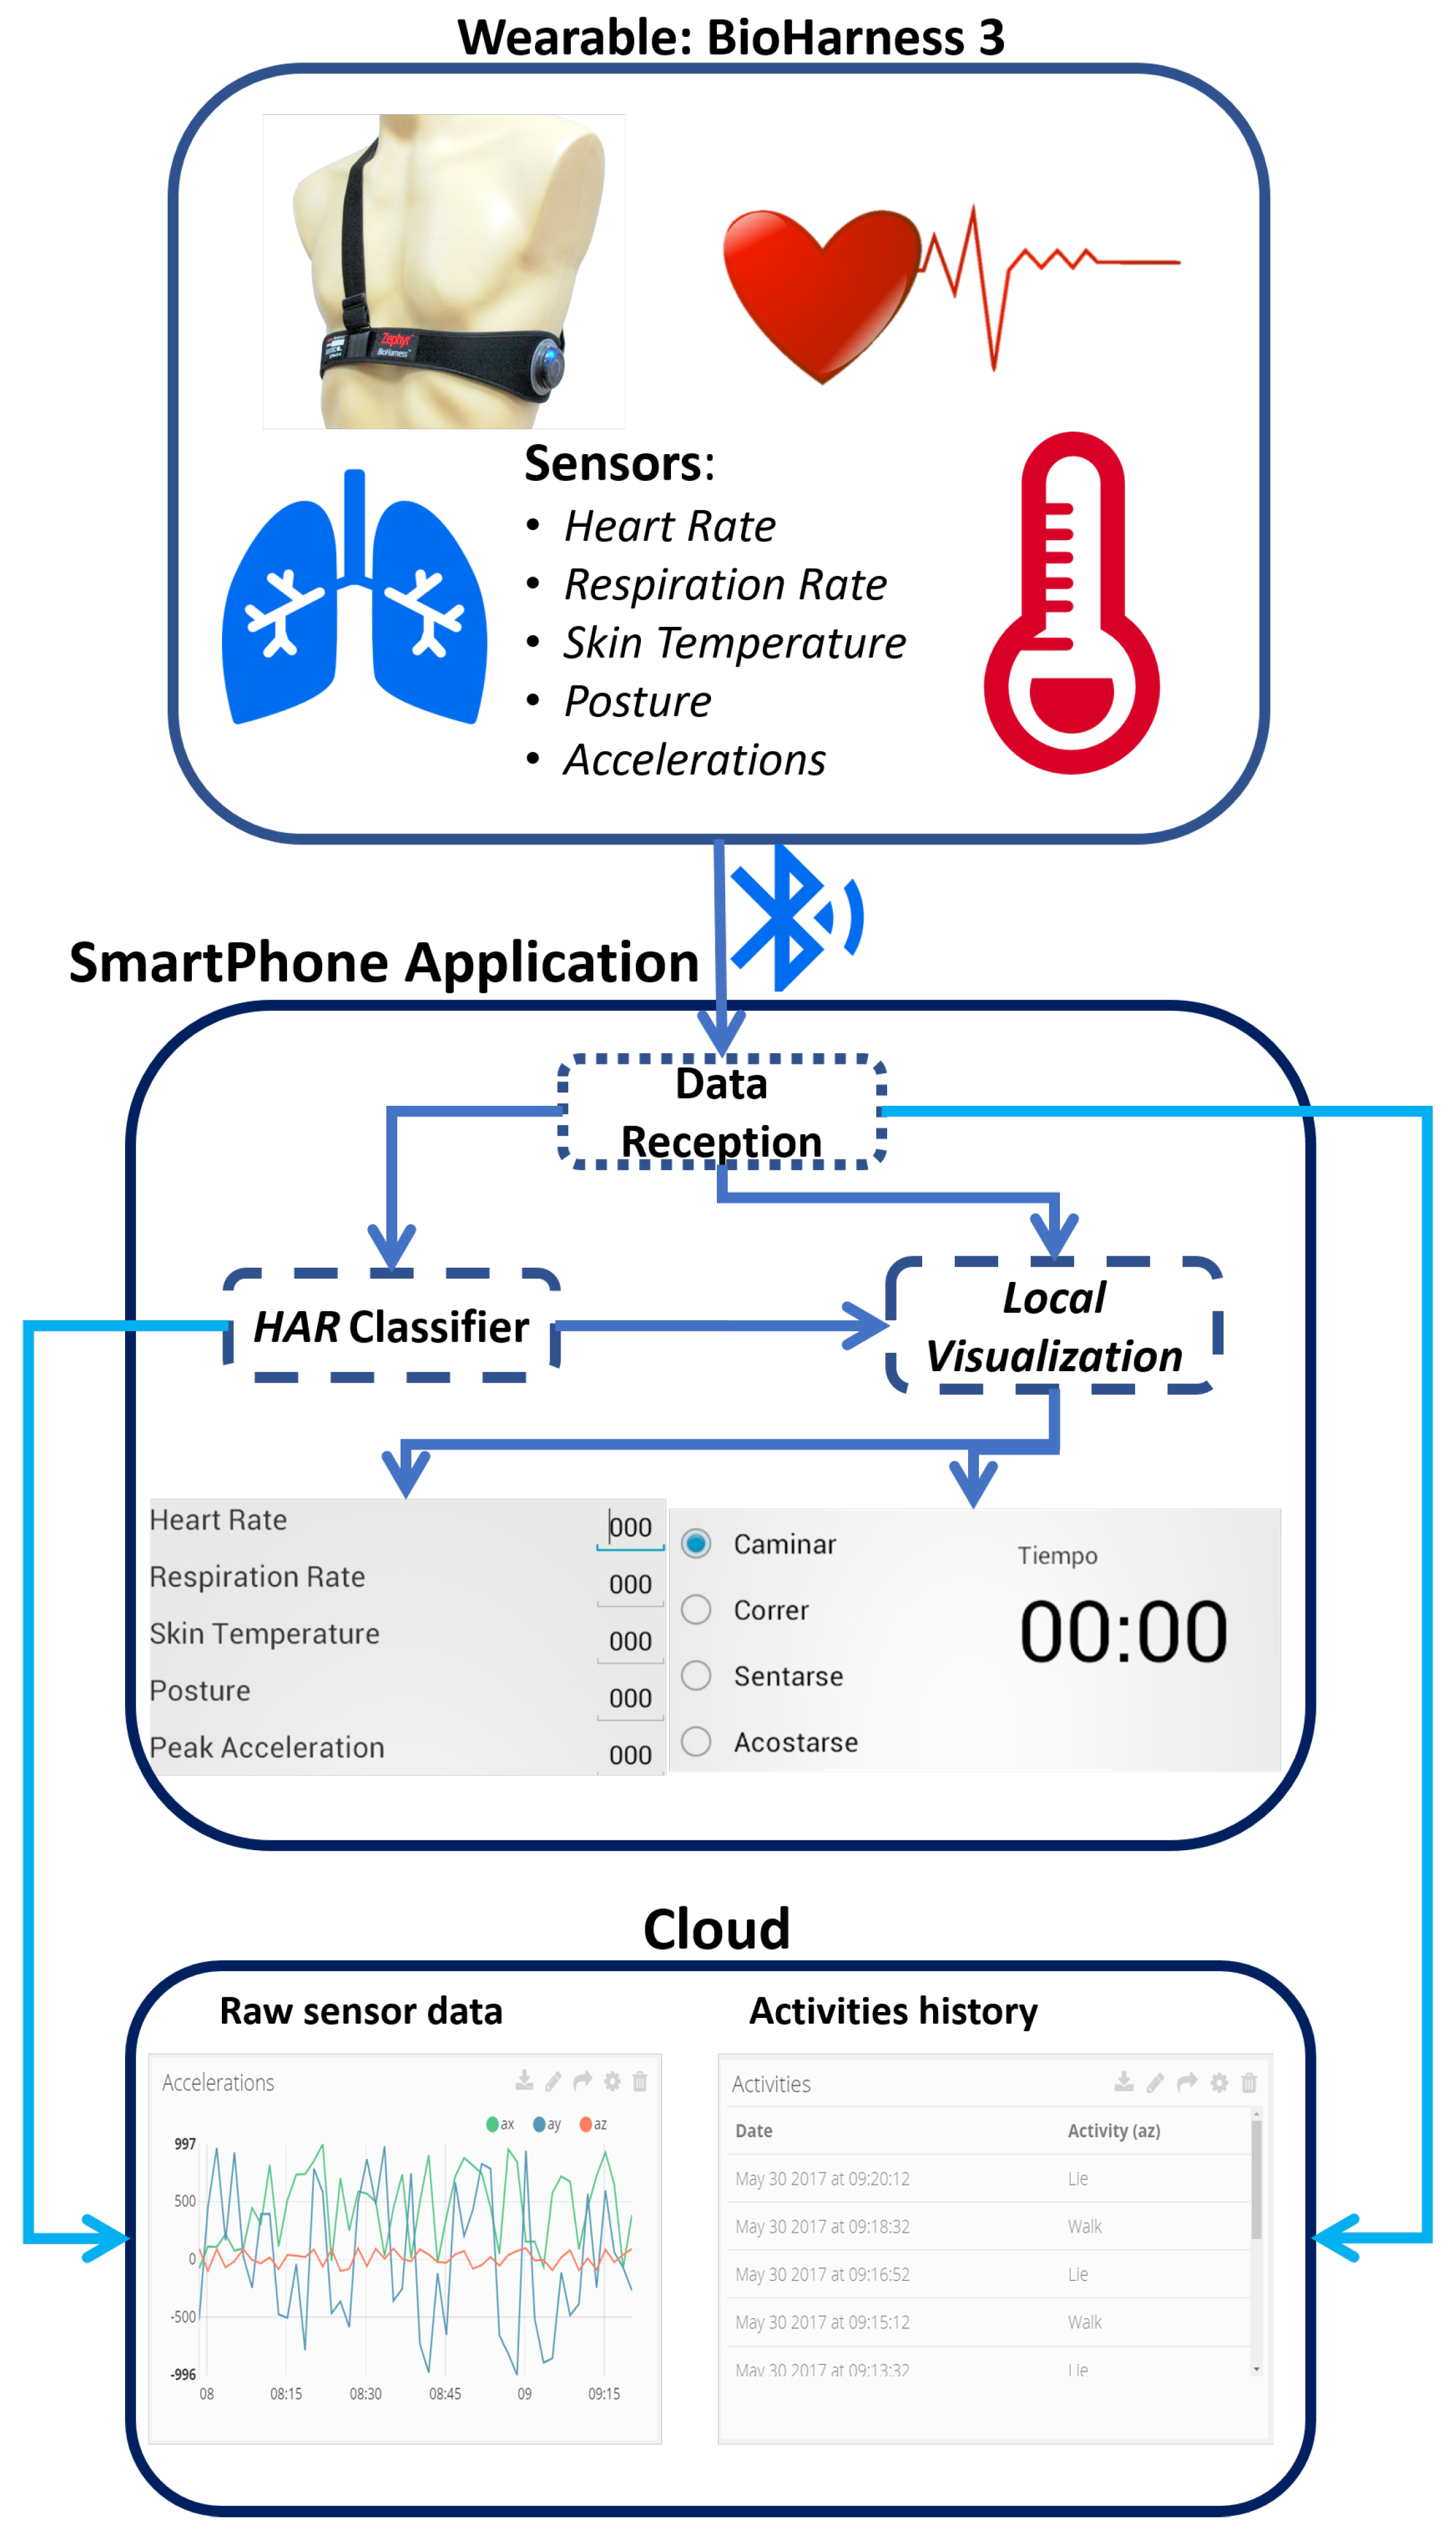
The system’s block diagram is composed of three main elements (wearable, the smartphone application and the cloud ). This diagram is shown in Figure 4:
- Wearable: The selected wearable is the Bioharness (Zaphyr, Annapolis, Maryland, US). This wearable is capable of measuring several physiological variables (for more information, see Section 3.1) and connect to a smartphone via Bluetooth.
- Smartphone application: This application has three main components. The data reception that handles the communication and storage of the raw sensor data of the wearable. The HAR classifier, which recognizes the kind of movement done at that moment using the raw sensor data, a classifier algorithm and a machine learning process. Furthermore, a local visualization is responsible for displaying raw sensor data and the activity recognized.
- Cloud: The cloud component receives all the raw data of the wearable and the activities recognized by the HAR classifier. All the data is stored and can be consulted online using a web browser.
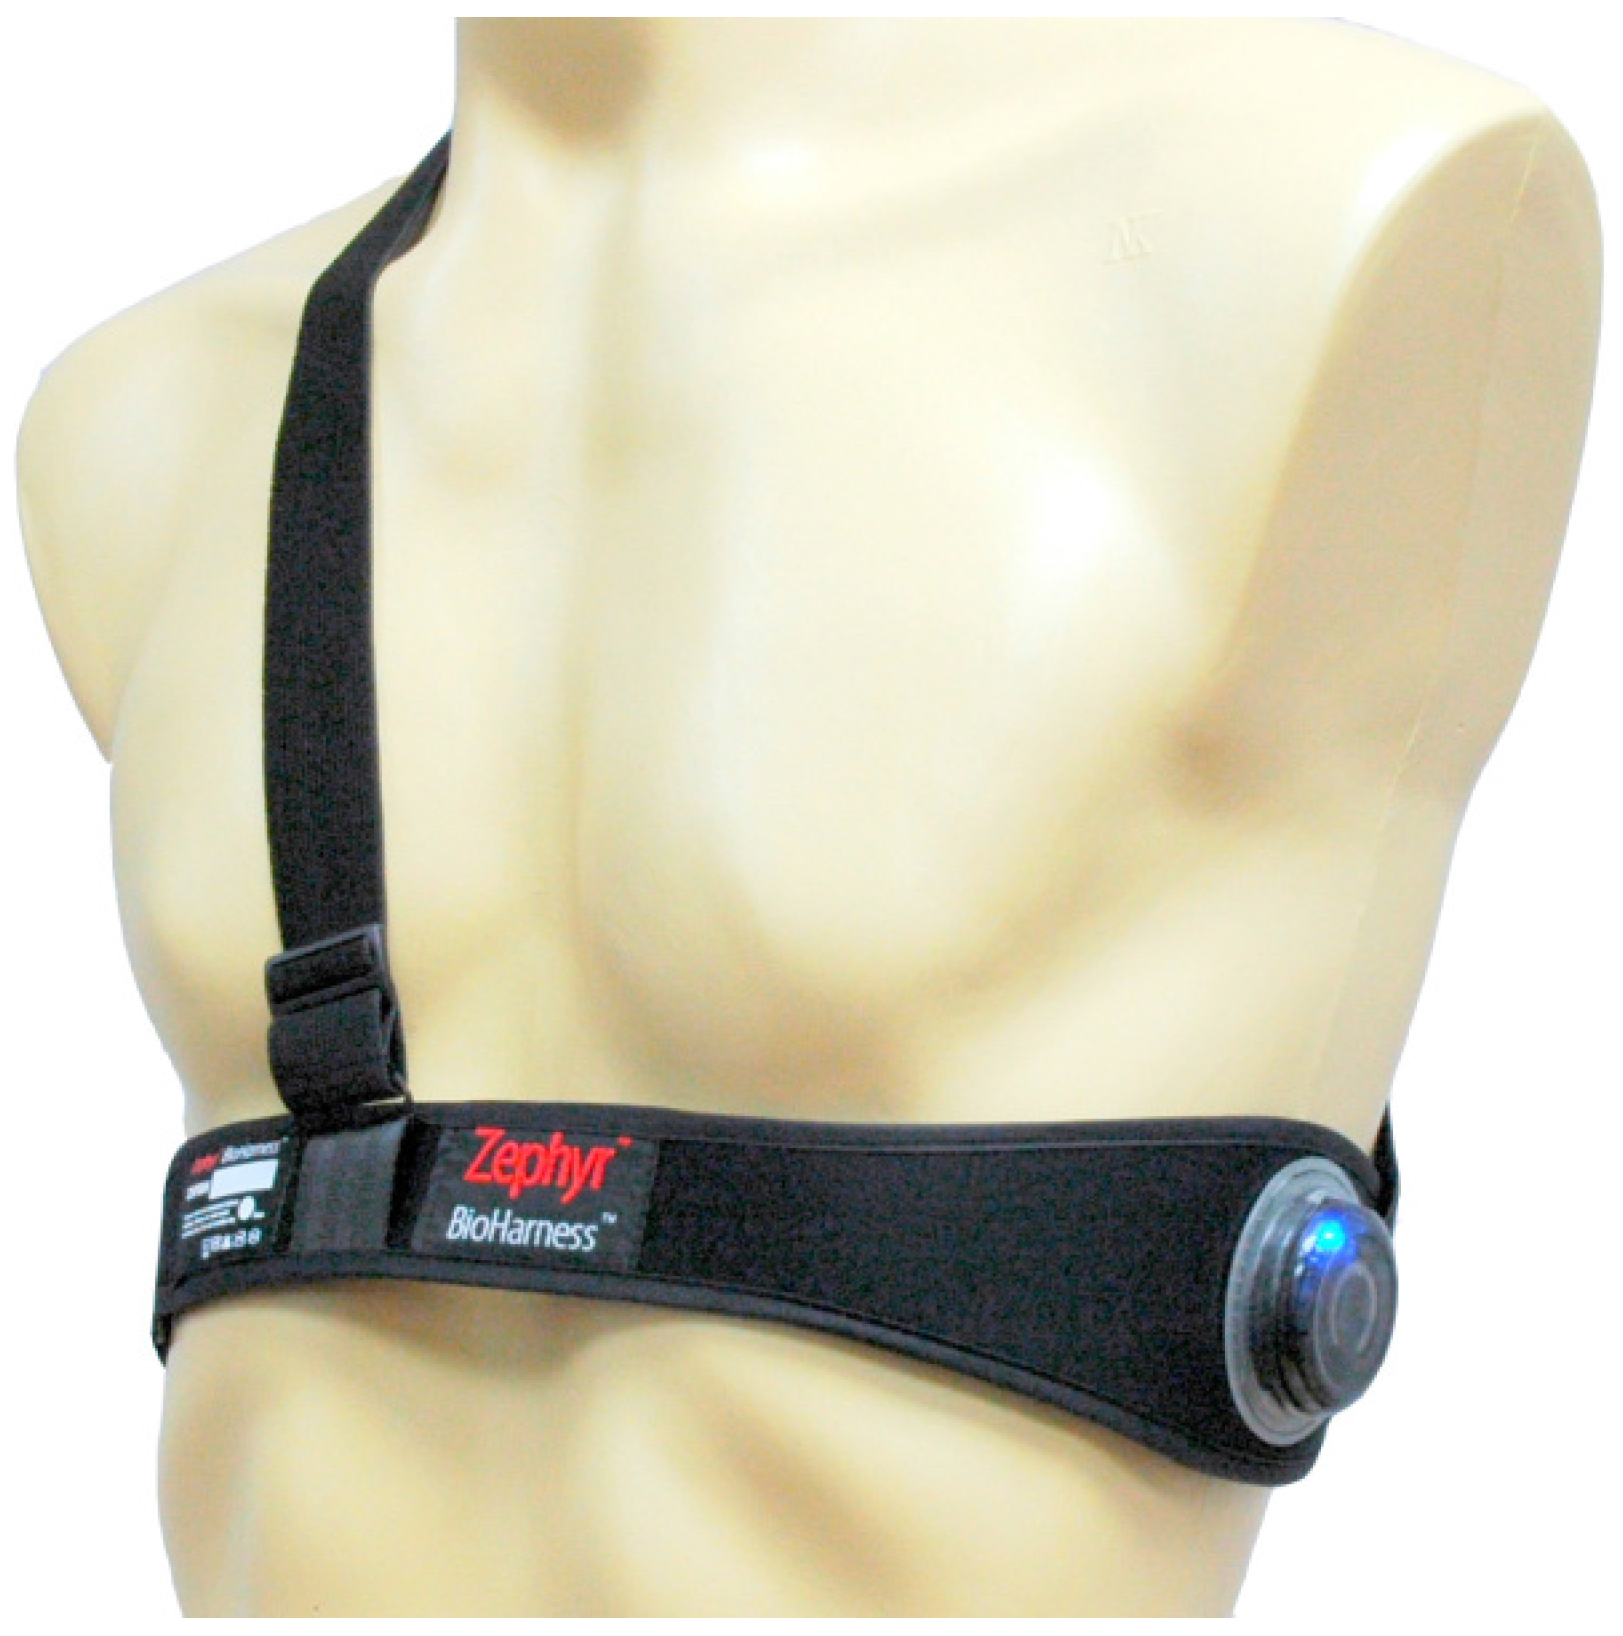
3.1. Hardware Component
The selected wearable device (Figure 5) was the ZephyrTM Bioharness 3 model K113045. This is a device that measures physiological variables [36]. It can measure heart rate, heart rate variability, and respiratory rate, it has a built-in accelerometer for posture and several activity analysis. These sensors are embedded on an elastic band that must be worn at chest height and pressured against the skin. The strap design allows it to be used under regular clothes, at any given place such as the work place, home and/or health centers.
The Bioharness 3 has a special characteristic that allows the device to not require the use of electrolytic gel nor any adhesive material for its proper operation, unlike other skin-contact devices. The device has an internal storage in which all the physiological data is saved as it performs measurements. When the Bioharness 3 connects via Bluetooth (class 1) to another device, it sends the storage data to the device. If the Bioharness 3 is connected while performing measurements, the data sent is the last measurement done. The strap of the Bioharness is washable and the plastic where all the sensors are can be submerged up to 1 m under water. Table 1 contains the detailed information as provided by the manufacturer.
3.2. Software Component
The software components of the system have two separate environments. The first is a smartphone application to gather, analyze, locally visualize and send the data to the cloud and is implemented for Android devices. The other one is a cloud environment. This allows for remote visualization of the raw data and activity recognition, and can have several configurable alarms.
3.2.1. Smartphone Application
The gathering of data, analysis and patient local interface of the project was implemented in a smartphone application compatible with Android 4.1 or higher. This application, as seen in the block diagram (Figure 4), has the following main functions:
- Data reception: The application has to receive Bioharness information packages using Bluetooth protocol. Then, the system has to discriminate the packages to get all the individual sensors’ information.
- HAR classifier: With the raw sensor data, the app uses a classifier algorithm to build a recognition model to estimate the current activity.
- Local visualization: All the latest sensor data can be seen in the mobile screen, in conjunction with the latest recognized activity.
Both the sensor’s raw data and the recognized activity is sent to the cloud system using either HTTP or Message Queue Telemetry Transport (MQTT) protocols.
3.2.2. Cloud
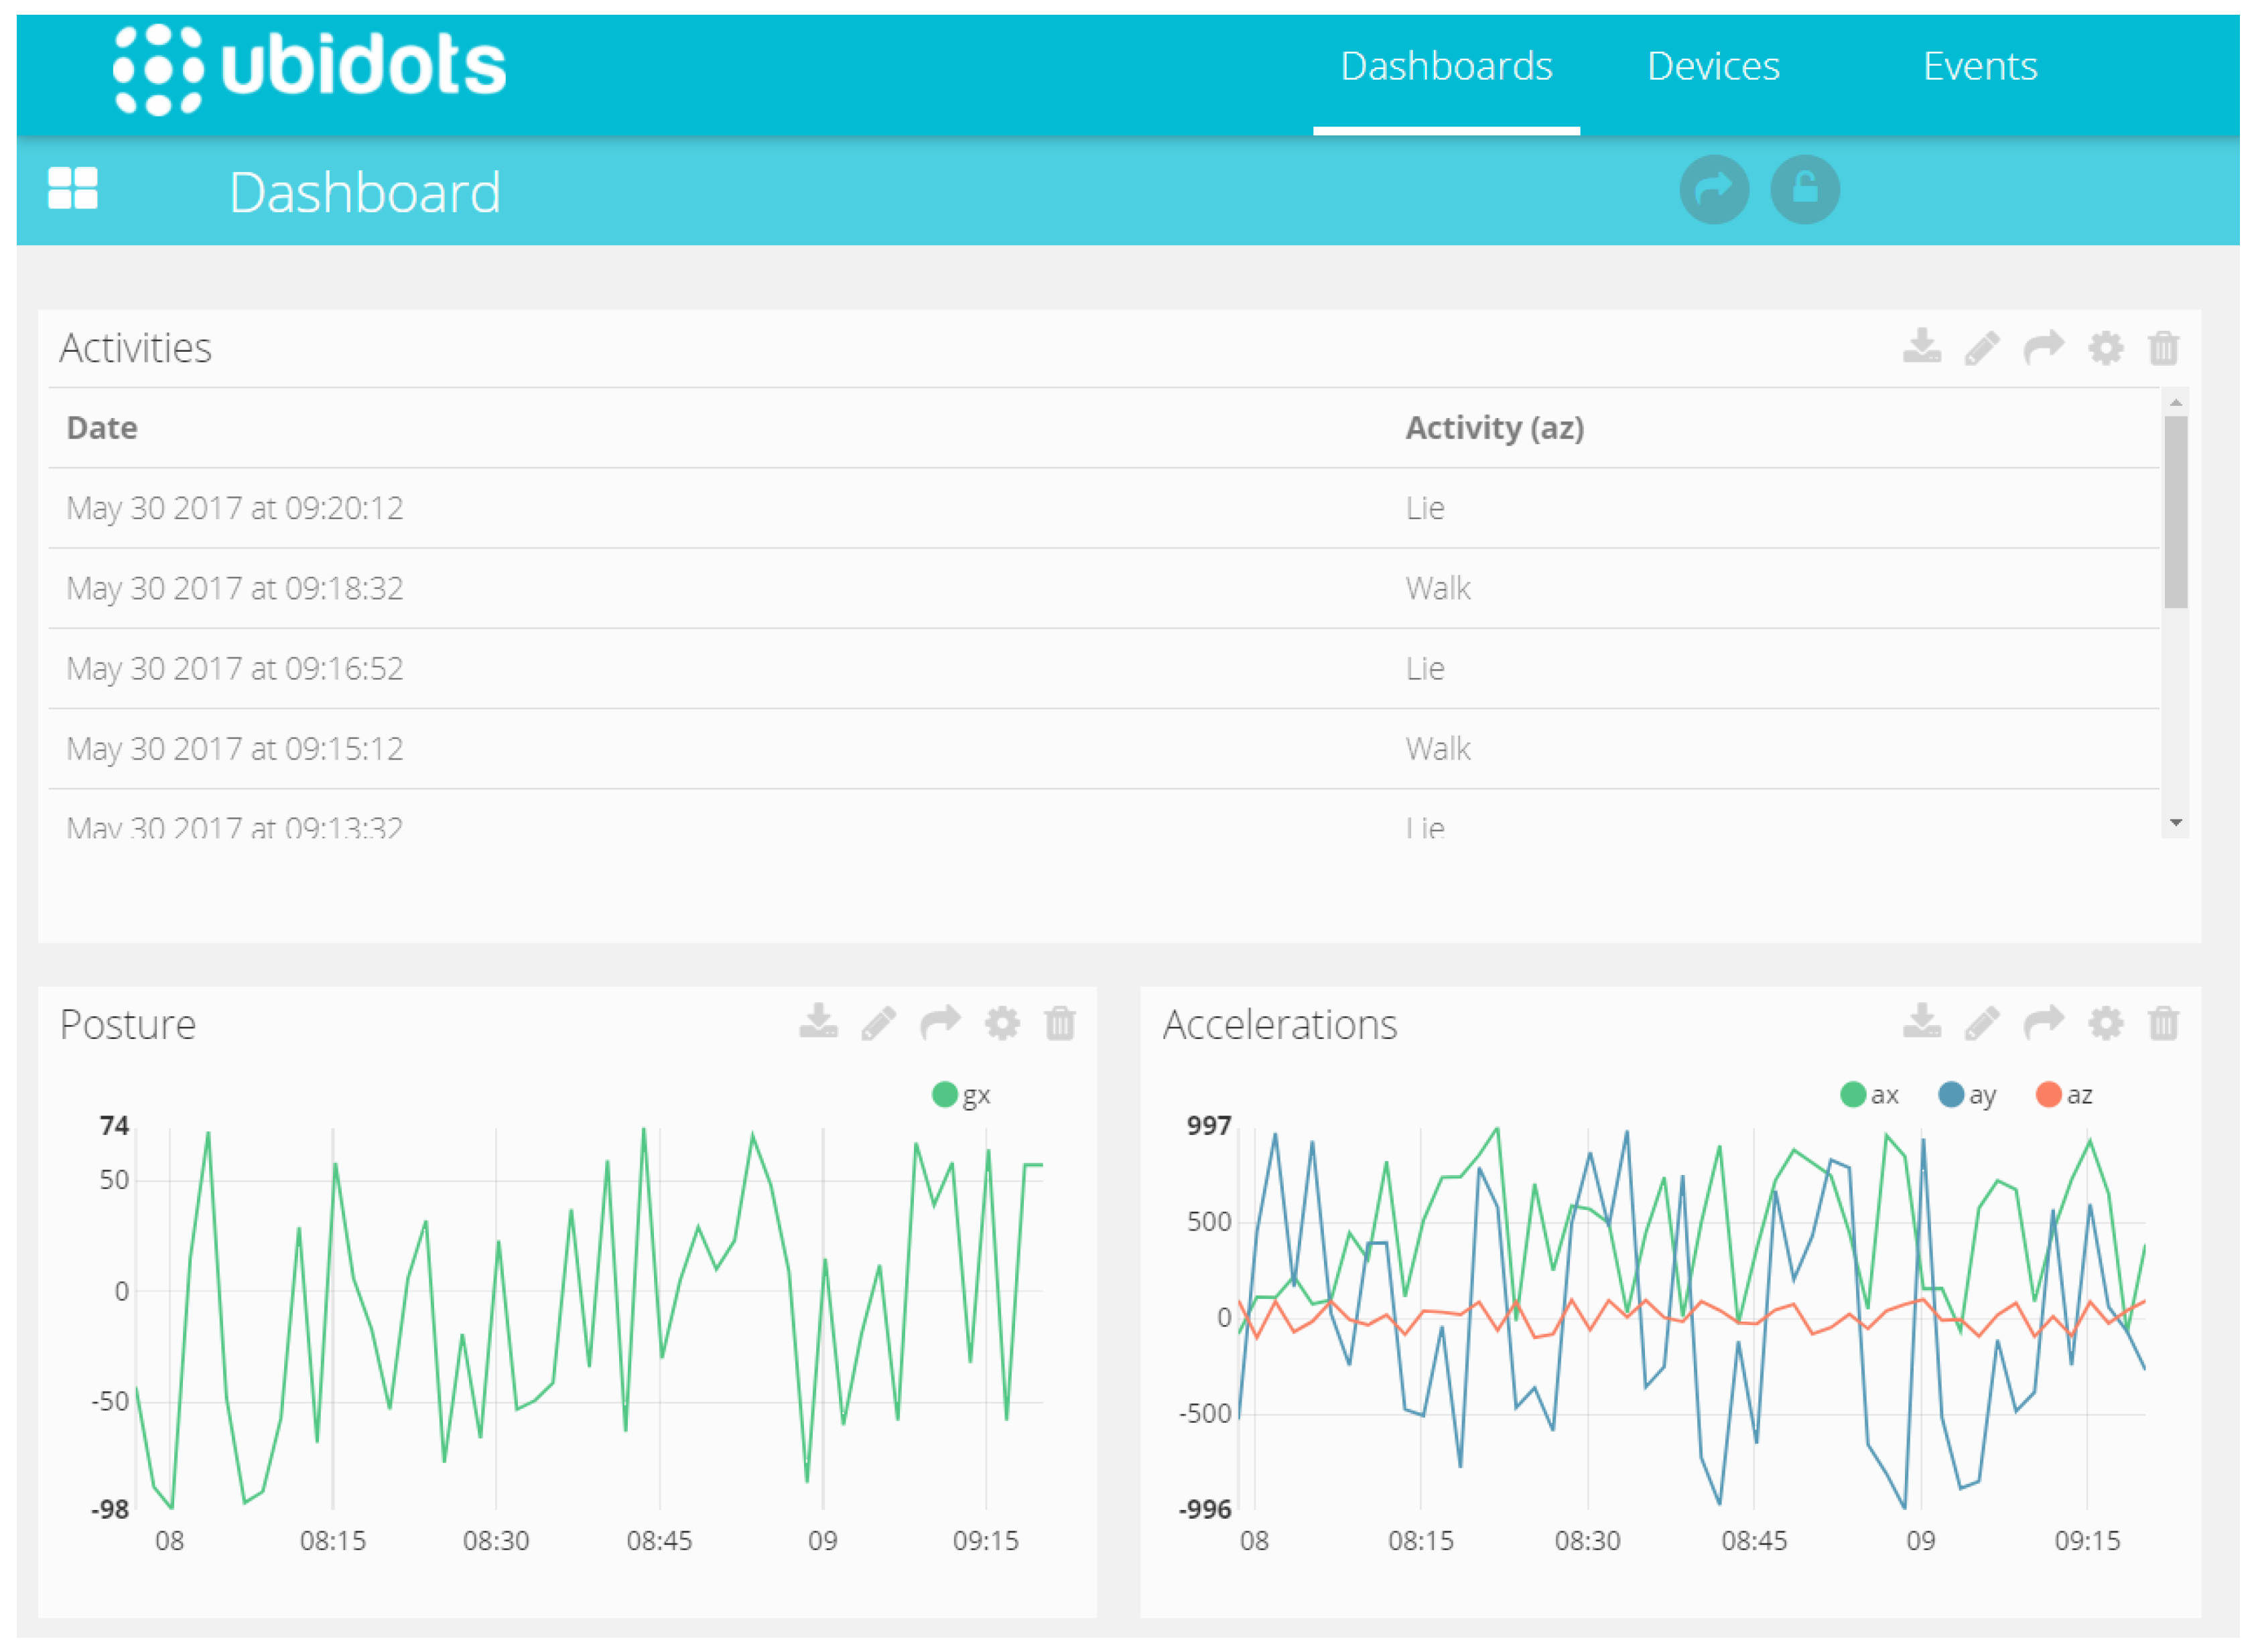
For the cloud environment, a platform called Ubidots was selected, which is a Colombian enterprise that offers cloud services for IoT solutions. This is an integrated solution that covers all necessary services to successfully implement small to medium solutions at a low cost. The services include: data storage (up to 500.000 data points), remote visualization (several widgets), basic data manipulation (basic algebraic operations) and programmable email and Short Message Service SMS alarms.
This platform was used to visualize the history of the activities recognized, heart rate, respiration rate, posture and the acceleration values. The alarms were configured for heart rate and respiration having minimum and maximum levels alerts. The last alarm was configured for a maximum level of the peak acceleration (behavior that indicates a fall) (Figure 6).
4. HAR System
Having the data collected, the next step is to perform the activity recognition. To do this, we performed a two-phase recognition algorithm. The first step is the feature extraction, which uses the raw data to create a set of features that are the input of the second phase: the classification phase.
The classification phase can be either a training step (see Section 2.1) that generates the recognition model or a recognition step that uses the recognition model and the extracted features to determine the activity performed.
4.1. Feature Extraction
The feature extraction is an algorithm that standardizes the raw data set, which reduces the amount of data to process. It performs analysis over the data set, such as structure detection, transformations or statistical functions. This allows the data to be organized in standard forms (mathematical functions) with an emphasis on how well the data explains these standard forms (fit). This process reduces the raw data to a finite and concrete set of aspects of the signal, which reduces the complexity of the recognition model.
For each available sensor, there can be several features that can be extracted and, if not well proposed, the classification problem can become an overdetermined system. To avoid an indeterminate problem, there are several options to decrease the amount of features used in the classification. To select the features and reduction methods appropriate to the problem, it is first necessary to see which data is available. For this project, the available data is:
- Heart Rate.
- Respiration Rate.
- Posture.
- Three-axis acceleration (X, Y, Z).
- Peak Acceleration.
- Electrocardiogram (ECG) magnitude.
In this case, most signals are time series measurements with low variability, meaning that the most appropriate feature extraction method is a structure detector without any prior processing [18]. The only exception to this is the three-axis acceleration, as these kinds of signals are too fluctuating and oscillatory to use a structure detection without pre-processing.
To decrease the unwanted behavior of the signal, two methods can be used: a principal component analysis (PCA) or a discrete cosine transform (DCT). Both extract the most relevant information of the signal, and the PCA uses statistical procedures to get a set of linearly uncorrelated variables. On the other hand, DCT uses a only real domain Laplace transform to get the frequency components of the signal. In this case and for this kind of signal, the best results are obtained using PCA over DCT [37].
The structure detection algorithm searches for the best fitting mathematical function for the selected data, a minimization of the mean square error between the data and the function (Equation (1)):
The structural detectors, , can be either lineal or nonlineal functions. These functions have different parameters that describe the behavior of the function. Modifying these parameter allows for fitting each signal iteration to a structure with a unique set of parameters. These parameters become the features selected to perform the recognition. To avoid a high cost search in mathematical structures, a few structures were selected. This was done according to the usual behavior and range of the available signals. Table 2 presents the selected mathematical functions from which the algorithm will try to fit the signals. This table also presents the different parameters that describe the functions, their restrictions, characteristics or formulas that define them.
The implemented algorithm that performs the feature extraction takes into account the current data set, the parameters of the structure with a priority on the less resource-consuming structures. The serial steps of this algorithm are:
- Get the current data set.
- Iterate and execute the linear structural detectors.
- Calculate the mean square error for the best fitting lineal structures.
- If the error is high enough, iterate and execute the nonlineal detectors.
- Calculate the mean square error for the best fitting nonlineal structures.
- Select the structure with the lowest error.
- Pass the function parameters as the features to the classifier.
4.2. Classifier
There are several classifier algorithms that could work on an HAR system. The main kind of classifiers are:
- Rule trees: The rule tree, or decision tree is a hierarchy based model, in which all the features are mapped as nodes and each possible value for the feature is presented as a branch. These kinds of classifiers have a computational complexity of O(log(n)) , for n features. The most common decision trees models are D3/4/5, CLS, ASSISTANT, CART and C4.5.
- Bayesian methods: The Bayesian methods use conditional probabilities to calculate the likelihood of an event according to a set of features and their probabilities. The most common Bayesian methods are the Bayesian network and the naive Bayes, the later one being a special case that considers all features to be statistically independent of one another.
- Iteration based learning: The iteration based learning (IBL) are methods that learn the similarities and relations between features according to the training data set. These methods rely on high computational resources, large data sets and high storage capacities.
- Support vector machines: Support vector machines (SVM) have been widely used in HAR systems. They are based on several kernel functions that transform all the features to a higher degree space gaining information and relations between the features and the activities.
- Artificial neural networks: The artificial neural networks, (ANN or NN), use a weighted network to perform an analysis of the features and the activities performed. It imitates the neural synapses on biological brains to successfully recognize patters and models.
Following the requirements and constraints of the project, either IBL, SVN or ANN can be used, as the limited resources of the device in which the algorithm will be implemented prevent a successful implementation of these classifiers. Only a rule tree or Bayesian method could be implemented for this project. One algorithm of each kind of classifier was implemented in the mobile device to analyze the performance and the best was implemented in the system.
4.2.1. Rule Tree Classifier
For the rule tree classifiers, the C4.5 algorithm was selected. This algorithm uses different sets of rules according to the training data set, which divide the data set in different sections (gains) following the feature’s relation to the activity to be recognized (attribute).
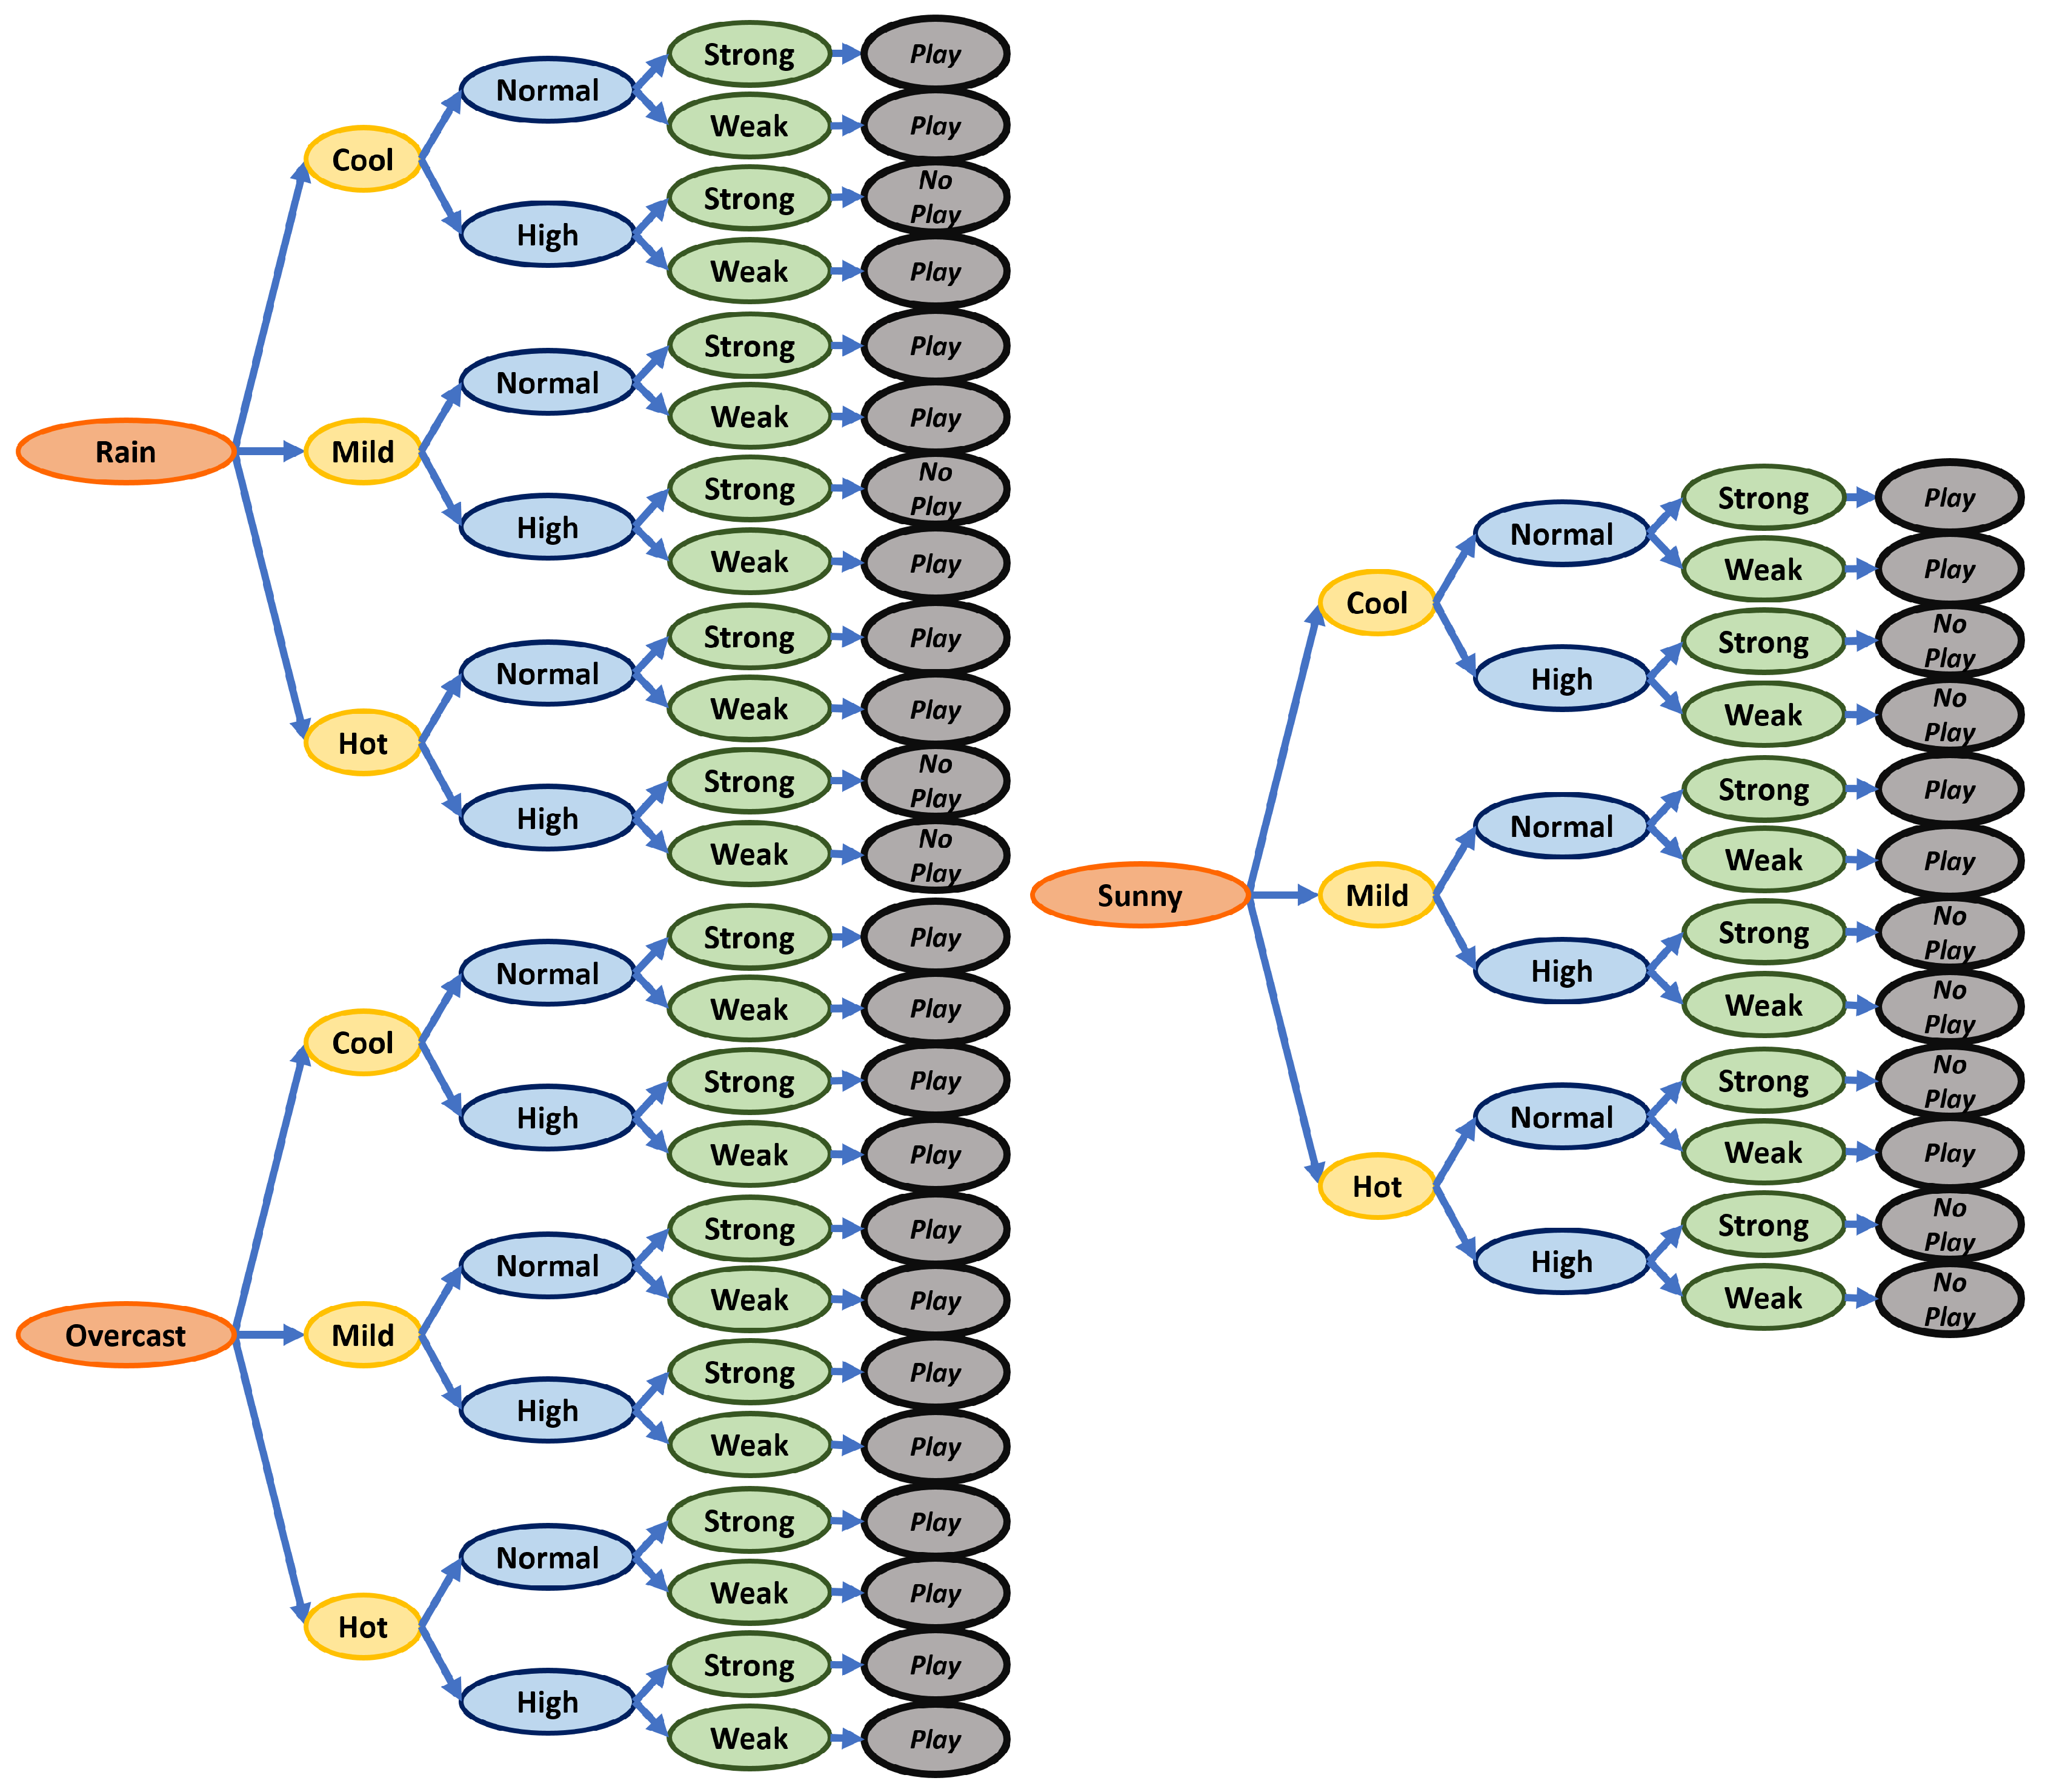
In Figure 7, a small example of this algorithm can be seen. The decision branches are probabilities of the feature to be in a certain location, which are expressed as binary variables. This algorithm has the following process to generate the rule tree:
- Root calculation: To select a starting point, root node selection, it uses the feature with the highest gain, as it covers the most possible cases with the first iteration.
- New branch search: The branch selection is done for each new node. It looks at the different features that the node can interact with and evaluates the possibility to recognize an attribute. The highest probability is assigned as a branch.
- New node selection: After the branch is assigned, the algorithm evaluates the new node probability of attribute selection and selects a feature with the highest chance of attribute recognition.
- Iteration: Iterate the steps 2 and 3 until the probability of attribute recognition is 1, which means it is the end of a branch. With the end of the branch, a rule is produced and associated with that attribute. If, after the iterations of all possible attributes a branch end has not been found, the starting node changes to the second highest gain.
- Search through all attributes in the current node: Steps 2–4 are needed to be repeated until all attributes have a rule associated.
4.2.2. Bayesian Classifier
For the Bayesian classifier, a Naive Bayes algorithm was selected. This algorithm is based on the conditional probabilities of an activity being performed for each given set of features. It assumes that all features are statistically independent from one another. The algorithm begins by counting and identifying all the features available (attributes) and the activity to be recognized (classes). The rules are generated by using the conditional probability of the attribute for a determined class. This is done for all possible classes (Equation (2)):
This means attributes times classes number of rules in a single problem. After all rules are calculated, a conditional calculation of the rule for a given set of attributes and class is performed. It selects the higher probability rule to be assigned to the class (Figure 8).
4.2.3. Classifier Selection
To test each classifier performance, each classifier was implemented in the target device and was presented with a single binary output problem. The problem consisted of a question: ¿Can I go out to play?. To solve this, there were four features to evaluate it. Table 3 presents all attributes and the class with the possible values.
The training data set consisted of 14 samples, with no statistical correlation between instances. With this, each algorithm generated its own set of rules. The resulting rule sets were five rules for a C4.5 algorithm (Figure 9) and 36 for the Naive Bayes algorithm (Figure 10).
As expected, the Naive Bayes algorithm has a much larger rule set because it combines all the features, and then produces a rule with the probability obtained with the number of times found in the training set rule. The rule is maintained even when it does not provide useful information, unlike the C4.5 algorithm, which deletes them. The results of this test concluded that the C4.5 algorithm is the best suited for this project. Because the proposed prototype will have 18 features, the rule set size of the Naive algorithm will be much larger than the one of the C4.5, implicating a less cost efficient algorithm.
5. Experiment and Results
This project presents an HAR-IoT system that uses an Food and Drug Administration (FDA)-certified strap that measure several physiological variables, in conjunction with an Android application that has a C4.5 classifier and PCA to improve the results and a cloud-based system for remote visualization of the strap raw data and the classifier outcome. In this section, the experiment setup used to validate the system will be described in addition to the results obtained after the experiment being successful.
5.1. Experiment Description
The experiment had two phases: Learning and Recognition. During the training phase, three different test subjects (students with similar body types, age and weight) were performed several physical activities in a pre-established order (lie, sit, lie, walk, sit, jog, sit, jog and walk) while wearing the Bioharness. Each activity needs to be performed for a time frame of four minutes without changing activity or stopping. This time frames are divided in eight smaller frames that are called windows, which need to be at least 15 s long, as it is the minimum amount of time for the variable detection by the Bioharness. These windows were selected to have twice the amount of time, which is a balance between the length of the activity and the amount of data gathered for each activity. During the whole learning phase, the sensors acquire the data and the classifier generates the rules for the recognition. In addition, all data is available in the cloud to supervise the exercises in a remote location (if needed).
For the feature extraction, a single structure detector was selected: a straight line. This is due to the convergence time, meaning that we obtained two features per signal, and this resulted in size of the resulting matrix being twice the number of signals, in the columns, and the number of time windows, in the rows. As this classifier works only with qualitative values, all probabilities were assigned a qualitative equivalent. Therefore, using the mean values of each feature, a qualitative value can be assigned. If the value is less than the mean, it is assigned as low and high, otherwise.
After the classifier generates the rules (recognition model), the recognition phase can start. During this phase, the prototype will extract, evaluate and detect the user activity based on the recognition model that was found during the learning phase. This phase does not have a time frame and can start or stop at any given time. Finally, for redundancy purposes, a text file with the data recorded from each instance is created.
5.2. Learning Phase Results
The training data set was composed of 74 time windows (Figure 11). As the activities that require more energy could have changes with an exhaustion factor during a prolonged experiment, a recurrent rest was included to have the best and more consistent results (inclusion of sitting periods of time between walking and jogging activities). The learning phase ended with the following qualitative assignments (Table 4).
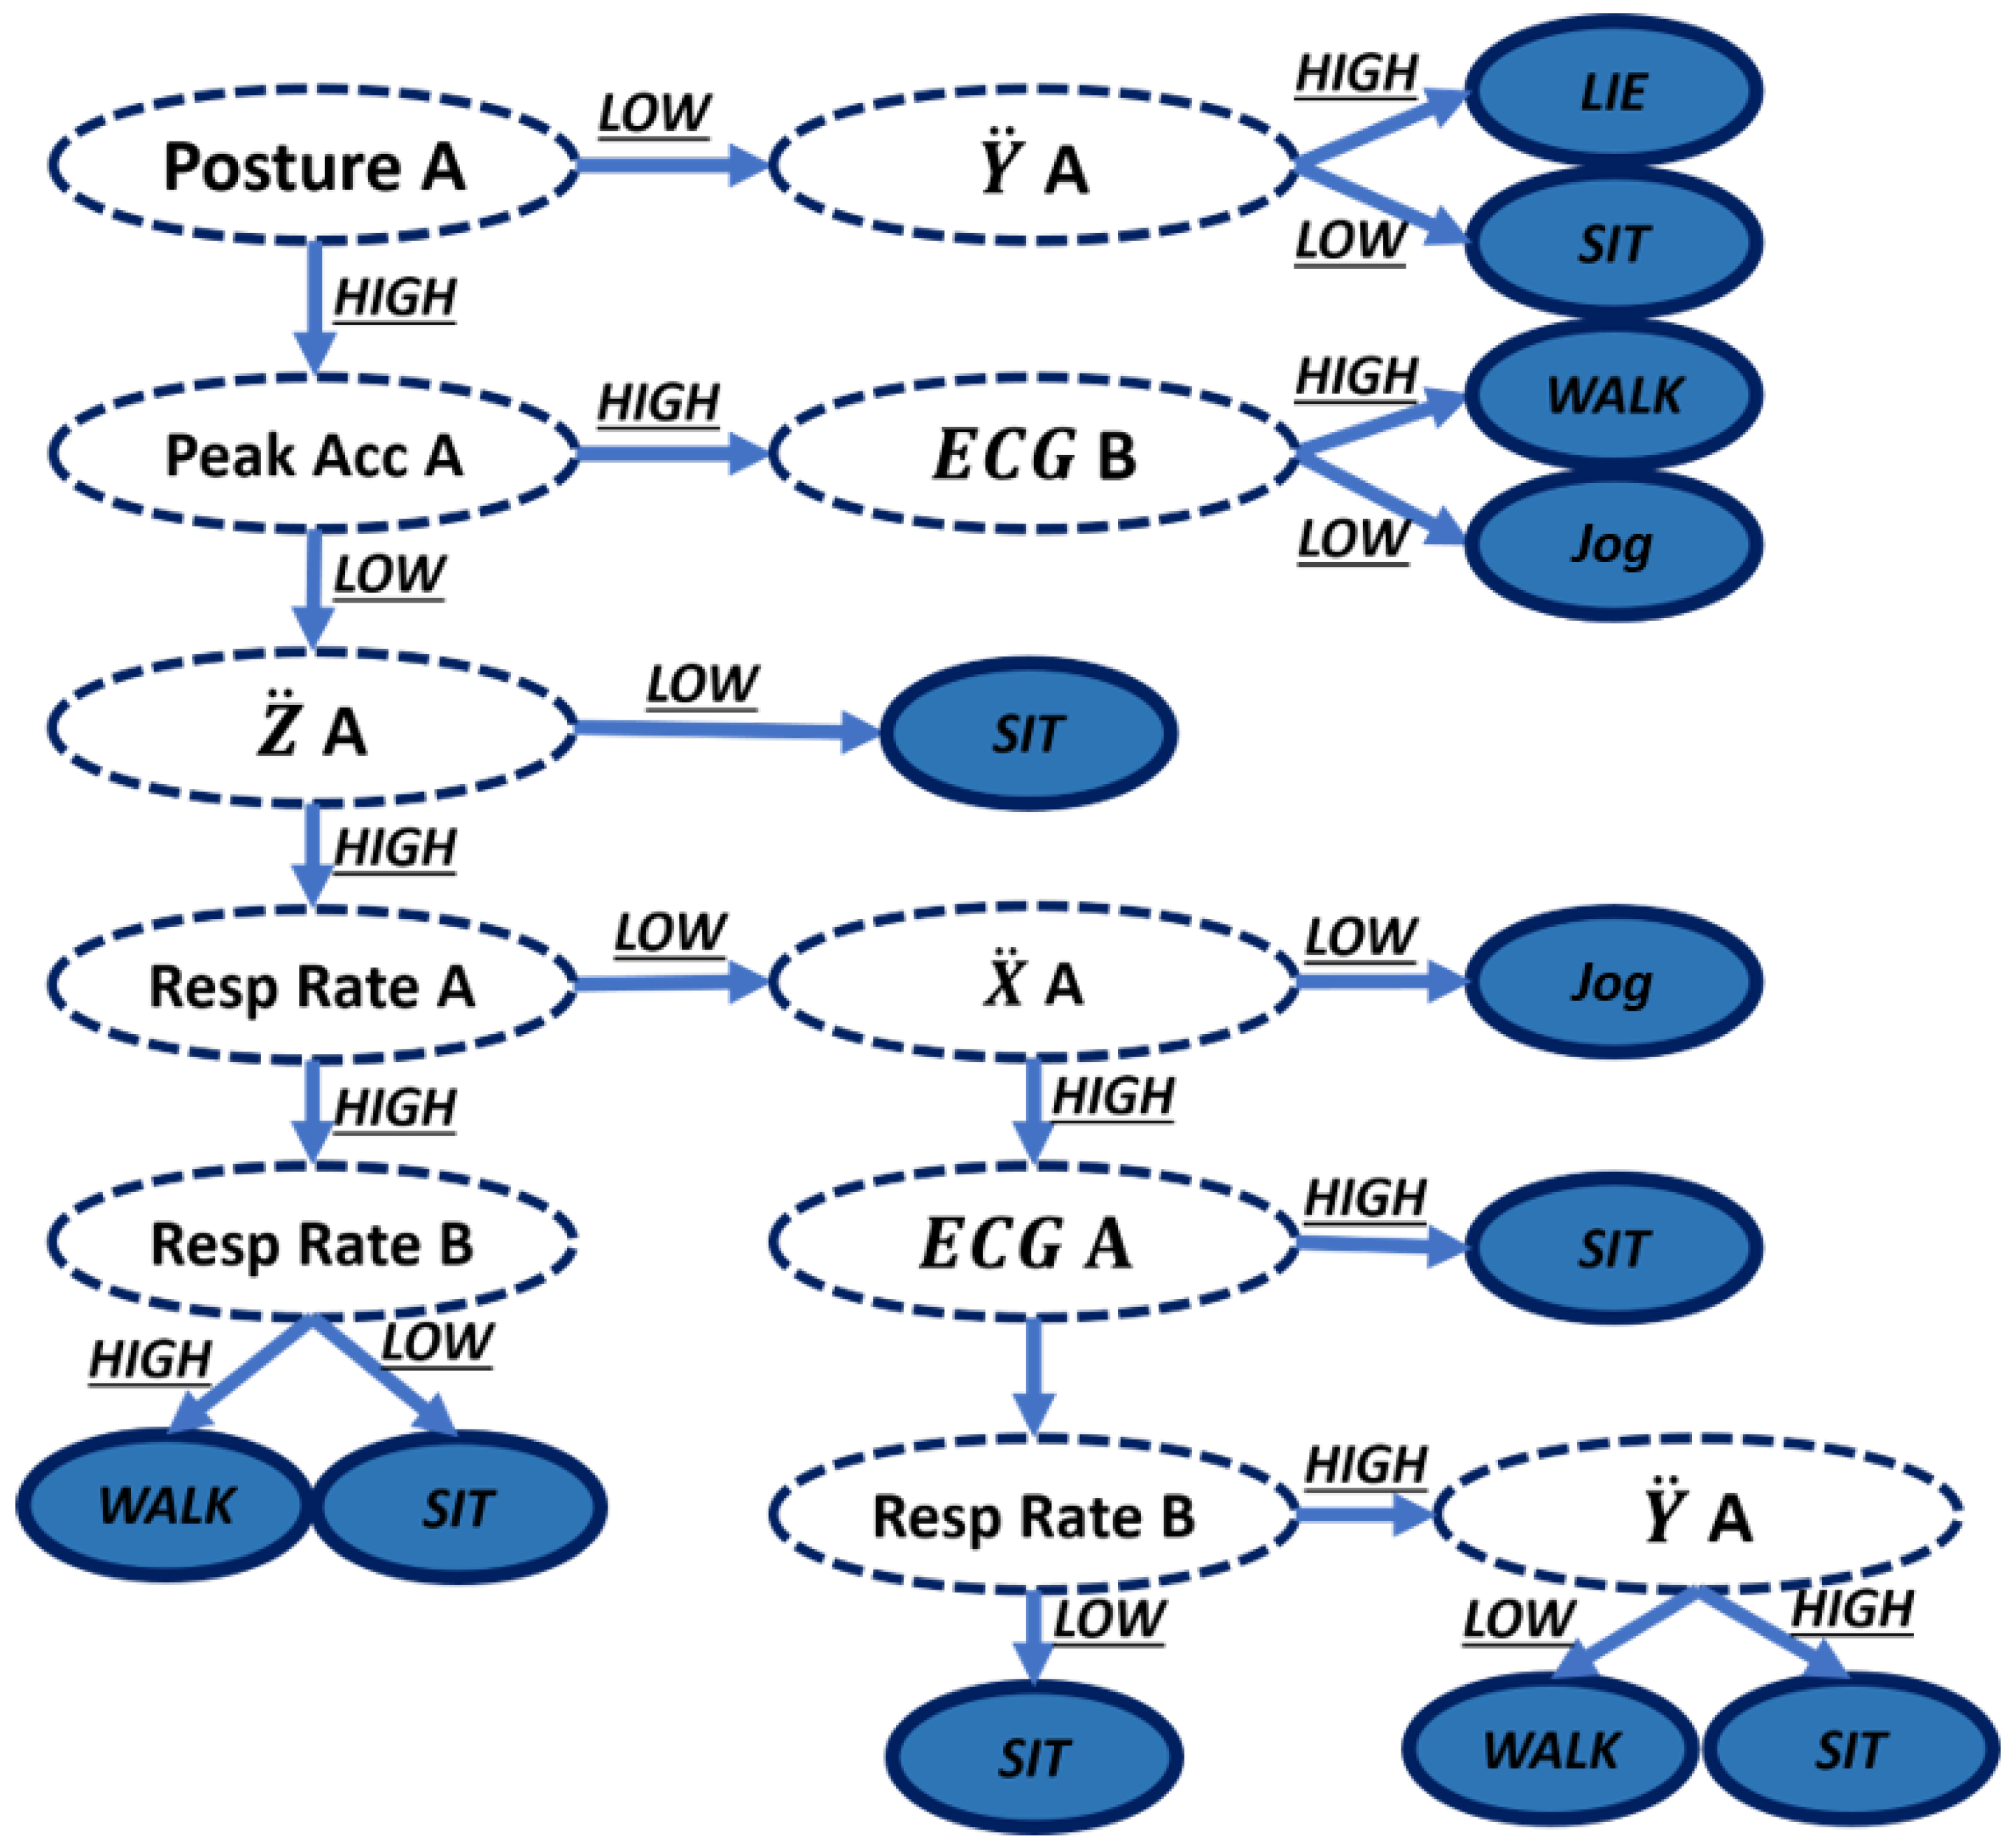
After the feature extraction phase, the algorithm proceeds generating the rule tree to that specific training data set (Figure 12). For this project, there were 13 rules in total having a single recognition model for the different subjects that were involved during this phase (Table 5).
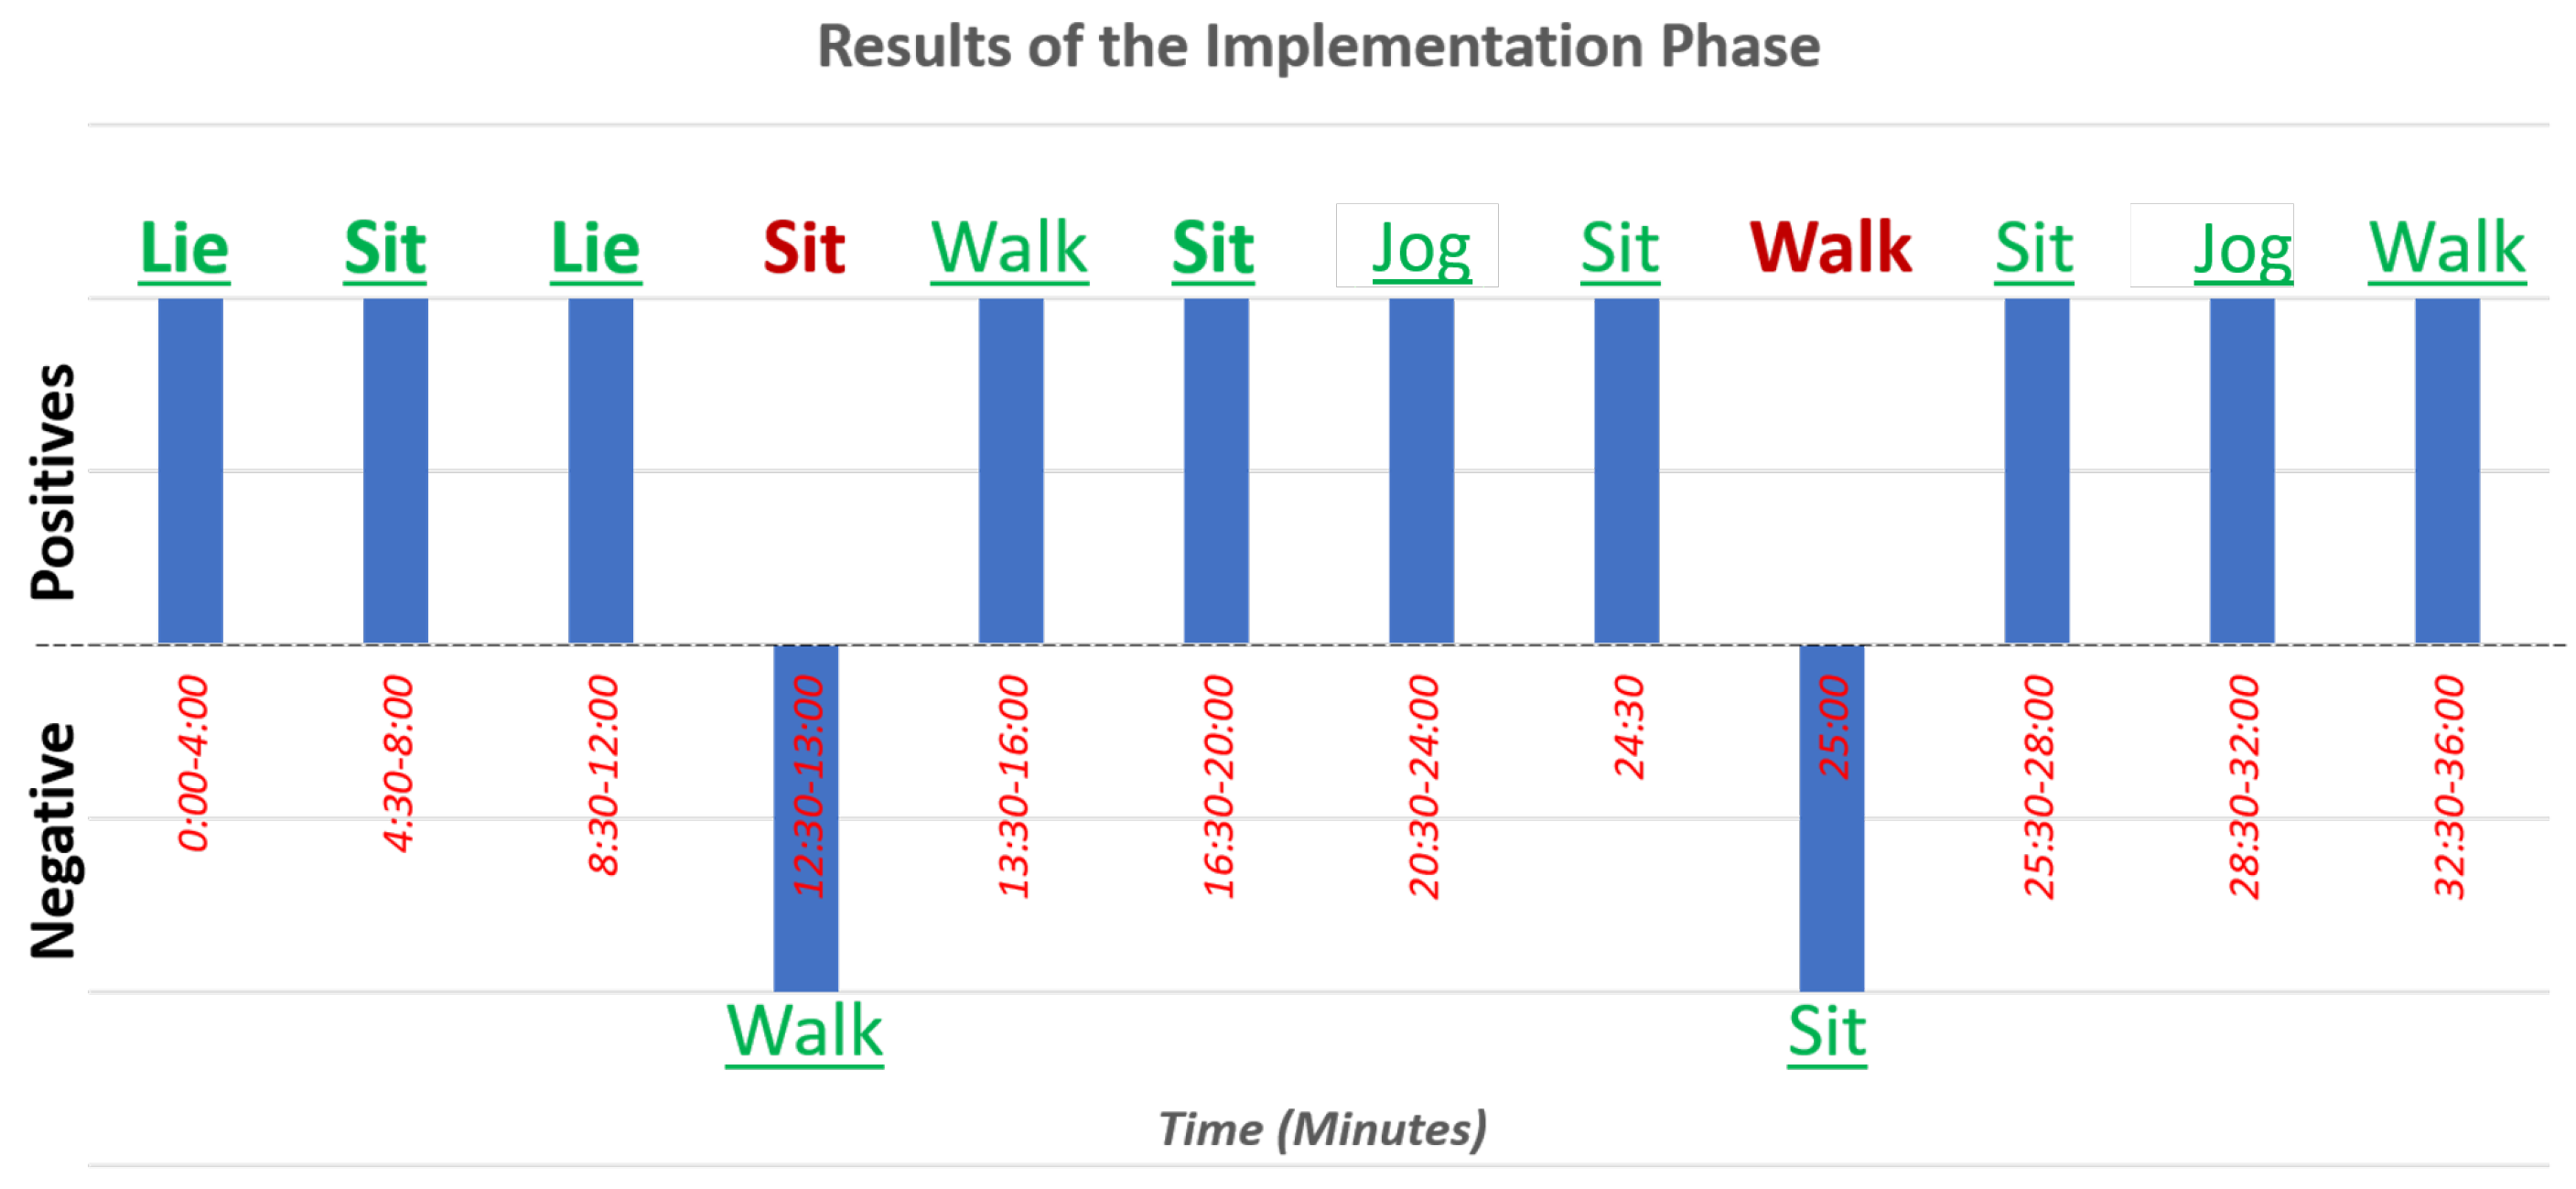
During the implementation phase, one of the test subjects was randomly asked to perform a total of 72 activity windows that were recollected. For these 72 windows, in 69 of them, the activity was successfully recognized, with only three that were wrongly classified. The confusion matrix of this implementation is present in Table 6. Likewise, a time series displaying each activity done and its activity recognized can be seen in Figure 13 and the same data in Table 7.
6. Conclusions
This project successfully developed and implemented a novel human activity recognition system using a smartphone, the Bioharness 3 and a cloud system. For feature extraction, we used structural functions and, for pre-processing, a PCA algorithm was used. For the classifier, both the C4.5 and the Naive Bayes rules were implemented on the target hardware, but the C4.5 was selected instead of Naive Bayes due to the size of the rule set. The prototype in implementation phase got a score of 95.83% in the classification success. The project can be improved by adding more light-weight algorithms, different structural functions and the usage of more features. As future work, we presented the following path that contributed to the improvement of the presented project:
- The comparison between the performance using multiple different structural functions: having different structural functions can optimize the resource consumption and decreasing the computational load of the classifier.
- The broadening of the training data and robustness of the system: the system was implemented as a proof of concept of an HAR-IoT system, with a few users. These kinds of systems to be implemented in a product or in a trial must be trained with a high amount of data sets, as the recognition models should be trained user-independently so the recognition works independently from the subject using it. With our system, the test subjects were students with similar body types, ages and weights, which resulted in a functional system. For the later implementation, the system should have more training data. To improve the classification, another set of features such as mean, variance or percentile could be used along with the features we used to have more information. In addition, another recognition model could be used.
- The implementation of the classifier on the cloud: The mayor constraint that the system present is the limited hardware available for the classifier. If the cloud resources can be available to perform the classification, more complex and better algorithms can be integrated into the system. There could even be a classifier redundancy system in which both the local application and the cloud system perform classification.
Acknowledgments
This work was supported by the Pontificia Universidad Javeriana (PUJ) in Bogota, Colombia under the project framework Centro de Excelencia y Apropiacion en Internet de las Cosas (CEA-IoT). The authors would like acknowledge the cooperation of all partners within the CEA-IoT and also like to thank all the institutions that supported this work: the Colombian Ministry for the Information and Communications Technology (Ministerio de Tecnologias de la Informacion y las Comunicaciones—MinTIC) and the Colombian Administrative Department of Science, Technology and Innovation (Departamento Administrativo de Ciencia, Tecnología e Innovacion—COLCIENCIAS) through the Fondo Nacional de Financiamiento para la Ciencia, la Tecnologia y la Innovacion Francisco José de Caldas (Project ID: FP44842-502-2015).
Author Contributions
Camilo Rodriguez implemented and tested the HAR application and classifiers, and Jose Cabra implemented the cloud and alarm system. Julian Colorado supervised the HAR implementation and testing. Diego Castro wrote, corrected and verified the publications and reports of the project. William Coral supervised, verified, corrected and guided the writing and testing protocol.
Conflicts of Interest
The authors declare no conflict of interest. The founding sponsors had no role in the design of the study; in the collection, analyses, or interpretation of data; in the writing of the manuscript, and in the decision to publish the results.
References
- Gubbi, J.; Buyya, R.; Marusic, S.; Palaniswami, M. Internet of Things (IoT): A vision, architectural elements, and future directions. Future Gener. Comput. Syst. 2013, 29, 1645–1660. [Google Scholar] [CrossRef]
- Roncancio, G.; Espinosa, M.; Perez, M.R. Spectral Sensing Method in the Radio Cognitive Context for IoT Applications. In Proceedings of the 10th IEEE International Conference on Internet of Things (iThings 2017), Exeter, Devon, UK, 21–23 June 2017; pp. 1–6. [Google Scholar]
- Cabra, J.; Castro, D.; Colorado, J.; Mendez, D.; Trujillo, L. An IoT approach for Wireless Sensor Networks Applied to E-Health Environmental Monitoring. In Proceedings of the 10th IEEE International Conference on Internet of Things (iThings 2017), Exeter, Devon, UK, 21–23 June 2017; pp. 14–22. [Google Scholar]
- Velasquez, N.; Medina, C.; Castro, D.; Acosta, J.C.; Mendez, D. Design and Development of an IoT System Prototype for Outdoor Tracking. In Proceedings of the International Conference on Future Networks and Distributed Systems—ICFNDS ’17, Cambridge, UK, 19–20 July 2017; pp. 1–6. [Google Scholar]
- Teran, M.; Aranda, J.; Carrillo, H.; Mendez, D.; Parra, C. IoT-based System for Indoor Location using Bluetooth Low Energy. In Proceedings of the IEEE Colombian Conference on Communications and Computing (COLCOM2017), Cartagena, Colombia, 16–18 August 2017; IEEE Xplore Digital Library: Cartagena, Colombia, 2017. [Google Scholar]
- Perera, C.; Liu, C.H.I.H.; Jayawardena, S.; Chen, M. A Survey on Internet of Things From Industrial Market Perspective. IEEE Access 2014, 2, 1660–1679. [Google Scholar] [CrossRef]
- Ganz, F.; Barnaghi, P.; Carrez, F. Information Abstraction for Heterogeneous Real World Internet Data. IEEE Sens. J. 2013, 13, 3793–3805. [Google Scholar] [CrossRef]
- Fitbit. Heart Rate Tracker: Fitbit Charge 2™. Available online: https://misfit.com/fitness-trackers/ (accessed on 25 November 2017).
- Misfit. Misfit: Fitness Trackers & Wearable Technology—Misfit.com. Available online: https://www.fitbit.com/home (accessed on 25 November 2017).
- Liu, C.H. A Survey of Context-Aware Middleware Designs for Human Activity Recognition Communications a Survey of Context-Aware Middleware Designs for Human Activity Recognition. IEEE Commun. Mag. 2014, 52, 24–31. [Google Scholar]
- Sikder, F.; Sarkar, D. Log-sum distance measures and its application to human-activity monitoring and recognition using data from motion sensors. IEEE Sens. J. 2017, 17, 4520–4533. [Google Scholar] [CrossRef]
- Wang, Z.; Wu, D.; Chen, J.; Ghoneim, A.; Hossain, M.A. Human Activity Recognition via Game-Theory-Based Feature Selection. IEEE Sens. J. 2016, 16, 3198–3207. [Google Scholar]
- Testoni, A.; Di Felice, M. A software architecture for generic human activity recognition from smartphone sensor data. In Proceedings of the 2017 IEEE International Workshop on Measurement and Networking (M&N), Naples, Italy, 27–29 September 2017; pp. 1–6. [Google Scholar]
- Poppe, R. A survey on vision-based human action recognition. Image Vis. Comput. 2010, 28, 976–990. [Google Scholar] [CrossRef]
- Mo, L.; Li, F.; Zhu, Y.; Huang, A. Human physical activity recognition based on computer vision with deep learning model. In Proceedings of the IEEE Instrumentation and Measurement Technology Conference, Taipei, Taiwan, 23–26 May 2016. [Google Scholar]
- Boufama, B. Trajectory-Based Human Activity Recognition from Videos. In Proceedings of the 3rd International Conference on Advanced Technologies for Signal and Image Processing—ATSIP’2017, Fez, Morocco, 22–24 May 2017; pp. 1–5. [Google Scholar]
- Chetty, G.; White, M. Body sensor networks for human activity recognition. In Proceedings of the 2016 3rd International Conference on Signal Processing and Integrated Networks (SPIN), Noida, India, 11–12 February 2016; pp. 660–665. [Google Scholar]
- Lara, O.D.; Labrador, M.A. A Survey on Human Activity Recognition using Wearable Sensors. IEEE Commun. Surv. Tutor. 2013, 15, 1192–1209. [Google Scholar] [CrossRef]
- Huang, H.; Member, S.; Li, X.; Member, S.; Sun, Y. A Triboelectric Motion Sensor in Wearable Body Sensor Network for Human Activity Recognition. In Proceedings of the 2016 IEEE 38th Annual International Conference of the Engineering in Medicine and Biology Society (EMBC), Orlando, FL, USA, 16–20 August 2016; pp. 4889–4892. [Google Scholar]
- Rodriguez, C.; Castro, D.M.; Coral, W.; Cabra, J.L.; Velasquez, N.; Colorado, J.; Mendez, D.; Trujillo, L.C. IoT system for Human Activity Recognition using BioHarness 3 and Smartphone. In Proceedings of the International Conference on Future Networks and Distributed Systems—ICFNDS ’17, Cambridge, UK, 19–20 July 2017; pp. 1–7. [Google Scholar]
- Yazdansepas, D.; Niazi, A.H.; Gay, J.L.; Maier, F.W.; Ramaswamy, L.; Rasheed, K.; Buman, M.P. A Multi-Featured Approach for Wearable Sensor-based Human Activity Recognition. In Proceedings of the 2016 IEEE International Conference on Healthcare Informatics (ICHI), Chicago, IL, USA, 4–7 October 2016; pp. 423–431. [Google Scholar]
- Koskimäki, H.; Siirtola, P. Adaptive model fusion for wearable sensors based human activity recognition. In Proceedings of the 2016 19th International Conference on Information Fusion (FUSION), Heidelberg, Germany, 5–8 July 2016; pp. 1709–1713. [Google Scholar]
- Chen, Y.; Shen, C. Performance Analysis of Smartphone-Sensor Behavior for Human Activity Recognition. IEEE Access 2017, 5, 3095–3110. [Google Scholar] [CrossRef]
- Siirtola, P.; Röning, J. Recognizing human activities user-independently on smartphones based on accelerometer data. Int. J. Interact. Multimedia Artif. Intell. 2012, 1, 4–12. [Google Scholar] [CrossRef]
- Suciu, G.; Suciu, V.; Martian, A.; Craciunescu, R.; Vulpe, A.; Marcu, I.; Halunga, S.; Fratu, O. Big data, internet of things and cloud convergence—An architecture for secure e-health applications. J. Med. Syst. 2015, 39, 141. [Google Scholar] [CrossRef] [PubMed]
- Perez, A.J.; Zeadally, S.; Jabeur, N. Investigating Security for Ubiquitous Sensor Networks. Procedia Comput. Sci. 2017, 109, 737–744. [Google Scholar] [CrossRef]
- Tomic, I.; McCann, J.A. A Survey of Potential Security Issues in Existing Wireless Sensor Network Protocols. IEEE Internet Things J. 2017, 4662, 1. [Google Scholar] [CrossRef]
- Barakovic, S.; Kurtovic, E.; Bozanovic, O.; Mirojevic, A.; Ljevakovic, S.; Jokic, A.; Peranovic, M.; Husic, J.B. Security issues in wireless networks: An overview. In Proceedings of the 2016 XI International Symposium on Telecommunications (BIHTEL), Sarajevo, Bosnia and Herzegovina, 24–26 October 2016; pp. 1–6. [Google Scholar]
- Rodrigues, L.M.; Mestria, M. Classification methods based on bayes and neural networks for human activity recognition. In Proceedings of the 12th International Conference on Natural Computation, Fuzzy Systems and Knowledge Discovery (ICNC-FSKD), Changsha, China, 13–15 August 2016; pp. 1141–1146. [Google Scholar]
- Nazábal, A.; García-Moreno, P.; Artés-Rodríguez, A.; Ghahramani, Z. Human Activity Recognition by Combining a Small Number of Classifiers. IEEE J. Biomed. Health Inform. 2016, 20, 1342–1351. [Google Scholar] [CrossRef] [PubMed]
- Postma-Nilsenová, M.; Postma, E.; Tates, K. Automatic detection of confusion in elderly users of a web-based health instruction video. Telemed. J. E-Health 2015, 21, 514–519. [Google Scholar] [CrossRef] [PubMed]
- Armentia, A.; Gangoiti, U.; Priego, R.; Estévez, E.; Marcos, M. Flexibility support for homecare applications based on models and multi-agent technology. Sensors 2015, 15, 31939–31964. [Google Scholar] [CrossRef] [PubMed]
- Alkmim, M.B.; Marcolino, M.S.; Figueira, R.M.; Sousa, L.; Nunes, M.S.; Cardoso, C.S.; Ribeiro, A.L. Factors Associated with the Use of a Teleconsultation System in Brazilian Primary Care. Telemed. J. E-Health 2015, 21, 473–483. [Google Scholar] [CrossRef] [PubMed]
- Sankaranarayanan, J.; Murante, L.J.; Moffett, L.M. A retrospective evaluation of remote pharmacist interventions in a telepharmacy service model using a conceptual framework. Telemed. J. E-Health 2014, 20, 893–901. [Google Scholar] [CrossRef] [PubMed]
- Sun, X.; Kashima, H.; Ueda, N. Large-scale personalized human activity recognition using online multitask learning. IEEE Trans. Knowl. Data Eng. 2013, 25, 2551–2563. [Google Scholar] [CrossRef]
- Johnstone, J.A.; Ford, P.A.; Hughes, G.; Watson, T.; Mitchell, A.C.S.; Garrett, A.T. Field Based Reliability and Validity of the Bioharness™ Multivariable Monitoring Device. 2012. Available online: https://www.zephyranywhere.com/system/overview (accessed on 1 September 2017).
- He, Z.; Jin, L. Activity recognition from acceleration data based on discrete consine transform and SVM. In Proceedings of the IEEE International Conference on Systems, Man and Cybernetics, San Antonio, TX, USA, 11–14 October 2009; pp. 5041–5044. [Google Scholar]
Figure 1.
Learning process of an HAR system.

Figure 2.
Recognition process of an HAR system.

Figure 3.
Basic scheme in an e-health system.
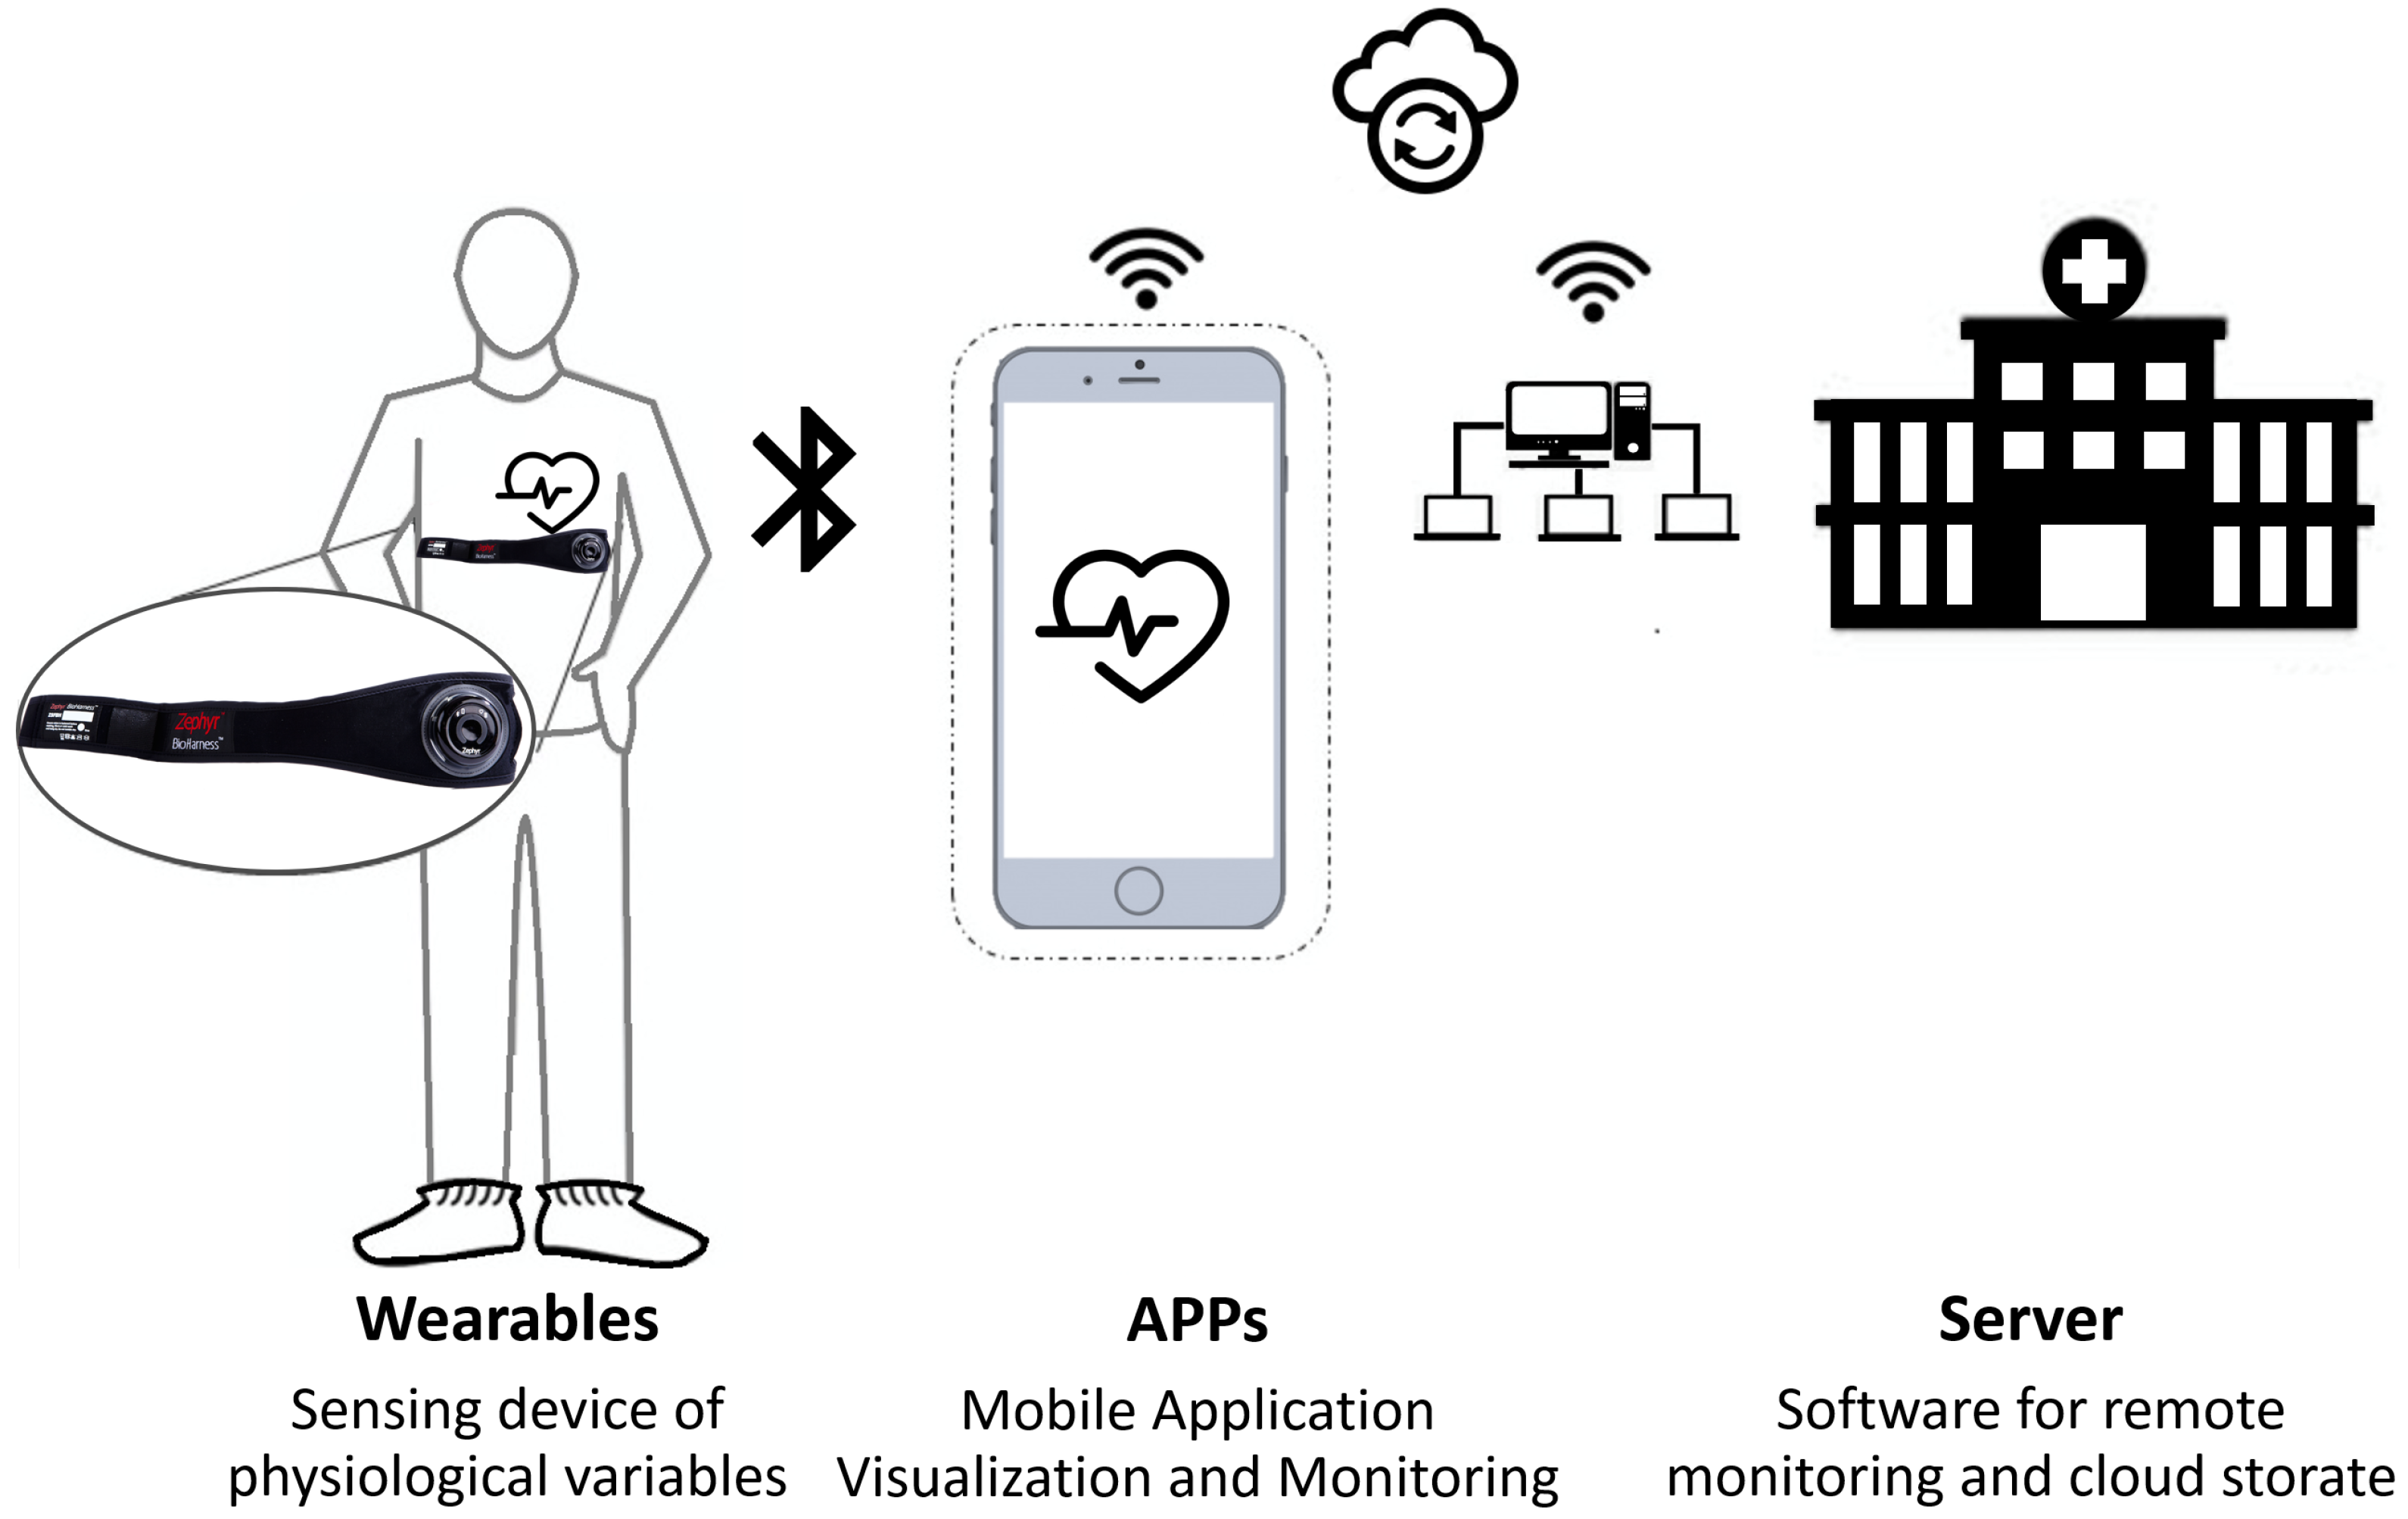
Figure 4.
Solution architecture.

Figure 5.
ZephyrTM Bioharness reference K113045.

Figure 6.
Example of the data visualization on the cloud service.

Figure 7.
Example of the decision tree of a C4.5 Algorithm.
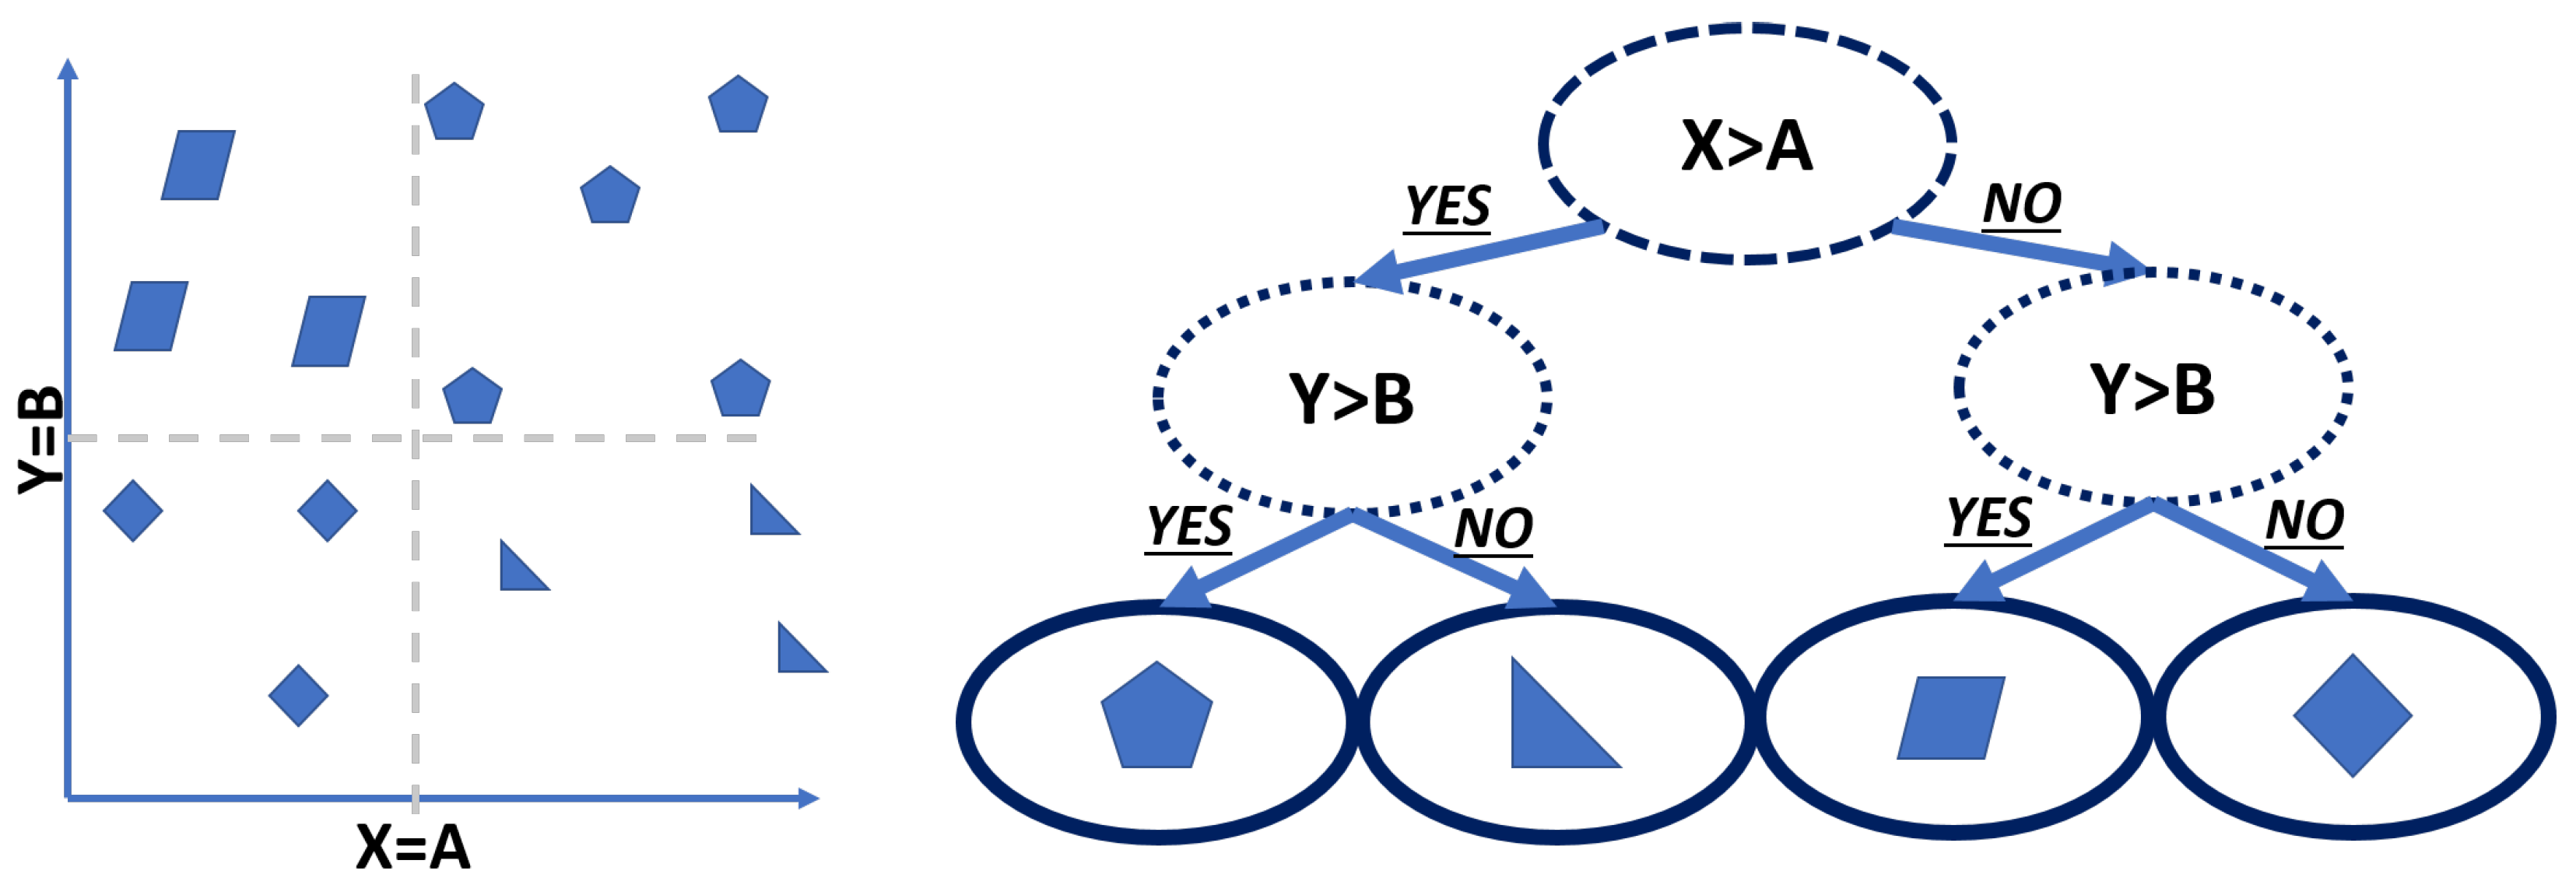
Figure 8.
Example of the probability tree of the Bayes algorithm.
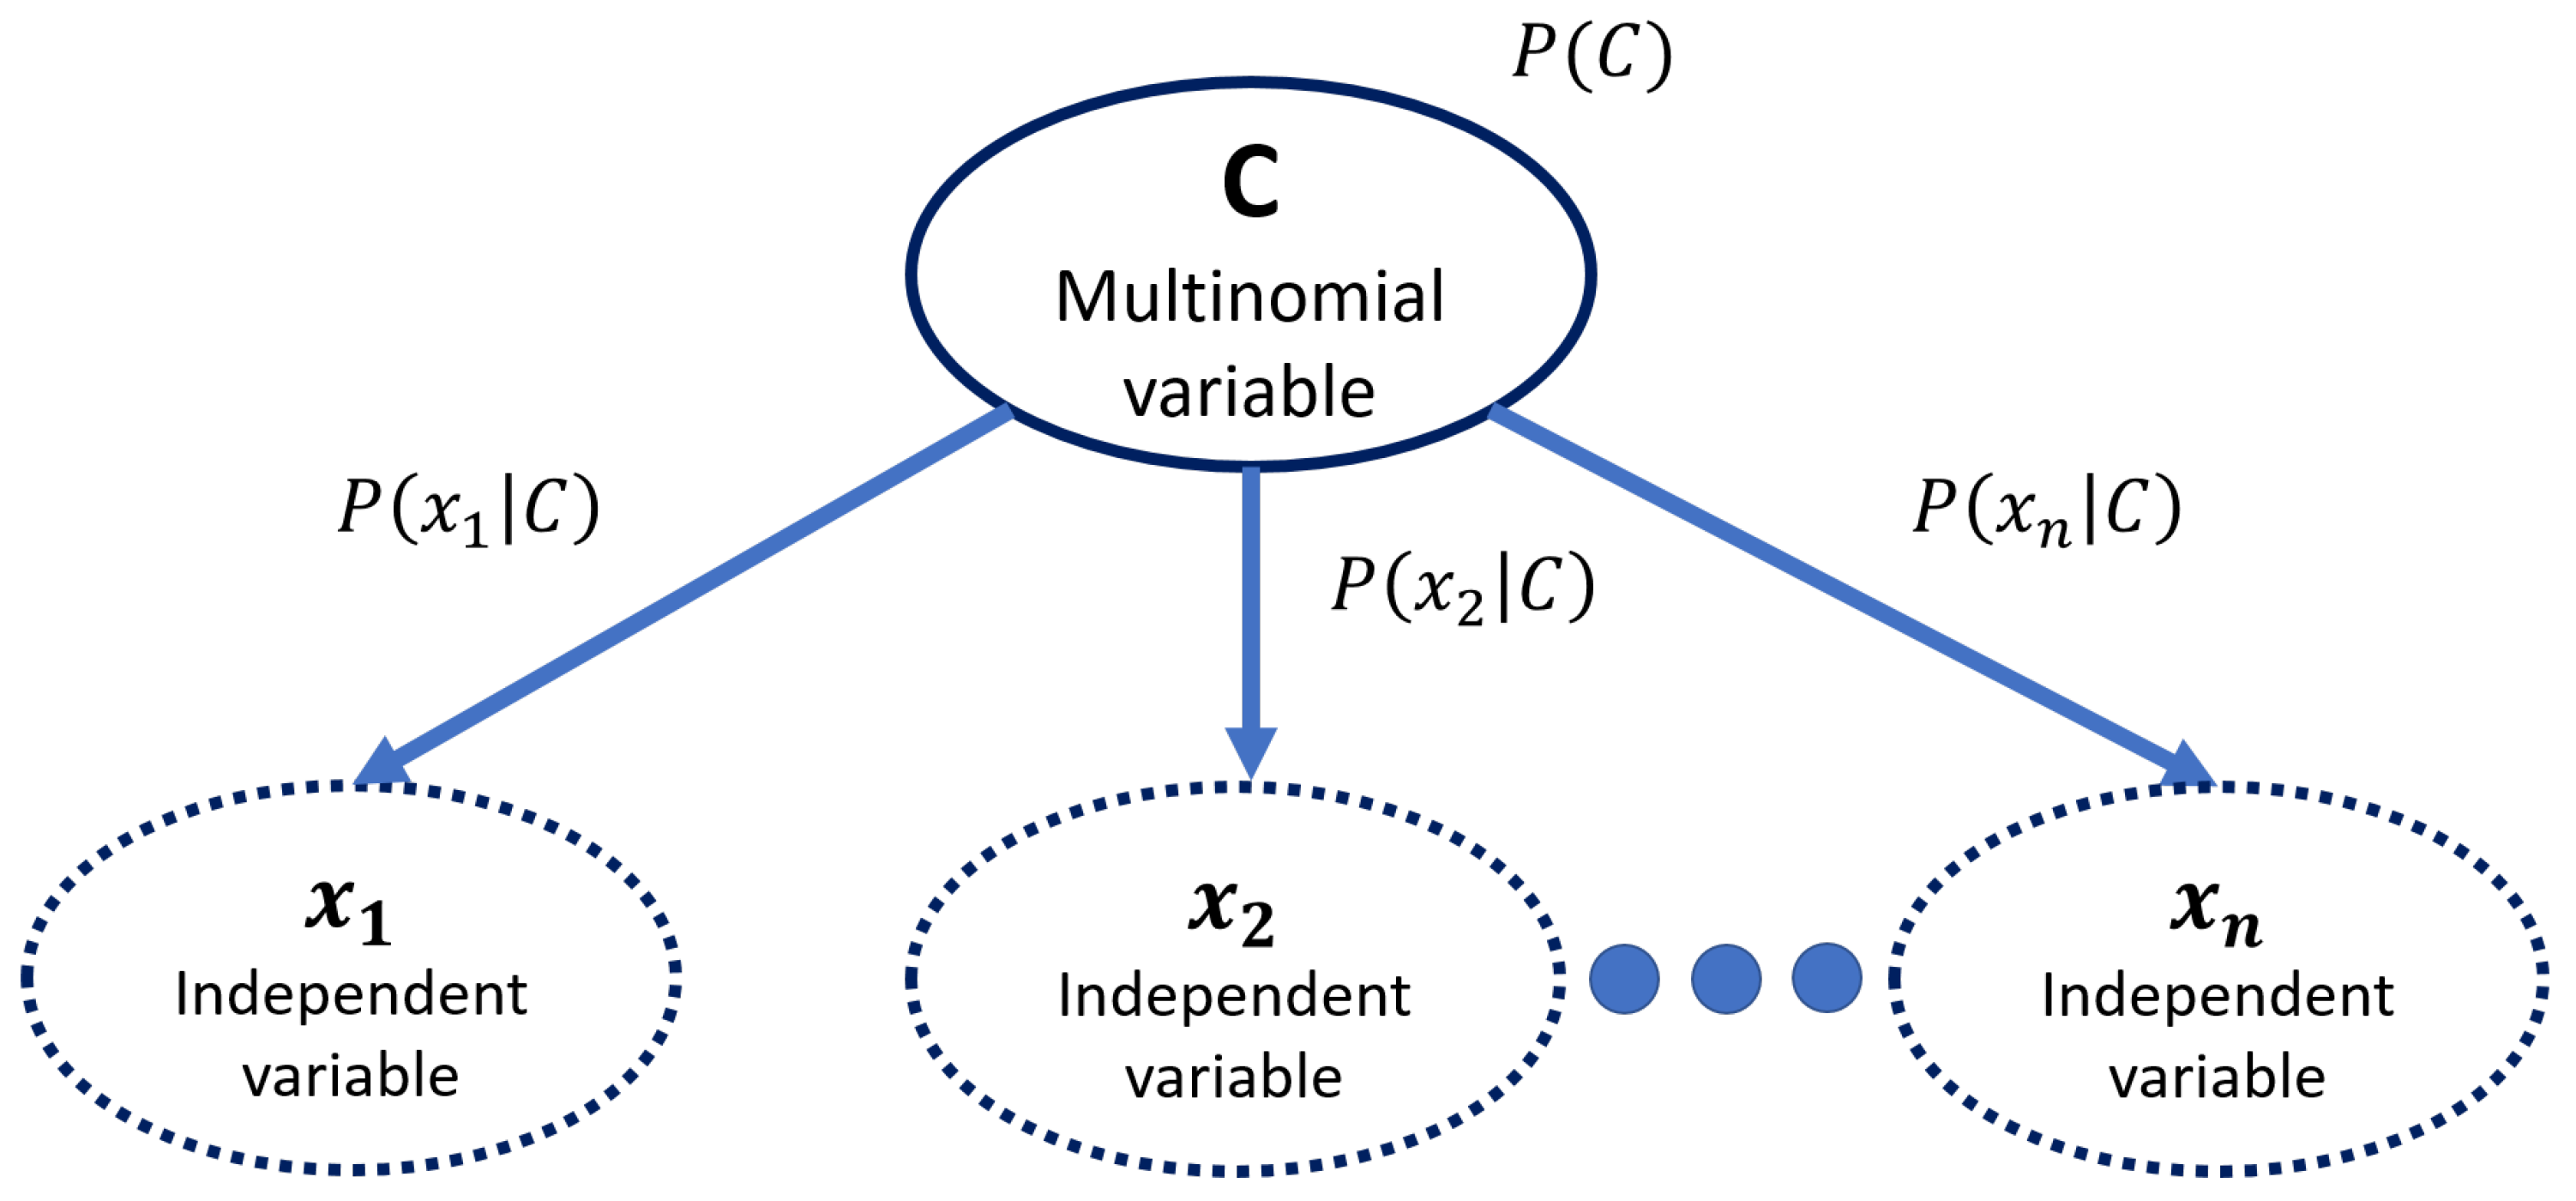
Figure 9.
The classifier’s test problem: C4.5 rule tree.
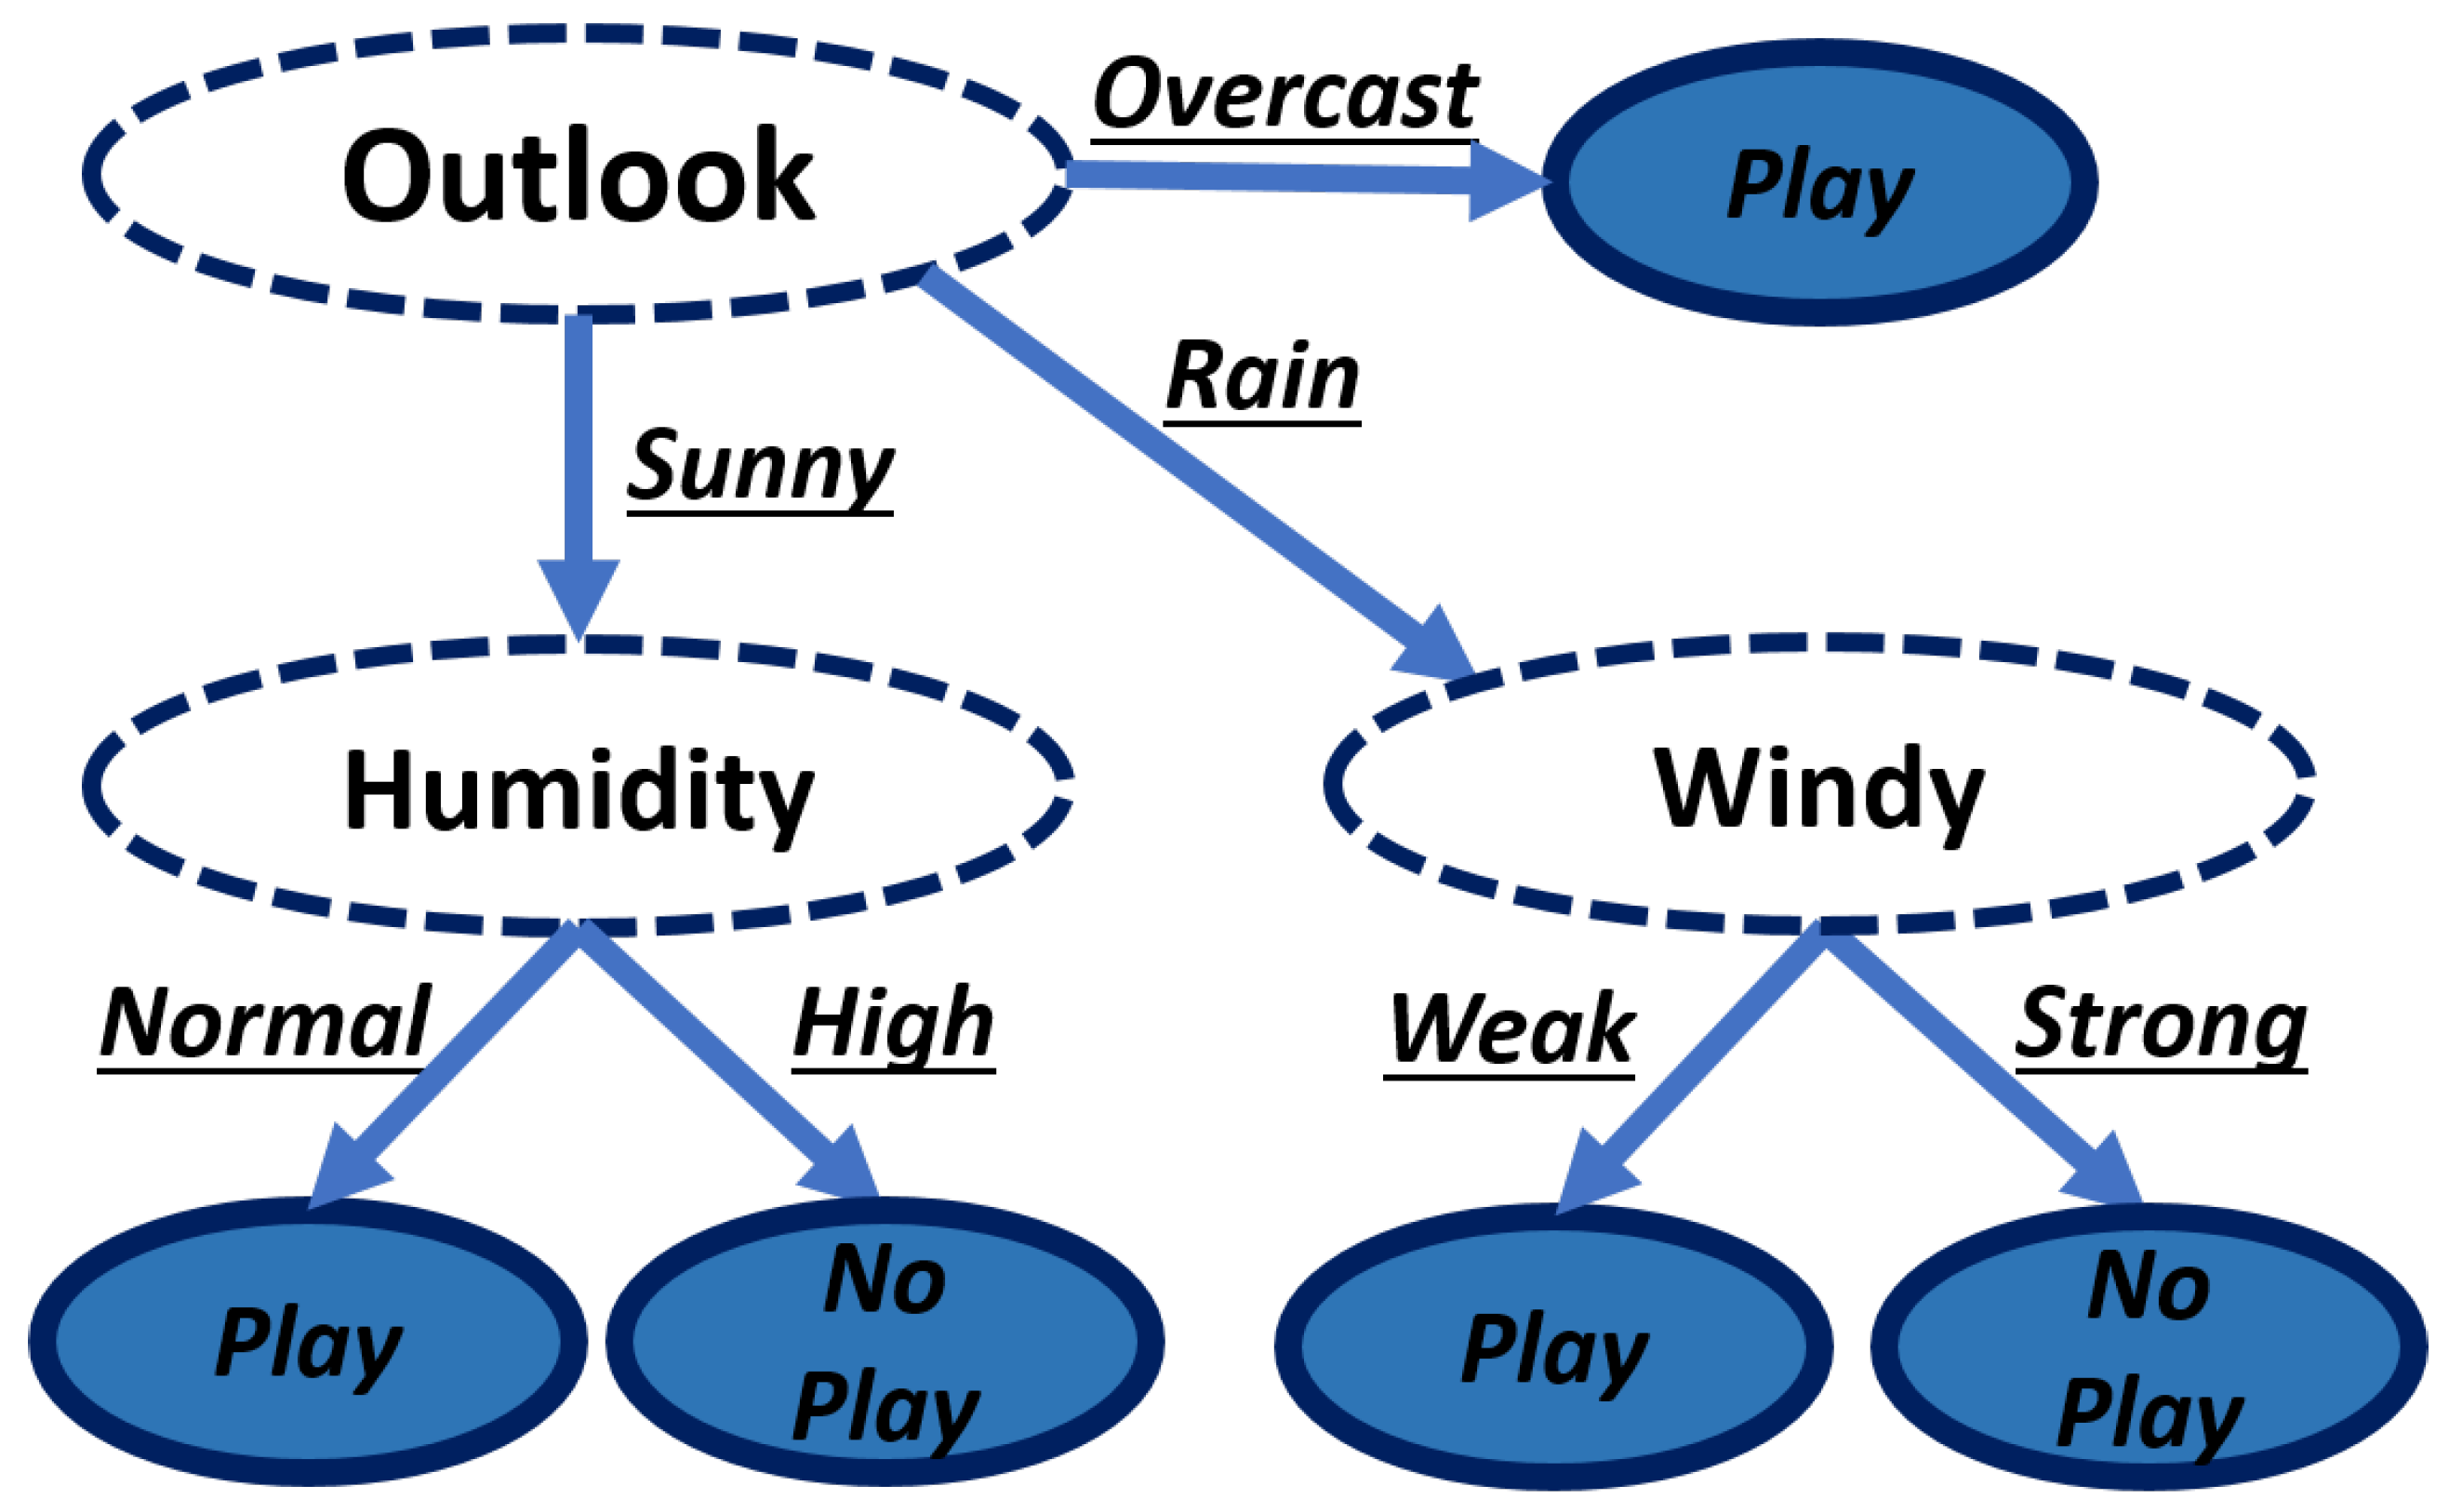
Figure 10.
The classifier’s test problem: Naive Bayes decision tree.

Figure 11.
Training data set: activity count.
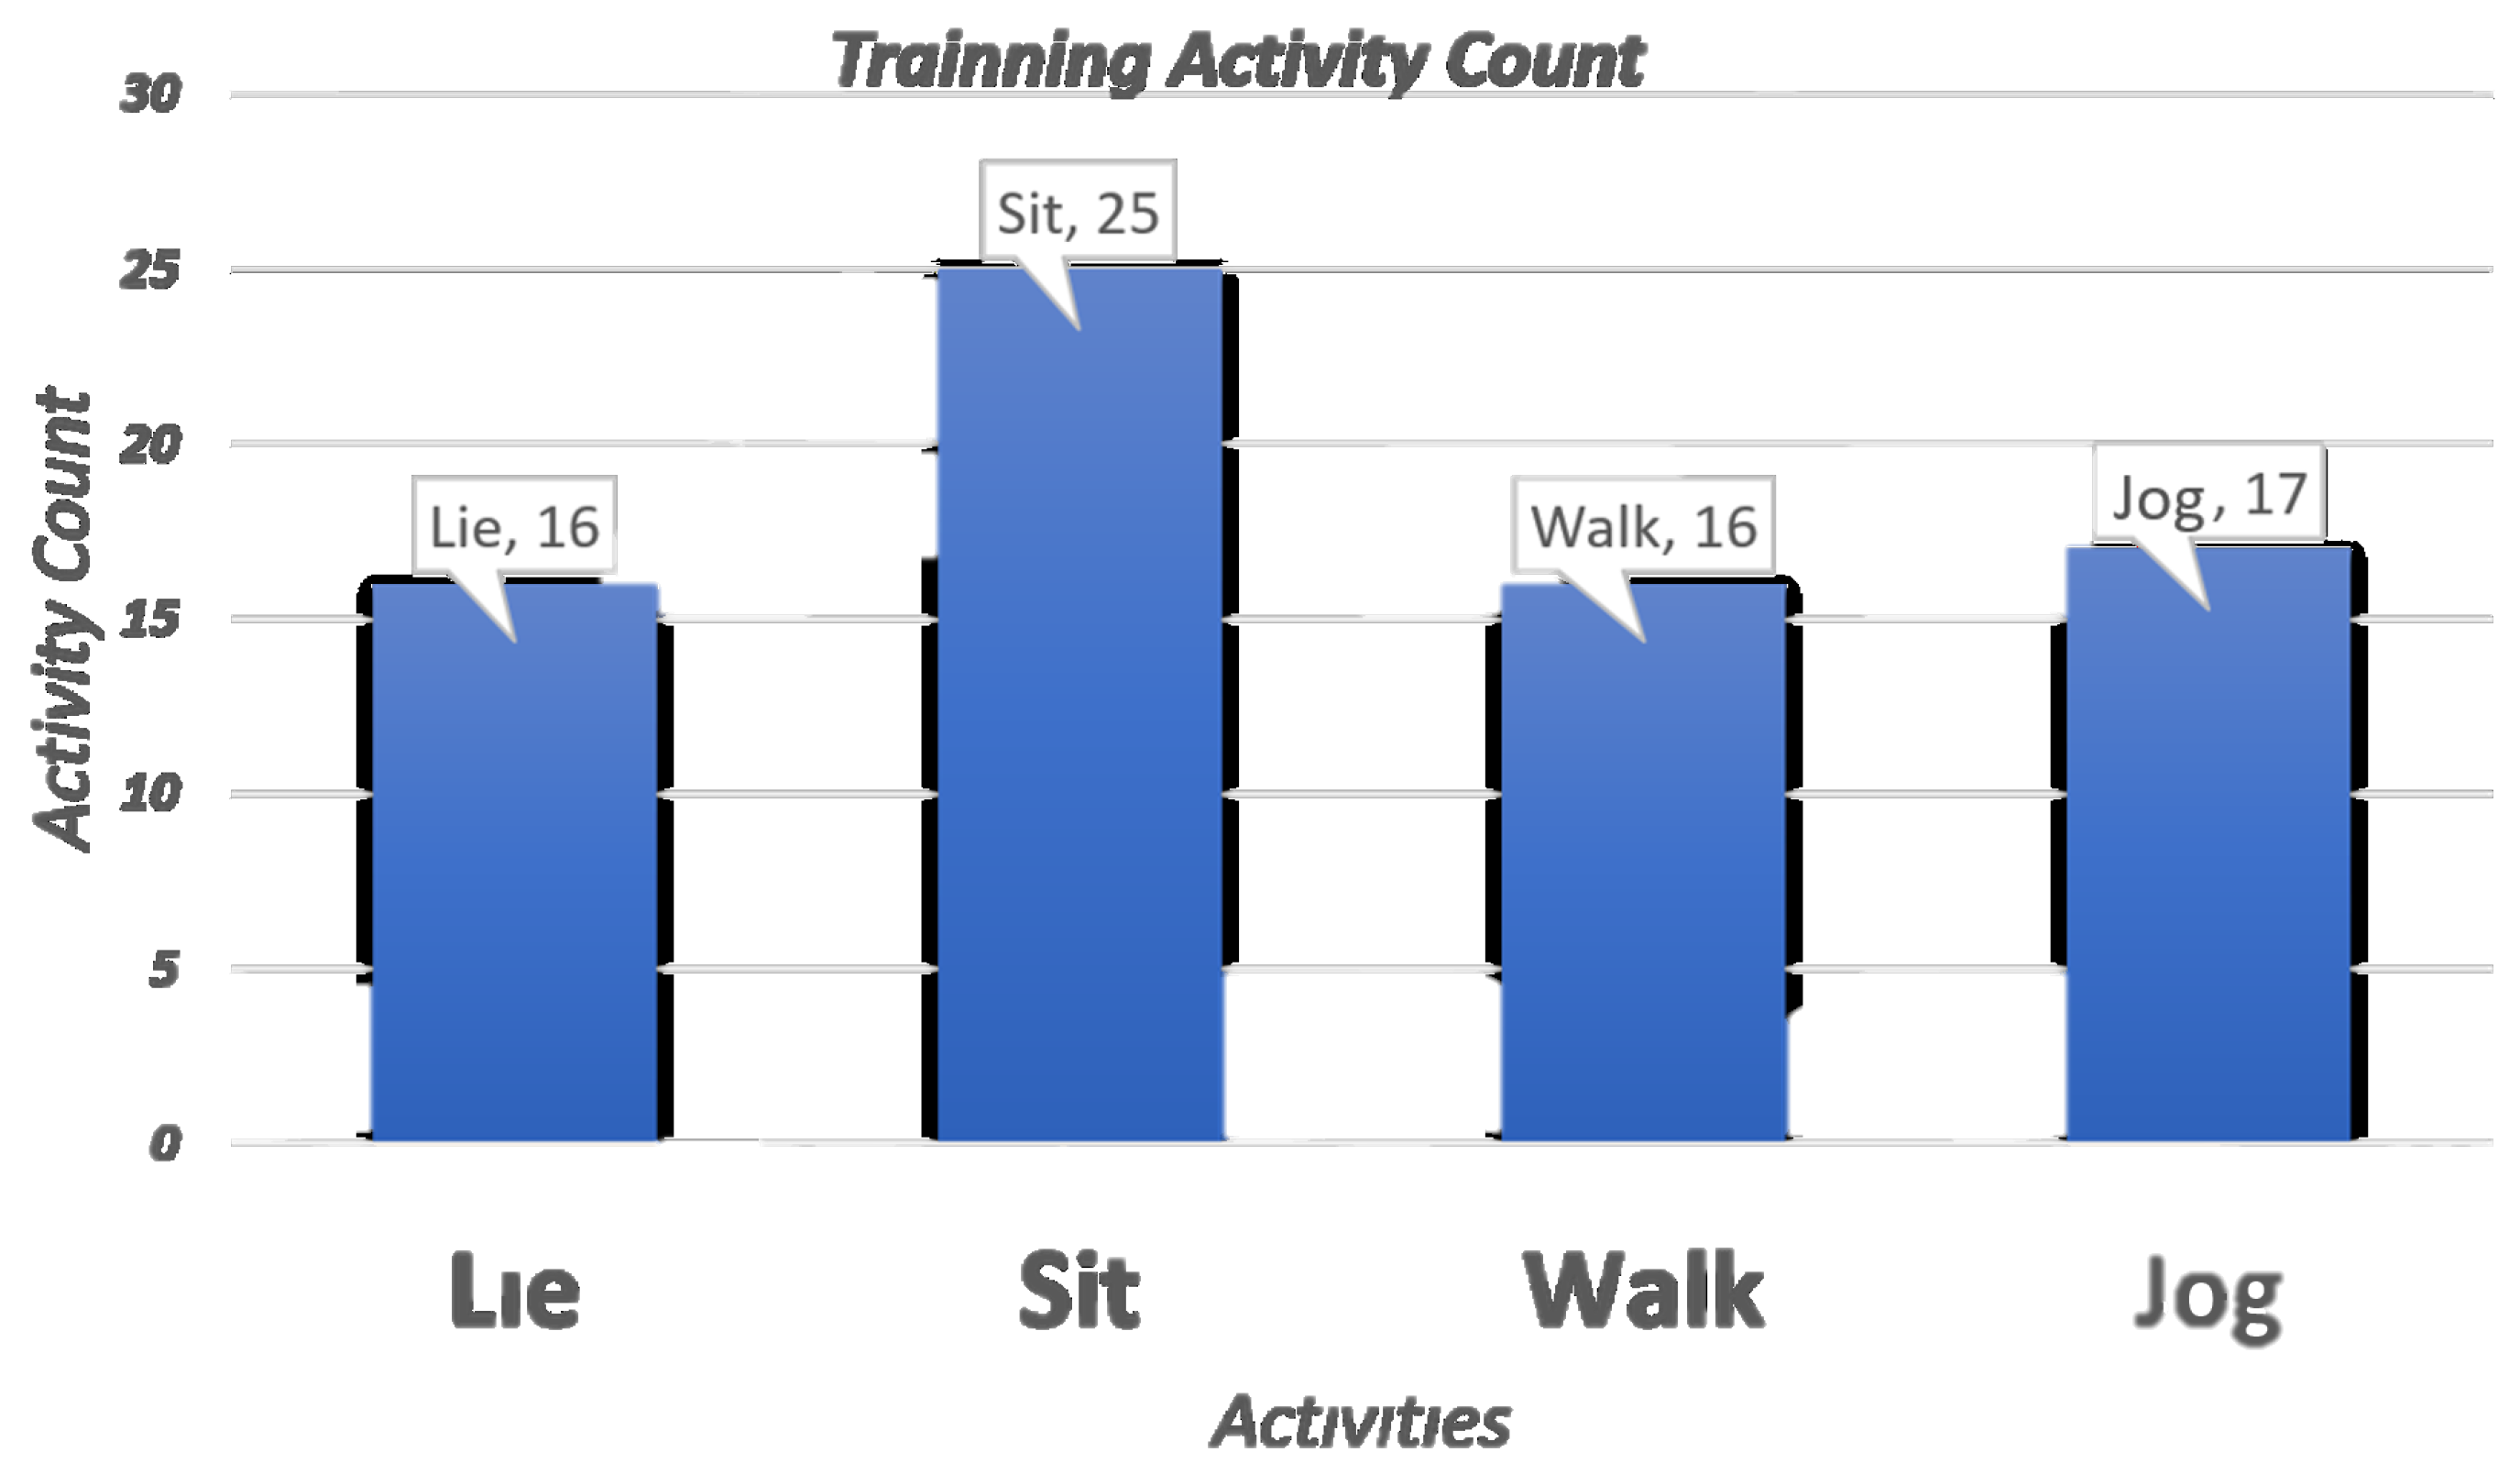
Figure 12.
Final decision tree based on the C4.5 algorithm.

Figure 13.
Results of the implementation phase.

Table 1.
Bioharness 3 specifications.
| Parameter | Value |
|---|---|
| HR Range: | 25–240 BPM |
| BR Range: | 4–70 BPM |
| Acc. Range: | ±16 g |
| Battery type: | Rechargeable Lithium Polymer |
| Battery Life: | 26 h per charge |
Table 2.
Attribute counting: value and probability.
| Structure | Formula | Parameters |
|---|---|---|
| Linear: Constant | ||
| Linear: line | ||
| Non-Linear: Exponential | ||
| Non-Linear: Sine | ||
| Non-Linear: Triangle | ||
| Non-Linear: Trapezoid |
Table 3.
Classifier’s test problems.
| Feature/Class | Possible Values |
|---|---|
| Feature: Outlook | Sunny: Overcast: Rain |
| Feature: Temperature | Cool: Mild: Hot |
| Feature: Humidity | Normal: High |
| Feature: Windy | Strong: Weak |
| Class: Outcome | Play: No Play |
Table 4.
Qualitative assignment.
| Feature | # In Low | Low Probability | # In High | High Probability |
|---|---|---|---|---|
| heart rate 1 | 62 | 0.837 | 12 | 0.162 |
| heart rate 2 | 4 | 0.054 | 70 | 0.945 |
| respiratory rate 1 | 45 | 0.608 | 29 | 0.391 |
| respiratory rate 2 | 10 | 0.135 | 64 | 0.865 |
| posture 1 | 17 | 0.230 | 57 | 0.770 |
| posture 2 | 1 | 0.013 | 73 | 0.986 |
| acceleration peak 1 | 57 | 0.770 | 17 | 0.229 |
| acceleration peak 2 | 39 | 0.527 | 35 | 0.473 |
| amplitude ECG 1 | 58 | 0.783 | 16 | 0.216 |
| amplitude ECG 2 | 73 | 0.986 | 1 | 0.013 |
| acceleration X 1 | 3 | 0.040 | 71 | 0.959 |
| acceleration X 2 | 2 | 0.027 | 72 | 0.973 |
| acceleration Y 1 | 9 | 0.122 | 65 | 0.878 |
| acceleration Y 2 | 2 | 0.027 | 72 | 0.973 |
| acceleration Z 1 | 12 | 0.162 | 62 | 0.837 |
| acceleration Z 2 | 2 | 0.027 | 72 | 0.973 |
Table 5.
Final rule set based on the C4.5 algorithm.
| R# | Condition | Output |
|---|---|---|
| 1 | Post A=L; A=H | Lie |
| 2 | Post A=L; A=L | Sit |
| 3 | Post A=H; PAcc A=L; A=L | Sit |
| 4 | Post A=H; PAcc A=L; A= 1; Resp A, ECG A=L; Resp B=H; A=H; PAcc B=H | Sit |
| 5 | Pos A=H; PAcc A=L; A=1; Resp A=L; A=H, ECG A=L; Resp B=H; A=H; PAcc B=L | Sit |
| 6 | Post A=H; PAcc A=L; A=1; Resp A=L; A=H, ECG=L, Resp B=H, AccY A=L | Walk |
| 7 | Post A=H; PAcc A=L; A=H; Resp A=L, AccX=L; ECG A=L; Resp B=L | Sit |
| 8 | Post A=H; PAcc A=L; A=H; Resp A=L; A=H, ECG A=H | Sit |
| 9 | Post A=H; PAcc A=L; A=H; Resp A=L; A=L | Jog |
| 10 | Post A=H; PAcc A=L; A=H; Resp A=H; Resp B=H | Walk |
| 11 | Post A=H; PAcc A=L; A=L; Resp A=H; Resp B=L | Sit |
| 12 | Post A=H; PAcc A=H; ECG B=L | Jog |
| 13 | Post A=H; PAcc A=H; ECG B=H | Walk |
Table 6.
Offline confusion table.
| Lie | Sit | Walk | Jog | Total | Error C | |
|---|---|---|---|---|---|---|
| Lie | 16 | 0 | 0 | 0 | 16 | 0 |
| Sit | 0 | 23 | 1 | 0 | 24 | 0.042 |
| Walk | 0 | 2 | 14 | 0 | 16 | 0.143 |
| Jog | 0 | 0 | 0 | 16 | 16 | 0 |
| Total | 16 | 25 | 15 | 16 | 72 | |
| Error O | 0 | 0.08 | 0.066 | 0 | 0.0417 |
Table 7.
Table of results of the implementation phase.
| Min:Sec | Activity | Classified | Score |
|---|---|---|---|
| 0:00–4:00 | Lie | Lie | True |
| 4:30–8:00 | Sit | Sit | True |
| 8:30–12:00 | Lie | Lie | True |
| 12:30–13:00 | Walk | Sit | False |
| 13:30–16:00 | Walk | Walk | True |
| 16:30–20:00 | Sit | Sit | True |
| 20:30–24:00 | Jog | Jog | True |
| 24:30 | Sit | Sit | True |
| 25:00 | Sit | Walk | False |
| 25:30–28:00 | Sit | Sit | True |
| 28:30–32:00 | Jog | Jog | True |
| 32:30–36:00 | Walk | Walk | True |
© 2017 by the authors. Licensee MDPI, Basel, Switzerland. This article is an open access article distributed under the terms and conditions of the Creative Commons Attribution (CC BY) license (http://creativecommons.org/licenses/by/4.0/).
Share and Cite
MDPI and ACS Style
Castro, D.; Coral, W.; Rodriguez, C.; Cabra, J.; Colorado, J. Wearable-Based Human Activity Recognition Using an IoT Approach. J. Sens. Actuator Netw. 2017, 6, 28. https://doi.org/10.3390/jsan6040028
AMA Style
Castro D, Coral W, Rodriguez C, Cabra J, Colorado J. Wearable-Based Human Activity Recognition Using an IoT Approach. Journal of Sensor and Actuator Networks. 2017; 6(4):28. https://doi.org/10.3390/jsan6040028
Chicago/Turabian StyleCastro, Diego, William Coral, Camilo Rodriguez, Jose Cabra, and Julian Colorado. 2017. "Wearable-Based Human Activity Recognition Using an IoT Approach" Journal of Sensor and Actuator Networks 6, no. 4: 28. https://doi.org/10.3390/jsan6040028
Note that from the first issue of 2016, this journal uses article numbers instead of page numbers. See further details here.