Addressing the Issue of Routing Unfairness in Opportunistic Backhaul Networks for Collecting Sensed Data

 , ,
, , 

Abstract
:1. Introduction
1.1. Routing Unfairness in OppNets
- How to design a forwarding utility that can increase the contribution of less popular nodes in the presence of spatial locality?
- How to determine a measure that can locally quantify the burden on nodes through non-scenario-specific means?
- How can fairness be improved with the forwarding utility and the burden measure without reducing delivery guarantees?
1.2. Authors’ Contribution
- Supported with simulation experiments, we investigate the impact of spatial locality inherent to user movement in sensed data collection scenarios on OppNet routing protocols and also identify drawbacks of existing burden detection approaches. Then, from our findings, we suggest design guidelines that need to be considered when addressing fair OppNet routing for collecting sensed data in real-world scenarios.
- Next, we follow our design guidelines to propose the Fair Locality Aware Routing (FLARoute) technique, which, to the best of our knowledge, presents the first routing approach that considers the impact of spatial locality inherent to user movement in urban environments. FLARoute implements a fair forwarding utility and distributed mechanisms, namely Relative Burden Detection (ReBurD) and Maximum Burden Estimation (MaxBE). Fair forwarding decisions are made with the Fair Locality Aware Forwarding (FLAFord) algorithm, which introduces a new burden balancing mechanism. Through simulation experiments, we verify that FLARoute can be incorporated into relevant routing protocols to improve fairness and throughput under conditions that compromise the performance of existing fair routing solutions.
1.3. Organization of the Paper
2. Problem Background
2.1. Need for Routing Fairness in OppNets
2.1.1. Fair Routing as a Complement to Congestion Control
2.1.2. Fair Routing as an Enhancement for Incentive Schemes
2.1.3. Fair Routing as an Augmentation for Energy Awareness
2.2. Existing OppNet Routing Protocols for Sensed Data Collection
2.2.1. Overview of OppNet Routing Techniques
2.2.2. OppNet Routing Protocols in Sensed Data Collection Scenarios
2.2.3. Current State of OppNet Routing Protocols for Sensed Data Collection
2.3. Existing Solutions for Improving OppNet Routing Fairness
2.4. Limitations of Existing Fair Routing Solutions for Sensed Data Collection
2.4.1. Neglecting the Impact of Spatial Locality
2.4.2. Unsuitable Forwarding Utility for Less Popular Nodes
2.4.3. Scenario-Specific Burden Measures
2.5. Fair Routing Guidelines for Collecting Sensed Data with OppNets
- An economical network model utilizes static gateway nodes, which are basically routers deployed in popular locations that allow sufficient encounter opportunities with user devices. Hence, the approach for computing forwarding utilities should be able to efficiently determine routing paths to destination nodes that are characterised by lack of mobility, limited social characteristics and inadequate contextual information.
- Gateway nodes are likely to be relatively few in order to minimize procurement, installation and maintenance costs, as well as maintain a manageable level of complexity. Due to their sparse distribution, design assumptions should be in accordance with the concepts of spatial locality inherent to user movement. Since the strength and reliability of social bonds and encounter-based relationships tend to reduce with distance, related metrics may not always perform as expected. Also, achieving acceptable fairness and throughput may require messages to traverse more than the usual number of hops to arrive at more distant destinations.
- The forwarding utility should be less biased towards global popularity, thereby allowing contribution from a wider range of nodes. For instance, the forwarding utility could be designed so that the encounter-based popularity of nodes cannot be perceived beyond H hops, where H represents a relatively small number. This ensures that the forwarding utility of a popular node is not always higher than that of a less popular node, unless the former is within H hops from the gateway.
- While allowing a wider range of relay nodes, the forwarding utility should also be able to maximize the contribution of less popular nodes. This requires knowledge about human movement, since less popular nodes may not have strong social ties or encounter-based relationships with gateways nodes. For instance, the regularity embedded in node movement could be exploited to carry messages closer to locations where more suitable relay nodes are likely to be encountered.
- During an encounter, routing decisions are made by comparing information about the nodes in contact. Knowledge about the relative burden on nodes is therefore necessary to make fair routing decisions. While this knowledge is mostly inferred from buffer information, conditions such as changes in data traffic, unequal buffer capacities and dynamic user behaviour may lead to misinterpretations. Hence, in order to ensure fairness under different network conditions, burden should be determined from properties that are directly related to resource consumption on nodes.
3. FLARoute: Fair Locality Aware Routing
- A forwarding utility that can assign forwarding responsibilities to nodes according to their spatial connectivity, in order to allow more nodes to participate in routing even under higher degrees of spatial locality;
- A non-scenario-specific means of identifying the burden on nodes, whose performance is not degraded by fluctuations in data traffic, variations in buffer capacity and dynamic user behaviour;
- A mechanism that can maximize the participation of less popular nodes by allowing them to forward messages with minimum involvement from popular nodes, especially when the latter is over-burdened; and
- A forwarding algorithm that makes fair forwarding decisions with the available knowledge.
3.1. Overview of FLARoute
- Determining a fair forwarding utility that can allow less burdened nodes to forward messages with minimal requirement of popular nodes;
- Determining and keeping account of the relative burden incurred from forwarding messages;
- Estimating the maximum burden on neighbouring nodes; and
- Forwarding messages with the fair forwarding utility and making decisions based on available burden information.
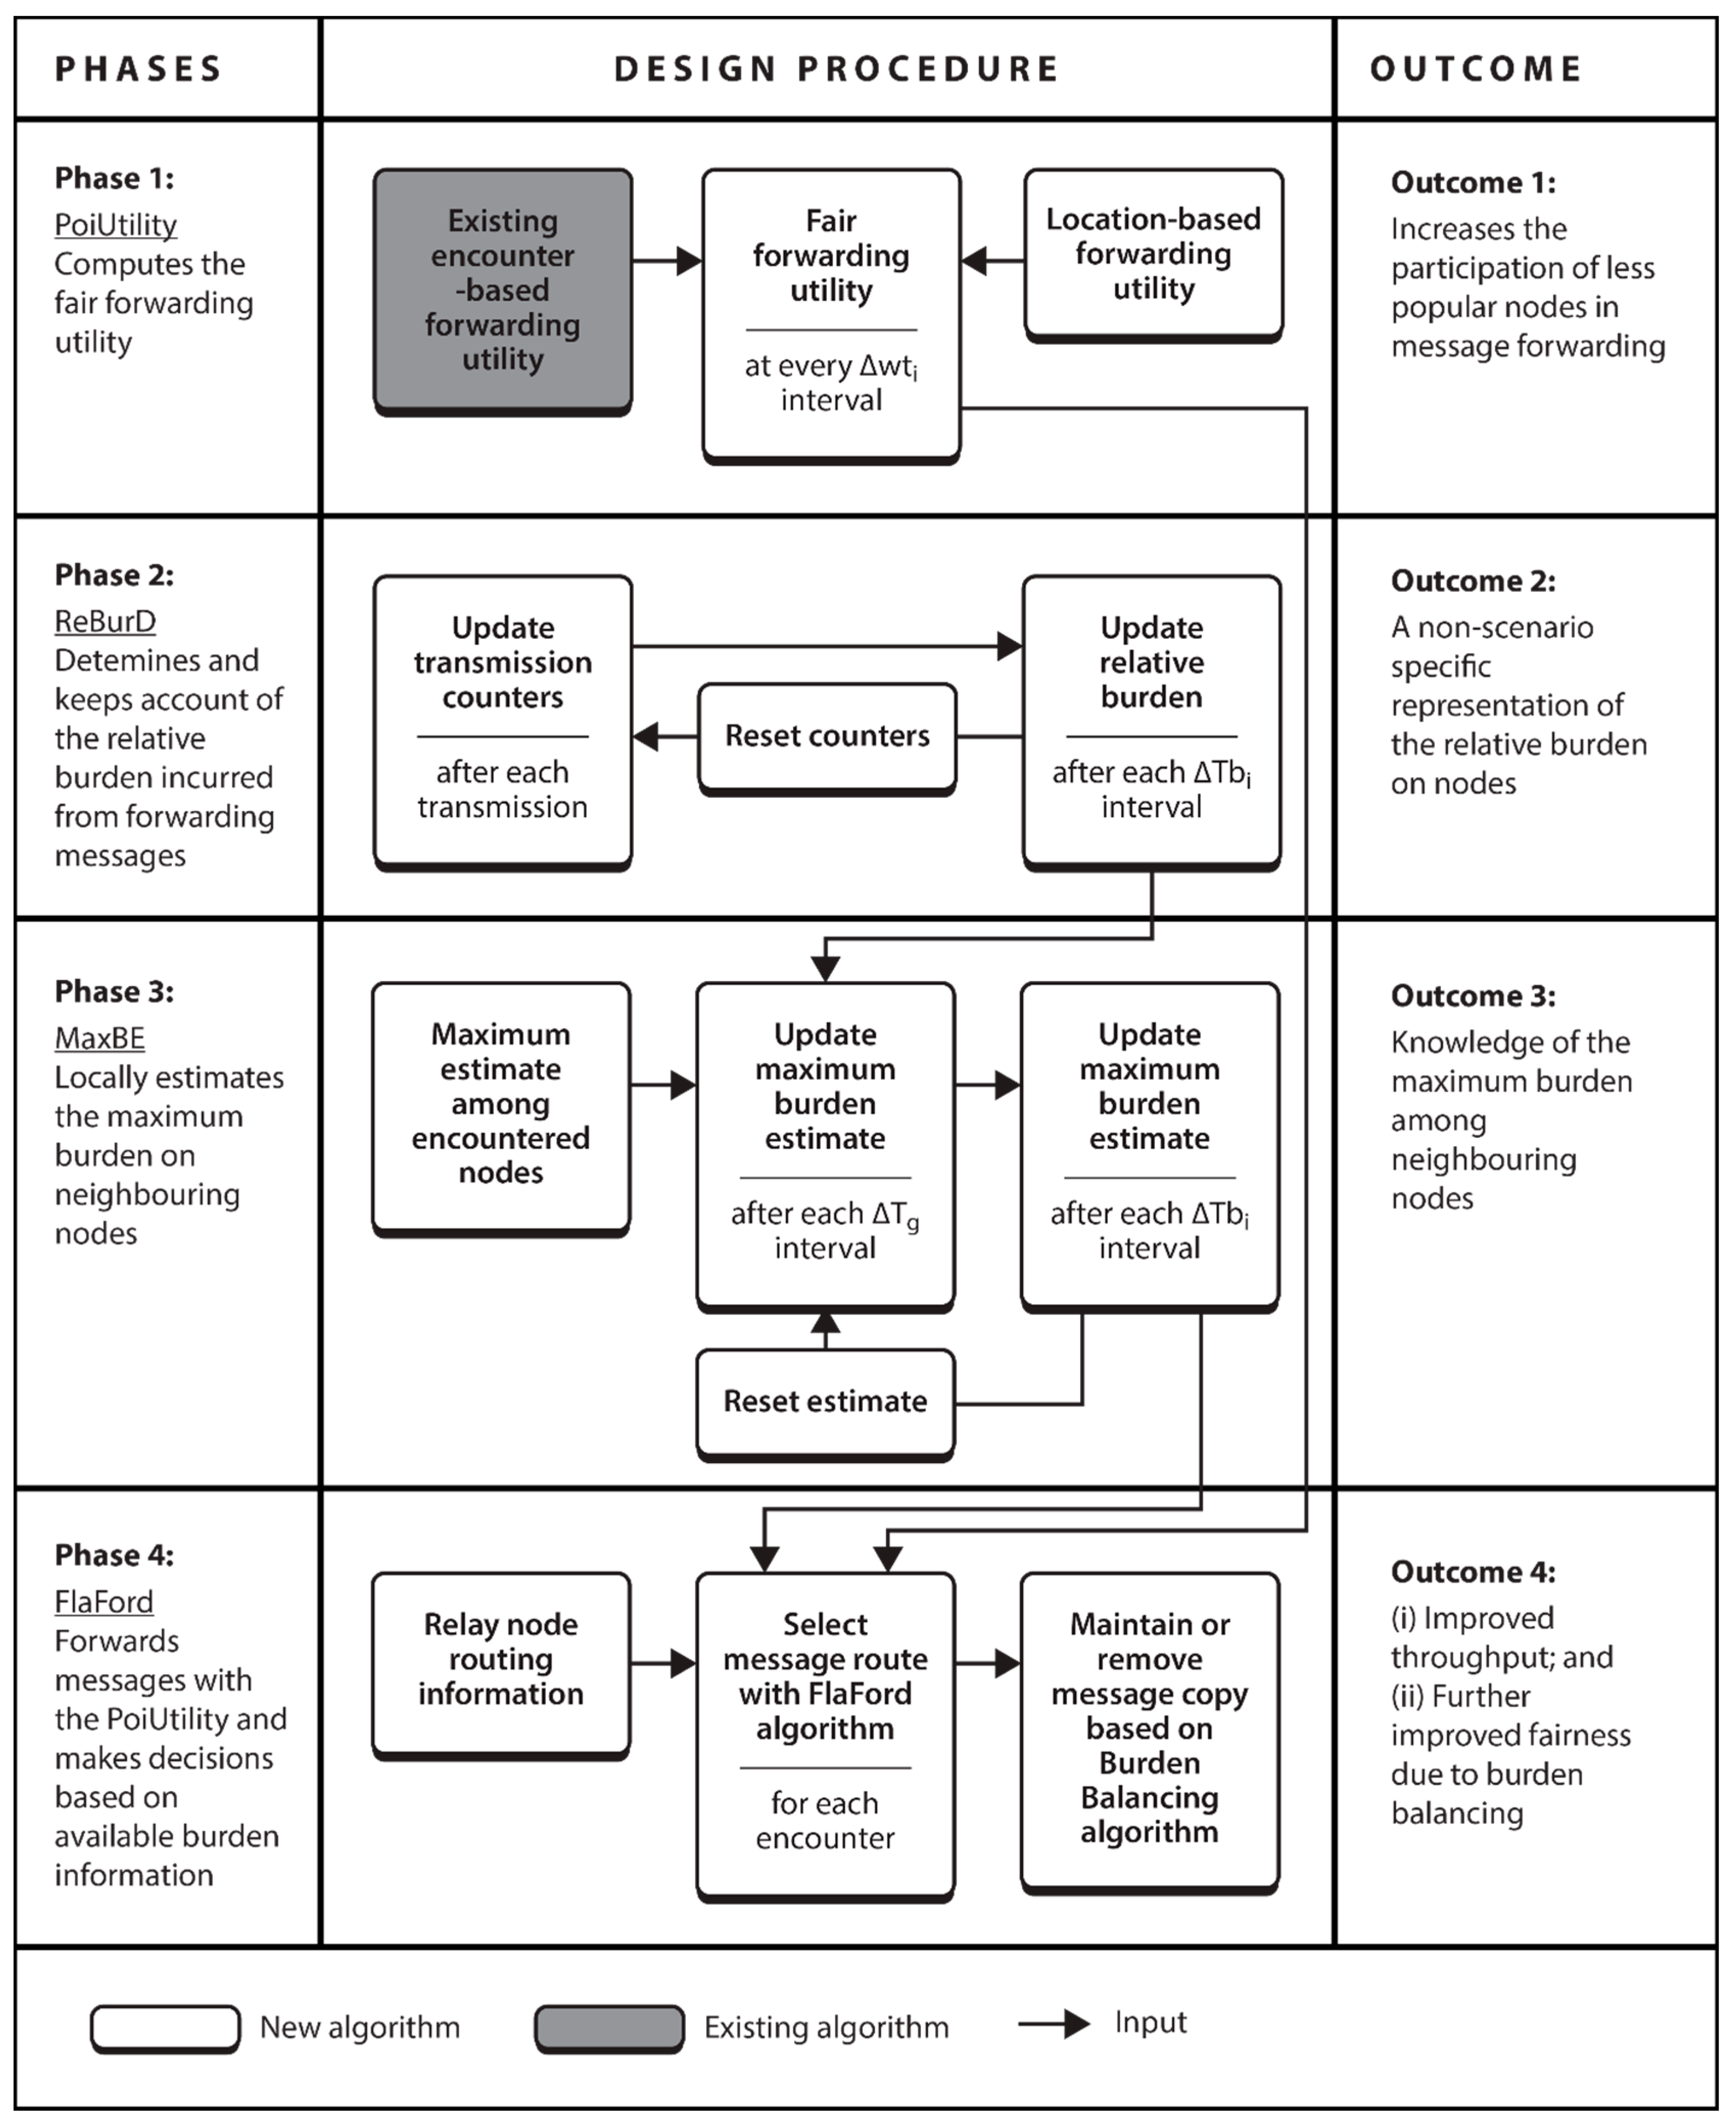
3.2. FLARoute Design
3.2.1. Phase 1: Computing the Fair Forwarding Utility
3.2.2. Phase 2: Determining Relative Burden
3.2.3. Phase 3: Estimating the Maximum Burden on Neighbouring Nodes
3.2.4. Phase 4: Fair Message Forwarding
| Algorithm 1 Making fair forwarding decisions with FLAFord | |||||
| Input: messages in ’s buffer , , , , , , | |||||
| Output: suitable relay nodes and respective messages | |||||
| 1 | foreach Input do | ||||
| 2 | if is then | ||||
| 3 | if then | ||||
| 4 | Insert into ; | ||||
| 5 | Remove from buffer; | ||||
| 6 | end | ||||
| 7 | end | ||||
| 8 | else | ||||
| 9 | if or then | ||||
| 10 | Insert into ; | ||||
| 11 | if and and then | ||||
| 12 | Remove from buffer; | ||||
| 13 | end | ||||
| 14 | end | ||||
| 15 | end | ||||
| 16 | end | ||||
| 17 | return ; | ||||
4. Evaluation
4.1. Evaluation Methodology
4.1.1. Simulation Set-Up
4.1.2. Performance Evaluation Metrics
4.2. Results and Discussion
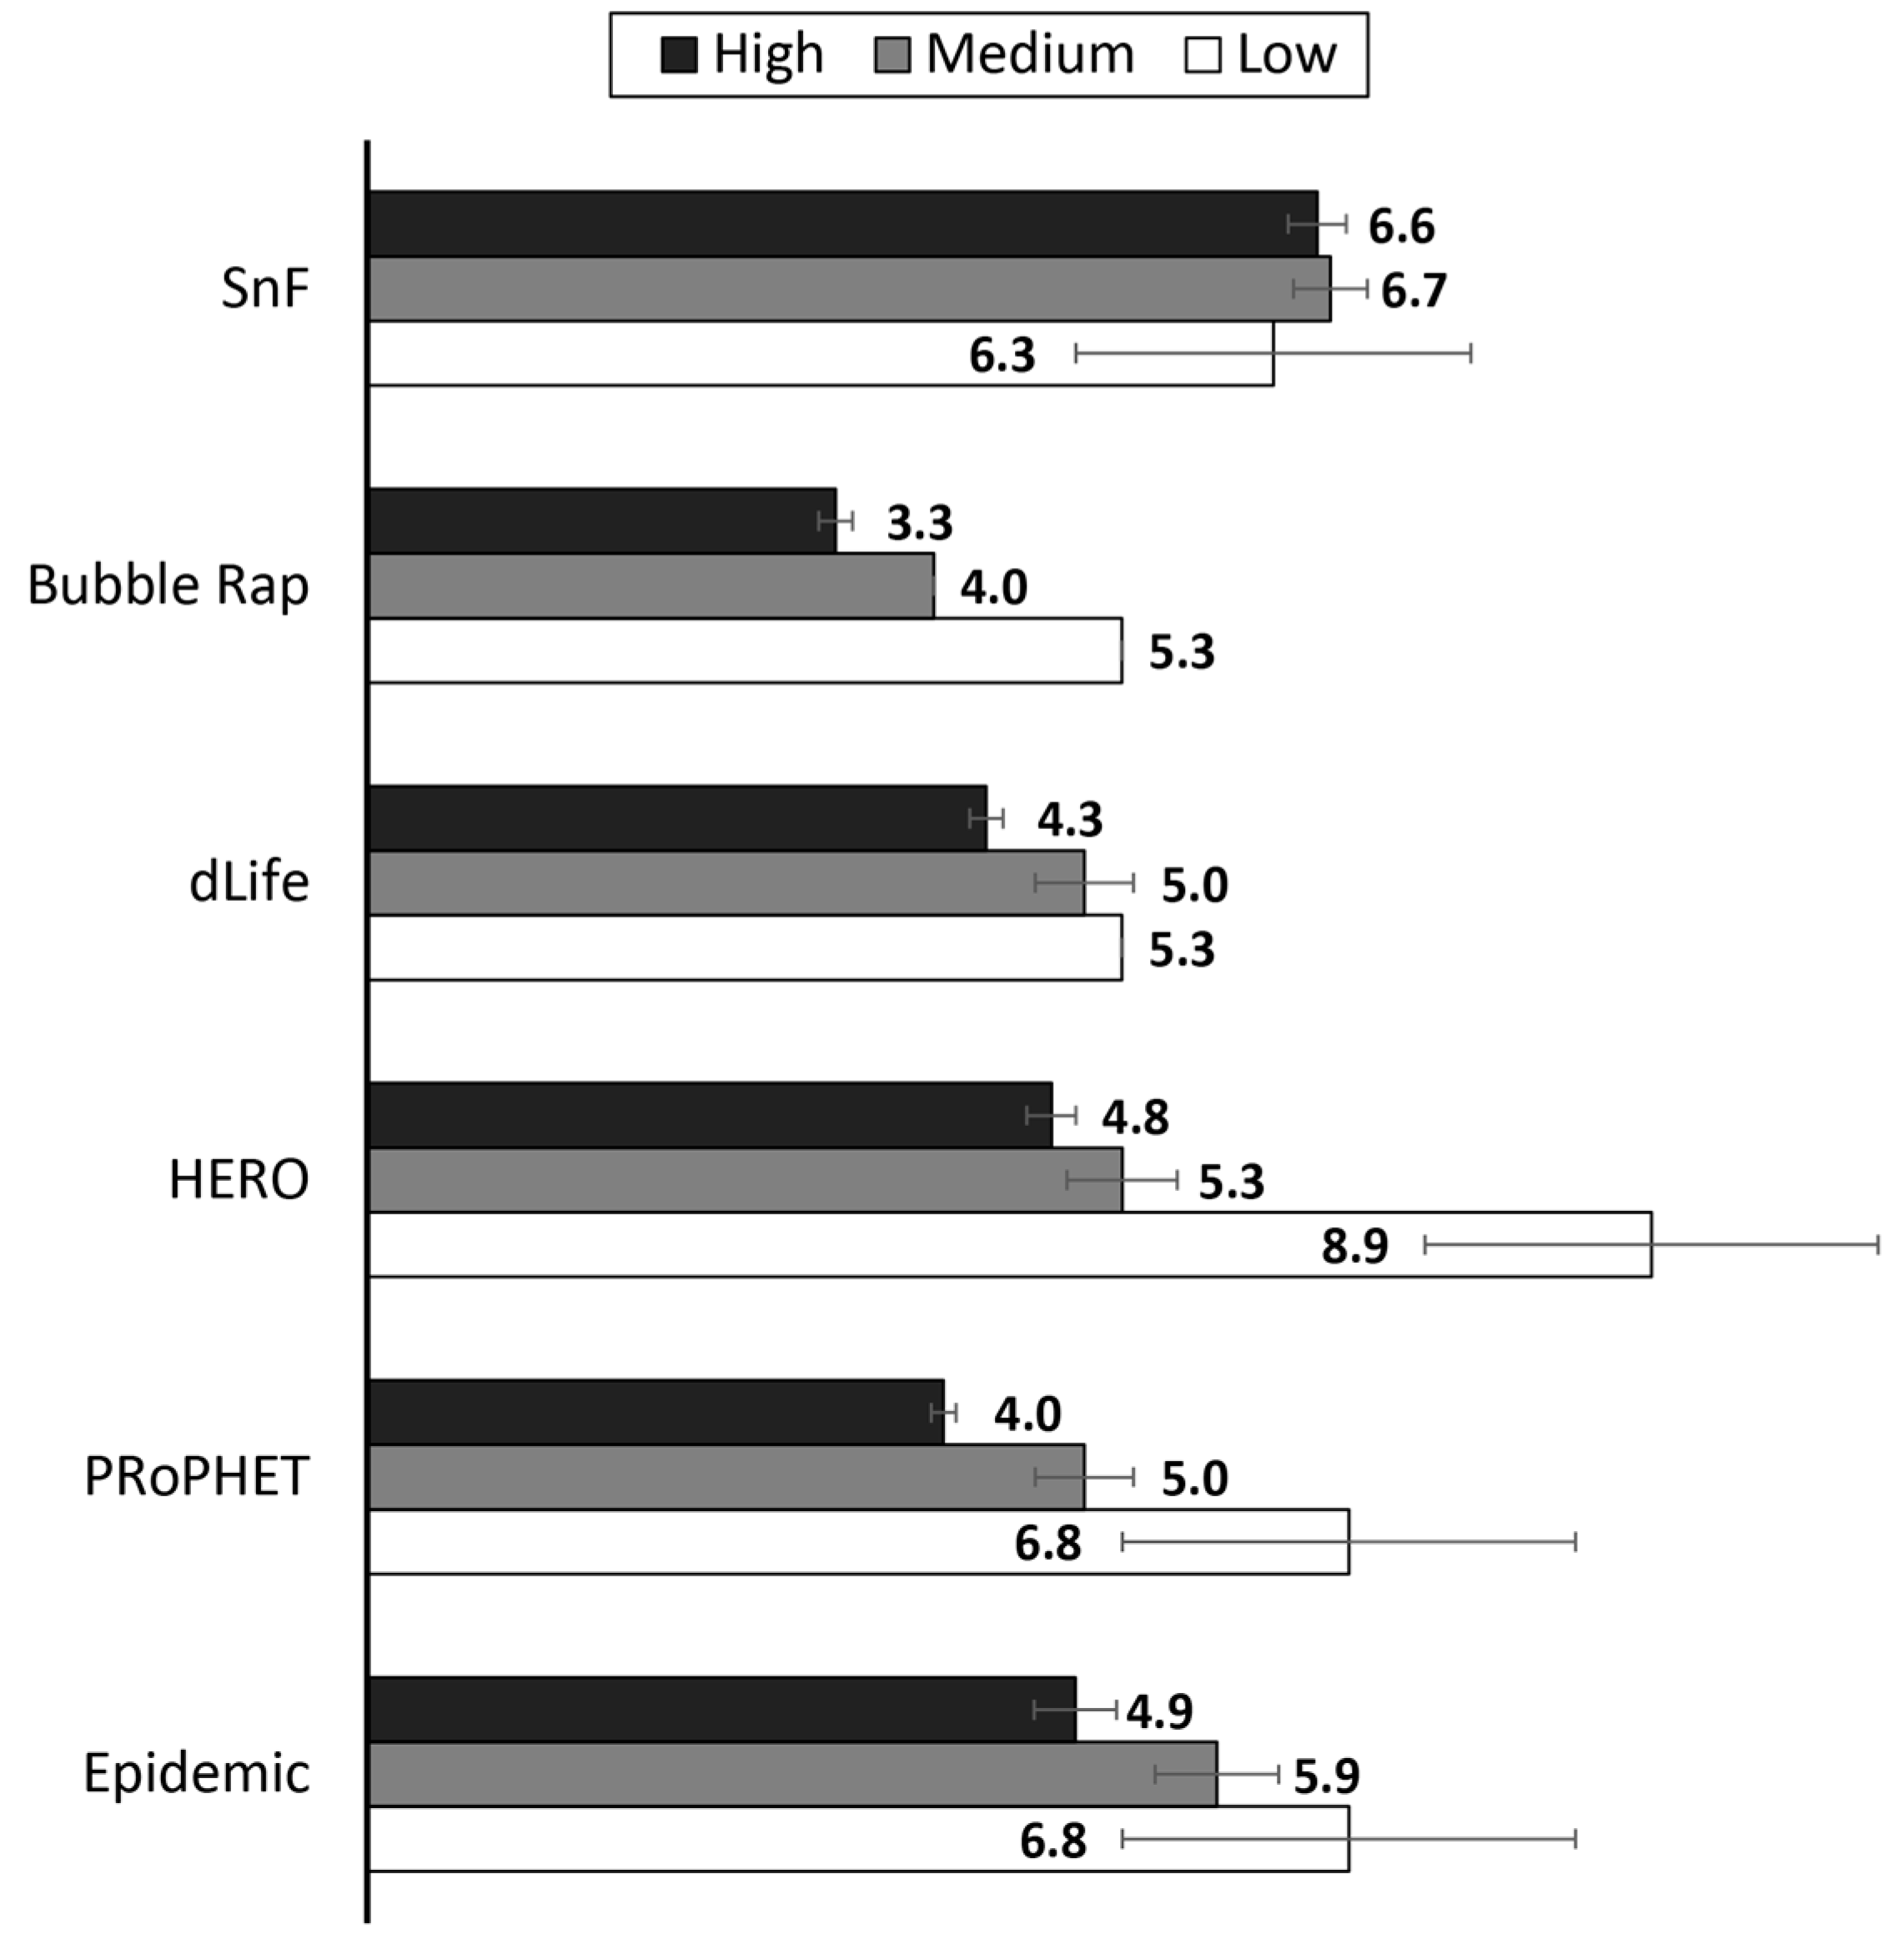
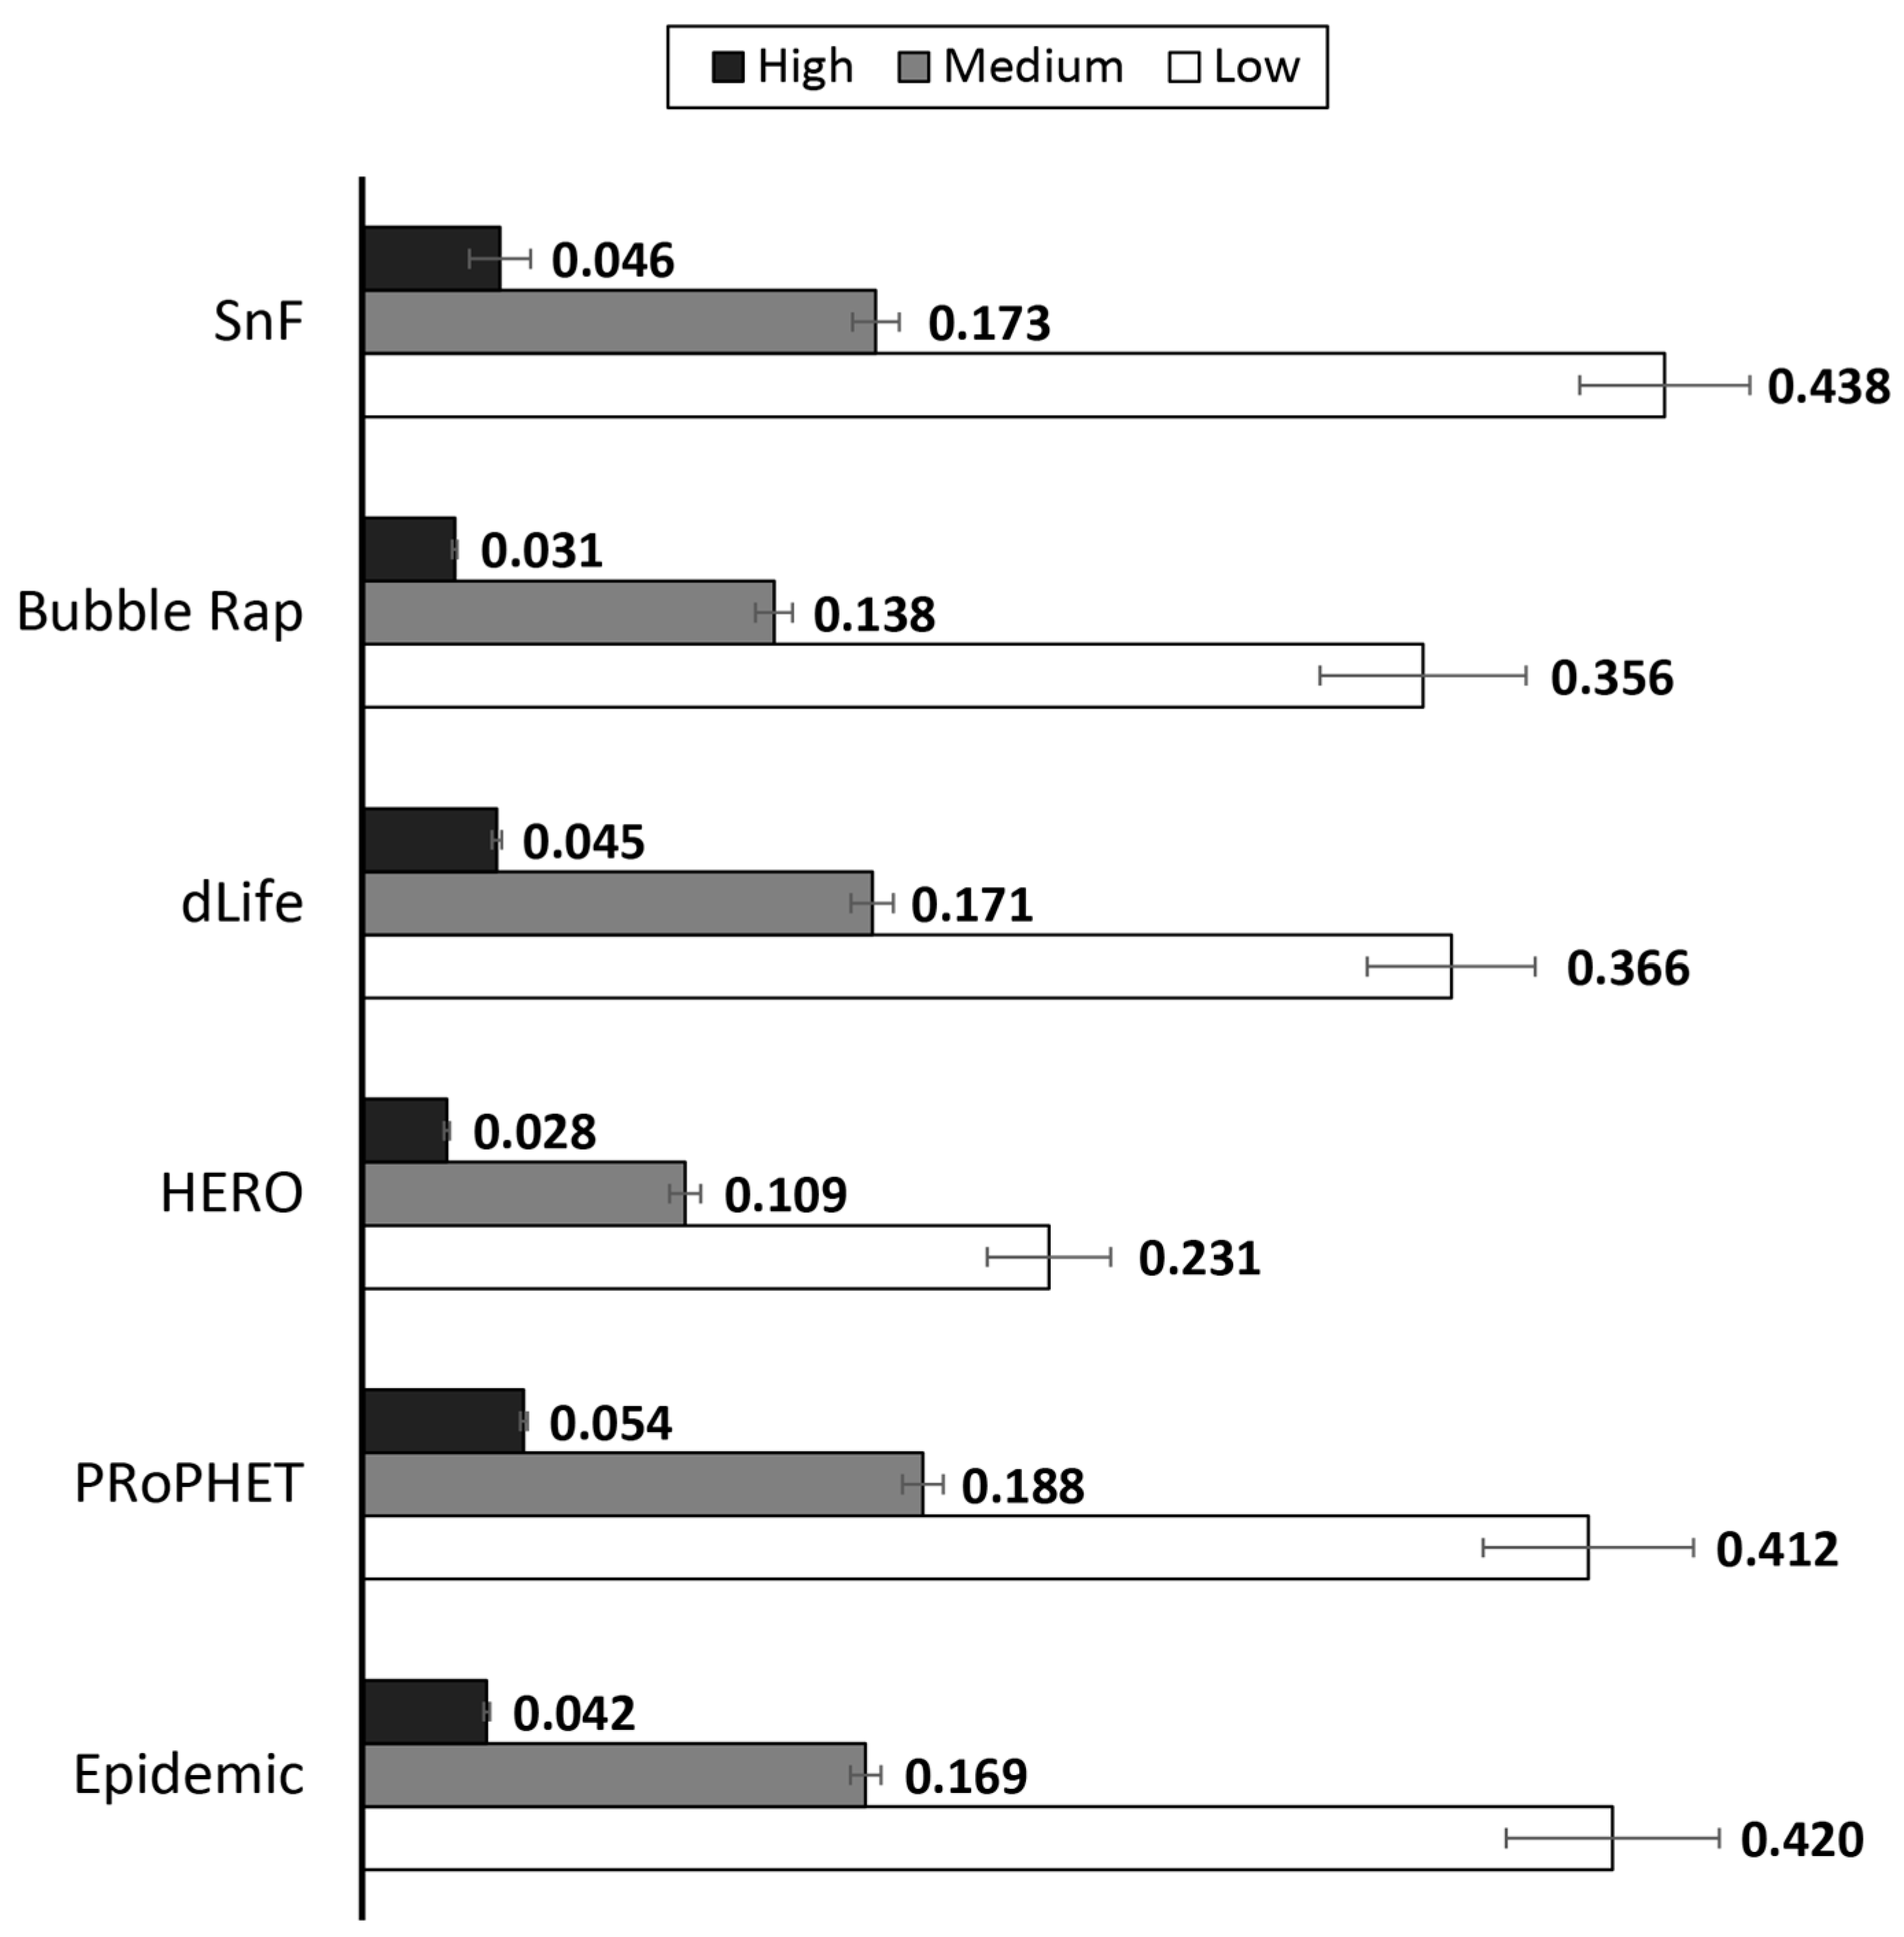
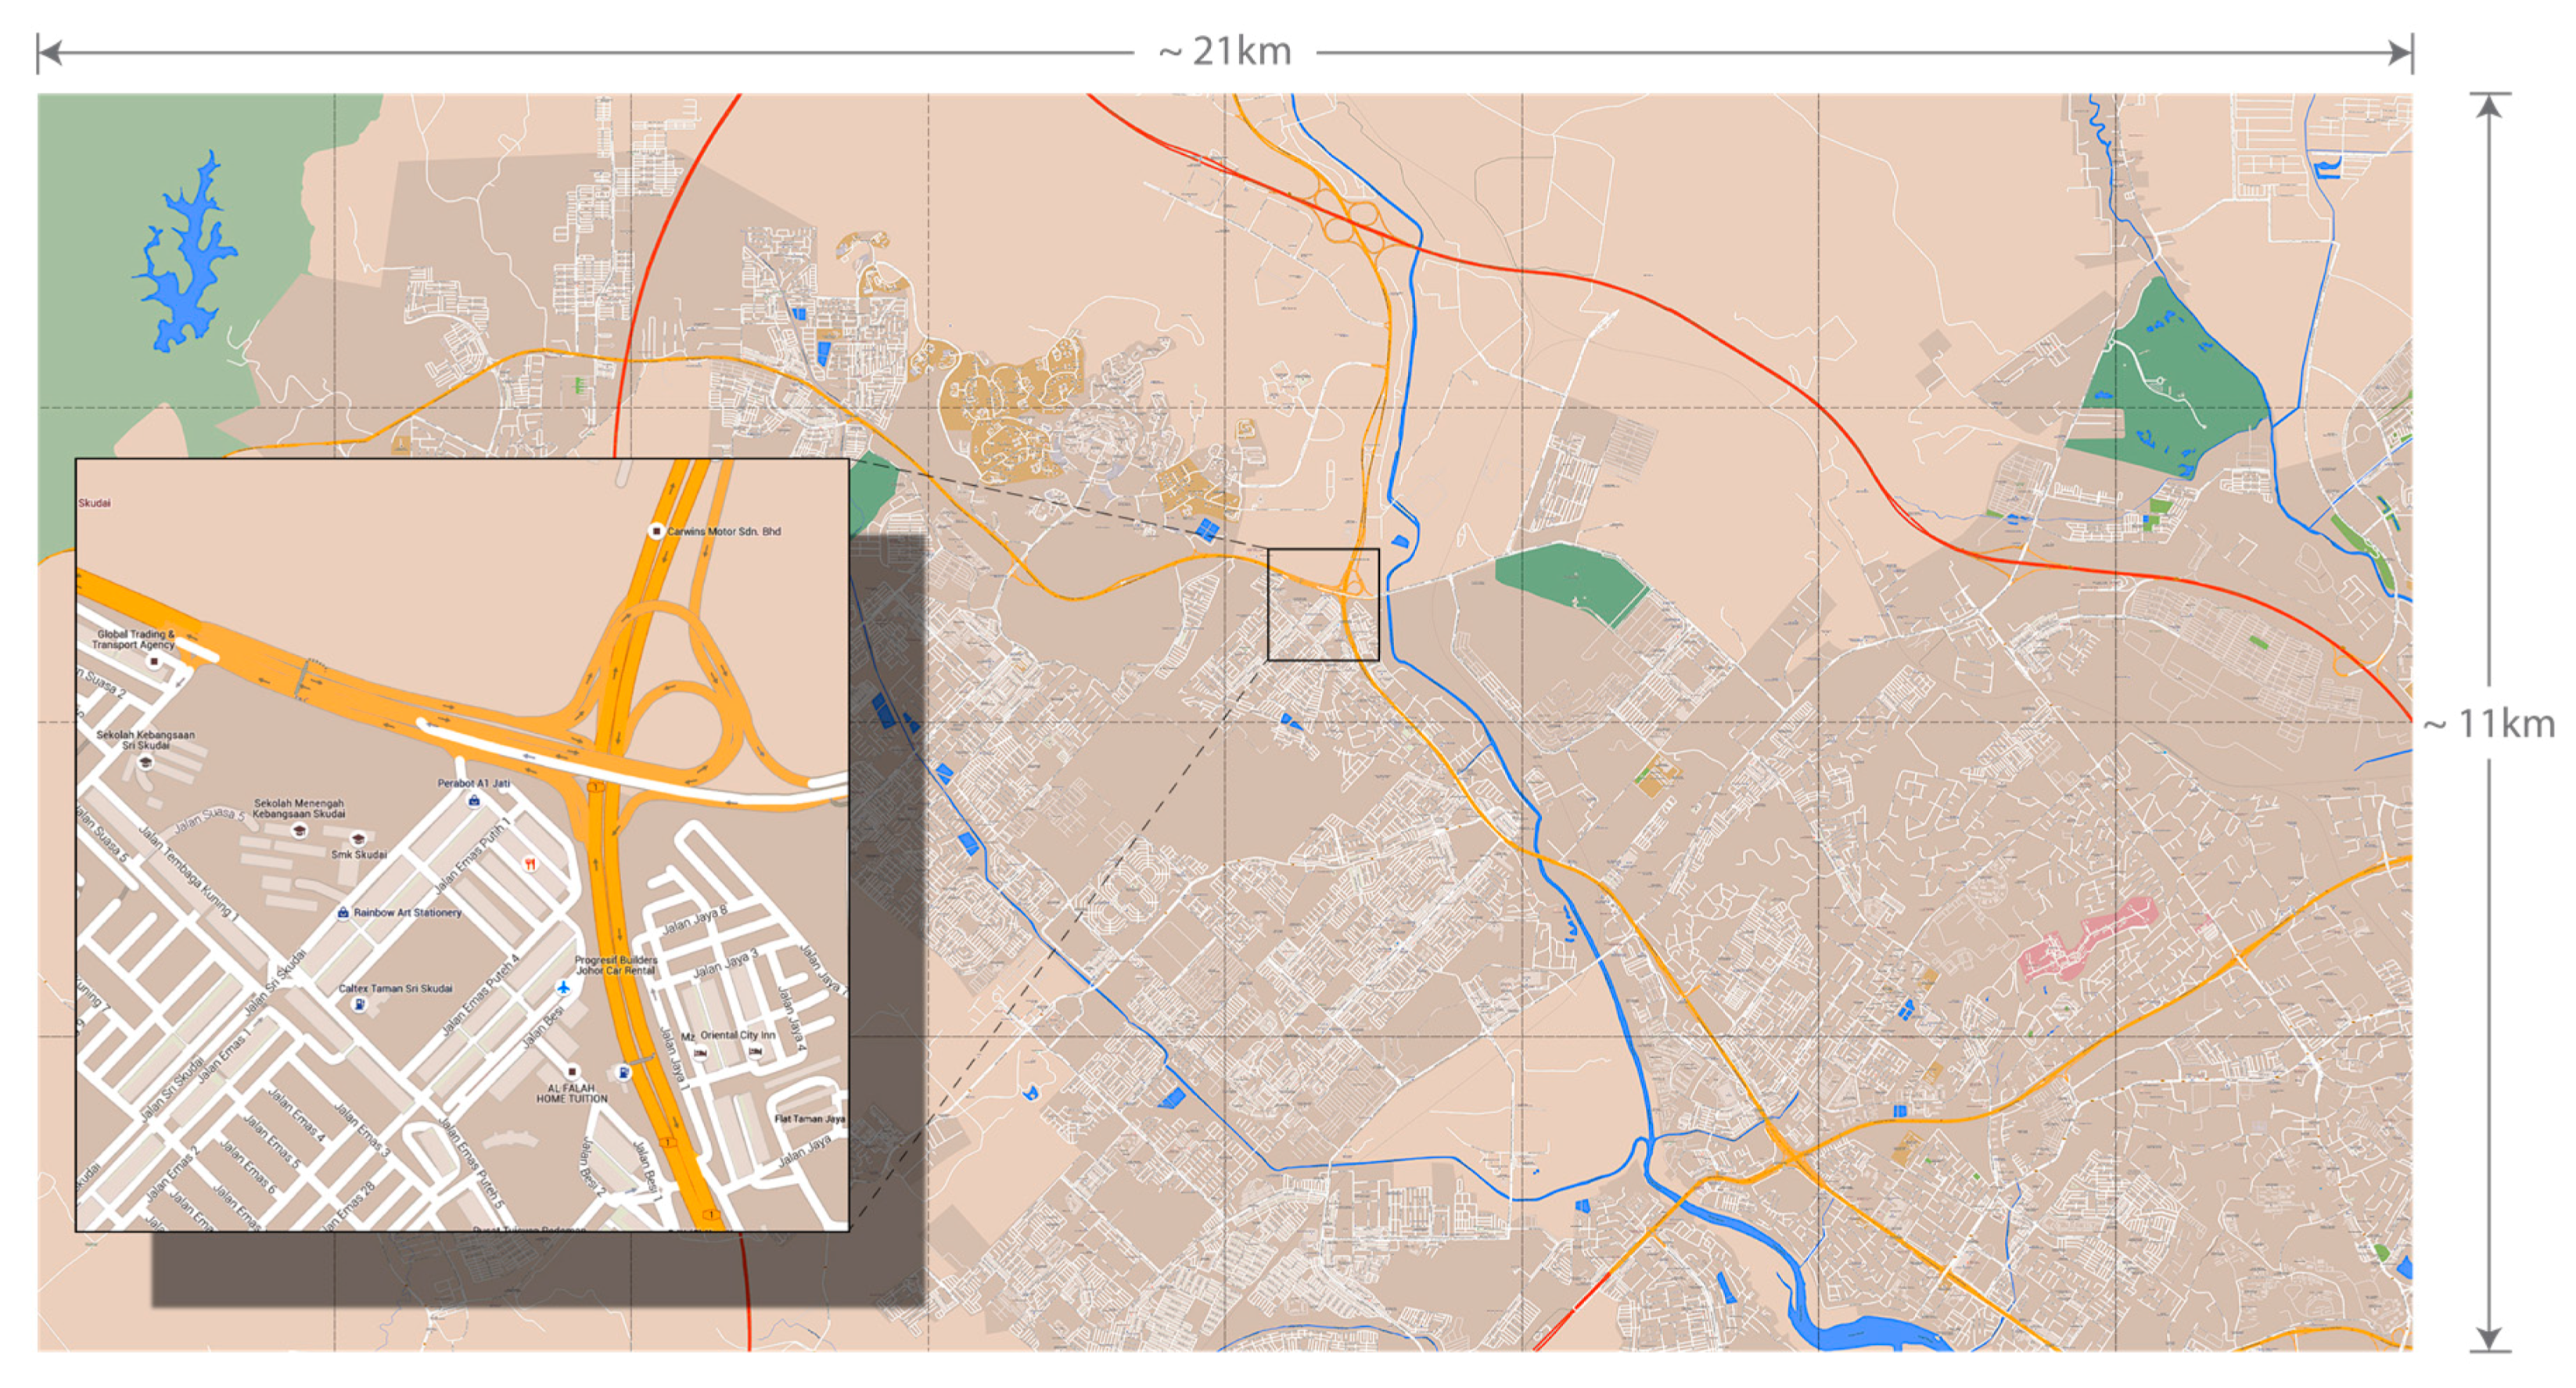
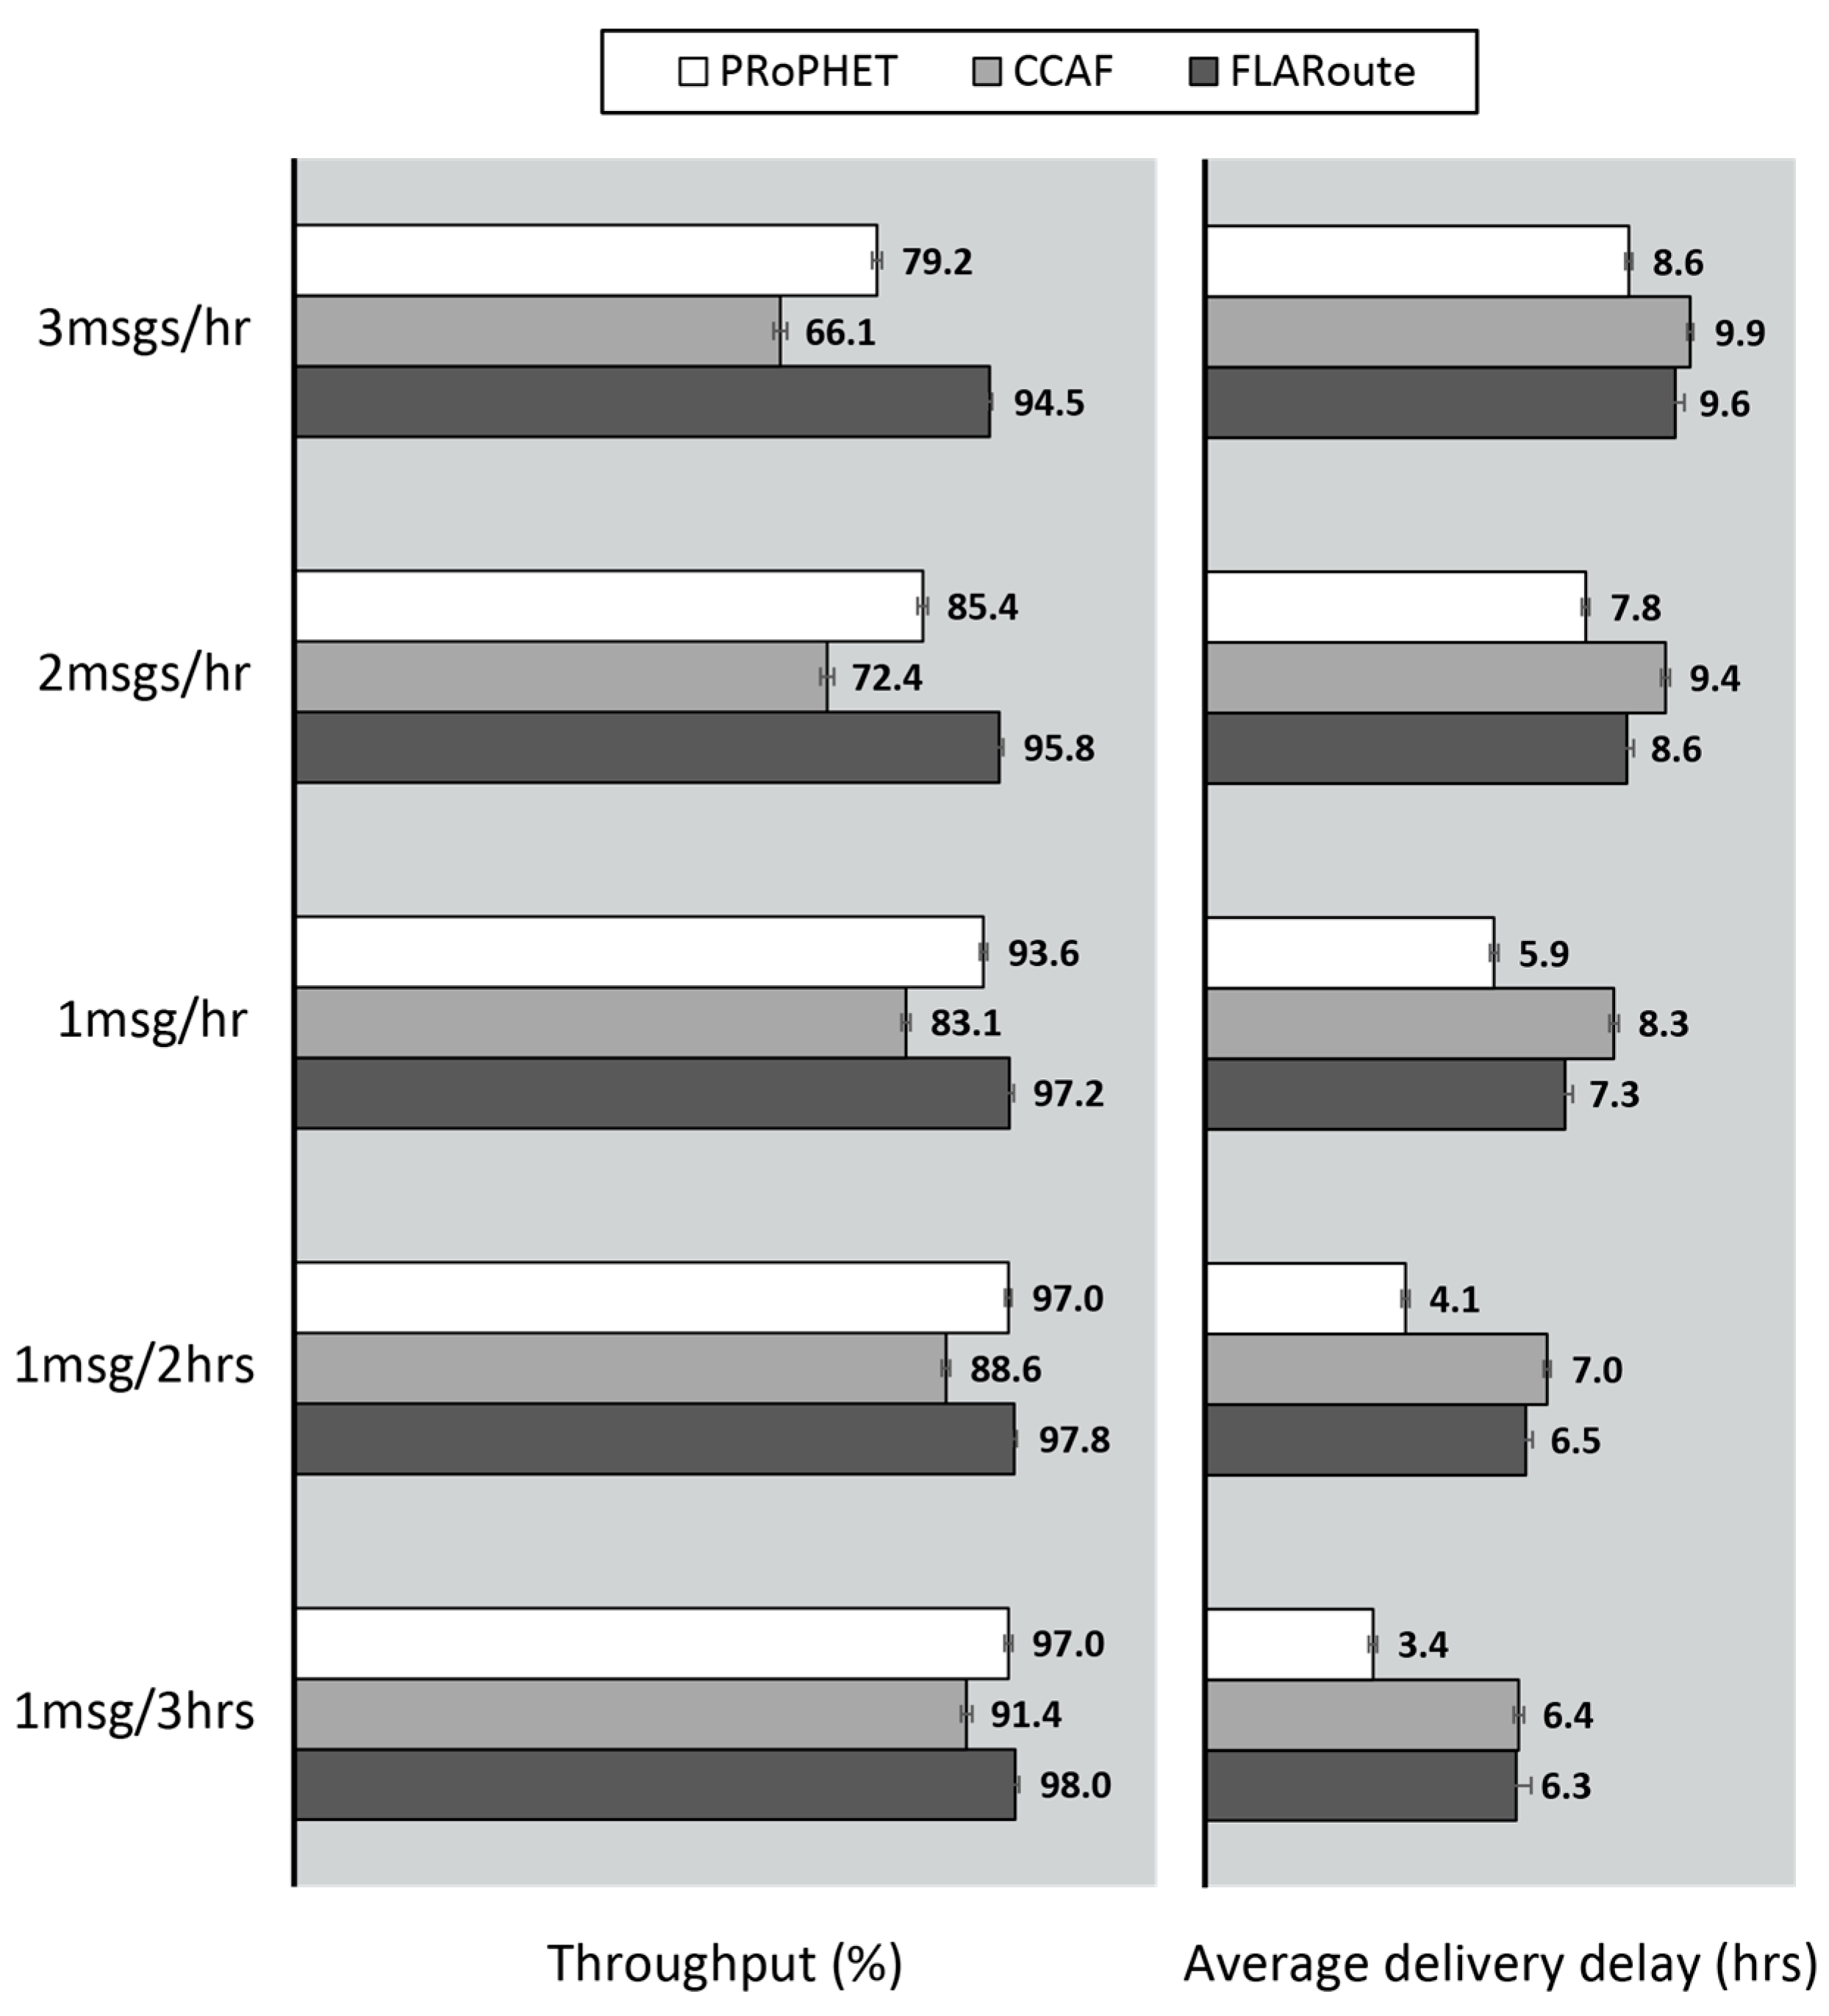
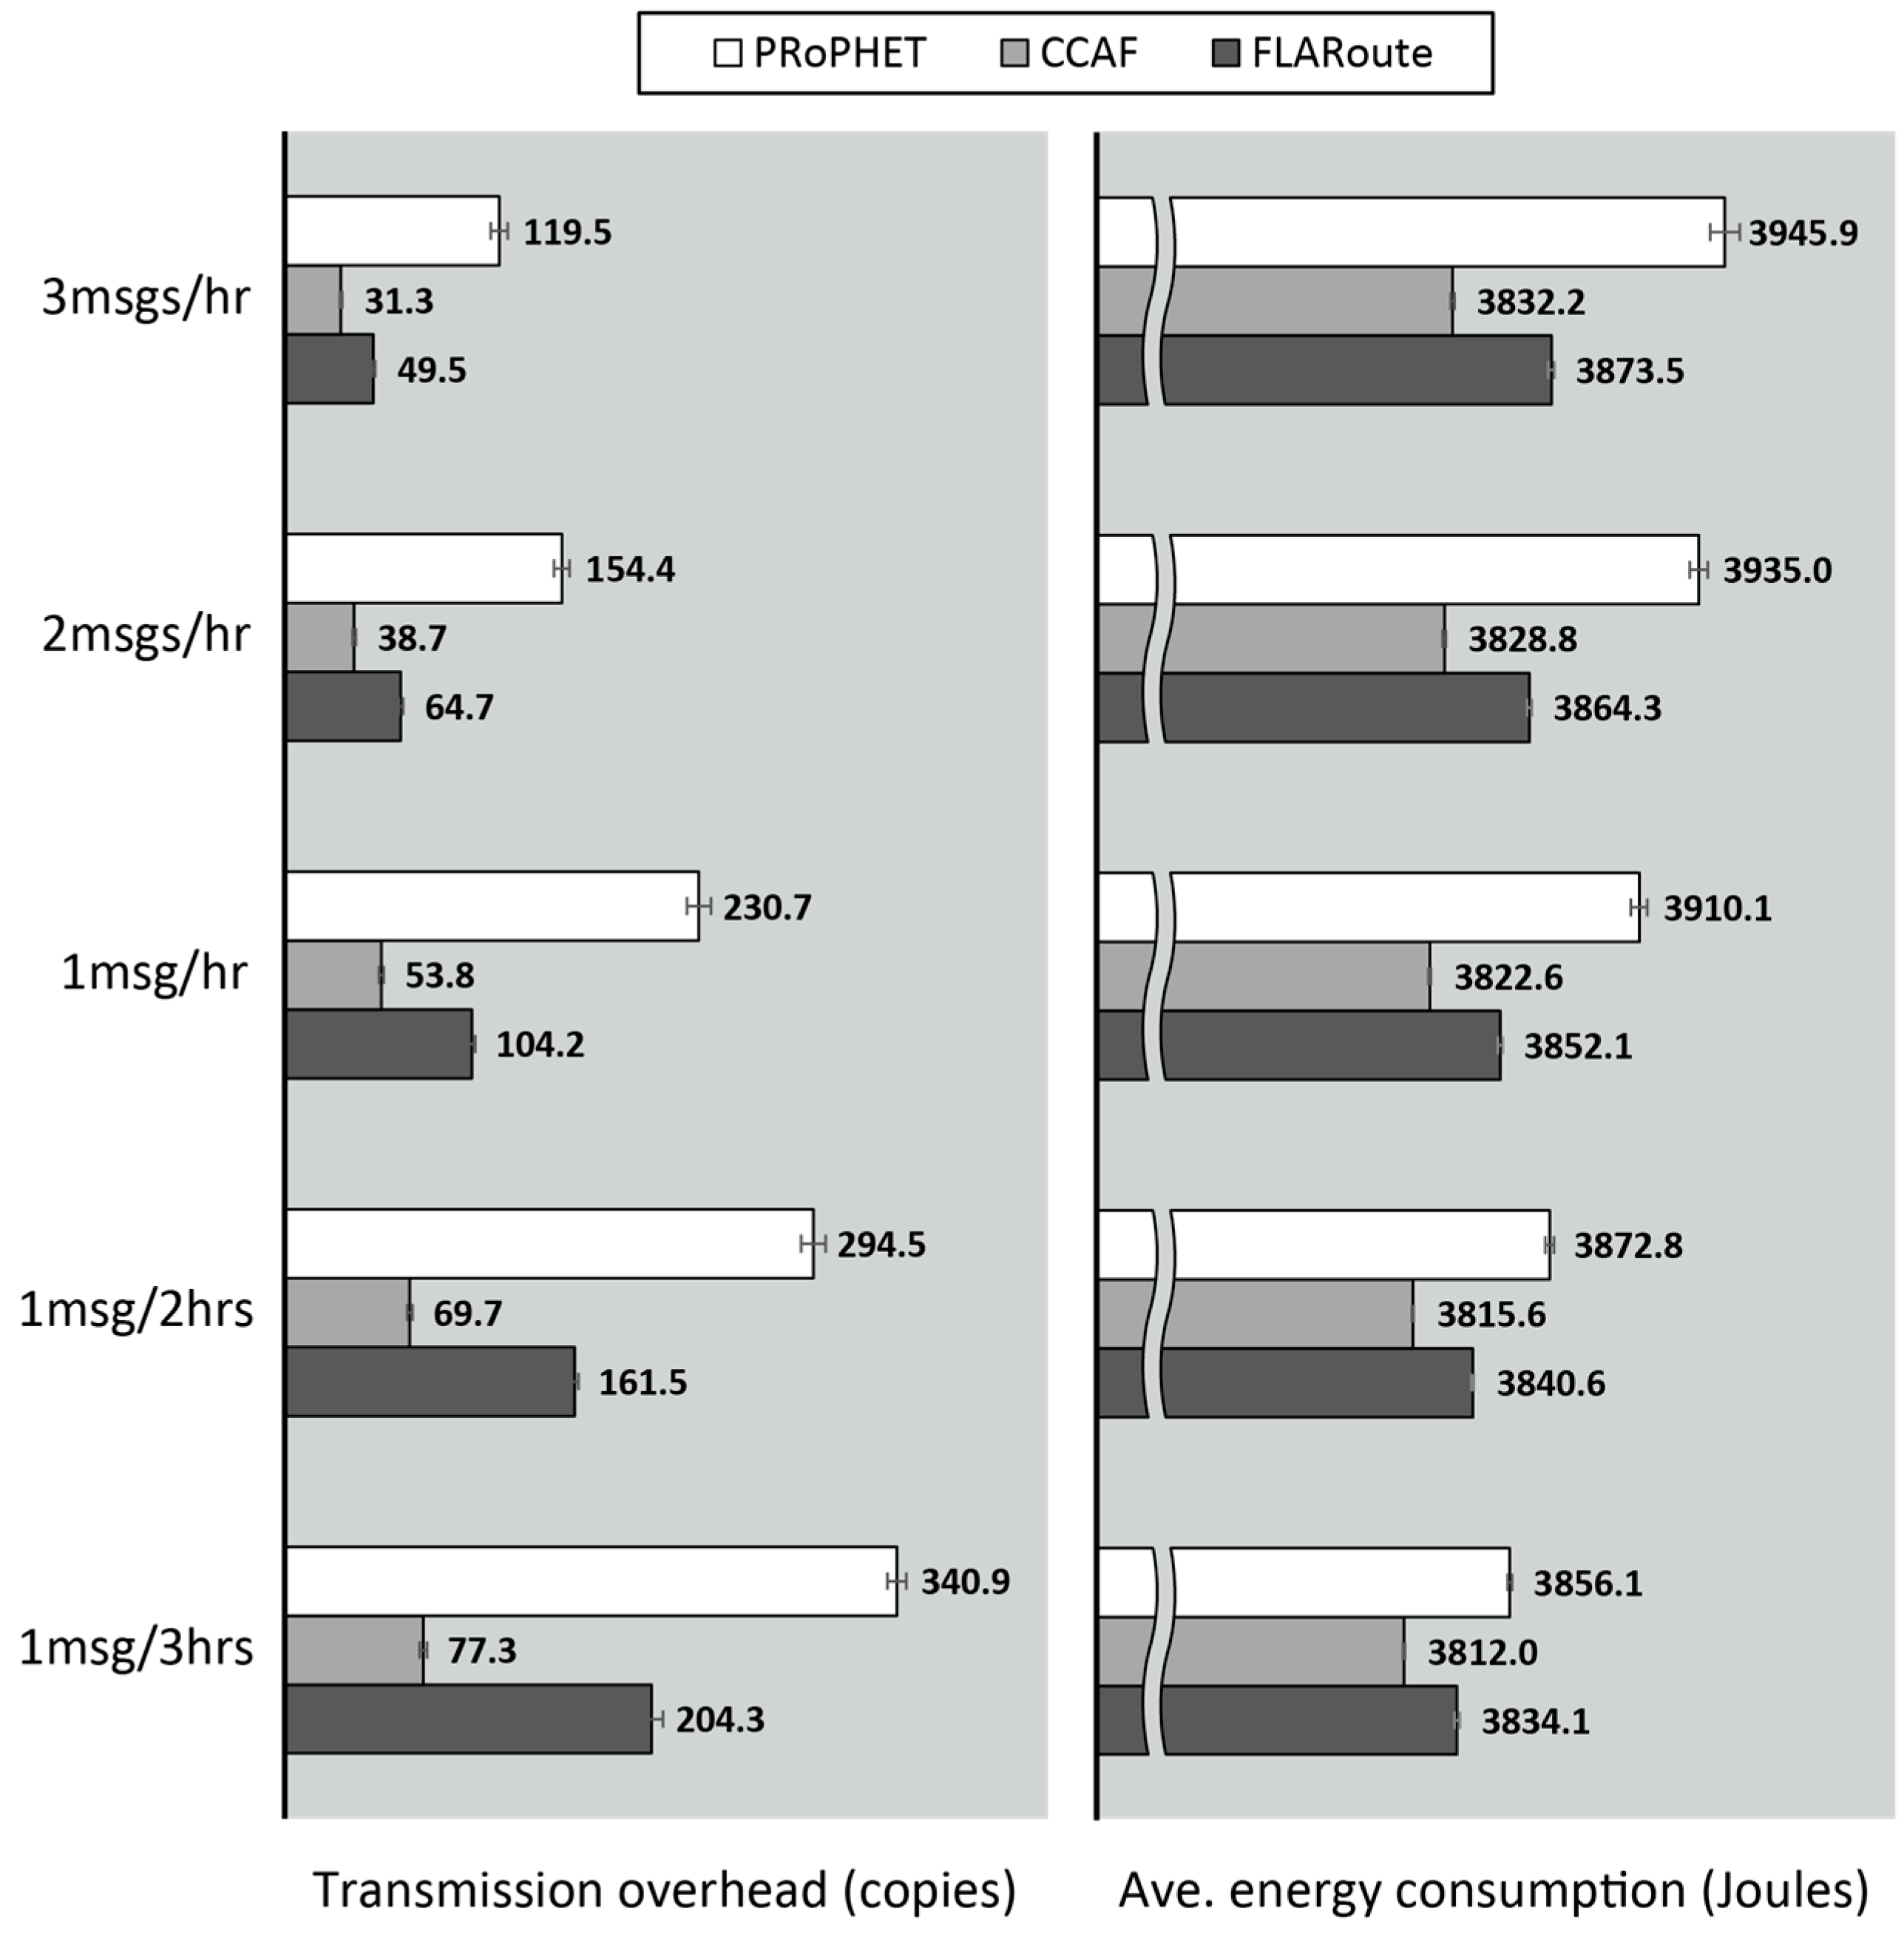
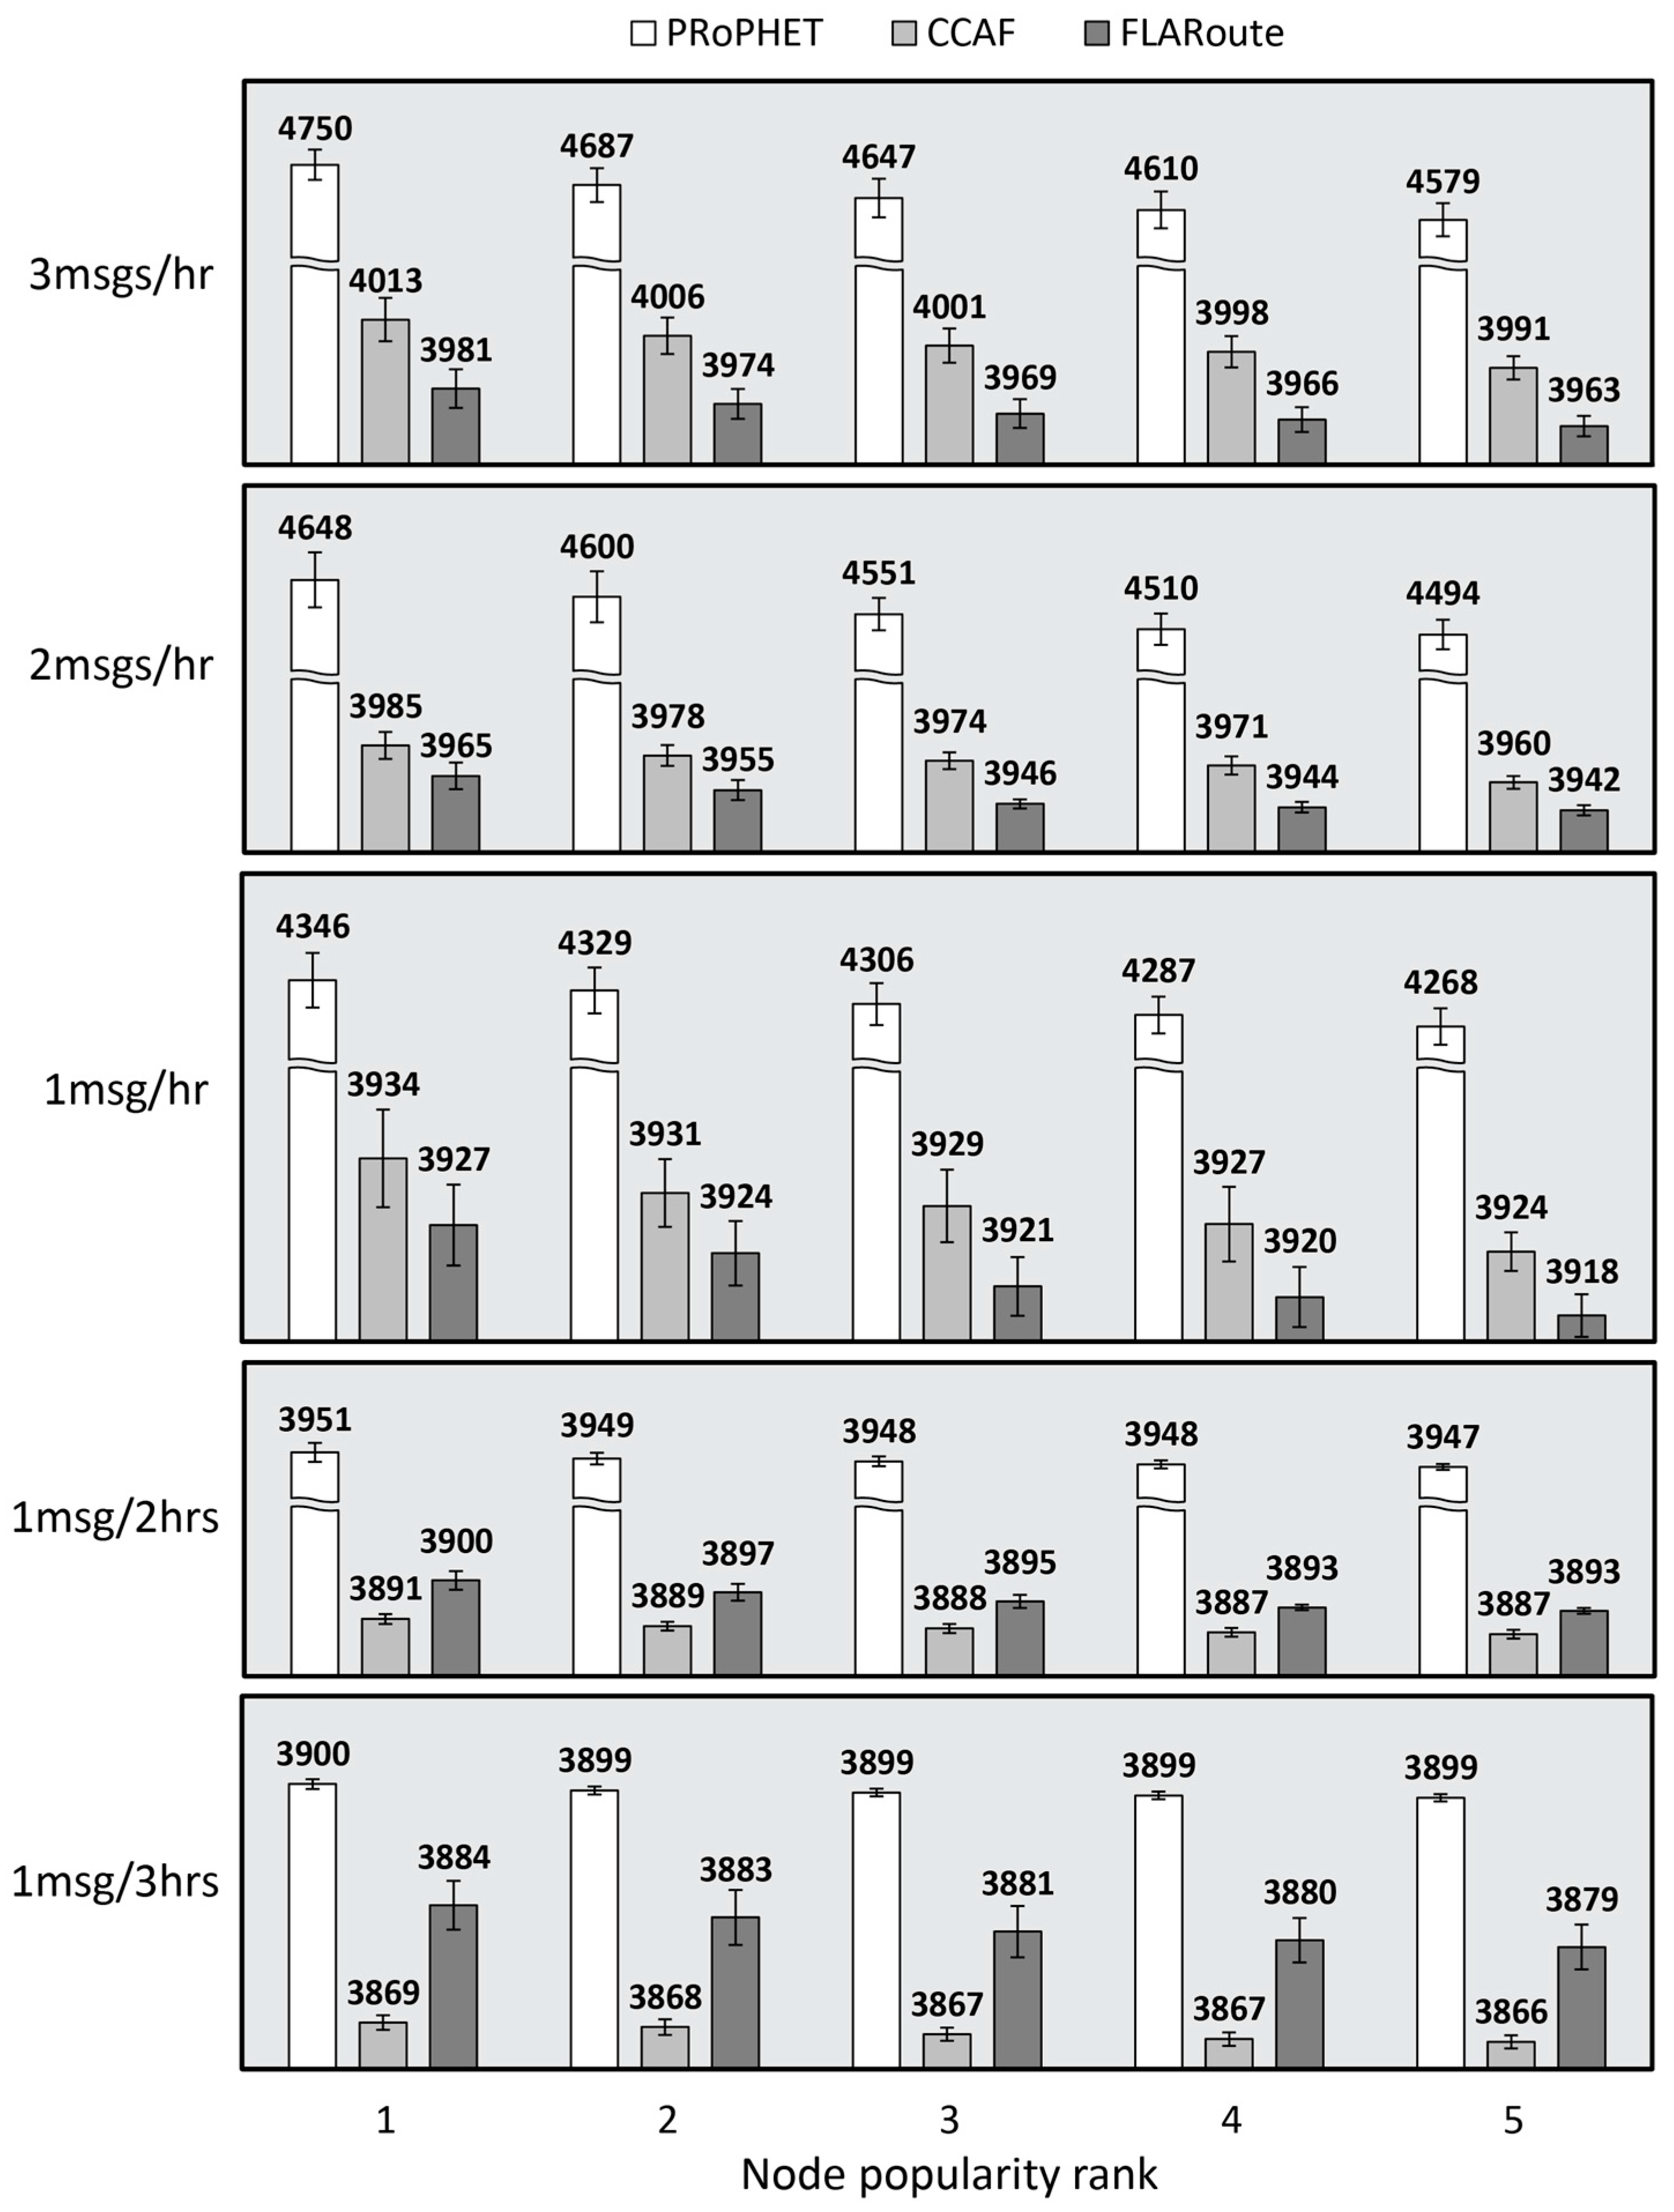
4.2.1. Performance Evaluation in the Skudai Scenario
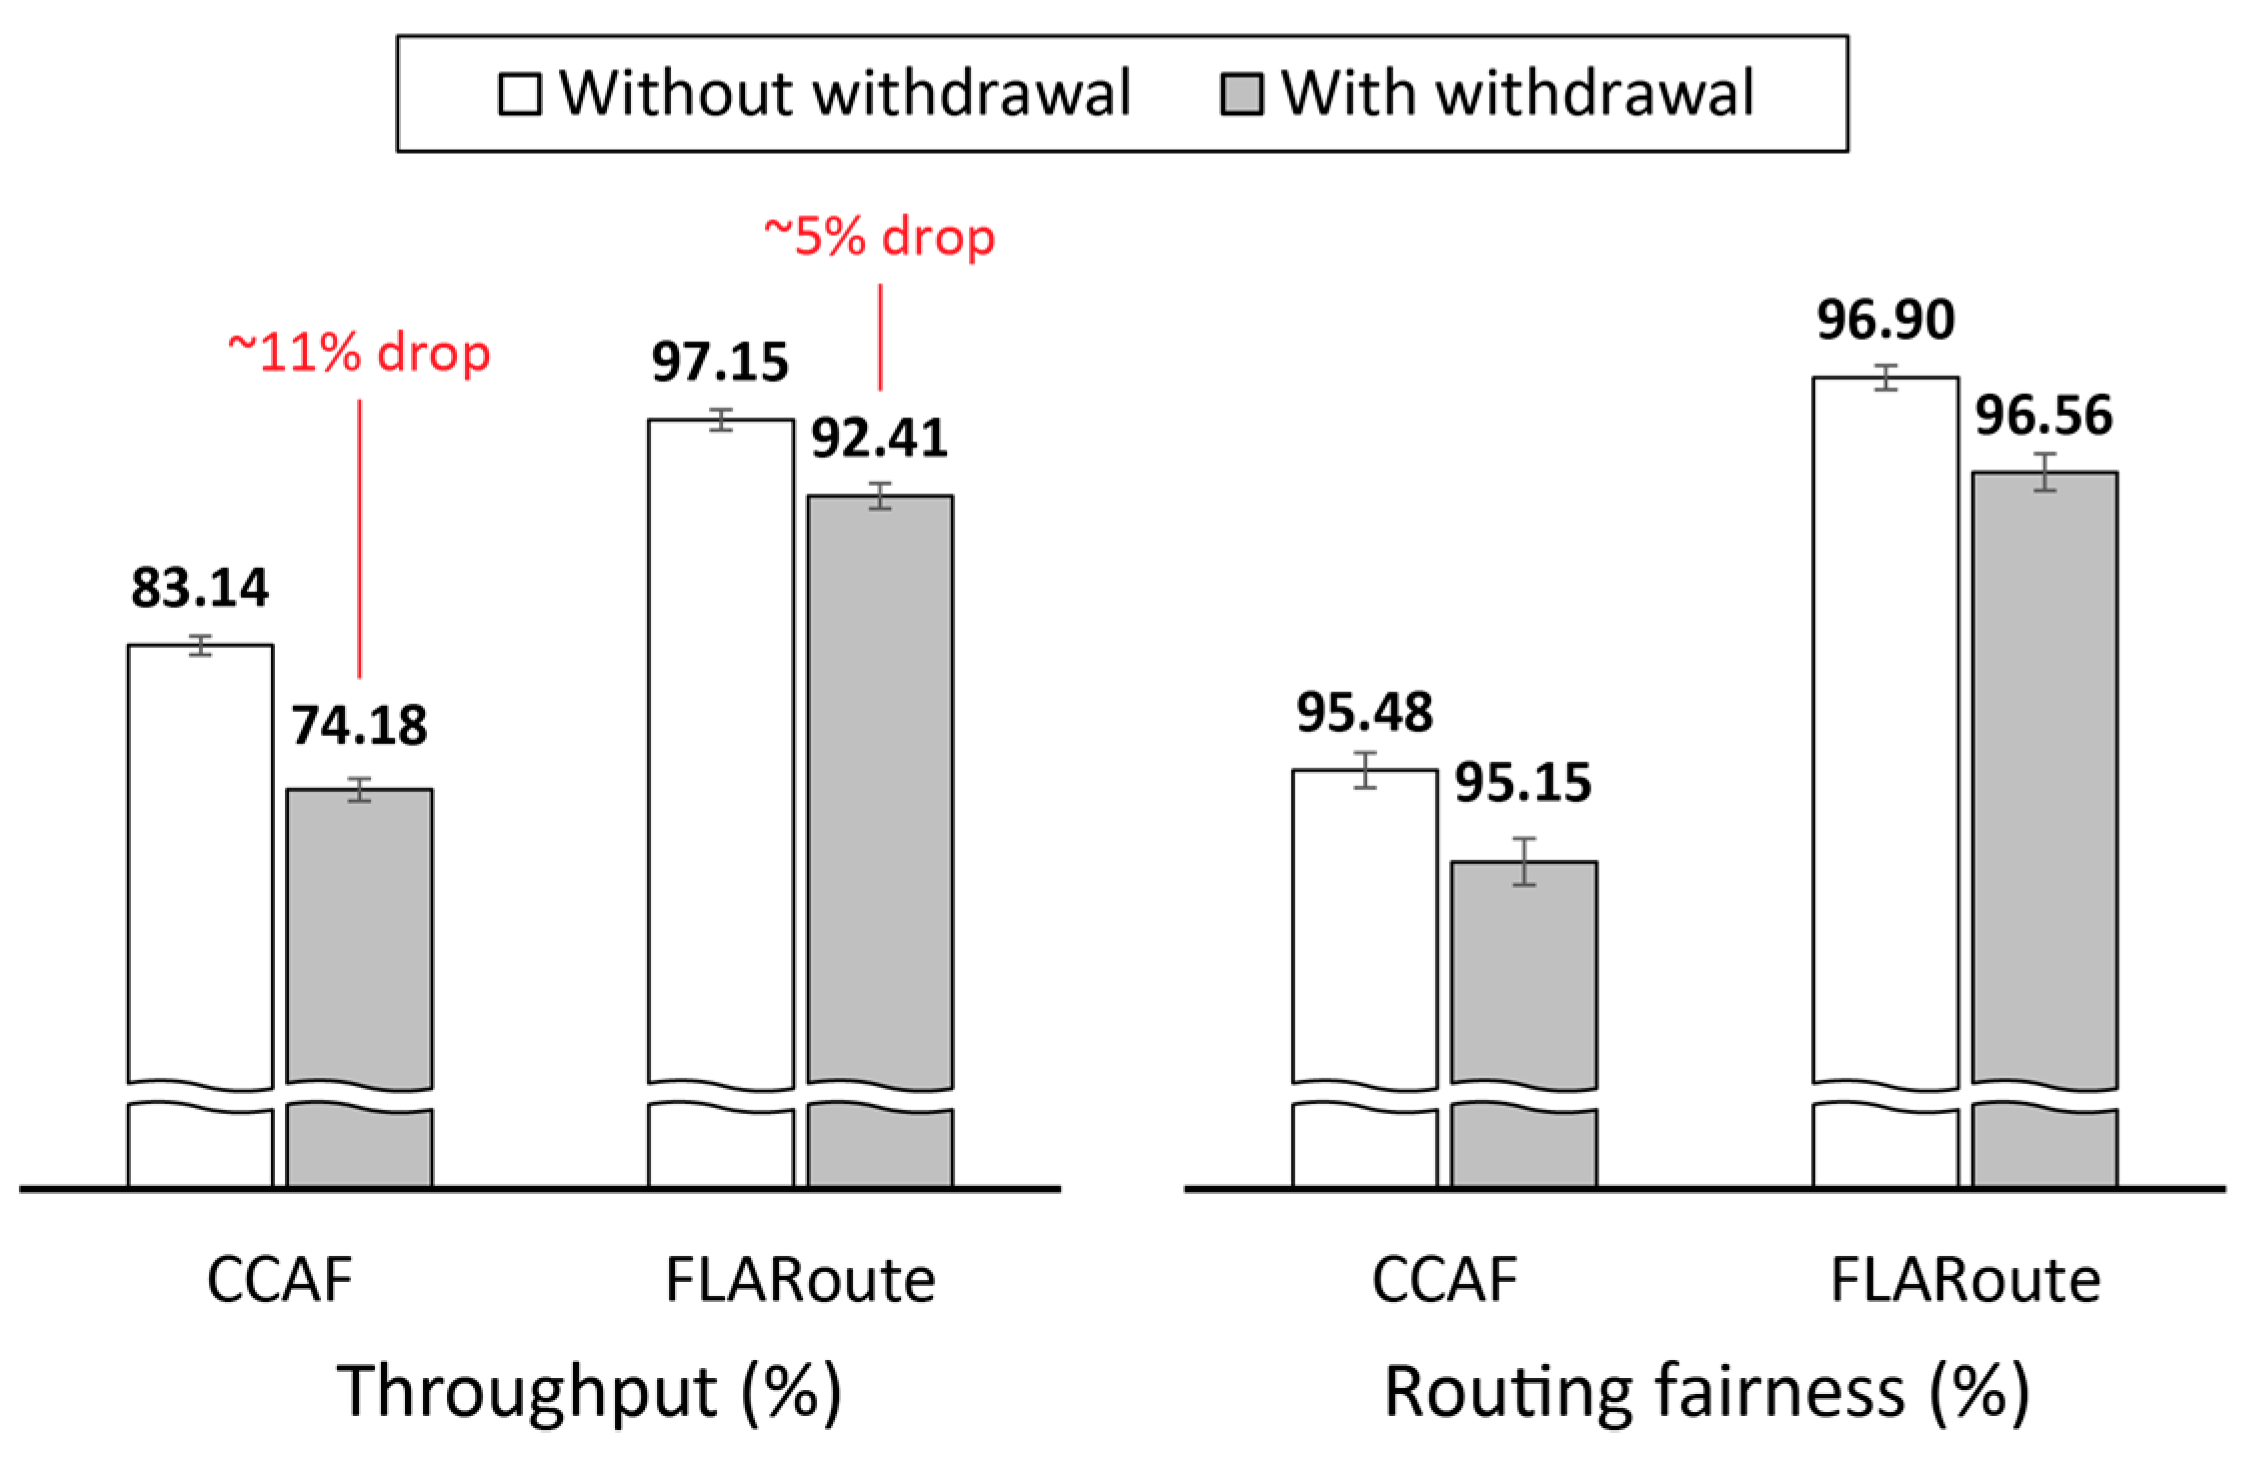
4.2.2. Performance Evaluation in the Helsinki Scenario
4.2.3. Impact of FLARoute and Choice of Parameters
4.3. Lessons Learned
“We observe that all of our fair strategies enjoy a better fairness index when compared with the original schemes, proving that the algorithm we proposed can indeed enhance the balance of success rate distribution.”
5. Conclusions and Future Work
Author Contributions
Conflicts of Interest
References
- Gomez, C.; Paradells, J. Urban Automation Networks: Current and emerging solutions for sensed data collection and actuation in smart cities. Sensors 2015, 15, 22874–22898. [Google Scholar] [CrossRef] [PubMed] [Green Version]
- Ochiai, H.; Ishizuka, H.; Kawakami, Y.; Esaki, H. Agent based sensor data gathering for agricultural applications. IEEE Sens. J. 2011, 11, 2861–2868. [Google Scholar] [CrossRef]
- Tovar, A.; Friesen, T.; Ferens, K.; McLeod, B. A DTN wireless sensor network for wildlife habitat monitoring. In Proceedings of the 23rd Canadian Conference on Electrical and Computer Engineering, Calgary, AB, Canada, 2–5 May 2010; pp. 1–5. [Google Scholar]
- McDonald, P.; Geraghty, D.; Humphreys, I.; Farrell, S.; Cahill, V. Sensor Network with Delay Tolerance (SeNDT). In Proceedings of the 16th International Conference on Computer Communications and Networks, Honolulu, HI, USA, 13–16 August 2007; pp. 1333–1338. [Google Scholar]
- Velásquez-Villada, C.; Donoso, Y. Delay/Disruption tolerant network-based message forwarding for a river pollution monitoring wireless sensor network application. Sensors 2016, 16, 436. [Google Scholar] [CrossRef] [PubMed]
- Cheng, N.; Lu, N.; Zhang, N.; Shen, X.; Mark, J. Vehicle-assisted data delivery for smart grid: An optimal stopping approach. In Proceedings of the IEEE International Conference on Communications, Budapest, Hungary, 9–13 June 2013; pp. 6184–6188. [Google Scholar]
- Du, W.; Li, Z.; Liando, J.C.; Li, M. From rateless to distanceless: Enabling sparse sensor network deployment in large areas. IEEE/ACM Trans. Netw. 2016, 24, 2498–2511. [Google Scholar] [CrossRef]
- Mao, X.; Miao, X.; He, Y.; Li, X.; Liu, Y. CitySee: Urban CO2 monitoring with sensors. In Proceedings of the 31st Annual IEEE International Conference on Computer Communications, Orlando, FL, USA, 25–30 March 2012; pp. 1611–1619. [Google Scholar]
- Clarke, R. Smart Cities and the Internet of Everything: The Foundation for Delivering Next-Generation Citizen Services. Available online: http://www.cisco.com/c/dam/en_us/solutions/industries/docs/scc/ioe_citizen_svcs_white_paper_idc_2013.pdf%20 (accessed on 7 November 2017).
- Park, U.; Heidemann, J. Data muling with mobile phones for sensornets. In Proceedings of the 9th ACM Conference on Embedded Networked Sensor Systems, Seattle, WA, USA, 1–4 November 2011; pp. 162–175. [Google Scholar]
- Can, Z.; Demirbas, M. Smartphone-based data collection from wireless sensor networks in an urban environment. J. Netw. Comput. Appl. 2015, 58, 208–216. [Google Scholar] [CrossRef]
- Shi, F.; Adeel, U.; Theodoridis, E.; Haghighi, M.; McCann, J. OppNet: Enabling citizen centric urban IoT data collection through opportunistic connectivity service. In Proceedings of the IEEE 3rd World Forum on Internet of Things, Reston, VA, USA, 12–14 December 2016; pp. 723–728. [Google Scholar]
- Dimatteo, S.; Hui, P.; Han, B.; Li, V. Cellular Traffic Offloading through Wi-Fi Networks. In Proceedings of the IEEE 8th International Conference on Mobile Ad-Hoc and Sensor Systems, Valencia, Spain, 17–22 October 2011; pp. 192–201. [Google Scholar]
- Petz, A.; Lindgren, A.; Hui, P.; Julien, C. Madserver: A server architecture for mobile advanced delivery. In Proceedings of the 7th ACM International Workshop on Challenged Networks, Istanbul, Turkey, 22–26 August 2012; pp. 17–22. [Google Scholar]
- Rebecchi, F.; Dias de Amorim, M.; Conan, V.; Passarella, A.; Bruno, R.; Conti, M. Data offloading techniques in cellular networks: A Survey. IEEE Commun. Surv. Tutor. 2015, 17, 580–603. [Google Scholar] [CrossRef]
- Wu, X.; Brown, K.; Sreenan, C. Analysis of smartphone user mobility traces for opportunistic data collection in wireless sensor networks. Pervasive Mob. Comput. 2013, 9, 881–891. [Google Scholar] [CrossRef]
- Aguilar, S.; Vidal, R.; Gomez, C. Opportunistic sensor data collection with bluetooth low energy. Sensors 2017, 17, 159. [Google Scholar] [CrossRef] [PubMed]
- Wu, X.; Brown, K.; Sreenan, C. Exploiting rush hours for energy-efficient contact probing in opportunistic data collection. In Proceedings of the 31st International Conference on Distributed Computing Systems Workshops, Minneapolis, MN, USA, 20–24 June 2011; pp. 240–247. [Google Scholar]
- Mtibaa, A.; Harras, K. Fairness-related challenges in mobile opportunistic networking. Comput. Netw. 2013, 57, 228–242. [Google Scholar] [CrossRef]
- Orlinski, M.; Filer, N. Quality distributed community formation for data delivery in pocket switched networks. In Proceedings of the Fourth Annual Workshop on Simplifying Complex Networks for Practitioners, Lyon, France, 17 April 2012; pp. 31–36. [Google Scholar]
- Tsvetovat, M.; Kouznetsov, A. Centrality, Power, and Bottlenecks. In Social Network Analysis for Startups: Finding Connections on the Social Web; O’Reilly Media, Inc.: Sebastopol, CA, USA, 2011. [Google Scholar]
- Muchnik, L.; Pei, S.; Parra, L.; Reis, S.; Andrade, J.; Havlin, S.; Makse, H. Origins of power-law degree distribution in the heterogeneity of human activity in social networks. Sci. Rep. 2013, 3, 1783. [Google Scholar] [CrossRef] [PubMed]
- Pujol, J.; Toledo, A.; Rodriguez, P. Fair Routing in Delay Tolerant Networks. In Proceedings of the 28th IEEE Conference on Computer Communications, Rio de Janeiro, Brazil, 19–25 April 2009; pp. 837–845. [Google Scholar]
- Amah, T.; Kamat, M.; Bakar, K.; Moreira, W.; Oliveira, A.; Batista, M. Spatial locality in pocket switched networks. In Proceedings of the 17th IEEE International Symposium on a World of Wireless, Mobile and Multimedia Networks, Coimbra, Portugal, 21–24 June 2016; pp. 1–6. [Google Scholar]
- Silva, A.; Burleigh, S.; Hirata, C.; Obraczka, K. A survey on congestion control for delay and disruption tolerant networks. Ad Hoc Netw. 2015, 25, 480–494. [Google Scholar] [CrossRef]
- Jiang, Q.; Men, C.; Tian, Z. A Credit-Based Congestion-Aware Incentive Scheme for DTNs. Information 2016, 7, 71. [Google Scholar] [CrossRef]
- Seregina, T.; Brun, O.; El-Azouzi, R.; Prabhu, B. On the design of a reward-based incentive mechanism for delay tolerant networks. IEEE Trans. Mob. Comput. 2017, 16, 453–465. [Google Scholar] [CrossRef]
- Khalid, K.; Woungang, I.; Dhurandher, S.; Barolli, L.; Carvalho, G.; Takizawa, M. An energy-efficient routing protocol for infrastructure-less opportunistic networks. In Proceedings of the 10th International Conference on Innovative Mobile and Internet Services in Ubiquitous Computing, Fukuoka, Japan, 6–8 July 2016. [Google Scholar]
- Bista, B.; Rawat, D. EA-PRoPHET: An energy aware prophet-based routing protocol for delay tolerant networks. In Proceedings of the IEEE 31st International Conference on Advanced Information Networking and Applications, Taipei, Taiwan, 27–29 March 2017. [Google Scholar]
- Moreira, W.; Mendes, P. Social-Aware opportunistic routing: The New Trend. In Routing in Opportunistic Networks; Woungang, I., Dhurandher, S., Anpalagan, A., Vasilakos, A., Eds.; Springer: New York, NY, USA, 2013; pp. 27–68. [Google Scholar]
- Vahdat, A.; Becker, D. Epidemic Routing for Partially Connected Ad Hoc Networks; Technical Report CS-200006; Duke University: Durham, NC, USA, 2000. [Google Scholar]
- Spyropoulos, T.; Psounis, K.; Raghavendra, C. Single-copy routing in intermittently connected mobile networks. Proceedings of 1st the Annual IEEE Communications Society Conference on Sensor and Ad Hoc Communications and Networks, Santa Clara, CA, USA, 4–7 October 2004; pp. 235–244. [Google Scholar]
- Jain, S.; Fall, K.; Patra, R. Routing in a delay tolerant network. In Proceedings of the Conference on Applications, Technologies, Architectures, and Protocols for Computer Communications, Portland, OR, USA, 30 August–3 September 2004; pp. 145–158. [Google Scholar]
- Spyropoulos, T.; Psounis, K.; Raghavendra, C. Spray and wait: An efficient routing scheme for intermittently connected mobile networks. In Proceedings of the ACM Special Interest Group on Data Communication Workshop on Delay-Tolerant Networking, Philadelphia, PA, USA, 22–26 August 2005; pp. 252–259. [Google Scholar]
- Balasubramanian, A.; Levine, B.; Venkataramani, A. DTN routing as a resource allocation problem. In Proceedings of the Conference on Applications, Technologies, Architectures, and Protocols for Computer Communications, Kyoto, Japan, 27–31 August 2007; pp. 373–384. [Google Scholar]
- Amah, T.; Kamat, M.; Moreira, W.; Abu Bakar, K.; Mandala, S.; Batista, M. Towards next-generation routing protocols for pocket switched networks. J. Netw. Comput. Appl. 2016, 70, 51–88. [Google Scholar] [CrossRef]
- Grasic, S.; Davies, E.; Lindgren, A.; Doria, A. The evolution of a DTN routing protocol—PRoPHETv2. In Proceedings of the 6th ACM Workshop on Challenged Networks, Las Vegas, NV, USA, 23 September 2011; pp. 27–30. [Google Scholar]
- Wang, X.; He, R.; Lin, B.; Wang, Y. Probabilistic routing based on two-hop information in delay/disruption tolerant networks. J. Electr. Comput. Eng. 2015, 2015, 918065. [Google Scholar] [CrossRef]
- Sadat, N.; Tasnim, M. A neighborhood contact history based spraying heuristic for delay tolerant networks. In Proceedings of the 3rd International Conference on Informatics, Electronics & Vision, Dhaka, Bangladesh, 23–24 May 2014; pp. 1–5. [Google Scholar]
- Rolla, V.; Curado, M. Time message system for delay tolerant networks. In Proceedings of the 2nd Baltic Congress on Future Internet Communications, Vilnius, Lithuania, 25–27 April 2012; pp. 239–245. [Google Scholar]
- Liu, C.; Wu, J. An optimal probabilistic forwarding protocol in delay tolerant networks. In Proceedings of the 10th ACM international Symposium on Mobile Ad Hoc Networking and Computing, New Orleans, LA, USA, 18–21 May 2009; pp. 105–114. [Google Scholar]
- Leguay, J.; Friedman, T.; Conan, V. Evaluating mobility pattern space routing for DTNS. In Proceedings of the 25th IEEE International Conference on Computer Communications, Barcelona, Spain, 23–29 April 2006; pp. 1–10. [Google Scholar]
- Mtibaa, A.; May, M.; Diot, C.; Ammar, M. Peoplerank: Social opportunistic forwarding. In Proceedings of the 2010 Proceedings IEEE, 29th IEEE International Conference on Computer Communications, San Diego, CA, USA, 14–19 March 2010; pp. 1–5. [Google Scholar]
- Moreira, W.; Mendes, P.; Sargento, S. Opportunistic routing based on daily routines. In Proceedings of the 13th IEEE International Symposium on a World of Wireless, Mobile and Multimedia Networks, San Francisco, CA, USA, 25–28 June 2012; pp. 1–6. [Google Scholar]
- Hui, P.; Crowcroft, J.; Yoneki, E. Bubble rap: Social-based forwarding in delay-tolerant networks. IEEE Trans. Mob. Comput. 2011, 10, 1576–1589. [Google Scholar] [CrossRef]
- Nguyen, H.; Giordano, S. Context information prediction for social-based routing in opportunistic networks. Ad Hoc Netw. 2012, 10, 1557–1569. [Google Scholar] [CrossRef]
- Spyropoulos, T.; Psounis, K.; Raghavendra, C. Spray and focus: Efficient mobility-assisted routing for heterogeneous and correlated mobility. In Proceedings of the 5th Annual IEEE International Conference on Pervasive Computing and Communications Workshops, White Plains, NY, USA, 19–23 March 2007; pp. 79–85. [Google Scholar]
- Sun, G.; Xiao, F.; Jiang, L.; Xu, J.; Wang, R. A Sociability-Based spray and forward scheme for opportunistic network. Int. J. Distrib. Sens. Netw. 2013, 2013, 987961. [Google Scholar] [CrossRef]
- Deok, S.; Won, Y. An improved PRoPHET routing protocol in delay tolerant network. Sci. World J. 2015, 2015, 623090. [Google Scholar] [CrossRef]
- Sanjay, K.; Kumar, D.; Woungang, I.; Saini, A. Efficient routing based on past information to predict the future location for message passing in infrastructure-less opportunistic networks. J. Supercomput. 2014, 71, 1694–1711. [Google Scholar]
- Socievole, A.; Yoneki, E.; De Rango, F.; Crowcroft, J. ML-SOR: Message routing using multi-layer social networks in opportunistic communications. Comput. Netw. 2015, 81, 201–219. [Google Scholar] [CrossRef]
- Wang, S.; Liu, M.; Cheng, X.; Li, Z.; Huang, J.; Chen, B. HERO—A home based routing in pocket switched networks. In Proceedings of the International Conference on Wireless Algorithms, Systems, and Applications, Huangshan, China, 8–10 August 2012; pp. 20–30. [Google Scholar]
- Keränen, A.; Ott, J.; Kärkkäinen, T. The ONE simulator for DTN protocol evaluation. In Proceedings of the 2nd International Conference on Simulation Tools and Techniques, Rome, Italy, 2–6 March 2009; p. 55. [Google Scholar]
- Ekman, F.; Keränen, A.; Karvo, J.; Ott, J. Working Day Movement Model. In Proceedings of the 1st ACM SIGMOBILE Workshop on Mobility Models, Hong Kong, China, 29–30 May 2008; pp. 33–40. [Google Scholar]
- Wu, X.; Brown, K.; Sreenan, C. Data pre-forwarding for opportunistic data collection in wireless sensor networks. ACM Trans. Sens. Netw. 2014, 11. [Google Scholar] [CrossRef]
- Silva, D.; Costa, A.; Macedo, J. Energy impact analysis on DTN routing protocols. In Proceedings of the 4th Extreme Conference on Communication, Zürich, Switzerland, 10–14 March 2012. [Google Scholar]
- Moreira, W.; Mendes, P.; Sargento, S. Social-Aware opportunistic routing protocol based on user’s interactions and interests. In Ad Hoc Networks, Proceedings of the 5th International ICST Conference, Barcelona, Spain, 16–18 October 2013; Sherif, M., Mel-louk, A., Li, J., Bellavista, P., Eds.; Springer: Cham, Switzerland, 2014; pp. 100–115. [Google Scholar]
- Wang, S.; Liu, M.; Cheng, X.; Li, Z.; Huang, J.; Chen, B. Opportunistic routing in intermittently connected mobile P2P networks. IEEE J. Sel. Areas Commun. Suppl. 2013, 31, 369–378. [Google Scholar] [CrossRef]
- Yu, C.; Bao, C.; Jin, H. Hierarchical geographical tags based routing scheme in delay/disruption tolerant mobile ad hoc networks. In Proceedings of the 1st International Conference on Human Centered Computing, Phnom Penh, Cambodia, 27–29 November 2014; pp. 352–364. [Google Scholar]
- Grundy, A.; Radenkovic, M. Promoting congestion control in opportunistic networks. In Proceedings of the 6th IEEE International Conference on Wireless and Mobile Computing, Networking and Communications, Niagara Falls, NU, Canada, 11–13 October 2010; pp. 324–330. [Google Scholar]
- Akestoridis, D.; Papanikos, N.; Papapetrou, E. Exploiting social preferences for congestion control in opportunistic networks. In Proceedings of the 10th IEEE International Conference on Wireless and Mobile Computing, Networking and Communications, Larnaca, Cyprus, 8–10 October 2014; pp. 413–418. [Google Scholar]
- Jahromi, K.; Zignani, M.; Gaito, S.; Rossi, G. Simulating human mobility patterns in urban areas. Simul. Modelling Pract. Theory 2016, 62, 137–156. [Google Scholar] [CrossRef]
- Wang, S.; Liu, M.; Cheng, X.; Song, M. Routing in pocket switched networks. IEEE Wirel. Commun. 2012, 19, 67–73. [Google Scholar] [CrossRef]
- González, M.; Hidalgo, C.; Barabási, A. Understanding individual human mobility patterns. Nature 2008, 453, 779–782. [Google Scholar] [CrossRef] [PubMed]
- Zhao, M.; Mason, L.; Wang, W. Empirical study on human mobility for mobile wireless networks. In Proceedings of the IEEE Military Communications Conference, San Diego, CA, USA, 16–19 November 2008; pp. 1–7. [Google Scholar]
- Cho, E.; Myers, S.; Leskovec, J. Friendship and mobility: user movement in location based social networks. In Proceedings of the 17th ACM SIGKDD International Conference on Knowledge Discovery and Data Mining, San Diego, CA, USA, 21–24 August 2011; pp. 1082–1090. [Google Scholar]
- Herder, E.; Siehndel, P. Daily and weekly patterns in human mobility. In Proceedings of the 2nd International Workshop on Augmented User Modeling, Montreal, QC, Canada, 16–20 July 2012; pp. 1–11. [Google Scholar]
- Mtibaa, A.; Harras, K. CAF: Community aware framework for large scale mobile opportunistic networks. Comput. Commun. 2013, 36, 180–190. [Google Scholar] [CrossRef]
- Ciobanu, R.; Marin, R.; Dobre, C.; Cristea, V.; Mavromoustakis, C.; Mastorakis, G. Opportunistic dissemination using context-based data aggregation over Interest Spaces. In Proceedings of the 2015 IEEE International Conference on Communications, London, UK, 8–12 June 2015; pp. 1219–1225. [Google Scholar]
- Amah, T.; Kamat, M.; Abu Bakar, K.; Moreira, W.; Oliveira, A.; Batista, M. Measuring burden and routing fairness in pocket switched networks. In Proceedings of the 35th Brazilian Symposium on Computer Networks and Distributed Systems, Belém, Brazil, 15–19 May 2017; pp. 250–264. [Google Scholar]
- Hasan, S.; Schneider, C.; Ukkusuri, S.; González, M. spatiotemporal patterns of urban human mobility. J. Stat. Phys. 2013, 151, 304–318. [Google Scholar] [CrossRef]
- Amah, T.; Kamat, M.; Abu Bakar, K.; Abd Rahman, S.; Mohammed, M.; Abali, A.; Moreira, W.; Oliveira, A. Collecting sensed data with opportunistic networks: The case of contact information overhead. Information 2017, 8, 108. [Google Scholar] [CrossRef]
- Ren, Z.; Liu, W.; Zhou, X.; Fang, J.; Chen, Q. Summary-Vector-Based effective and fast immunization for epidemic-based routing in opportunistic networks. IEEE Commun. Lett. 2014, 18, 1183–1186. [Google Scholar] [CrossRef]
- Santi, P. Next generation wireless networks. In Mobility Models for Next Generation Wireless Networks: Ad Hoc, Vehicular and Mesh Networks, 1st ed.; Hutchison, D., Fdida, S., Sventek, J., Eds.; John Wiley & Sons, Ltd.: Chichester, UK, 2012; pp. 1–17. [Google Scholar]
- Aviv, A.; Sherr, M.; Blaze, M.; Smith, J. Evading cellular data monitoring with human movement networks. In Proceedings of the 5th USENIX Conference on Hot Topics in Security, Washington, DC, USA, 10 August 2010; pp. 1–6. [Google Scholar]
- Fan, X.; Li, V.; Xu, K. Fairness analysis of routing in opportunistic mobile networks. IEEE Trans. Veh. Technol. 2014, 63, 1282–1295. [Google Scholar] [CrossRef]
- Jain, R.; Chiu, D.; Hawe, W. A Quantitative Measure of Fairness and Discrimination for Resource Allocation in Shared Computer Systems; Technical report; Eastern Research Lab, Digital Equipment Corporation: Hudson, MA, USA, 1984. [Google Scholar]


| Parameter | Value(s) |
|---|---|
| Total simulation time (days) | 5 |
| Warm-up period (days) | 1 |
| Cool-down period (days) | 1 |
| Wireless communication interface | Bluetooth |
| Transmission range (m) | 10 |
| Transmission rate (MBps) | 2 |
| Buffer size (MB) | 10 |
| Message size (KB) | 10 to 15 |
| Message TTL (days) | 1 |
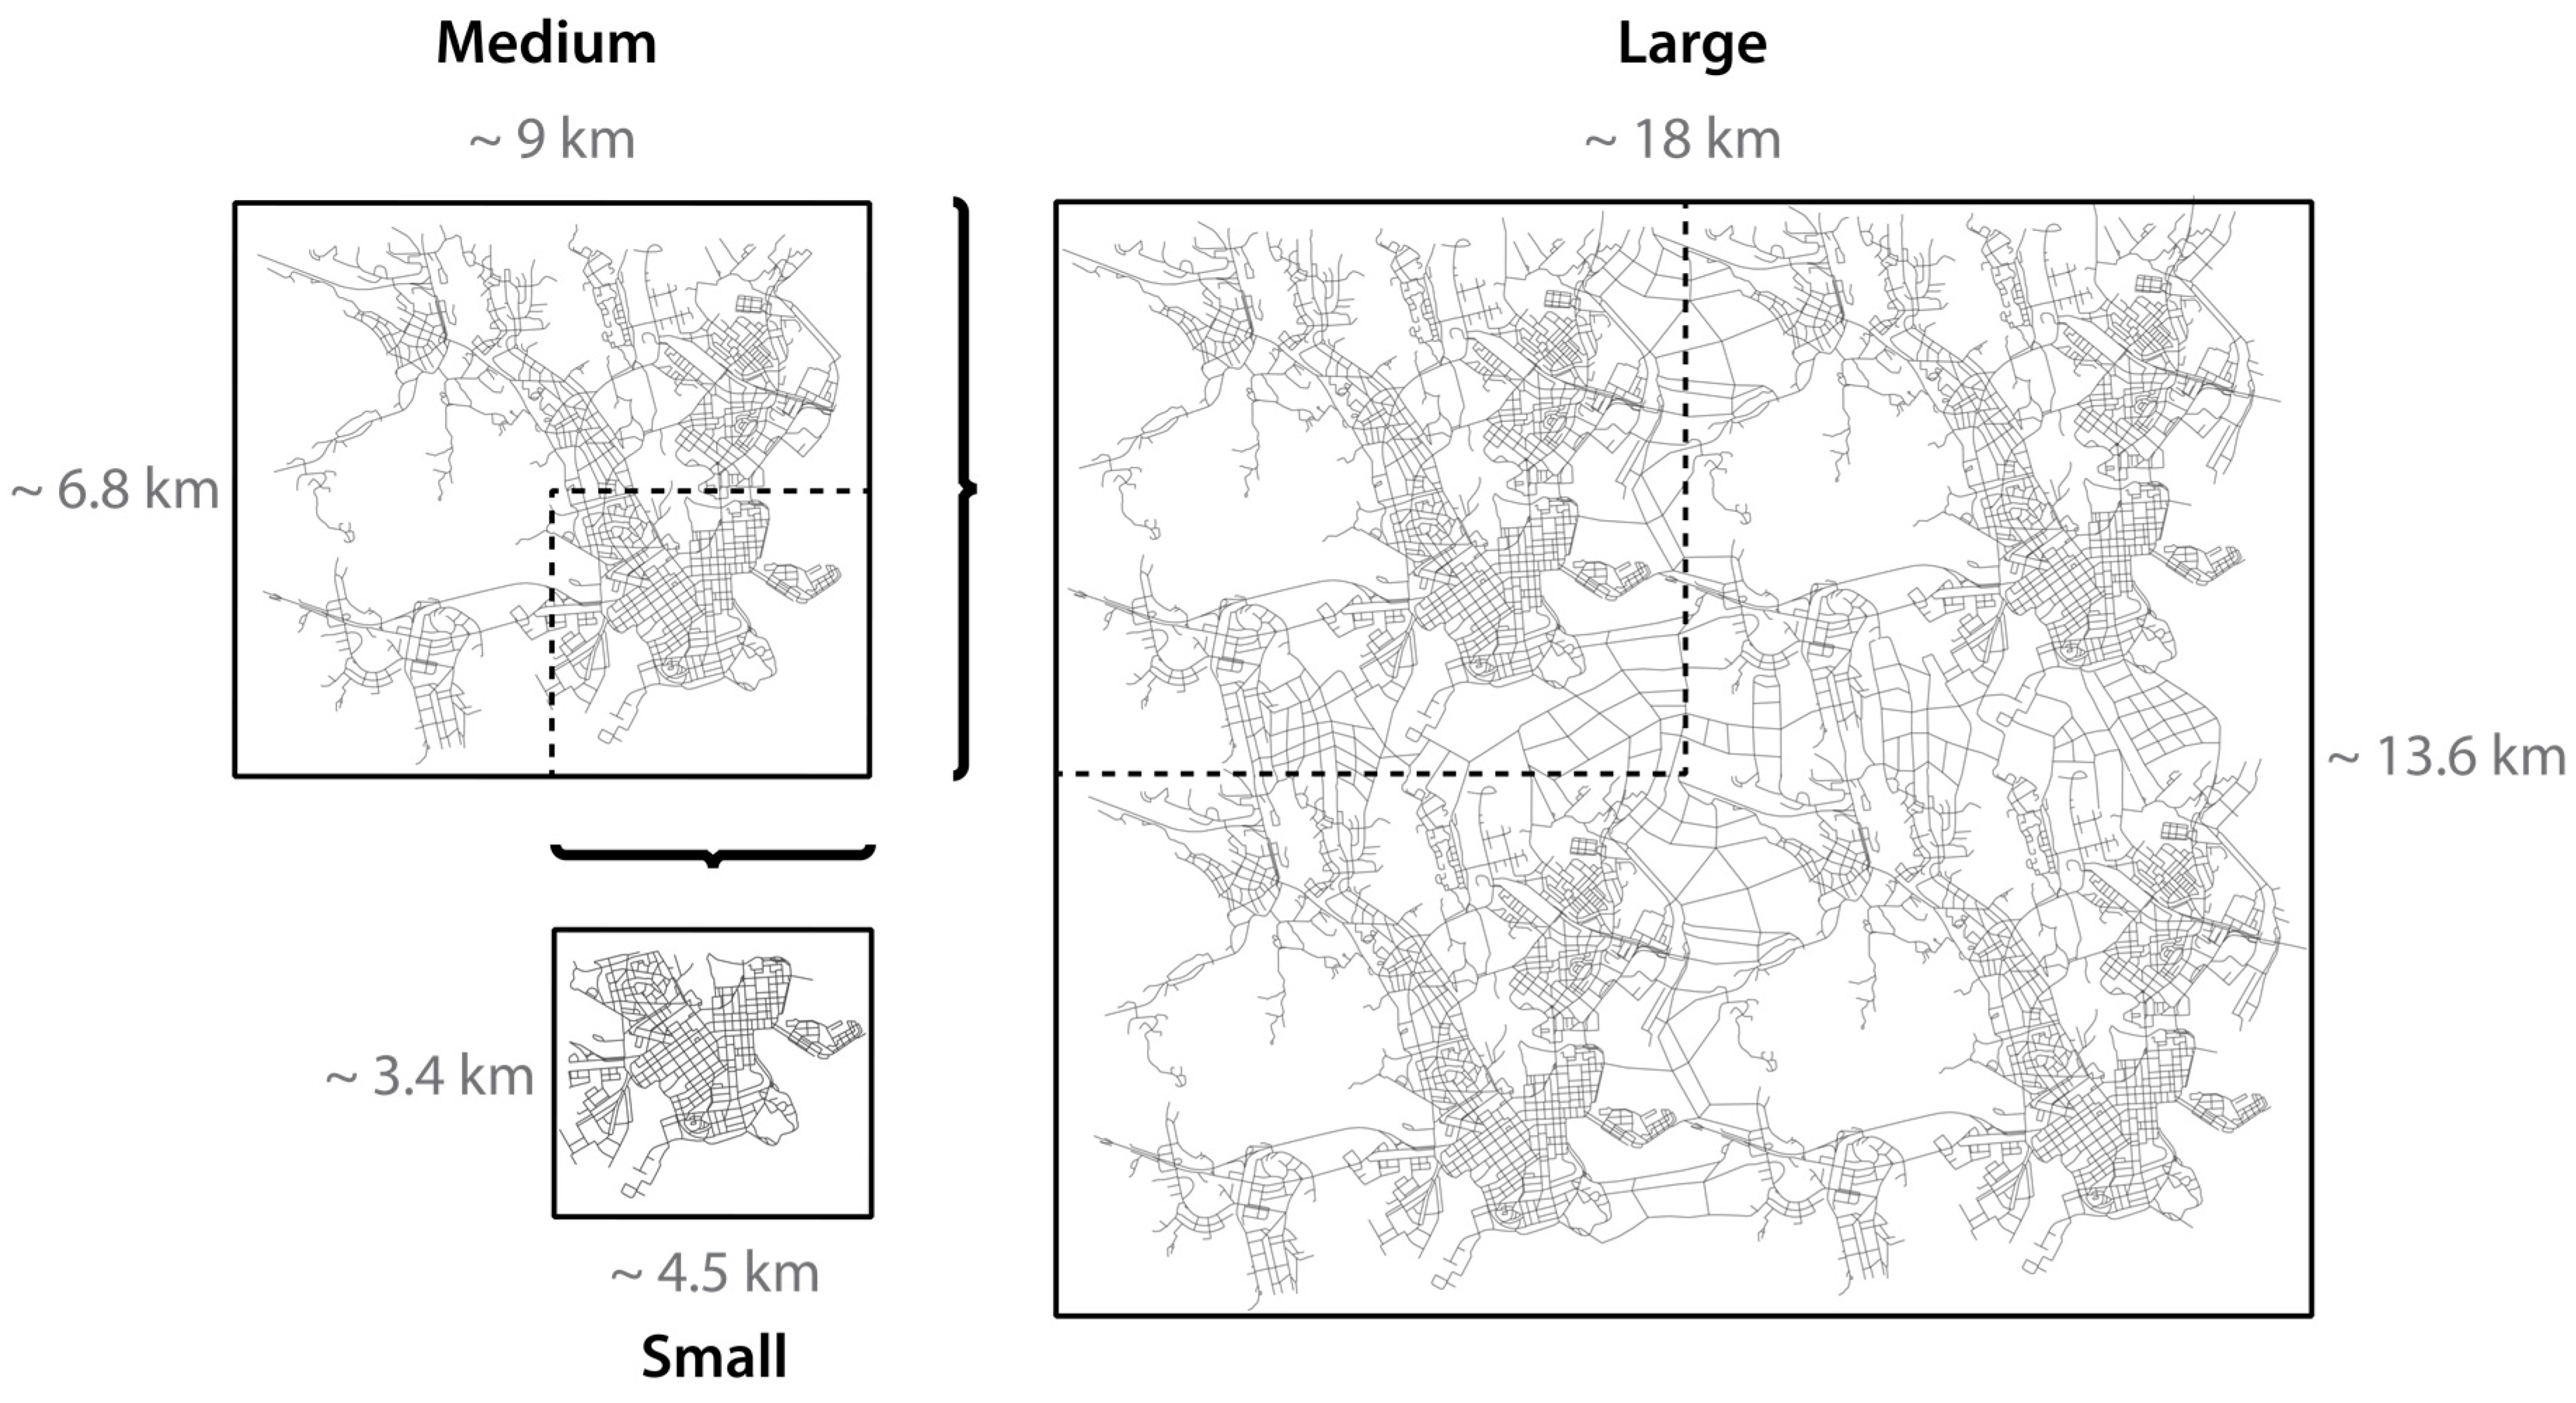
| Number of scenarios | 3 |
| Simulation area (km2) | 4.5 × 3.4, 9 × 6.8 and 18 × 13.6 |
| Number of nodes | 19, 76 and 304 |
| Ave. message generation rate/node | 1 message every 10 to 15 min |
| Battery capacity (Joules) | 4800 |
| Receive/transmit energy (mW/s) | 0.08 |
| Solution for Improving Fairness | Allows More Relay Nodes | Improves Delivery Guarantees through | Burden Measure Is Suitable under | |||
|---|---|---|---|---|---|---|
| Awareness of Spatial Locality | Maximizing Less Popular Node Contribution | Changes in Data Traffic | Unequal Buffer Capacities | Dynamic User Behaviour | ||
| FOG [19] | √ | × | × | × | × | × |
| FairRoute [23] | √ | × | × | × | × | × |
| CAFÉ [60] | √ | × | × | × | × | × |
| CCAF [61] | √ | × | × | × | × | × |
| Our proposal (FLARoute) | √ | √ | √ | √ | √ | √ |
| Routing Technique (p) | Nodes and Number of Transmissions | Fairness; (%) | ||||
|---|---|---|---|---|---|---|
| n1 | n2 | n3 | n4 | |||
| A | 12 | 12 | 12 | 12 | 0 | 100 |
| B | 13 | 12 | 12 | 11 | 0.7 | 96.6 |
| C | 24 | 8 | 8 | 8 | 6.9 | 66.7 |
| D | 32 | 8 | 4 | 4 | 11.7 | 43.9 |
| E | 47 | 1 | 0 | 0 | 20.2 | 2.8 |
| F | 48 | 0 | 0 | 0 | 20.8 | 0 |
| Performance Metric | PRoPHET | Incorporated Solution | Comment on FLARoute as Compared with CCAF | |
|---|---|---|---|---|
| CCAF | FLARoute | |||
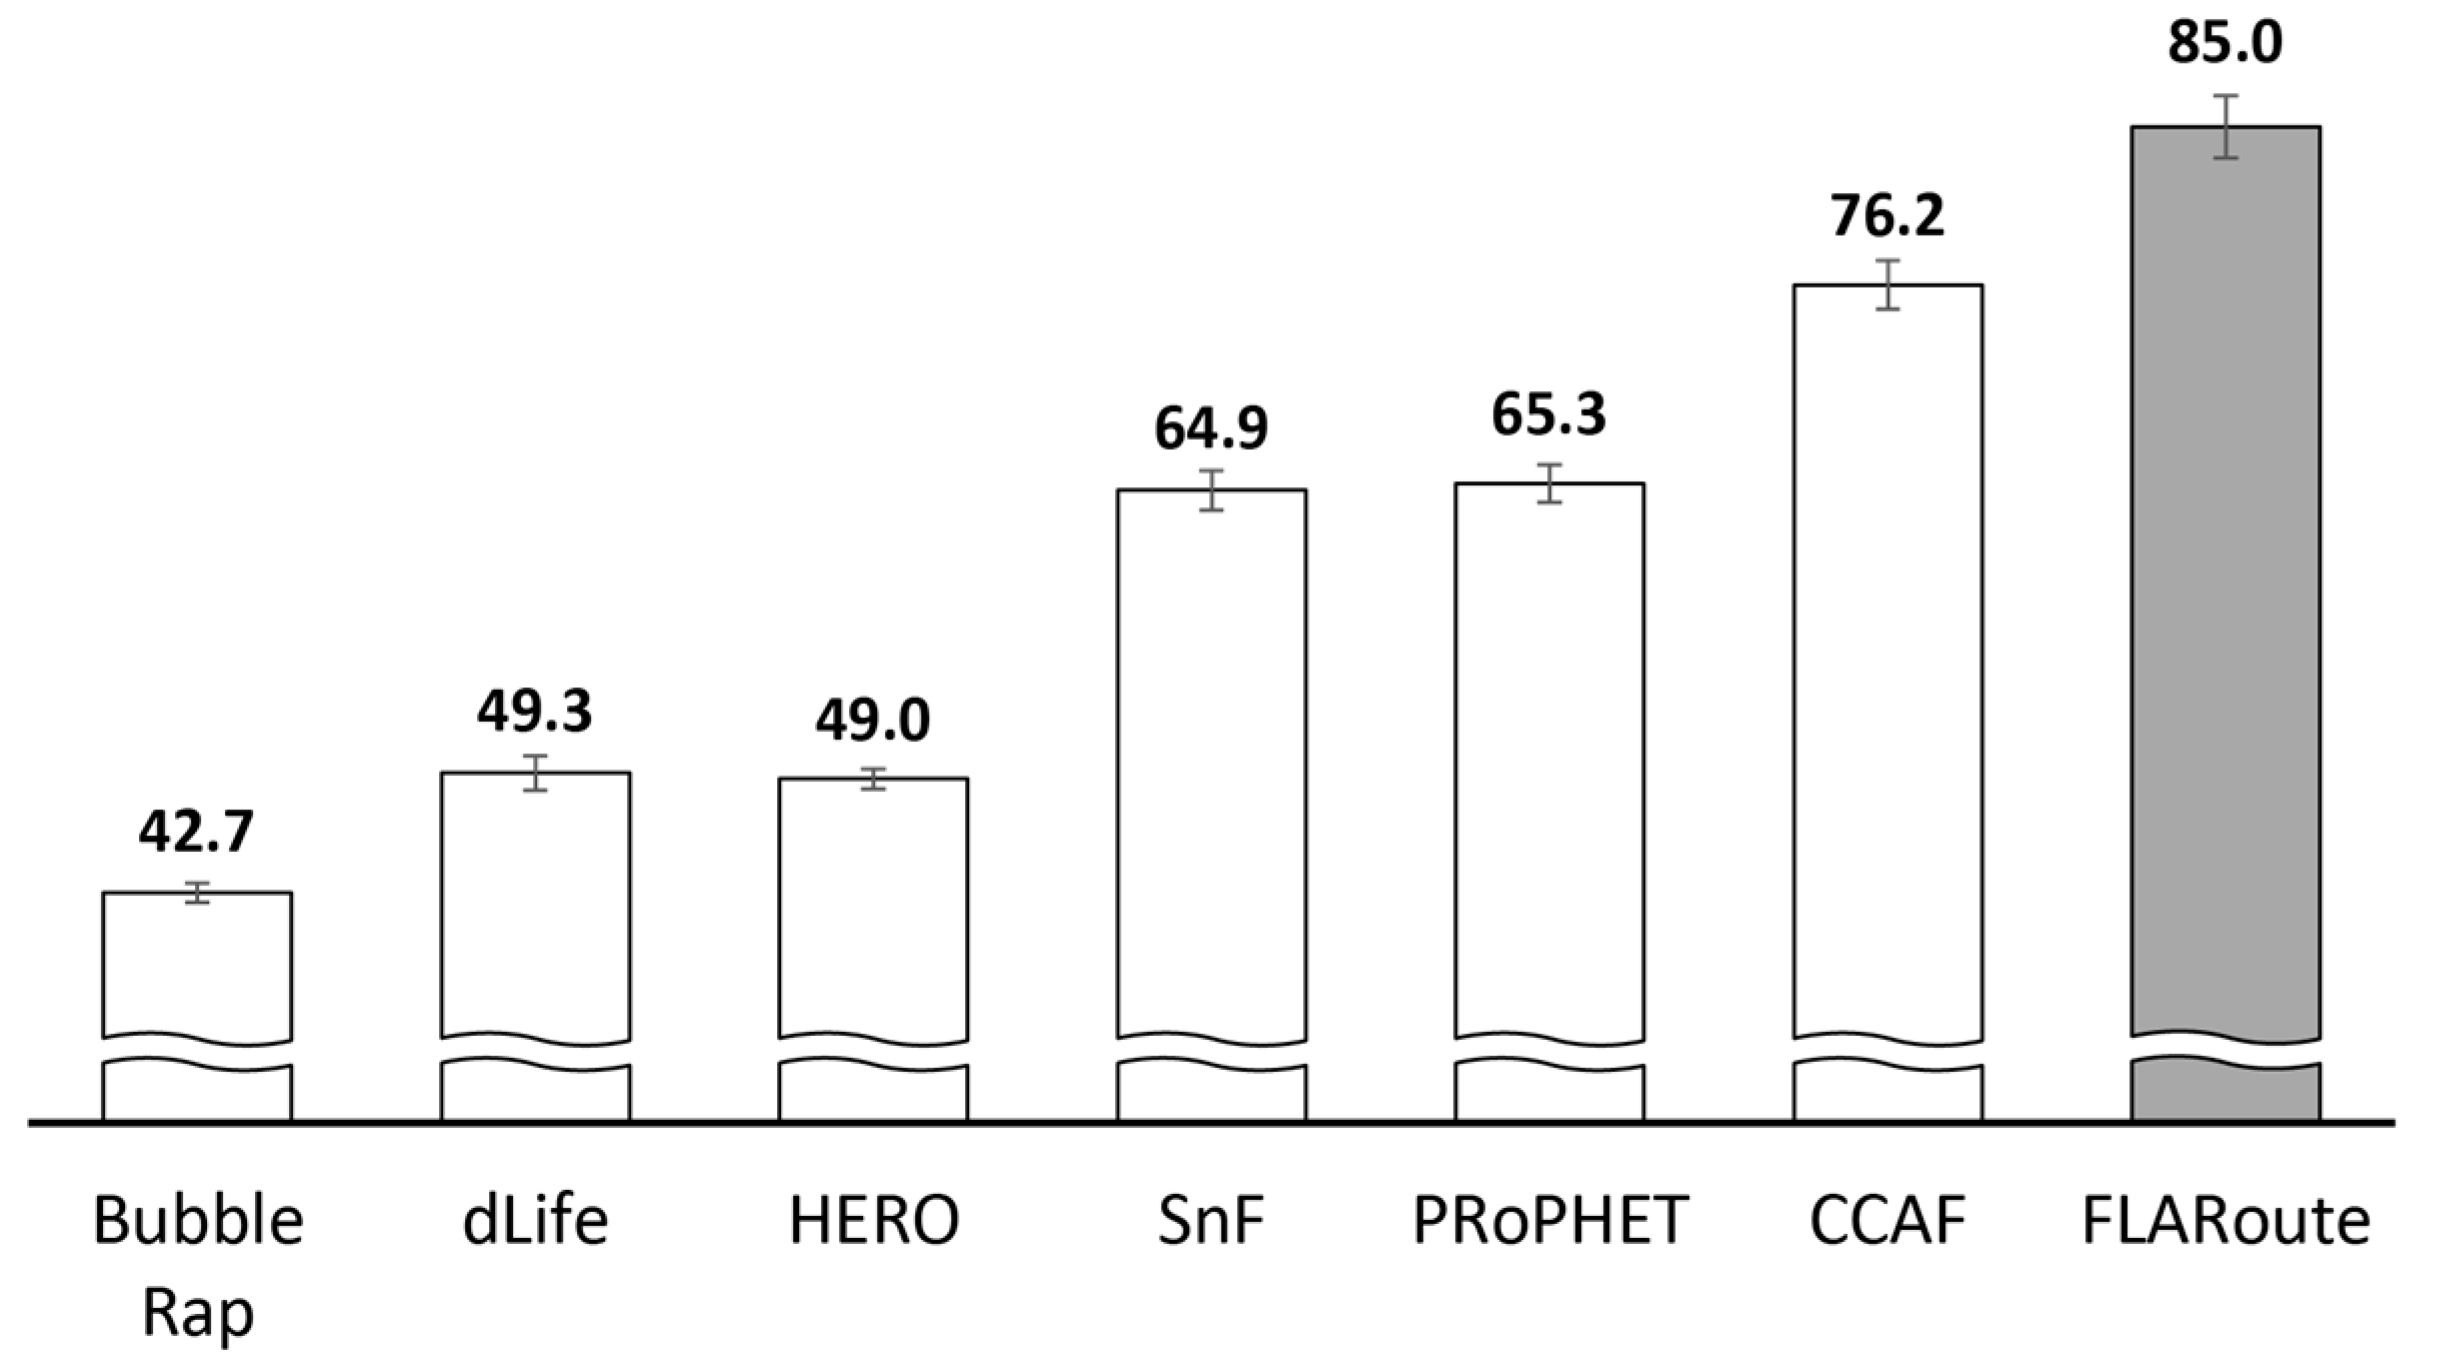
| Throughput (%) | 65.3 | 76.2 | 85 | Higher throughput and routing fairness is due to locality-awareness |
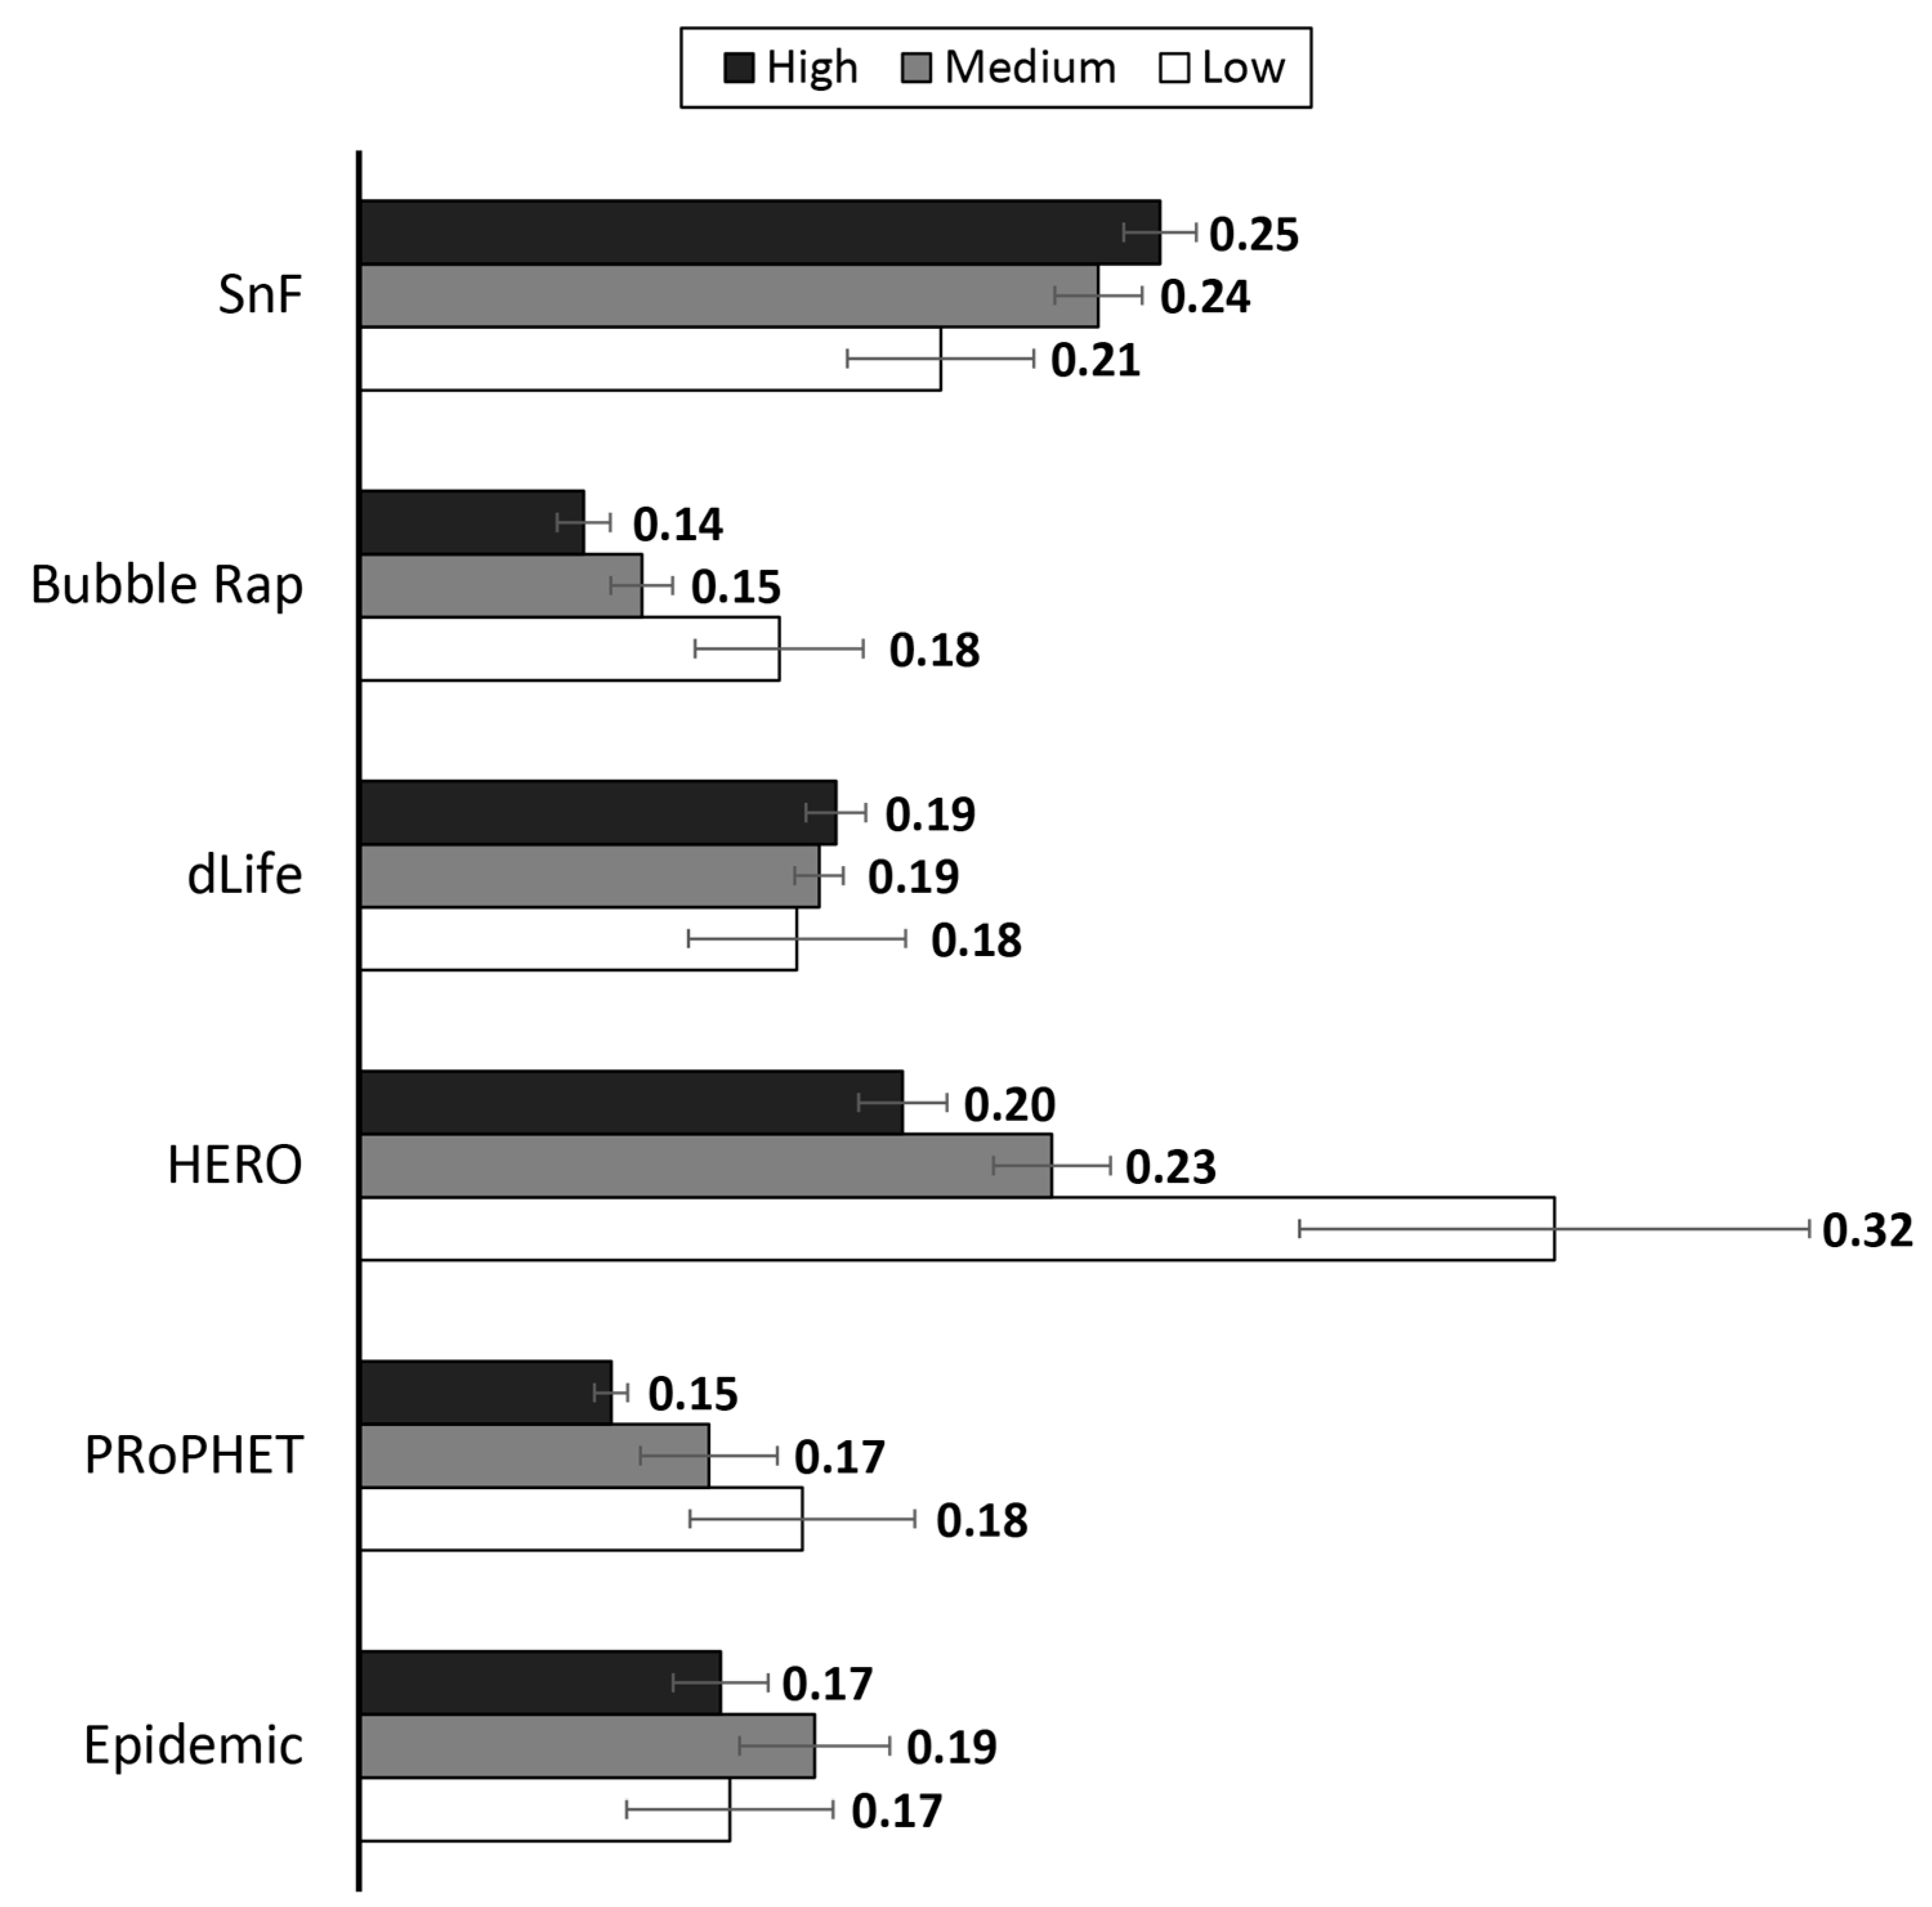
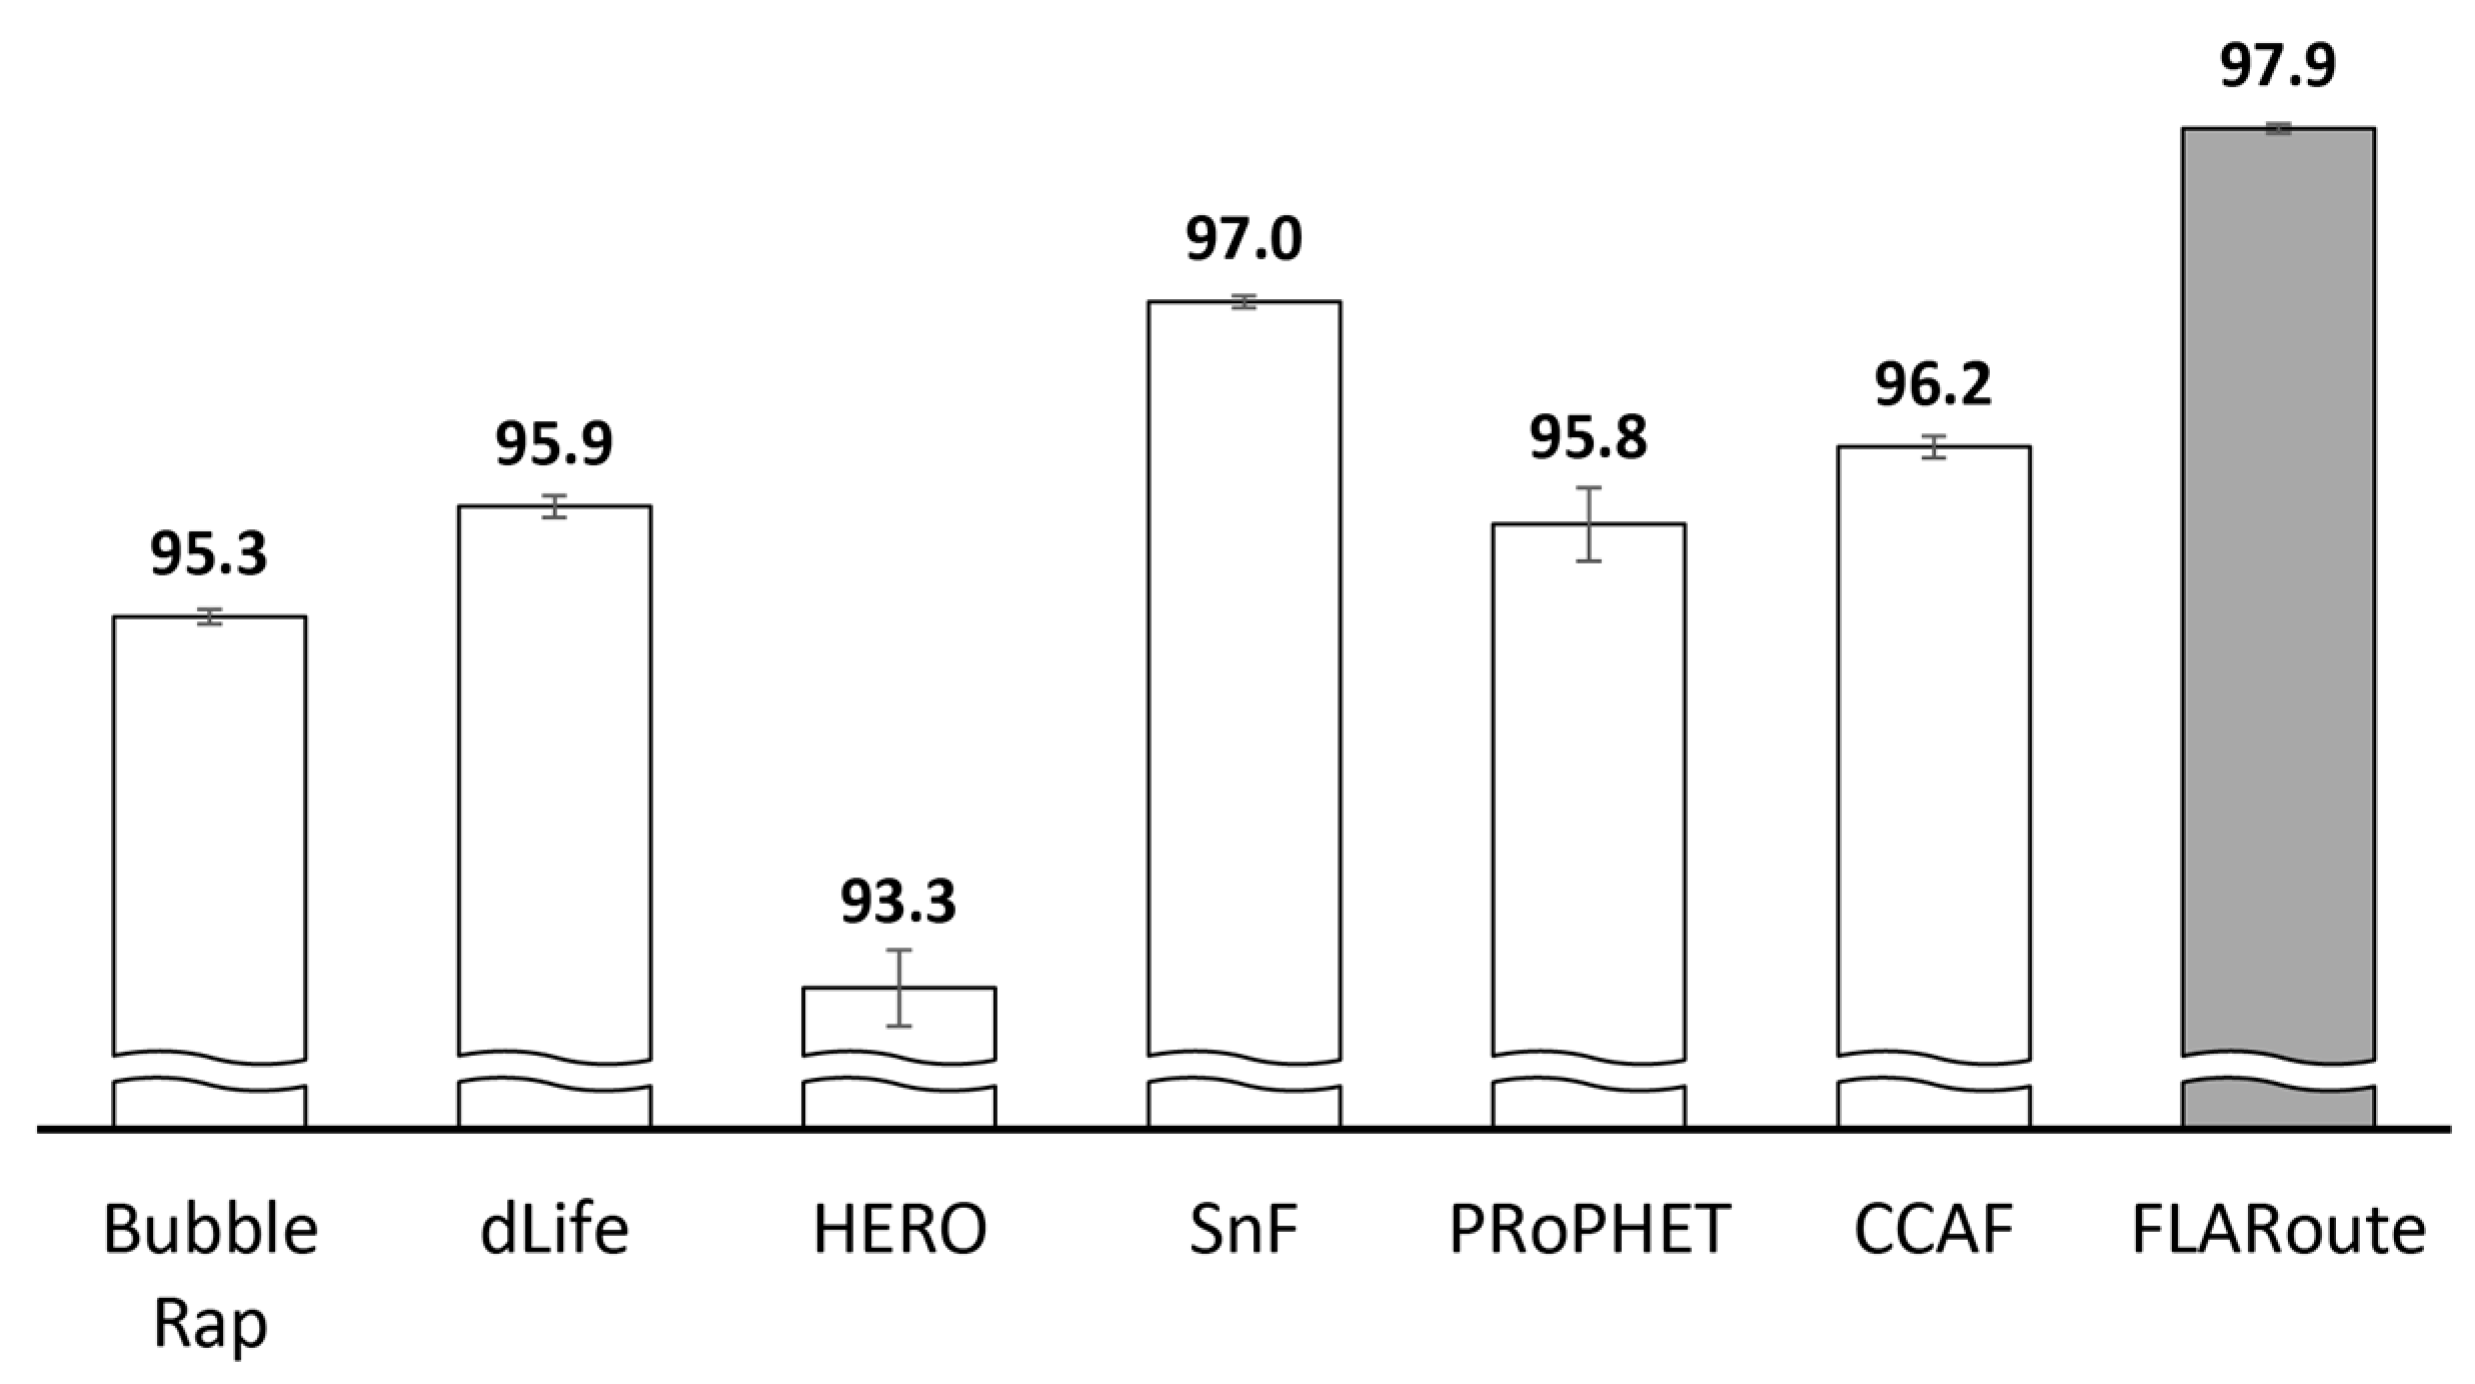
| Routing fairness (%) | 95.8 | 96.2 | 97.9 | |
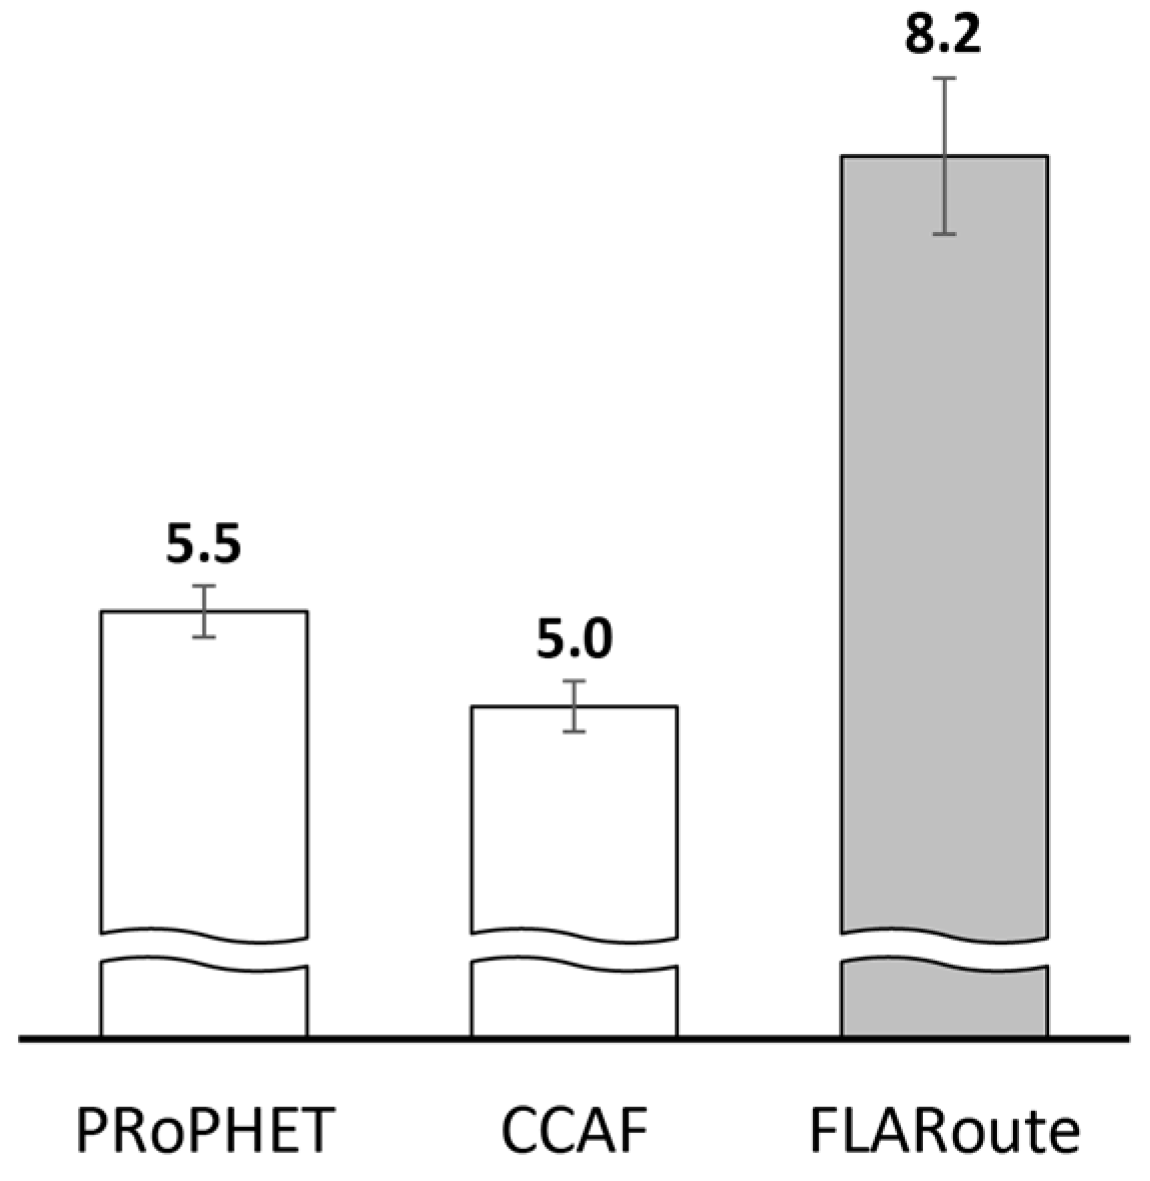
| Average delivery delay (h) | 5.5 | 5 | 8.2 | More delay is incurred in order to deliver messages traversing longer distances |
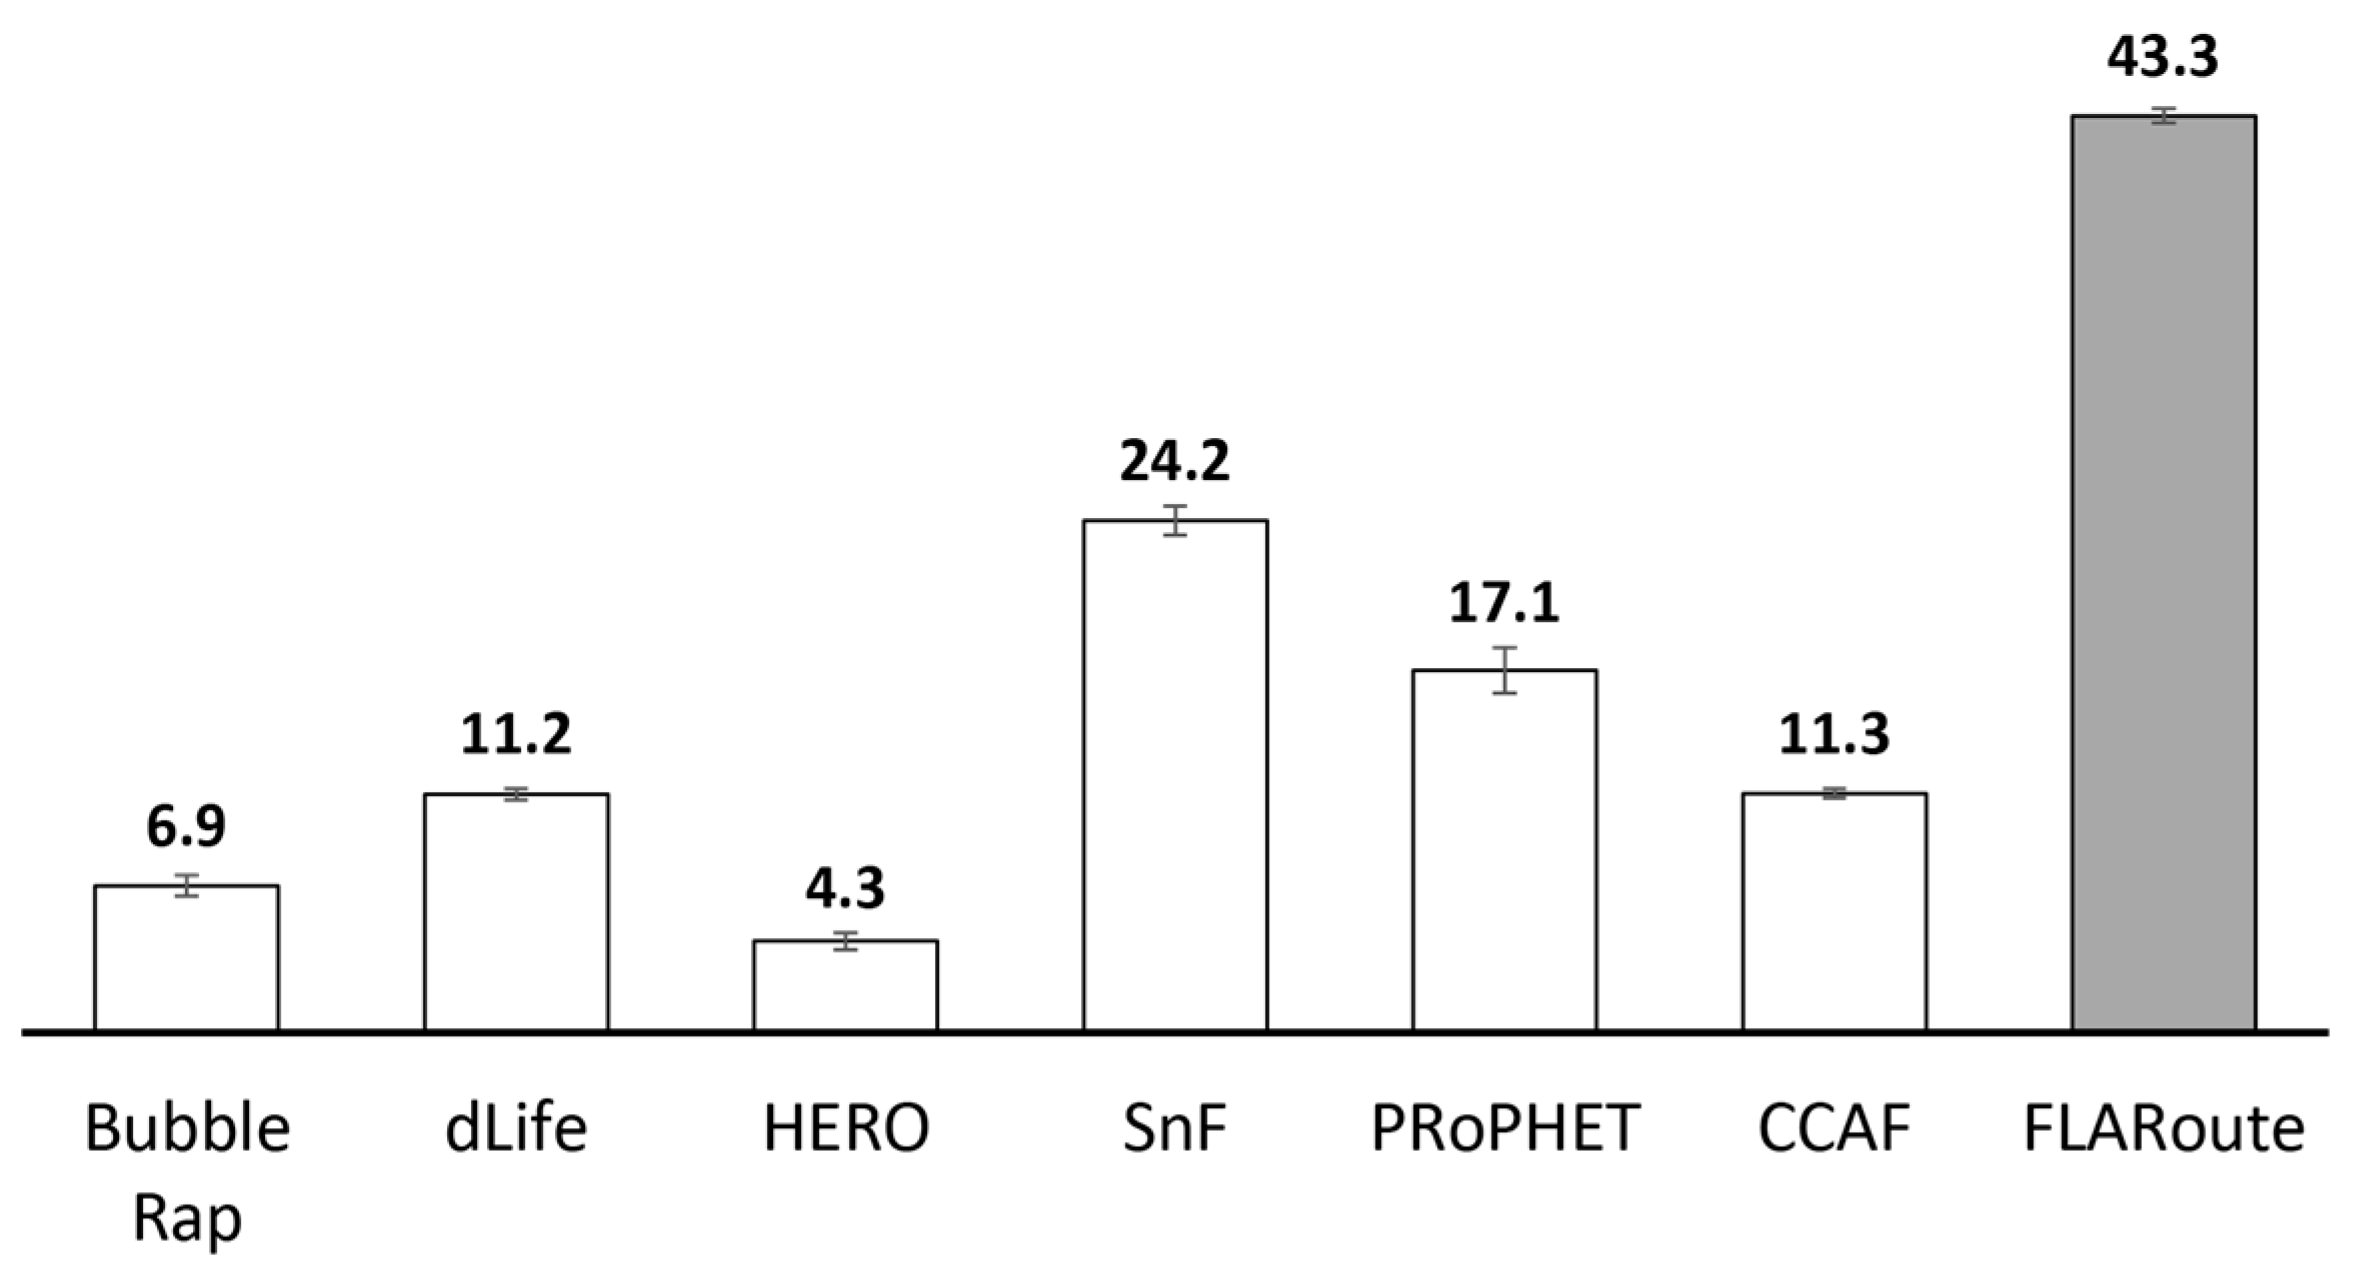
| Energy distribution (%) | 17.1 | 11.3 | 43.3 | Energy consumption is more evenly distributed among the two sets of nodes |
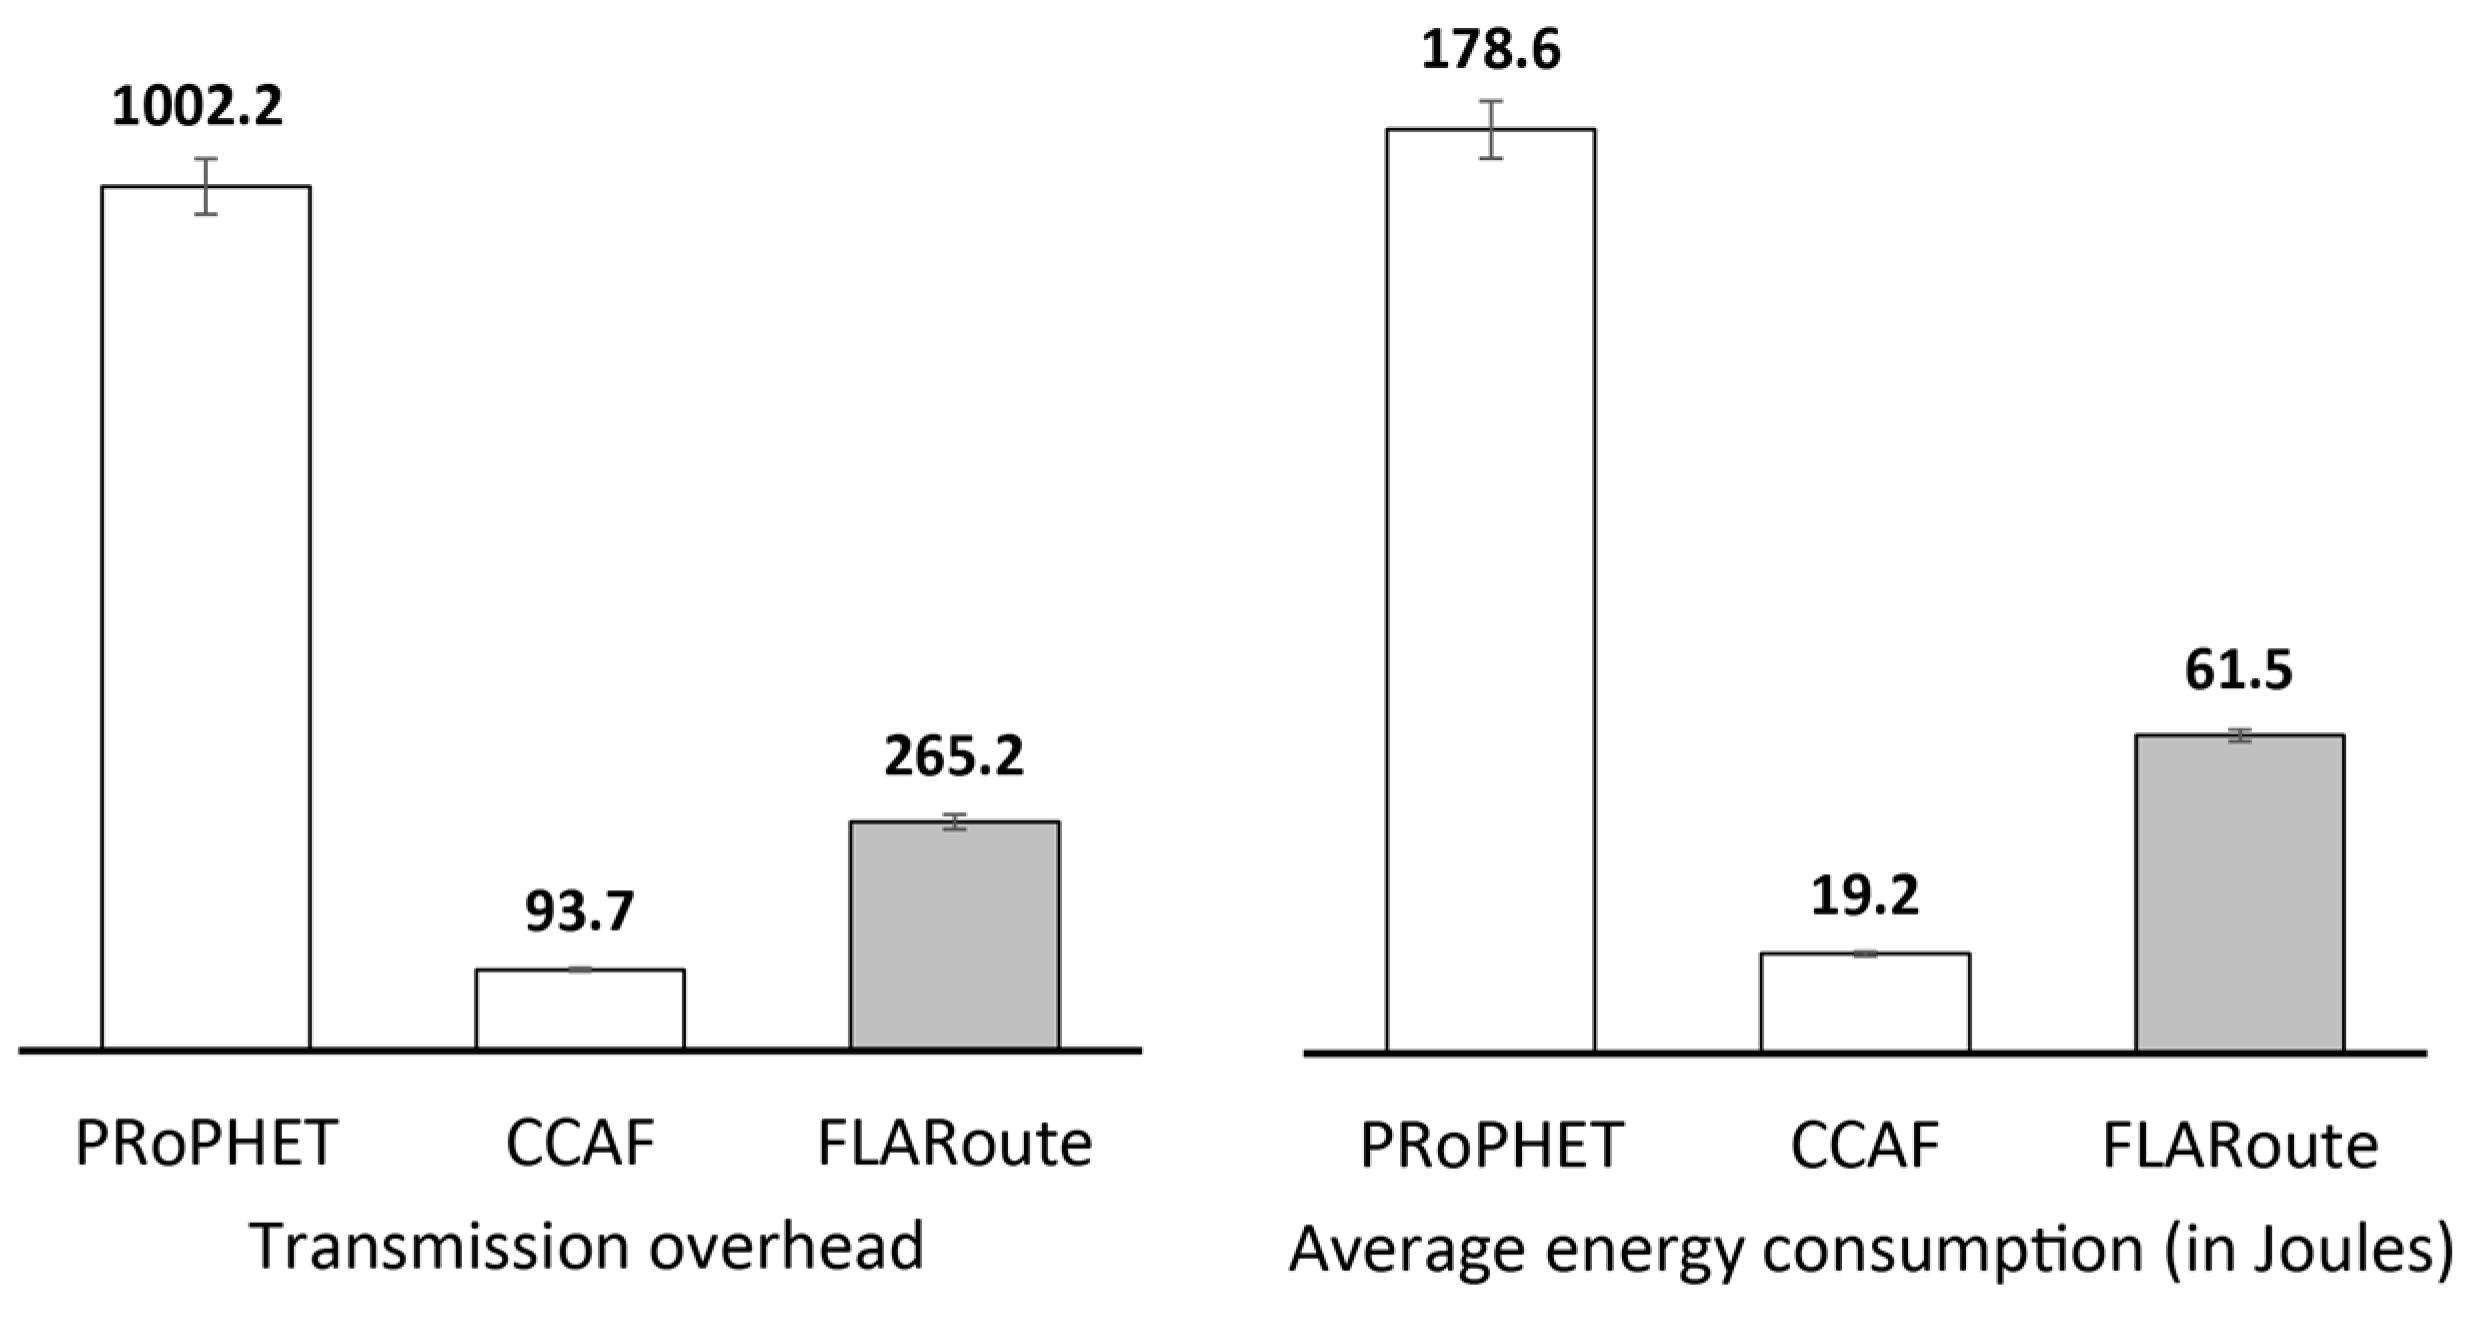
| Transmission overhead | 1002.2 | 93.7 | 265.2 | Added transmission overhead and average energy consumption is due to improved fairness |
| Average energy consumption (Joules) | 178.6 | 19.2 | 61.5 | |
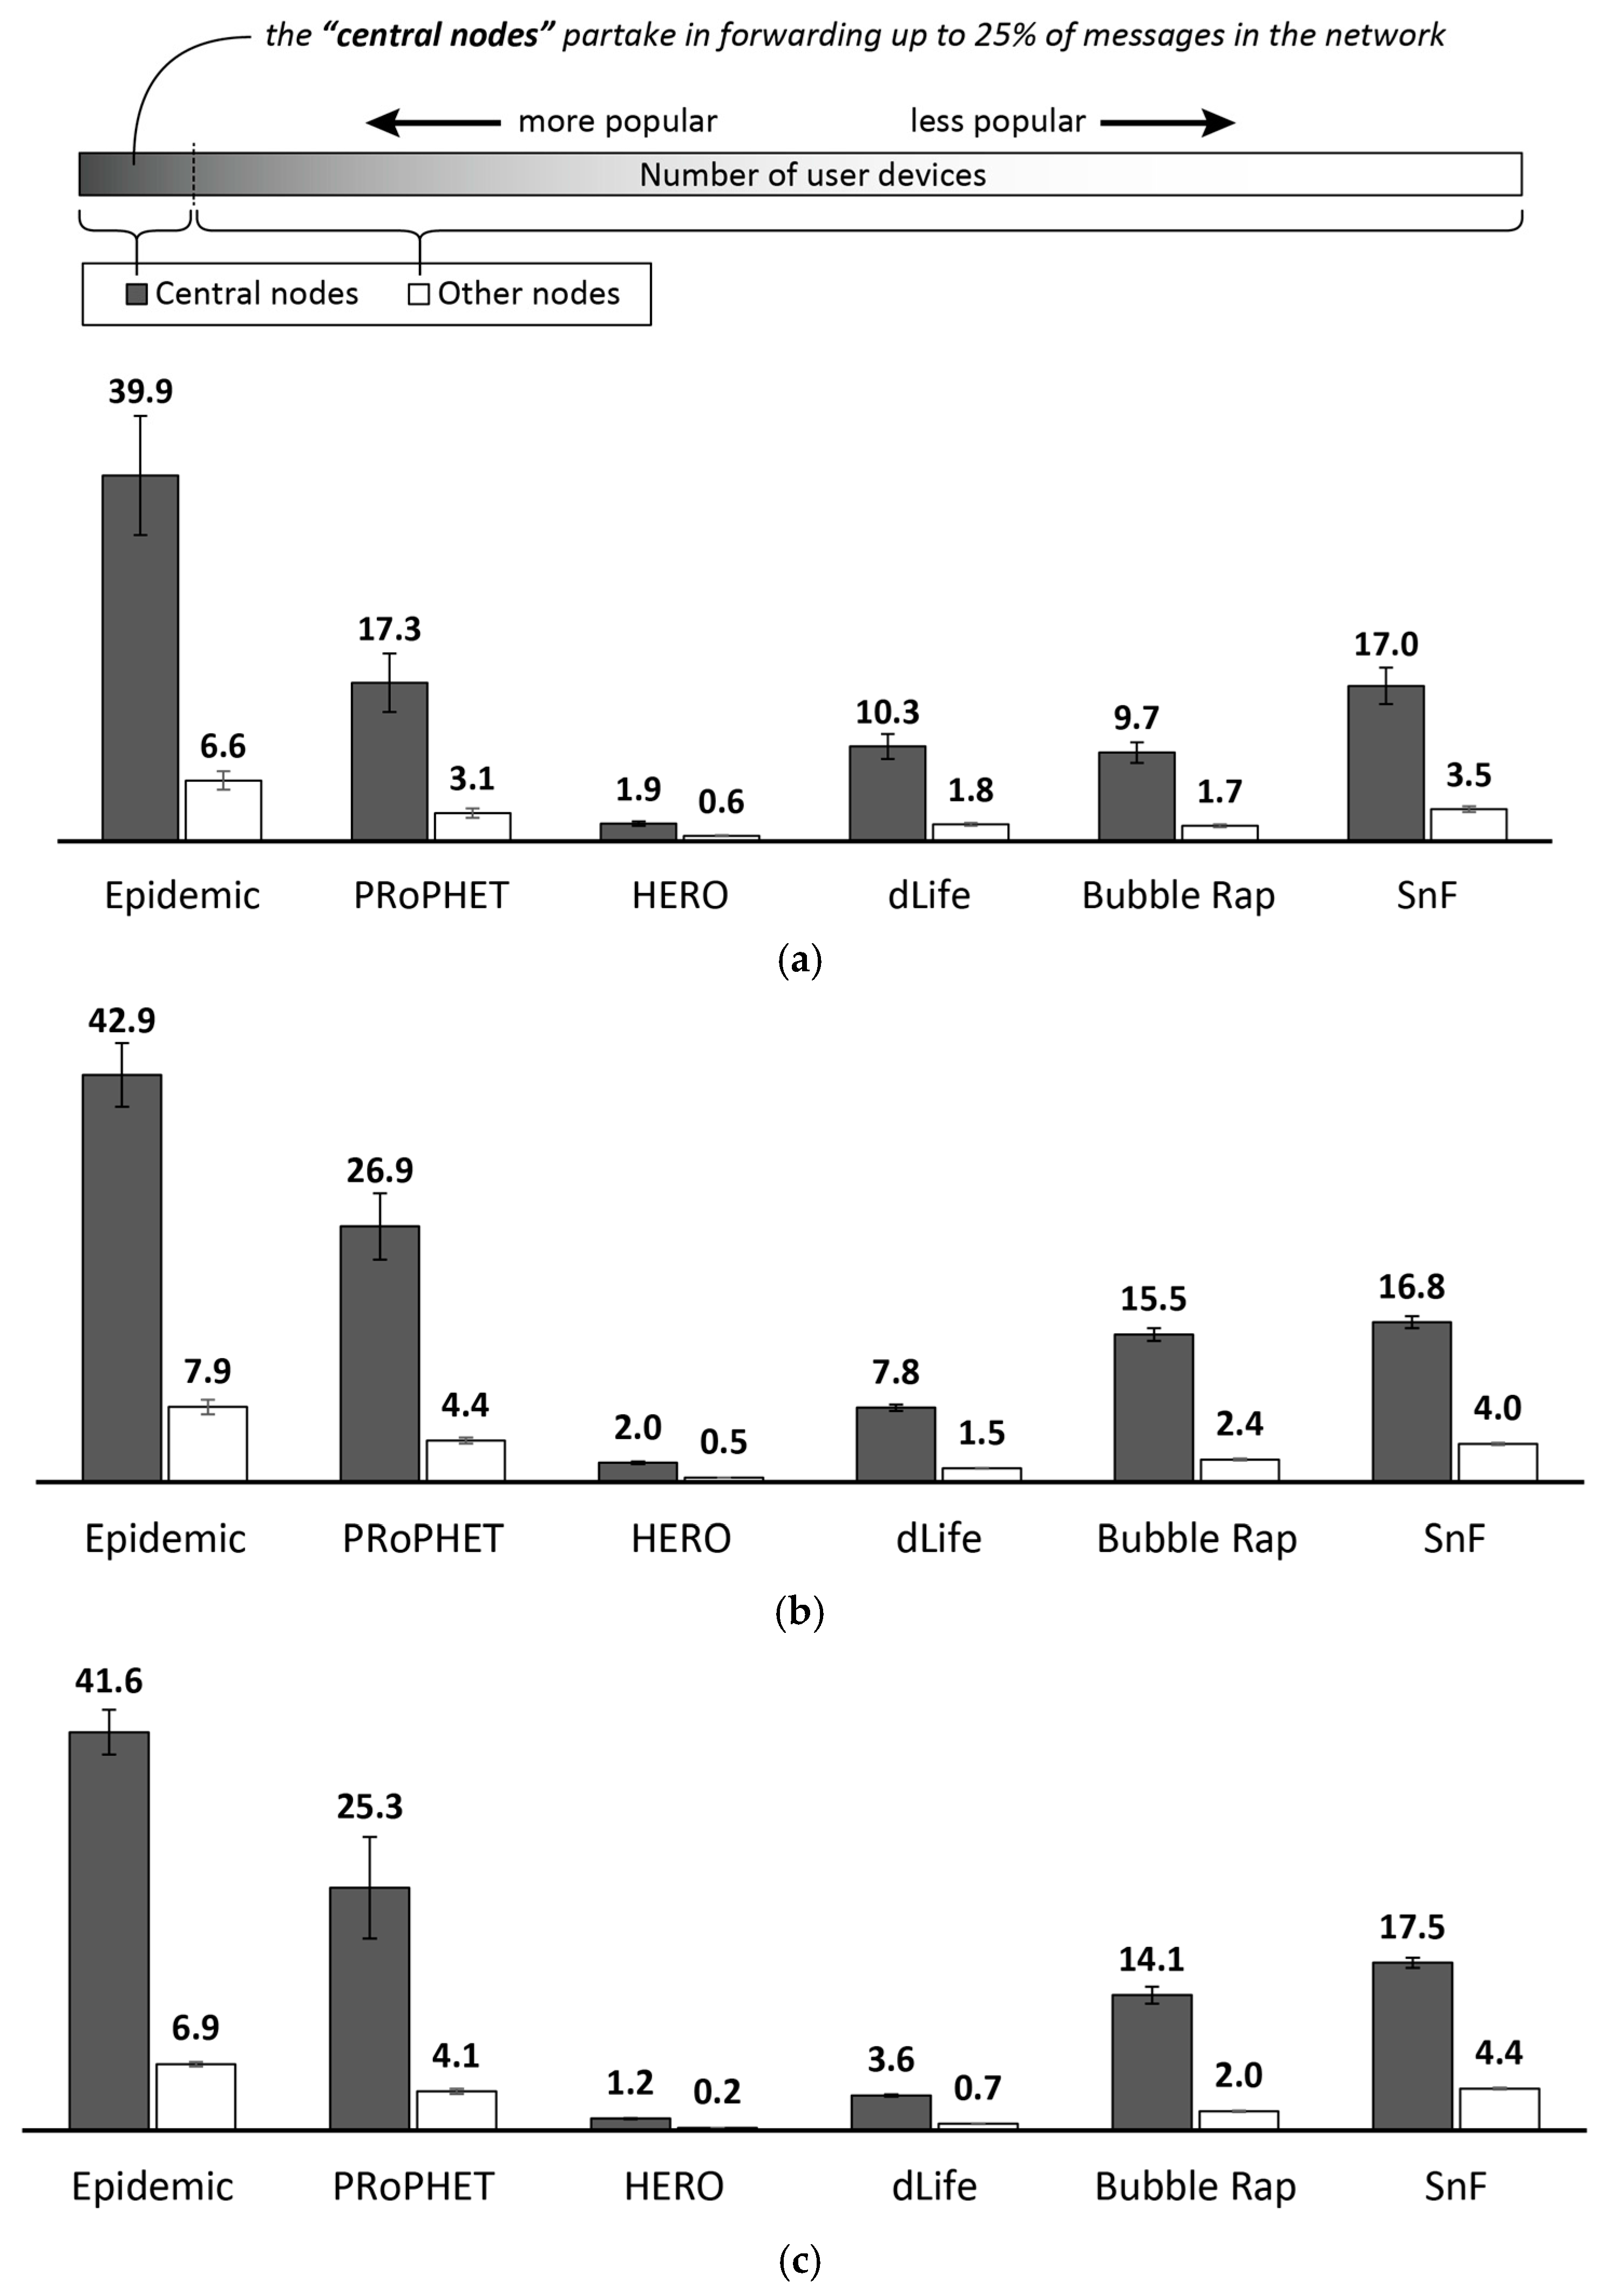
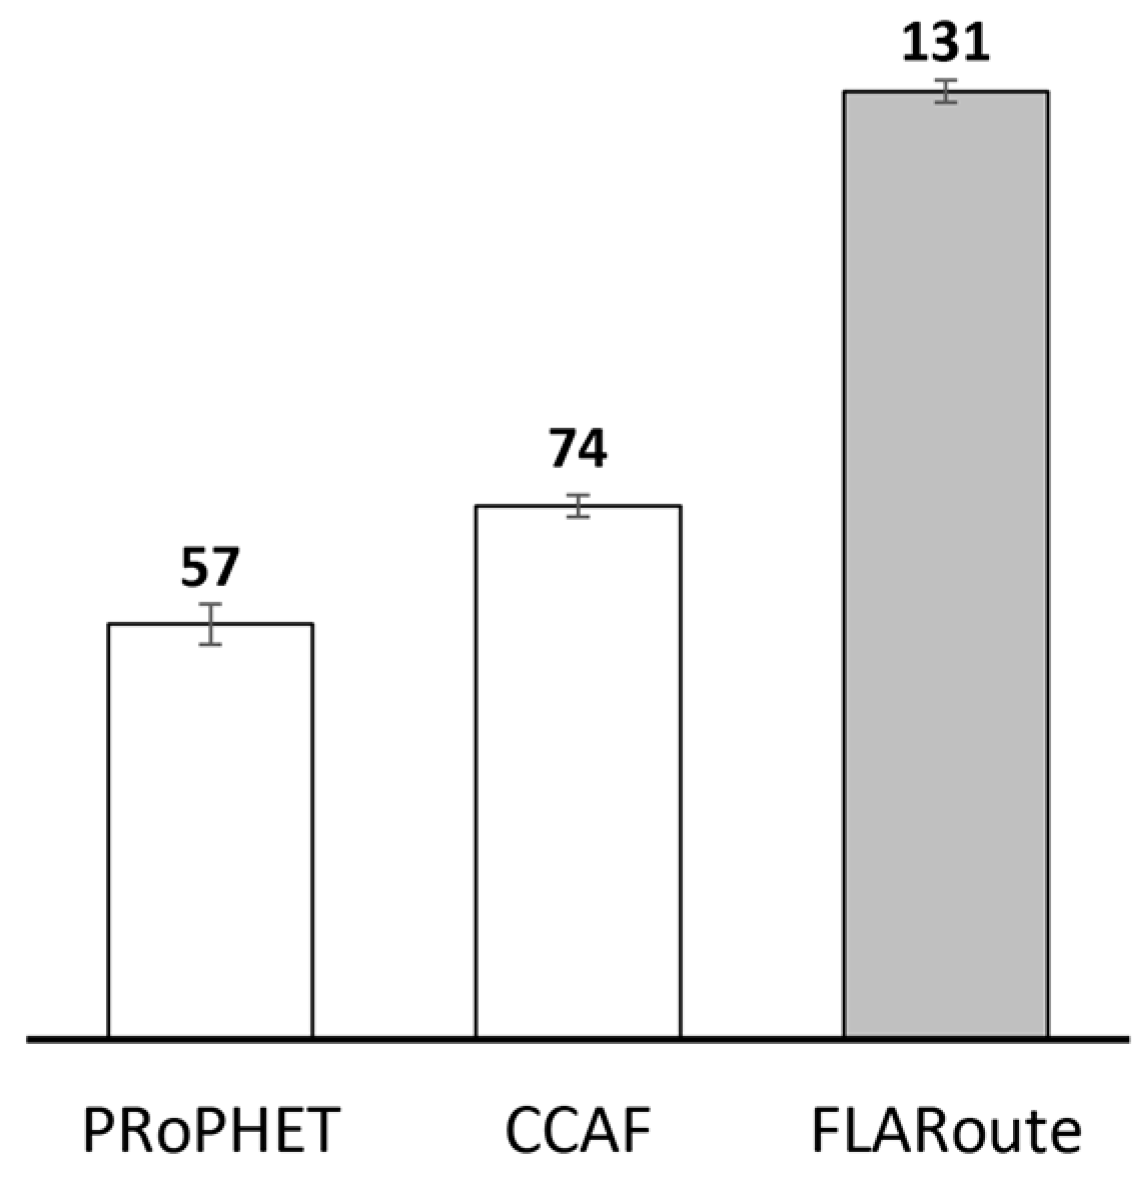
| Average central node count | 57 | 74 | 131 | More number of central nodes contributing to increased fairness and throughput |
© 2017 by the authors. Licensee MDPI, Basel, Switzerland. This article is an open access article distributed under the terms and conditions of the Creative Commons Attribution (CC BY) license (http://creativecommons.org/licenses/by/4.0/).
Share and Cite
Amah, T.E.; Kamat, M.; Abu Bakar, K.; Abali, A.M.; Moreira, W.; Oliveira-Jr, A. Addressing the Issue of Routing Unfairness in Opportunistic Backhaul Networks for Collecting Sensed Data. J. Sens. Actuator Netw. 2017, 6, 31. https://doi.org/10.3390/jsan6040031
Amah TE, Kamat M, Abu Bakar K, Abali AM, Moreira W, Oliveira-Jr A. Addressing the Issue of Routing Unfairness in Opportunistic Backhaul Networks for Collecting Sensed Data. Journal of Sensor and Actuator Networks. 2017; 6(4):31. https://doi.org/10.3390/jsan6040031
Chicago/Turabian StyleAmah, Tekenate E., Maznah Kamat, Kamalrulnizam Abu Bakar, Aliyu M. Abali, Waldir Moreira, and Antonio Oliveira-Jr. 2017. "Addressing the Issue of Routing Unfairness in Opportunistic Backhaul Networks for Collecting Sensed Data" Journal of Sensor and Actuator Networks 6, no. 4: 31. https://doi.org/10.3390/jsan6040031