IoT-Based Intelligent Modeling of Smart Home Environment for Fire Prevention and Safety


1
Department of Computer Science and Engineering, Kyungpook National University, Daegu 702-701, Korea
2
School of Architectural, Civil, Environmental and Energy Engineering, Kyungpook National University, Daegu 702-701, Korea
*
Author to whom correspondence should be addressed.
J. Sens. Actuator Netw. 2018, 7(1), 11; https://doi.org/10.3390/jsan7010011
Submission received: 15 December 2017
/
Revised: 29 January 2018
/
Accepted: 2 February 2018
/
Published: 2 March 2018
(This article belongs to the Special Issue Smart Homes: Current Status and Future Possibilities)
Abstract
:Fires usually occur in homes because of carelessness and changes in environmental conditions. They cause threats to the residential community and may result in human death and property damage. Consequently, house fires must be detected early to prevent these types of threats. The immediate notification of a fire is the most critical issue in domestic fire detection systems. Fire detection systems using wireless sensor networks sometimes do not detect a fire as a consequence of sensor failure. Wireless sensor networks (WSN) consist of tiny, cheap, and low-power sensor devices that have the ability to sense the environment and can provide real-time fire detection with high accuracy. In this paper, we designed and evaluated a wireless sensor network using multiple sensors for early detection of house fires. In addition, we used the Global System for Mobile Communications (GSM) to avoid false alarms. To test the results of our fire detection system, we simulated a fire in a smart home using the Fire Dynamics Simulator and a language program. The simulation results showed that our system is able to detect early fire, even when a sensor is not working, while keeping the energy consumption of the sensors at an acceptable level.
1. Introduction
In recent years, fire detection has become a very big issue, as it has caused severe damage including the loss of human lives. Sometimes, these incidents are more destructive when the fire spreads to the surroundings. Early detection of a fire event is an effective way to save lives and reduce property damage. To escape a fiery place and to douse the fire source, the fire must be detected at its initial stage. The installation of a fire alarm system is the most convenient way to detect a fire early and avoid losses. Fire alarms consist of different devices working together that have the ability to detect fire and alert people through visual and audio appliances. The detection devices (i.e., heat, smoke, and gas detectors) detect events and activate the alarm automatically, or sometimes the alarms are activated manually. The alarm may consist of bells, mountable sounders, or horns.
Most of the fire alarm systems use the technology of a wireless sensor network (WSN). WSNs have gained popularity because they have a variety of uses in different applications, such as target tracking [1,2], localization [3], healthcare [4,5], Smart Transpiration [6], environmental monitoring, and industrial automation [7]. WSN is also used in collecting data and monitoring, both autonomously or with the help of users [8,9]. WSN applications also help human and animals [10,11] and are also used for industrial purposes, for example, underground pipeline monitoring. In a WSN, sensor devices are often very tiny, battery-powered, and densely populated with the functionality of monitoring several parameters of the environment. The sensed data are sent to the main collecting unit (i.e., the sink, cluster head etc.) for processing [8]. WSNs used for fire detection systems also have the same functional properties. Each sensor detects rising heat, smoke, or gas in some spots in a home and generate san alert in its head node in a network. The head node collects reports from various sensors and identifies the presence of a fire. Next, different heads coordinate the received inputs and consult with a remote command center to plan a response that may consist in a simple fire alarm generation or in complicated evacuation methods. Numerous technologies based on WSN have already been proposed to detect fire. Some of them are stand-alone with WSN, and some have hybrid technologies. There are many event detection systems, which help to identify heat, gas, and smoke.
Today, smart houses and smart cities are equipped with different type of WSNs [12]. In WSNs, more energy may be consumed because of communication overhead. Thus, most of the time, a sensor’s battery is exhausted very fast and it may cause the failure of the sensor or the breakdown of whole network, as houses have different sub-portions and each portion is equipped with one sensor with a single function, which in case of failure causes a system flaw. In this scenario, if an event occurs in a certain portion and the sensor fails to detect the accident, then there is no other way to detect the incident at its initial stage. As unifunctional sensors are only be able to detect one event, there is another noticeable issue regarding the possibility of false alarms. For example, a heat detector detects temperature in the environment and produces the alarm if the temperature increases beyond a threshold. However, the increase in heat may be due to environmental changes or human activity in the room. In the case of smoke detectors, the smoke may come from outside or from other sources. The cost of a false alarm is estimated between $30,000 and $50,000 per incident [13].
Today, sensors are very cheap and very small in size. Thus, to address the above-mentioned challenges, we propose an efficient, IoT-based intelligent home fire prevention system using multiple sensors. Each of the sensors uses its own mechanism for detection. Our method detects fire very efficiently and reduces false positives by using Global System for Mobile Communications. The contribution of this article is manifold.
- Problems and challenges related to the current approaches are identified. The existing methods use single sensor for each target regions. Nowadays, sensors are very cheap so we used multi-sensors for every critical region to address problems linked to single sensor detection.
- We use GSM communication to alert the user at early stages if the sensor reports a fire.
- The identification of the fire is made by the system after verification from two sources. These sources are: (1) Response of the user to the GSM alert, i.e., if the user response is fire, then our system directly generates the alarm; (2) When two or more sensors report fire, then the system directly generates a fire alarm without waiting for the user response.
- We use star topology for the deployment of sensors and communication between sensors and main home sink. We use the ZigBee protocol to provide communication between the sensors and the sink.
- Finally, we evaluate the system concerning energy consumption.
The rest of the paper is organized as follows. The related work is presented in Section 2. Section 3 discusses the analysis of fire data. Section 4 describes the overview of our proposed work and the detailed design of the fire detection system. Simulation details and results are exposed in Section 5 and Section 6, respectively. Finally, the article is concluded in Section 7.
2. Related Work
In the last few years, sensors have been widely used for fire detection [14,15,16,17,18,19]. Silva et al. [14] proposed a work for fire detection in mines by using wireless sensor networks called WMSS. For determining the hazardous factor in the mines, they used gas sensors and designed a wireless sensor network which collects and analyses the gas level in mines. The work proposed in [15] used Zigbee-based wireless sensors for fire detection in forests. They used temperature sensors to establish the intensity of fire in a forest. They used a CC2430 chip in their hardware design for network nodes. Similarly, Buratti et al. [16] also designed a framework for forest fire detection. In their work, they used a model for fire detection using different clustering schemes and communication protocols. They performed the simulation for validation and evaluation of their work. W. Tan et al. [17] implemented a work for forest fire detection. They used multi-sensor and wireless IP cameras to avoid false alarms. Their system also connected to the internet via gateways for uploading the data to the cloud. A work proposed in [18] for forest fire detection was based on a ZigBee wireless sensor network in China. A work for forest fire detection is proposed in [19]. A. Rehman proposed a work for WSN [20]. South Koreans [21] also designed a system for fire detection in their mountains. They named their system FFSS (Forest fire Surveillance system). They developed their system by using WSN, middleware, and web applications. Network nodes (i.e., temperature sensors and humidity sensors) collect measurements and send them to the sink node. Afterwards, the sink node transmits that data to the cloud via a transceiver (gateway). Later, by using a formula, the fire risk level is determined in the middleware program. After detecting the fire, FFSS is activated automatically. TinyOS is used as an operating system for network nodes.
Similarly, few other systems utilize the WSN for early fire detection. Few of them use IP-based cameras and mixed multi-sensors [22] on wireless mesh network to detect a fire efficiently. They use these three parameters to make an efficient system to identify and verify fire. A software application exists, which selects the closest IP base camera. When sensors sense a fire, they send the information to the central server where the software program selects the nearest camera. That camera takes pictures of the location and send them back to the main sink. Alarm decision is made on the basis of the sensor’s information and selected images. Also, a clustering-based forest fire detection system was proposed in [23]. The proposed method uses advanced communication protocols. The proposed work consists of four major parts: (i) an approach for sensor deployment, (ii) the use of WSN for fire detection, (iii) intra-clustering protocols, and (iv) an inter-clustering communication protocol. Aother work was proposed by Wenning, Pesch, Giel, and Gorg [24] for disaster detection, including the fire event. This method can quickly adapt the routing work state on the basis of the threat of possible failure. In [25], researchers proposed a protocol for the adaptation of the Context-Aware Routing Protocol (CAR) to WSN and named it SCAR. Energy, colocation with sink, and their connectivity was evaluated in SCAR. For the delivery of data packets to the sink, delivery probability and forecasted values were combined on the basis of previous knowledge of SCAR parameters. In this system, buffer space and delivery probability are exchanged periodically with neighbor nodes. An order list of neighbors is sorted by delivery probability, which is kept by each node. Garcia et al. [26] proposed a work to create a model for fire detection. They performed a simulation by analyzing sensors data and geographic information. To differentiate from the existing work, they used topography of the environment under study.
Energy and time factors are an unavoidable requirement that should be satisfied efficiently. The energy factor plays a vital role to maximize the lifespan of sensors in the WSN environment. The ever-increasing demand by the market leads the researcher to invent new hardware and algorithms that are more reliable and efficient. IEEE 802.15.4/ZigBee with cluster-tree topology [27] assures reliable performance and efficient energy consumption that significantly increases the lifespan of WSN. This IEEE standard reduces the time slot collision named guaranteed time slot (GTSs). GTSs can also be used in real-time transmission scenarios. Allocating GTSs to the sensor nodes indicates that nodes will remain in sleep mode until they get a time slot. Other anomalies, such as optimal sensor placement, data communication, security, and sensor’s energy factors, are also involved in sensor environments. A considerable amount of work has been done in this domain. Gul et al. [28] proposed a work that optimized the sensor node placement and analyzed the energy constraints on a significant amount of data passing through the WSN while the network was suffering from a DDoS attack. Techniques like the Constrained node-weighted Steiner tree-based algorithm [29] have proven to be helpful while creating WSN. This technique optimized the sensor node placement efficiently. A proposed method [30] maximized the lifetime of a sensor by optimizing data aggregation. Intelligent systems, from vehicular networks to the smart buddy and other evolutionary systems, are applied in various fields of technology [31,32,33,34,35] which also poses many challenges in implementation, especially in analyzing fire simulations without human intervention.
3. Home Fire Data Analysis
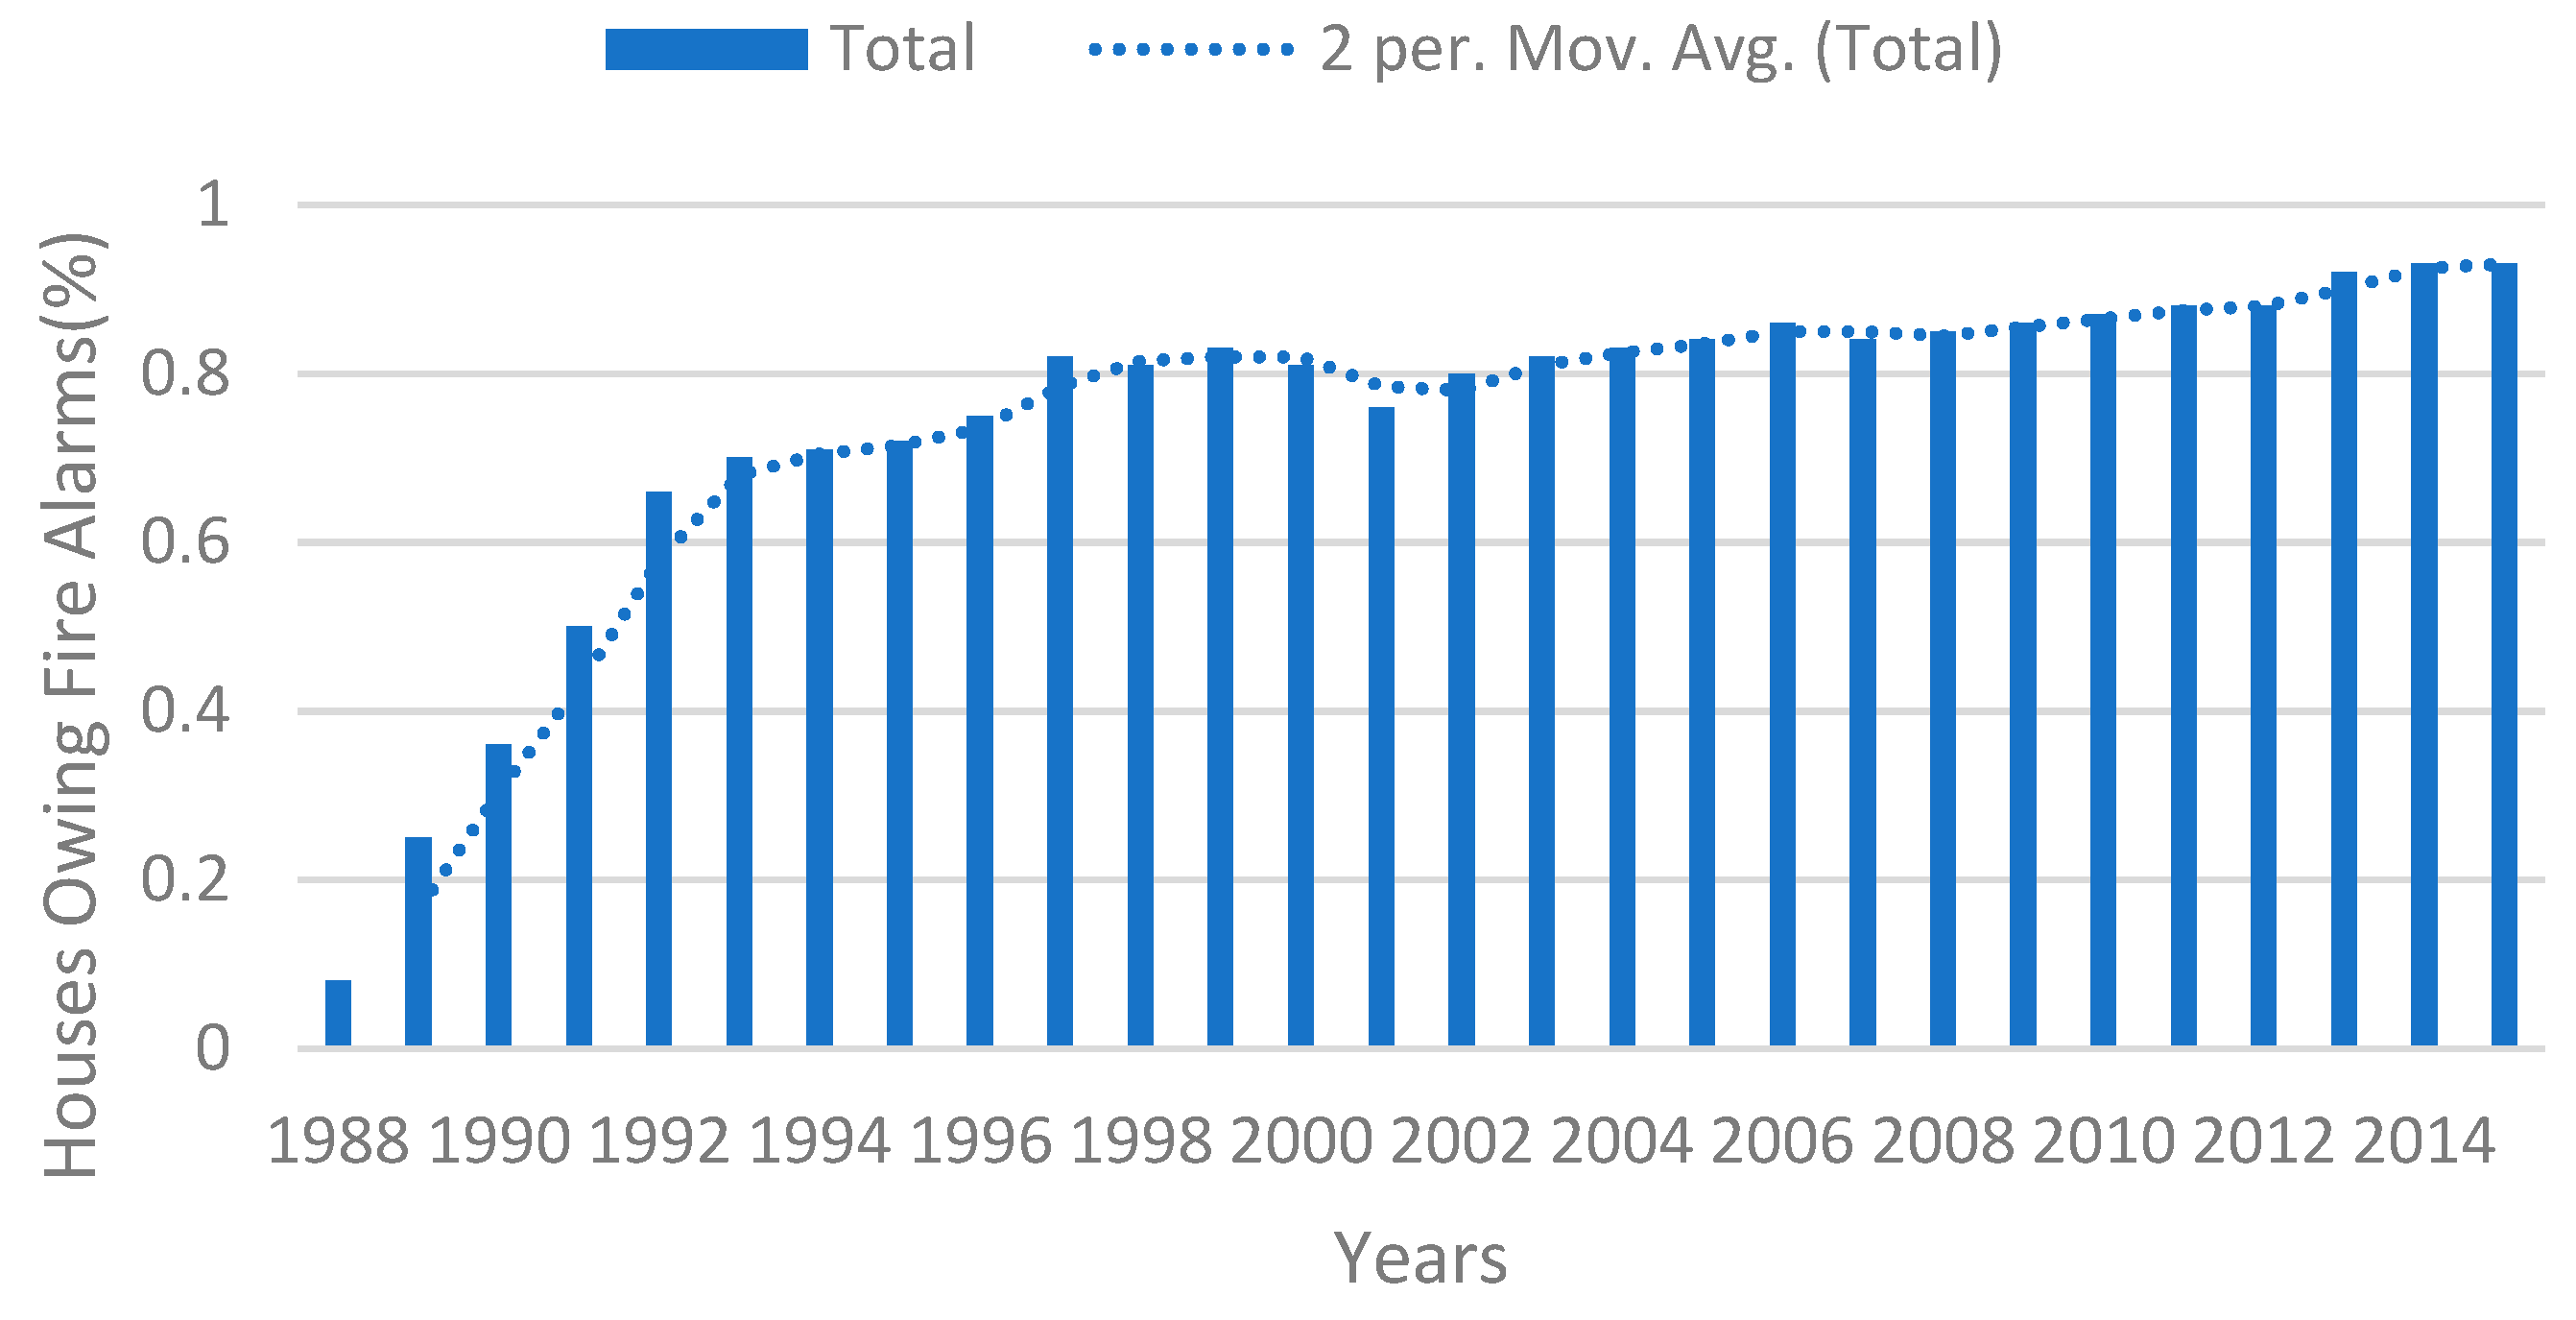
To understand the importance of the study, we did some analysis by using different fire datasets. We took these datasets from very reliable sources [36,37]. The datasets include fire statistics containing: (i) a percentage of homes that have fire alarms in England & Wales, (ii) causes of the fires, (iii) fire alarms with respect to sensors type, and (iv) death data per million population because of dwelling fires. While analyzing the house fire data initially, we examined the trend of using alarm during the years from 1988 to 2015. Figure 1 shows the graph of this trend. It shows that almost 93.4% of houses in English countries are now using fire alarms.
As this analysis shows, almost 93% of houses are equipped with fire alarms but the study indicates that there are still many deaths despite the fire detection systems. Figure 2 shows the pictorial representation of the analysis of the death dataset taken from [37]. The graph shows the number of deaths per million people in each year. The study shows that more than ten deaths per million population are still occurring every year. The loss of lives or property caused by fire is due to many reasons, such as alarm failure, false alarm, no response, and many other unspecified reasons. We performed another analysis of fire-caused losses where fire detection systems were installed. This analysis was made on the data taken from England between 2010 and 2016. Figure 3 shows the study of fire-caused losses per year. We analyzed fire losses due to three causes: (1) Fire damages due to a false alarm, (2) Fire losses due to no person response, (3) Other/unspecified reasons. The analysis shows that most of the losses were caused by false alarms. As we described earlier, most of the fires are not detected because of sensors’ failure and thus progress. Most of the houses examined were equipped with WSN-based fire alarm systems.
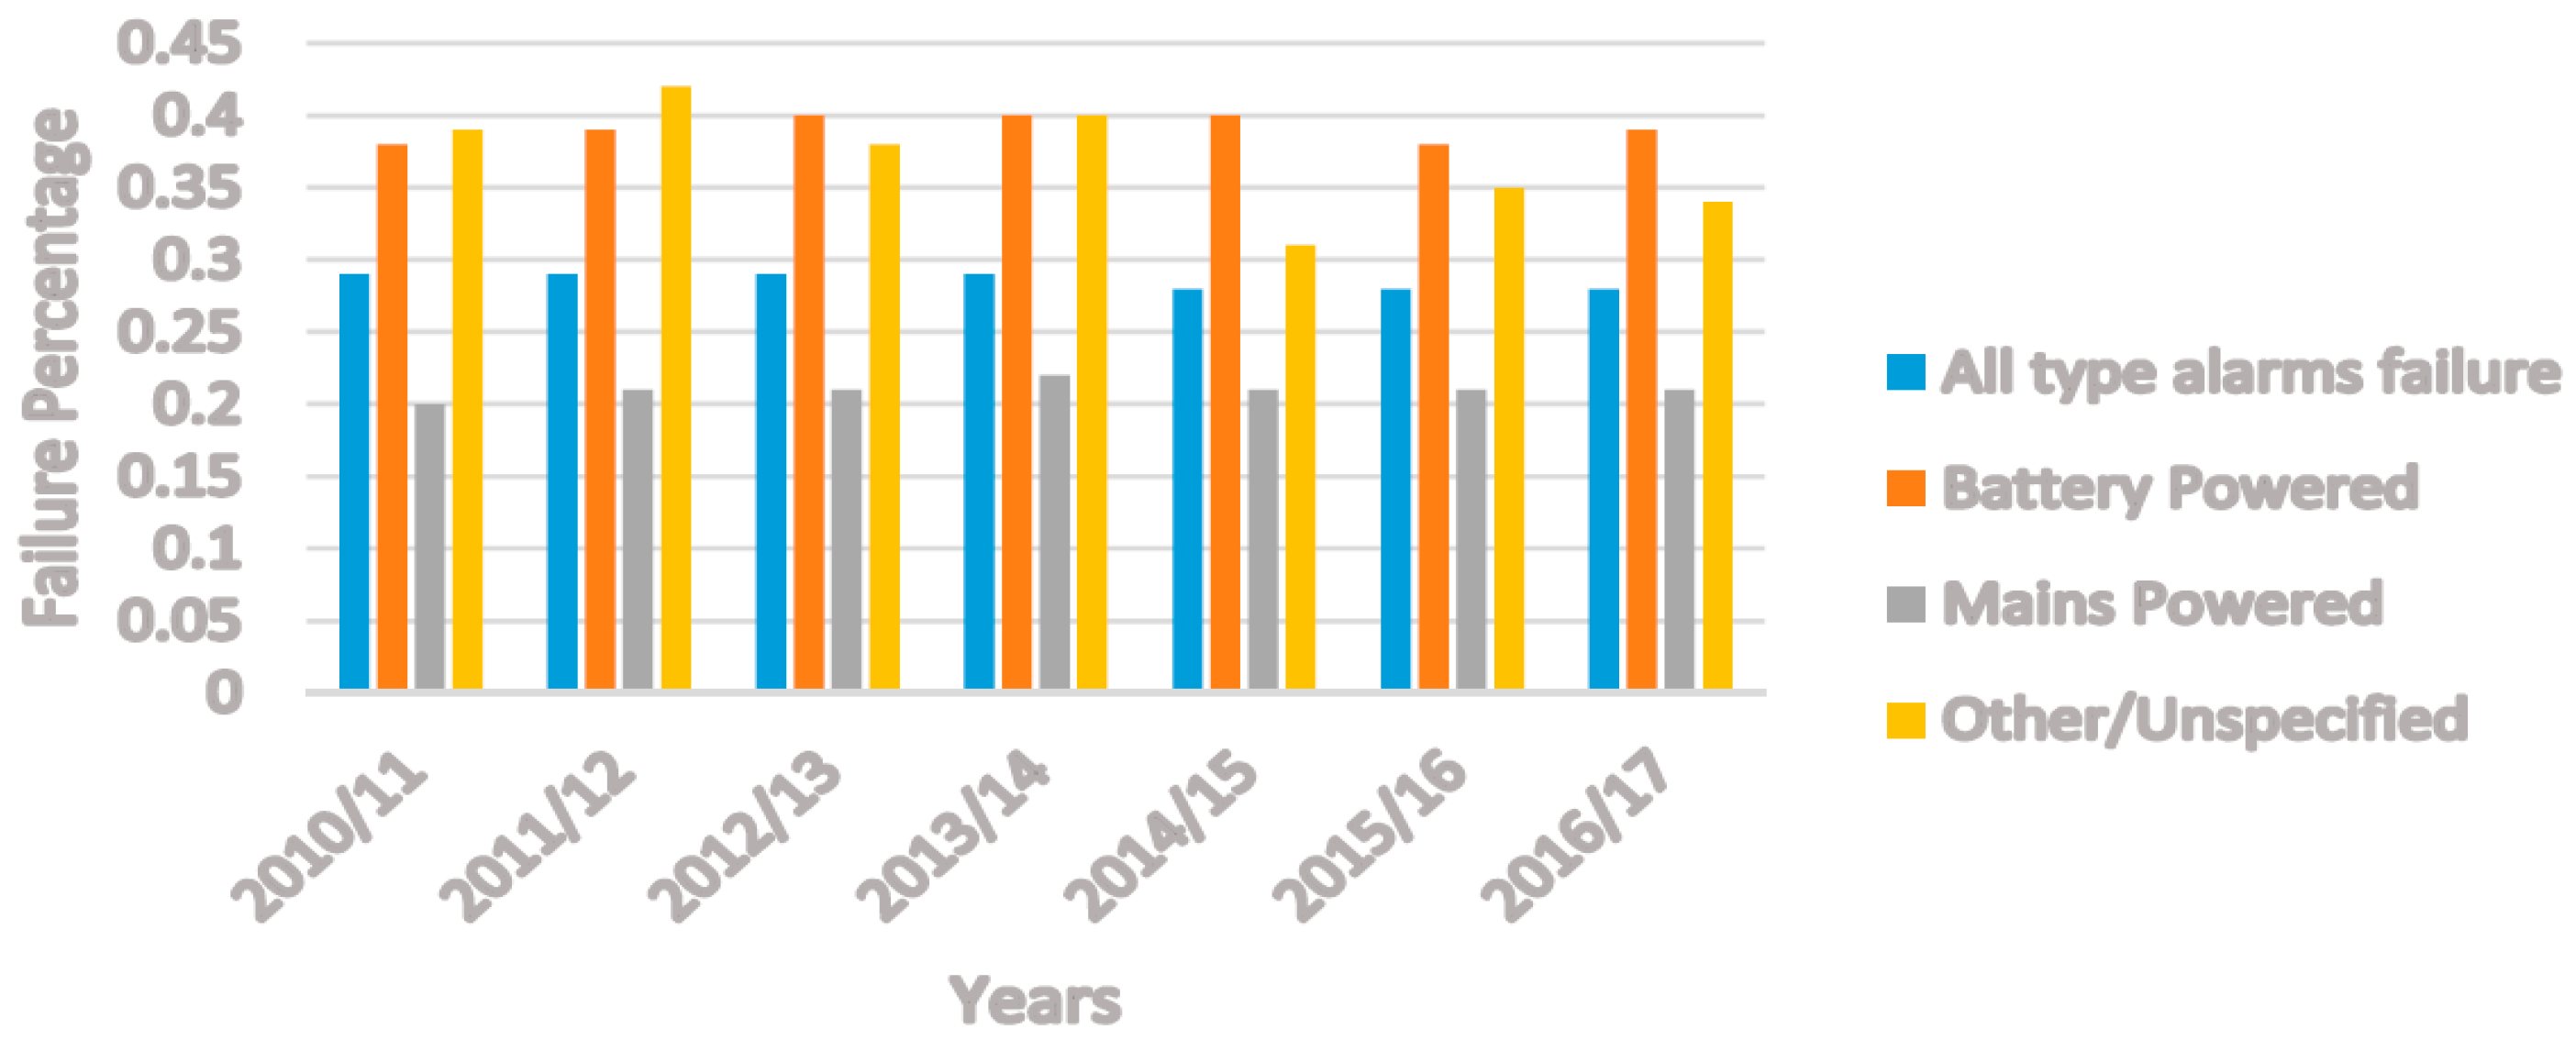
Most of the time, alarm failures are due to the breakdown of the WSN. In the WSN, the association between sensors is essential. Therefore, the communication between sensors cannot be performed if the network is disconnected. So, the failure of a single sensor may result in many harsh events. Most of the sensors are battery-powered and might not have the possibility to recharge. Most of the energy is spent in communication, and, if the sensor energy is exhausted during communication, sensor failure occurs, and this can sometimes lead to network failure. We performed analyses on alarm’s failure in the presence of a fire detector sensor. The analysis results are shown in Figure 4. The analysis graph displays the percentage of true alarm generation and sensors failure with respect to the different categories of sensors from 2010 to 2016.
4. IoT-Based Intelligent Modeling of Smart Home Environment for Fire Prevention and Safety
In this section, we breakdown of our work into four parts. The first unit describes the sensor which collects the information from the environment and transmits it to the second unit, i.e., the processing unit, by using the ZigBee protocol. The third unit is the GSM communication unit, which alerts the users about the event. The fourth unit triggers the alarm. Details of these units are as follows.
4.1. Overview
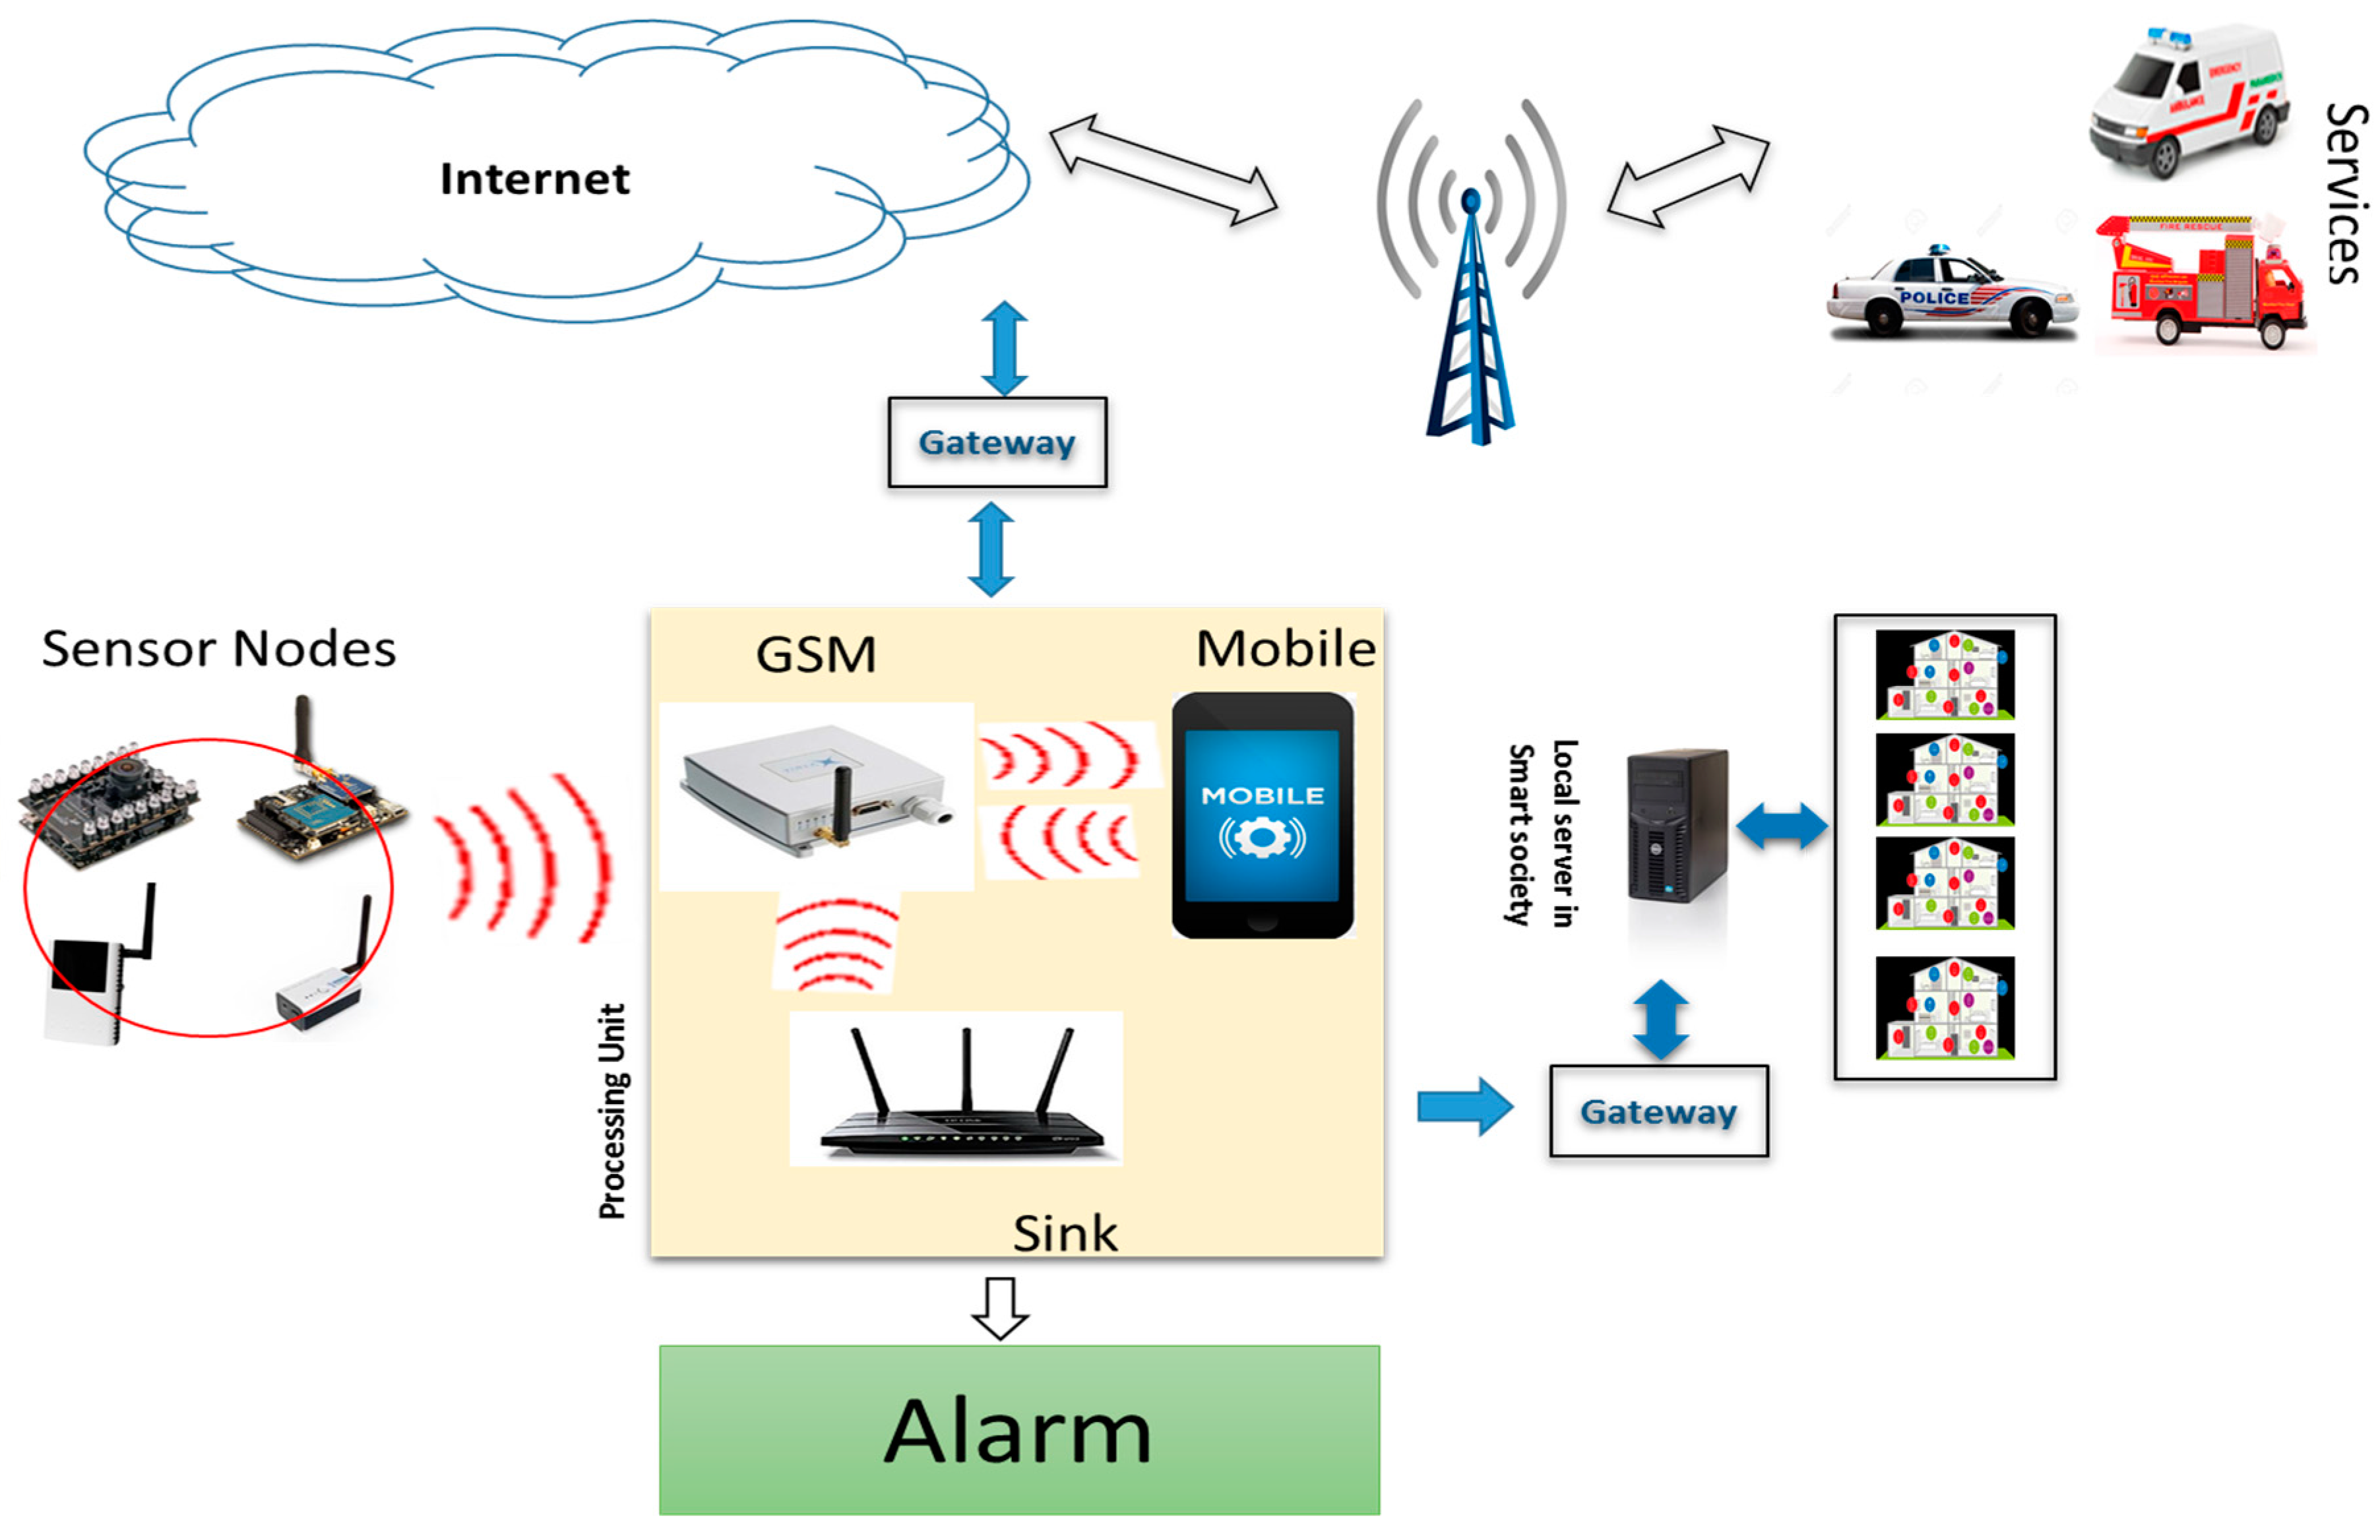
The existing systems have flaws because they contain single unifunctional sensors for each target portion in the residential place. However, if an event occurred in a particular place and the sensor of that region was not working, then it would be highly improbable to detect the incident at its initial stage. The second major problem is the generation of false alarms. The proposed smart home fire detection system consists of four major parts: (i) sensor; (ii) processing unit as the main home sink; (iii) GSM communication system; (iv) alarm system. In the sensor unit, we deployed multi-sensors, i.e., smoke, gas, and heat sensors for each portion of the smart homes. All these sensors have their own event detection mechanism. Figure 5 shows the complete model of our proposed work. The processing unit contains a home sink, which communicates with the sensors through the ZigBee Protocol. The decision of fire detection is taken on the sink on the basis of the information received from the sensors and of the user’s response. If a single sensor node sends fire alert to the sink, it automatically activates the GSM communication and sends an alert message to the user. The sink make decisions on the basis of the user’s response or of the alert notification from the other sensors. After getting confirmation of a fire event either from two or more sensors or from the user, the sink generates an alarm. Simultaneously, the system shares the event information with the cloud and with the local server which helps to spread the information to the basic service units. The local server is connected with the surrounding inhabitants to inform the other houses about the current situation. We present the detail design of each unit in the following subsections.
4.2. Sensors
The products derived from the fire are heat, smoke, gas, or infrared/ultraviolet radiations. The sensors can detect one or more of these phenomena. In our model, we used smoke, gas and heat sensors to detect changes in the above-mentioned aspects. The temperature sensors are mainly designed to detect changes in temperature. Temperature sensors are classified into two classes according to their operations, i.e., (i) rising rate of heat (ii) fixed temperature. The LM35 (Texas instrument, China) is a temperature sensor which is very efficient and highly calibrated. This sensor is used to detect the rise in temperature. It may have attributes such as less heating and low linear impedance. It can operate in the voltage range from 4 V to 30 V which is lower than 60 μA of drain current [38]. The smoke sensors are devices that can detect smoke from a fire. The smoke sensors are packed in a plastic cage varying in size and shape, but mostly disk-shaped, 25 mm thick, and 150 mm in diameter. MQ9 (Henan Hanwei Electronics Co., Ltd., Zhengzhou, China) is a smoke sensor made of microaluminum oxide which is used to detect smoke in a room. In order to detect the smoke, this sensor combines the high sensitiveness of carbon monoxide and a layer of in oxide. It contains very sensitive components, work conditions, and measuring electrodes [39]. During a burning fire, the gases produced (e.g., carbon dioxide, carbon monoxide, and many others) are very hazardous. The devices which are used to detect gases like CO, CO2, etc. are called gas detectors. These devices are used to identify toxic, combustible, flaming gases, and also depletion of oxygen. These devices can be grouped into different classes (infrared, photoionization, catalytic, semiconductors, oxidation, etc.). They are available in two primary forms: (i) portable devices (ii) fixed gas detectors. MH-Z19 NDIR (Zhengzhou Winsen Electronics Technology Co., Ltd., Zhengzhou, China) is an infrared gas detector which is quite common. These sensors are tiny, have a long life, and work on the principle of non-dispersive infrared (NDIR) to detect the presence of carbon-dioxide in the air very efficiently.
In proposed work, we used these three sensors for each sub-portion and set a threshold for these sensors. For the kitchen environment, we used different limits. The sensors sense the environment and collect data in raw form. If the sensed data is higher than a threshold, which is δS, then the sensor reports the information as fire. This report goes to the sink which works as a processing unit that analyzes the report.
4.3. ZigBee as the Used Communication Protocol
To set up the wireless sensor network, it is possible to use different topologies, depending on the number of sensor nodes and communication methods. The four most common topologies are: (i) The peer to peer, (ii) The mesh, (iii) The tree, and (iv) The star network topologies [40]. Comparatively, the star network topology setup is very competent compared to other network topologies. Figure 6b shows the star network topology. For communication between the sensor and the home sink, we used the Zigbee protocol. Figure 6a shows the communication method. ZigBee is based on IEEE 802.15.4 standard specification and uses high-level communication protocols to build personal local area networks. It uses tiny, low powered, digital radio devices and it can be used to transfer data over some limited distance from 10 to 100 m. This distance depends on the environmental conditions, and it varies for different homes. It is considered a low-powered protocol because it needs a minimal amount of energy to receive and transmit data.
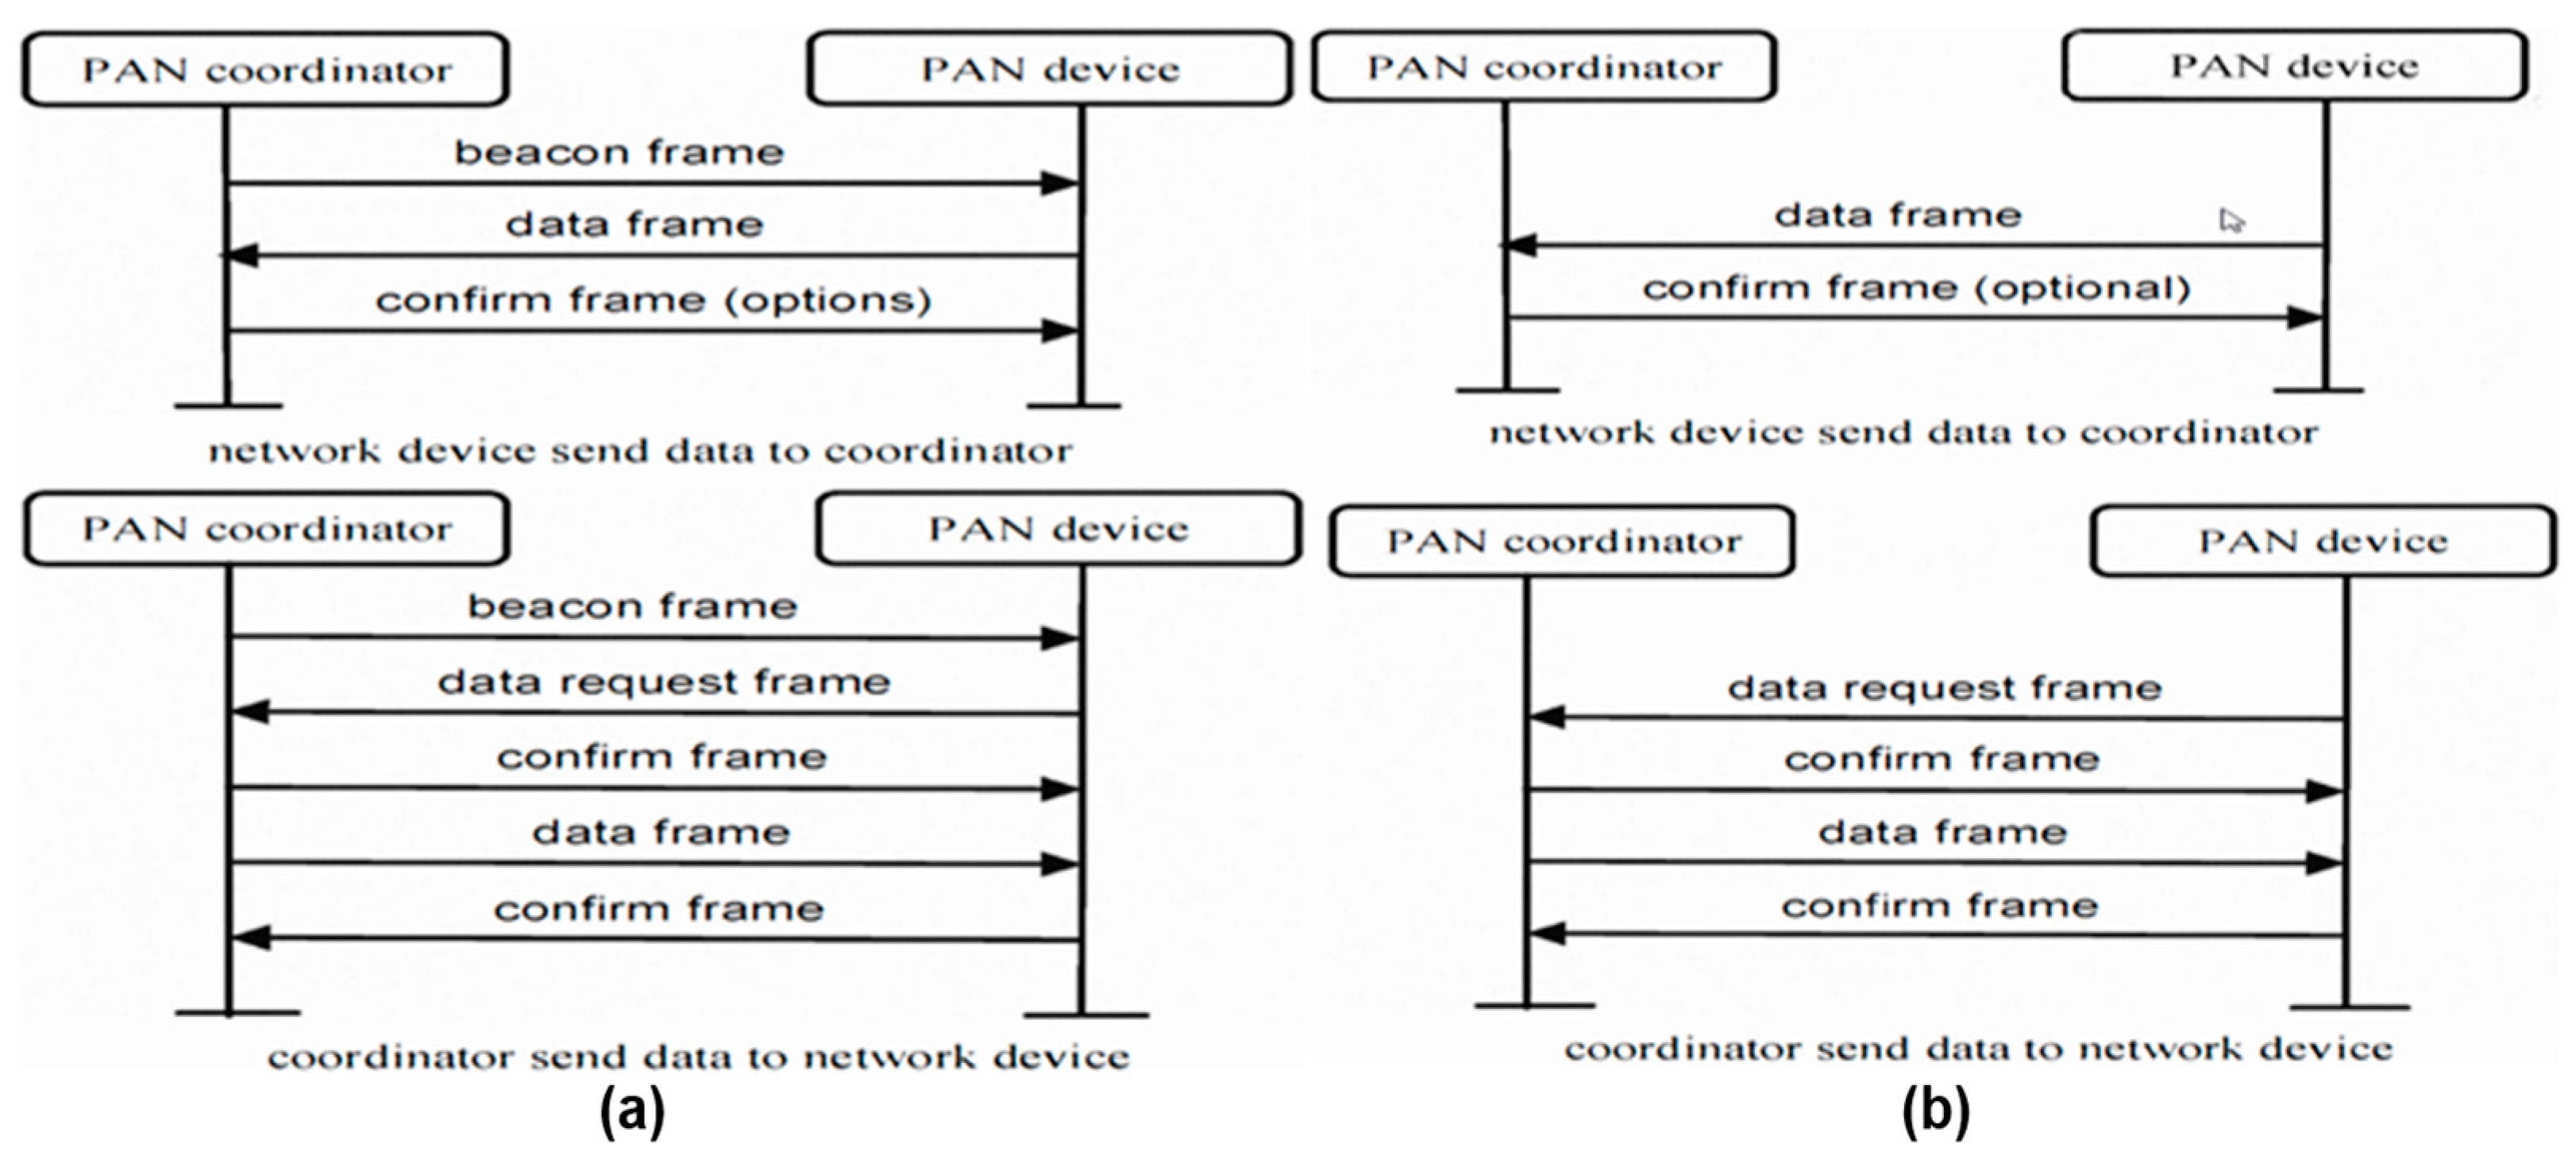
It consumes most of its energy in transmitting the data. This protocol uses different types of devices like: (i) Coordinator; (ii) Router; and (iii) End devices. ZigBee uses as a coding technique the direct sequence spread spectrum, abbreviated as DSSS. Therefore, it uses two primary types of communication modes, i.e., (i) Beacon-enabled and (ii) Non-beacon enabled. The outlines of the beacon-enabled and non-beacon-enabled communication are shown in Figure 7a,b [41]. In beacon-enabled communication, the beacon frames or beacon packets are broadcast periodically by the PAN coordinator [41]. In non-beacon-enabled communication, the PAN coordinator broadcast the beacon packets randomly. When the sensors are in the inactive state or do not send the data, this protocol automatically turns off its interface to save energy. When it sends beacon messages, the nodes remain in the active mode. Usually, beacon intervals are between 15.36 ms and 251.65 ms at the speed of 250 kb/s, but this depends on the data flow rate. By keeping in mind this ZigBee communication model, we used ZigBee for data communication.
4.4. Processing Unit
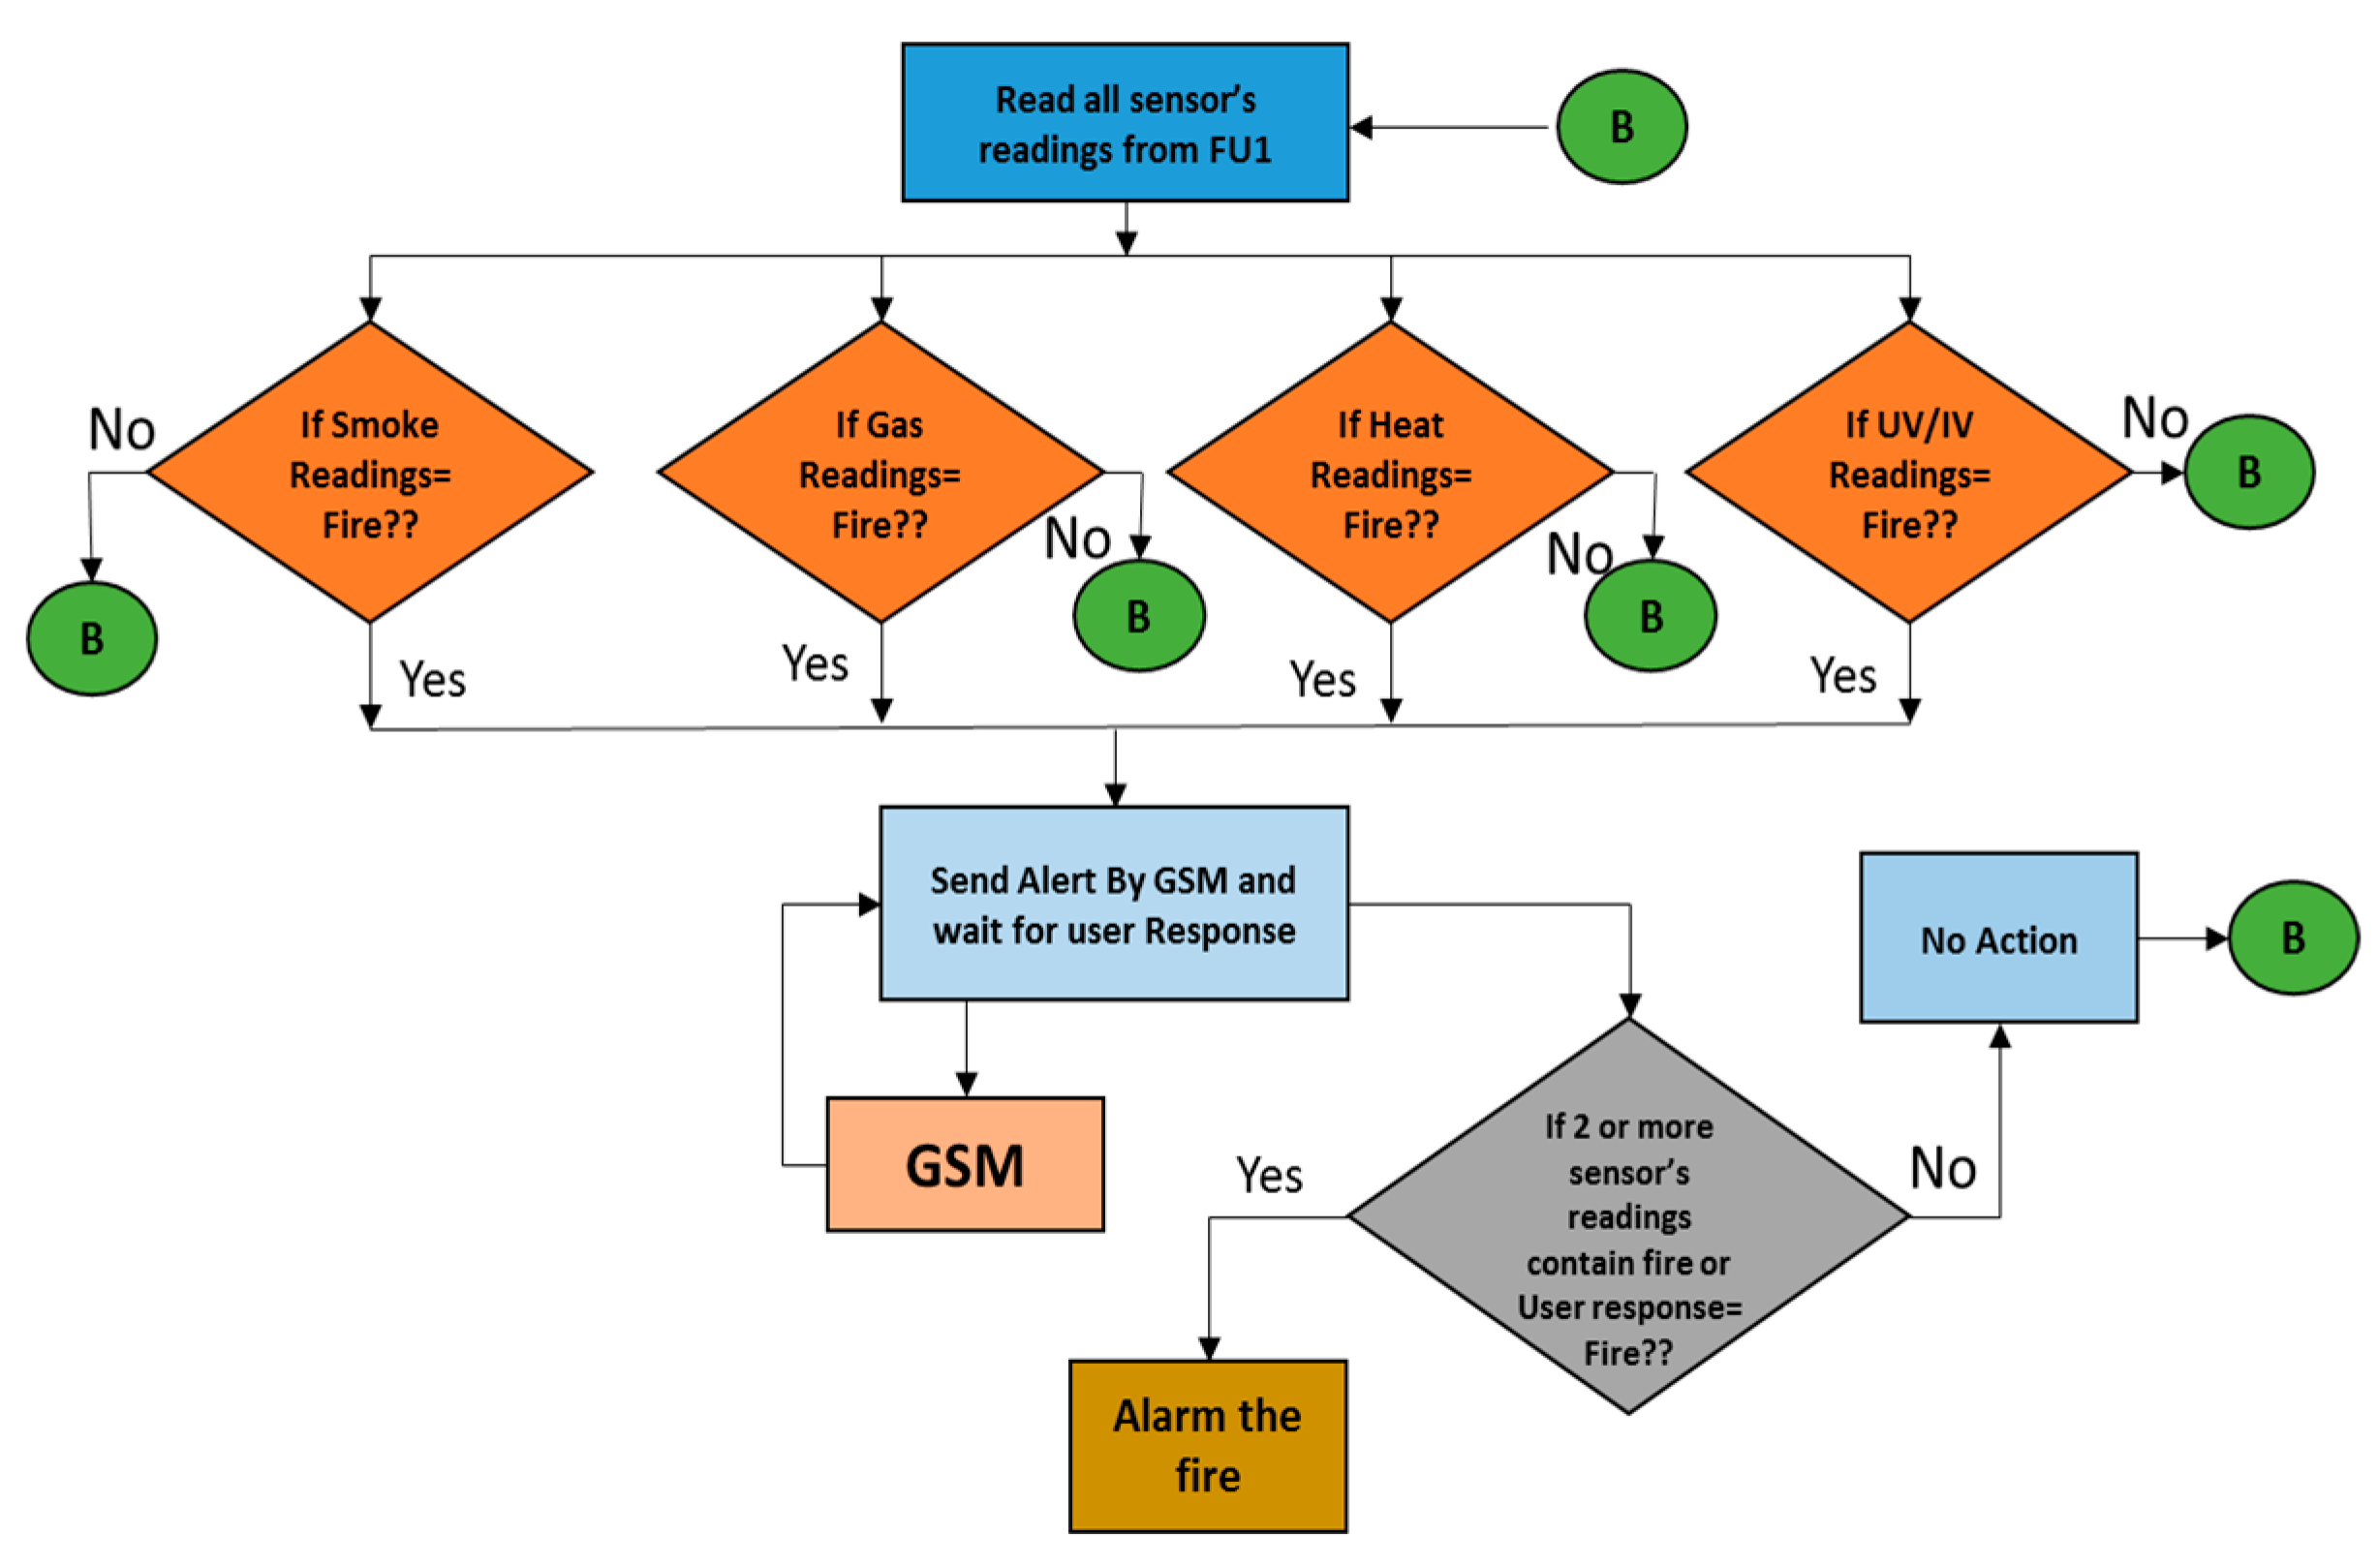
The information collected from the sensors is then sent to central processing hub or main home sink wirelessly. Nowadays raspberry pi, abbreviated as (RPI), is being used as the primary processing unit. The main reasons for choosing it are its popularity and versatile functionalities. This device works as a processing unit and processes the data that comes from sensors to decide whether to activate the alarm. To handle the information which comes from the sensor nodes, RPI starts initializing the modules that are required for that specific processing. For example, in our proposed method, we used SMS alert system via GSM technology and then GPIO general purpose input–output. If the measurements that come from the sensor nodes consist of a fire alert, the GSM module is activated and send an alert SMS automatically to the specific user. The general purpose of the input–output GPIO module is to check the user response to the fire. This response will always be in the form of “yes” or “no”.
If the response is “yes”, this means a fire is present, but if the response is “no”, that means no fire. For each of the deployed sensors in homes, the GSM module gets activated automatically. The final decision of alarm depends on both the user’s response and the sensor’s readings. The flow diagram of this system is shown in Figure 8. If a single sensor’s reading contains a fire alert message, then the system does not make any decision on behalf of this single reading. The system waits for the response to a pre-warning SMS. After receiving a response to the pre-warning SMS, that can be either “yes” or “no”, the alarm will be activated if the response is “yes” or if the system receives the event notification from two or more sensors.
4.5. GSM Module
As the expenses of a false alarm are very high, to avoid this flaw, we used a module, i.e., the GSM. In the kitchen environment, there are more chances of false alarms a, temperature, smoke, gas, and UV or IR radiations are usually present in the atmosphere. Currently, GSM modems such as WaveCom and Multitech have the functionality of the SMS mode. Instead of encoding the binary PDU of messages, this text mode allows the home sink to send a pre-warning alert to the user by using AT commands. The pseudo code for the GSM module is listed below:
- Open serial port of RPi device and connect the 3G modem.
- Set phone number and message content.
- Send “AT” commands for SMS to be sent
- Disconnect phone.
4.6. Algorithm of the System
The algorithm of our proposed work is shown in Algorithm 1 and Table 1. Table 2 shows the notations used in the algorithm.
| Algorithm 1: Proposed Work Algorithm |
|
(1) For each (among all sensors) do IF (Sen_Val > δs) Then Report = 1; Alert(); Next(); Else Report = 0; Next(); //Alert Function Algorithm on right side of the table (2) For each (For all report as fire) do Open(); Connect(); Commands(); Send(Rsp); Disconnect(); //Sink Decision Algorithm (3) IF (Two sensor Report Fire or Response = 1) Alarm(); Else Next(); |
5. Simulation
To evaluate the efficiency and effectiveness of our proposed work, we simulated fire in a smart home using the Fire Dynamic Simulator, abbreviated as FDS [42]. FDS is a tool developed by NIST to simulate a fire in different environments. It is a computer language program which solves Navier–Stokes Equations numerically. It is written in FORTRAN and it takes multiple inputs like: (i) Sensors thresholds; (ii) Initial values of sensors; (iii) Humidity; (iv) Different parameters to design the environment, and many more. By using these inputs, it computes the Navier–Stokes Equations.
Figure 9 shows our simulated work scenario using FDS. We divided the house into four parts, i.e., (i) Bedroom; (ii) Living room; (iii) Kitchen; (iv) TV Lounge. To monitor fire, we examined three different parameters, i.e., temperature, gas, and smoke. For each portion of the house, we used three sensors, while 12 thermocouples were used in whole. The initial inputs of the sensors were 25 °C, 15 ppm, and 60 ppm for temperature, gas, and smoke sensors, respectively. We ignited the fire in the kitchen and we assumed that it started 30 min after the beginning of the simulation. After the fire started, it spread at a rate of 1500 KW/m2.
We performed the simulation for both scenarios, first in the presence of a single unifunctional sensor and then in the presence of the multi-sensor. For the first scenario, we used temperature sensors to monitor the fire. As the fire started from the kitchen, we made this sensor inactive and continued the simulation for 40 min. For the second scenario, we performed the same simulation and setup, as shown in Figure 9. We measured the data generated by the simulation for these two scenarios.
To check the efficiency of our work, we also implemented our proposed method by using C++ programming language. We performed our implementation in visual studio 2017 in which we used C++ libraries. We installed our simulation environment and visual language on a machine with specification “Intel(R) Core(TM) i5-3570 CPU @ 3.40 GHz 3.80 GHz and RAM 16 GB”. The data produced by FDS during fire simulation was used for our algorithm to check the efficiency of our work.
6. Results
While performing the simulation, the system took the initial values of the sensors and the other parameters. We set a threshold for every sensor and used the GSM module to avoid false alarms. The system generates the alarm when two or more sensors value exceed the sensors’ threshold values or if the user response contains a fire confirmation message. The system was tested many times and produced almost zero percent of false alarms. We compared the simulation results with those from other existing techniques to check the efficiency of our proposed method and we found that our system is efficient. We discuss our simulated results in the following subsections.
6.1. Sensor Behavior
We simulated two different scenarios to compare the sensor’s behavior and overcome the problem discussed in this paper. First, we simulated a single-sensor scenario by deploying a temperature sensor for each portion. Then, we used a multi-sensor as in our proposed work. After performing both simulations, two types of data were generated, i.e., (i) data generated during the single-sensor environment simulation; (ii) data generated in the multi-sensor environment simulation. Then, we examined the sensor’s behavior for these datasets, as shown in Figure 10 and Figure 11, respectively. For the first scenario (uni-sensor), we assumed that the fire started from the kitchen, we made kitchen sensor in-active and then checked the behavior of the other sensors. Figure 10 shows the sensors’ behavior in the unifunctional, single sensor simulation. WE found that the kitchen sensor was in-ctive throughout the fire. When the fire and heat spread out, the other sensors deployed in TV lounge, living room, and bedroom started detecting a temperature increase after 8, 14, and 18 min respectively.
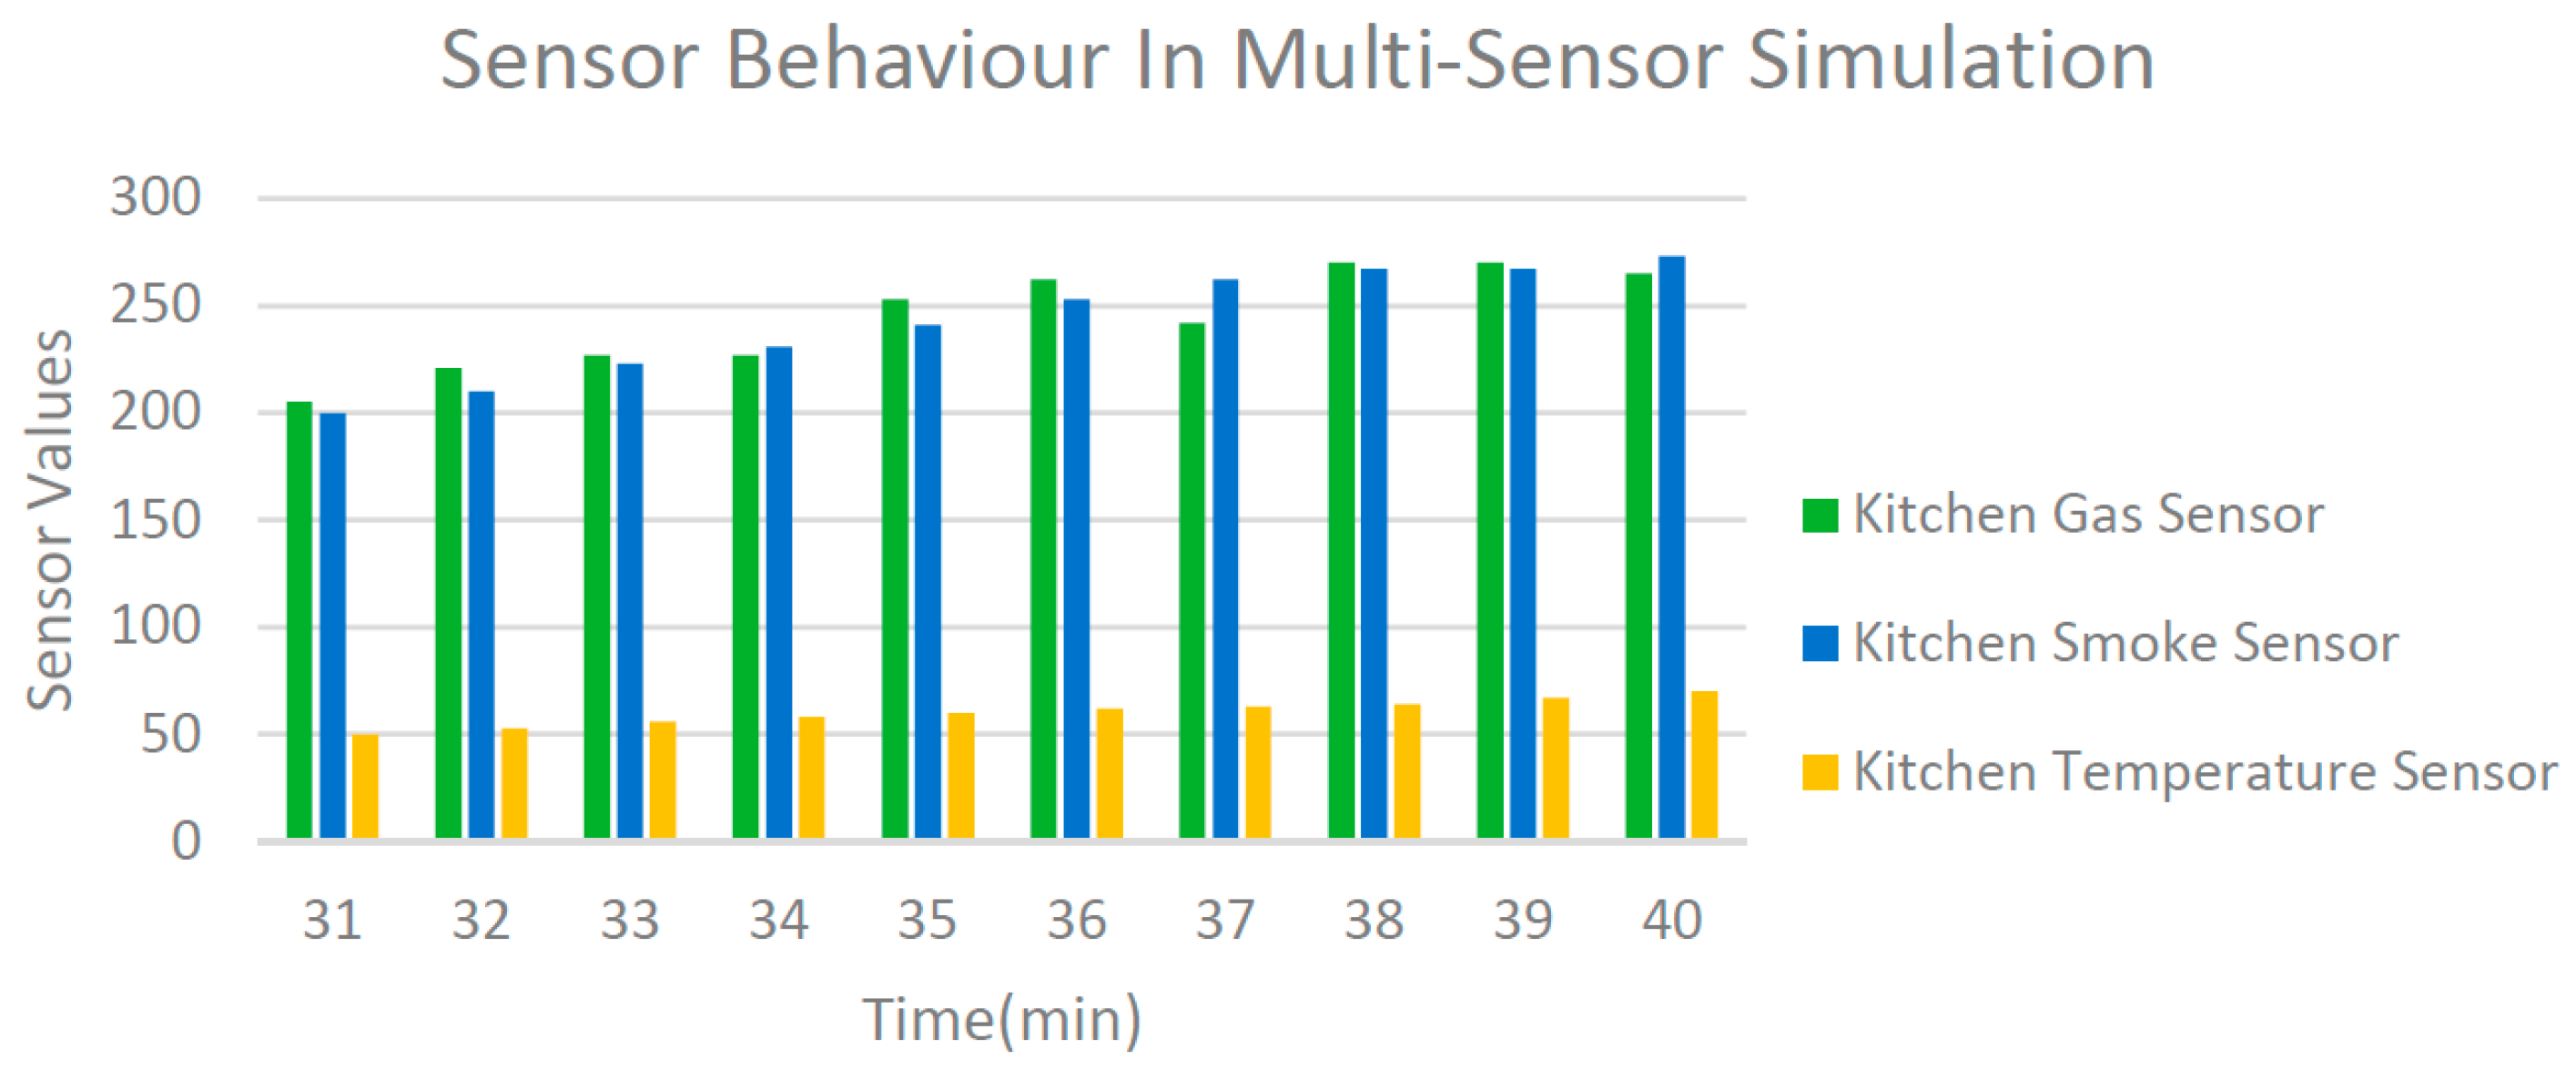
When we simulated and analyzed our multi-sensor system, we found that it detected the event in quite a short time as compared to the single sensor. As the fire started from the kitchen, we analyzed the sensor’s behavior only in the kitchen.
The graph in Figure 11 shows that, when the fire started, the sensor that we deployed in the kitchen started sensing the environment immediately. When the temperature, gas, and smoke values exceed the threshold values, the sensor started sending fire alerts to the sink. The simulation results for GSM communication (that we applied in the visual studio) that we used to verify our implemented algorithm are shown in Table 3. We performed five experiments to examine the efficiency of our system. The experiments showed that our method is efficient and accurate. We made a comparison with the existing systems in Table 4.
6.2. Energy Consumption
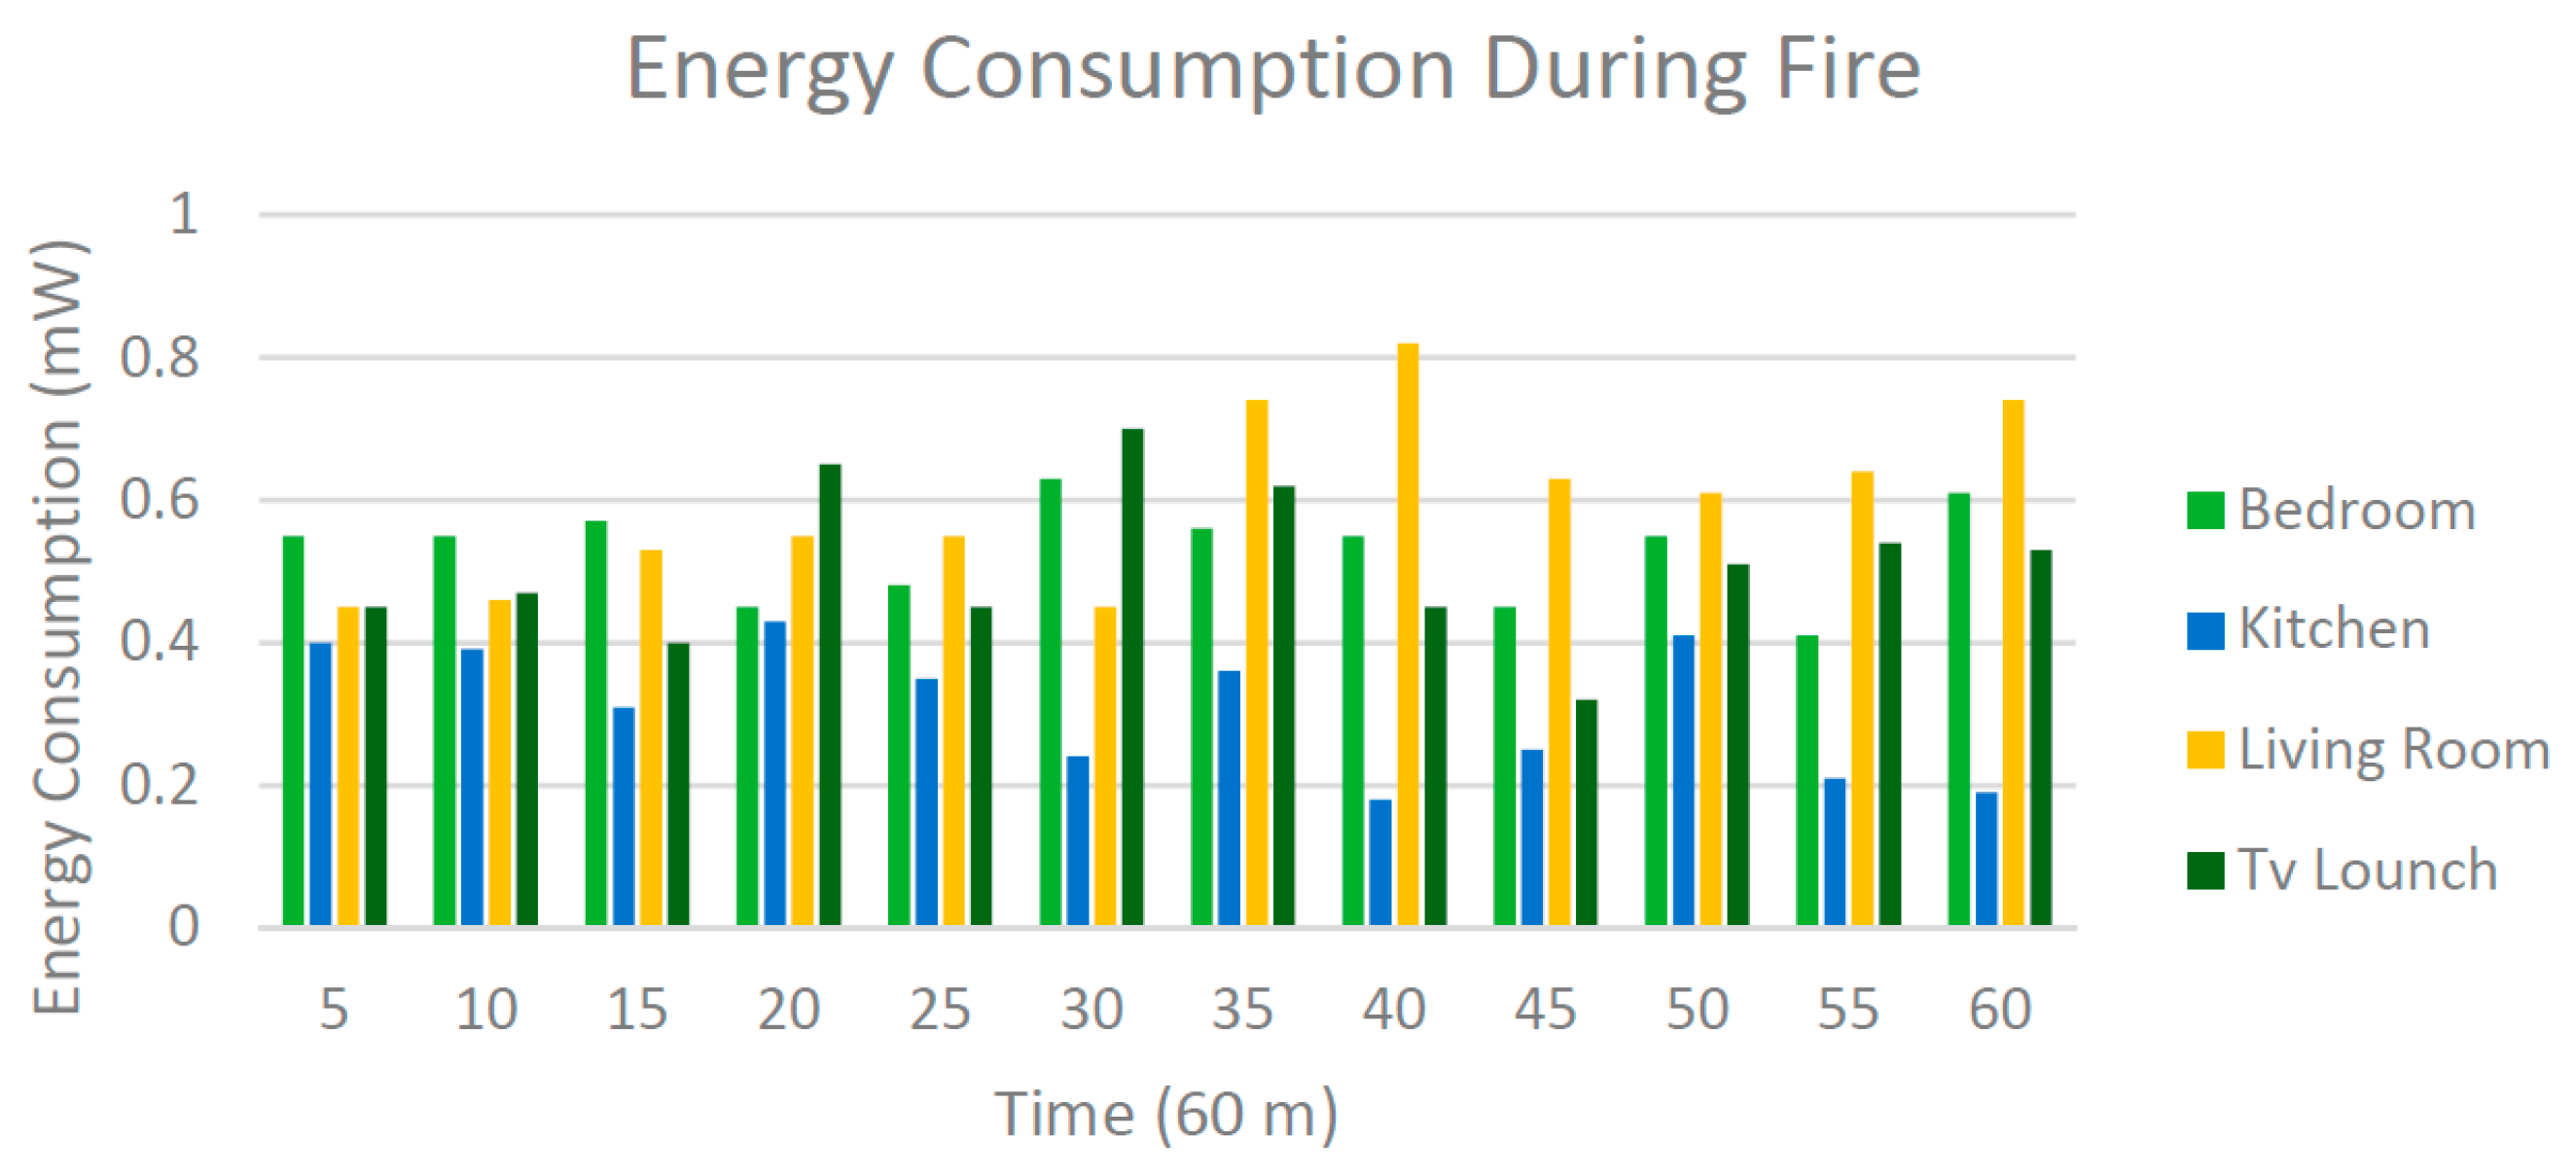
As we considered the setup of the house, consisting of four rooms, e.g., kitchen, TV launch, living room, and bedroom, we calculated the average energy consumption by the ZigBee sensors for a duration of 12 h for a 50% and 100% duty cycle. We also computed the energy consumption for our proposed approach and compared it with the 50% and 100% duty cycle, and the results are shown in Figure 12. Duty cycles of 100% and 50% indicate the time when the radio interface remains in the active state. An energy-efficient communication stack has a duty cycle less than 1%. The sensors used in each room had a pair of AA batteries (3000 mAh). The total energy consumption of the sensors during 12 h was calculated (for both 50% and 100% duty cycles), and the results are presented in Figure 12. The energy consumption of the ZigBee sensor was within the limit. A pair of three sensors were deployed in each portion, e.g., for the kitchen, we used temperature, smoke, and gas sensors, as in the other rooms. The energy consumption of these sensors was calculated in our proposed approach. Figure 13 shows the results for energy consumption. The sensors used in some rooms consumed high energy compared with the sensors in others rooms. More energy was consumed during the morning, afternoon, and evening. We also calculated the energy consumption of the sensors during the fire event. Figure 14 shows the energy consumption during one hour of fire. It shows that more energy was consumed during the fire.
7. Conclusions
The primary objective of the proposed work was to design an intelligent analysis of smart home for fire prevention. Two major flaws of the currently used systems are: (a) the fire prevention systems mostly use a single sensor for event detection but problems arise if the target sensor does not detect the event; (b) false alarms can be generated. Overall our proposed method provides a solution to these problems. We introduced an efficient technique to overcome these problems. We used multi-sensors for each region in smart homes. To reduce the false alarms, we used the GSM communication system. The purpose of GSM communication was to alert the user at the very initial time of the fire. Fire detection decisions were made by the main home sink connected with all the sensors wirelessly. The decision was made on the basis of the sensor’s values or the user’s response. We simulated fire in FDS that was designed by NIST, and the generated results of the simulation were analyzed by our proposed algorithm that we implemented in Visual Studio using C++ libraries programming language. The simulators were installed on a machine with the following specification: Intel(R) Core(TM) i5-3570 CPU @ 3.40 GHz 3.80 GHz, and RAM 16 GB. The energy consumption of the deployed sensors was also computed, and we noticed that it was within an acceptable limit. The results and other evaluations showed that our proposed work fulfills all the desired requirements. In the future, as we used multi-sensors for the detection of fire and the amount of data generated by the sensors during a fire was high, we will work to find a method that deals with this high amount of data efficiently.
Acknowledgments
This study was supported by a National Research Foundation of Korea (NRF) grant funded by the Korean government (NRF-2017R1C1B5017464). This study was also supported by a National Research Foundation of Korea (NRF) grant funded by the Korean government (MSIP) (NRF-2016R1A2A1A05005459). The grant covered the research work and the publication costs for open access publishing.
Author Contributions
Faisal Saeed prepared the comparative analysis report. Anand Paul established the entire framework of the study and selected the tools to be used. Won Hwa Hong reviewed this work and suggested improving it by making use of various datasets. Hyuncheol Seo and Abdul Rehman used the selected tools to perform the simulations.
Conflicts of Interest
The authors declare no conflict of interest.
References
- Bhatti, S.; Xu, J.; Memon, M. Clustering and fault tolerance for target tracking using wireless sensor networks. IET Wirel. Sens. Syst. 2011, 1, 66–73. [Google Scholar] [CrossRef]
- Li, W.; Zhang, W. Sensor selection for improving accuracy of target localisation in wireless visual sensor networks. IET Wirel. Sens. Syst. 2012, 2, 293–301. [Google Scholar] [CrossRef]
- Pagano, S.; Peirani, S.; Valle, M. Indoor ranging and localisation algorithm based on received signal strength indicator using statistic parameters for wireless sensor networks. IET Wirel. Sens. Syst. 2015, 5, 243–249. [Google Scholar] [CrossRef]
- Rathore, M.M.; Ahmad, A.; Paul, A.; Wan, J.; Zhang, D. Real-time medical emergency response system: Exploiting IoT and big data for public health. J. Med. Syst. 2016, 40, 283. [Google Scholar] [CrossRef] [PubMed]
- Rathore, M.M.; Paul, A.; Ahmad, A.; Anisetti, M.; Jeon, G. Hadoop-Based Intelligent Care System (HICS): Analytical approach for big data in IoT. ACM Trans. Int. Technol. 2017, 18, 8. [Google Scholar] [CrossRef]
- Rathore, M.M.; Paul, A.; Hong, W.H.; Seo, H.; Awan, I.; Saeed, S. Exploiting IoT and big data analytics: Defining smart digital city using real-time urban data. Sustain. Cities Soc. 2017. [Google Scholar] [CrossRef]
- Yick, J.; Mukherjee, B.; Ghosal, D. Wireless sensor network survey. Comput. Netw. 2008, 52, 2292–2330. [Google Scholar] [CrossRef]
- Potter, C.H.; Hancke, G.P.; Silva, B.J. Machine-to-Machine: Possible applications in industrial networks. In Proceedings of the 2013 IEEE International Conference on Industrial Technology (ICIT), Cape Town, South Africa, 25–28 February 2013; pp. 1321–1326. [Google Scholar]
- Opperman, C.A.; Hancke, G.P. Using NFC-enabled phones for remote data acquisition and digital control. In Proceedings of the IEEE AFRICON 2011, Livingstone, Zambia, 13–15 September 2011; pp. 1–6. [Google Scholar]
- Kumar, A.; Hancke, G.P. An energy-efficient smart comfort sensing system based on the IEEE 1451 standard for green buildings. IEEE Sens. J. 2014, 14, 4245–4252. [Google Scholar] [CrossRef]
- Kumar, A.; Hancke, G.P. A Zigbee-based animal health monitoring system. IEEE Sens. J. 2015, 5, 610–617. [Google Scholar] [CrossRef]
- Rathore, M.M.; Paul, A.; Ahmad, A.; Jeon, G. IoT-based big data: From smart city towards next generation super city planning. Int. J. Semant. Web. Inform. Syst. 2017, 13, 28–47. [Google Scholar] [CrossRef]
- Blake, D. Aircraft Cargo Compartment Smoke Detector Alarm Incidents on US-Registered Aircraft, 1974–1999; DOT/FAA/AR-TN00/29; Federal Aviation Administration: Washington, DC, USA, 2000. [Google Scholar]
- Silva, B.; Fisher, R.M.; Kumar, A.; Hancke, G.P. Experimental link quality characterization of wireless sensor networks for underground monitoring. IEEE Trans. Ind. Inform. 2015, 11, 1099–1110. [Google Scholar] [CrossRef]
- Chiwewe, T.M.; Mbuya, C.F.; Hancke, G.P. Using cognitive radio for interference-resistant industrial wireless sensor networks: An overview. IEEE Trans. Ind. Inform. 2015, 11, 1466–1481. [Google Scholar] [CrossRef]
- Buratti, C.; Conti, A.; Dardari, D.; Verdone, R. An overview on wireless sensor networks technology and evolution. Sensors 2009, 9, 6869–6896. [Google Scholar] [CrossRef] [PubMed]
- Tan, W.; Wang, Q.; Huang, H.; Guo, Y.; Zhan, G. Mine Fire Detection System Based on Wireless Sensor Networks. In Proceedings of the Conference on Information Acquisition (ICIA’07), Seogwipo-si, Korea, 8–11 July 2007. [Google Scholar]
- Zhang, J.; Li, W.; Han, N.; Kan, J. Forest fire detection system based on a ZigBee wireless sensor network. Front. For. China 2008, 3, 369–374. [Google Scholar] [CrossRef]
- Arrue, B.C.; Ollero, A.; De Dios, JM. An intelligent system for false alarm reduction in infrared forest-fire detection. IEEE Intell. Syst. Appl. 2000, 15, 64–73. [Google Scholar] [CrossRef]
- Rehman, A.; Din, S.; Paul, A.; Ahmad, W. An Algorithm for Alleviating the Effect of Hotspot on Throughput in Wireless Sensor Networks. In Proceedings of the IEEE 42nd Conference on Local Computer Networks Workshops (LCN Workshops), Singapore, 9–12 October 2017; pp. 170–174. [Google Scholar] [CrossRef]
- Son, B.; Her, Y.S.; Kim, J.G. A design and implementation of forest-fires surveillance system based on wireless sensor networks for South Korea Mountains. Int. J. Comput. Sci. Netw. Secur. 2006, 6, 124–130. [Google Scholar]
- Lloret, J.; Garcia, M.; Bri, D.; Sendra, S. A wireless sensor network deployment for rural and forest fire detection and verification. Sensors 2009, 9, 8722–8747. [Google Scholar] [CrossRef] [PubMed]
- Aslan, Y.E.; Korpeoglu, I.; Ulusoy, Ö. A framework for use of wireless sensor networks in forest fire detection and monitoring. Comput. Environ. Urban Syst. 2012, 36, 614–625. [Google Scholar] [CrossRef] [Green Version]
- Wenning, B.L.; Pesch, D.; Timm-Giel, A.; Görg, C. Environmental monitoring aware routing: Making environmental sensor networks more robust. Telecommun. Syst. 2010, 43, 3–11. [Google Scholar] [CrossRef]
- Musolesi, M.; Hailes, S.; Mascolo, C. Adaptive routing for intermittently connected mobile ad hoc networks. In Proceedings of the Sixth IEEE International Symposium on World of wireless mobile and multimedia networks, Taormina-Giardini Naxos, Italy, 16 June 2005. [Google Scholar]
- García, E.M.; Serna, M.Á.; Bermúdez, A.; Casado, R. Simulating a WSN-based wildfire fighting support system. In Proceedings of the International Symposium on Parallel and Distributed Processing with Applications, Sydney, NSW, Australia, 10–12 December 2008. [Google Scholar]
- Koubaa, A.; Cunha, A.; Alves, M. A time division beacon scheduling mechanism for IEEE 802.15. 4/ZigBee cluster-tree wireless sensor networks. In Proceedings of the 19th Euromicro Conference on Real-Time Systems, Pisa, Italy, 4–6 July 2007; pp. 125–135. [Google Scholar]
- Gul, J.; Mushtaq, S.; Riaz, R. Optimal guard node placement using SGLD and energy factor. J. Comput. 2012, 4, 87–92. [Google Scholar]
- Liu, B.H.; Nguyen, N.T.; Pham, V.T.; Wang, W.S. Constrained node-weighted Steiner tree based algorithms for constructing a wireless sensor network to cover maximum weighted critical square grids. Comput. Commun. 2016, 81, 52–60. [Google Scholar] [CrossRef]
- Nguyen, N.T.; Liu, B.H.; Pham, V.T.; Luo, Y.S. On maximizing the lifetime for data aggregation in wireless sensor networks using virtual data aggregation trees. Comput. Netw. 2016, 105, 99–110. [Google Scholar] [CrossRef]
- Paul, A.; Daniel, A.; Ahmad, A.; Rho, S. Cooperative cognitive intelligence for internet of vehicles. IEEE Syst. J. 2015, 11, 1249–1258. [Google Scholar] [CrossRef]
- Paul, A.; Ahmad, A.; Rathore, M.M.; Jabbar, S. Smartbuddy: Defining human behaviors using big data analytics in social internet of things. IEEE Wirel. Commun. 2016, 23, 68–74. [Google Scholar] [CrossRef]
- Paul, A. Real-Time Power Management for Embedded M2M Using Intelligent Learning Methods. ACM Trans. Embed. Comput. Syst. 2014, 13, 1–22. [Google Scholar] [CrossRef]
- Paul, A.; Victoire, T.A.A.; Jeyakumar, A.E. Particle swarm approach for retiming in VLSI. In Proceedings of the 2003 IEEE 46th Midwest Symposium on Circuits and Systems, Cairo, Egypt, 27–30 December 2003. [Google Scholar]
- Paul, A.; Rho, S. Probabilistic model for M2M in IoT networking and communication. Telecommun. Syst. 2016, 62, 59–66. [Google Scholar] [CrossRef]
- DATA.GOV.UK. Available online: https://data.gov.uk/dataset/fire-statistics-smoke-alarms (accessed on 11 November 2017).
- U.S. Fire Administration. Available online: https://www.usfa.fema.gov/data/statistics/order_download_data.html (accessed on 22 October 2017).
- Instruments, T. LM35 Precision Centigrade Temperature Sensors. Available online: www.ti.com/lit/ds/symlink/lm35.pdf (accessed on 12 October 2017).
- Henan Hanwei Electronics Co., Ltd. MQ-9 Semiconductor Sensor for CO/Combustible Gas. Available online: www.pololu.com/file/0J314/MQ9.pdf (accessed on 12 October 2017).
- Kosmerchock, S. Wireless Sensor Network Topologies. Available online: http://www.k5systems.com/TP0001_v1.pdf (accessed on 15 December 2017).
- Zhou, M.; Nie, Z.L. Analysis and design of ZigBee MAC layers protocol. In Proceedings of the International Conference on Future Information Technology and Management Engineering (FITME), Changzhou, China, 9–10 October 2010. [Google Scholar]
- McGrattan, K.; Hostikka, S.; Floyd, J.; Baum, H.; McDermott, R. Fire Dynamics Simulator (Version 5), Technical Reference Guide; National Institute of Standards and Technology: Gaithersburg, MD, USA, 2004; Volume 5. [Google Scholar]
Figure 1.
Percentage of houses owing fire alarms per year.

Figure 2.
Fire deaths per million people.
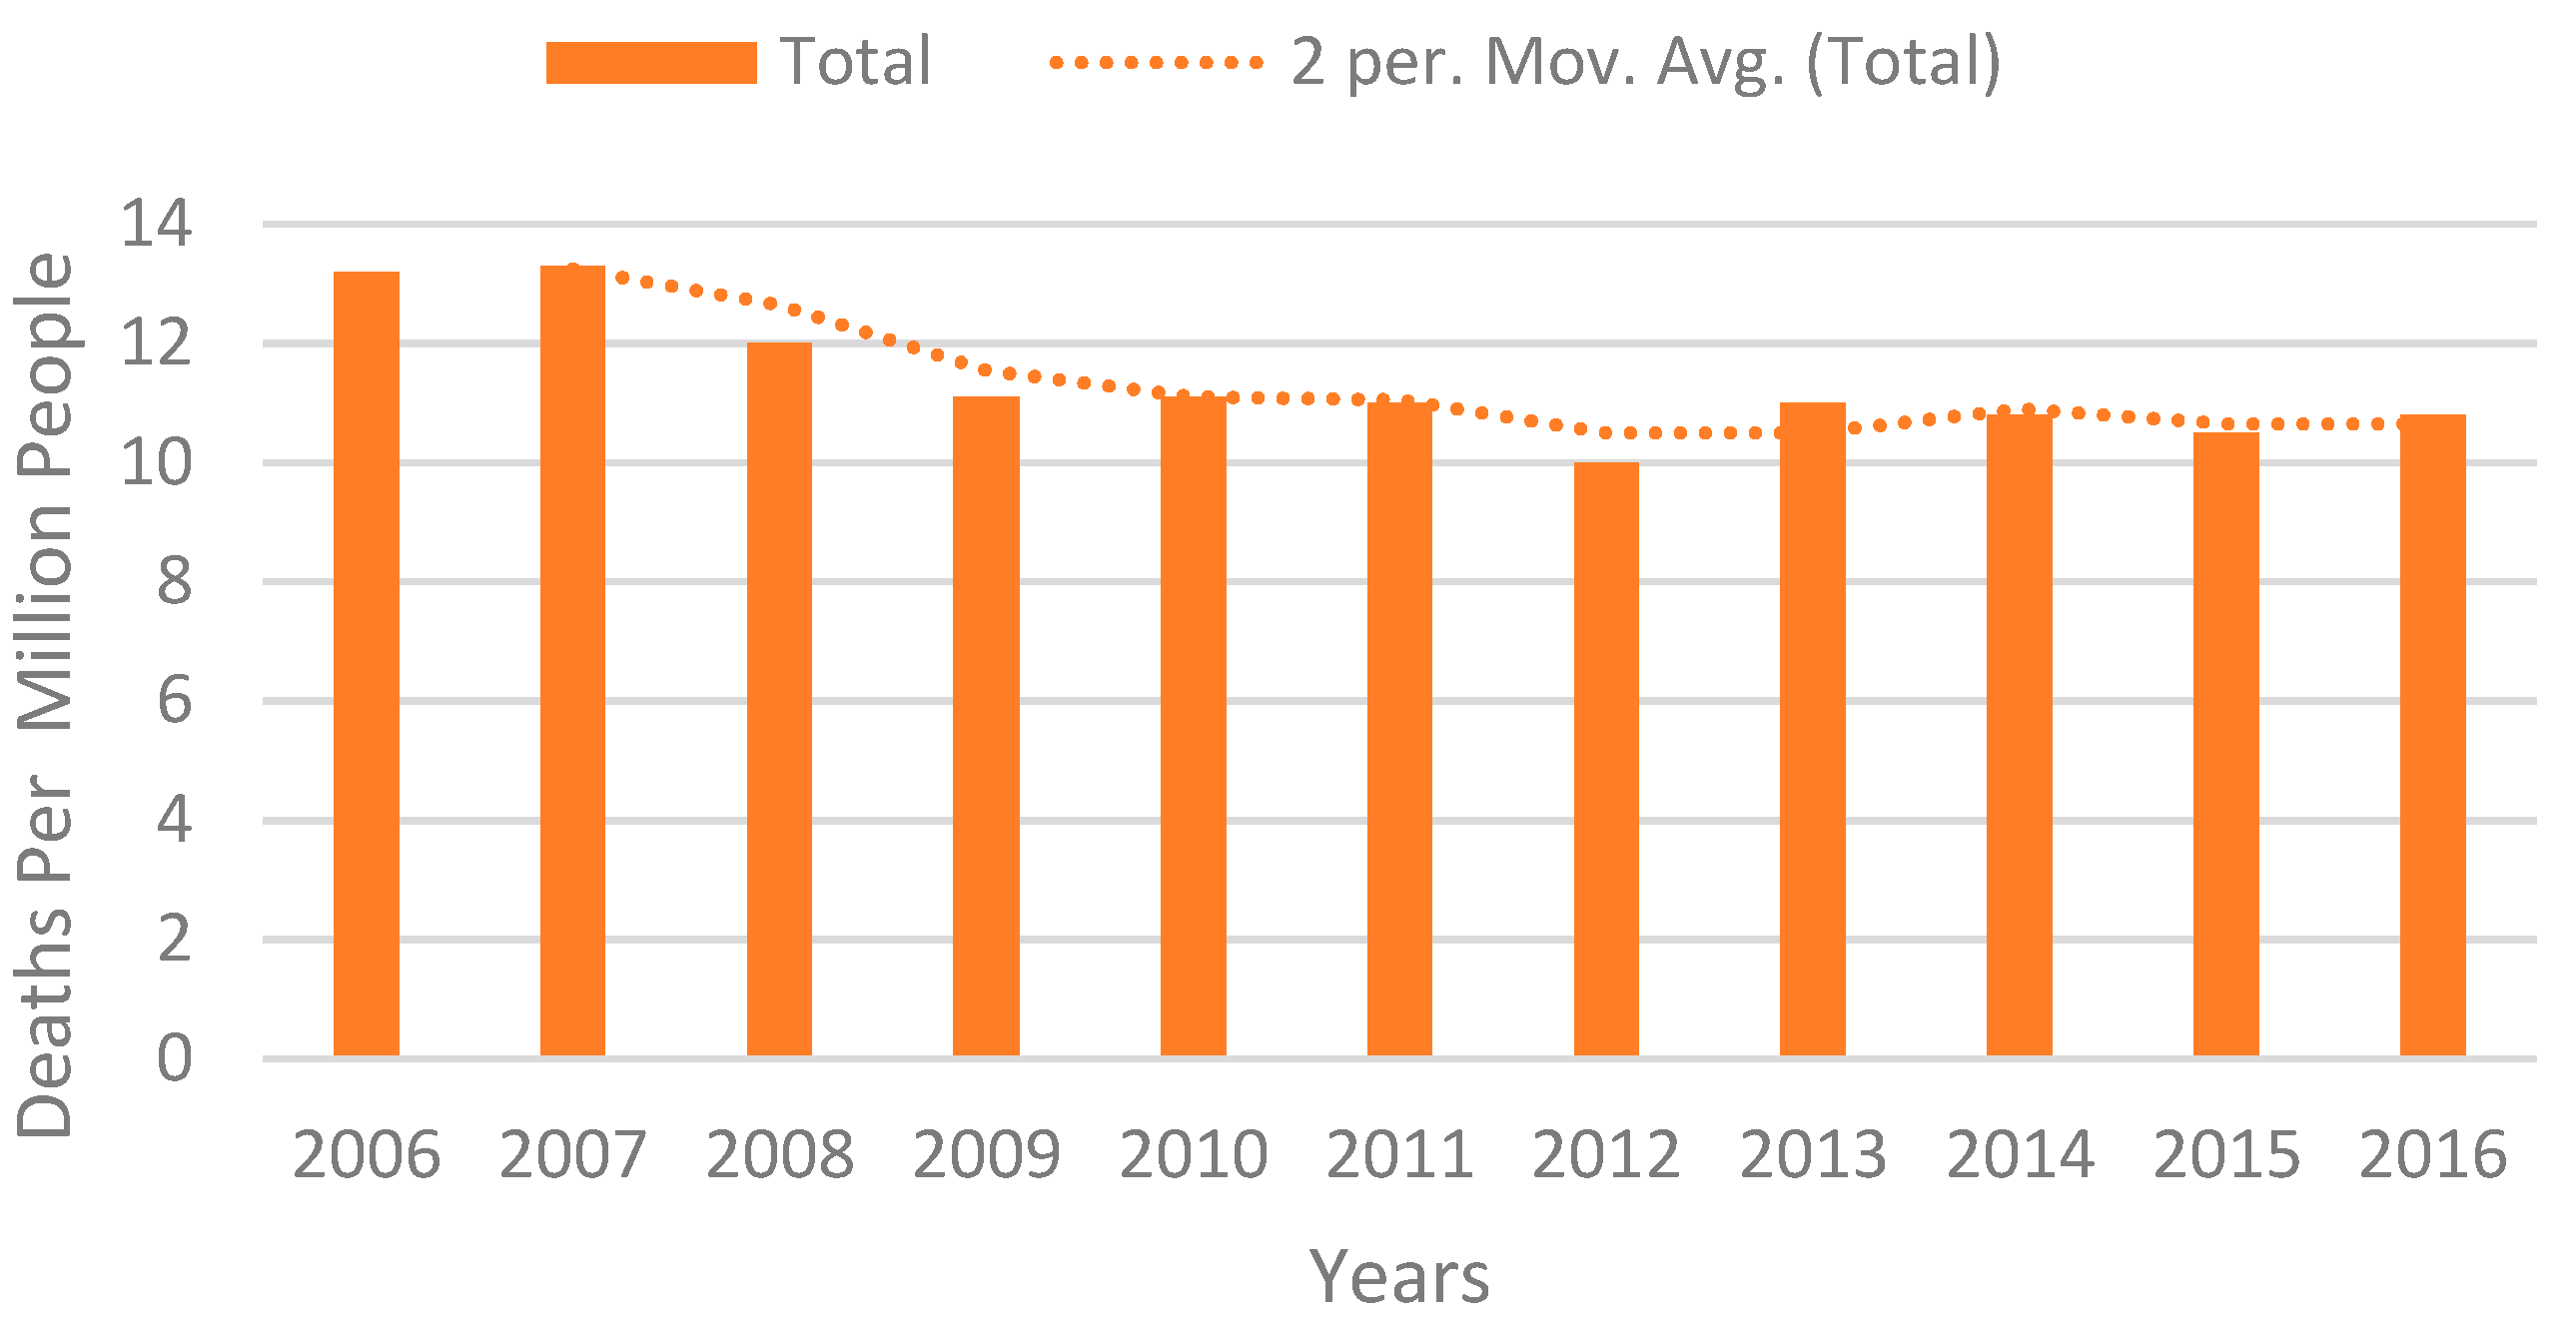
Figure 3.
Fire loss ratio by cause.
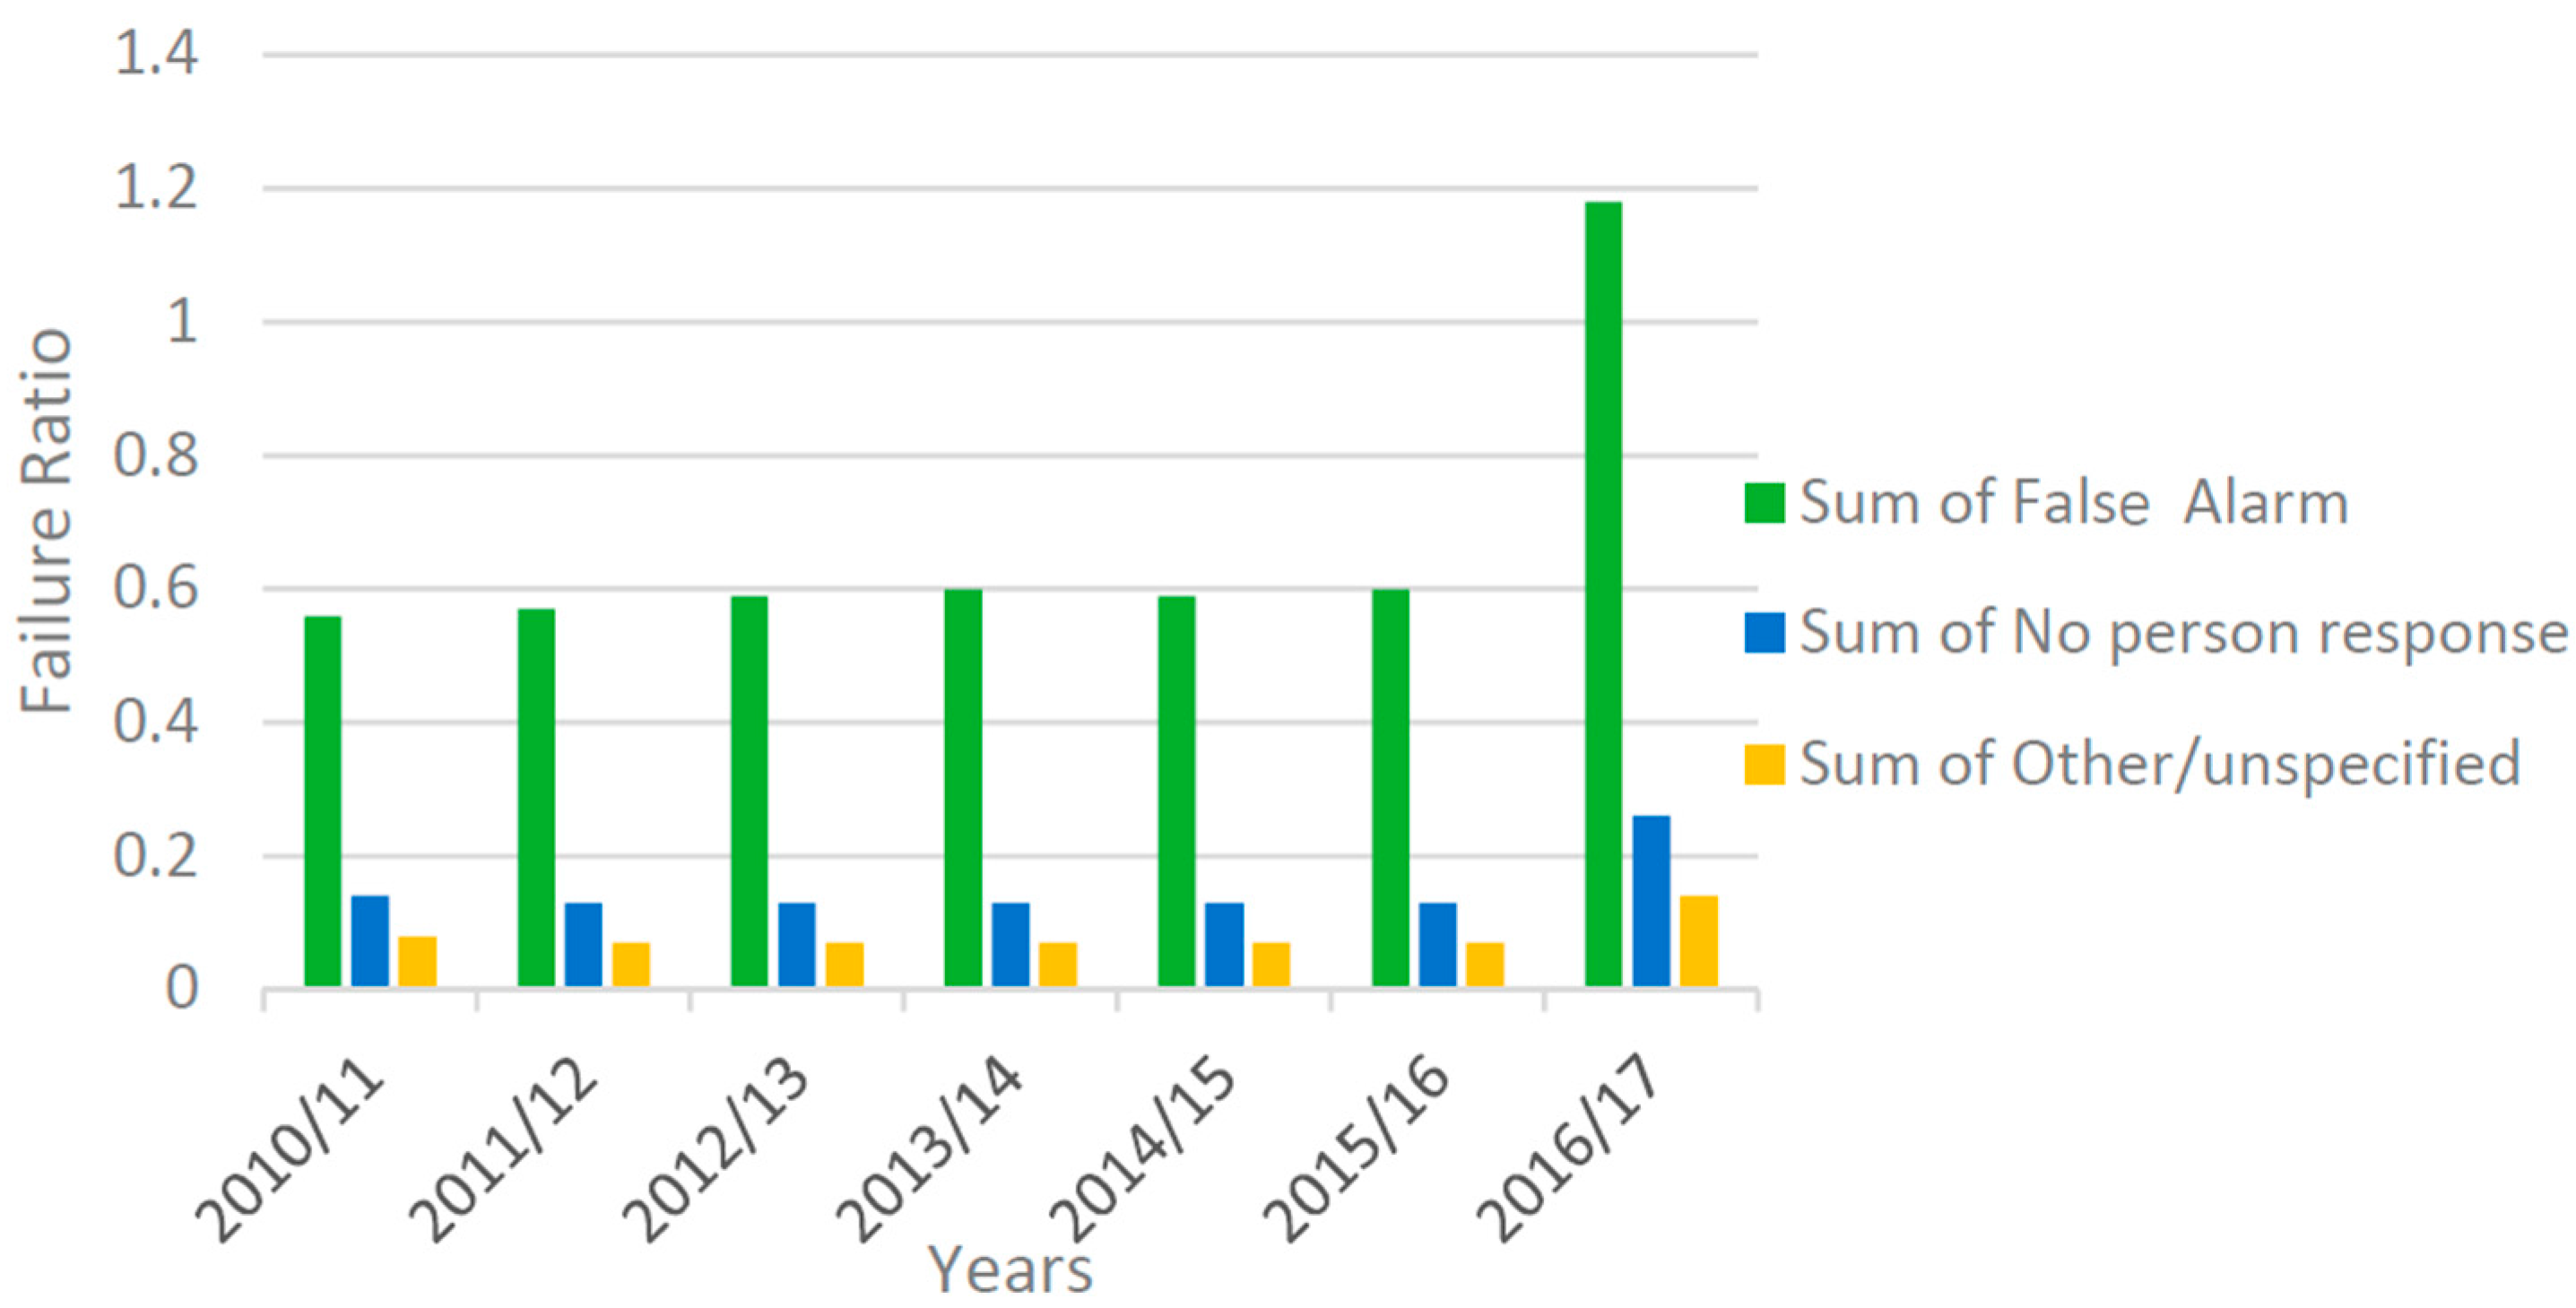
Figure 4.
Fire failure ratios by types.

Figure 5.
Skeleton of IoT-based intelligent modeling of smart home for fire prevention.

Figure 6.
(a) Flow diagram of the Wireless Sensor Node (b) Star topology.
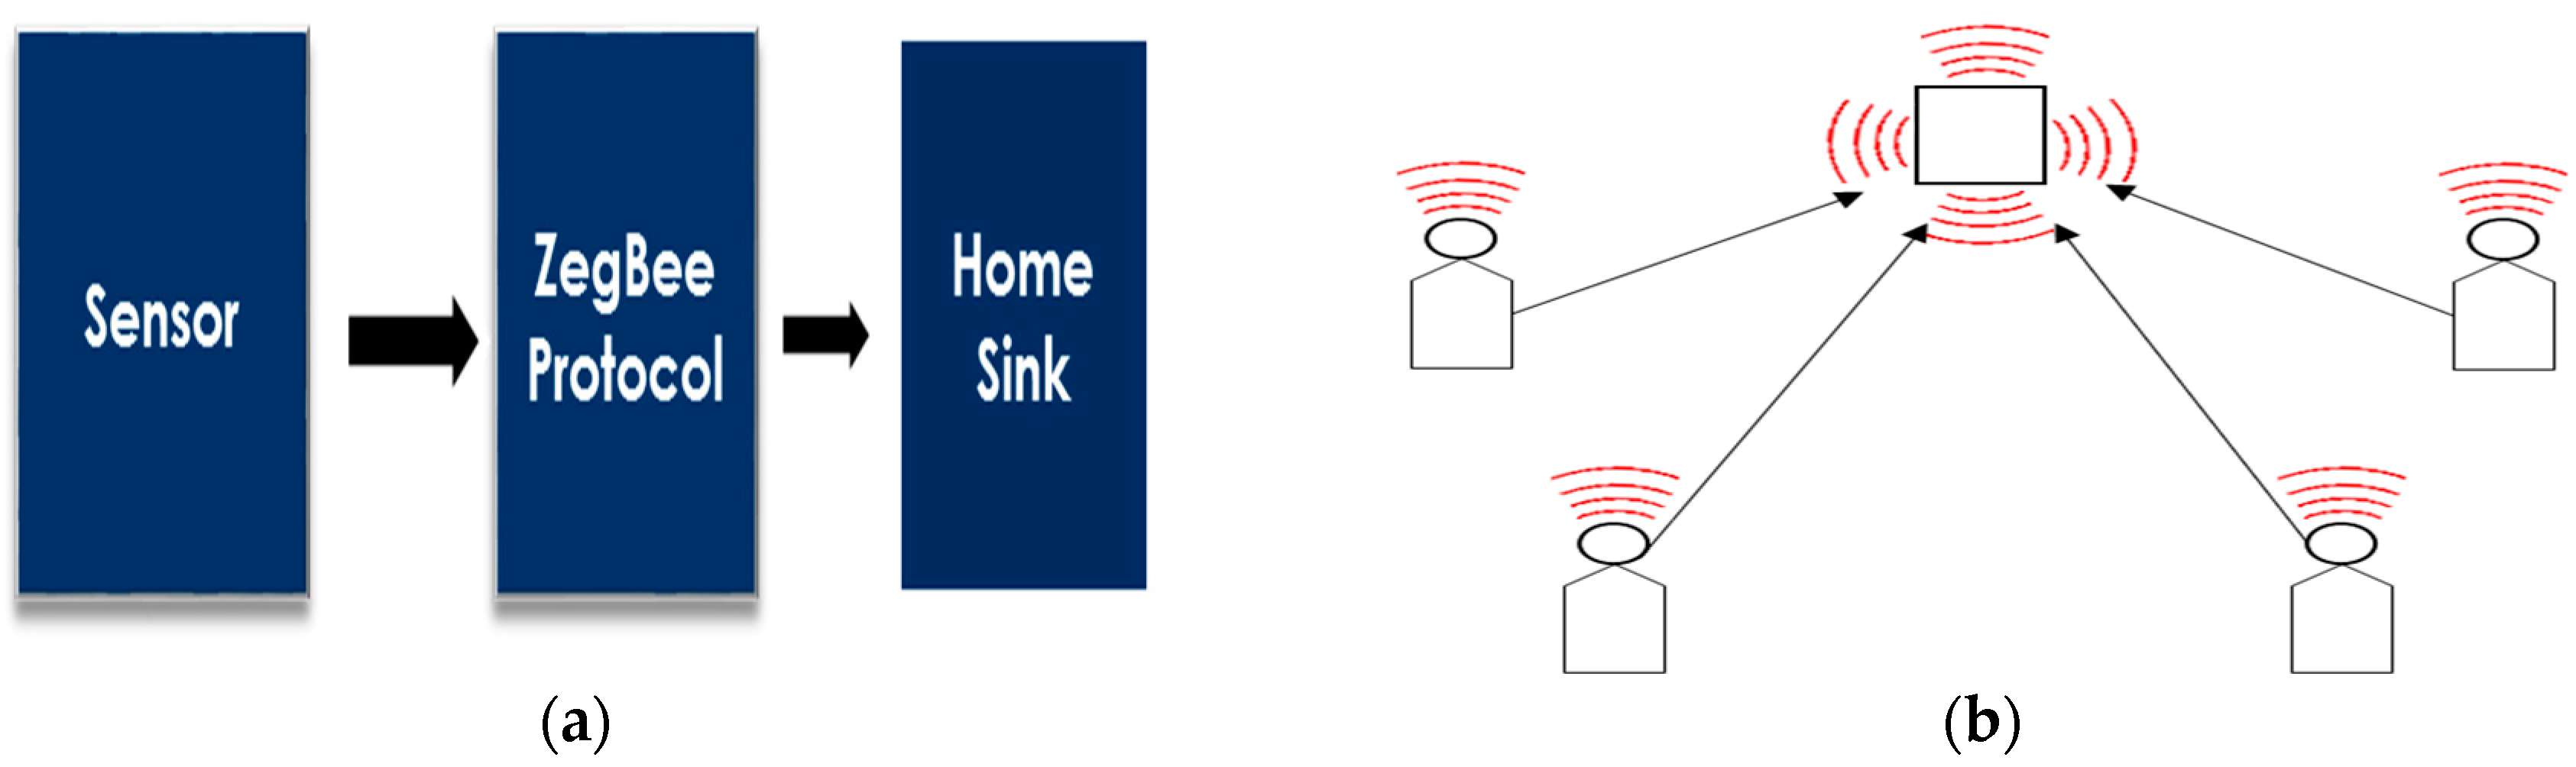
Figure 7.
(a) Beacon-enabled in ZigBee (b) Non-Beacon-enabled in ZigBee.

Figure 8.
Flow diagram of the proposed scheme.

Figure 9.
Indoor scenario of the simulation using FDS.
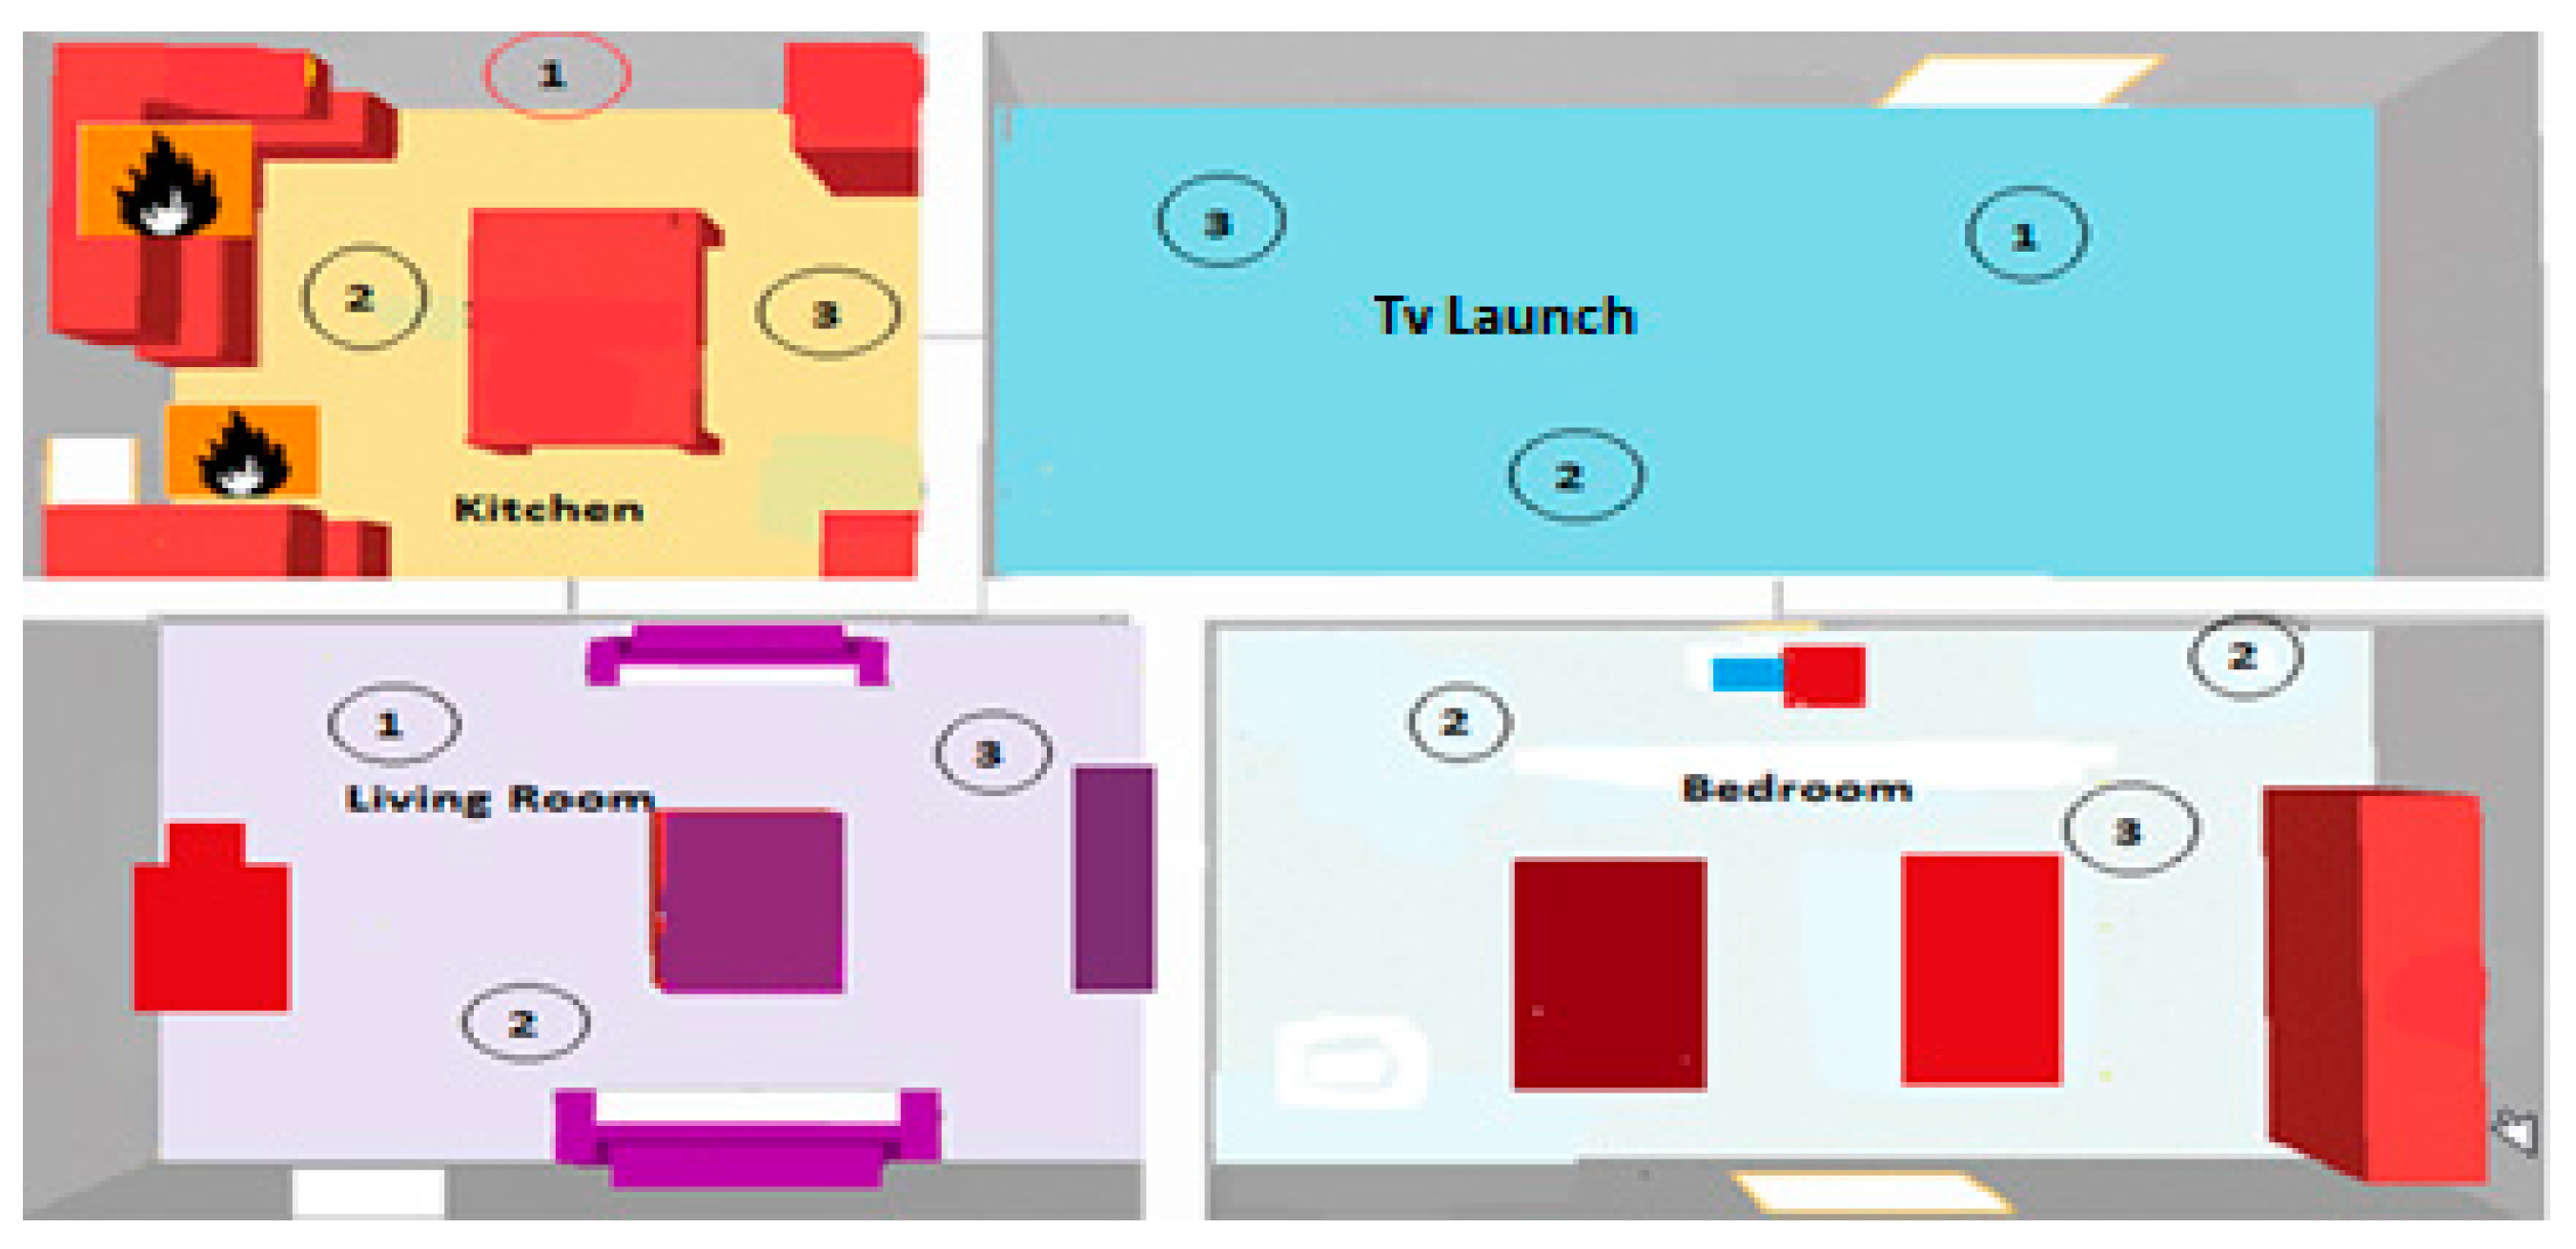
Figure 10.
Sensor behavior in the uni-sensor simulation.
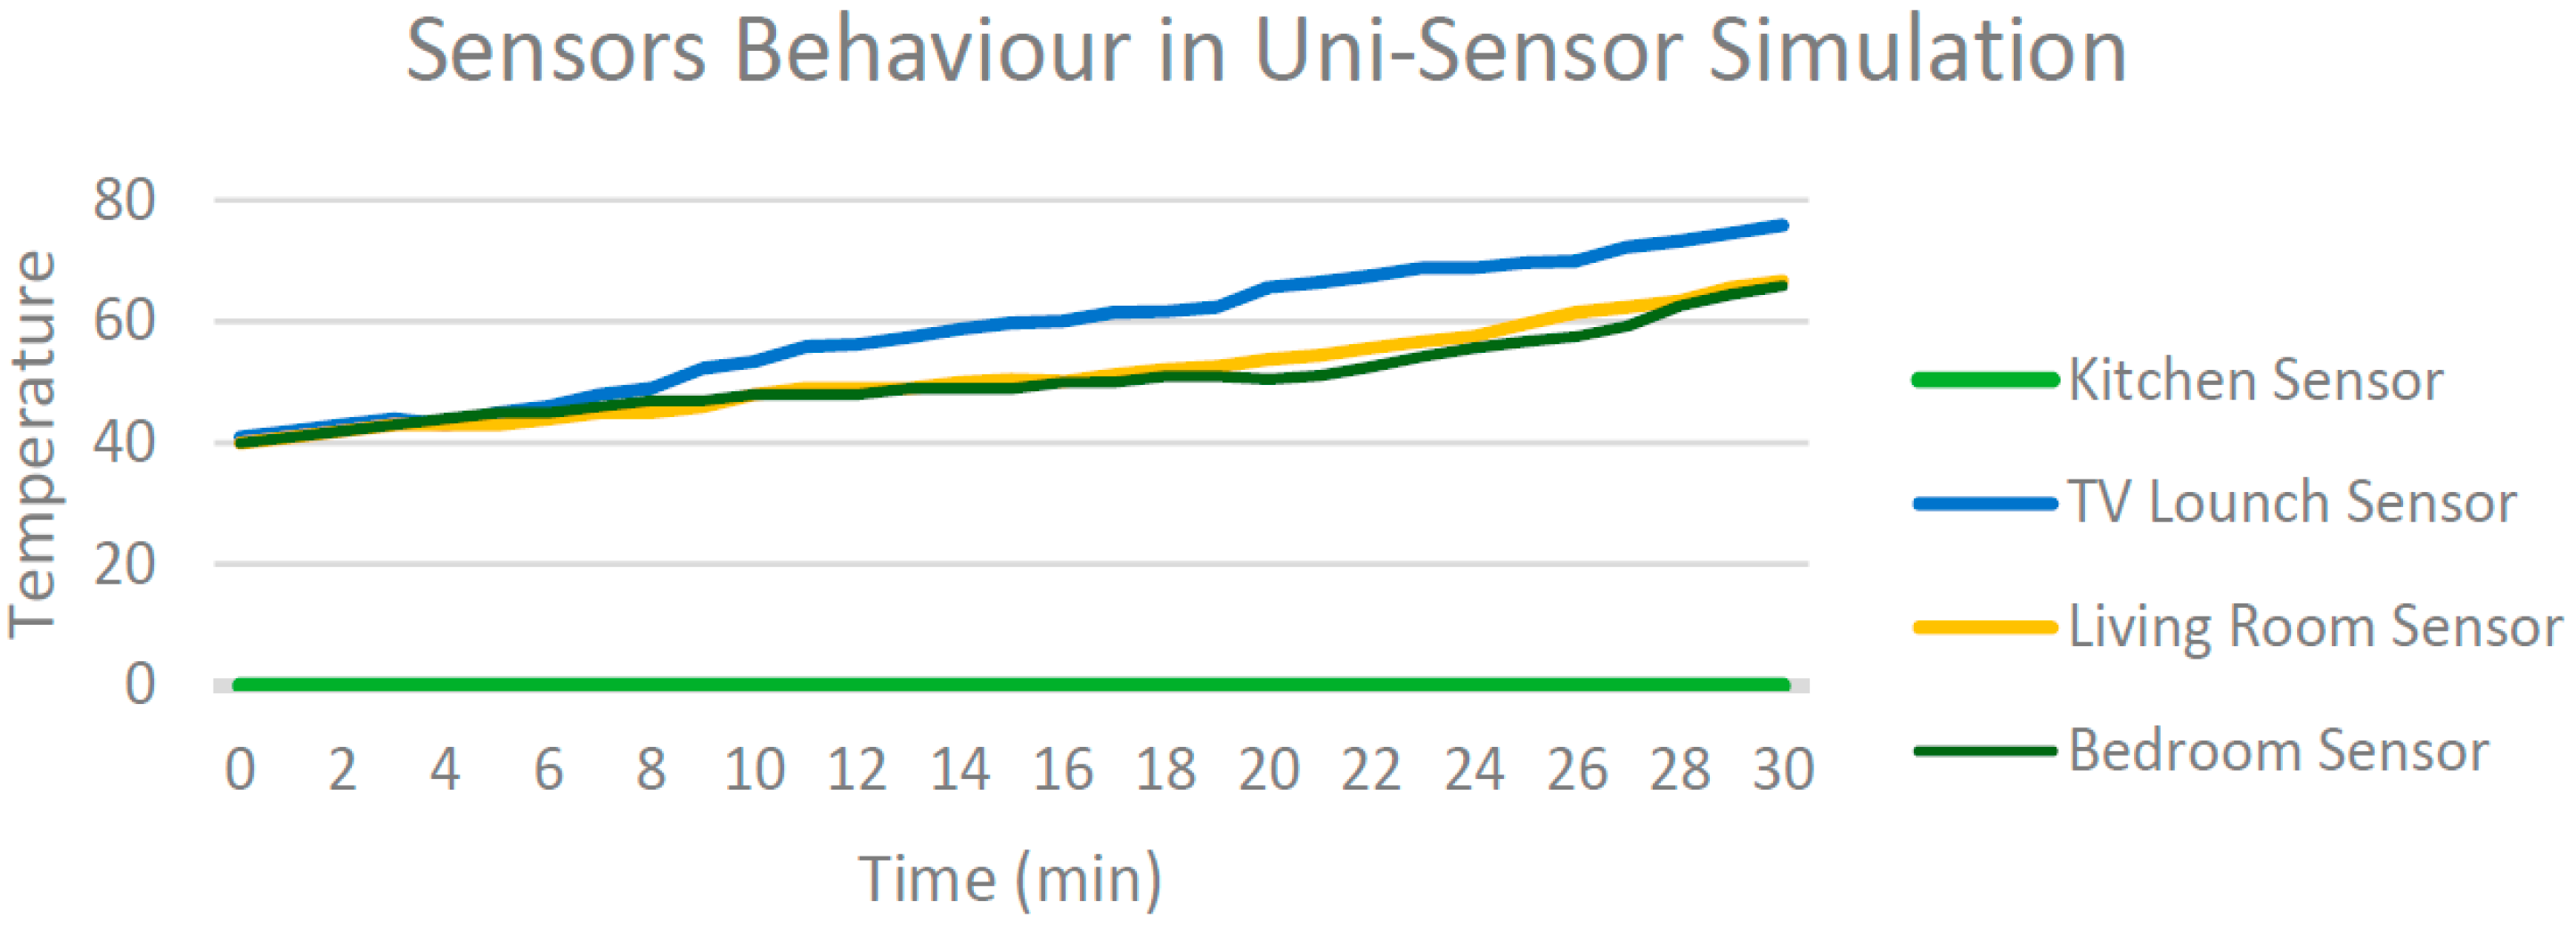
Figure 11.
Sensor behavior in the multi-sensor simulation.

Figure 12.
Energy consumption while the sensors operated in 50% and 100% duty cycle.
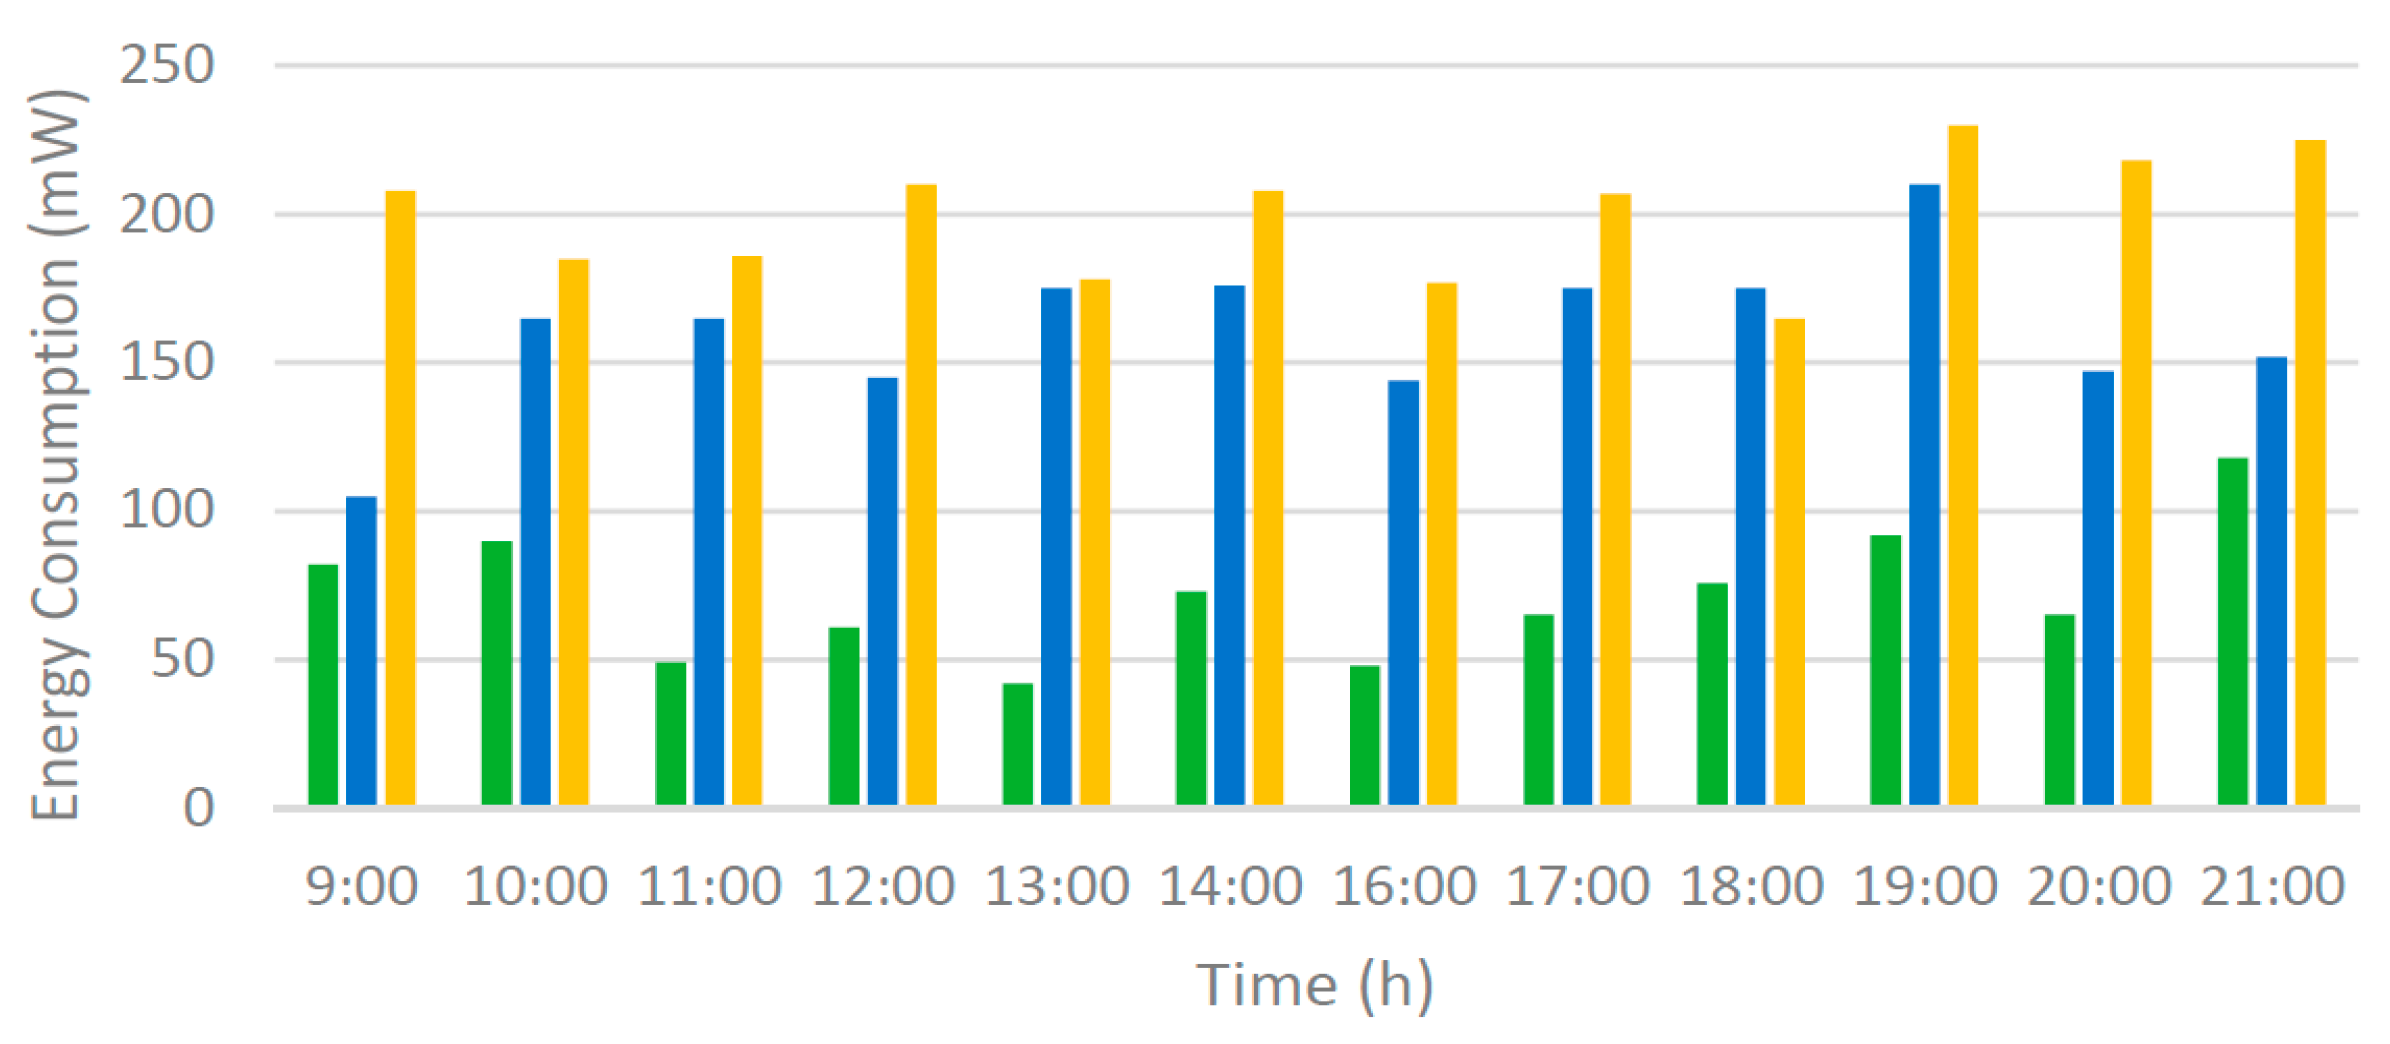
Figure 13.
Energy consumption of the sensors during 12 h.
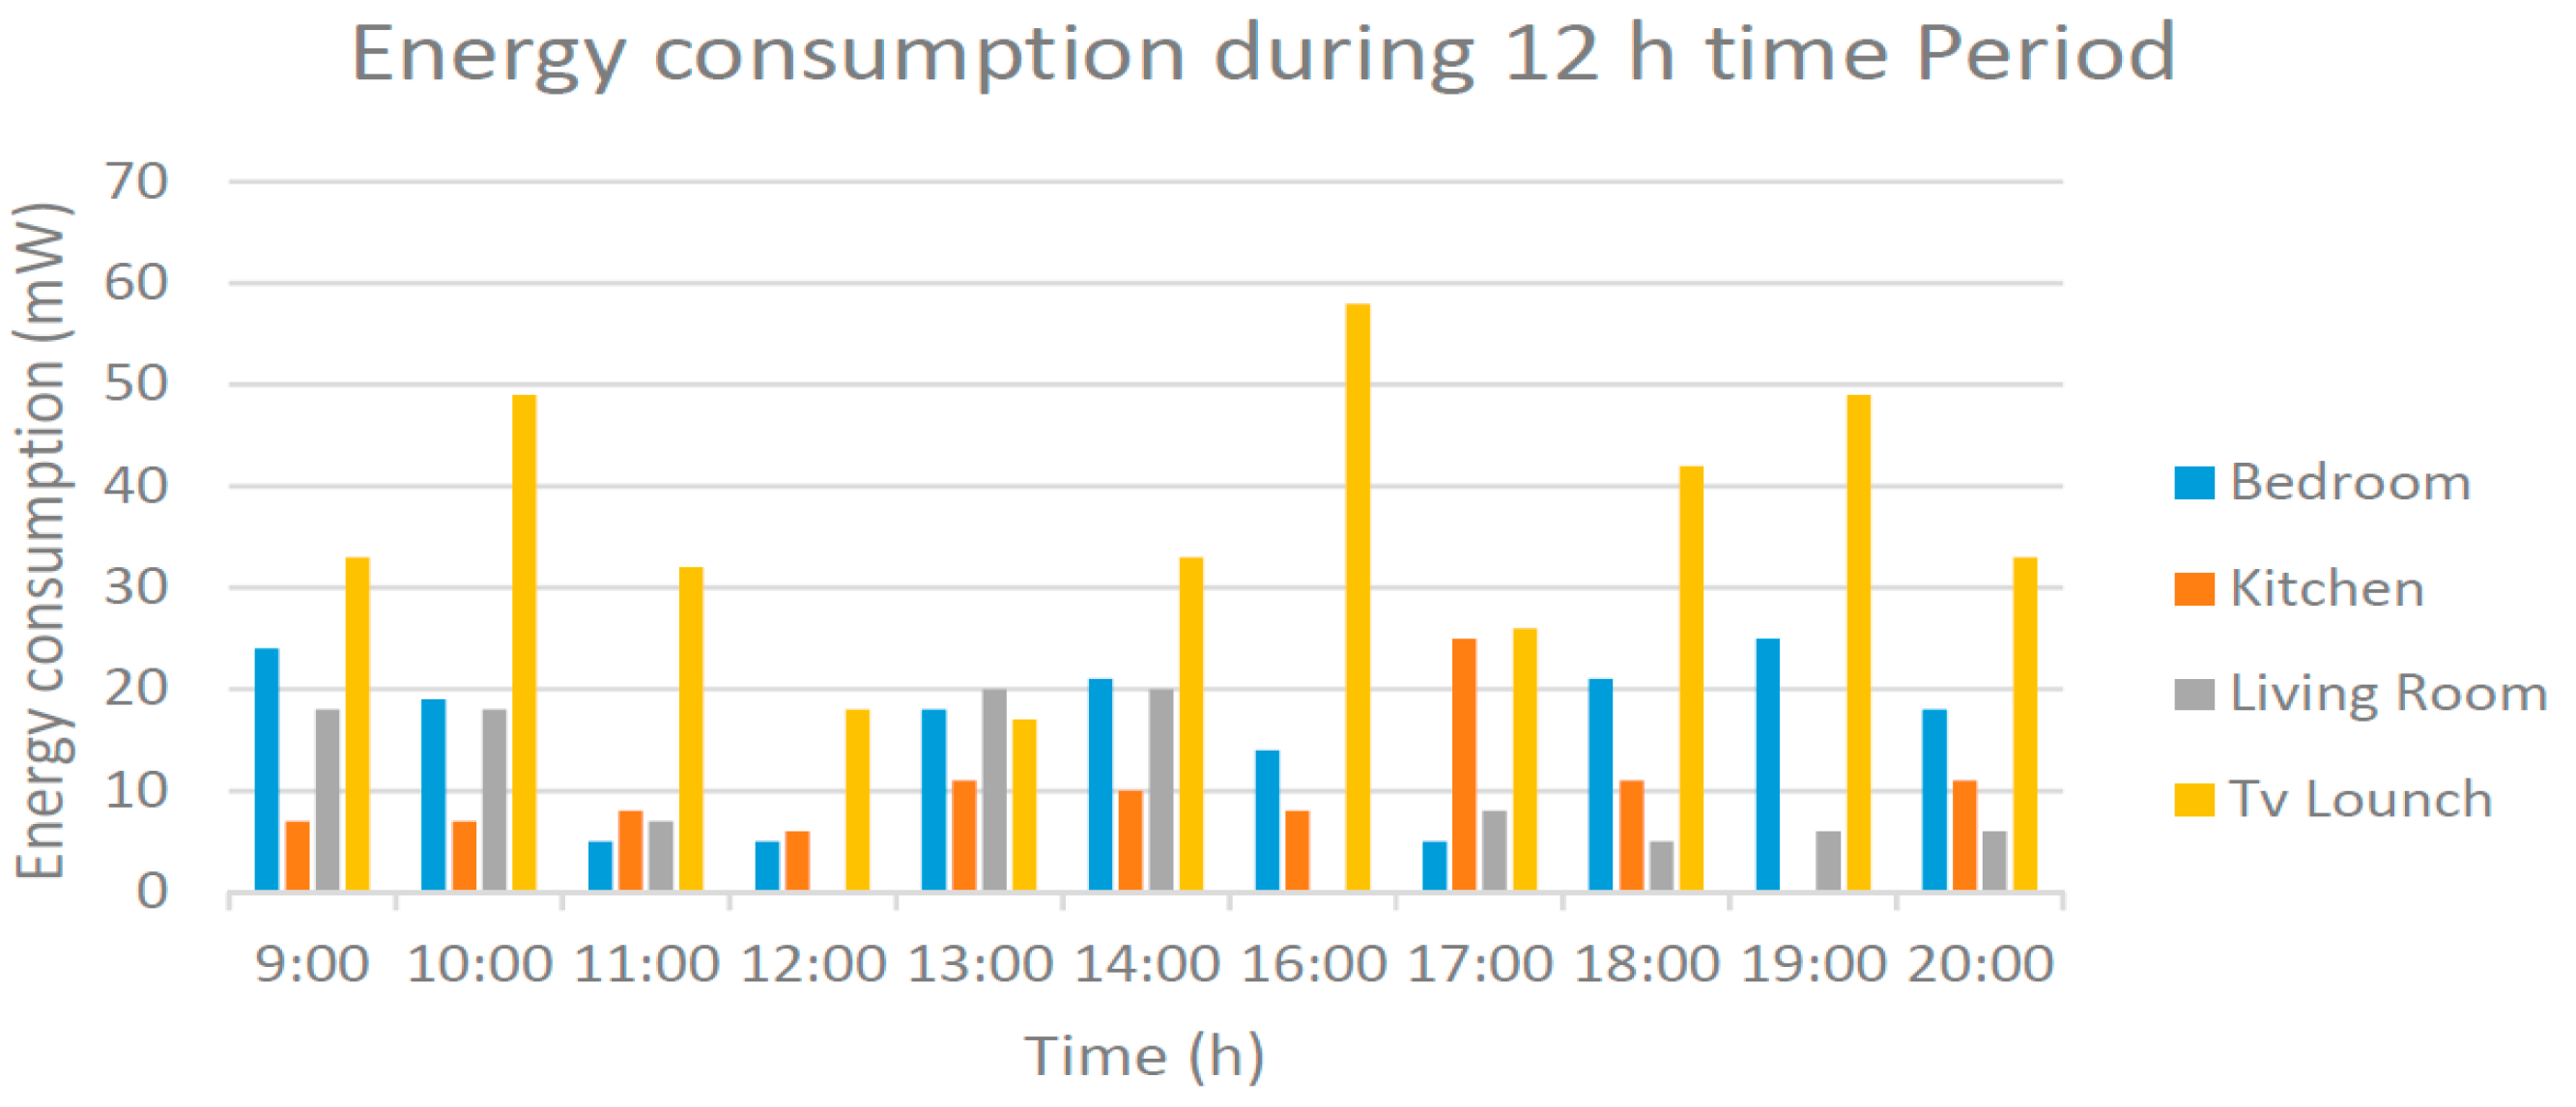
Figure 14.
Energy consumption of the sensors during 1 h of fire simulation.


Table 1.
Defined Threshold for Sensors.
| Defined Threshold for Sensors | |||
|---|---|---|---|
| Smoke Sensor | Gas Sensor | Temperature Sensor | |
| Hall | 190 | 190 | 47 °C |
| Bedroom | 150 | 150 | 43 °C |
| Living Room | 150 | 150 | 43 °C |
| Kitchen | 200 | 200 | 50 °C |
Table 2.
Notations used in the algorithm.
| Notations | Meaning | Notation | Meaning |
|---|---|---|---|
| Sen_Val | Sensor Sensed Value | δs | Thresholds |
| 1 | Fire | 0 | No Fire |
| Alert() | GSM | Next() | Loop |
| Open() | Open GSM modem | Connect() | Connection with Phone |
| Command() | AT commands | Rsp | User Response |
Table 3.
Table of the results from our five experiments.
| Experiments No. | Temperature Sensor | Smoke Sensor | Gas Sensor | User Response | Decision |
|---|---|---|---|---|---|
| 1 | Fire | No Fire | Fire | NIL | Fire |
| 2 | Fire | Fire | Fire | NIL | Fire |
| 3 | No Fire | No Fire | Fire | Fire | Fire |
| 4 | Fire | Fire | No Fire | Fire | Fire |
| 5 | Fire | No Fie | No fire | No Fire | No Fire |
© 2018 by the authors. Licensee MDPI, Basel, Switzerland. This article is an open access article distributed under the terms and conditions of the Creative Commons Attribution (CC BY) license (http://creativecommons.org/licenses/by/4.0/).
Share and Cite
MDPI and ACS Style
Saeed, F.; Paul, A.; Rehman, A.; Hong, W.H.; Seo, H. IoT-Based Intelligent Modeling of Smart Home Environment for Fire Prevention and Safety. J. Sens. Actuator Netw. 2018, 7, 11. https://doi.org/10.3390/jsan7010011
AMA Style
Saeed F, Paul A, Rehman A, Hong WH, Seo H. IoT-Based Intelligent Modeling of Smart Home Environment for Fire Prevention and Safety. Journal of Sensor and Actuator Networks. 2018; 7(1):11. https://doi.org/10.3390/jsan7010011
Chicago/Turabian StyleSaeed, Faisal, Anand Paul, Abdul Rehman, Won Hwa Hong, and Hyuncheol Seo. 2018. "IoT-Based Intelligent Modeling of Smart Home Environment for Fire Prevention and Safety" Journal of Sensor and Actuator Networks 7, no. 1: 11. https://doi.org/10.3390/jsan7010011
Note that from the first issue of 2016, this journal uses article numbers instead of page numbers. See further details here.