Article

A Quasi-Global Approach to Improve Day-Time Satellite Surface Soil Moisture Anomalies through the Land Surface Temperature Input

by
Robert M. Parinussa
1,2,*,
Richard A. M. De Jeu
2,
Robin Van der Schalie
2,
Wade T. Crow
3,
Fangni Lei
3 and
Thomas R. H. Holmes
4
1
Water Research Centre, School of Civil and Environmental Engineering, University of New South Wales, Sydney 2052, Australia
2
Transmissivity B.V./VanderSat B.V, Space Technology Business Park, Huygenstraat 34, Noordwijk 2201 DK, The Netherlands
3
United States Department of Agriculture - Agricultural Research Service, Hydrology and Remote Sensing Laboratory, Beltsville, MD 20705, USA
4
National Aeronautics and Space Administration, Goddard Space Flight Centre, Greenbelt, MD 20771, USA
*
Author to whom correspondence should be addressed.
Climate 2016, 4(4), 50; https://doi.org/10.3390/cli4040050
Submission received: 23 August 2016 / Revised: 23 September 2016 / Accepted: 29 September 2016 / Published: 12 October 2016

Abstract

:
Passive microwave observations from various spaceborne sensors have been linked to the soil moisture of the Earth’s surface layer. A new generation of passive microwave sensors are dedicated to retrieving this variable and make observations in the single theoretically optimal L-band frequency (1–2 GHz). Previous generations of passive microwave sensors made observations in a range of higher frequencies, allowing for simultaneous estimation of additional variables required for solving the radiative transfer equation. One of these additional variables is land surface temperature, which plays a unique role in the radiative transfer equation and has an influence on the final quality of retrieved soil moisture anomalies. This study presents an optimization procedure for soil moisture retrievals through a quasi-global precipitation-based verification technique, the so-called Rvalue metric. Various land surface temperature scenarios were evaluated in which biases were added to an existing linear regression, specifically focusing on improving the skills to capture the temporal variability of soil moisture. We focus on the relative quality of the day-time (01:30 pm) observations from the Advanced Microwave Scanning Radiometer for Earth Observing System (AMSR-E), as these are theoretically most challenging due to the thermal equilibrium theory, and existing studies indicate that larger improvements are possible for these observations compared to their night-time (01:30 am) equivalent. Soil moisture data used in this study were retrieved through the Land Parameter Retrieval Model (LPRM), and in line with theory, both satellite paths show a unique and distinct degradation as a function of vegetation density. Both the ascending (01:30 pm) and descending (01:30 am) paths of the publicly available and widely used AMSR-E LPRM soil moisture products were used for benchmarking purposes. Several scenarios were employed in which the land surface temperature input for the radiative transfer was varied by imposing a bias on an existing regression. These scenarios were evaluated through the Rvalue technique, resulting in optimal bias values on top of this regression. In a next step, these optimal bias values were incorporated in order to re-calibrate the existing linear regression, resulting in a quasi-global uniform LST relation for day-time observations. In a final step, day-time soil moisture retrievals using the re-calibrated land surface temperature relation were again validated through the Rvalue technique. Results indicate an average increasing Rvalue of 16.5%, which indicates a better performance obtained through the re-calibration. This number was confirmed through an independent Triple Collocation verification over the same domain, demonstrating an average root mean square error reduction of 15.3%. Furthermore, a comparison against an extensive in situ database (679 stations) also indicates a generally higher quality for the re-calibrated dataset. Besides the improved day-time dataset, this study furthermore provides insights on the relative quality of soil moisture retrieved from AMSR-E’s day- and night-time observations.

1. Introduction

Surface soil moisture is an important hydrological variable, as it is the key to understanding interactions between the land and the atmosphere. Remotely sensed soil moisture products have been used in several applications, including numerical weather predictions [1], global change monitoring [2], surface runoff predictions [3], and improved vegetation predictions [4]. Both passive and active microwave observations from individual satellite platforms have been linked to surface soil moisture. The recent (April 2015) Soil Moisture Active and Passive (SMAP) mission was the first to combine these observations from a single satellite platform, but its radar stopped transmitting due to an anomaly involving the radar’s high power amplifier, resulting in an end to its operation. In an earlier era for remotely sensed soil moisture products, the Advanced Microwave Scanning Radiometer for Earth Observing System (AMSR-E) was widely used for global soil moisture retrievals, and several algorithms that link the observed brightness temperature to surface soil moisture exist [5], the majority of which is based on the radiative transfer equation [6]. An additional input of the radiative transfer equation that significantly impacts the quality of the soil moisture retrievals is land surface temperature (LST) [7].
AMSR-E is a historical multi-frequency passive microwave sensor that was in operation for almost a decade (May 2002–October 2011), and was mounted onboard the National Aeronautics Space Administration (NASA) Aqua satellite. This satellite was designed to make observations of a number of water-related variables, including precipitation, land ice, snow cover, and also soil moisture, through a range of different sensors. The local equator overpass time of the Aqua satellite is 01:30 am for the descending path and 01:30 pm for the ascending path, and AMSR-E has a swath width of 1445 km. Surface soil moisture products are primarily retrieved from the 01:30 am overpass time of AMSR-E, as these are considered to be more suitable due to the thermal equilibrium theory [8]. This thermal equilibrium relates to the assumption that the temperature of the soil (Ts) and canopy (Tc) are more balanced at 01:30 am, which is in contrast with the 01:30 pm observations around the daily peak temperature. The general consensus is that around 01:30 pm, the Tc is affected by transpiration processes, resulting in a cooling effect for the canopy that is absent for Ts. As a result, different LST inputs can manifest themselves differently in the radiative transfer equation and affect the quality of the surface soil moisture retrievals [7], resulting in a distinct quality for soil moisture products retrieved from both satellite paths [9]. Further improving surface soil moisture retrievals from day-time observations (01:30 pm) will allow their integration in existing applications and double the temporal frequency of surface soil moisture data, which can lead to significant advancements. Additionally, spatial and temporal dynamic error information [10] for soil moisture retrievals for these overpasses can even further advance applications by providing guidance on the integration of day-time soil moisture retrievals with their night-time equivalent.
In the current publicly available AMSR-E Land Parameter Retrieval Model (LPRM) soil moisture dataset, an overpass time-dependent linear regression relationship was established between vertically polarized Ka-band (36.5 GHz) brightness temperatures and LST [11]. From now on, we refer to the current publicly available dataset as the benchmark dataset. The LST regression used in this benchmark product was determined against in situ observations in Oklahoma (the United States of America), and was applied globally. As a result, this local calibration has a limited LST range encountered over the experimental site compared to the range of conditions encountered worldwide. A consequence is that the existing linear regression is extrapolated outside its calibrated range, resulting in LST errors which manifest themselves in the soil moisture algorithm. A previous study [7] demonstrated this, and showed that refining this LST regression can lead to enhanced soil moisture anomalies with significantly larger improvements possible for the day-time over the night-time observations. In contrast with the degrading impact of Ts and Tc differences, it was suggested that higher LST observed during the day-time may result in a higher transparency of the vegetation, allowing for better penetration of the soil moisture emission through the canopy. Additionally, transpiration processes [2] can lead to lower vegetation water content during the day-time observations, which again leads to higher canopy transparency and improved soil moisture detection.
In this paper, we present an approach to further improving day-time surface soil moisture retrievals at the quasi-global scale, specifically through the land surface temperature input. The paper is ordered as follows. The main characteristics of the datasets used in this study are described in Section 2, followed by a description of the retrieval algorithm and verification techniques (Section 3). The results are presented and discussed in Section 4, starting with an optimization procedure, followed by the results of the large-scale verification techniques and in situ comparison of the improved surface soil moisture anomaly product. Finally, Section 5 describes the conclusions and outlook for future research.

2. Datasets

2.1. Passive Microwave Observations

The first sensor widely used for global surface soil moisture was AMSR-E, a passive microwave sensor that makes observations in 12 channels, in six different frequencies ranging from 6.9 to 89.0 GHz, in both horizontal and vertical polarizations. AMSR-E rotated continuously at about 40 revolutions per minute, with a fixed Earth incidence angle of 55°. Lower frequency microwave observations have higher sensitivity to surface soil moisture [12], which is the reason that the recent SMAP and Soil Moisture and Ocean Salinity (SMOS) missions observe in the L-band frequency (1.4 GHz). The lowest frequency observed by the AMSR-E sensor is the 6.9 GHz (C-band) frequency, followed by the 10.7 GHz (X-band), and both have been linked to surface soil moisture [13]. AMSR-E was in operation from May 2002 until it was switched off in October 2011 due to problems with the rotation of its antenna. For the last three years (until December 2015), AMSR-E was turned into a slow rotation mode of 2 rpm in order to provide simultaneous observations with its successor, the Advanced Microwave Scanning Radiometer 2 (AMSR2), which were used for sensor inter-calibration purposes. In this study, the Level 2A AMSR-E brightness temperatures (version 12) provided by the National Snow and Ice Data Centre (NSIDC) were used.
All passive microwave frequencies (L-, C-, and X-band) used for surface soil moisture retrievals are—at varying intensity levels—disturbed by man-made emission, so-called radio frequency interference (RFI). Such artificially affected observations have to be detected and masked. Several detection approaches exist [14,15]; some rely on brightness temperature thresholds, whereas others rely on the temporal (dis-)agreement between the channels in surrounding frequencies. In this paper, the standard RFI detection algorithm of [15] was applied to AMSR-E data, and the lowest frequency that was free of RFI was selected and further used in this study. As a result, the lowest (6.9 GHz) frequency was selected as default, and the switch to X-band observations (10.7 GHz) was made in areas of well-known RFI contamination within the 6.9 GHz frequency band (e.g., US, Middle East and Japan).

2.2. Precipitation Data

The Rvalue verification technique (Section 3.2.1) is based on the connection between precipitation and the subsequent changes in soil moisture and therefore requires precipitation data as an input [7,16]. The precipitation product that was used here is the Tropical Rainfall Monitoring Mission (TRMM) 3B42 (v7) product. The 3B42 algorithm [17] converts remotely sensed observations to precipitation rates and consists of two separate steps. First, the TRMM visible and infrared scanner (VIRS) and microwave imager (MI) observations are combined to produce calibration parameters. The next step uses these parameters to adjust a merged infrared dataset from various geostationary satellite platforms into precipitation rates. Finally, the adjusted merged infrared products at a 0.25° spatial resolution at three-hourly time-steps are aggregated into daily representations. Unlike the polar orbiting Aqua satellite, TRMM is in a (near) equatorial orbit. TRMM satellite orbit was in a constant plane relative to the sun, covering the latitudes between 50° north and 50° south, which was subsequently the region over which this study was performed.

2.3. Additional Surface Soil Moisture Datasets

2.3.1. Remotely Sensed Soil Moisture from Advanced Scatterometer

The statistical verification technique used in this study—the Triple Collocation (Section 3.2.2)—requires three surface soil moisture products that have independent error structures. The European Space Agency (ESA) developed MetOp, a series of polar orbiting meteorological satellites that is operated by the Exploitation of Meteorological Satellites (EUMETSAT). These satellites carry various different scientific instruments, including the Advanced Scatterometer (ASCAT), an active radar instrument that operates in the C-band frequency (5.255 GHz). The Technical University Vienna developed a change detection algorithm [18,19] which converts backscatter measurements made at six azimuth angles into soil moisture. The ASCAT soil moisture product is widely used [20,21,22], and comes in percentage of saturation ranging between wilting point and saturation, and represents (in line with AMSR-E) the top 0–2 cm surface layer. In this study, we used the 0.25° ASCAT soil moisture product for the period from January 2007 until October 2011. The ascending and the descending grids were combined, leading to near daily revisit times at the equator. Here the ASCAT soil moisture dataset was only used as a fixed input for the Triple Collocation technique, with the goal of determining the quality of the various AMSR-E soil moisture products relative to each other. More details on ASCAT are presented in [23], whereas more details on the soil moisture change detection algorithm are provided by [18,19].

2.3.2. Reanalysis Soil Moisture

The third surface soil moisture product required for the Triple Collocation technique is from the Modern-Era Retrospective analysis for Research and Applications-Land product (MERRA-Land, [24]). MERRA-Land is an atmospheric reanalysis product that makes use of the Goddard Earth Observing System model (version 5) and the catchment land surface model [25]. Compared to MERRA, an updated precipitation forcing and data assimilation system (version 5.2.0) was implemented. MERRA produces various water- and energy-related variables at various depths of the saturated and unsaturated zone, as well as the land surface. One of these variables is LST, which was analyzed by [7,26], both focusing on the implementation for microwave soil moisture retrievals. Another variable is surface soil moisture, which was used here as a fixed input for the Triple Collocation technique to determine the quality of the various AMSR-E soil moisture products relative to each other. For example, [27] analyzed Triple Collocation results by interchanging reanalysis products, and concluded that this choice has only a marginal influence on verification results. MERRA-Land is available for the period from 1980 onwards; for this study, the surface soil moisture layer (0–2 cm) was extracted for the period from January 2007 until October 2011. The hourly MERRA-Land surface soil moisture timeseries were linearly interpolated at the respective overpass times of AMSR-E. Finally, this product comes at a spatial grid of 1/2° latitude by 2/3° longitude, which was also downscaled through nearest neighbor resampling on a 0.25° grid.

2.4. In Situ Soil Moisture Observations

The International Soil Moisture Network (ISMN) provides a freely accessible database of in situ soil moisture observations hosted by the Technical University Vienna [28,29]. The ISMN serves for the calibration and validation of remotely sensed soil moisture product, as well as land surface models. In this study, we aim to evaluate the relative quality of benchmark and the re-calibrated AMSR-E LPRM soil moisture products to each other over the entire operational lifespan of the sensor (May 2002–October 2011). Within this time period, a total number of 2227 sensors made in situ soil moisture observations, which were distributed worldwide, divided over 39 different networks. We applied a number of selection criteria based on the associated quality flags delivered through the ISMN, data availability through time and observational depth. Firstly, the microwave emission in the lowest frequency bands that were used in this study (C- and X-band) generally originates from the top surface layer (0–2 cm). For consistency reasons, only the shallow in situ sensors were selected; hence, sensors located at more than 10 cm from the surface were rejected. Additionally, it is important to have sufficient data samples for the in situ verification; hence, the minimum number of overlapping data points between AMSR-E soil moisture retrievals and the in situ observations was set to 50. Moreover, only stations within the quasi-global TRMM domain (50°N–50°S) were considered. This selection procedure resulted in a total number of 679 stations, which were all used for verification purposes.
Specifically for the validation of large-scale remote sensing products, it should be noted that a sufficiently large selection of the in situ sensors were located in very challenging regions due to topographical complexity and freeze or thaw complications. For example, the Snow Telemetry (SNOTEL) network, with 177 out of the 679 stations, was specifically designed to monitor the snowpack and related variables, and stations are mainly located in remote high-elevation mountain catchments. Such complexity will likely result in relatively low agreement between the in situ soil moisture observations (which are dominated by local hydrological processes) and the remotely sensed product that represent the average conditions over a very large area. It should be noted that specific approaches exist for determining whether point scale observations have the capacity to represent large areas [30]. However, it was decided to use all stations that satisfied the described selection criteria, since an evaluation over the widest possible range of climate conditions is required, as the quality of the remotely sensed products is known to vary accordingly [7,9,10,27].

2.5. Normalized Vegetation Difference Index

The AMSR-E LPRM soil moisture is known to have a generally reduced quality with an increasing density of the overlying canopy [7,9,10]. In particular, distinct relationships for the separate satellite paths and the respective overpass times of the AMSR-E, ASCAT, and SMOS sensors were evaluated by [9]. Here, the Normalized Difference Vegetation Index (NDVI) obtained from the Moderate Resolution Imaging Spectro-radiometer (MODIS) serves as a surrogate for such relations. NDVI is a graphical indicator determined through near-infrared and visible observations, and is linked to the vegetation greenness. In order to further understand the distinct relationship between the quality of remotely sensed soil moisture and vegetation density, monthly NDVI images (MOD13C) were aggregated from its native 0.05° grid into a global 0.25° grid and served as supporting information for the quasi-global analysis, and are also publicly available.

2.6. Data Processing

Applications that use remotely sensed soil moisture data often minimize systematic differences between products by removing the climatology and scaling anomalies to match the model’s climatology [31]. As a result, this study focuses on soil moisture anomalies relative to their long term climatology. Hence, the remotely sensed hydrological variables (i.e., soil moisture and precipitation) were decomposed into a climatology and anomaly component. The climatology was determined through a 31-day moving window centered on the particular day of interest [7,16,27]. There was only one exception regarding this decomposition, relating to the comparison of the AMSR-E products against the in situ observations from the ISMN (Section 4.3). The reason for this choice relates to the extensively long time period (May 2002–October 2011) over which this analysis was performed, and potential discrepancies associated over such long time period. Generally, in situ sites require regular and intensive maintenance because external forces (i.e., erosion, power issues, and destruction by animals) are common and can introduce significant uncertainties on the inter-annual signal that we are aiming to evaluate. As a result, the comparison against the ISMN was only performed on the original timeseries, and the large-scale verification techniques—the Rvalue and the Triple Collocation—were performed on an anomaly basis.
Finally, NDVI data was used to better understand relations that the quality of soil moisture is known to have with the overlying vegetation canopy. In order to achieve this, NDVI was used in a binning procedure, with the ultimate goal of better understanding the behavior and parameterization of the radiative transfer equation at the quasi-global scale. The binning procedure that was applied here uses multi-year mean NDVI, and verification results from the various techniques were binned over the NDVI range (0.10 < NDVI < 0.85) that provides reliable verification results [7,9]. Unless mentioned otherwise, the NDVI intervals were chosen to be 0.005, resulting in 150 individual bins.

3. Methodology and Results

3.1. The Land Parameter Retrieval Model

The LPRM is well documented in the literature; the first publications appeared in the early 2000s [32], and the approach developed continuously, resulting in an extensive (and ongoing) publication record. This section starts with a summary of the relevant LPRM literature (Section 3.1.1) in which key elements of the algorithm are discussed, specifically focusing on the approach proposed in this study. After that, the approach to further improve soil moisture retrievals from the ascending path (01:30 pm) of AMSR-E is discussed (Section 3.1.2).

3.1.1. Summary of the Relevant LPRM Literature

One of the commonly used retrieval algorithms for soil moisture is the LPRM, as this was one of the first global surface soil moisture datasets to become publicly available. The LPRM is also the most comprehensive model in terms of applicability on a wide range of low microwave frequencies, including the L- [33,34,35], C- [13], X- [36,37], and Ku-band [13]. These products have been used in a wide range of hydrological and climatological applications [2,3]. Another advantage of LPRM soil moisture products is the possibility for them to be completely free of any ancillary data, as a result better facilitating their role in climate studies [38]. Numerous validation and inter-comparison studies have been done seeking the traditional comparison against in situ observations and large scale verification techniques, such as Triple Collocation [27], Rvalue [16], and lagged variable instrument analysis [39]. These studies generally indicate the high skill of the LPRM soil moisture products to capture the temporal variability relative to other products, which was confirmed through in situ observations [40,41].
The LPRM simultaneously retrieves soil moisture and vegetation optical depth from low-frequency microwave observations using both the horizontal and vertical polarizations. The LPRM is based on the commonly used radiative transfer equation [6], and the vegetation optical depth is derived from the Microwave Polarization Difference Index through an analytical solution [42]. The LPRM is a forward model that runs over the widest possible soil moisture range, followed by an internal procedure that minimizes the difference between simulations and observations. The LPRM approach is unique for each location at each time step; it does not distinguish for land cover types, is free of external vegetation information, and the LPRM is independent of reanalysis datasets such as the commonly used land surface temperature [7] or surface soil moisture fields [43]. The only external information required is soil texture information, required for the conversion between soil moisture and dielectric constant, which was obtained through the Food and Agricultural Organization (FAO; [44]). The LPRM has been detailed in various studies, to which readers are directed to for more information. In particular, [11] provides a comprehensive overview of the LPRM, including all the relevant publications.
Relevant for this study is the publicly available AMSR-E LPRM soil moisture dataset that was used as the benchmark product. This benchmark dataset uses a globally constant parameterization for roughness and single scattering albedo. Vertically polarized Ka-band (36.5 GHz) observations were used to determine the LST through the linear regression calibrated over the experimental site in Oklahoma [11]. As a starting point in this study, both paths of the benchmark AMSR-E LPRM soil moisture dataset were evaluated through the Rvalue technique (see Section 3.2.1), the AMSR-E ascending (01:30 pm ) and descending (01:30 am ) paths were explicitly separated, and the quasi-global results were binned over the NDVI range. Figure 1 presents these results, which show a unique and distinct degradation for both satellite paths. The descending path (01:30 am ) of AMSR-E is generally considered to be of higher quality [8], which is confirmed by the Rvalue technique, but only until NDVI values around ~0.47. Interestingly, for higher NDVI values, the ascending path (01:30 pm ) gradually overtakes and starts to outperform the descending path (01:30 am ) over higher NDVI values. This finding was already confirmed in previous studies through the use of this Rvalue technique [7], in situ observations [20], and Triple Collocation [9].
A recent study [45] demonstrated improvements for the AMSR-E descending path (01:30 am) through an updated parameterization of the roughness and single scattering albedo in combination with a vegetation correction. This vegetation correction is based on the vegetation optical depth from an initial run to determine a correction in the final run. This recent study by van der Schalie et al. [45] focused on optimizing the roughness and single scattering albedo from the radiative transfer equation against in situ observations, while this study aims to isolate the improvements that can be made through LST. For this reason, our study specifically focus on day-time (01:30 pm) observations, as these are theoretically more challenging and larger improvements can potentially be expected compared to the night-time (01:30 am) equivalent [7].

3.1.2. The Approach for Further Improvements

LST plays a unique role in the radiative transfer equation and has an influence on the final quality of soil moisture anomalies. This was demonstrated for the first time by forcing the algorithm with a wide range of LST products from both the simultaneous higher frequency AMSR-E observations and several phase shift scenarios applied to MERRA LST data [7]. Parinussa et al. also demonstrated that the benchmark AMSR-E LPRM approach benefits from these simultaneous Ka-band LST observations over arid and semi-arid regions, which was reversed for ancillary LST over moderate-to-densely vegetated regions. Additionally, [11] established the linear relationship between Ka-band observations and LST that is currently applied in the benchmark AMSR-E LPRM soil moisture dataset. This existing relationship was determined over an isolated site in Oklahoma (the United States of America) and retrieves the temperature from the top (0–2 cm) soil layer, from which the microwave emission from the C- and X-band frequencies originates. This local calibration was applied globally, relying on extrapolation outside its calibrated range. This extrapolation results in LST errors, which propagate into LPRM soil moisture retrievals [11,46]. Accounting for these LST errors in the retrieval algorithm can lead to enhanced soil moisture retrievals.
This study proposes an empirical expansion of the existing linear regression from the benchmark AMSR-E LPRM ascending (01:30 pm) soil moisture dataset. Our goal is to improve the LST input of the radiative transfer equation through a bias correction and determine its impact on the temporal correlation of the surface soil moisture retrievals. This was achieved by employing a wide range of scenarios in which bias values were imposed on top of the existing linear regression. The range of the bias scenarios was chosen to vary between −10 degrees K and +10 degrees K, with 1 degree K increments. It should be noted that the positive bias scenarios were not further analyzed, as these consistently degrade the quality of the soil moisture retrievals (Supplementary Materials; Figure S1). In the final step, the linear regression (slope and offset) was determined by relating the vertically polarized Ka-band observations and the re-calibrated LST product, where the re-calibrated LST product consists of the LST estimation acquired from the existing Ka-band regression equation plus the additive pixel-based optimal LST bias correction applied above. Scenarios were initially evaluated with the Rvalue technique, with the goal of gathering information that can be used to improve the regression used in the benchmark soil moisture product, the results of which are discussed in Section 4.1.

3.2. Quasi-Global Verification Techniques

This section provides an overview of the large-scale mutually-independent verification techniques employed herein. The first is a precipitation-based verification technique, the so-called Rvalue (Section 3.2.1), which was used for both optimization and validation purposes. The second is a statistical verification technique, the Triple Collocation technique (Section 3.2.2), which requires additional soil moisture products, solely used for validation purposes.

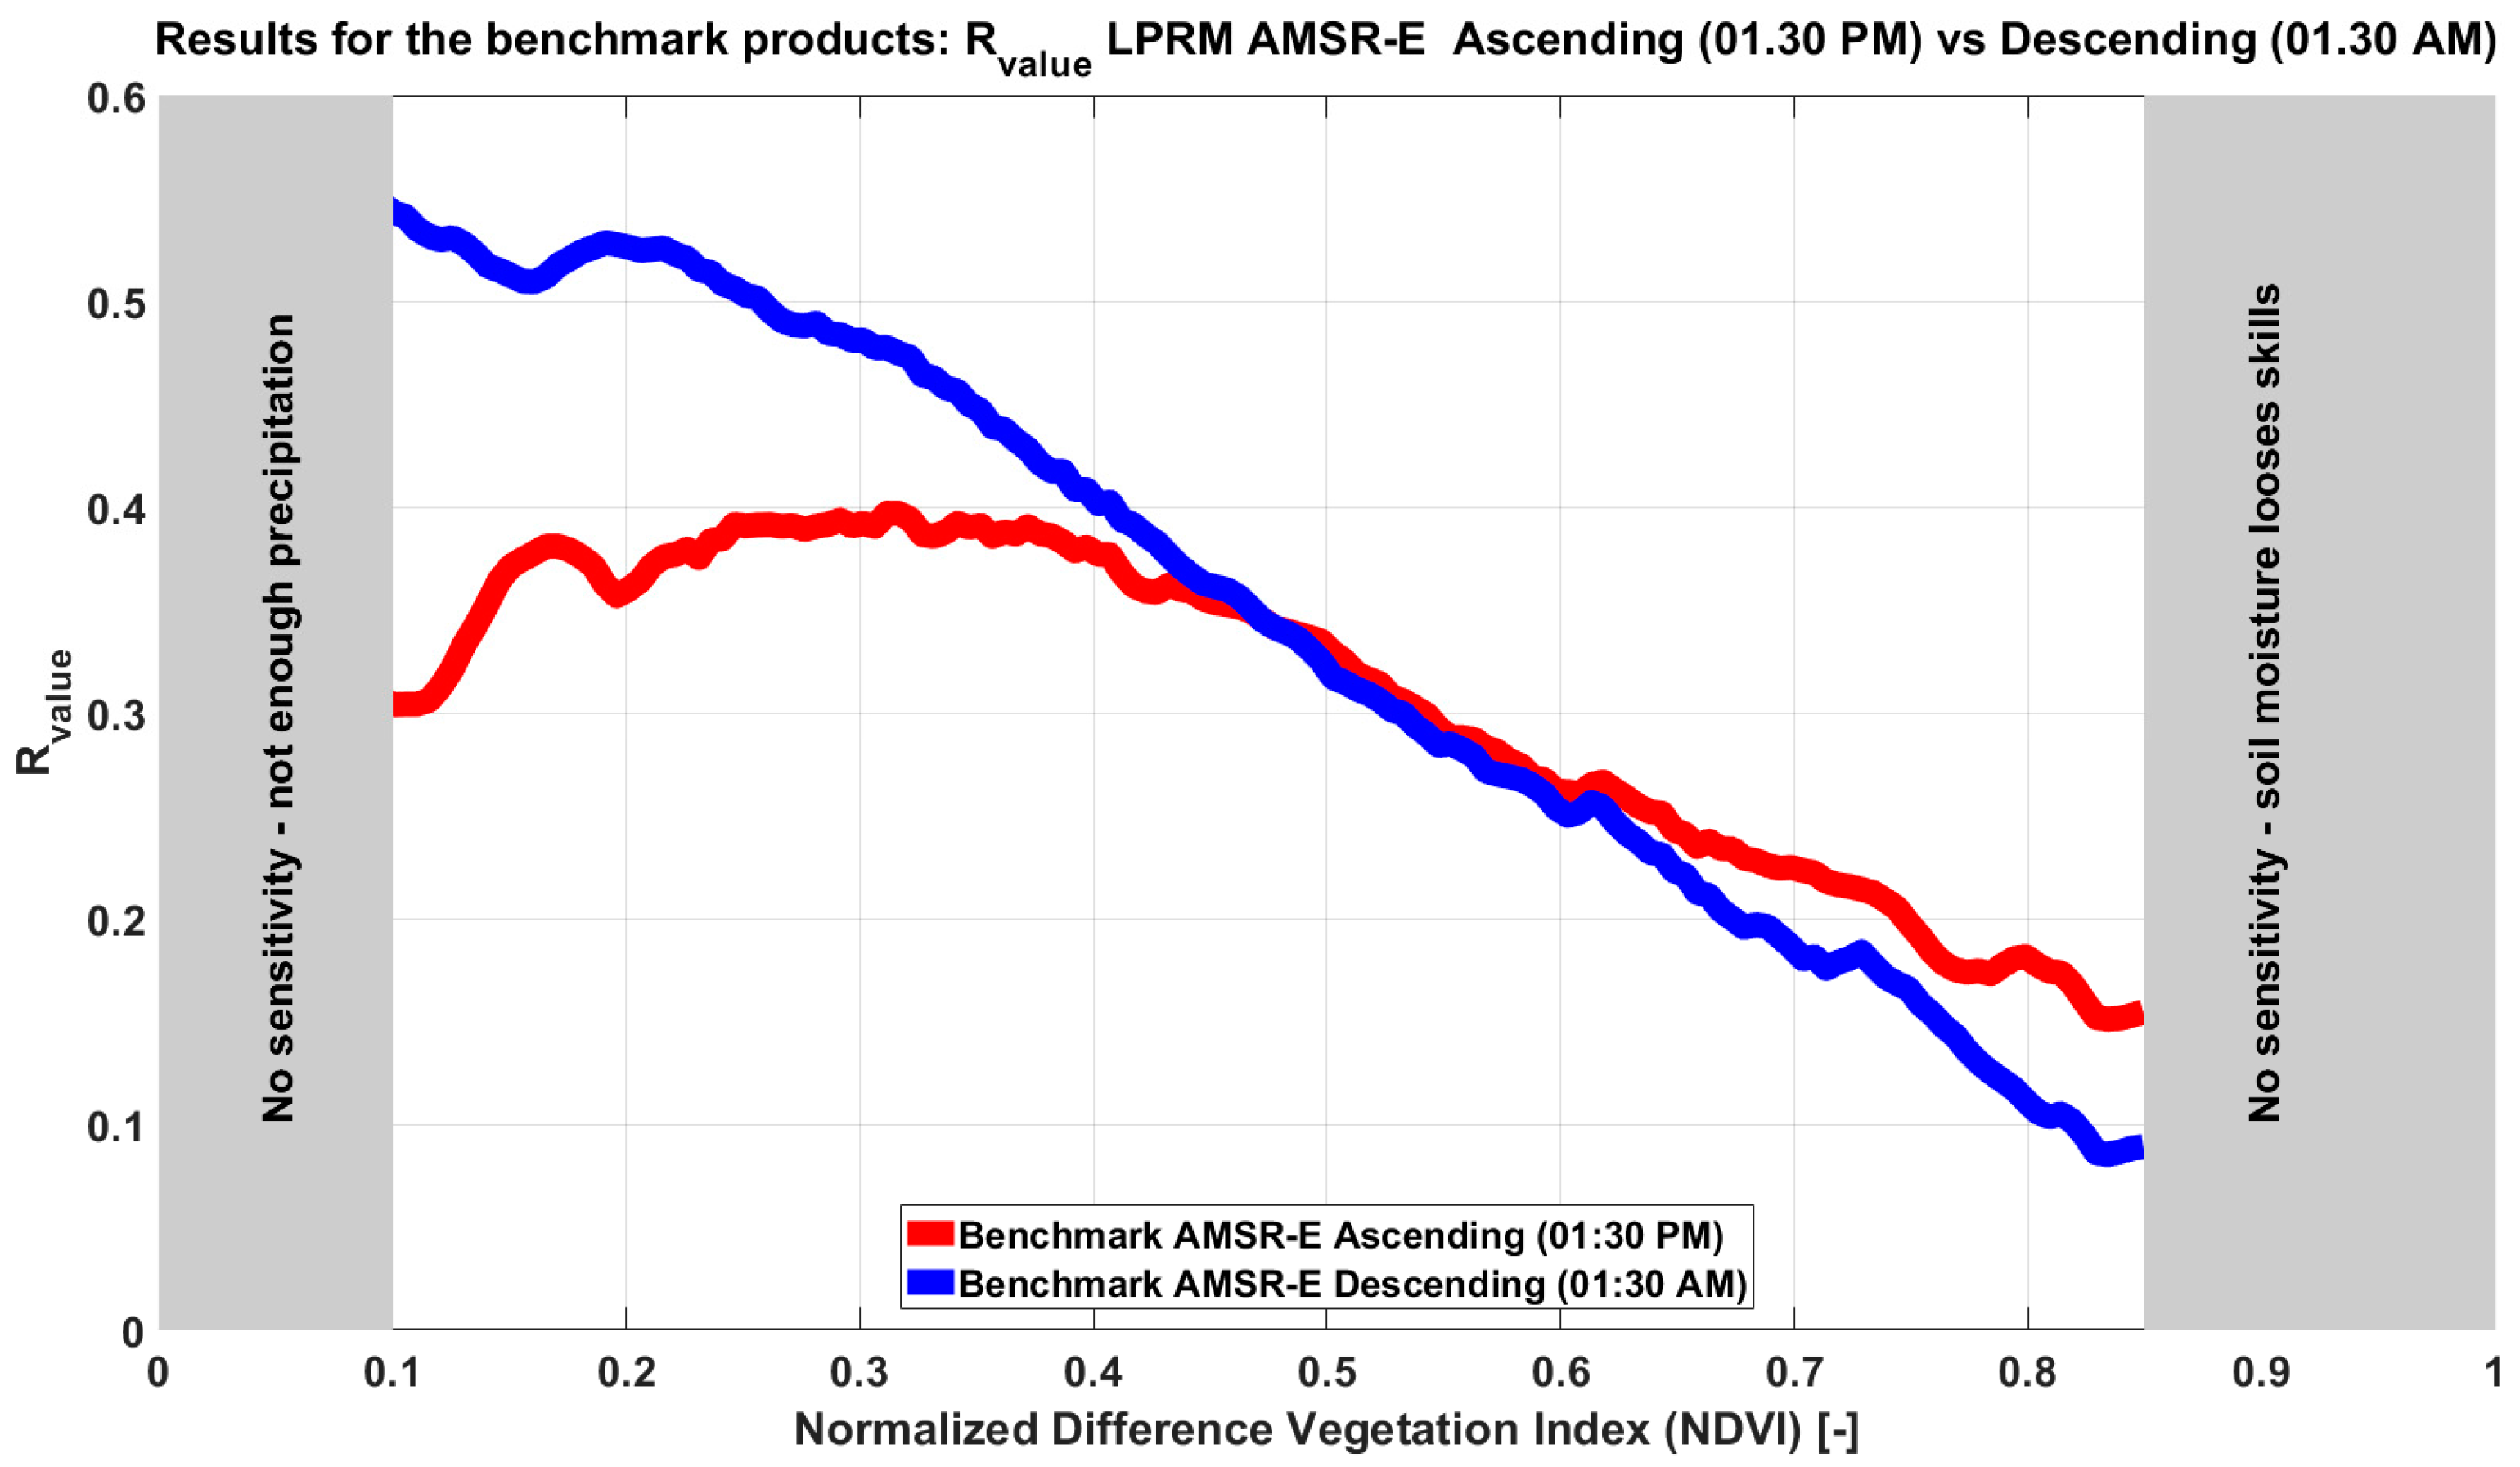
3.2.1. The Rvalue Technique

The Rvalue technique is based on the connection between precipitation and the subsequent changes in soil moisture [47]. The technique uses the contrasting quality of two separate rainfall products (e.g., satellite and gauge-based) to evaluate the degree to which analysis increments (derived via the sequential assimilation of soil moisture into a simple water balance model) accurately compensate for known rainfall errors [7,16]. More recently, the approach has been adapted to run on an anomaly basis and validated as a robust representation of anomaly-correlation-based skill in satellite soil moisture retrievals [16]. Here we used the Rvalue version presented by [16], with the only modification being an artificial deterioration of the gauge-corrected (3B42) TRMM-based precipitation product instead of relying on its contrast with the near-real-time precipitation dataset. This modification is beneficial for the spatial comparison of Rvalue results, as the contrast between the two precipitation products is now uniform in space. It should be noted that the Rvalue approach has already been successfully applied as a tool for understanding the impact of land cover and sensor characteristics on the quality of satellite-derived soil moisture products [48]. Furthermore, there are well-known [7] limitations to the precipitation-based Rvalue verification technique over extremely arid climate regimes, as this technique requires a sufficient number of precipitation events. This requirement cannot be met under extremely arid conditions, as indicated in the figures by “No sensitivity-not enough precipitation”. In line with this limitation of the Rvalue technique is the well-known limitation of remotely sensed algorithms under dense vegetation canopies, as the emission from the soil (moisture) becomes entirely blocked by the overlying vegetation. This limitation in regions with a very dense vegetation cover was indicated in the figures by “No sensitivity-soil moisture looses skills”. For more detailed information on the Rvalue technique, readers are directed to [7,16].

3.2.2. The Triple Collocation Technique

Rvalue is a performance metric which provides a linear representation of retrieval correlation with truth soil moisture conditions. In contrast, the Triple Collocation technique estimates the root mean square error (RMSE) versus true conditions for three linearly-related soil moisture datasets with independent error structures. This technique has been intensively used for the validation of remotely-sensed surface soil moisture retrievals [7,9,27,49]. Generally, these studies used soil moisture from the surface layer of a reanalysis model, remotely sensed soil moisture based on active- and passive microwave observations. Triple Collocation was also applied to in situ observations [49] but these are only available for a handful of sites worldwide lacking the capacity for an evaluation over the widest possible range of climate conditions across which remotely sensed soil moisture is known to vary. Additionally, [27] used several product combinations and showed that the error estimates are only marginally influenced by the choice of (independent) dataset.
This paper follows the conventional Triple Collocation approach that has been extensively discussed in literature [7,9,27]. In this study, the Triple Collocation technique is used to examine the relative quality of the two AMSR-E ascending soil moisture products. These two products were both generated through the LPRM, and the first is the benchmark AMSR-E product, whereas the second product uses the re-calibrated LST relation (Section 4.1). For this reason, two soil moisture data sources (MERRA-Land and ASCAT) are fixed, while the other product (soil moisture from the LPRM) is evaluated for the two scenarios. Again, all soil moisture datasets are decomposed into their climatology and anomaly components, and this analysis is limited to the overlapping period between ASCAT and AMSR-E (2007–2011). Since the truth is unknown, we arbitrarily chose the ASCAT datasets as the reference, which will not affect subsequent manuscript conclusions regarding the relative performance of various LPRM cases. Both the Rvalue (Section 3.2.1) and Triple Collocation (Section 3.2.2) verification techniques utilize different input datasets and are based on very different approaches. The first is based on the assimilation of remotely sensed soil moisture in a simple water balance model, whereas the other is a statistical technique. As a result, both these techniques can be assumed to be an independent source of verification.

4. Results

This chapter provides the results, which are divided into three main sections. The first section (Section 4.1) focuses on a wide range of bias scenarios imposed on top of the existing linear regression relationship between Ka-band brightness temperatures and LST, followed by verification at the quasi-global scale through the Rvalue technique (Section 4.2.1) as well as the Triple Collocation (Section 4.2.2). Finally, the comparison between the benchmark and the re-calibrated AMSR-E ascending soil moisture product against ground observations from the ISMN is presented in Section 4.3.

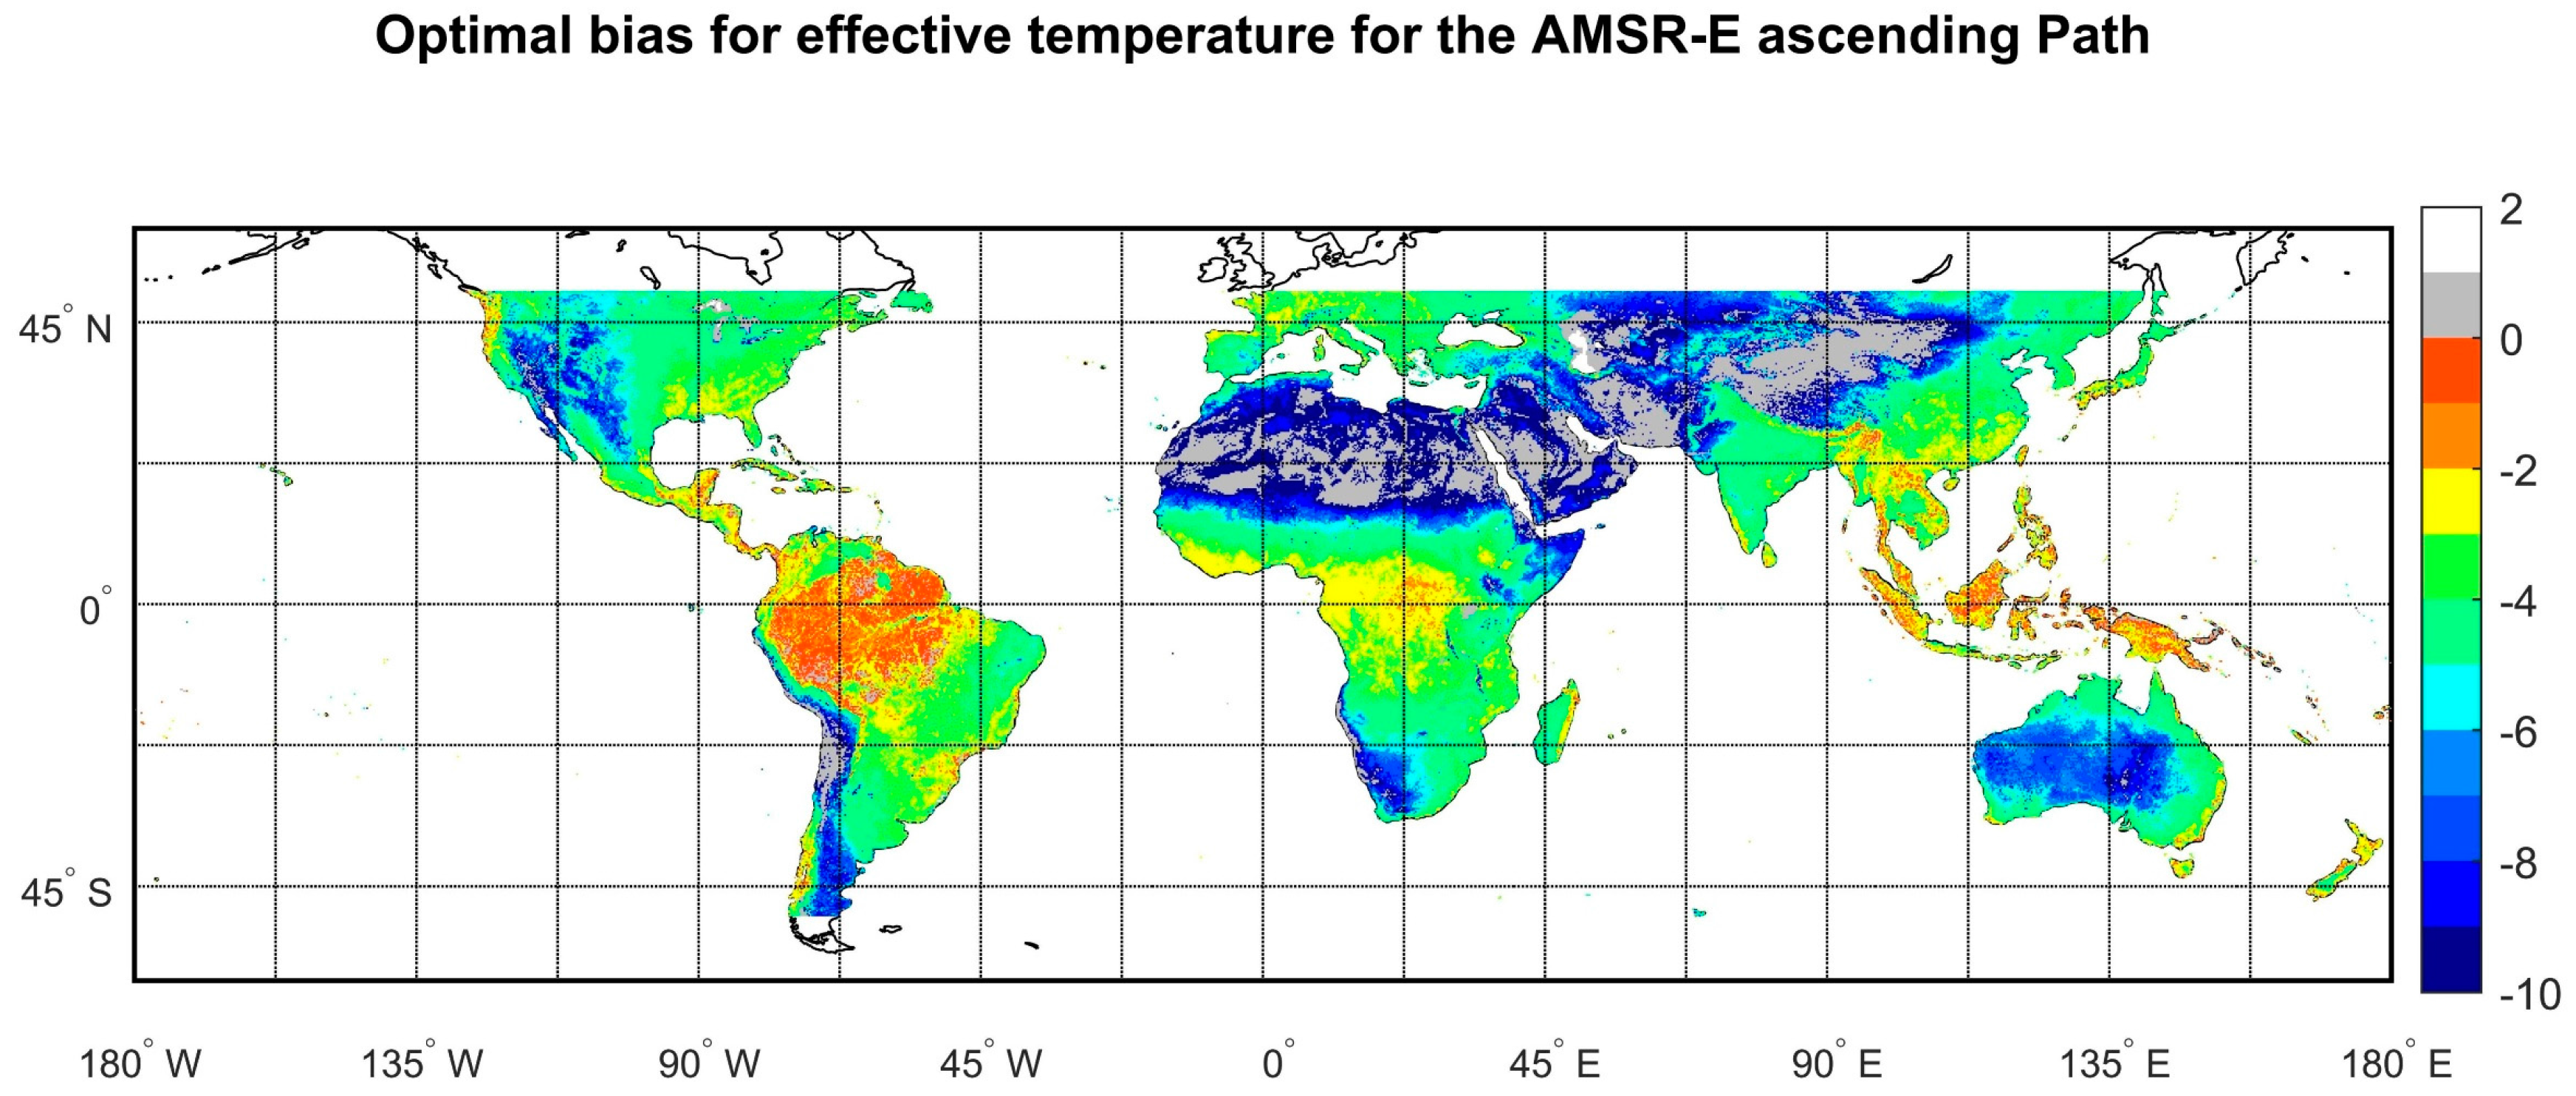
4.1. Quasi Global Optimization

As previously detailed, an empirical approach to improving an existing linear regression was proposed by imposing a wide range of bias scenarios on top an existing linear regression [11]. The optimization is a multi-step procedure that begins with running the benchmark retrieval algorithm with the individual LST biases imposed over a range of scenarios. The second step in the optimization procedure determines the pixel-based optimal LST bias over the entire quasi-global domain, based on the Rvalue verification results. Then, the linear regression (both slope and offset) was updated by re-calibrating the relation between: (a) the existing regression used in the benchmark product, including the pixel-based optimal LST bias; and (b) the vertically polarized AMSR-E Ka-band brightness temperature observations. As a result, the re-calibrated linear regression is now based on the LST range that is encountered at the quasi-global scale, rather than at a single location. Finally, the re-calibrated regression is verified again by the Rvalue technique (Section 4.2.1), the Triple Collocation technique (Section 4.2.2), and through in situ soil moisture observations (Section 4.3).
Figure 2 presents the previously-discussed benchmark scenarios from Figure 1 (both ascending (--) and descending (--)), in which the descending dataset was only presented for reference purposes. Of main importance in Figure 2 are the Rvalue results for the various bias scenarios, ranging from −10 K (blue) to −1 K (red). A quick look shows that the general tendency for all scenarios is the same, with increasing Rvalues from the left until a breaking point around NDVI values of 0.37, followed by steadily decreasing Rvalues with increasing NDVI. Another result from Figure 2 can be extracted when inter-comparing the various bias scenarios that range from −10 degrees K (blue) to −1 degree K (red). Rvalue is a proxy for the anomaly correlation coefficient for each product, so a higher number indicates a superior soil moisture product. At low NDVI values, the optimal bias scenario was found to be −10 degrees K (blue). When following the best performing soil moisture product (highest Rvalues) while progressing to higher NDVI values, the optimal bias scenario successively drops from blue (−10 degrees K) all the way to red (−1 degree K). This successive drop goes with 1 degree increments until the final scenario at the relatively high NDVI values around 0.85. The difference between the upper boundary of the bias correction scenarios and the benchmark (--) indicates these potential improvements that can be achieved via the proposed re-calibration of the LST relation.
Then, the next step is to extract a pixel-based optimal LST bias over the entire quasi-global domain based on the Rvalue results. The spatial distribution of the pixel-based optimal bias value is shown in Figure 3. In line with the scenarios presented in Figure 2, these optimal bias values range between −10 degrees K and −1 degree K. This figure again shows a distinct relation with vegetation density, where the largest bias optimal correction was shown over the very arid regions (−10 degrees K) and the smallest optimal bias correction was shown over the Amazonian and Indonesian rainforests (−1 degrees K).
In the final step, the re-calibrated linear regression (slope and offset) was determined by relating the vertically polarized Ka-band observations and the updated LST product. Where the updated LST product consists of the LST estimation acquired from the existing Ka-band regression equation plus the additive pixel-based optimal LST bias correction applied above. Equation (1) presents the LST regression used in the LPRM benchmark product, whereas Equation (2) presents our re-calibrated regression equation. In the following sections, the impact of this relatively simple change on the final quality of the AMSR-E LPRM ascending product is verified through the Rvalue technique (Section 4.2.1), the Triple Collocation technique (Section 4.2.2), and the ground-based observations acquired from the ISMN (Section 4.3). Finally, the multi-step optimization procedure was sequentially described in this Section, and to provide further guidance, is also visualized in a flowchart (Supplementary Materials; Figure S2).
LST = 0.898 × Tb(36.5V) + 44.2 [K]
LST = 0.844 × Tb(36.5V) + 54.1 [K],

4.2. Quasi-Global Verification

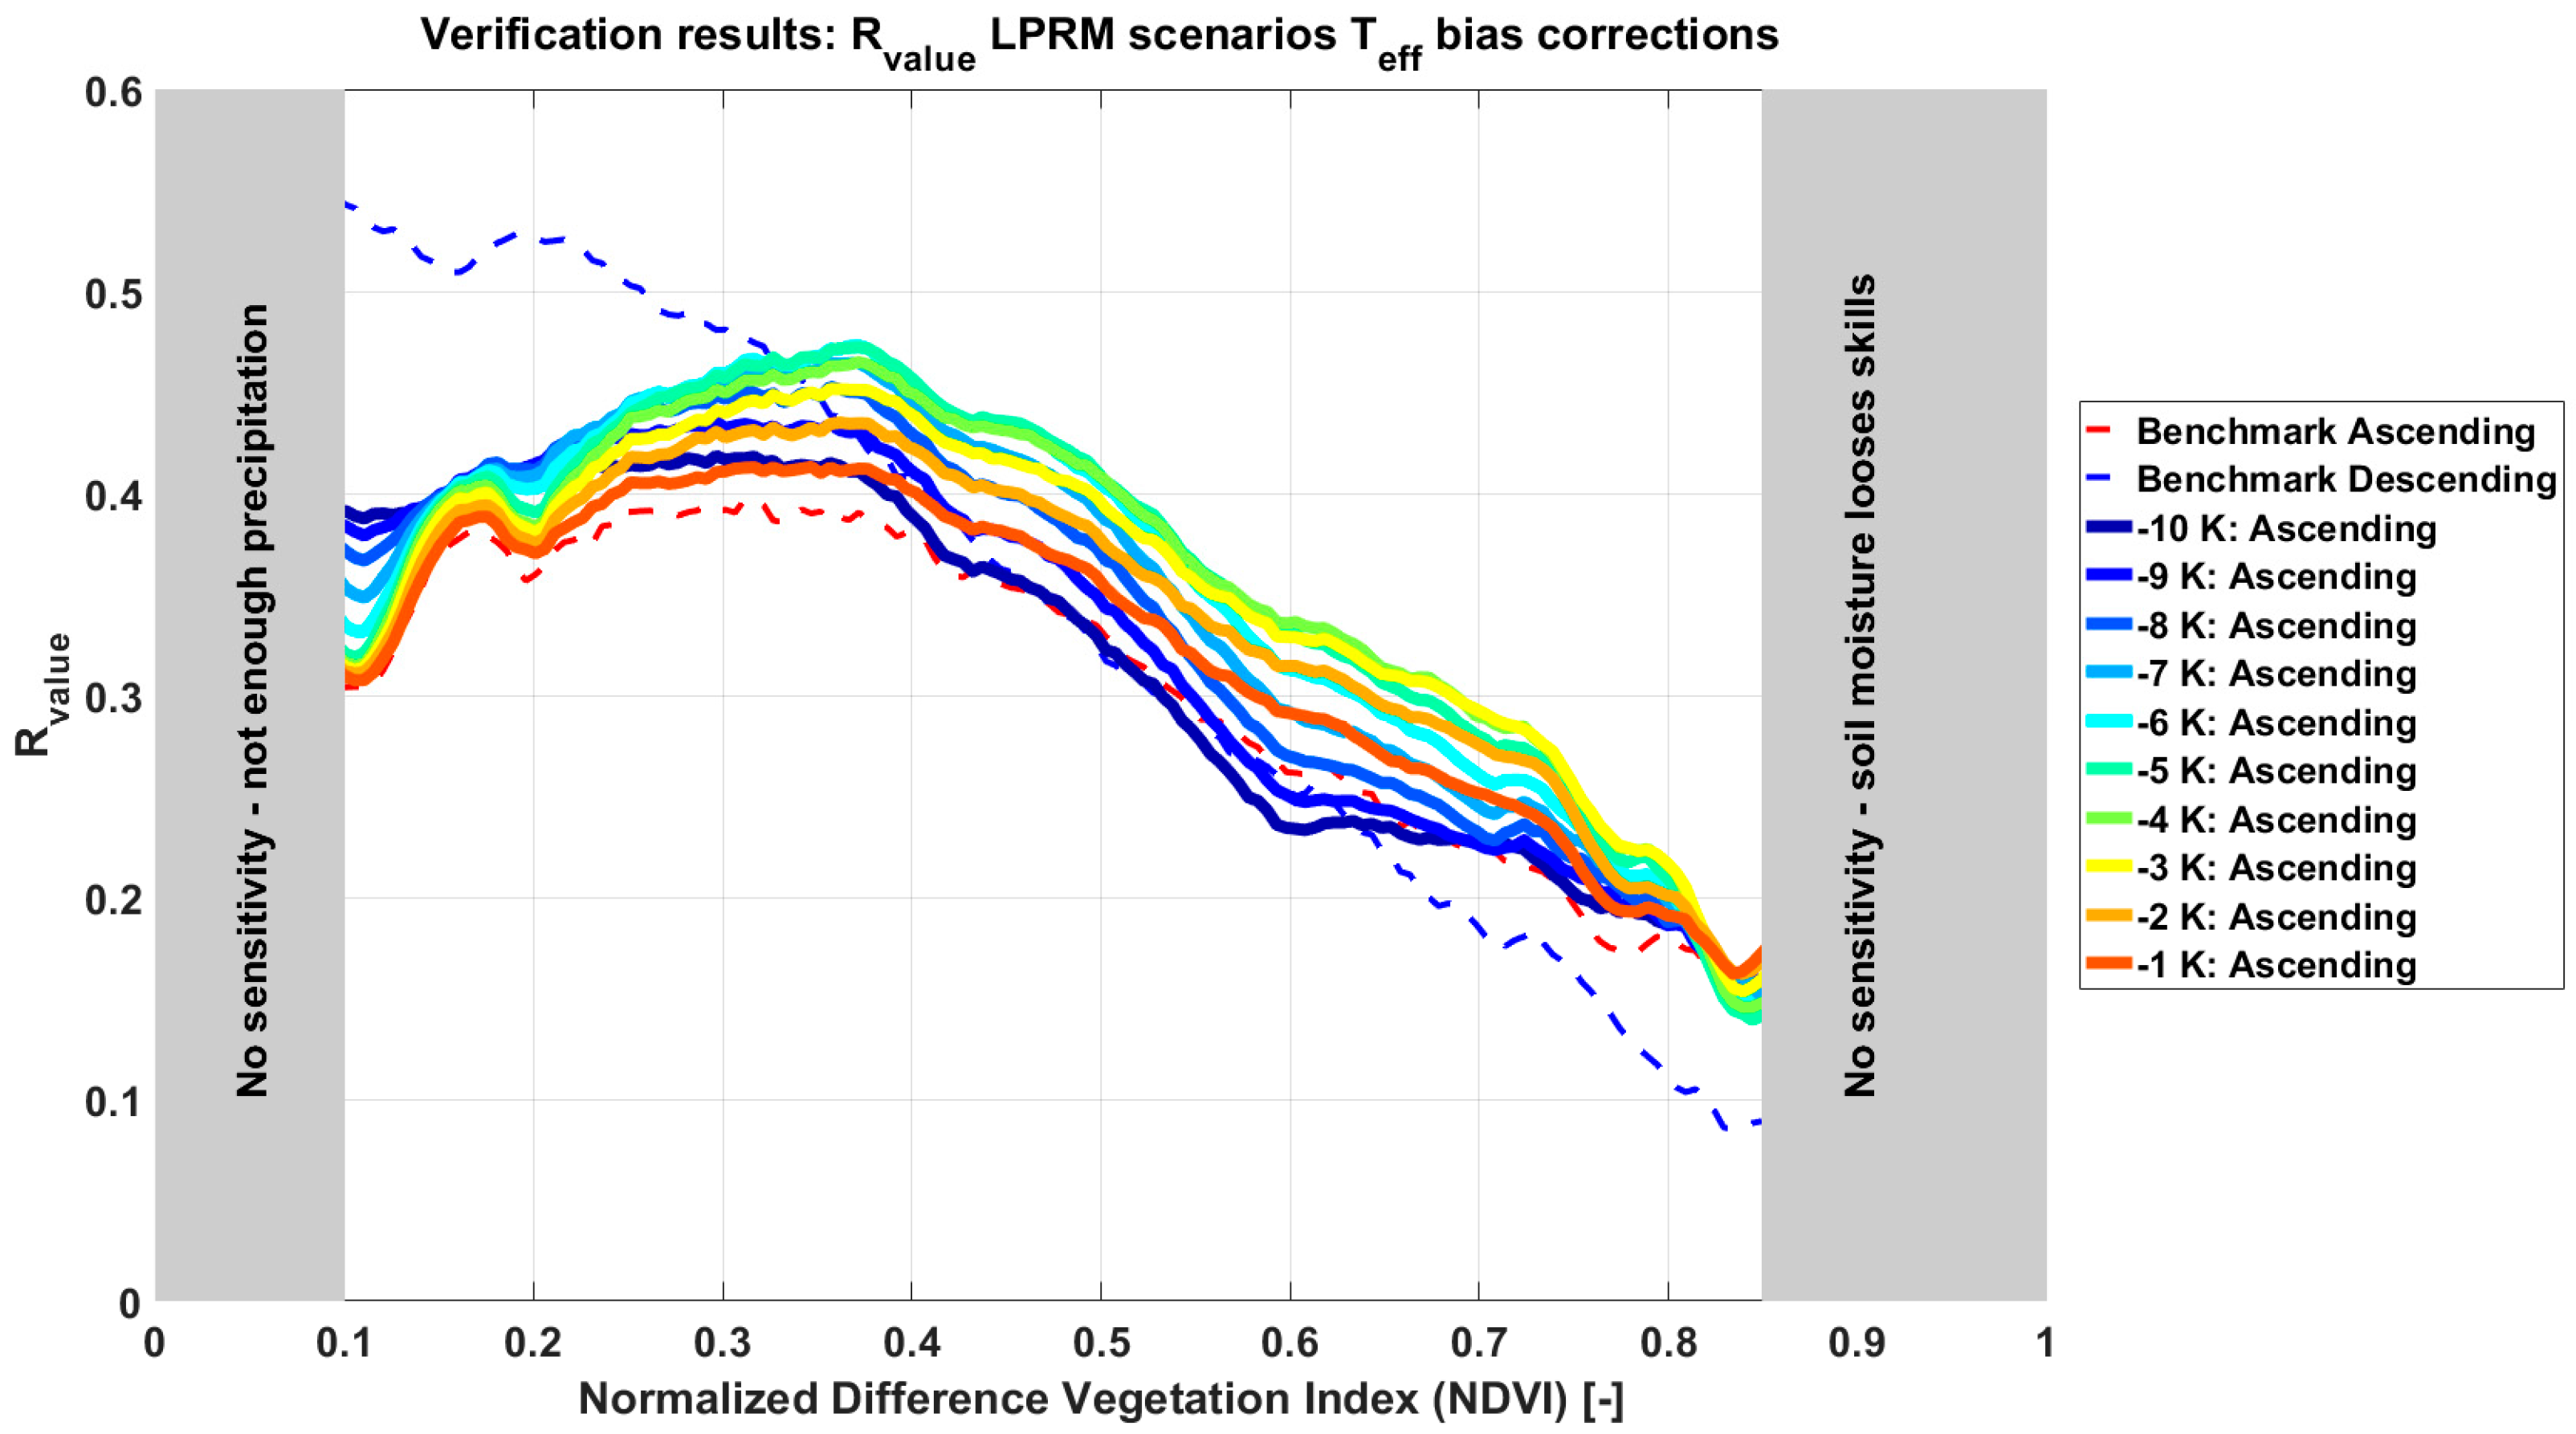
4.2.1. The Rvalue Results

In the next step, the LPRM algorithm applied to AMSR-E ascending observations was fed with the re-calibrated LST regression (Equation (2)) and the Rvalue technique was again used for verification purposes. It should be noted that this verification is not independent of the optimization technique, but such independence is provided by the additional application of verification techniques described in Section 4.2.2 (Triple Collocation) and Section 4.3 (ISMN). Results from the Rvalue technique were binned over the NDVI range, and are presented in Figure 4a. Verification results from the benchmark AMSR-E LPRM ascending fed by Equation (1) () are presented, as well as the verification results from the scenario utilizing the re-calibrated regression in Equation(2) (). Figure 4a consistently demonstrates an enhanced performance of the soil moisture product that uses the re-calibrated LST regression () compared to the benchmark product (), as the Rvalue is consistently higher.
Figure 4b presents the spatial distribution of the relative performance difference between this benchmark () and the re-calibrated soil moisture product () according to the Rvalue technique. This relative performance was expressed in a percentage to allow for a direct comparison against the independent verification results obtained by the Triple Collocation technique, as the Rvalue technique is a performance metric and the Triple Collocation is an error metric. This figure confirms the overall improvements that were made through the re-calibration step, where very arid regions such as the Sahara and Central Australia indicate improvements around 10%. In more densely vegetated regions, like Europe, the Eastern United States, Eastern China, and India, these improvements are generally higher, with a relative improvement of around 25%. The only exception was observed over the Amazonian and Indonesian rainforests, indicated by the orange colors in Figure 4b. It should be noted that these areas are generally masked in soil moisture applications for well-known [10] restrictions induced by the dominant canopy emission.

4.2.2. The Triple Collocation Results

Results obtained through the quasi-global Rvalue verification (Section 4.2.1) are not independent of the optimization procedure, as this technique was also used to re-calibrate the LST regression. In order to provide an independent verification, the Triple Collocation technique was also employed. Figure 5a presents results binned over NDVI, and they confirm the findings of the Rvalue technique. The Rvalue demonstrates an almost consistently better performance of the soil moisture product, determined through the re-calibrated LST relation indicated by consistently higher performance metrics. In contrast, the error metrics from the Triple Collocation show lower values almost consistently, which confirms the better performance of the soil moisture product determined through the re-calibrated LST relation. The only exception where verification results from the Rvalue and Triple Collocation disagree is over the very low NDVI values, associated with the very arid climate regions. The disagreement in arid climate regions is likely caused by shortcomings of the Rvalue technique, which requires rainfall as an input, as rainfall is infrequent in these extreme environments [7]. Additionally, it is well-known that surface soil moisture products disagree over such climate regions due to the limited soil moisture dynamics and the resulting amplified noise of, for example, sensor accuracy, algorithm uncertainties, and other input errors [8,11]. Under all other climate regimes, the larger dynamics of the natural signal varies stronger than these error-induced variabilities.
Figure 5b again presents the spatial distribution of the relative performance difference between this benchmark () and the re-calibrated soil moisture product (), but now according to the Triple Collocation technique, and again expressed as a percentage. This figure confirms the exception over the very arid climate regimes, where the verification techniques tend to disagree. Interestingly, in all other climate regimes, the agreement between Figure 4b and Figure 5b is striking. This high agreement was further confirmed by a quasi-global average increasing Rvalue of 16.5%, indicating a better performance, whereas the quasi-global averaged root mean square error from the Triple Collocation technique is reduced by 15.3%.

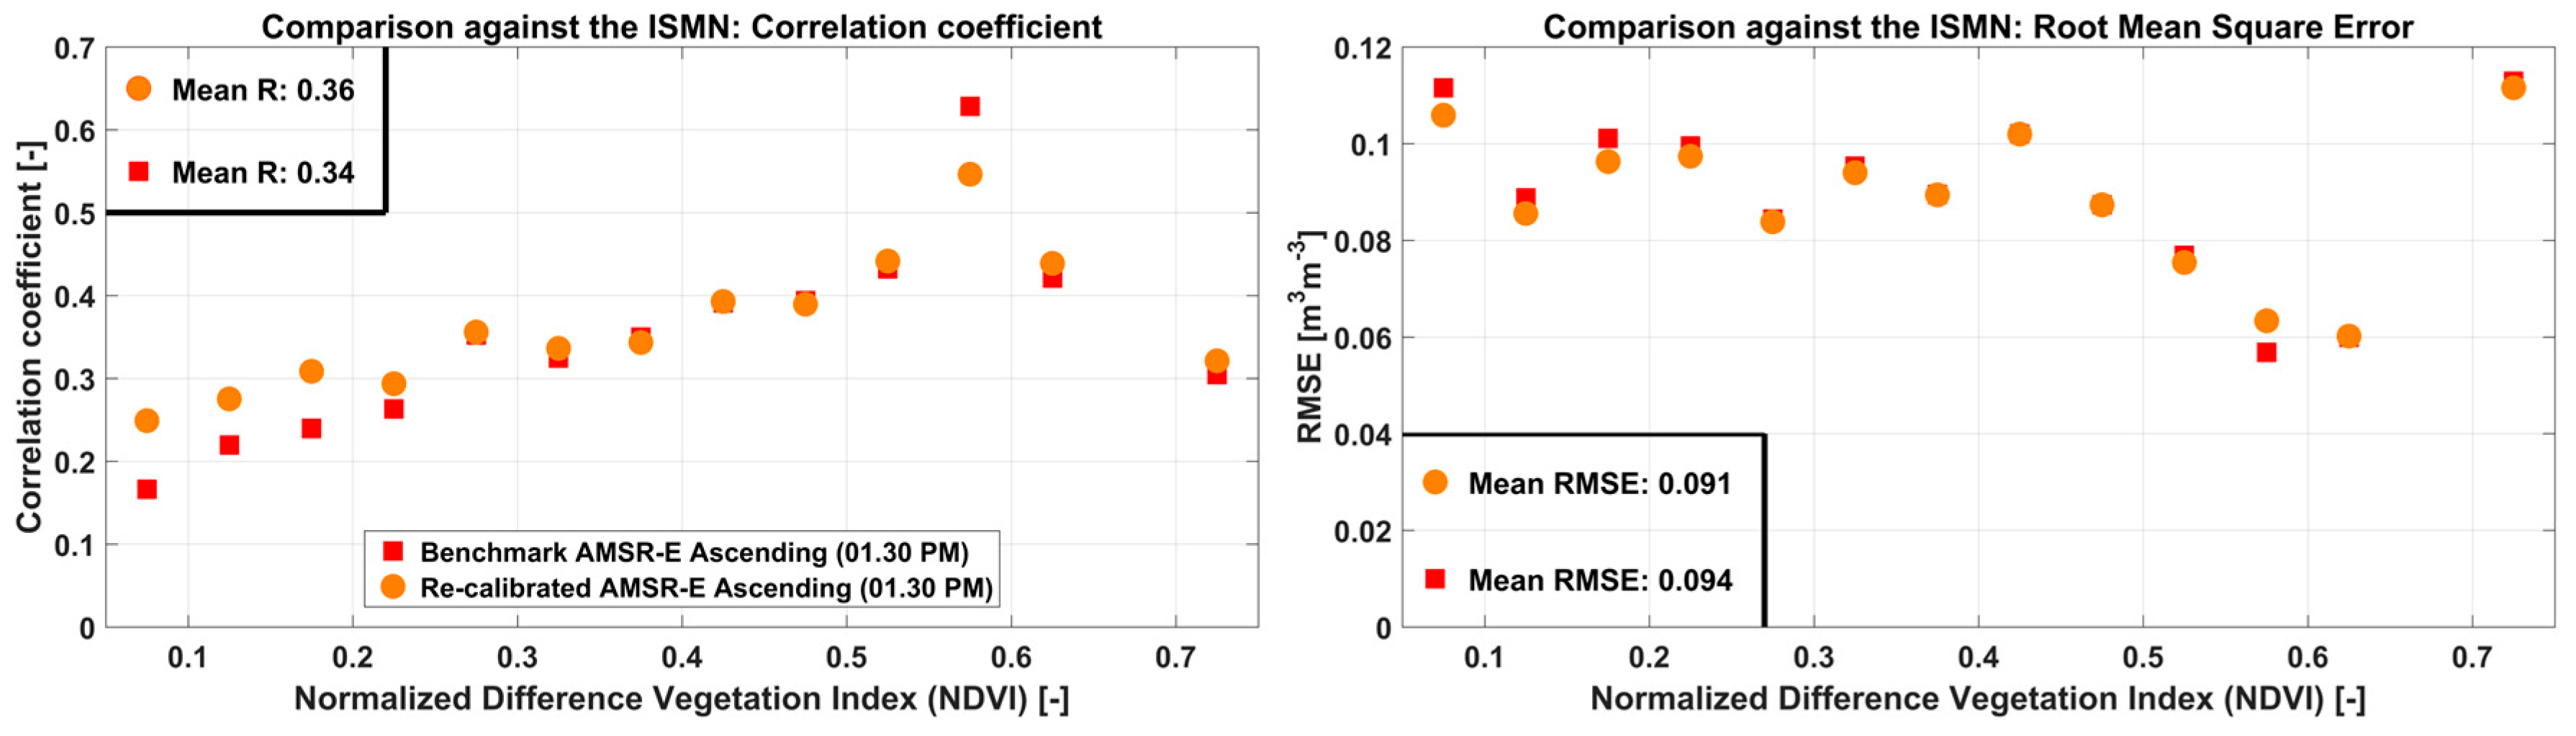
4.3. ISMN Verification

Finally, in situ soil moisture observations from the ISMN were used for additional verification in an effort to support our main findings determined through the two quasi-global verification techniques. As previously explained (Section 2.6), due to the likely long-term (9.5 years) inconsistencies in ground observations, this comparison was not performed on a soil moisture anomaly basis. Instead, the temporal correlation coefficients and root mean square errors were based on the original timeseries themselves. Additionally, relative to both the Rvalue and Triple Collocation techniques, the ISMN covers only a limited climate range; hence, the NDVI intervals used for the binning procedure were chosen to be 0.05, resulting in a significantly reduced number of bins. Figure 6 (left) presents the temporal correlation coefficient of the re-calibrated LST regression () and the benchmark product () against NDVI, whereas Figure 6 (right) yields similar analysis for the RMSE.
This analysis reveals generally better performance of the soil moisture product fed by the re-calibrated LST regression () when compared to the benchmark product (). This is indicated by an overall increase in temporal correlation coefficient and a reduction in RMSE over the NDVI range. It should be repeated that the natural heterogeneity of surface soil moisture, topographical complexity, and freeze or thaw issues complicate the comparison against the ISMN dataset. As a result, conclusions from this particular analysis are not directly comparable with Rvalue and Triple Collocation. Additionally, differences in data processing (NDVI binning and anomaly decomposition) will also lead to a reduced comparability. Nonetheless, overall findings confirm the main conclusions obtained through the Rvalue and Triple Collocation verification techniques on the improvements of the AMSR-E LPRM ascending dataset.

5. Discussion

Even though day-time observations significantly improve over almost all the climate regimes encountered at the quasi-global scale, the night-time soil moisture retrievals still remain superior for NDVI values up to 0.35, which are associated with (semi-) arid climate regions. This finding can likely be related to the large contrast in soil- (Ts) and canopy temperature (Tc) experienced around the daily peak temperature (01:30 pm). At higher NDVI values, the quality of the soil moisture retrievals observed during the challenging time at day-time (01:30 pm) are now better than those observed by the benchmark night-time (01:30 am) equivalent. These findings are increasingly important and allow for a better integration of both ascending and descending satellite paths in existing applications. This results in a doubling of the amount of soil moisture data advancing such applications, especially when simultaneously providing spatial and temporal dynamic error information [10] that can distinguish both satellite paths. It should also be noted that there are no further restrictions to applying this approach to any other passive microwave sensor used for the retrieval of soil moisture, though it should be noted that improvements likely depend on the acquisition time and the resulting contrast between Ts and Tc [9]. Therefore, the magnitude of expected improvements will likely be largest around the peak temperatures of the day.

6. Conclusion and Outlook

In this study, day-time soil moisture retrievals of the LPRM were successfully optimized through a quasi-global precipitation-based verification technique, the Rvalue. This optimization procedure led to a re-calibrated uniform relationship between high frequency observations (Ka-band; 36.5 GHz) and LST. The Rvalue results suggest that the skill to capture the temporal variability of day-time soil moisture increases by 16.5% at the quasi-global scale through the re-calibration. This number was determined against the publicly available and widely used AMSR-E LPRM soil moisture products retrieved from the ascending (01:30 pm) satellite path, which was used as benchmark. This number is also confirmed through an independent Triple Collocation verification over the same domain, demonstrating an average root mean square error reduction of 15.3%. An additional comparison against an extensive database (679 stations) also indicates a generally higher quality for the re-calibrated dataset, but care should be taken in the interpretation, due to different data processing steps.
The re-calibrated uniform land surface temperature relationship was determined by evaluating various land surface temperature scenarios in which biases were added to an existing linear regression. The range of the bias scenarios varied between −10 degrees K and +10 degrees K (with 1 degree K increments), but we focused on the negative bias scenarios, as positive biases consistently degraded the quality of the soil moisture retrievals (Supplementary Materials; Figure S1). These scenarios were evaluated through the Rvalue technique, resulting in optimal bias values on top of the existing regression. These optimal bias values were incorporated in order to re-calibrate the existing linear regression resulting in a quasi-global uniform LST relation for day-time observations. Aside from the improved day-time dataset, this study furthermore provides insights on the relative quality of soil moisture retrieved from AMSR-E’s day- and night-time observations.
Further improvements can possibly be made by disentangling soil and canopy temperature and individually feeding the radiative transfer equation with those. Based on the results presented here, such an approach should primarily focus on sparsely vegetated regions (NDVI < 0.35) where night-time observations remain superior over the day-time observations. Another follow-up study will combine the improvements obtained by the updated roughness and single scattering albedo parameterization and a vegetation correction [45], and the improvements obtained by the isolated LST calibration as presented here. It should finally be noted that there are no theoretical restrictions to applying this optimization procedure to the night-time observation (01:30 am) of the AMSR-E sensor or to the new generation sensors observing in the L-band frequency.

Supplementary Materials

The following are available online at www.mdpi.com/2225-1154/4/4/50/s1, Figure S1: The distinct Rvalue results for the positive bias scenarios ranging from +1 to +10 degrees K, as well as the benchmark products. These additive bias scenarios consistently degrade the quality of the soil moisture retrievals; hence, the manuscript focuses on the negative bias scenarios from Figure 2, Figure S2: A flowchart that sequentially describes the multi-step optimization procedure. This procedure starts with the benchmark approach, followed by the additive bias scenarios that were used within the LPRM with the re-calibrated LST relation.

Acknowledgments

This work has been undertaken as part of a Discovery Project (DP140102394) funded by the Australian Research Council. Partial funding was also provided by the European Space Agency through the Climate Change Initiative for Soil Moisture (Contract 4000104814/11/I-NB) and through Wade Crow’s membership on the NASA SMAP mission science team. We are furthermore grateful to all contributors to the datasets that were used in this study. Particularly, we thank the teams from NASA, the Japanese Aerospace Exploration Agency and the Technical University Vienna for making their datasets publically available.

Author Contributions

Robert M. Parinussa initiated the study and did the analysis under the overall supervision of Richard A. M. de Jeu, while Wade T. Crow and Thomas R. H. Holmes provided regular feedback on the analysis in particular in the early stages of the study. The analysis against ground data and the statistical verification technique were a joined effort between Robert M. Parinussa, Robin van der Schalie and Fangni Lei. All authors contributed to the editing of the manuscript and to the discussion and interpretation of the results.

Conflicts of Interest

The authors declare no conflict of interest.

References

  1. Loew, A.; Holmes, T.; de Jeu, R. The European heat wave 2003: Early indicators from multisensoral microwave remote sensing? J. Geophys. Res. 2009, 114. [Google Scholar] [CrossRef] [Green Version]
  2. Miralles, D.; van den Berg, M.; Gash, J.; Parinussa, R.; de Jeu, R.; Beck, H.; Holmes, T.; Jimenez, C.; Verhoest, N.; Dorigo, W.; et al. El Nino-La Nina cycle and recent trends in continental evaporation. Nat. Clim. Chang. 2014, 4, 1–4. [Google Scholar] [CrossRef]
  3. Brocca, L.; Melone, F.; Moramarco, T.; Wagner, W.; Naeimi, V.; Bartalis, Z.; Hasenauer, S. Improving runoff prediction through the assimilation of the ASCAT soil moisture product. Hydrol. Earth Syst. Sci. 2010, 14, 1881–1893. [Google Scholar] [CrossRef]
  4. Bolten, J.; Crow, W. Improved prediction of quasi global vegetation conditions using remotely sensed surface soil moisture. Geophys. Res. Lett. 2012, 39, L19406. [Google Scholar] [CrossRef]
  5. Mladenova, I.; Jackson, T.; Njoku, E.; Bindlish, R.; Chan, S.; Cosh, M.; Holmes, T.; de Jeu, R.; Jones, L.; Kimball, J.; et al. Remote monitoring of soil moisture using passive microwave-based techniques—Theoretical basis and overview of selected algorithms for AMSR-E. Remote Sens. Environ. 2014, 144, 197–213. [Google Scholar] [CrossRef]
  6. Mo, T.; Choudhury, B.; Schmugge, T.; Wang, J.; Jackson, T. A model for microwave emission from vegetation-covered fields. J. Geophys. Res. 1982, 87, 11229–11237. [Google Scholar] [CrossRef]
  7. Parinussa, R.; Holmes, T.; Yilmaz, M.; Crow, W. The impact of land surface temperature on soil moisture anomaly detection from passive microwave observations. Hydrol. Earth Syst. Sci. 2011, 15, 3135–3151. [Google Scholar] [CrossRef]
  8. De Jeu, R.; Wagner, W.; Holmes, T.; Dolman, A.; van de Giesen, N.; Friesen, J. Global soil moisture patterns observed by space borne microwave radiometers and scatterometers. Surv. Geophys. 2008, 29, 399–420. [Google Scholar] [CrossRef] [Green Version]
  9. Lei, F.; Crow, W.; Shen, H.; Parinussa, R.; Holmes, T. The impact of local acquisition time on the accuracy of microwave surface soil moisture retrievals over the contiguous United States. Remote Sens. 2015, 7, 13448–13465. [Google Scholar] [CrossRef]
  10. Parinussa, R.; Meesters, A.; Liu, Y.; Dorigo, W.; Wagner, W.; de Jeu, R. Error estimates for near-real-time soil moisture as derived from the land parameter retrieval model. IEEE Geosci. Remote Sens. Lett. 2011, 8, 779–783. [Google Scholar] [CrossRef]
  11. Parinussa, R.; Holmes, T.; de Jeu, R. Soil moisture retrievals from the WindSat spaceborne polarimetric microwave radiometer. IEEE Trans. Geosci. Remote Sens. 2012, 50, 2683–2694. [Google Scholar] [CrossRef]
  12. Schmugge, T. Remote sensing of soil moisture: Recent advances. IEEE Trans. Geosci. Remote Sens. 1983, 21, 336–344. [Google Scholar] [CrossRef]
  13. Owe, M.; Jeu, R.; Holmes, T. Multisensor historical climatology of satellite-derived global land surface moisture. J. Geophys. Res. Earth Surf. 2008, 113. [Google Scholar] [CrossRef] [Green Version]
  14. Oliva, R.; Daganzo, E.; Kerr, Y.; Mecklenburg, S.; Nieto, S.; Richaume, P.; Gruhier, C. SMOS radio frequency interference scenario: Status and actions taken to improve the RFI environment in the 1400-1427-MHz passive band. IEEE Trans. Geosci. Remote Sens. 2012, 50, 1427–1439. [Google Scholar] [CrossRef] [Green Version]
  15. De Nijs, A.; Parinussa, R.; Jeu, R.; Schellekens, J.; Holmes, T. A methodology to determine radio frequency interference in AMSR2 observations. IEEE Trans. Geosci. Remote Sens. 2015, 53, 5147–5159. [Google Scholar] [CrossRef]
  16. Crow, W.; Miralles, D.; Cosh, M. A quasi-global evaluation system for satellite-based surface soil moisture retrievals. IEEE Trans. Geosci. Remote Sens. 2010, 48, 2516–2527. [Google Scholar] [CrossRef]
  17. Huffman, G.; Adler, R.; Bolvin, D.; Gu, G.; Nelkin, E.; Bowman, K.; Hong, Y.; Stocker, E.; Wolff, D. The TRMM Multisatellite Precipitation Analysis (TMPA): Quasi-global, multiyear, combined-sensor precipitation estimates at fine scales. J. Hydrometeorol. 2007, 8, 38–55. [Google Scholar] [CrossRef]
  18. Wagner, W.; Lemoine, G.; Rott, H. A method for estimating soil moisture from ERS scatterometer and soil data. Remote. Sens. Environ. 1999, 70, 191–207. [Google Scholar] [CrossRef]
  19. Naeimi, V.; Scipal, K.; Bartalis, Z.; Hasenauer, S.; Wagner, W. An improved soil moisture retrieval algorithm for ERS and METOP scatterometer observations. IEEE Trans. Geosci. Remote Sens. 2009, 47, 1999–2013. [Google Scholar] [CrossRef]
  20. Brocca, L.; Hasenauer, S.; Lacava, T.; Melone, F.; Moramarco, T.; Wagner, W.; Dorigo, W.; Matgen, P.; Martinez-Fernandez, J.; Llorens, P.; et al. Soil moisture estimation through ASCAT and AMSR-E sensors: An intercomparison and validation study across Europe. Remote Sens. Environ. 2011, 155, 3390–3408. [Google Scholar] [CrossRef]
  21. Liu, Y.; Parinussa, R.; Dorigo, W.; de Jeu, R.; Wagner, W.; van Dijk, A.; McCabe, M.; Evans, J. Developing an improved soil moisture dataset by blending passive and active microwave satellite-based retrievals. Hydrol. Earth Syst. Sci. 2011, 15, 425–236. [Google Scholar] [CrossRef] [Green Version]
  22. Wanders, N.; Karssenberg, D.; Bierkens, M.; Parinussa, R.; de Jeu, R.; van Dam, J.; de Jong, S. Observation uncertainty of satellite soil moisture products determined with physically-based modeling. Remote Sens. Environ. 2012, 127, 341–356. [Google Scholar] [CrossRef]
  23. Figa-Saldana, J.; Wilson, J.; Attema, E.; Gelsthorpe, R.; Drinkwater, M.; Stofellen, A. The advanced scatterometer (ASCAT) on the meteorological operational (MetOp) platform: A follow on for European wind scatterometers. J. Remote Sens. 2002, 28, 404–412. [Google Scholar] [CrossRef]
  24. Reichle, R.; Koster, R.; de Lannoy, G.; Forman, B.; Liu, Q.; Mahanama, S.; Touré, A. Assessment and enhancement of the MERRA land surface hydrology estimates. J. Clim. 2011, 24, 6322–6338. [Google Scholar] [CrossRef]
  25. Rienecker, M.; Suarez, M.; Gelaro, R.; Todling, R.; Bacmeister, J.; Liu, E.; Bosilovich, M.; Schubert, S.; Takacs, L.; Kim, G.; et al. MERRA–NASA’s modern-era retrospective analysis for research and applications. J. Clim. 2011, 24, 3624–3648. [Google Scholar] [CrossRef]
  26. Holmes, T.; Jackson, J.; Reichle, R.; Basara, J. An assessment of surface soil temperature products from numerical weather prediction models using ground-based measurements. Water Resour. Res. 2011, 48. [Google Scholar] [CrossRef]
  27. Dorigo, W.; Scipal, K.; Parinussa, R.; Liu, Y.; Wagner, W.; de Jeu, R.; Naeimi, V. Error characterisation of global active and passive microwave soil moisture datasets. Hydrol. Earth Syst. Sci. 2010, 14, 2605–2616. [Google Scholar] [CrossRef] [Green Version]
  28. Dorigo, W.; Wagner, W.; Hohensinn, R.; Hahn, S.; Paulik, C.; Xaver, A.; Gruber, A.; Drusch, M.; Mecklenburg, S.; van Oevelen, P.; et al. The international soil moisture network: A data hosting facility for global in situ soil moisture measurements. Hydrol. Earth Syst. Sci. 2011, 15, 1675–1698. [Google Scholar] [CrossRef]
  29. Dorigo, W.; Xaver, A.; Vreugdenhil, M.; Gruber, A.; Hegyiová, A.; Sanchis-Dufau, A.; Zamojski, D.; Cordes, C.; Wagner, W.; Drusch, M. Global automated quality control of in situ soil moisture data from the international soil moisture network. Vadose Zone J. 2013, 12. [Google Scholar] [CrossRef]
  30. Yee, M.; Walker, J.; Monerris, A.; Rudiger, C.; Jackson, T. On the identification of representative in situ soil moisture monitoring stations for the validation of SMAP soil moisture products in Australia. J. Hydrol. 2016, 537, 367–381. [Google Scholar] [CrossRef]
  31. Reichle, R.; Koster, R. Bias reduction in short records of satellite soil moisture. Geophys. Res. Lett. 2004, 31. [Google Scholar] [CrossRef]
  32. Owe, M.; van de Griend, A. On the relationship between thermodynamic surface temperature and high frequency (37 GHz) vertical polarization brightness temperature under semi-arid conditions. Int. J. Remote Sens. 2001, 22, 3521–3532. [Google Scholar] [CrossRef]
  33. Van der Schalie, R.; Parinussa, R.; Renzullo, L.; van Dijk, A.; Su, C.; de Jeu, R. SMOS soil moisture retrievals using the land parameter retrieval model: Evaluation over the murrumbidgee catchment, southeast Australia. Remote. Sens. Environ. 2015, 163, 70–79. [Google Scholar] [CrossRef]
  34. Van der Schalie, R.; Kerr, Y.; Wigneron, J.; Rodriguez-Fernandez, N.; Al-Yaari, A.; de Jeu, R. Global SMOS soil moisture retrievals from the land parameter retrieval model. Int. J. Appl. Earth Observ. Geoinf. 2016, 45, 125–134. [Google Scholar]
  35. De Jeu, R.; Holmes, T.; Panciera, R.; Walker, J. Parameterization of the land parameter retrieval model for L-band observations using the NAFE’05 data Set. IEEE Geosci. Remote Sens. Lett. 2009, 6, 630–634. [Google Scholar] [CrossRef]
  36. Jung, M.; Reichstein, M.; Ciais, P.; Seneviratne, S.I.; Sheffield, J.; Goulden, M.L.; Bonan, G.; Cescatti, A.; Chen, J.; De Jeu, R.; et al. Recent decline in the global land evapotranspiration trend due to limited moisture supply. Nature 2010, 467, 951–954. [Google Scholar] [CrossRef] [PubMed]
  37. Parinussa, R.; Wang, G.; Holmes, T.; Liu, Y.; Dolman, A.; de Jeu, R.; Jiang, T.; Zhang, P.; Shi, J. Global surface soil moisture from the microwave radiation imager onboard the Fengyun-3B satellite. Int. J. Remote Sens. 2014, 35, 7007–7029. [Google Scholar] [CrossRef]
  38. Loew, A.; Stacke, T.; Dorigo, W.; de Jeu, R.; Hagemann, S. Potential and limitations of multidecadal satellite soil moisture observations for selected climate model evaluation studies. Hydrol. Earth Syst. Sci. 2013, 17, 3523–3542. [Google Scholar] [CrossRef]
  39. Su, C.; Zhang, J.; Gruber, A.; Parinussa, R.; Ryu, D.; Crow, W.; Wagner, W. Error decomposition of nine passive and active microwave satellite soil moisture datasets over Australia. Remote. Sens. Environ. 2016, 182, 128–140. [Google Scholar] [CrossRef]
  40. Wagner, W.; Naeimi, V.; Scipal, K.; de Jeu, R.; Martinez-Fernandez, J. Soil moisture from operational meteorological satellites. Hydrogeol. J. 2007, 15, 121–131. [Google Scholar] [CrossRef]
  41. Jackson, T.; Cosh, M.; Bindlish, R.; Starks, P.; Bosch, D.; Seyfried, M.; Goodrich, D.; Moran, M.; Du, J. Validation of advanced microwave scanning radiometer soil moisture. IEEE Trans. Geosci. Remote Sens. 2010, 48, 4256–4272. [Google Scholar] [CrossRef]
  42. Meesters, A.; de Jeu, R.; Owe, M. Analytical derivation of the vegetation optical depth from the microwave polarization difference index. IEEE Trans. Geosci. Remote Sens. 2005, 2, 121–123. [Google Scholar] [CrossRef]
  43. Wigneron, J.P.; Kerr, Y.; Waldteufel, P.; Saleh, K.; Escorihuela, M.J.; Richaume, P.; Ferrazzoli, P.; De Rosnay, P.; Gurney, R.; Calvet, J.C.; et al. L-band Microwave Emission of the Biosphere (L-MEB) model: Description and calibration against experimental datasets over crop fields. Remote. Sens. Environ. 2007, 107, 639–655. [Google Scholar] [CrossRef]
  44. Reynold, C.; Jackson, T.; Rawls, W. Estimating available water content by linking the FAO soil map of the world with global soil profile database and pedotransfer functions. In Proceedings of the AGU 1999 Springs Meeting, Boston, MA, USA, 1–4 June 1999.
  45. Van der Schalie, R.; de Jeu, R.; Kerr, Y.; Wigneron, J.; Rodríguez-Fernández, N.; Al-Yaari, A.; Parinussa, R.; Mecklenburg, S.; Drusch, M. Towards a consistent surface soil moisture record from SMOS and AMSR-E through a radiative transfer based approach. Remote Sens. Environ. 2016. under review. [Google Scholar]
  46. Kim, S.; Parinussa, R.; Liu, Y.; Johnson, F.; Sharma, A. A framework for combining multiple soil moisture retrievals based on maximizing temporal correlation. Geophys. Res. Lett. 2015, 42, 6662–6670. [Google Scholar] [CrossRef]
  47. Crow, W.; Zhan, X. Continental-scale evaluation of remotely sensed soil moisture products. IEEE Geosci. Remote Sens. Lett. 2007, 4, 451–455. [Google Scholar] [CrossRef]
  48. Crow, W.; Wagner, W.; Naeimi, V. The impact of radar incidence angle on soil moisture retrieval skill. IEEE Geosci. Remote Sens. Lett. 2010, 73, 501–505. [Google Scholar] [CrossRef]
  49. Miralles, D.; Crow, W.; Cosh, M. Estimating spatial sampling errors in coarse-scale soil moisture estimates derived from point-scale observations. J. Hydrometeorol. 2010, 11, 1423–1429. [Google Scholar] [CrossRef]
Figure 1. Results from the Rvalue verification technique from the descending path (01:30 am ) and ascending path (01:30 pm ) for the benchmark Advanced Microwave Scanning Radiometer for Earth Observing System (AMSR-E) Land Parameter Retrieval Model (LPRM) datasets.
Climate 04 00050 g001
Figure 2. The distinct Rvalue results for the various bias scenarios (ranging from −10 to −1 degrees K), as well as the benchmark products. The gradual change over the Normalized Difference Vegetation Index (NDVI) for the most optimal bias scenario was used to re-calibrate the linear regression used in the benchmark product.
Climate 04 00050 g002
Figure 3. The quasi-global (50°N–50°S) spatial distribution of the optimal bias value, imposed on top of the currently used linear regression for re-calibration purposes. These optimal values range between −10 and −1 degrees K and show a distinct relation with vegetation density.
Climate 04 00050 g003
Figure 4. (a) Verification results for the Rvalue technique binned over the entire NDVI range were presented in Figure 4a. This figure demonstrates an enhanced performance of the soil moisture product utilizing the re-calibrated land surface temperature (LST) regression () compared to the benchmark product (); (b) Quasi-global Rvalue performance differences between the benchmark and re-calibrated product (expressed in a relative percentage).
Climate 04 00050 g004
Figure 5. (a) The independent verification results of the Triple Collocation (TC) technique binned over the entire NDVI range were presented in Figure 5a. These results confirm the overall findings of the Rvalue technique; (b) Quasi-global Triple Collocation performance differences between the benchmark and re-calibrated product (expressed in a relative percentage).
Climate 04 00050 g005
Figure 6. Comparison of in situ soil moisture and AMSR-E retrievals fed by the re-calibrated LST regression () and the benchmark product (). An almost consistent increase in temporal correlation coefficient and a reduced RMSE indicate enhancements through the re-calibrated LST relation. A note should be made that results are not directly comparable with the Rvalue and Triple Collocation verification techniques, but that general findings are supported through this analysis.
Climate 04 00050 g006

