Article

Evaluation of TRMM 3B42 V7 Rainfall Product over the Oum Er Rbia Watershed in Morocco

1
Faculté des Sciences et Techniques, Université Sultan Moulay Slimane, B.P. 523, Béni-Mellal 23030, Maroc
2
IRD-HydroSciences, Montpellier 34090, France
3
CESBIO (Université de Toulouse, CNRS, CNES, IRD), 18 Av. Edouard Belin BPI 280, Toulouse 31401 CEDEX 9, France
4
Institut National de la Recherche Agronomique, B.P 415 R.P, Rabat 10000, Maroc
5
Faculté des Sciences et Techniques, Université Cadi ayyad, B.P 549, Marrakech 40000, Maroc
6
Agence du bassin Hydraulique d’Oum Er Rabia, B.P 511, Béni Mellal 23000, Maroc
*
Authors to whom correspondence should be addressed.
Climate 2017, 5(1), 1; https://doi.org/10.3390/cli5010001
Submission received: 29 October 2016 / Revised: 23 December 2016 / Accepted: 26 December 2016 / Published: 4 January 2017

Abstract

:
In arid and semi-arid areas, rainfall is often characterized by a strong spatial and temporal variability. These environmental factors, combined with the sparsity of the measurement networks in developing countries, constitute real constraints for water resources management. In recent years, several spatial rainfall measurement sources have become available, such as TRMM data (Tropical Rainfall Measurement Mission). In this study, the TRMM 3B42 Version 7 product was evaluated using rain gauges measurements from 19 stations in the Oum-Er-Bia (OER) basin located in the center of Morocco. The relevance of the TRMM product was tested by direct comparison with observations at different time scales (daily, monthly, and annual) between 1998 and 2010. Results show that the satellite product provides poor estimations of rainfall at the daily time scale giving an average Pearson correlation coefficient (r) of 0.2 and average Root Mean Square Error (RMSE) of 10 mm. However, the accuracy of TRMM rainfall is improved when temporally averaged to monthly time scale (r of 0.8 and RMSE of 28 mm) or annual time scale (r of 0.71 and RMSE of 157 mm). Moreover, improved correlation with observed data was obtained for data spatially averaged at the watershed scale. Therefore, at the monthly and annual time scales, TRMM data can be a useful source of rainfall data for water resources monitoring and management in ungauged basins in semi-arid regions.

1. Introduction

The quantification of water supply is a major concern worldwide, and particularly in regions characterized by a semi-arid to arid climate. These regions frequently face problems of water resources management in an environment of scarcity and droughts [1,2]. Certainly, the availability of water in these areas is one of the main factors influencing socio-economic development, especially when these regions are based largely on revenues of the agriculture [3,4,5]. However, the constraints in such context marked by precipitations with a high spatial heterogeneity and a strong irregularity in time [6,7] pose great challenges for any attempt to accurately measure this resource [8,9,10].
The rain gauges are the main instruments to provide basic measures of precipitation in a watershed. Each individual rain gauge provides a continuous measurement of rainfall over time, but these measures can only be representative of relatively small areas. The WMO (World Meteorological Organization) in 1994 indicated that in mountainous regions a rain gauge is required every 250 km2 in order to have an optimal coverage [11]. Nevertheless, the sparsity of the networks in developing countries, particularly in mountainous areas, may strongly limit the estimation of these intakes on the watershed.
In recent years, remote sensing data have been widely used in the climate field, particularly for estimating precipitations [12,13,14,15]. Several precipitation data sets derived from various remote sensing data have been released. They provide estimation of rainfall and allow the spatiotemporal monitoring of rainfall variability at a global scale [16]. On the one hand, there are models that provide rainfall estimates using infrared satellite imagery, such as PERSIANN (Precipitation Estimation from Remote Sensing Information using Artificial Neural Network, [17]), algorithms, and techniques like MIRAA (Microwave/Infrared Rain Rate Algorithm, [18]) and CMORPH (CPC MORPHing technique, [19]) which estimates rainfall based on passive microwave and infrared satellite data. On the other hand, there is TRMM (Tropical Rainfall Measurement Mission), a space mission that provides several products of rain estimates from a combination of passive microwave, visible/infrared, and rainfall radar data. Furthermore, these products can be an important source of rainfall data at the regional and local scales due to their global availability and high measurement frequencies. Combining rainfall data derived from these missions with punctual data measured by rain gauges can greatly improve the accuracy of rainfall estimations at the catchment scale, overcoming the challenges related to data availability [20,21].
Over the years, TRMM, which was primarily designed to monitor and study tropical rainfall, has proved to be an important source of information in many application fields, such as monitoring the global hydrological cycle [22,23,24], floods [25,26,27], and drought [28,29,30]. Indeed, the evaluation of TRMM data against rain gauges has been conducted in various previous studies around the world. Some studies have evaluated the rainfall estimates from TRMM in parallel with other satellite products [31,32,33,34]. Al Mazroui [35] and Mantas et al. [36] have focused their work on the TRMM product by evaluating its accuracy on different time steps and in different geographical and topographical contexts. In addition to the direct comparison against rain gauges, Collischonn et al. [37] provided an assessment based on hydrological modeling at a daily time step. Islam and Uyeda [38] compared daily rainfall from TRMM 3B42 to rain-gauge measurements over Bangladesh. Huang et al. [39] evaluated the TMPA V7 products with a relatively dense rain gauge network in Beijing and adjacent regions for an extreme precipitation event. In Morocco, only a few studies have been undertaken with the TRMM products. Milewski et al. [40] have evaluated four TMPA 3B42 products (V6, V7 temporary, V7, reel time V7) against rain gauges data depending on climatic zones and topography. The study covered a large part of the Moroccan territory, but the analysis was focused only for the average annual precipitation. The work done by Tramblay [41] over the Oued El Makhazine basin in northern Morocco shows the potential of these data in hydrological modeling.
The objective of this study is to evaluate the robustness and the accuracy of 3B42 V7 TRMM (Tropical Rainfall Measuring Mission) product to estimate rainfall over the Oum Er-Rbia (OER) basin in the center of Morocco. We evaluate the 3B42 V7 rainfall estimates at three different time scales (daily, monthly, and annually). Furthermore, we compared the product and rain gauges data based on a zonal scale, considering the average rainfall from rain gauges and TRMM pixels within the same sub watershed.

2. Materials and Methods
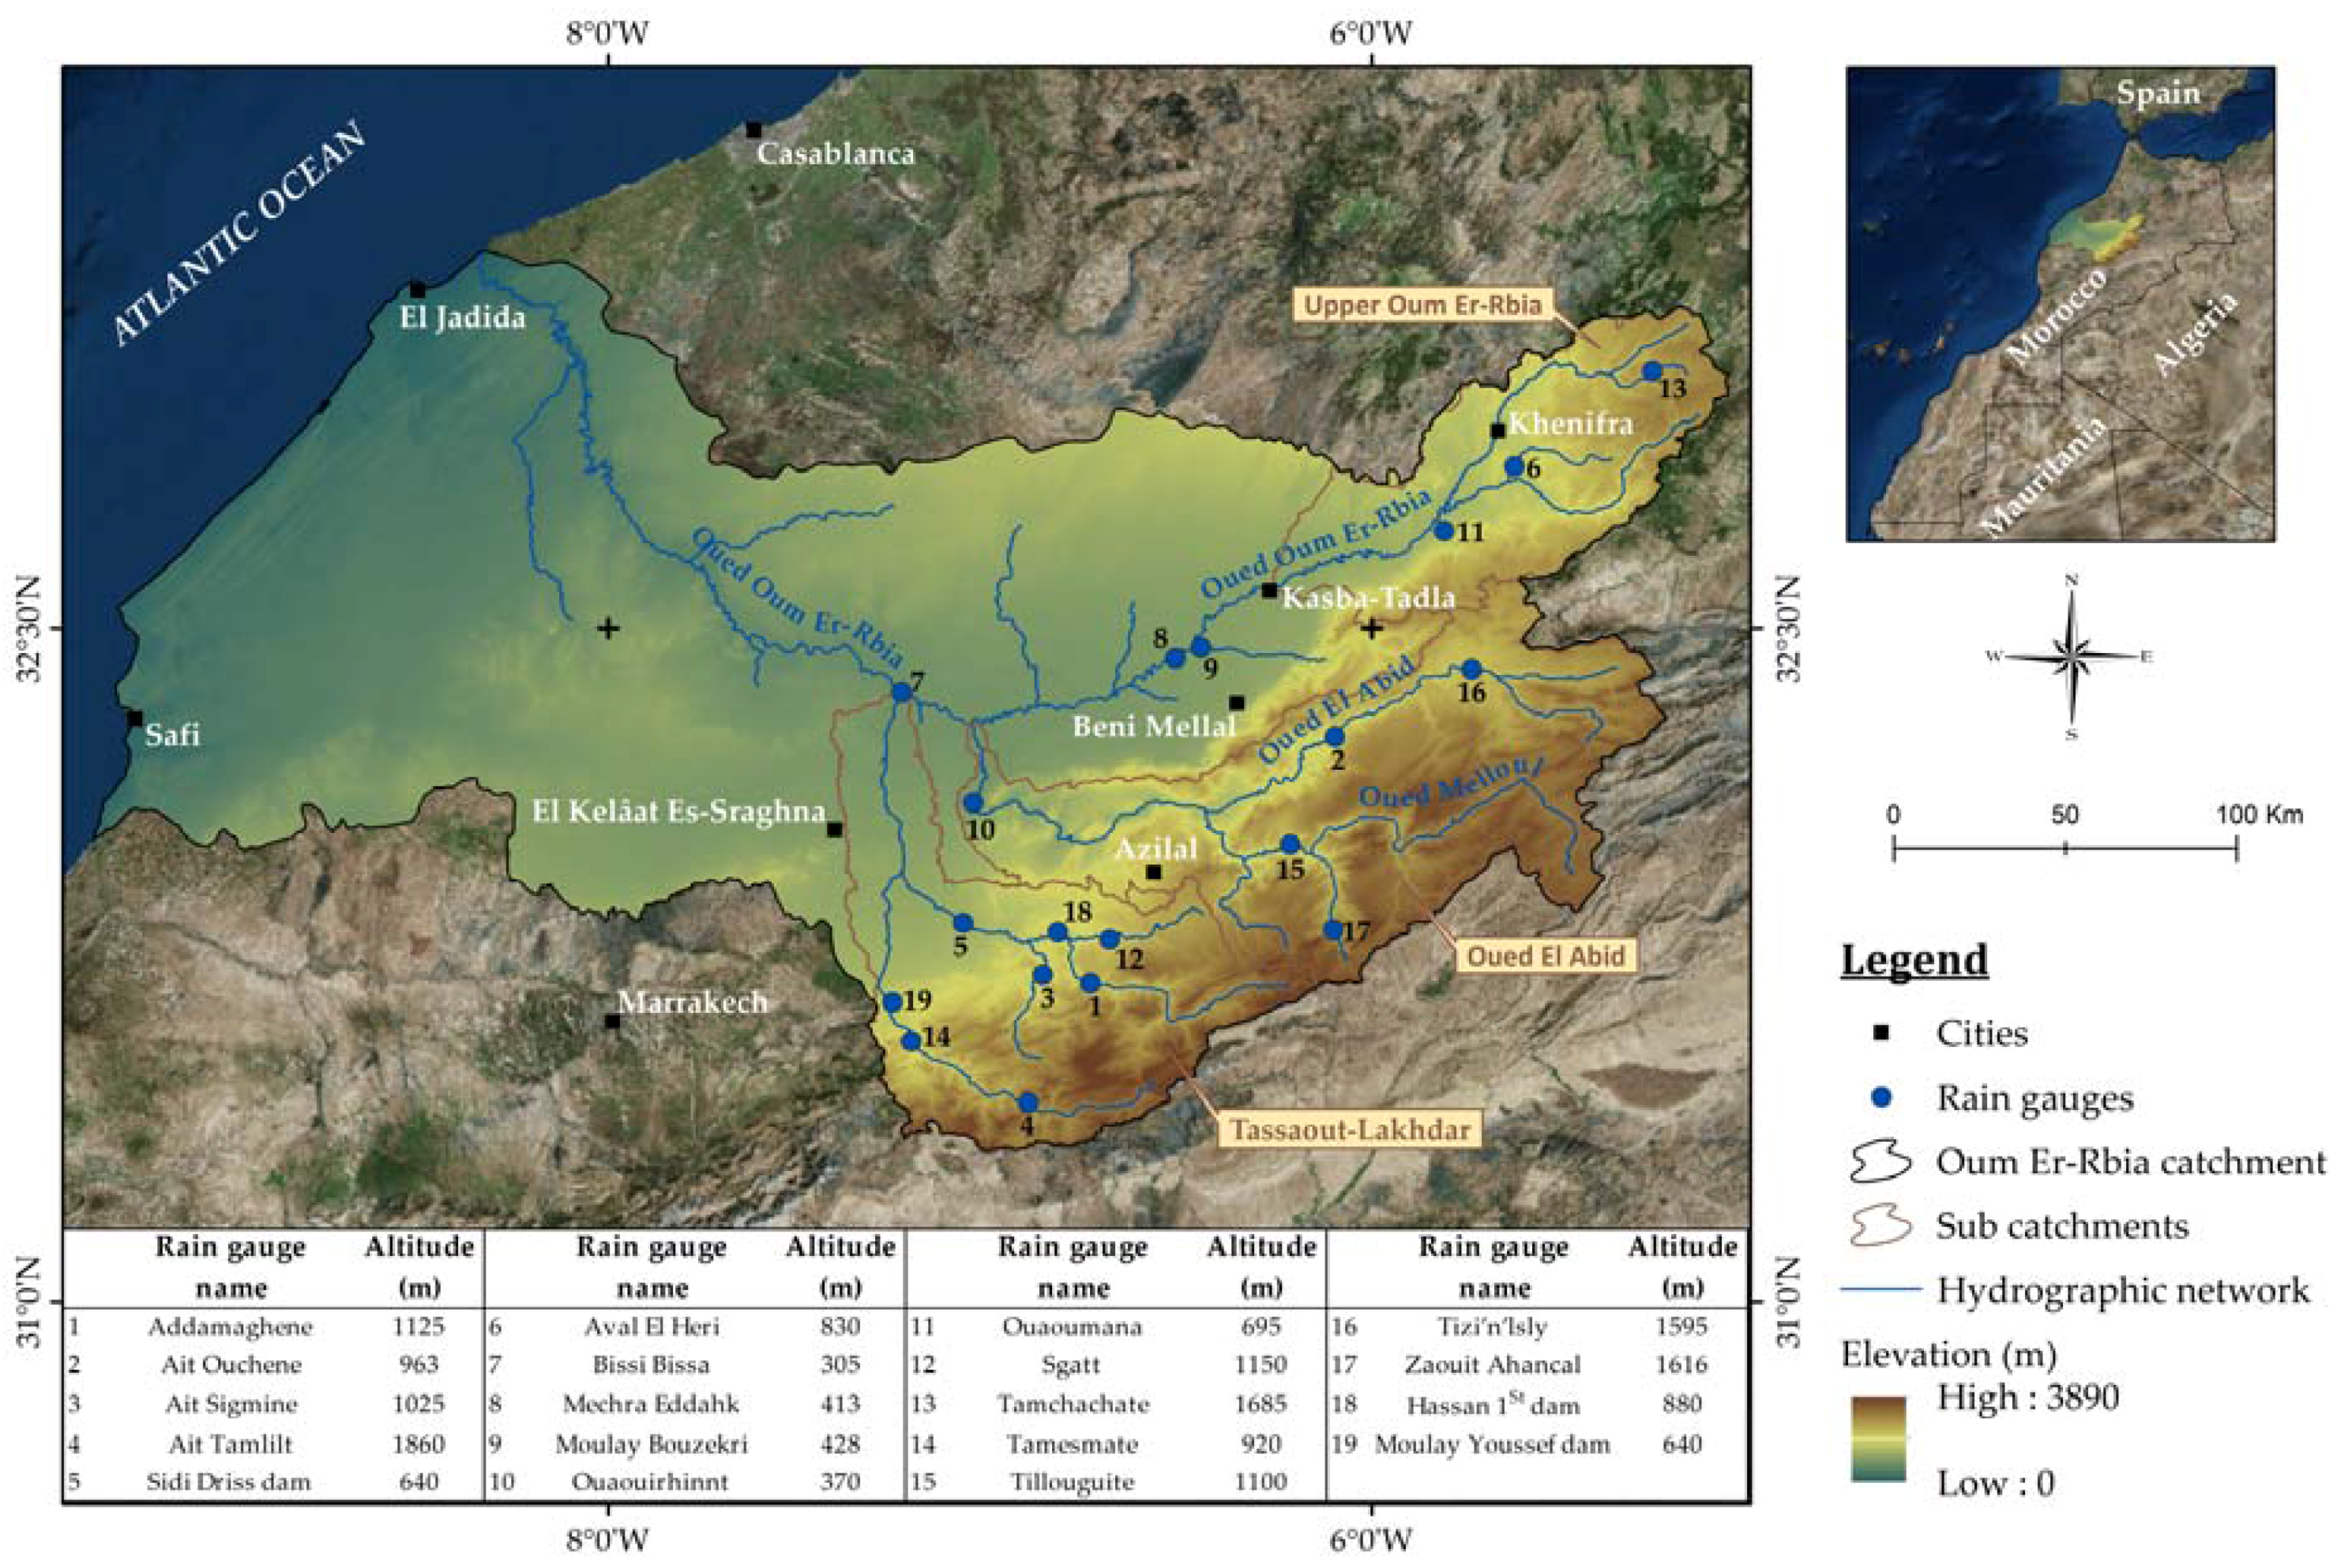
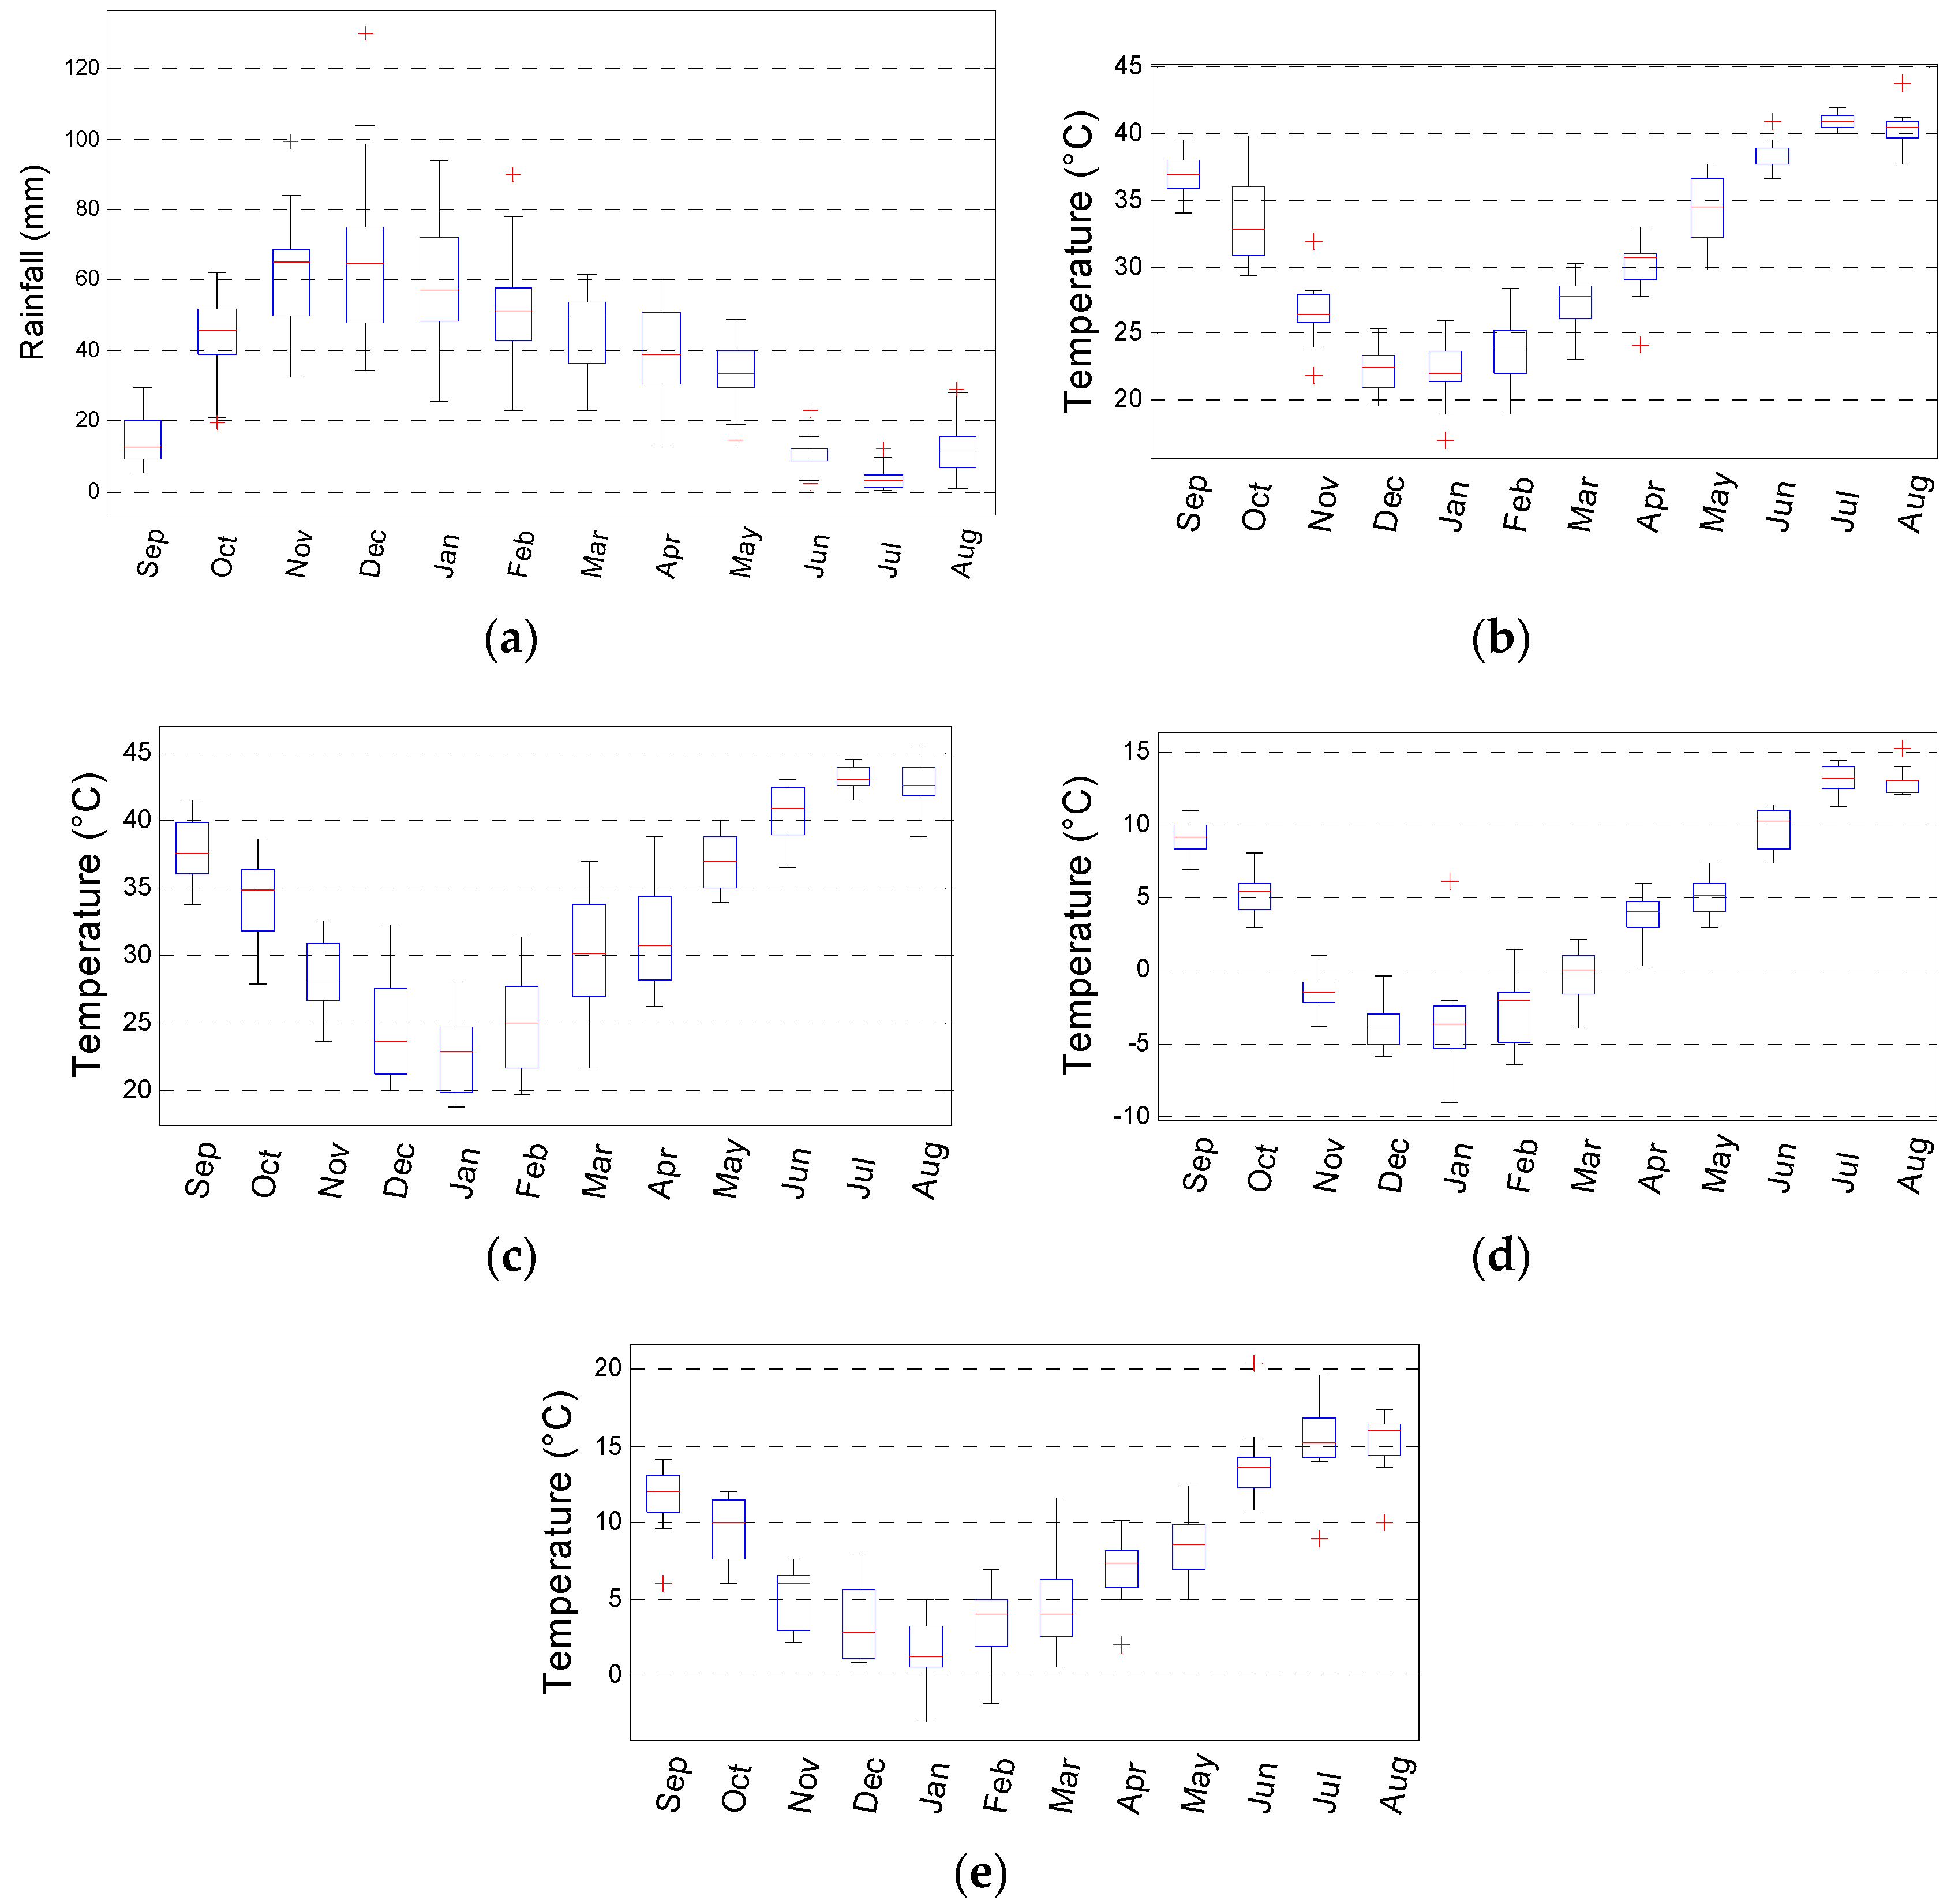
2.1. Study Area

The OER watershed (Figure 1), one of the biggest watersheds of the Kingdom of Morocco, has an area of nearly 35,000 km2, covering 7% of the total area of Morocco. It lies between 31°15′N and 33°22′N for latitudes and between 5°00′W and 9°20′W for longitudes. It is characterized by a marked topography with elevations that vary between 0 m above sea level (a.s.l.) at its outflow and 3890 m a.s.l. in the Atlas Mountains located in the eastern part of the watershed. The Atlas chain ensures the main water supply to compensate the demand for potable water and economic activities, particularly the agricultural sector in the plain. There are four main sub-watershed located in the upstream part of Oum Er-Rbia which are Tassaout-Lakhdar, Oued El Abid, Central Oum Er-Rbia, and the Upper Oum Er-Rbia.
In this study, we have focused on the upstream part of the OER watershed where most rain gauges are available and where several dams and reservoirs are located, including the Bin El Ouidane dam that is the main hydropower unit in Morocco, which produces about two thirds of the hydraulic energy of the country.
The climate of the OER watershed ranges from semi-arid in the plain to sub-humid at the Atlas chain [42], with a dominance of semi-arid. The study area is characterized by two distinct seasons: a wet season that extends between October and April, and a dry season that begins in May and ends in September. It experiences an oceanic influence manifested by the fact that the moisture wind comes frequently from the west [43]. Based on the data (rainfall and temperature) obtained from the ABHOER (Oum Er-Rbia hydraulic Basin Agency), the rainy season in the study area usually begins in October. A peak is often marked during December, where the mean monthly rainfall could exceed 100 mm in some regions. During July (the driest), the mean monthly rainfall rarely surpasses 10 mm over the whole study area (Figure 2a). Likewise, the snowfall generally occurs between November and May in the high mountains [44,45]. The influence of the continental climate is stronger when moving away from the coastal areas. It induces high temperatures in summer and very low temperature during winter [6]. The lowest temperatures (under −3 °C in the mountains area and around 0 °C in the foothill) are recorded during the period from December to March where January is the coldest (Figure 2d,e). The highest temperature appears during the period from June to August with a peak generally in July (around 41 °C in the mountains and 46 °C in the foothills) (Figure 2b,c).

2.2. Data

In order to evaluate the TRMM product for estimating rainfall we have used a daily data set of 19 rain gauges located in the study area. The time series covers a period between September 1998 and August 2011 concomitant with the availability of TRMM products (13 hydrological seasons, from 1 September to 31 August). These data sets were delivered by the Oum Er-Rbia hydraulic Basin Agency (ABHOER). All rain gauges managed by the ABHOER provide daily-accumulated rainfall data. They are distributed in the plain and the mountainous areas, following the development of the hydrographic network of Oum Er-Rbia River and its tributaries. The location of the rain gauges are presented in Figure 1.
The original ABHOER time series were explored to identify and fill the missing values. The data for the month of February for the 2007–2008 season were completely missing in the time series of Sidi Driss dam’s rain gauge. These gaps, which represent less than 2%, were filled by linear regression using a neighbor rain gauge with a height correlation coefficient, in considering the recommendations of WMO [11].
TRMM (Tropical Rainfall Measuring Mission) is the first space mission dedicated to the quantitative measurement of rainfall. It was launched from NASDA (National Space Development Agency of Japan) on 28 November 1997 [46]. The mission is a collaboration between NASA (National Aeronautics and Space Administration) and JAXA (Japan Aerospace eXploration Agency). The satellite launched as a part of the TRMM mission covers a band between 50°N and 50°S. It operates in an orbit with 400 km of altitude, an inclination of 35° and a period of 92.5 min allowing it to rotate around the Earth 16 times a day, although the satellite revisits the same scene of the earth’s surface twice a day. It embeds five measuring instruments, the Precipitation Radar (PR), the TRMM Microwave Imager (TMI), Visible and Infrared Scanner (VIRS) Clouds and the Earth’s Radiant Energy System (CERES), and Lightning Imaging Sensor (LIS) [47,48]. Three of these instruments (PR, TMI, and VIRS) are dedicated for the precipitation measurement system.
The TRMM program provides a variety of algorithms, including, the TMPA (TRMM Multi-satellite Precipitation Analysis) 3B42 Version 7 [49,50] that provides rainfall estimation products through the combination of a set of data from TRMM and various satellite sensors that provide similar data as those on board of TRMM [51]. The seventh version of the 3B42 algorithm (3B42 V7), available since 22 May 2012, incorporated several important changes compared to its predecessor (3B42 V6). In addition to the data used in the previous version, 3B42 V7 algorithm uses new data sources in order to enhance the rainfall estimations [52]. In this study, we have decided to use the 3B42 V7 product based on results from previous studies ([40,53,54], which demonstrate the improvement of the 3B42 V7 product rainfall estimation.
The data were extracted as NetCDF images with spatial resolution of 0.2° and daily temporal resolution. These data were acquired from NASA’s official website of Goddard Earth Sciences Data and Information Services Center [55] for the period between 1 January 1998 and 30 August 2011. The monthly and yearly time series were prepared by accumulating the daily data.

2.3. Methodology

Several studies, in various areas around the world, have evaluated the rainfall estimations derived from the 3B42 V7 product. Moazami et al. [56] evaluated daily rain rates derived from three high-resolution satellite precipitation products including TMPA 3B42 V7 over the entire country of Iran. Cai et al. [57] assessed the accuracy of TMPA 3B42 V7 data over the mid-high latitudes region of China. Nastos et al. [58] evaluated the space borne TMPA 3B43 V7 research products with the respective interpolated monthly rain gauge data over Greece. In this study, the use of the interpolation approach can be inefficient to produce a representative distribution of precipitations due to the low spatial density of rain gauges in a rough topography context. Using a moderate density measurement network can bring several mistakes, which will affect the evaluation process [59]. As a matter of fact, the TRMM data were evaluated by direct comparison between punctual rainfall data obtained from rain gauges and the amount of rainfall under the corresponding pixel for TRMM.
The rain gauges and the 3B42 V7 product time series were compared to analyze their variation and relationship at different timescales using various indices and statistical parameters (daily, monthly, and yearly). First of all, we used the verification indices: POD (Probability Of Detection), FAR (False Alarm Ratio), and FBI (Frequency Bias Index) [60]. These indices, which are based on contingency tables, emphasize the product’s ability to identify precipitation events above a given threshold [32]. Different thresholds have been adopted in various studies throughout the world to differentiate between rainy or dry days, including 0.1 mm to define a rainy day in Saudi Arabia [35], 0.5 mm in the Korean peninsula [33], and 1 mm in the Peruvian Andes [36]. In this study, we have chosen to apply 0.5 mm as a precipitation threshold based on an analysis where different precipitation thresholds were tested, which were 0.1, 0.3, 0.5, 0.7, and 1 mm.
The POD (the Probability Of Detection), which represents the fraction of observed events that were correctly estimated, is also referred to as the success rate. It is defined as follows (Equation (1)):
POD =   a a   +   c   ,
The FAR (the False Alarm Ratio) is the estimated proportion of events that tend to be falsely detected. It is calculated by the following formula (Equation (2)):
FAR = b a + b   ,
The FBI (the Frequency Bias Index) is the ratio of the number of estimated and observed rainfall events. It is calculated in Equation (3):
FBI = a + b a + c   ,
where, a, b and c represents the number of rain events that fulfilled the conditions in Table 1.
The comparison of the satellite product data against observed data from rain gauges was also conducted through a statistical analysis based on standard parameters. These include the Pearson correlation coefficient (Equation (4)) to evaluate the linear relationship between the two data sets. There is also the RMSE (Root Mean Square Error) in mm (Equation (5)) and the bias (Equation (6)) that are used to quantify the difference between the TRMM and the observed data.
r =   i = 1 n ( E i   E ¯ i ) ( O i   O ¯ i ) i = 1 n ( E i   E ¯ i ) ( O i   O ¯ i ) 2   ,
R M S E =   i = 1 n ( E i   O i ) n   ,
B i a s =   T R M M S t a t i o n   ,
E i and O i are the 3B42 V7 product and rain gauge data, respectively, at a time i . E ¯ i and O ¯ i are the average values of the product and rain gauge data, respectively. n is the total number of the rain-gauge records.

3. Results

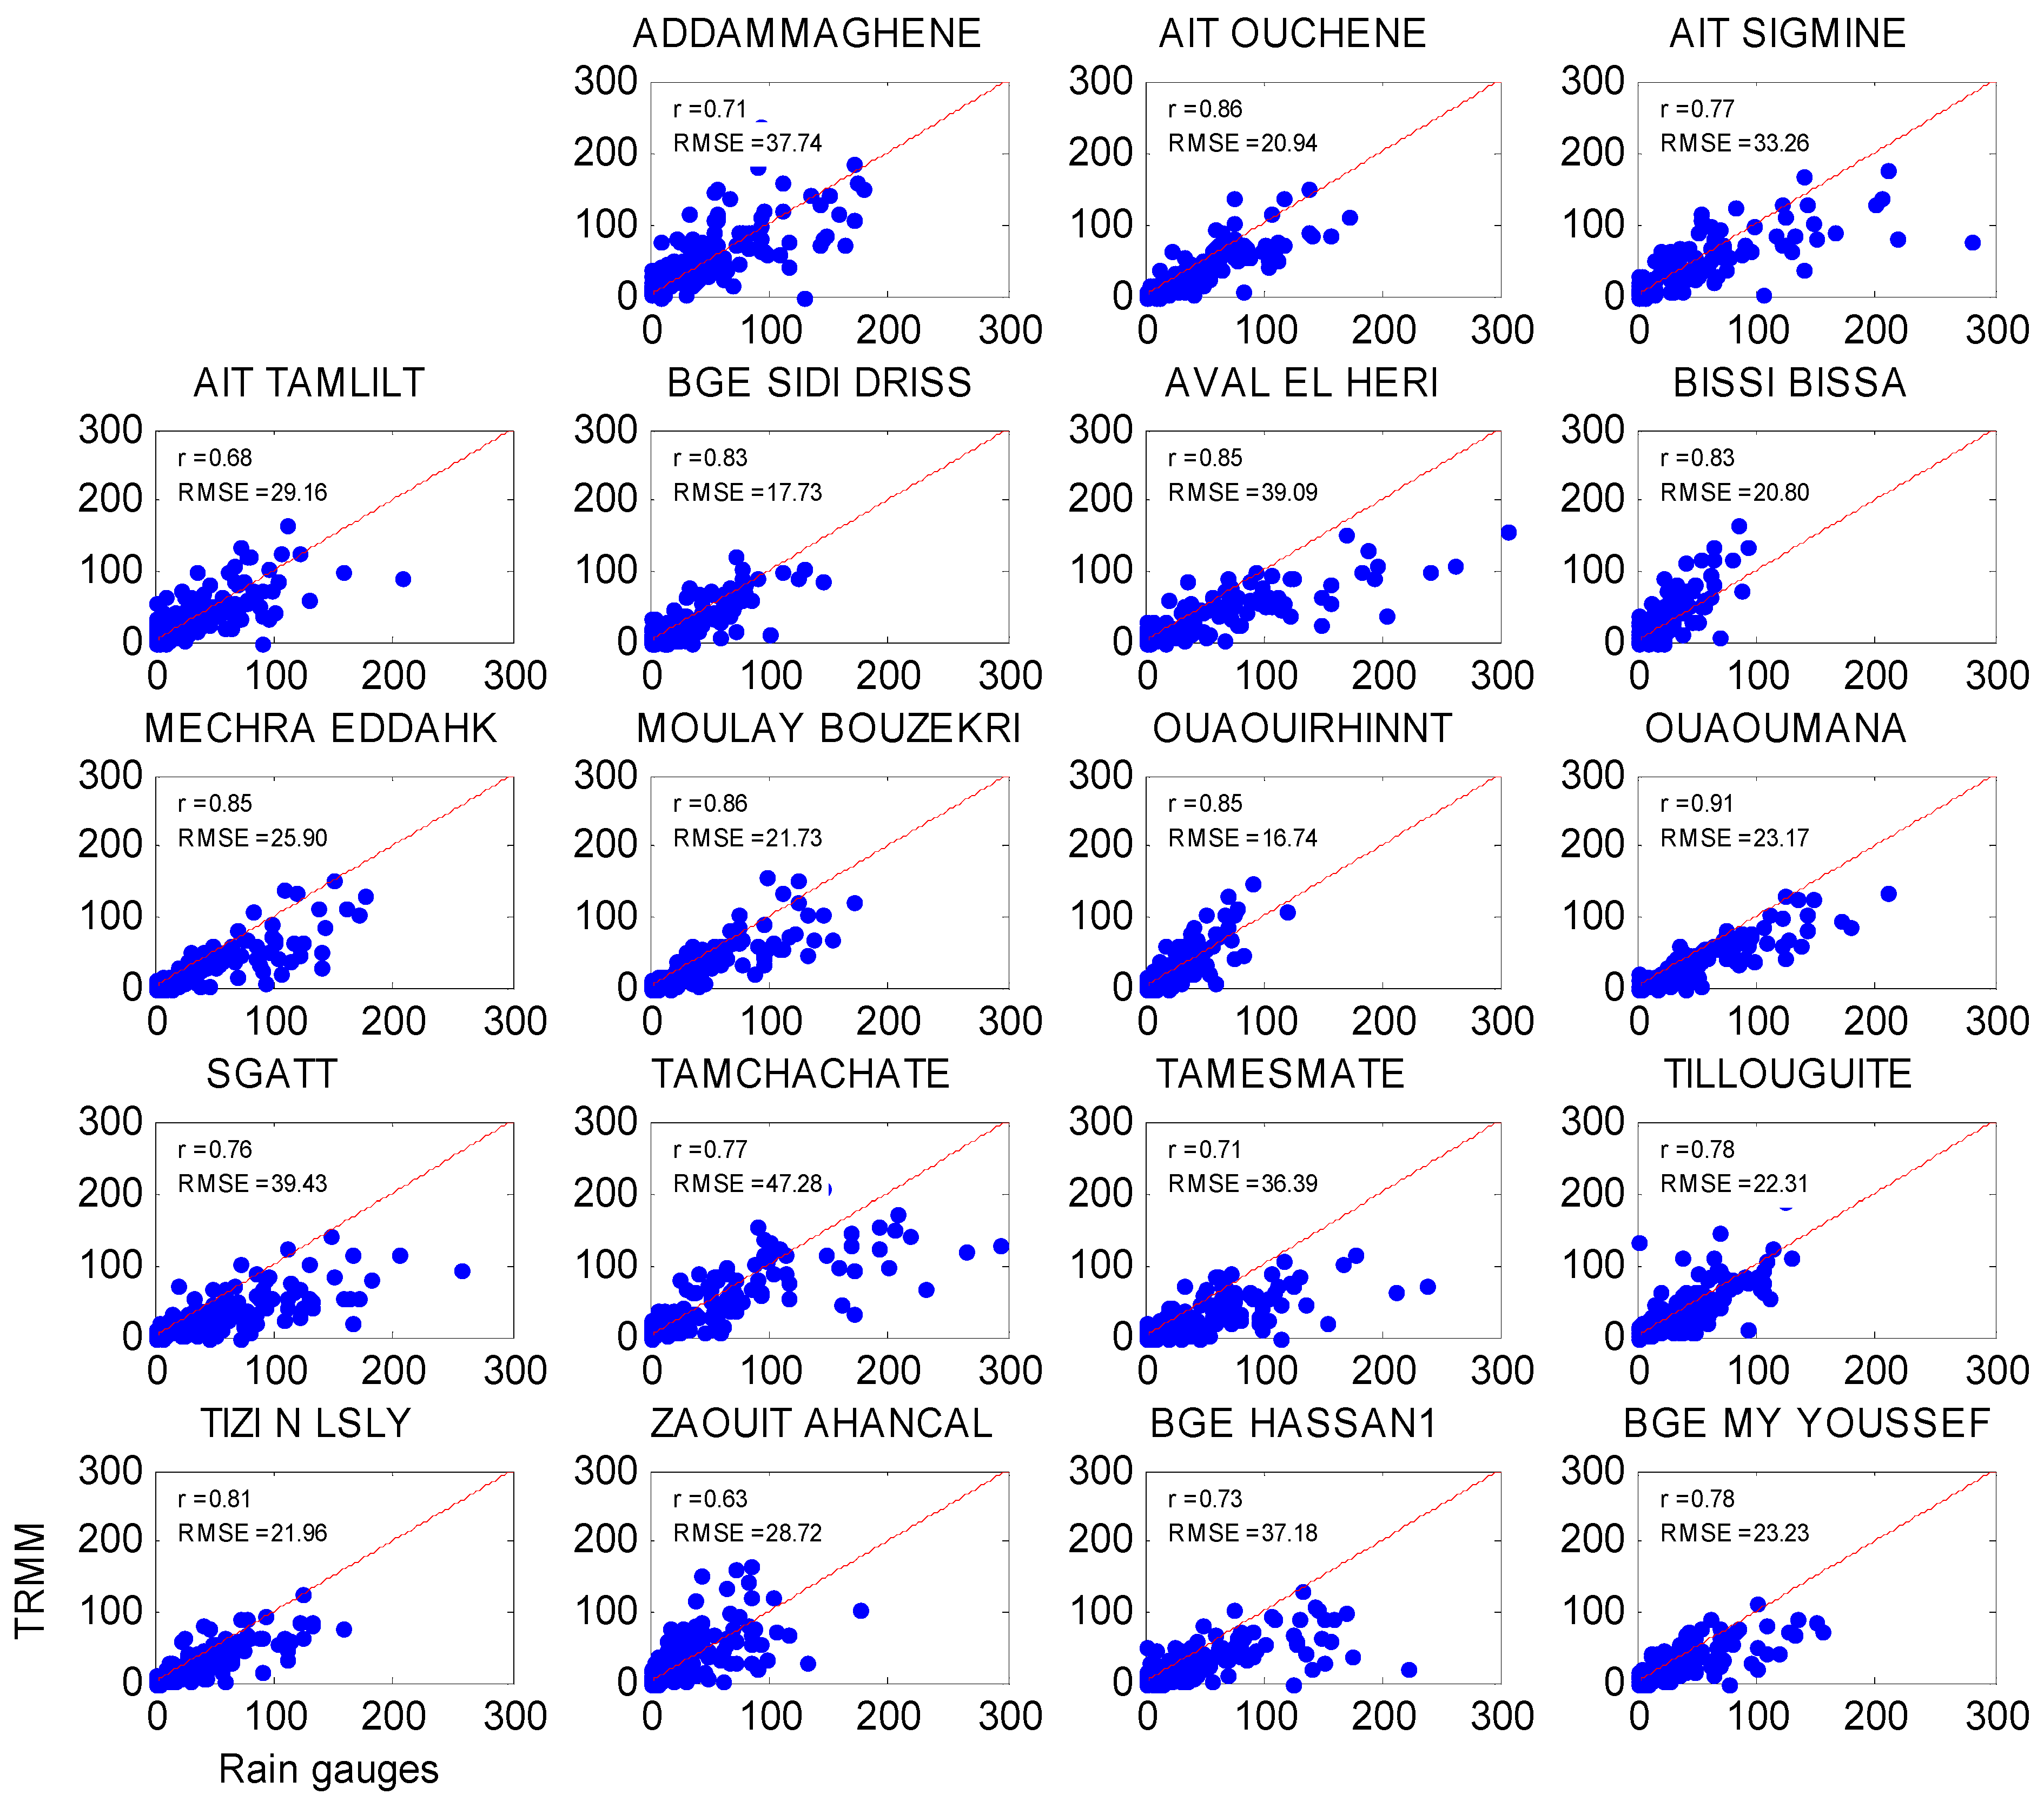
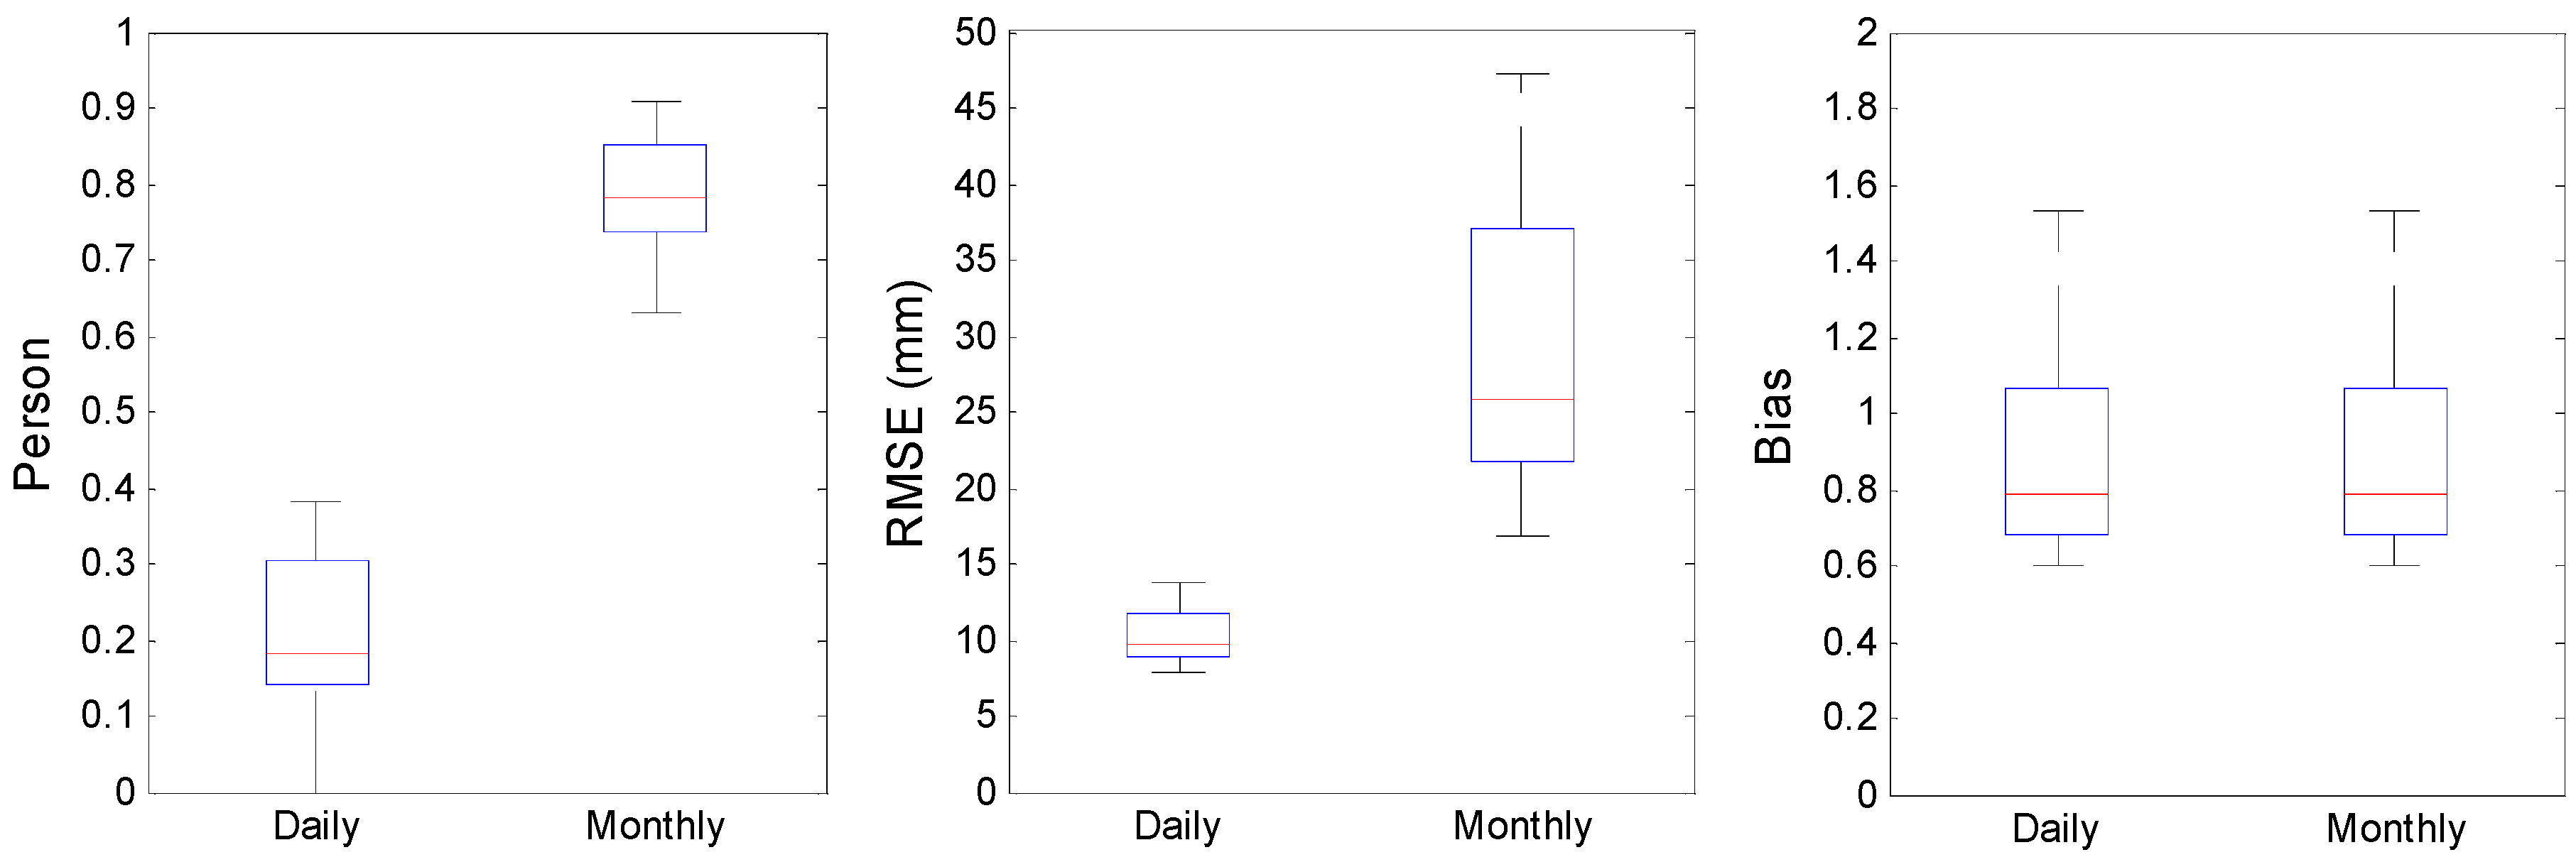
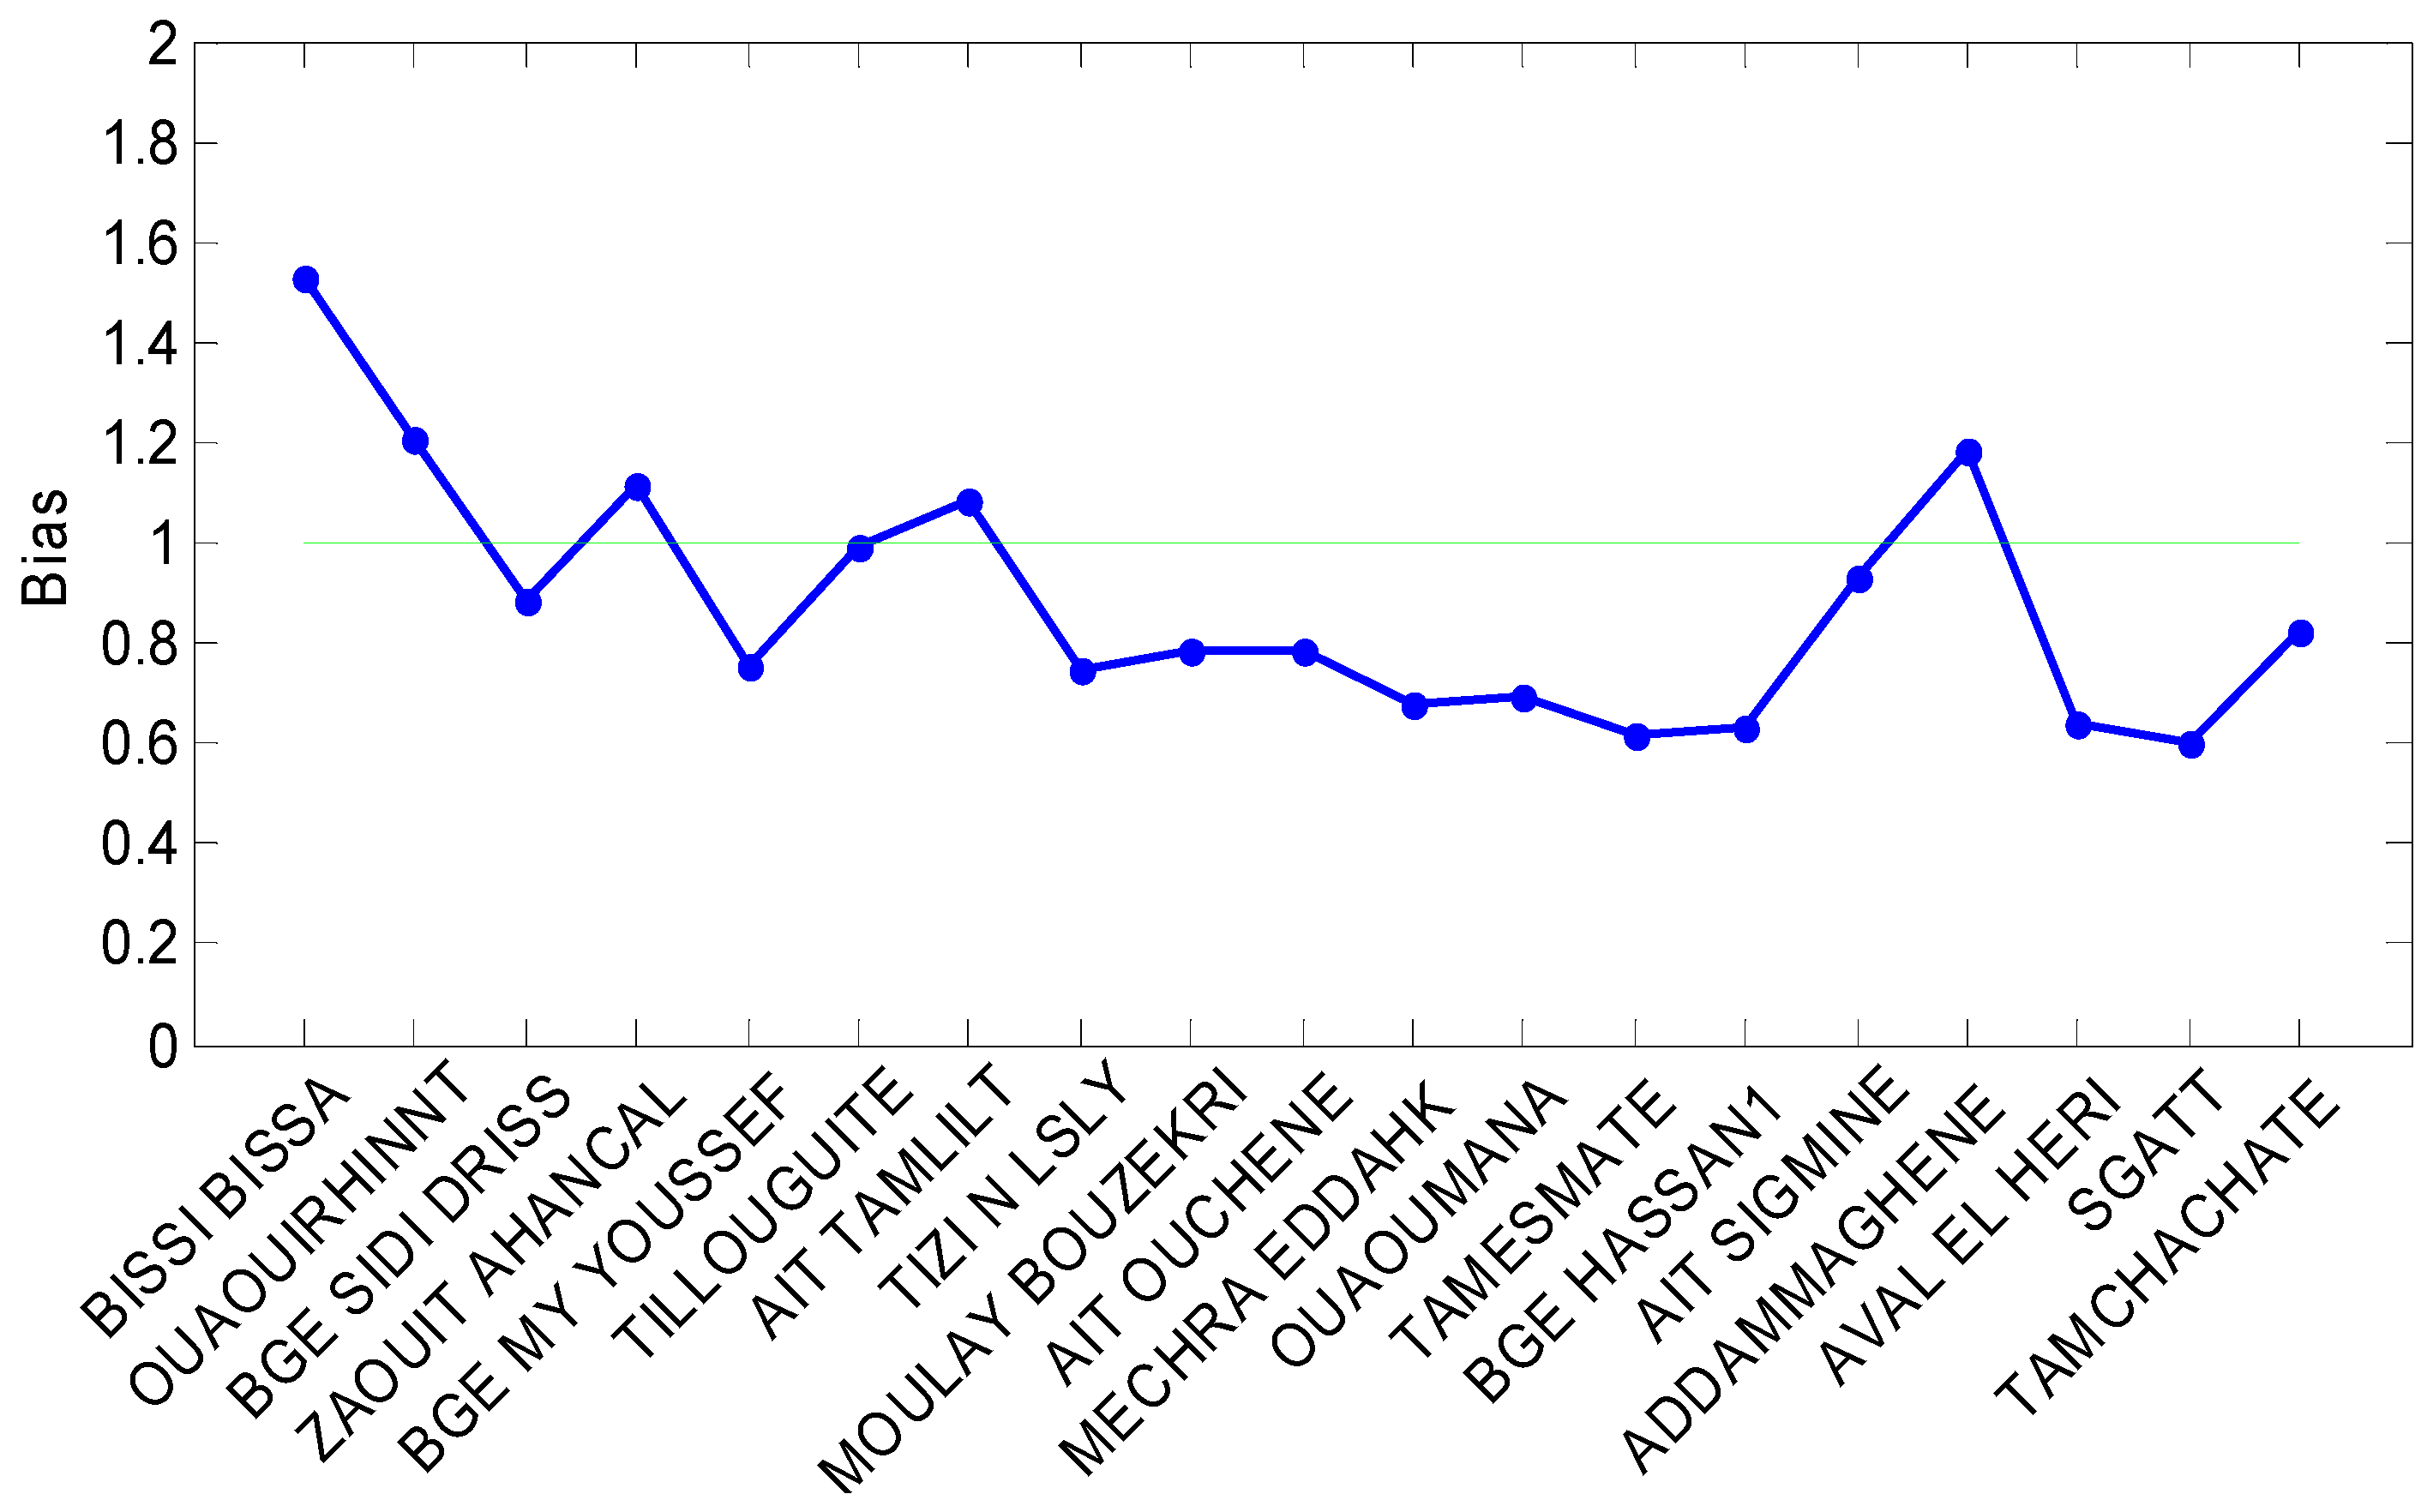
3.1. Evaluation at Daily Time Step

The 3B42 V7 product’s performance varies from one area to another. It has been found that at a daily time step, there is a remarkable difference between 3B42 V7 and rain gauges. Over the entire study area, the calculated statistics are generally low (Table 2). According to the POD, about 36%–60% of the rain gauge records have been properly detected by TRMM. Nevertheless, at 75% of the rain gauges, the correctly detected events are usually below 50%. On one hand, the FAR shows that at half of the studied rain gauges, TRMM gave false alarms for 38 to 55% of the measurements. On the other hand, for the rain gauges the proportion of false alarms can reach degrees higher than 70%, particularly at those located in mountainous areas receiving snowfall. Furthermore, the FBI varies between 0.59 and 2.63. At 50 % of the studied rain gauges, TRMM overestimates the number of rainy days with FBI that are greater than one.
At a daily time scale, the two data sets exhibit a poor linear relationship across the study area. This is well demonstrated by the Pearson correlation coefficient values that are lower than 0.38 at all rain gauges (Table 2). This low efficiency of TRMM can be explained by the rapid cloud dynamics and the stormy nature of precipitation events in the study region that influence the spatial and temporal distribution of rainfall. Baik and Choi [33] have pointed out that rapid temporal evolution of convective rainfall may not be captured by TRMM due to differences in overpass time. Moreover, there is a mismatch of scale since the satellite product is extracted for a 25 km area, unlike the rain gauges that provide punctual measurements.

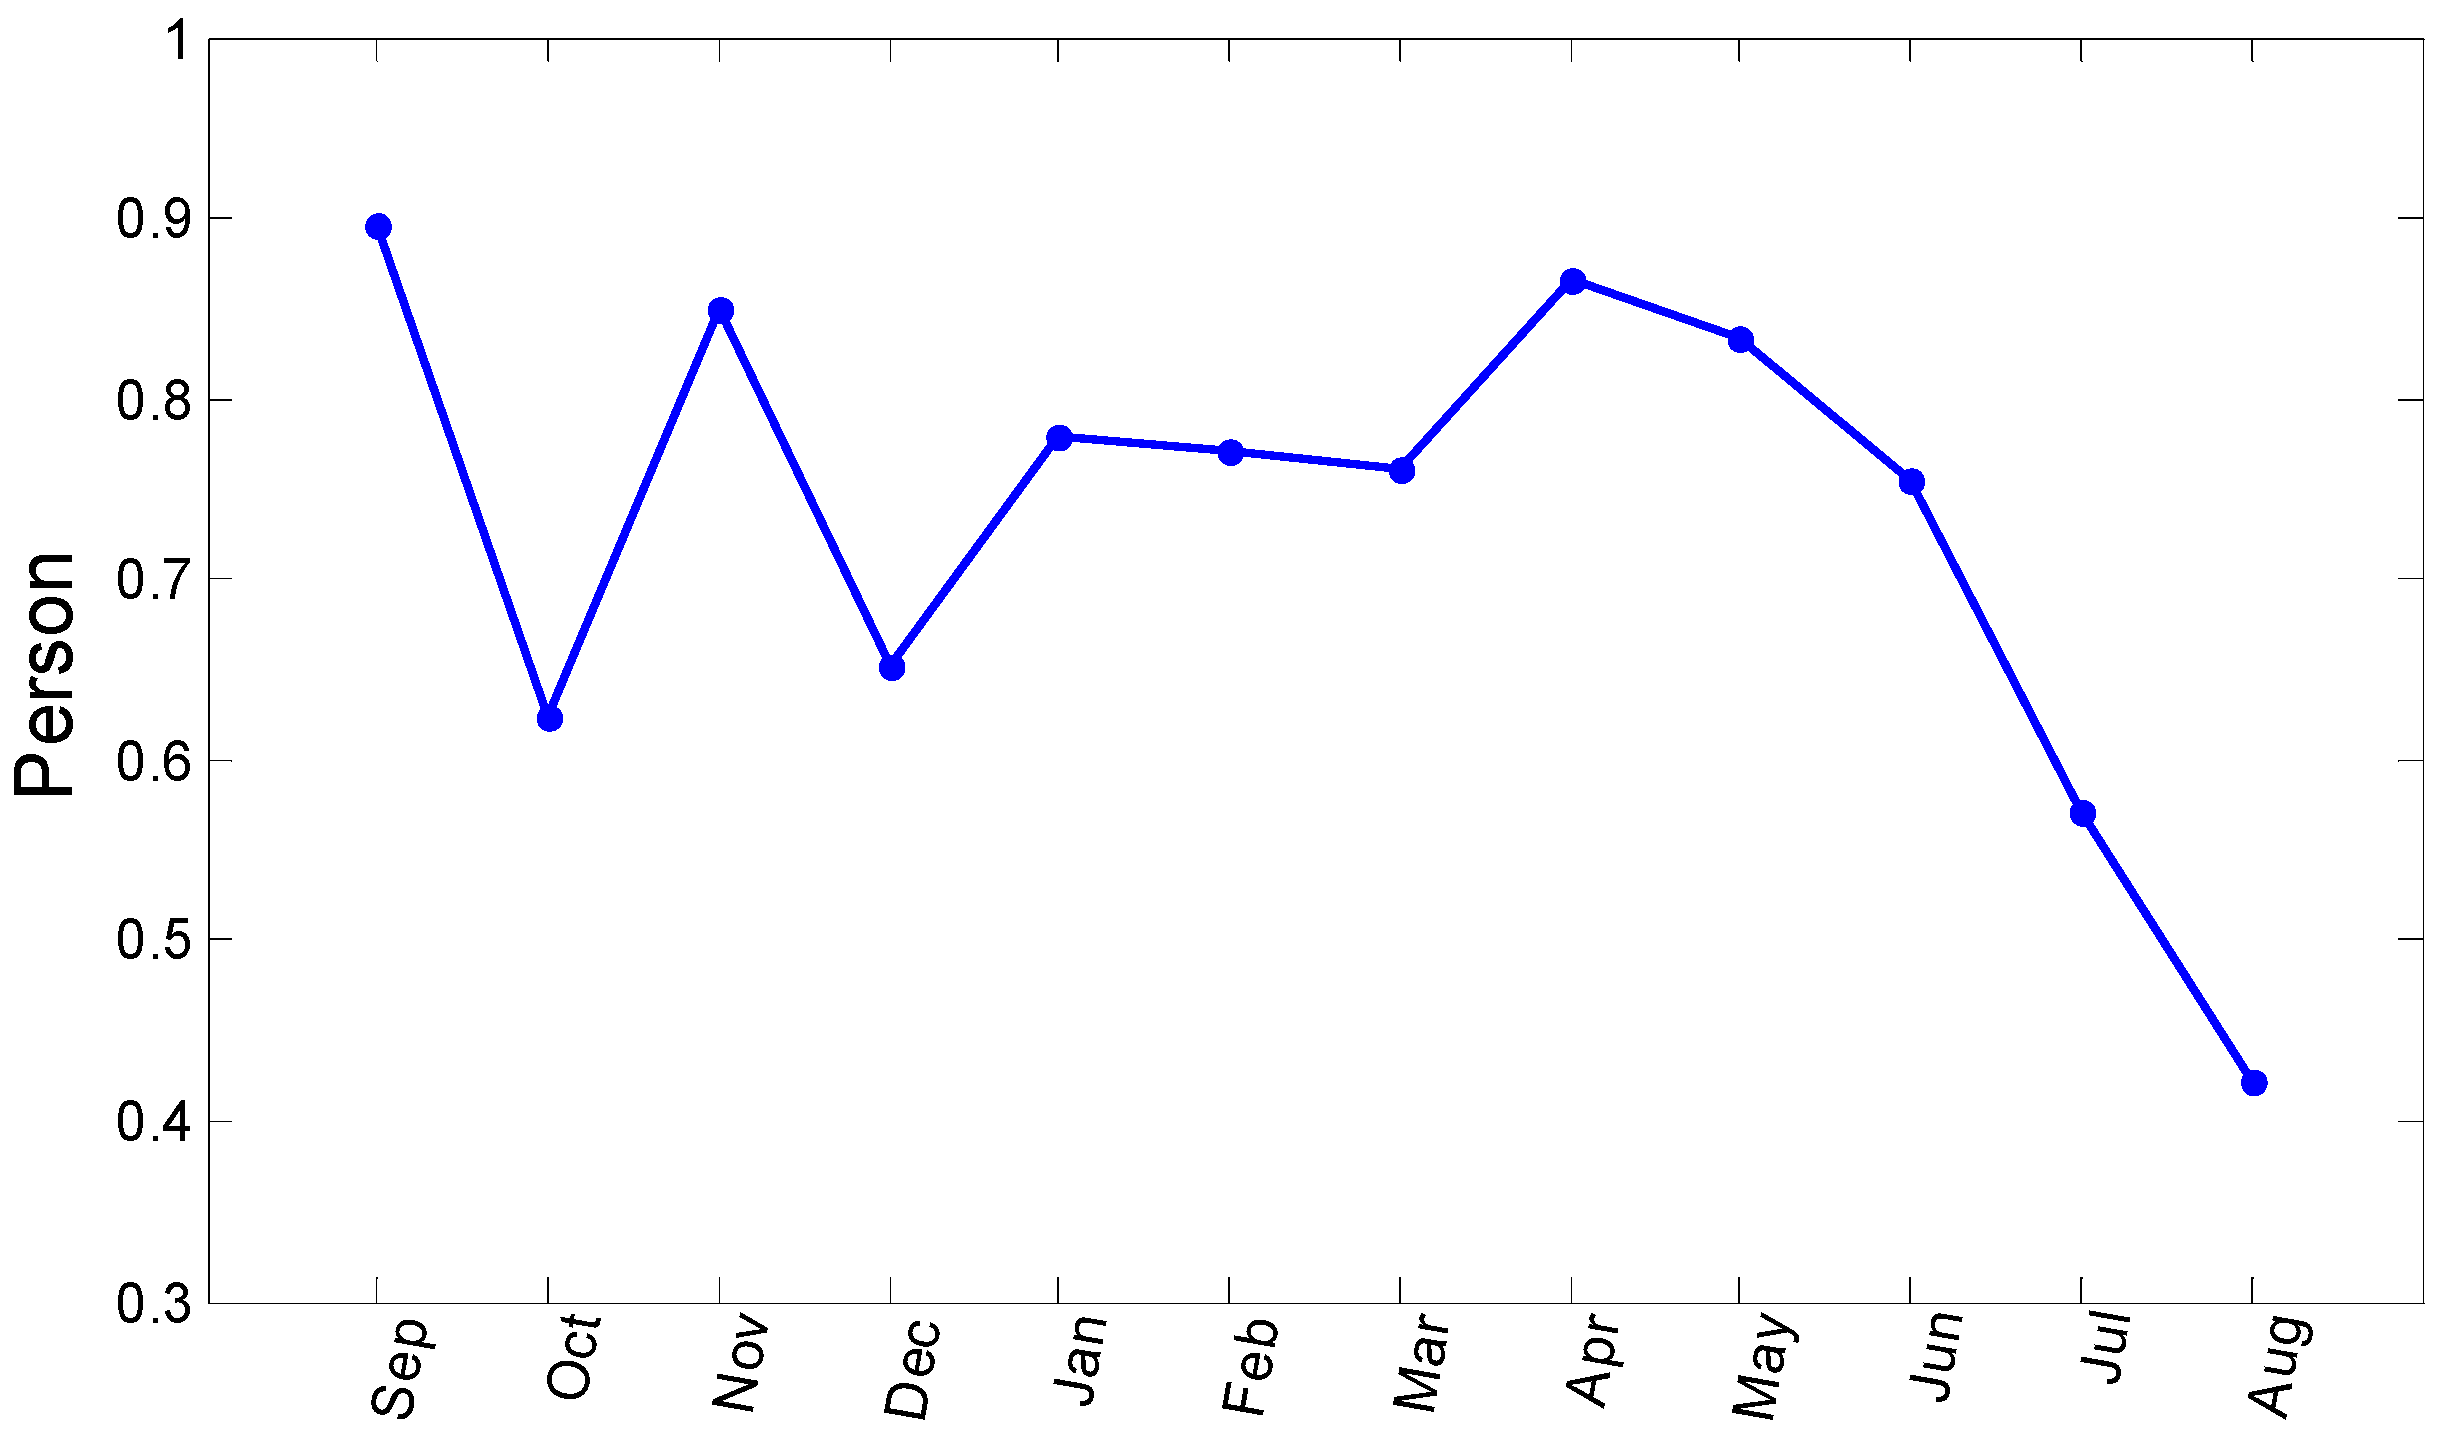
3.2. Evaluation at Monthly Time Step

At the monthly time scale, the linear relationship between the rain gauges and TRMM data shows a considerable improvement, compared to the daily one (Figure 3 and Figure 4). The two data sets demonstrate a good relationship with correlation coefficients varying between 0.63 and 0.91 with an overall average of 0.80. Furthermore, 17 rain gauges have correlation coefficients greater than 0.7, and two gauges have correlation coefficients of 0.63 and 0.68. As for the RMSE, which shows sensitivity to the accumulated rainfall amounts, we have found that it is less than 25 mm for over 50% of the studied tiles. However, most of the rain gauges located at the mountainous area present the highest RMSE, especially those with the highest monthly rainfall averages. This is maybe due to the topographic effect that reduces the accuracy of the measurements or the presence of snow in high-elevation areas.
To explore further the relationship between the two data sets, an analysis was conducted which considered the obtained statistical indices in relation to the following different factors: the measurement time, the topographic dependence, and the recorded rainfall amounts. Actually, the relevance of the statistical indices changes over the hydrological season. In a semi-arid climate, heavy rainfall events typically occur during summer [9,61]. These events are generally characterized by low spatial extension and short time scales, which make their detection a real challenge for both the rain gauges and satellite. In the study area, these short-term events generally occur during July and August. The statistical indices month by month showed that July and August exhibit the lowest correlation coefficients (Figure 5).
The second factor, topography, has a considerable impact on the relationship between rain gauges and TRMM data. Unlike those found for the plain, most of the TRMM pixels located at the mountainous area have lower agreement with the corresponding rain gauges (Figure 6). These pixels have correlation coefficients that vary between 0.7 and 0.8, except those corresponding to Ait Tamlilt and Zaouit Ahencal rain gauges, which present correlation coefficients less than 0.7. This is can be explained by the fact that the two pixels are located in an area experiencing snowfall.
Finally, an analysis of bias values sorted in ascending order according to the monthly average rainfall (Figure 7) reveals that in the most arid zones, TRMM tends to overestimate rainfall amounts as compared to rain gauges. Bissi Bissa's and Ouaouirinth's rain gauges present the lowest monthly average rainfall all over the study area. The bias computed for the pixels corresponding to these two rain gauges (which happen to be located at the most arid sites) shows that TRMM overestimates the amount of rainfall in such areas. On the other hand, for rain gauges with high monthly averages, TRMM underestimates rainfall. This is observed for most of the rain gauges, except for the ones that may receive snowfall, such as Zaouit Ahencal and Ait Tamlilt. At these sites, TRMM tends to provide overestimated rainfall amounts.
In addition, the annual cycle of rainfall derived from TRMM data is fairly close to that of rain gauges, as is shown in Figure 8. The annual cycle of rainfall demonstrates a maximum during the rainy season around December and a minimum in the dry season from June to August. Nevertheless, the TRMM estimations are indeed influenced by a bias that is manifested very often by under-estimations of the rainfall amounts. Partially, this bias was expected considering the fact that the comparison is made between punctual measurements and spatial estimations.

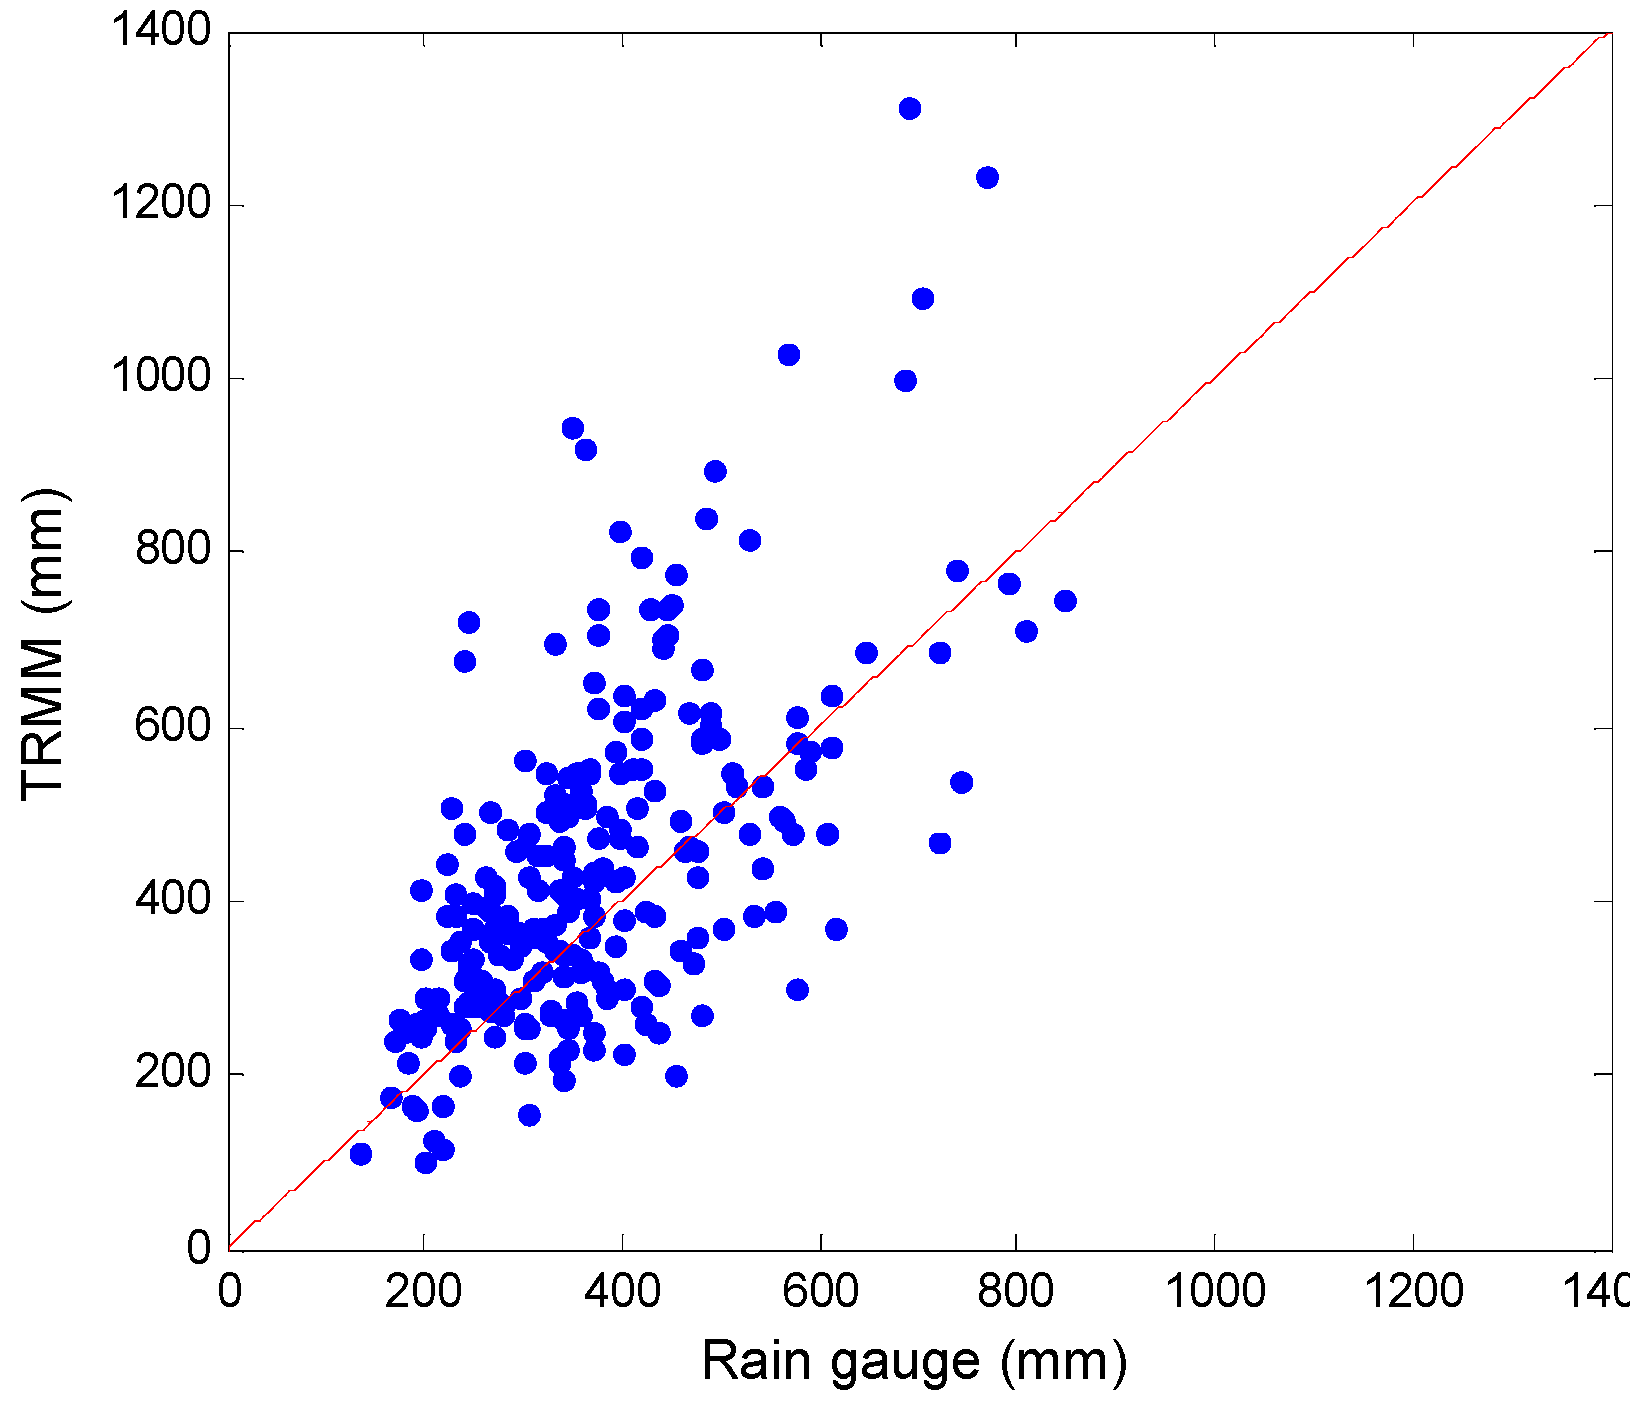
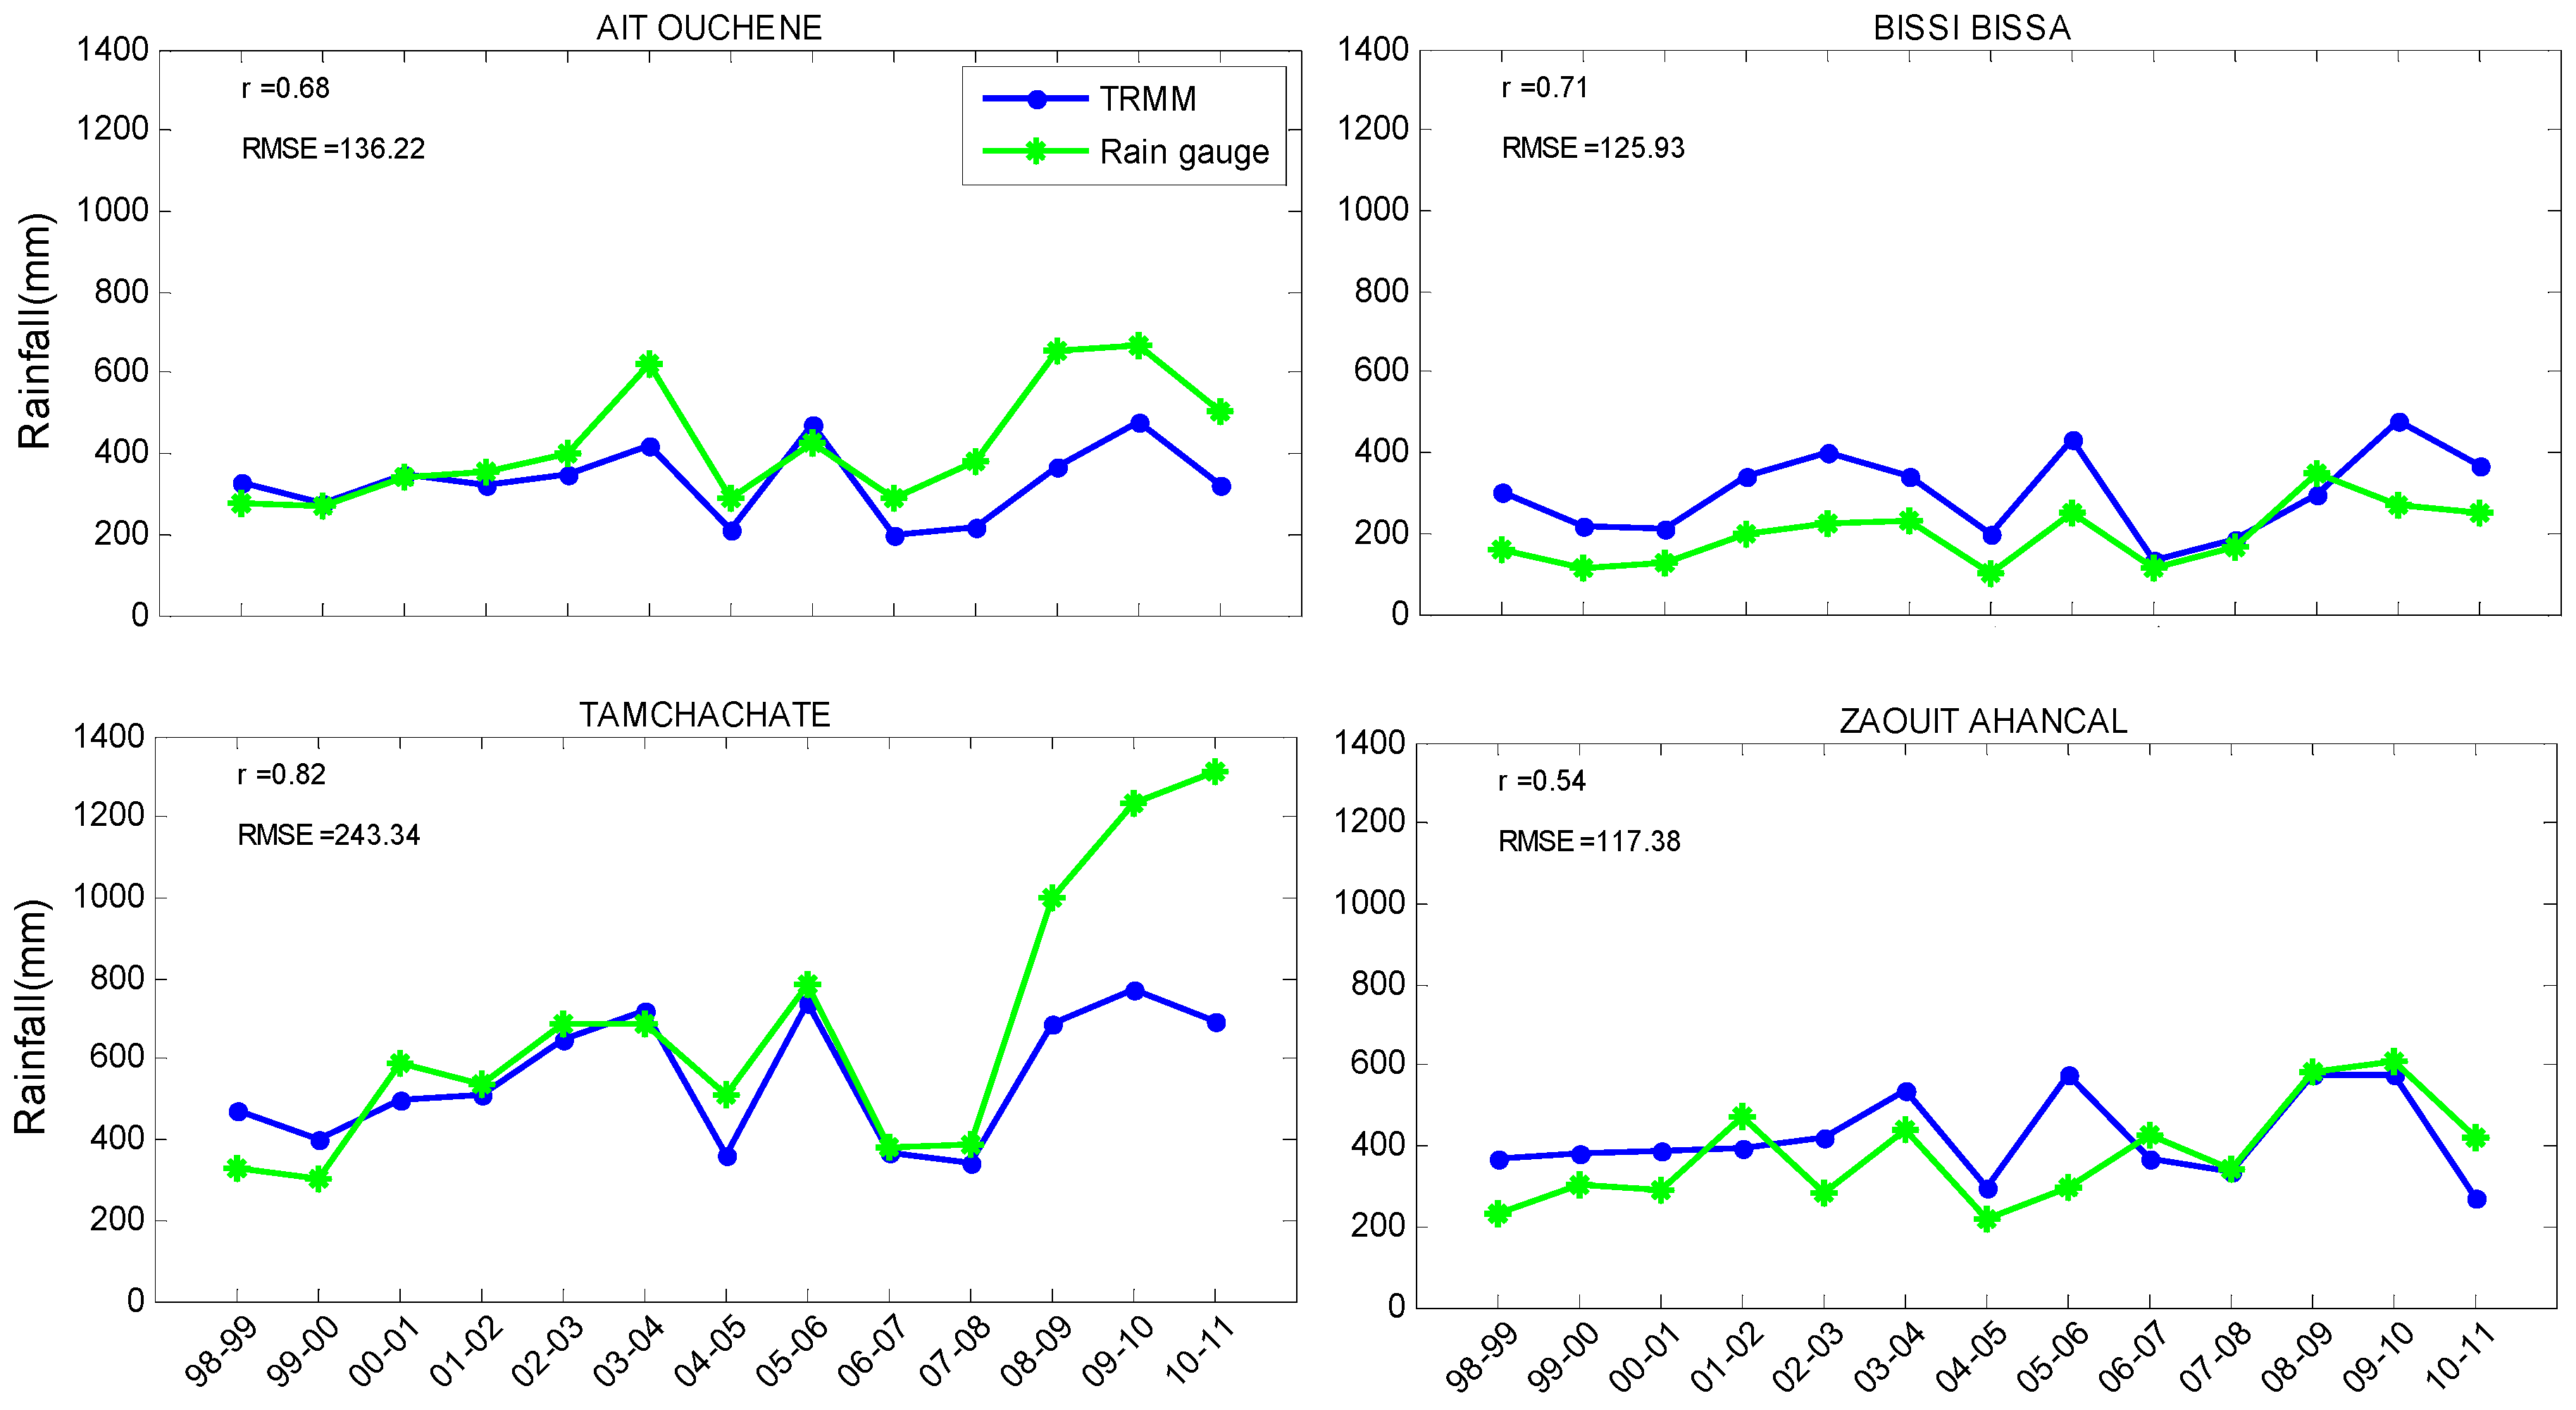
3.3. Evaluation at Annual Time Step

At the annual scale, there is a reasonable overall linear relationship between the TRMM and rain gauges data, according to the Figure 9. However, this relationship is irregular from one part to another of the study area. The correlation coefficients range between 0.43 and 0.88, where nearly 75% of the studied rain gauges have coefficients higher than 0.66. Compared to the monthly time scale, the correlation coefficients are slightly reduced for most rain gauges but much lower for Mechra Eddahk. Both AitTamlilt and Zaouit Ahencal rain gauges still have one of the lowest correlation coefficients of the study area. This highlights the problematic effect of snowfall on the 3B42 V7 estimations. Some low coefficients are found for rain gauges situated in the plain, which maybe related to the impact fewer records of the considered time series. This is a limiting factor in the correlation analysis in judging the acceptability of the calculated coefficients.
The RMSE between observed and TRMM annual precipitation ranged from 70 to 261 mm with 50% of the pixels having values lower than 140 mm. For some other pixels the RMSE remains high generally due to the large difference between the two data sets that often occurs during the wetter seasons where TRMM tends to underestimate the rainfall amounts particularly in the seasons of 2003–2004, 2008–2009, and 2009–2010 (Figure 10).

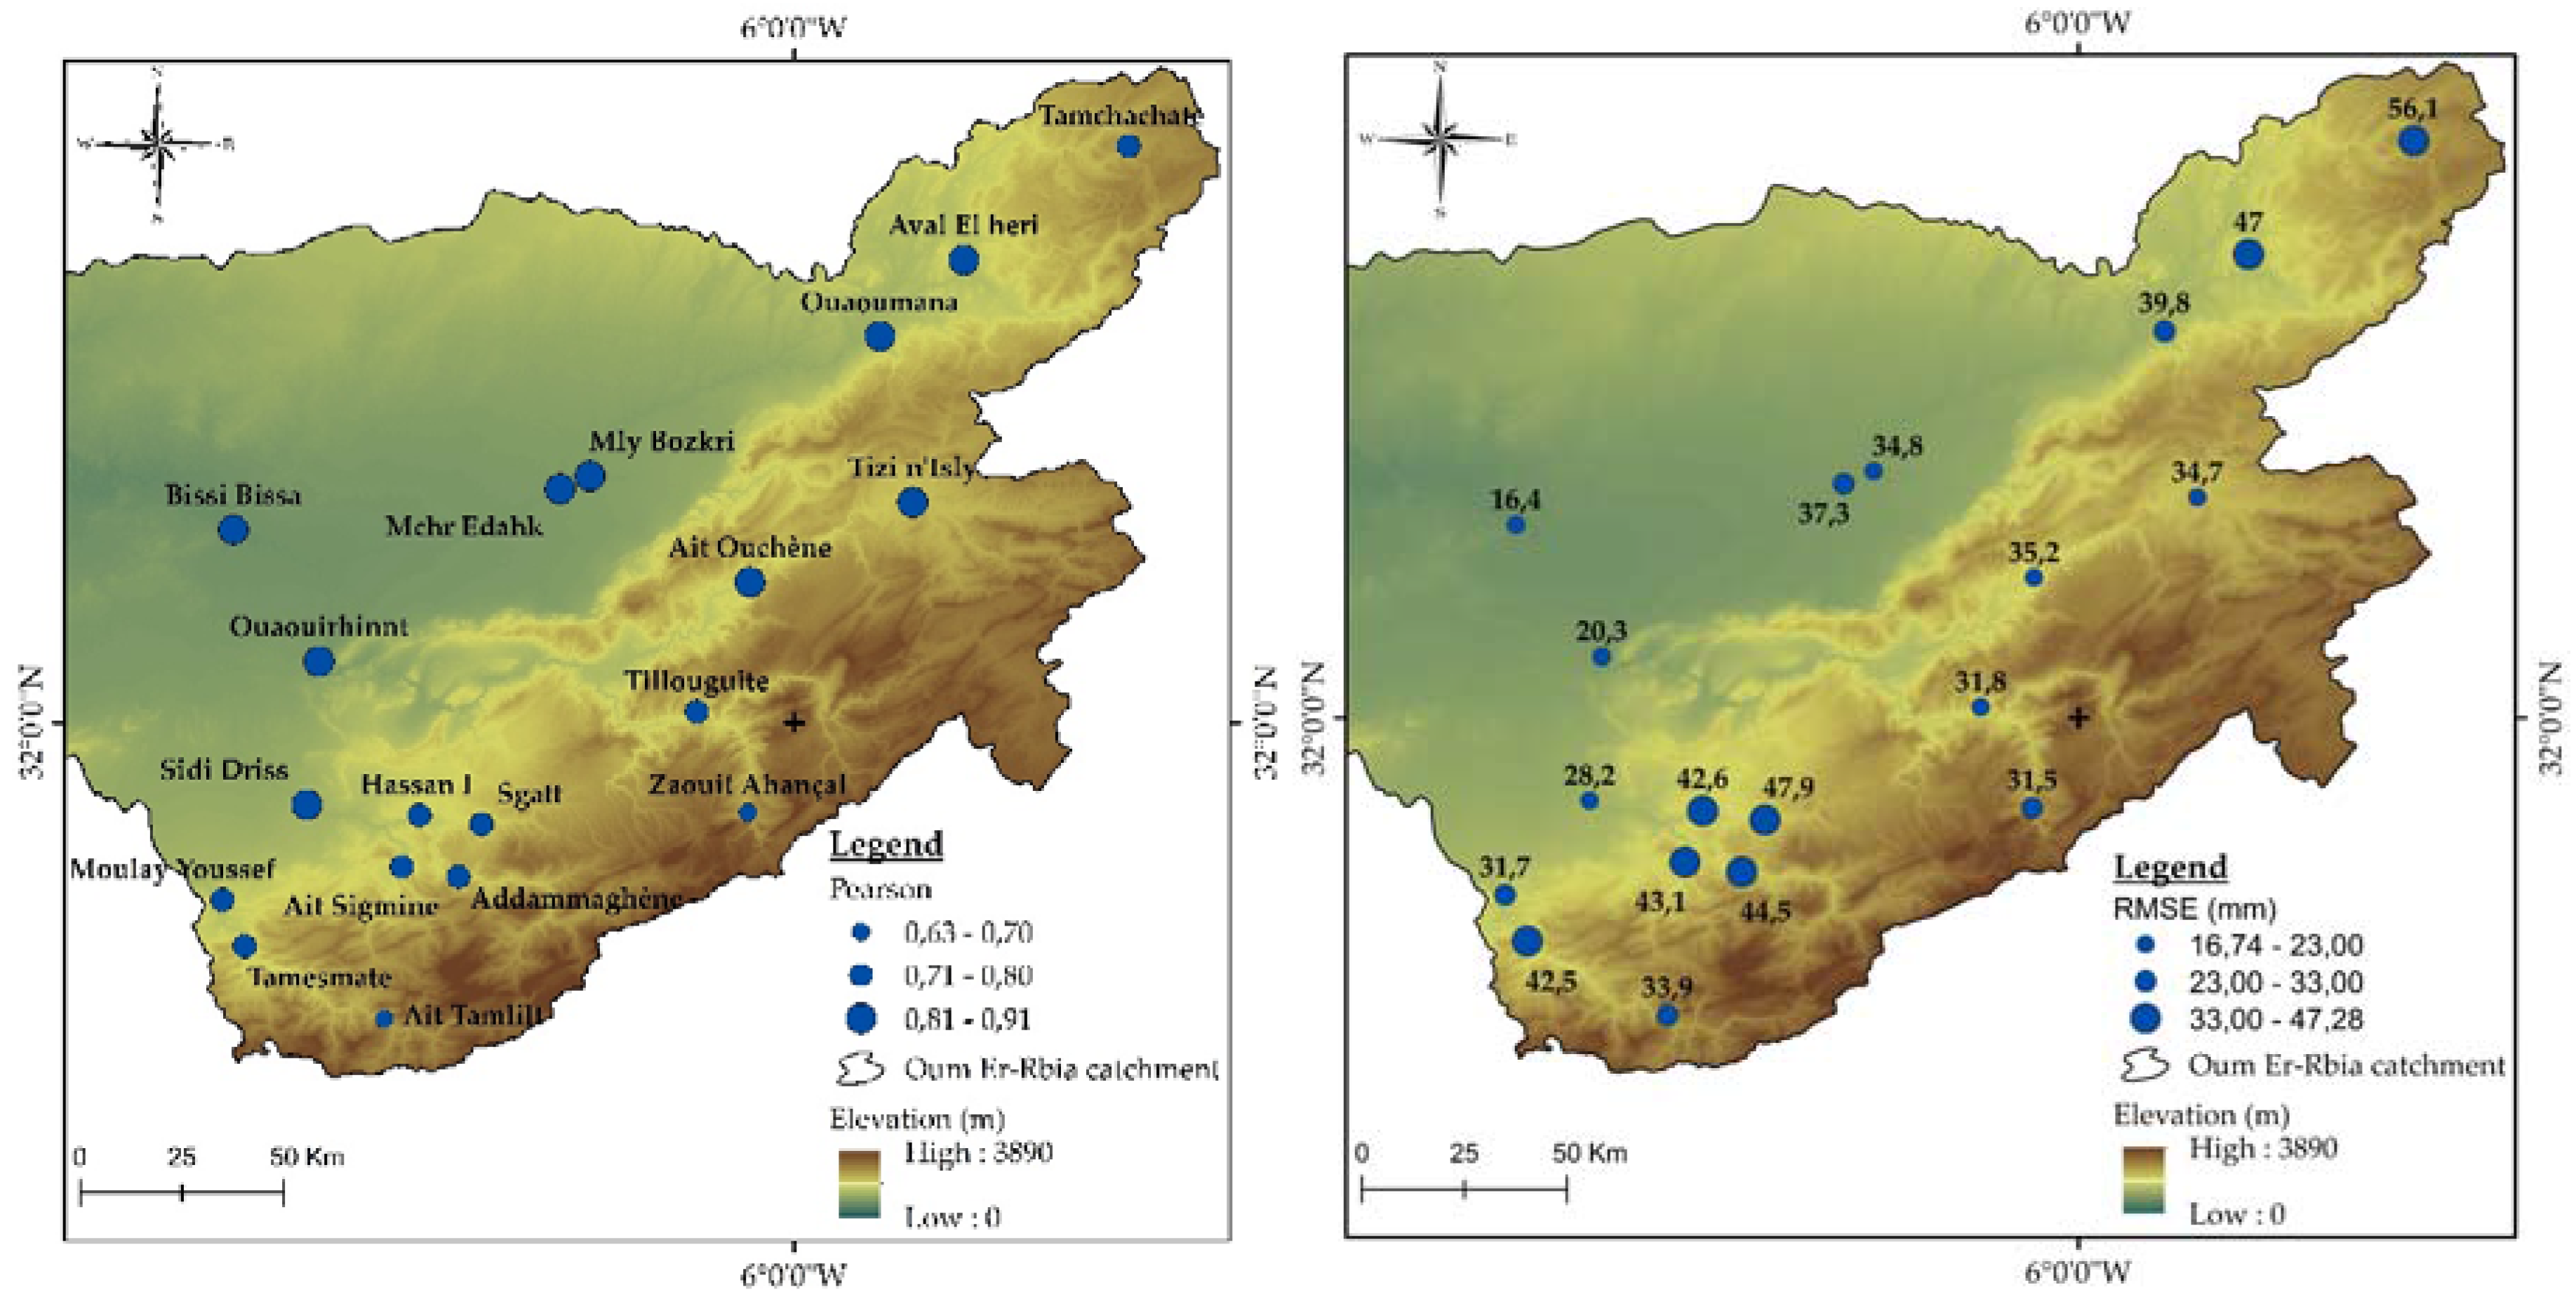
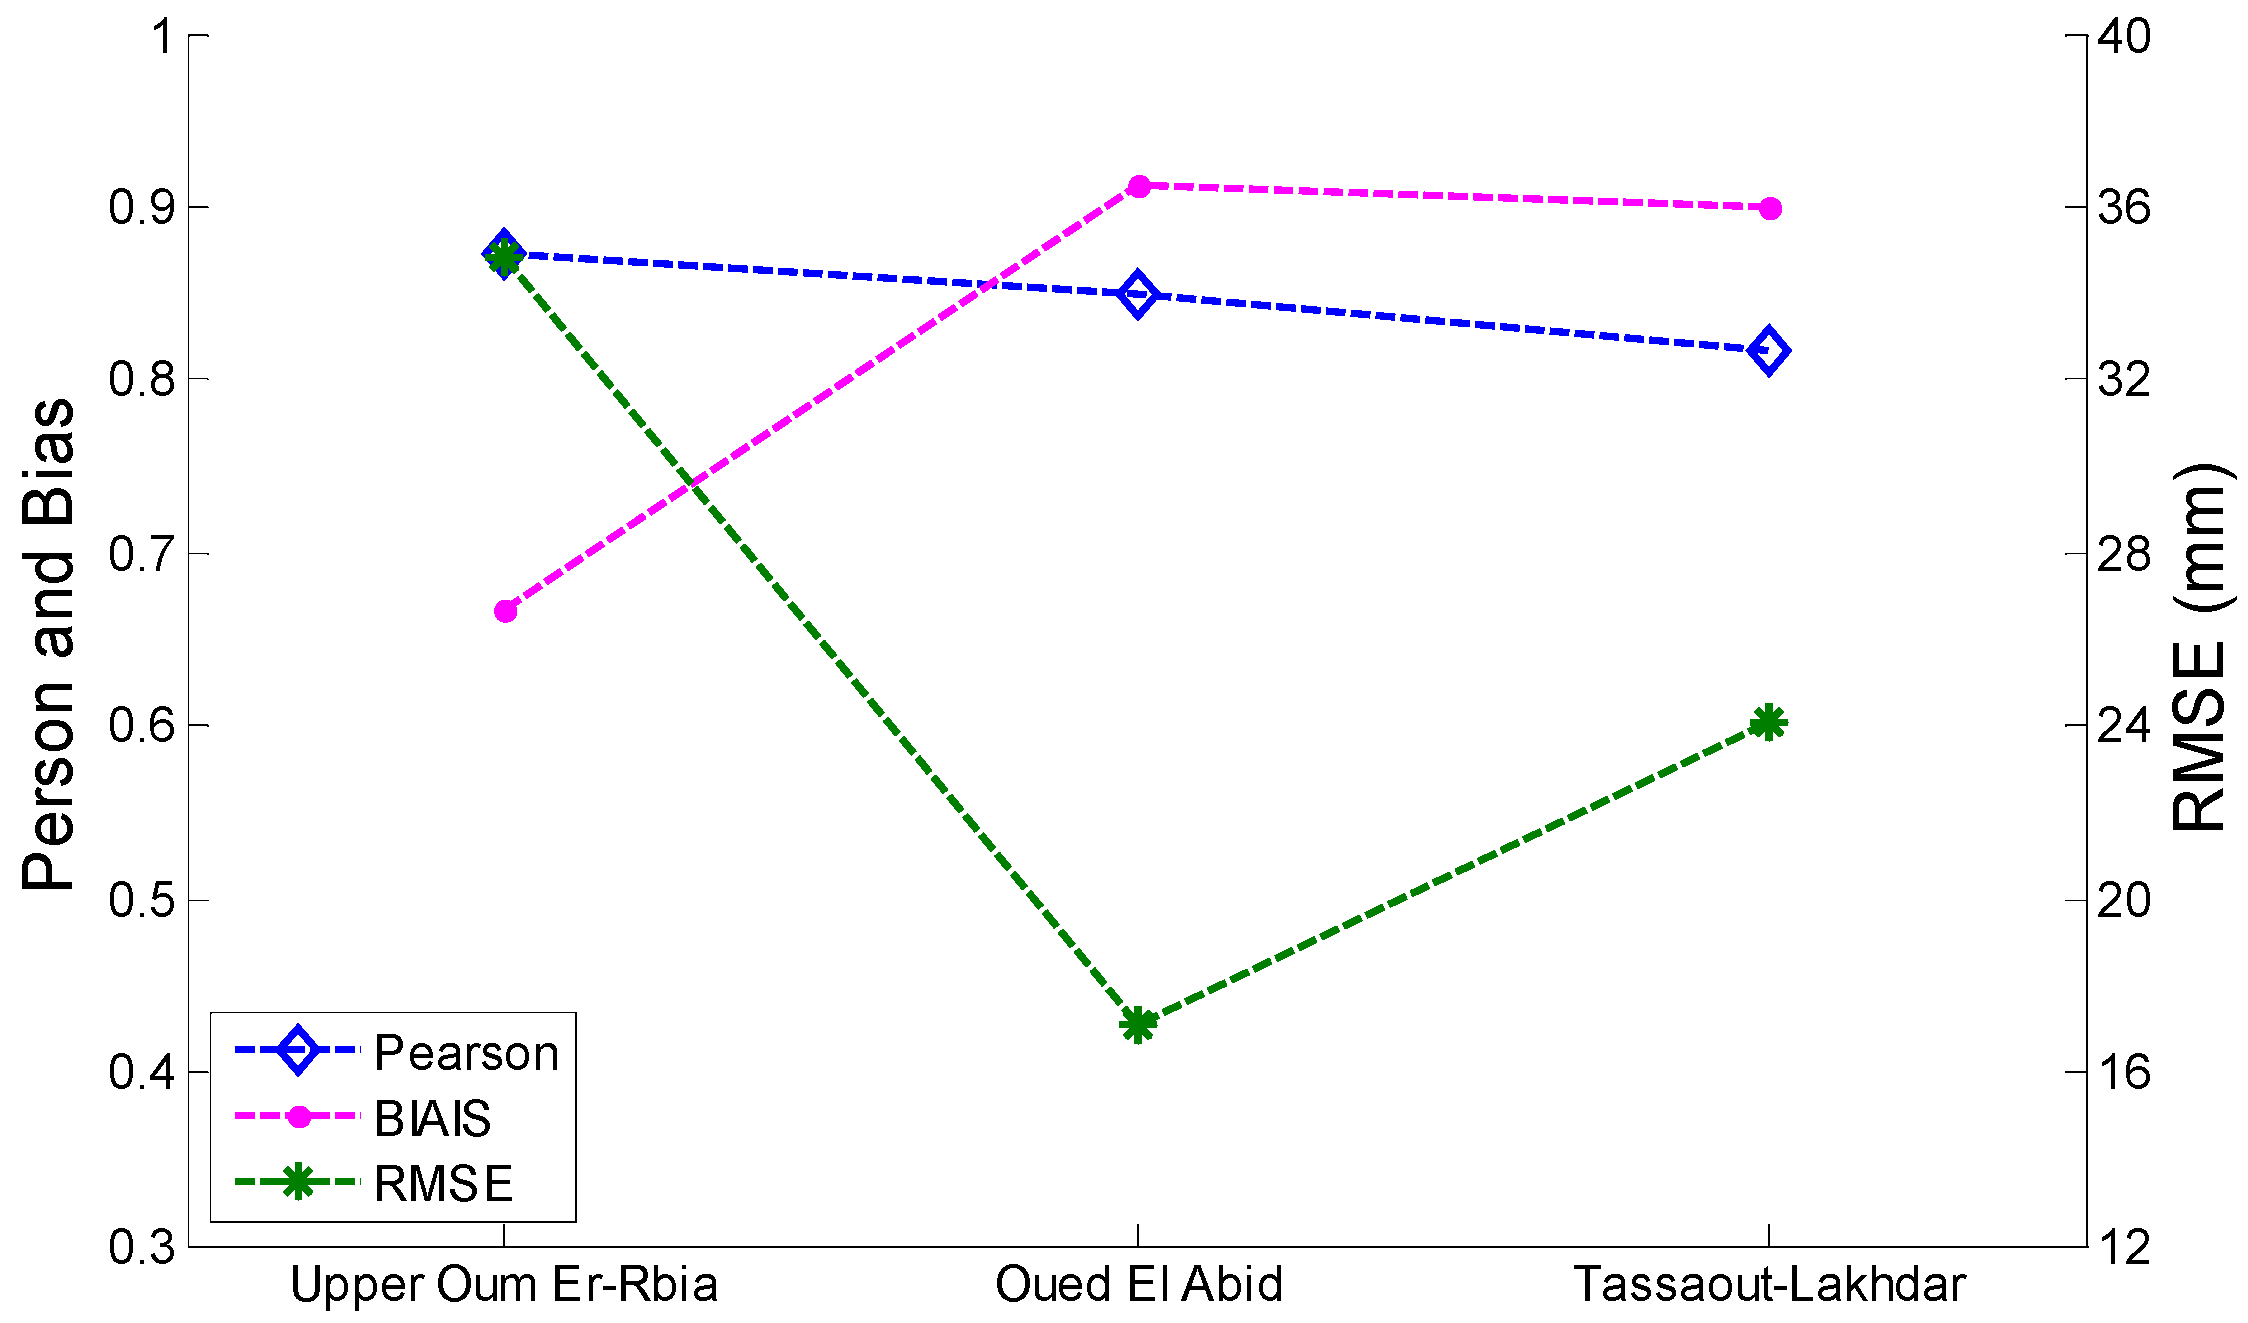
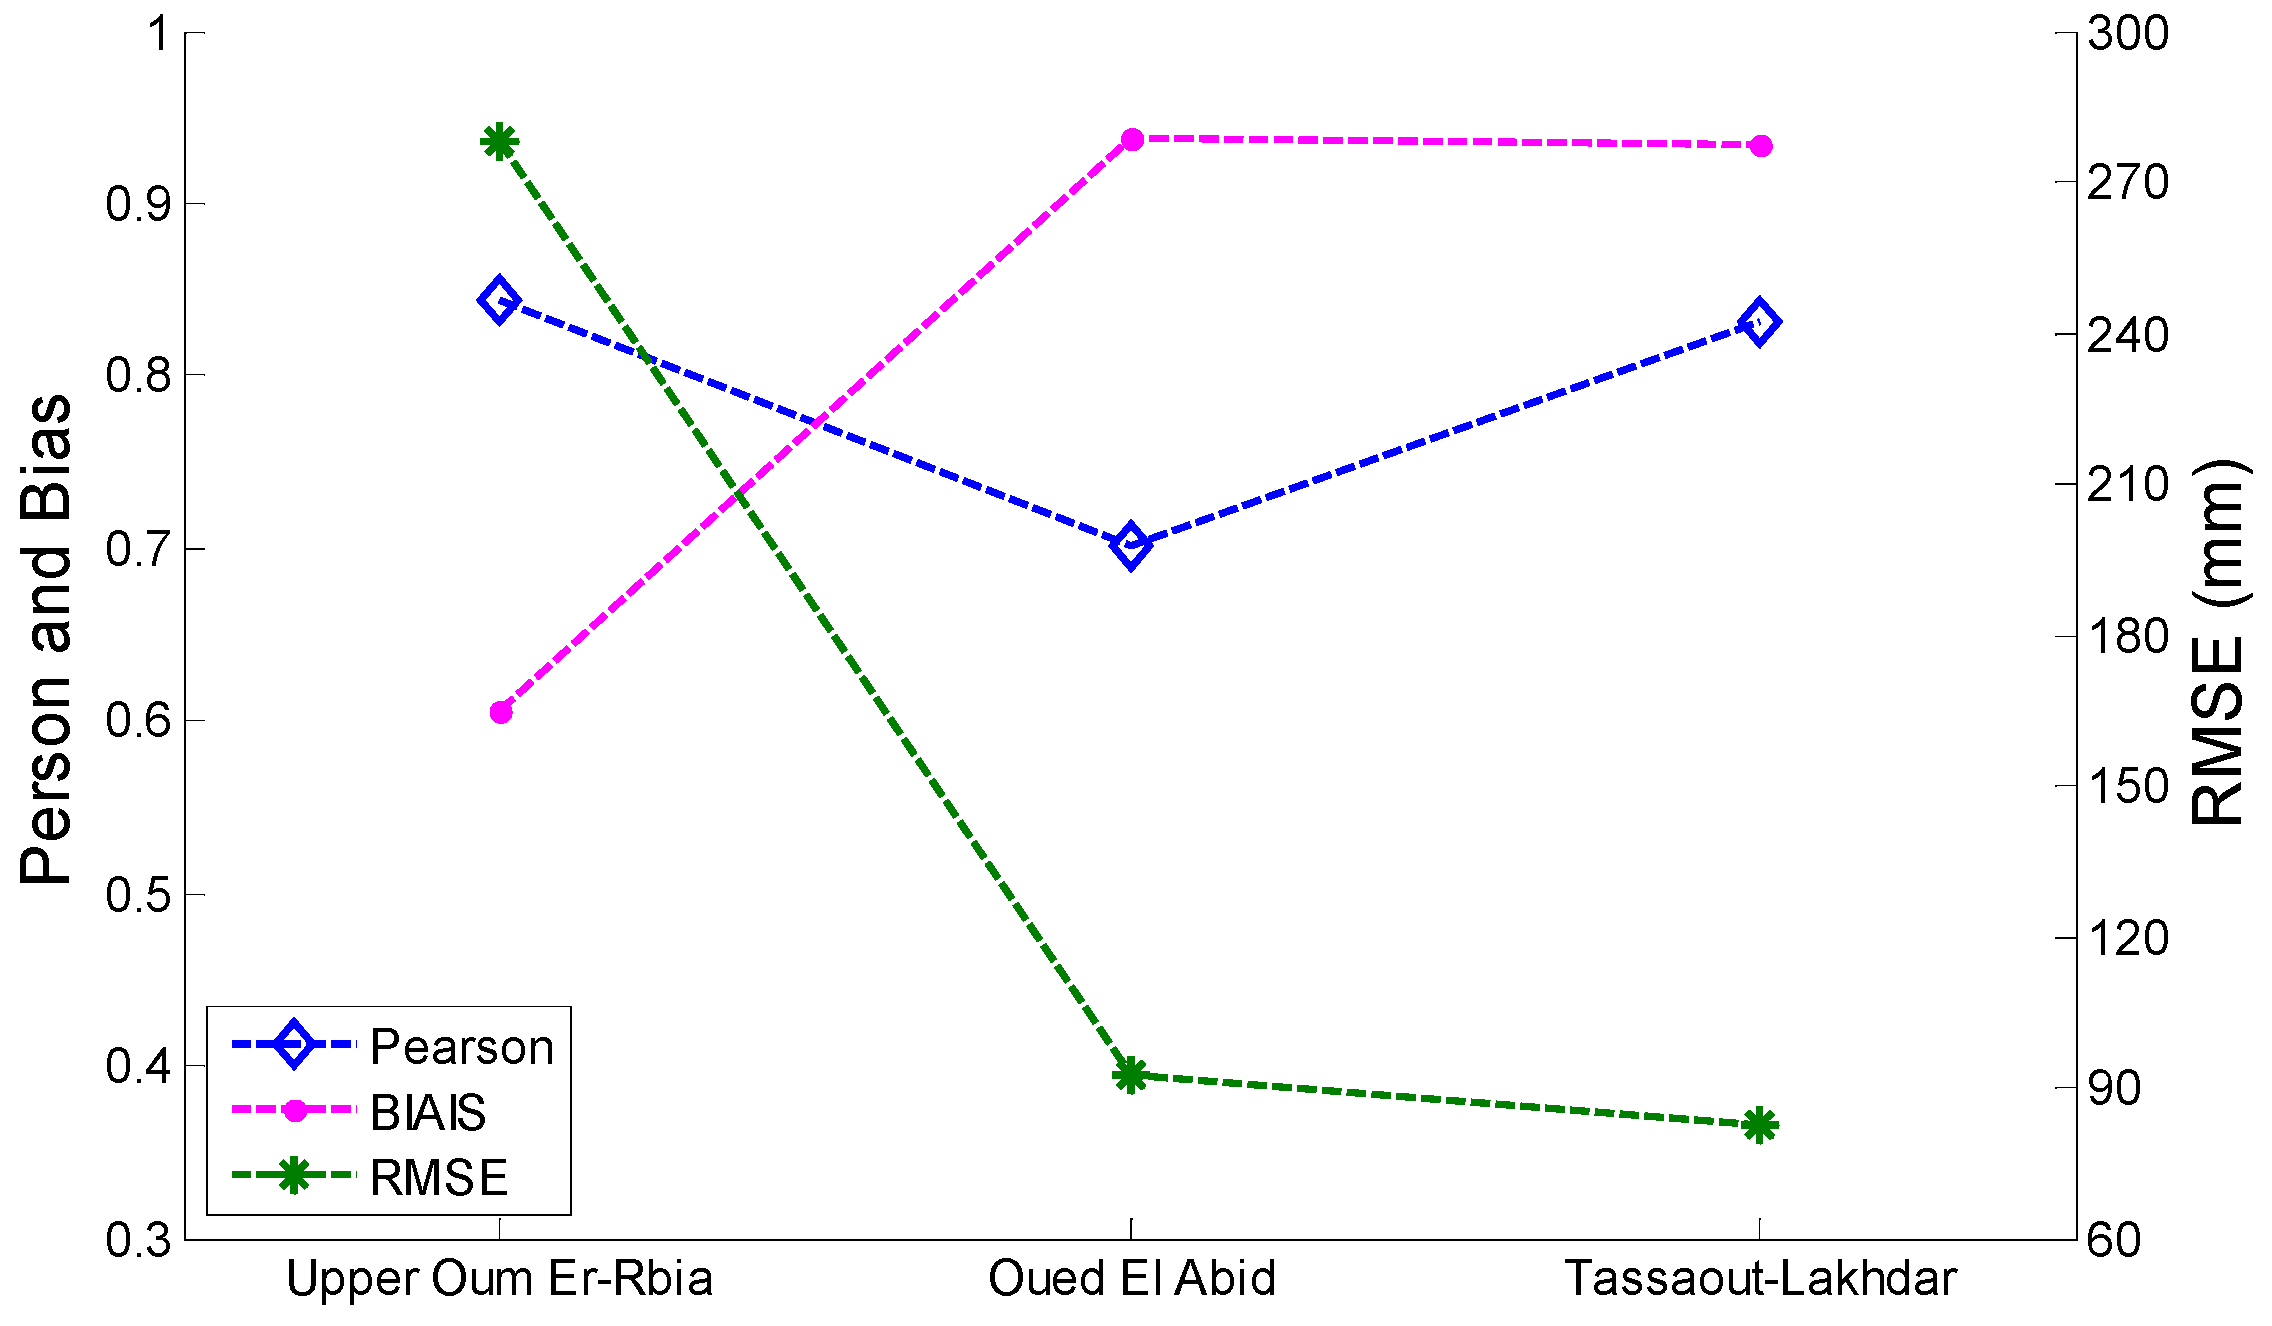
3.4. The Evaluation at The Catchment Scale

A comparison between TRMM and rain gauges data was conducted based on a zonal scale, considering the average rainfall collected in rain gauges and pixels within the same sub-watershed. Because of the very low statistics at the daily time scale, this comparison was carried out monthly (Figure 11) and annually (Figure 12).
In the three sub-watersheds (High Oum Er-Rbia Oueld El Abid and Tassaout Lekhdar) included in this analysis, the two datasets show a good agreement at both monthly and annual time scale. At the monthly scale, the Pearson correlation coefficients vary between 0.82 and 0.87, the RMSE between 17 mm and 35 mm, and the bias between 0.67 and 0.91. Among the three sub-watersheds, Ouad El Abid presents the best agreement with TRMM data followed by Tassaout-Lakhdar. However, at the annual scale, the correlation coefficients are slightly decreased with values ranging between 0.7 and 0.84, the RMSE values are more important between 82 mm and 278 mm, and the bias between 0.61 and 0.94. The two watersheds of Oued El Abid and Tassaout show good correlation coefficients (greater than 0.83) and acceptable RMSE (92 mm and 82 mm, respectively) with bias close to one. However, the upper watershed of Oum Er-Rbia shows relatively high correlation coefficients and low bias, associated with high RSME. This is again caused by the presence of snow during winter months, which is not detected by TRMM data.

4. Discussion and Conclusions

In the last few decades, water resources availability in the Oum Er Rbia watershed, which contains major river systems in Morocco, has faced alarming reductions of surface water and groundwater resources. According to future projections, the hydrological response in the upstream part of this watershed will be characterized by a reduction of total flow due to the increasing temperature and decreasing precipitation [62]. The rainfall, as a key parameter of the hydrological cycle, required a deep analysis to monitor the variability at spatial and temporal scale in order to ensure an operational water resources management. However, remote sensing data, such as TRMM, offers an opportunity to compensate the lack of rainfall measurements over a large region. This valuable information is not yet used in the Oum Er Rbia watershed, particularly as input data for hydrological modeling purpose. In this regards, we assessed the performance of the 3B42 V7 rainfall product at different time scales over the upstream part of the Oum Er Rbia watershed. Due to the varying topographic systems in the studied area, we conducted this assessment by a direct comparison between the rain gauges measurements and the corresponding pixels data obtained from TRMM. The working methodology has allowed us to evaluate the satellite product in different climatic and topographical contexts, thereby avoiding the uncertainties related to interpolation approaches based on a low-density measurement network.
The results, at a daily time scale, showed a remarkable difference between 3B42 V7 rainfall product and rain gauges, with correlation coefficients lower than 0.38 all over the study area. Mantas et al. [36] suggested that some of the poor agreement at smaller time resolution is due to intra-tile variability. For aggregated time scales (monthly and annual), the 3B42 V7 product and rain gauges show a stronger agreement compared to the daily time scale. These improvements for large time scales are probably because TRMM precipitation estimates are calibrated and rescaled using monthly rain gauge data [63]. Generally, TRMM and rain gauges data are well correlated for most of the study sites, with a mean correlation coefficient of 0.8 and 0.71 for monthly and annual time scales, respectively. However, the analysis showed that the TRMM product had difficulties in retrieving rainfall amounts over mountainous regions. Similarly, Almazroui [35], Mantas et al. [36], and Milweski et al. [40] emphasized the important impact of the accidental rugged topography on the accuracy of both satellite and rain gauges measurements. They all demonstrated the low agreement between TRMM and rain gauges over the highest elevations areas. Considering the fact that snowfall occurs usually in most of these areas during the wet season. This remains problematic for rainfall estimations [40]. In our case study, we have found that TRMM tends to overestimate rainfall amounts in areas receiving snowfall, contrary to what was reported by Anders et al. [64] and Krakauer et al. [65]. This observation may be explained by the unmeasured snow water equivalent by the rain gauges. Moreover, the study showed that the 3B42 V7 product is able to adequately reproduce the annual cycle of rainfall at large scale with bias compared to the rain gauges. Therefore, TRMM tends, in general, to overestimate rainfall in dry regions and underestimate rainfall in humid regions, which usually located at the highest elevations. During winter, TRMM mostly underestimates the rainfall amounts. Thus, the product faces a real constraint in capturing convective and short time events that occur often during July and August.
The rainfall data from the 3B42 V7 product, at monthly and annual time scale, can be a valuable source of information at a watershed scale, especially for hydrological modeling on one hand, and on the other hand, can also be valuable information for managers and decision makers. The use of these freely available data can represent an alternative in data-sparse regions and an important source of data for ungauged watersheds. These data, with their global spatial coverage, can be considered in further studies for hydrological and climatic research in the Oum Er Rbia watershed. Moreover, the use of this date will constitute a valuable source of information to assess the vulnerability of the various studied watersheds, and evaluate the sustainability of the anthropic activities under the actual and future hydrological and climatic contexts.

Acknowledgments

The authors are grateful to the Oum Er-Rbia hydraulic Basin Agency for providing the rain gauges data that we used in this study. We would like to thank NASA’s and JAXA’s teams, for creating and making their precipitation products freely available. We also would like to thank the reviewers of the manuscript for their helpful remarks.

Author Contributions

Hamza Ouatiki conducted the analysis, the interpretation of results, and the preparation of the manuscript under the supervision and the effective guidance and suggestions of Abdelghani Boudhar; Yves Tramblay, Lionel Jarlan, and Tarik Benabdelouhab contributed to the design and revisions of the manuscript, and provided important suggestions and reviews; Lahoucine Hanich and Abdelghani Chehbouni provided reviews and suggestions; Mohamed Rachid El Meslouhi processed the rain gauges data. All authors contributed to the writing of the manuscript.

Conflicts of Interest

The authors declare no conflict of interest.

References

  1. Esper, J.; Frank, D.; Büntgen, U.; Verstege, A.; Luterbacher, J.; Xoplaki, E. Long-term drought severity variations in Morocco. Geophys. Res. Lett. 2007, 34, 1–5. [Google Scholar] [CrossRef]
  2. Jarlan, L.; Khabba, S.; Er-Raki, S.; Le Page, M.; Hanich, L.; Fakir, Y.; Merlin, O.; Mangiarotti, S.; Gascoin, S.; Ezzahar, J.; et al. Remote sensing of water resources in semi-arid Mediterranean areas: The joint international laboratory TREMA. Int. J. Remote Sens. 2015, 36, 4879–4917. [Google Scholar] [CrossRef]
  3. Jellali, M.M. Développement des ressources en eau au Maroc. In Aspects économiques de la Gestion de l'eau dans le Bassin Méditerranéen; CIHEAM: Bari, Italie, 1997; pp. 51–68. [Google Scholar]
  4. Houdret, A. Les conflits autour de l’eau au Maroc: Origines Sociopolitiques et écologiques et Perspectives Pour une Transformation des Conflits. Ph.D. Thesis, University Duisburg-Essen, Duisburg/Essen, Allemagne, 2009. [Google Scholar]
  5. Schilling, J.; Freier, K.P.; Hertig, E.; Scheffran, J. Climate change, vulnerability and adaptation in North Africa with focus on Morocco. Agric. Ecosyst. Environ. 2012, 156, 12–26. [Google Scholar] [CrossRef]
  6. Knippertz, P.; Christoph, M.; Speth, P. Long-term precipitation variability in Morocco and the link to the large-scale circulation in recent and future climates. Meteorol. Atmos. Phys. 2003, 83, 67–88. [Google Scholar] [CrossRef]
  7. Boudhar, A.; Duchemin, B.; Hanich, L.; Jarlan, L.; Chaponnière, A.; Maisongrande, P.; Boulet, G.; Chehbouni, A. Long-term analysis of snow-covered area in the Moroccan High-Atlas through remote sensing. Int. J. Appl. Earth Obs. Geoinf. 2010, 12, S109–S115. [Google Scholar] [CrossRef] [Green Version]
  8. Yvan, C. Modélisation des écoulements d’Origine Pluvio-nivo-glaciaire en Contexte de Haute Montagne Tropicale: Application à la Haute Vallée du Zongo (Bolivie). Ph.D. Thesis, University Montpellier II, Montpellier, France, 2001. [Google Scholar]
  9. Güntner, A. Large-Scale Hydrological Modelling in the Semi-Arid North-East of Brazil. Ph.D. Thesis, Departement Geoecology, University Potsdam, Potsdam, Germany, 2002. [Google Scholar]
  10. Boudhar, A.; Hanich, L.; Boulet, G.; Duchemin, B.; Berjamy, B.; Chehbouni, A. Evaluation of the snowmelt runoff model in the Moroccan High Atlas Mountains using two snow-cover estimates. Hydrol. Sci. J. 2009, 54, 1094–1113. [Google Scholar] [CrossRef]
  11. Organisation Météorologique Mondiale. Guide Des Pratiques Hydrologiques: Acquisition et Traitement des Données, Analyses, Prévision et Autres Applications; OMM: Genève, Suisse, 1994. [Google Scholar]
  12. Adler, R.F.; Negri, A.J.; Keehn, P.R.; Hakkarinen, I.M. Estimation of monthly rainfall over Japan and surrounding waters from a combination of low-orbit microwave and geosynchronous IR data. J. Appl. Meteorol. 1993, 32, 335–356. [Google Scholar] [CrossRef]
  13. Adler, R.F.; Huffman, G.J.; Keehn, P.R. Global tropical rain estimates from microwave-adjusted geosynchronous IR data. Remote Sens. Rev. 1994, 11, 125–152. [Google Scholar] [CrossRef]
  14. Bennartz, R.; Thoss, A.; Dybbroe, A.; Michelson, D.B. Precipitation analysis using the advanced microwave sounding unit in support of nowcasting applications. Meteorol. Appl. 2002, 9, 177–189. [Google Scholar] [CrossRef]
  15. Muñoz, E.A.; Di Paola, F.; Lanfri, M.A.; Arteaga, F.J. Observing the troposphere through the Advanced Microwave Technology Sensor (ATMS) to retrieve rain rate. IEEE Lat. Am. Trans. 2016, 14, 586–594. [Google Scholar] [CrossRef]
  16. Huffman, G.J.; Adler, R.F.; Morrissey, M.M.; Bolvin, D.T.; Curtis, S.; Joyce, R.; McGavock, B.; Susskind, J. Global precipitation at one-degree daily resolution from multisatellite observations. J. Hydrometeorol. 2001, 2, 36–50. [Google Scholar] [CrossRef]
  17. Hsu, K.; Gao, X.; Sorooshian, S.; Gupta, H.V. Precipitation estimation from remotely sensed information using artificial neural networks. J. Appl. Meteorol. 1997, 36, 1176–1190. [Google Scholar] [CrossRef]
  18. Miller, S.W.; Arkin, P.A.; Joyce, R. A combined microwave/infrared rain rate algorithm. Int. J. Remote Sens. 2001, 22, 3285–3307. [Google Scholar] [CrossRef]
  19. Joyce, R.J.; Janowiak, J.E.; Arkin, P.A.; Xie, P. CMORPH: A method that produces global precipitation estimates from passive microwave and infrared data at high spatial and temporal resolution. J. Hydrometeorol. 2004, 5, 487–503. [Google Scholar] [CrossRef]
  20. Vila, D.A.; de Goncalves, L.G.G.; Toll, D.L.; Rozante, J.R. Statistical evaluation of combined daily gauge observations and rainfall satellite estimates over continental South America. J. Hydrometeorol. 2009, 10, 533–543. [Google Scholar] [CrossRef]
  21. Rozante, J.R.; Moreira, D.S.; de Goncalves, L.G.G.; Vila, D.A. Combining TRMM and surface observations of precipitation: Technique and validation over South America. Weather Forecast. 2010, 25, 885–894. [Google Scholar] [CrossRef]
  22. Arvor, D.; Dubreuil, V.; Ronchail, J.; Penello, S.; Paris, U. Apport des données TRMM 3B42 à l’étude des précipitations au Mato Grosso. Climatologie 2008, 5, 49–69. [Google Scholar] [CrossRef]
  23. Su, F.; Hong, Y.; Lettenmaier, D.P. Evaluation of TRMM Multisatellite Precipitation Analysis (TMPA) and its utility in hydrologic prediction in the La Plata Basin. J. Hydrometeorol. 2008, 9, 622–640. [Google Scholar] [CrossRef]
  24. Gu, H.; Yu, Z.; Yang, C.; Ju, Q.; Lu, B.; Liang, C. Hydrological assessment of TRMM rainfall data over Yangtze River Basin. Water Sci. Eng. 2010, 3, 418–430. [Google Scholar]
  25. Di Paola, F.; Ricciardelli, E.; Cimini, D.; Romano, F.; Viggiano, M.; Cuomo, V. Analysis of catania flash flood case study by using combined microwave and infrared technique. J. Hydrometeorol. 2014, 15, 1989–1998. [Google Scholar] [CrossRef]
  26. Li, L.; Hong, Y.; Wang, J.; Adler, R.F.; Policelli, F.S.; Habib, S.; Irwn, D.; Korme, T.; Okello, L. Evaluation of the real-time TRMM-based multi-satellite precipitation analysis for an operational flood prediction system in Nzoia Basin, Lake Victoria, Africa. Nat. Hazards 2009, 50, 109–123. [Google Scholar] [CrossRef]
  27. Moffitt, C.B.; Hossain, F.; Adler, R.F.; Yilmaz, K.K.; Pierce, H.F. Validation of a TRMM-based global flood detection system in Bangladesh. Int. J. Appl. Earth Obs. Geoinf. 2011, 13, 165–177. [Google Scholar] [CrossRef]
  28. Zhang, A.; Jia, G. Monitoring meteorological drought in semiarid regions using multi-sensor microwave remote sensing data. Remote Sens. Environ. 2013, 134, 12–23. [Google Scholar] [CrossRef]
  29. Du, L.; Tian, Q.; Yu, T.; Meng, Q.; Jancso, T.; Udvardy, P.; Huang, Y. A comprehensive drought monitoring method integrating MODIS and TRMM data. Int. J. Appl. Earth Obs. Geoinf. 2013, 23, 245–253. [Google Scholar] [CrossRef]
  30. Yaduvanshi, A.; Srivastava, P.K.; Pandey, A.C. Integrating TRMM and MODIS satellite with socio-economic vulnerability for monitoring drought risk over a tropical region of India. Phys. Chem. Earth 2015, 83, 14–27. [Google Scholar] [CrossRef]
  31. Brown, J.E.M. An analysis of the performance of hybrid infrared and microwave satellite precipitation algorithms over India and adjacent regions. Remote Sens. Environ. 2006, 101, 63–81. [Google Scholar] [CrossRef]
  32. Dinku, T.; Chidzambwa, S.; Ceccato, P.S.; Connor, J.; Ropelewski, C.F. Validation of high-resolution satellite rainfall products over complex terrain. Int. J. Remote Sens. 2008, 29, 4097–4110. [Google Scholar] [CrossRef]
  33. Baik, J.; Choi, M. Spatio-temporal variability of remotely sensed precipitation data from COMS and TRMM: Case study of Korean peninsula in East Asia. Adv. Space Res. 2015, 56, 1125–1138. [Google Scholar] [CrossRef]
  34. Blacutt, L.A.; Herdies, D.L.; de Gonçalves, L.G.G.; Vila, D.A.; Andrade, M. Precipitation comparison for the CFSR, MERRA, TRMM3B42 and combined scheme datasets in Bolivia. Atmos. Res. 2015, 163, 117–131. [Google Scholar] [CrossRef]
  35. Almazroui, M. Calibration of TRMM rainfall climatology over Saudi Arabia during 1998–2009. Atmos. Res. 2011, 99, 400–414. [Google Scholar] [CrossRef]
  36. Mantas, V.M.; Liu, Z.; Caro, C.; Pereira, A.J.S.C. Validation of TRMM multi-satellite precipitation analysis (TMPA) products in the Peruvian Andes. Atmos. Res. 2015, 163, 132–145. [Google Scholar] [CrossRef]
  37. Collischonn, B.; Collischonn, W.; Tucci, C.E.M. Daily hydrological modeling in the Amazon Basin using TRMM rainfall estimates. J. Hydrol. 2008, 360, 207–216. [Google Scholar] [CrossRef]
  38. Islam, M.N.; Uyeda, V. Use of TRMM in determining the climatic characteristics of rainfall over Bangladesh. Remote Sens. Environ. 2007, 108, 264–276. [Google Scholar] [CrossRef]
  39. Huang, Y.; Chen, S.; Cao, Q.; Hong, Y.; Wu, B.; Huang, M.; Qiao, L.; Zhang, Z.; Li, Z.; Li, W.; et al. Evaluation of version-7 TRMM multi-satellite precipitation analysis product during the Beijing extreme heavy rainfall event of 21 July 2012. Water 2014, 6, 32–44. [Google Scholar] [CrossRef]
  40. Milewski, A.; Elkadiri, R.; Durham, M. Assessment and comparison of TMPA satellite precipitation products in varying climatic and topographic regimes in Morocco. Remote Sens. 2015, 7, 5697–5717. [Google Scholar] [CrossRef]
  41. Tramblay, Y.; Thiemig, V.; Dezetter, A.; Hanich, L. Evaluation of satellite-based rainfall products for hydrological modelling in Morocco. Hydrol. Sci. J. 2016, 61, 2509–2519. [Google Scholar] [CrossRef]
  42. Mokhtari, N.; Mrabet, R.; Lebailly, P.; Bock, L. Spatialisation des bioclimats, de l’aridité et des étages de végétation du Maroc. Rev. Marocaine Sci. Agron. Vétérinaires 2013, 2, 50–66. [Google Scholar]
  43. Moniod, F. Étude hydrologicpe de l’Oum Er-Rbia. Cah. ORSTOM Sér. Hydrol. 1973, 10, 153–170. [Google Scholar]
  44. Boudhar, A.; Hanich, L.; Boulet, G.; Outaleb, K.; Arioua, A.; Ben, B.; Hakkani, B. Etude de la disponibilité des ressources en eau à l’aide de la télédétection et la modélisation: Cas du bassin versant d’Oum Er Rbia (Maroc). In Proceedings of the 3éme Colloque International Eau–Climat’2014: Ressources en Eau Changement Climatique en Région Méditerranéenne, Hammamet, Tunisie, 21–23 Octobre 2014.
  45. Marchane, A.; Jarlan, L.; Hanich, L.; Boudhar, A.; Gascoin, S.; Tavernier, A.; Filali, N.; Le Page, M.; Hagolle, O.; Berjamy, B. Assessment of daily MODIS snow cover products to monitor snow cover dynamics over the Moroccan Atlas mountain range. Remote Sens. Environ. 2015, 160, 72–86. [Google Scholar] [CrossRef]
  46. Earth Observation Center National Space Development Agency of Japan. TRMM Users Handbook; NASDA: Tanegashima, Japan, 2001. [Google Scholar]
  47. Kummerow, C.; Barnes, W.; Kozu, T.; Shiue, J.; Simpson, J. The tropical rainfall measuring mission (TRMM) sensor package. J. Atmos. Ocean. Technol. 1998, 15, 809–817. [Google Scholar] [CrossRef]
  48. Kummerow, C.; Simpson, J.; Thiele, O.; Barnes, W.; Chang, A.T.C.; Stocker, E.; Adler, R.F.; Hou, A.; Kakar, R.; Wentz, F.; et al. The status of the Tropical Rainfall Measuring Mission (TRMM) after two years in orbit. J. Appl. Meteorol. 2000, 39, 1965–1982. [Google Scholar] [CrossRef]
  49. Huffman, G.; Adler, R.; Bolvin, D.; Nelkin, E. The TRMM multi-satellite precipitation analysis (TMPA). In Satellite Rainfall Applications for Surface Hydrology; Springer: Berlin, Germany, 2010; pp. 3–22. [Google Scholar]
  50. Bolvin, D.T.; Huffman, G.J. Transition of 3B42/3B43 Research Product from Monthly to Climatological Calibration/Adjustment. Available online: http://pmm.nasa.gov/sites/default/files/document_files/3B42_3B43_TMPA_restart.pdf (accessed on 15 Decembre 2015).
  51. Huffman, G.J.; Bolvin, D.T.; Nelkin, E.J.; Wolff, D.B.; Adler, R.F.; Gu, G.; Hong, Y.; Bowman, K.P.; Stocker, E.F. The TRMM Multisatellite Precipitation Analysis (TMPA): Quasi-global, multiyear, combined-sensor precipitation estimates at fine scales. J. Hydrometeorol. 2007, 8, 38–55. [Google Scholar] [CrossRef]
  52. Huffman, G.J.; Bolvin, D.T. TRMM and Other Data Precipitation Data Set Documentation. Available online: ftp://meso-a.gsfc.nasa.gov/pub/trmmdocs/3B42_3B43_doc.pdf (accessed on 15 Decembre 2015).
  53. Xue, X.; Hong, Y.; Limaye, A.S.; Gourley, J.J.; Huffman, G.J.; Khan, S.I.; Dorji, C.; Chen, S. Statistical and hydrological evaluation of TRMM-based Multi-satellite Precipitation Analysis over the Wangchu Basin of Bhutan: Are the latest satellite precipitation products 3B42V7 ready for use in ungauged basins? J. Hydrol. 2013, 499, 91–99. [Google Scholar] [CrossRef]
  54. Chen, S.; Hong, Y.; Gourley, J.J.; Huffman, G.J.; Tian, Y.; Cao, Q.; Yong, B.; Kirstetter, P.E.; Hu, J.; Hardy, J.; et al. Similarity and difference of the two successive V6 and V7 TRMM multisatellite precipitation analysis performance over China. J. Geophys. Res. Atmos. 2013, 118, 13060–13074. [Google Scholar] [CrossRef]
  55. Tropical Rainfall Measuring Mission (TRMM) (2011), TRMM (TMPA) Rainfall Estimate L3 3 hour 0.25 degree x 0.25 degree V7, Greenbelt, MD, Goddard Earth Sciences Data and Information Services Center (GES DISC). Available online: http://disc.gsfc.nasa.gov/datacollection/TRMM_3B42_7.html (accessed on 17 December 2015).
  56. Moazami, S.; Golian, S.; Kavianpour, M.R.; Hong, Y. Comparison of PERSIANN and V7 TRMM Multi-satellite Precipitation Analysis (TMPA) products with rain gauge data over Iran. Int. J. Remote Sens. 2013, 34, 8156–8171. [Google Scholar] [CrossRef]
  57. Cai, Y.; Jin, C.; Wang, A.; Guan, D.; Wu, J.; Yuan, F.; Xu, L. Spatio-temporal analysis of the accuracy of tropical multisatellite precipitation analysis 3B42 precipitation data in mid-high latitudes of China. PLoS ONE 2015, 10, 1–22. [Google Scholar] [CrossRef] [PubMed]
  58. Nastos, P.T.; Kapsomenakis, J.; Philandras, K.M. Evaluation of the TRMM 3B43 gridded precipitation estimates over Greece. Atmos. Res. 2016, 169, 497–514. [Google Scholar] [CrossRef]
  59. Porcù, F.; Milani, L.; Petracca, M. On the uncertainties in validating satellite instantaneous rainfall estimates with raingauge operational network. Atmos. Res. 2014, 144, 73–81. [Google Scholar] [CrossRef]
  60. Wilks, D.S. Forecast verification. In Statistical Methods in the Atmospheric Sciences; Elsevier: Burlington, MA, USA, 2006; pp. 255–335. [Google Scholar]
  61. Chaponniere, A. Fonctionnement Hydrologique d’un Bassin Versant Montagneux Semi-aride: Cas du Bassin Versant du Rehraya (Haut Atlas marocain). Ph.D. Thesis, Institut National Agronomique Paris-Grignon, Paris, France, 2005. [Google Scholar]
  62. Jaw, T.; Li, J.; Hsu, K.L.; Sorooshian, S.; Driouech, F. Evaluation for Moroccan dynamically downscaled precipitation from GCM CHAM5 and its regional hydrologic response. J. Hydrol. Reg. Stud. 2015, 3, 359–378. [Google Scholar] [CrossRef]
  63. Gao, Y.C.; Liu, M.F. Evaluation of high-resolution satellite precipitation products using rain gauge observations over the Tibetan Plateau. Hydrol. Earth Syst. Sci. 2013, 17, 837–849. [Google Scholar] [CrossRef]
  64. Anders, A.M.; Roe, G.H.; Hallet, B.; Montgomery, D.R.; Finnegan, N.J.; Putkonen, J. Spatial patterns of precipitation and topography in the Himalaya. Geol. Soc. Am. 2006, 398, 39–53. [Google Scholar]
  65. Krakauer, N.Y.; Pradhanang, S.M.; Lakhankar, T.; Jha, A.K. Evaluating satellite products for precipitation estimation in mountain regions: A case study for Nepal. Remote Sens. 2013, 5, 4107–4123. [Google Scholar] [CrossRef]
Figure 1. Geographical location of the study area and locations of used rain gauges.
Climate 05 00001 g001
Figure 2. (a) Overall inter-annual mean monthly rainfall of the study area (1998–2010); (b) and (c) Maximal monthly temperature at Tillouguite (1100 m a.s.l.) and Sidi Driss dam’s rain gauge (640 m a.s.l.), respectively (1998–2010); (d) and (e) Minimal monthly temperature at Tillouguite and Sidi Driss dam’s rain gauge, respectively (1998–2010).
Climate 05 00001 g002
Figure 3. Obtained statistics (Pearson correlation coefficient, RMSE, and Bias) for daily and monthly time scale.
Climate 05 00001 g003
Figure 4. Scatterplot between the 3B42 V7 product and the rain gauges at a monthly time scale over the period 1998–2010.
Climate 05 00001 g004
Figure 5. Average correlation coefficient of each month of the time series.
Climate 05 00001 g005
Figure 6. Pearson correlation coefficient based on topography and RMSE based on mean monthly rainfall.
Climate 05 00001 g006
Figure 7. Bias sorted according to the monthly average rainfall.
Climate 05 00001 g007
Figure 8. Annual cycle of rainfall obtained from Tropical Rainfall Measurement Mission (TRMM) data and rain gauges for the period of 1998–2010.
Climate 05 00001 g008
Figure 9. The overall scatterplot between TRMM and rain gauges at annual time scale.
Climate 05 00001 g009
Figure 10. Annual rainfall obtained from representative TRMM pixels and rain gauges data for the period 1998–2010.
Climate 05 00001 g010
Figure 11. Evaluation statistics for the three studied sub watershed at monthly time scale.
Climate 05 00001 g011
Figure 12. Evaluation statistics for the three studied sub-watershed at annual time scale.
Climate 05 00001 g012
Table 1. Contingency table showing the meaning of parameters used in Equations (1)–(3) (rain ≥ threshold ➔ rainy day; rain < threshold ➔ day without rain).
Rain   Gauge
Rain     Threshold Rain   <   Threshold
Satellite Rain     Threshold a b
Rain   <   Threshold c d
Table 2. Obtained statistics (POD, FAR, FBI, and Pearson correlation coefficient) for daily time scale. POD, Probability Of Detection; FAR, False Alarm Ratio; FBI, Frequency Bias Index.
StationPODFARFBIPearson
Addammaghene0.600.772.590.08
Ait Ouchene0.480.430.840.29
Ait Sigmine0.500.812.630.10
Ait Tamlilt0.540.772.310.14
Sidi Driss dam0.470.510.970.22
Aval El Heri0.490.511.000.31
Bissi Bissa0.480.621.260.31
Mechra Eddahk0.360.390.590.35
Moulay Bouzekri0.440.380.710.38
Ouaouirhinnt0.440.470.830.21
Ouaoumana0.430.450.770.31
Sgatt0.440.540.970.13
Tamchachate0.420.721.510.15
Tamesmate0.400.721.440.00
Tillouguite0.520.621.370.18
Tizi N lsly0.460.530.970.16
Zaouit Ahancal0.600.681.880.16
Hassan 1st dam0.450.530.950.14
Moulay Youssef dam0.420.500.850.20

