
Urban Land Use Land Cover Changes and Their Effect on Land Surface Temperature: Case Study Using Dohuk City in the Kurdistan Region of Iraq


Abstract
:1. Introduction
- (1)
- To evaluate urban land use/cover changes in Duhok City and to analyze the impact of land use/cover on LST.
- (2)
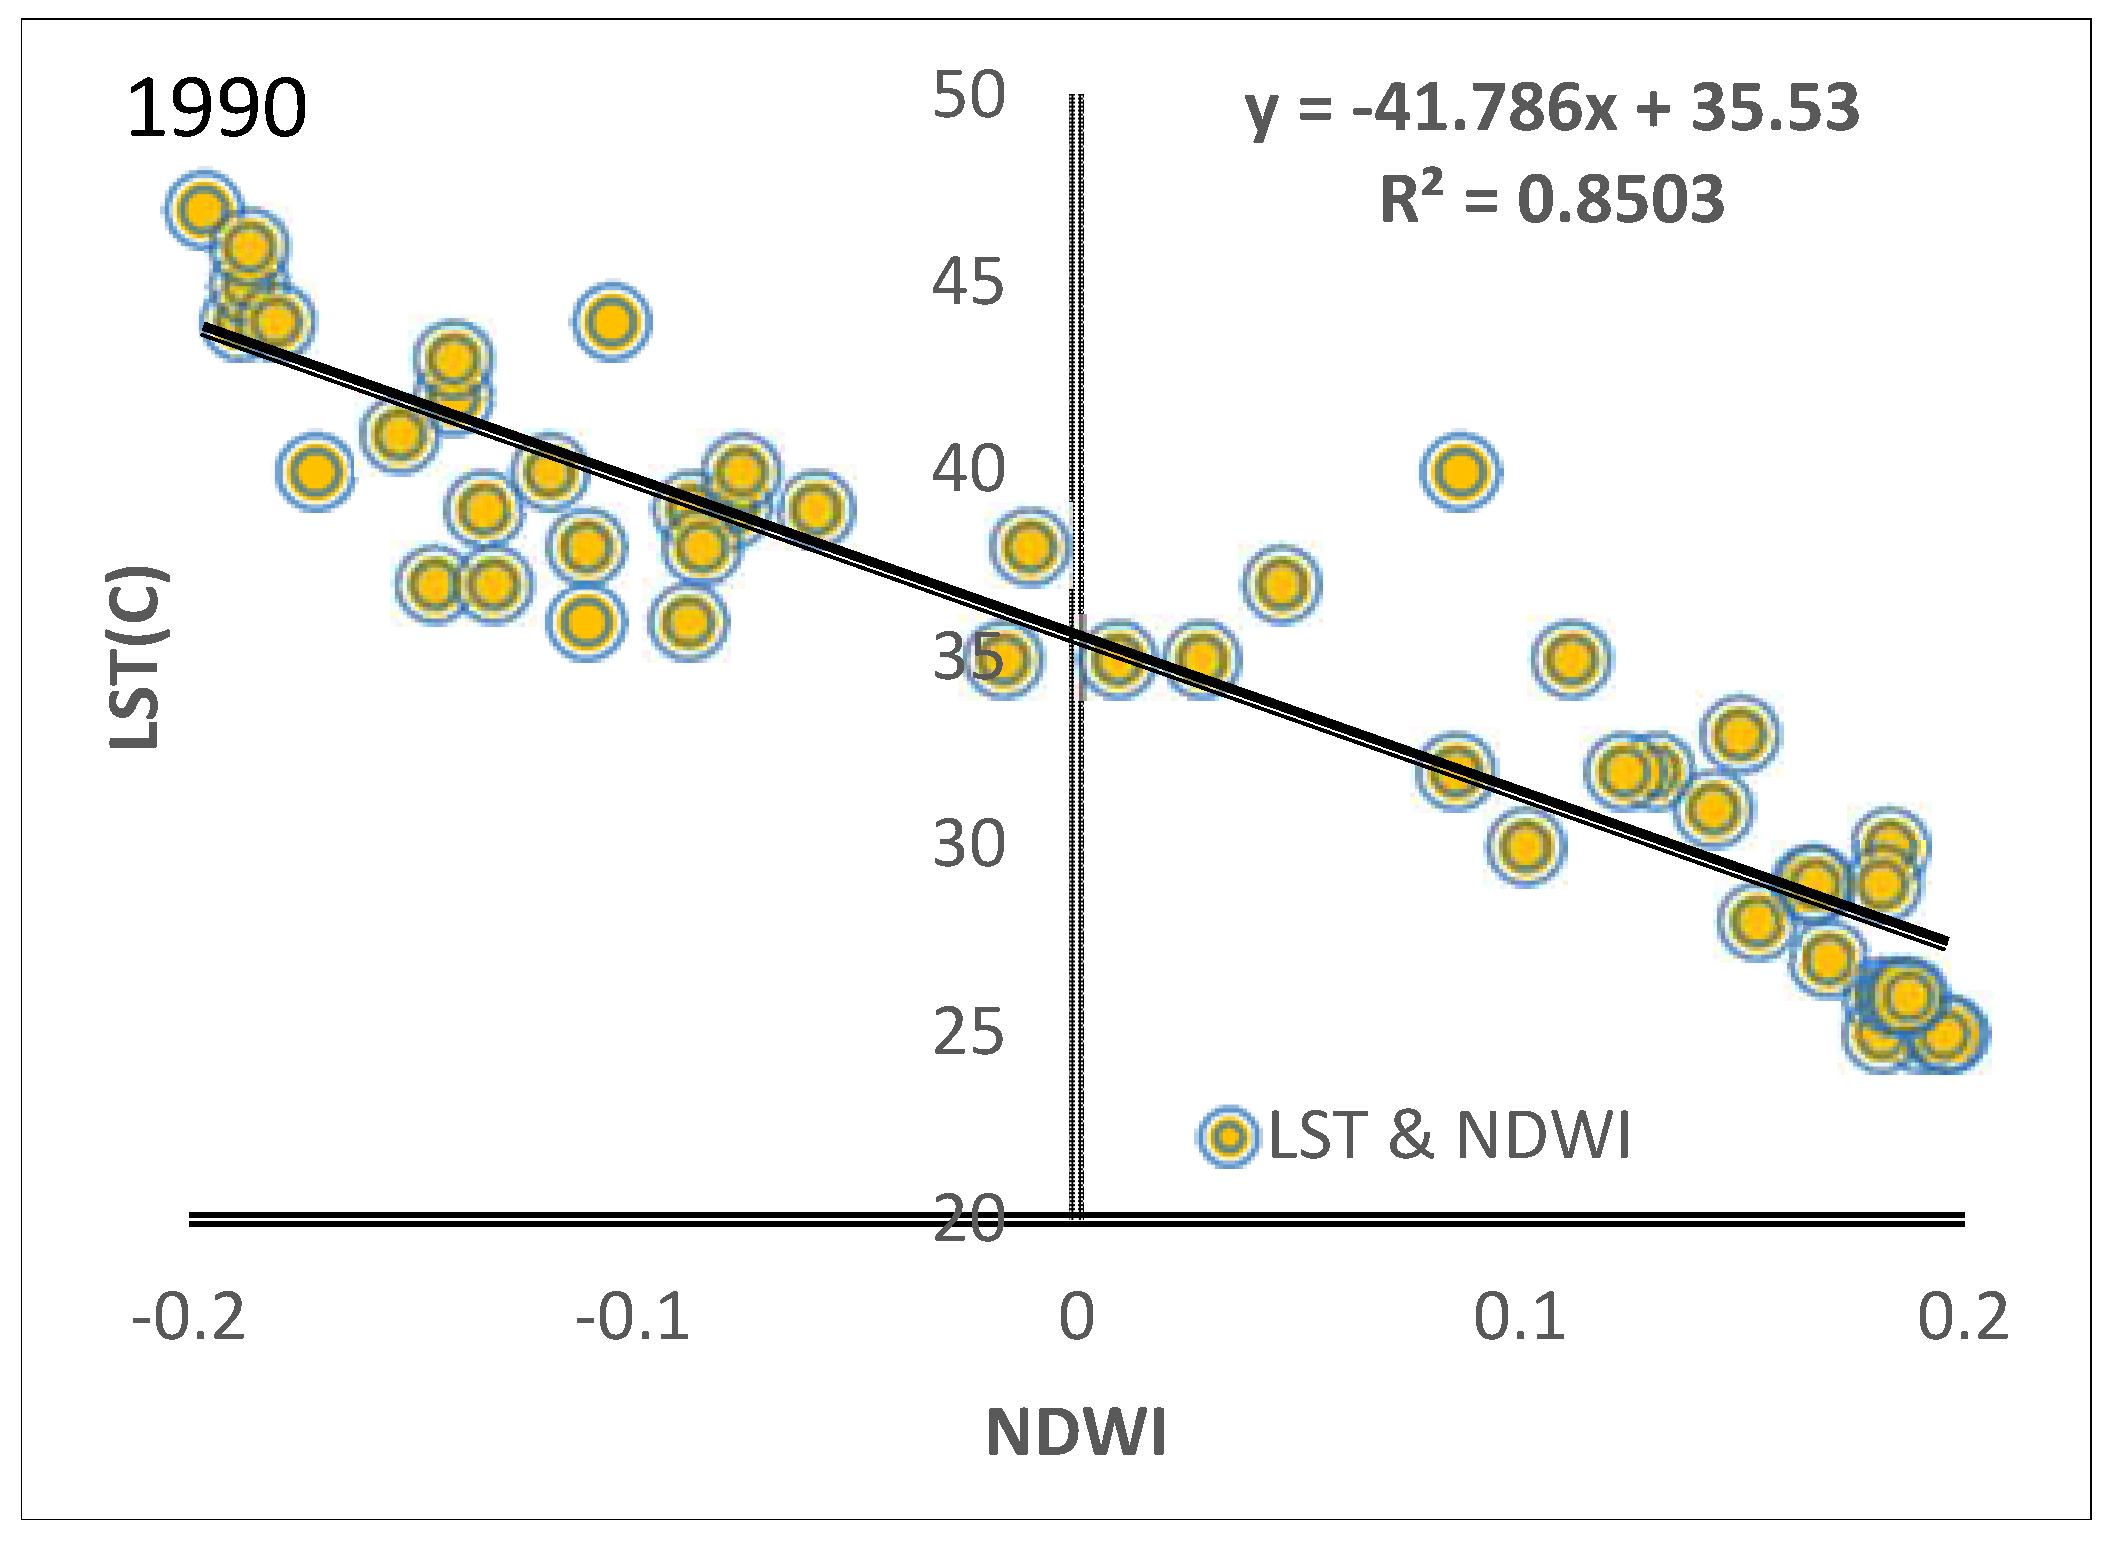
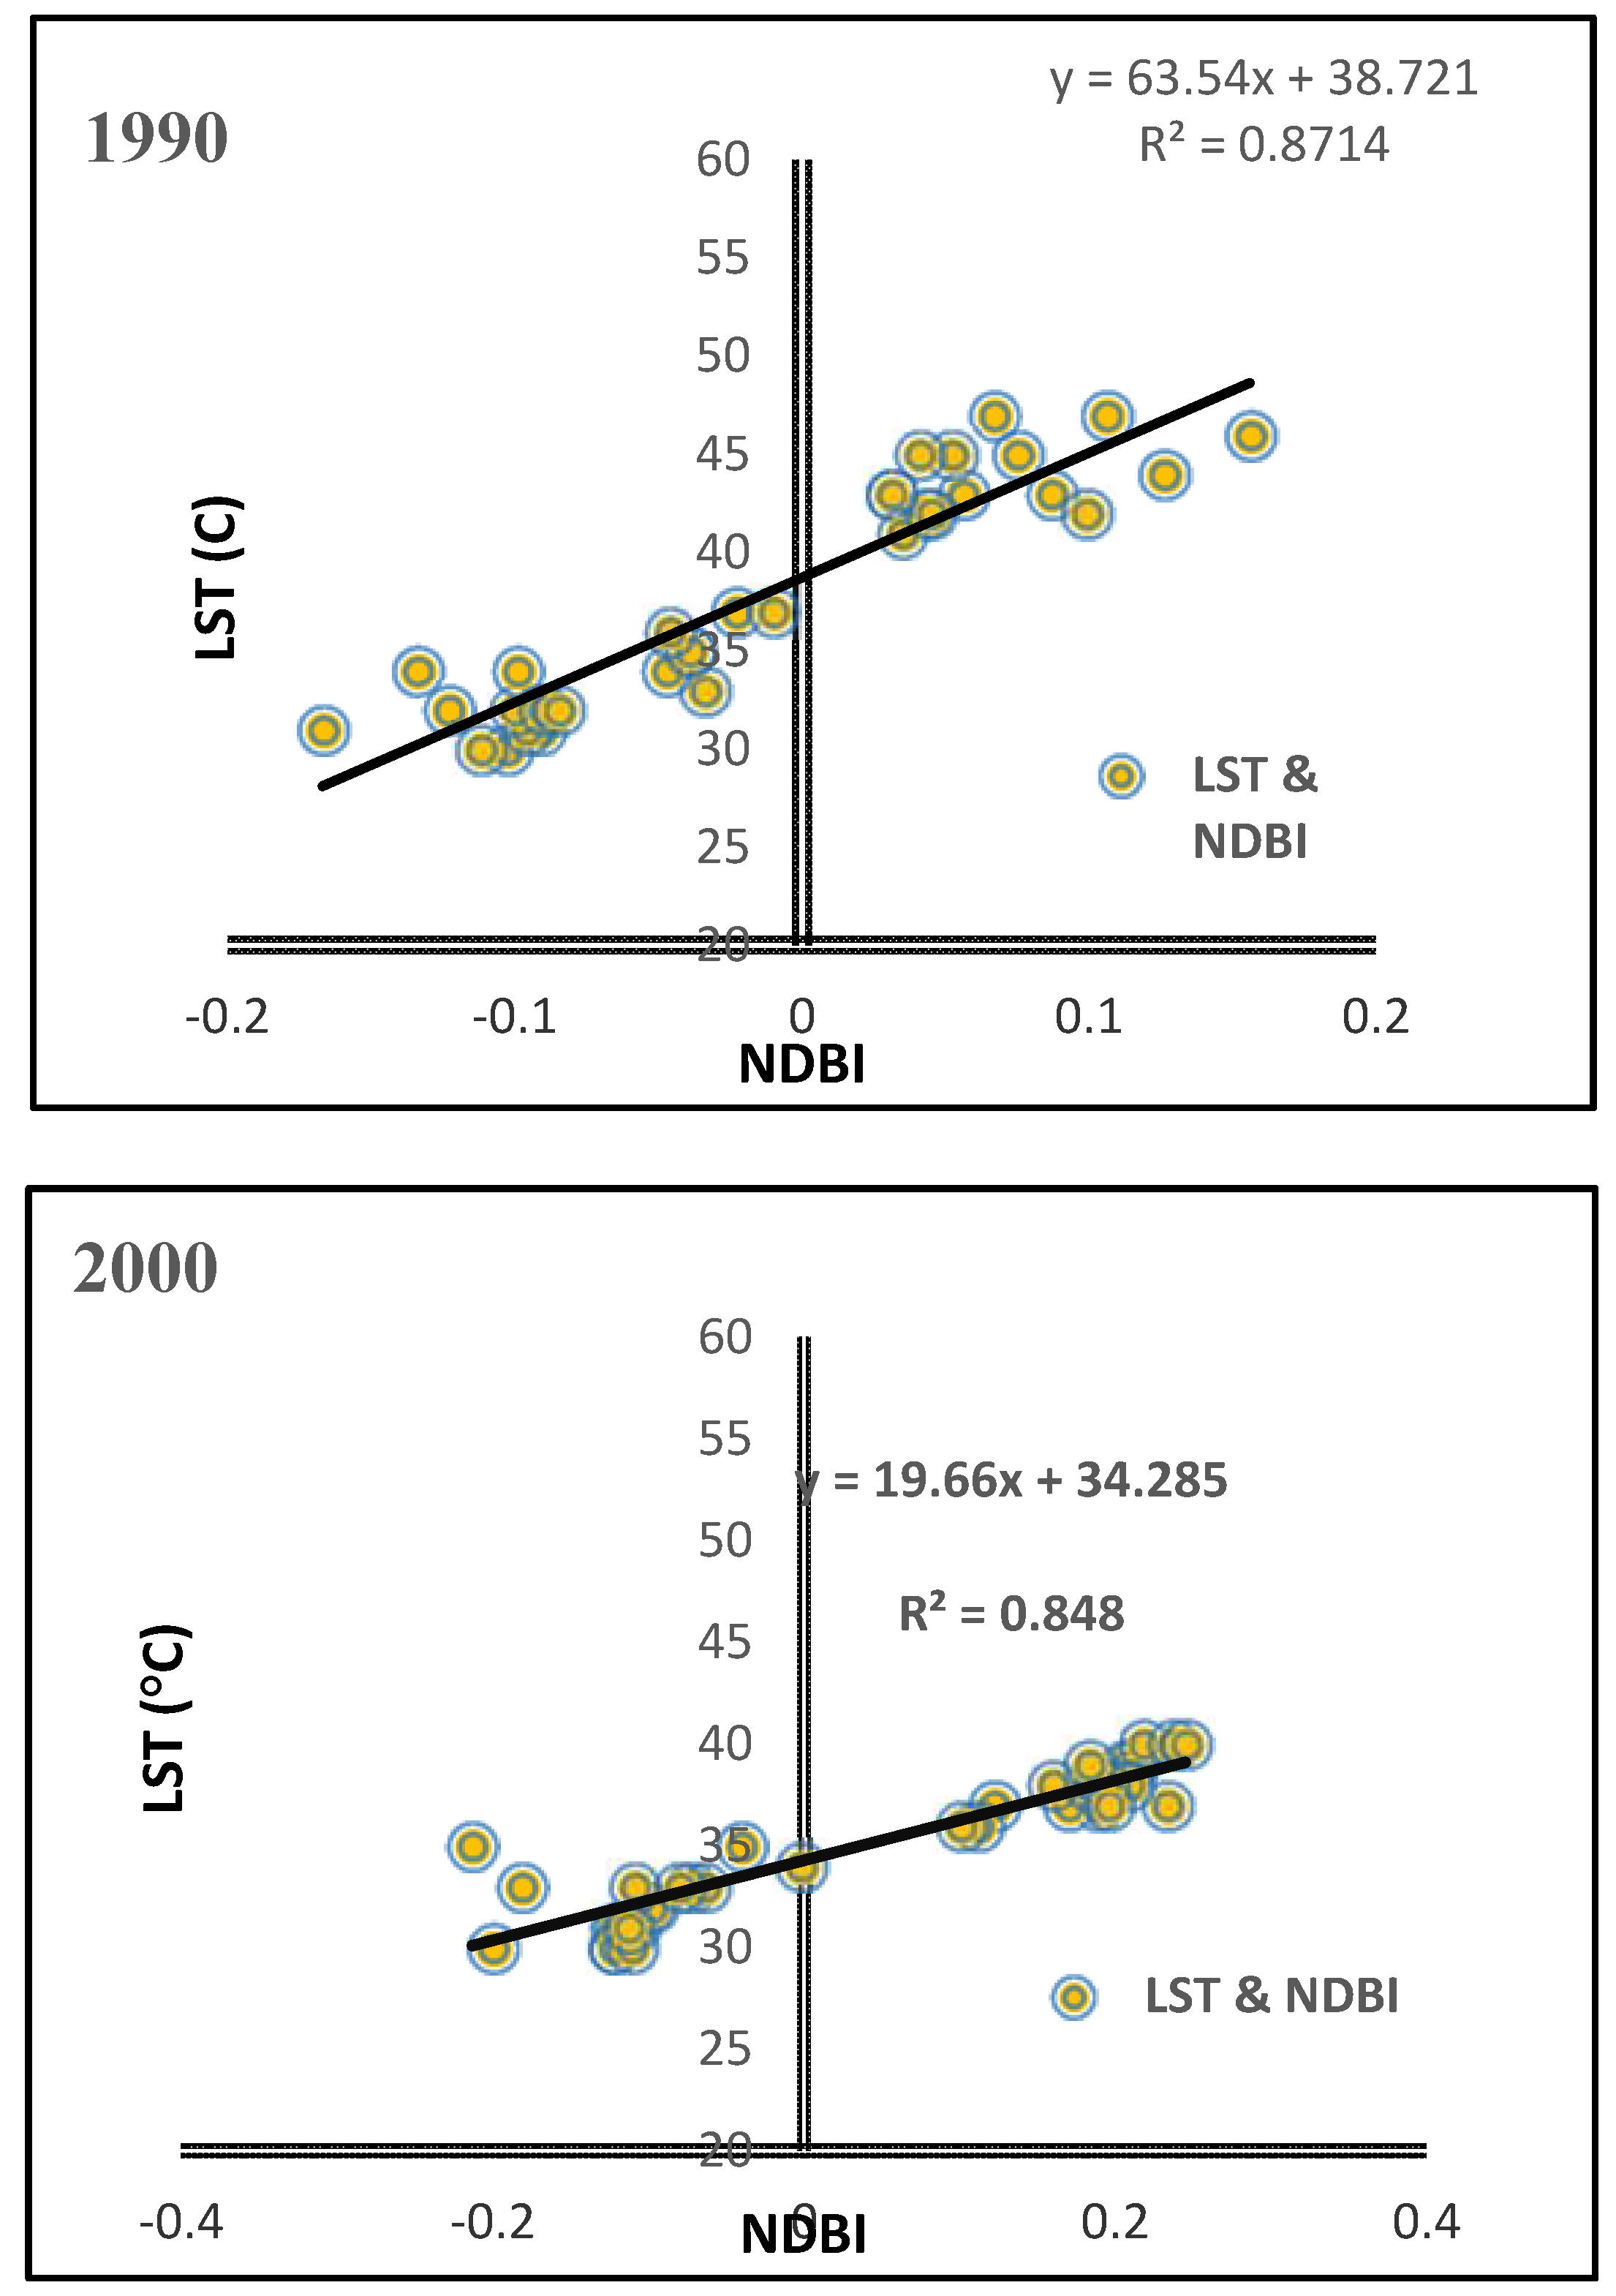
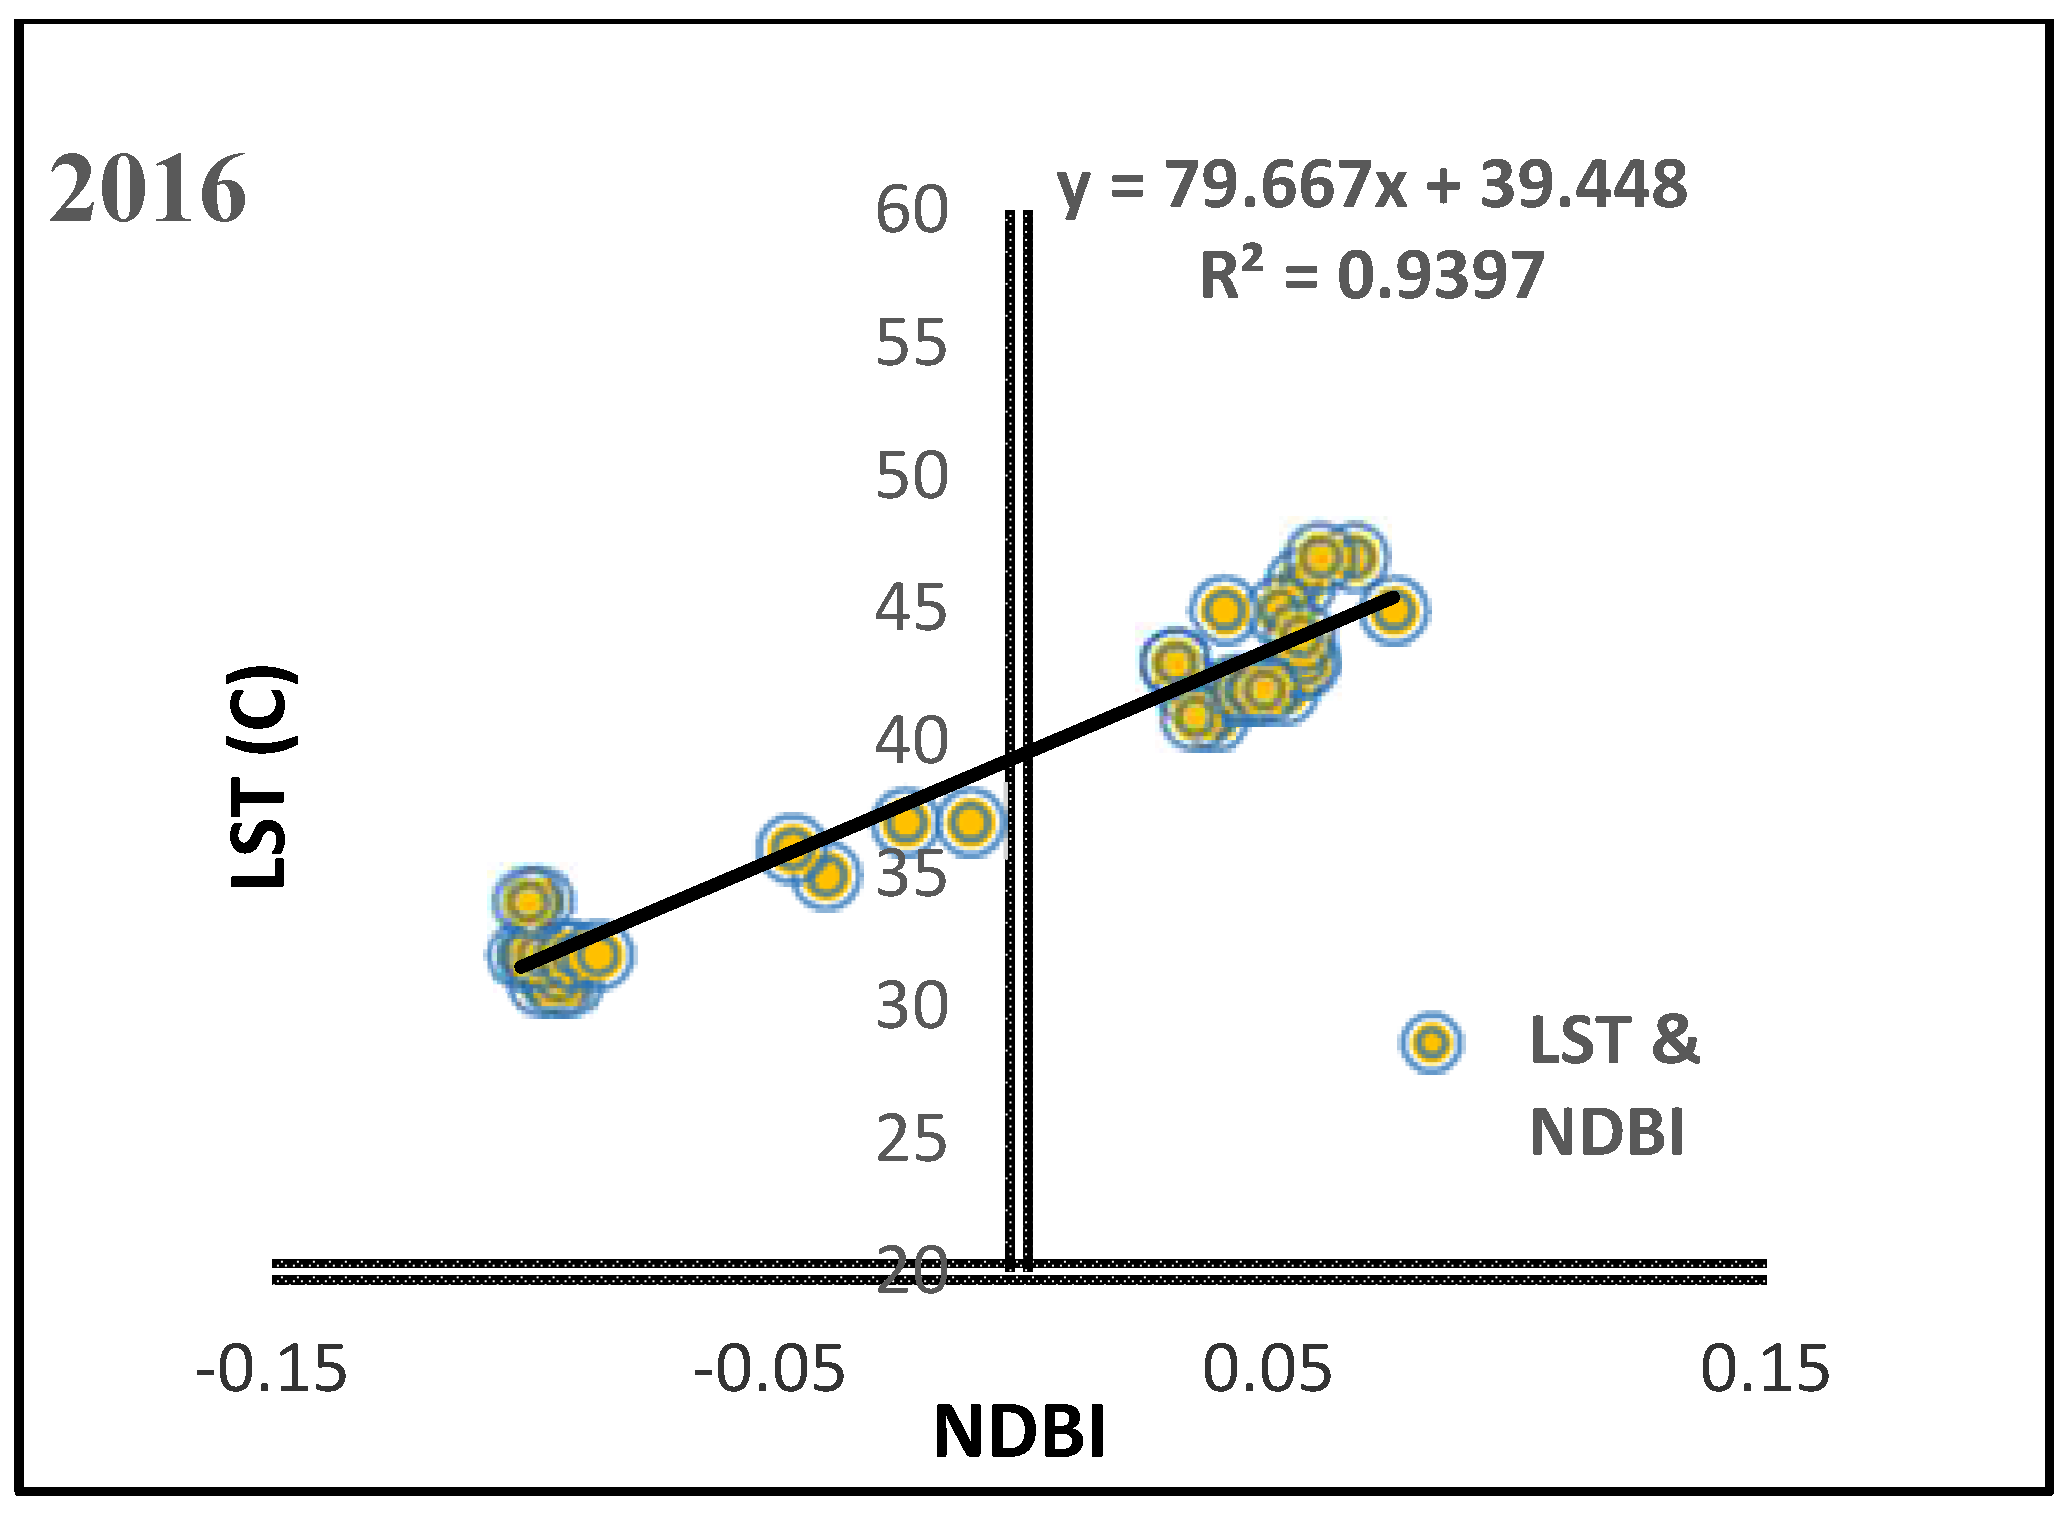
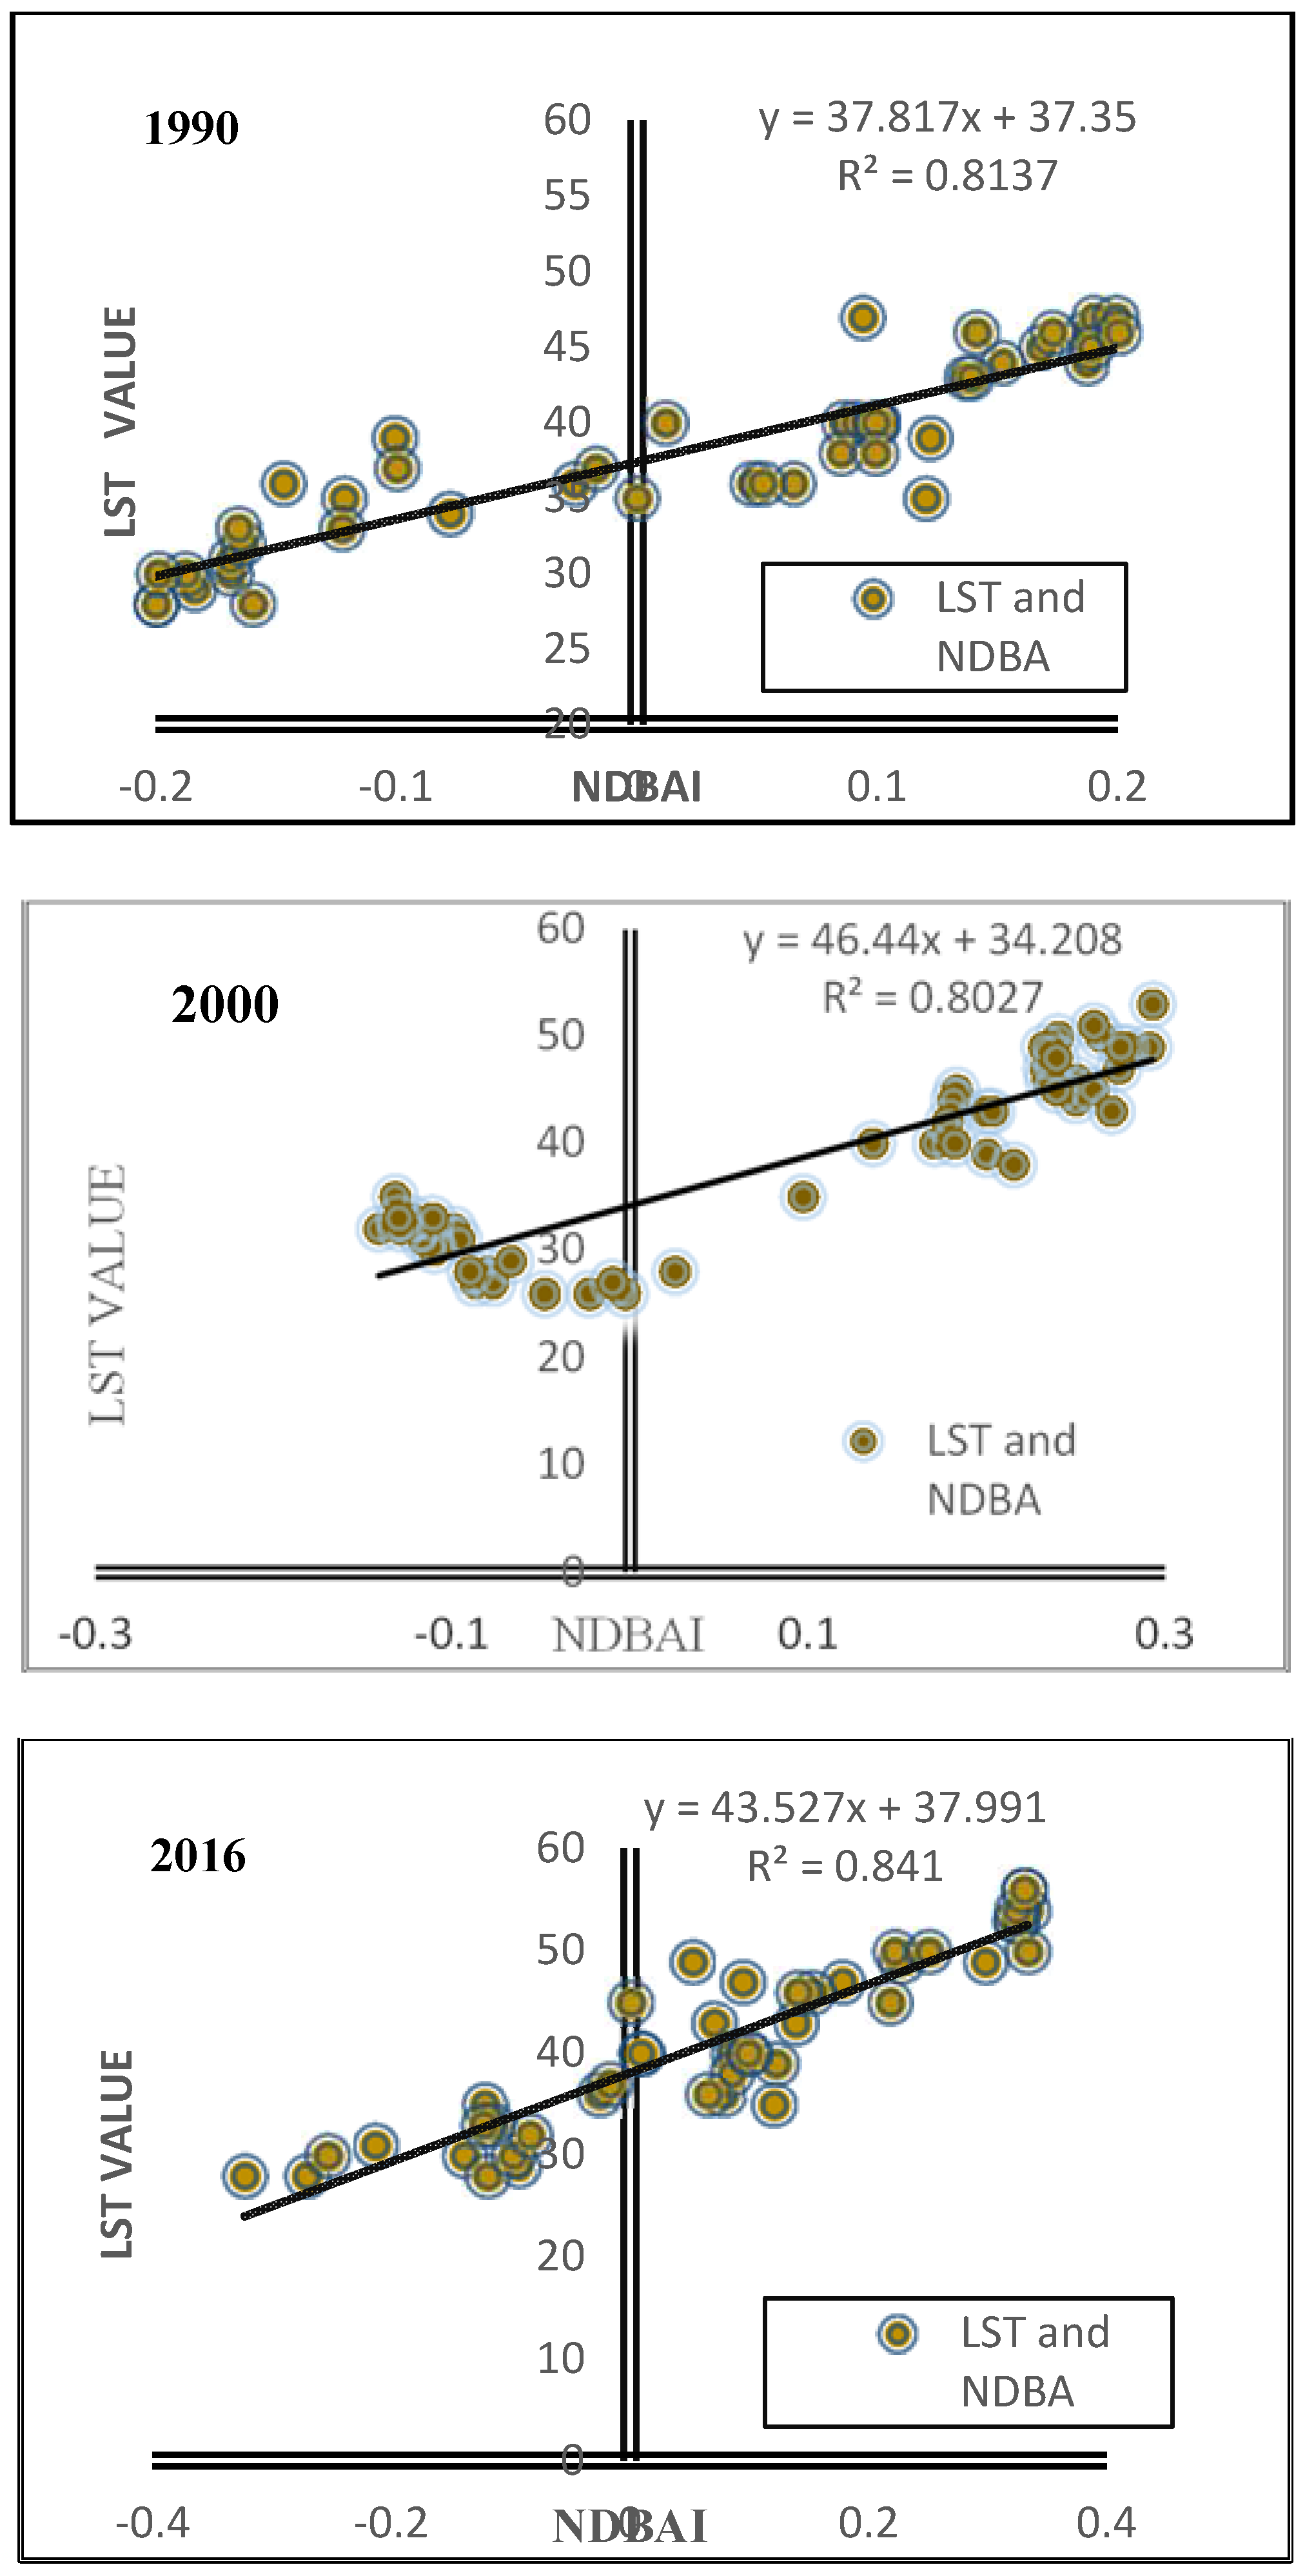
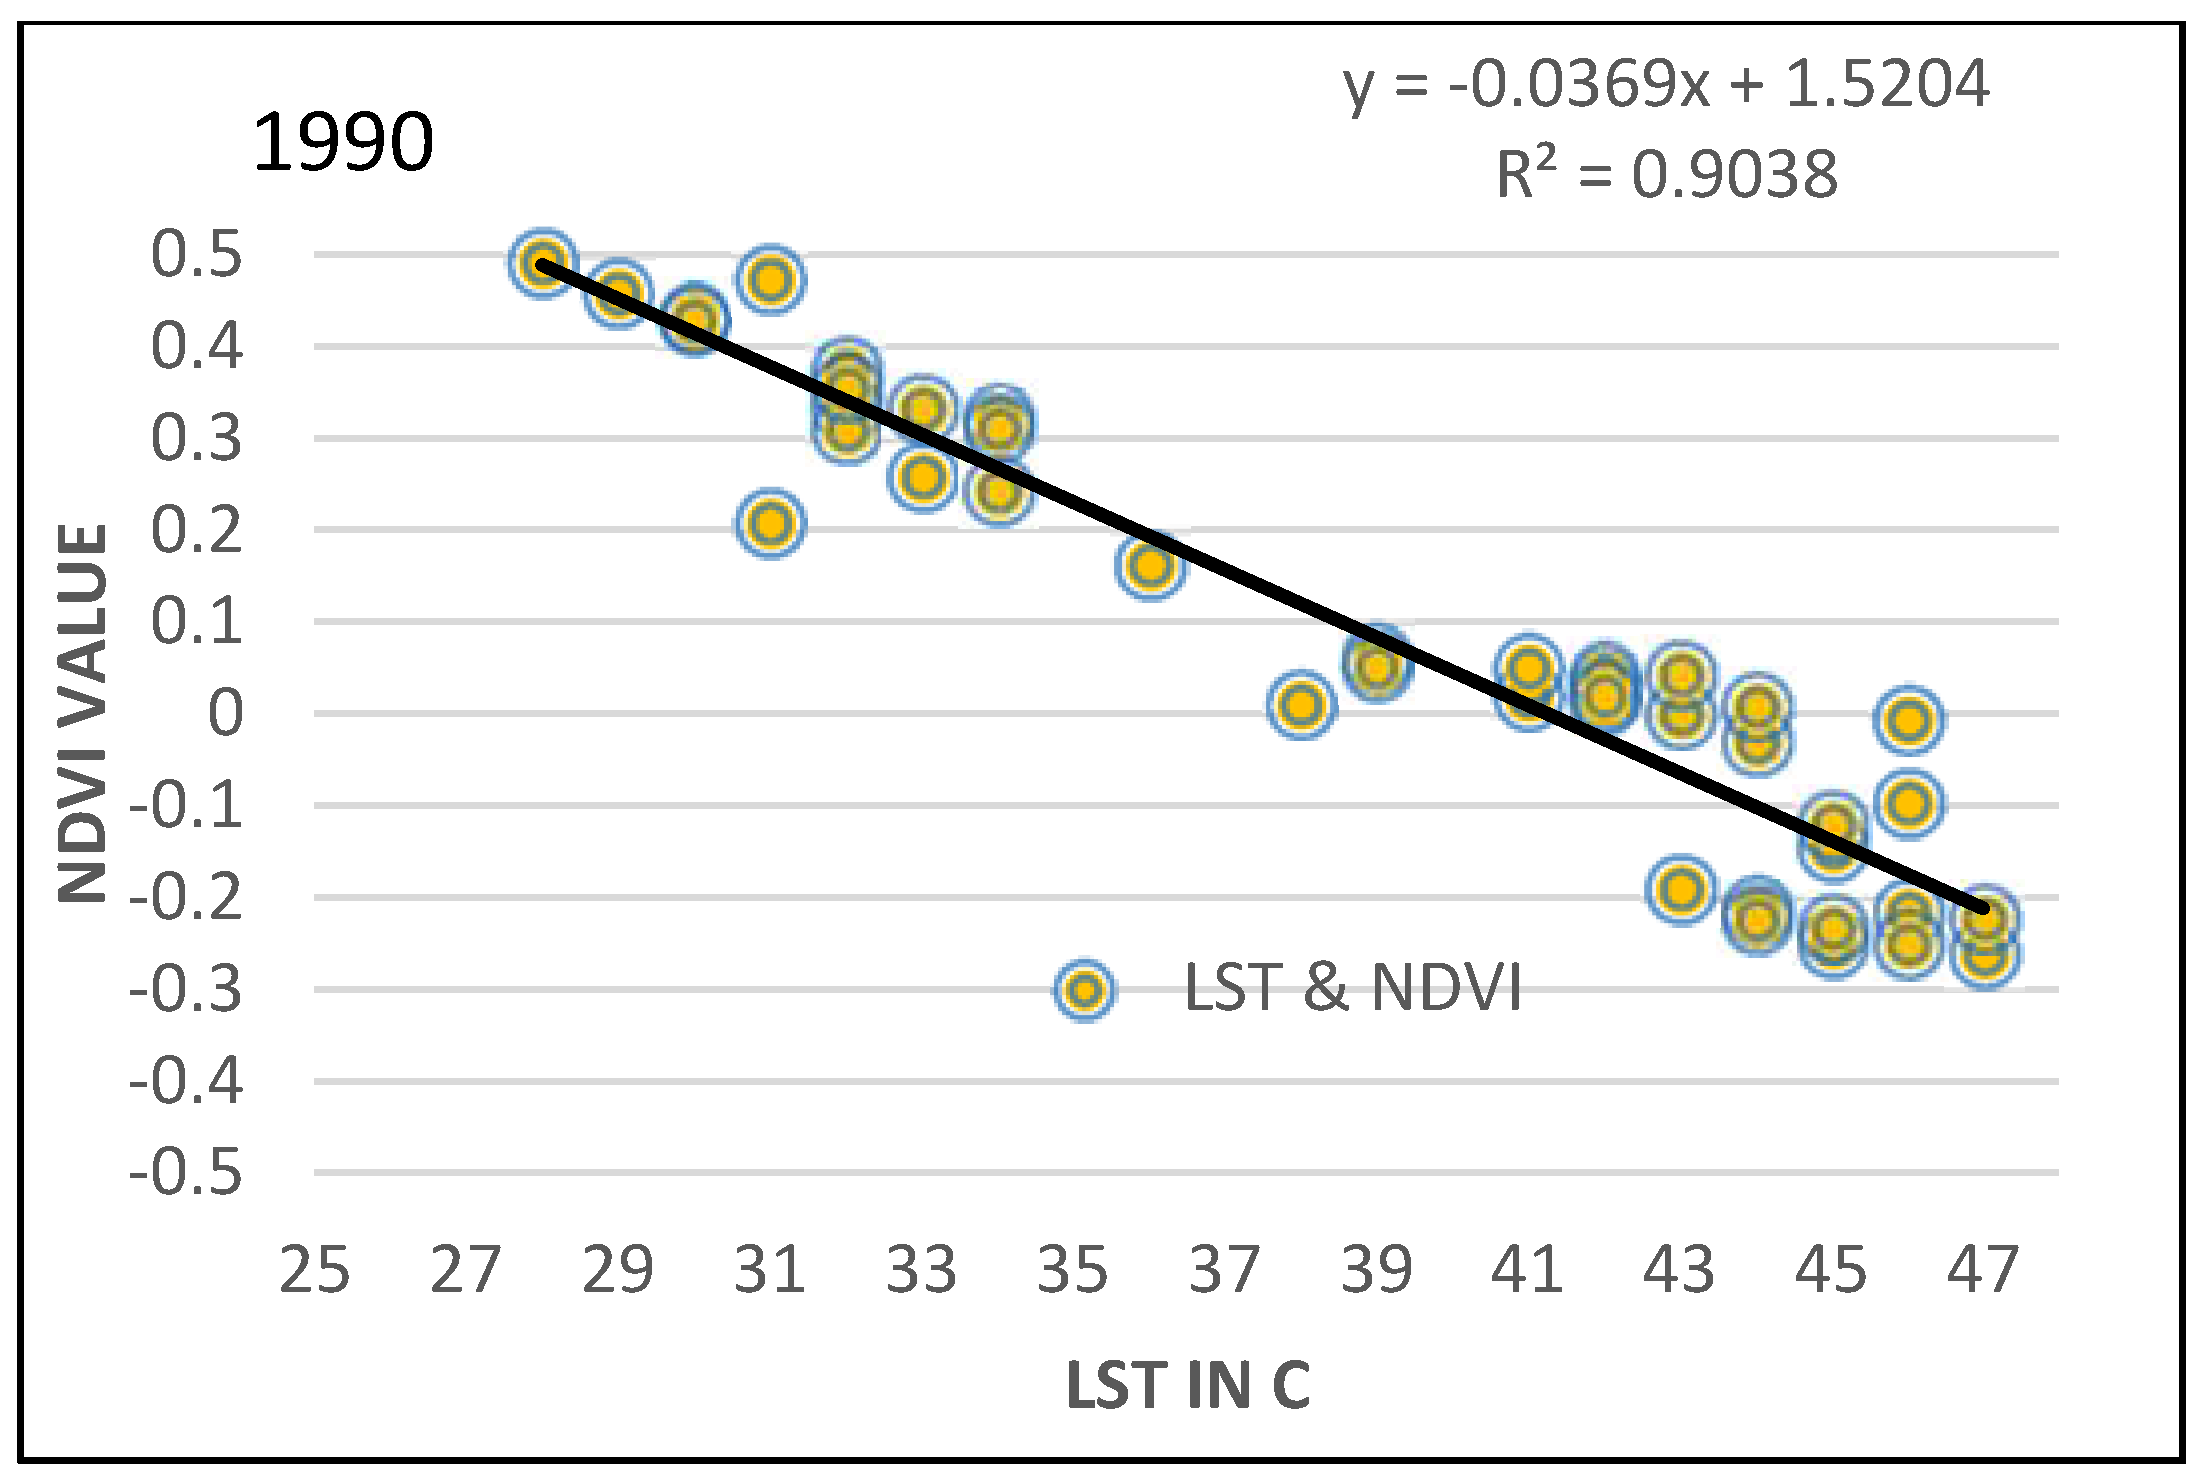
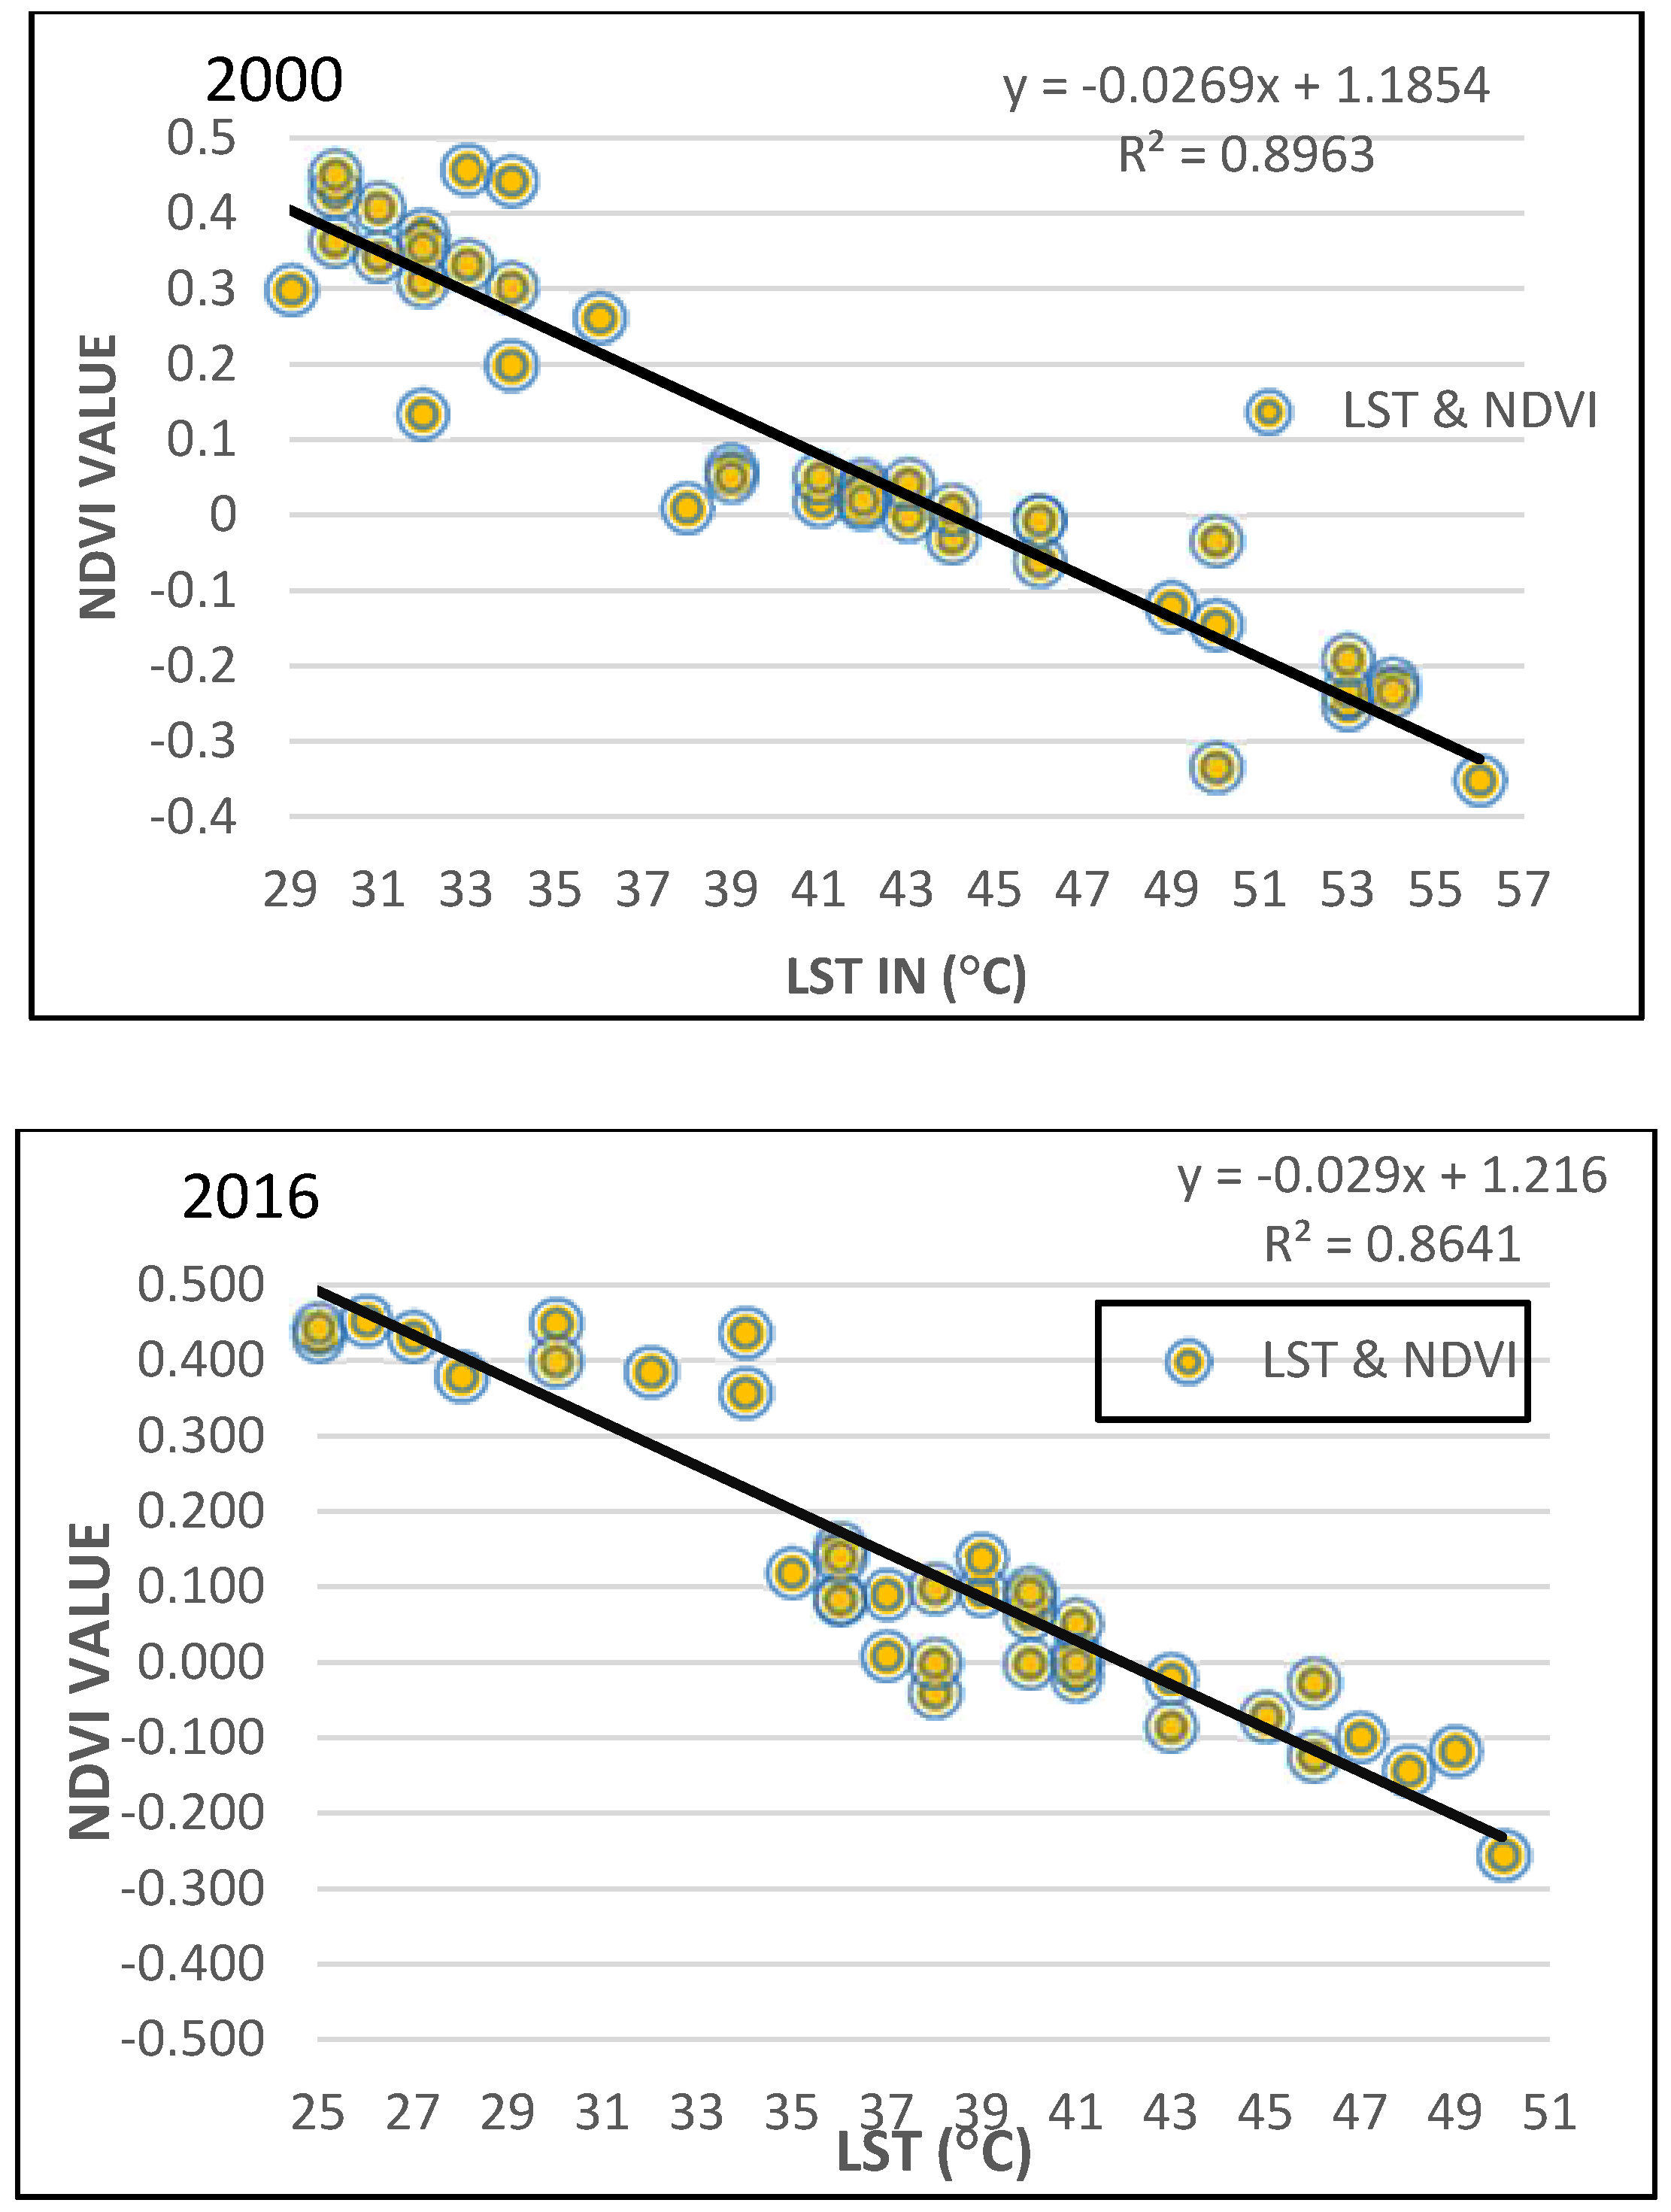
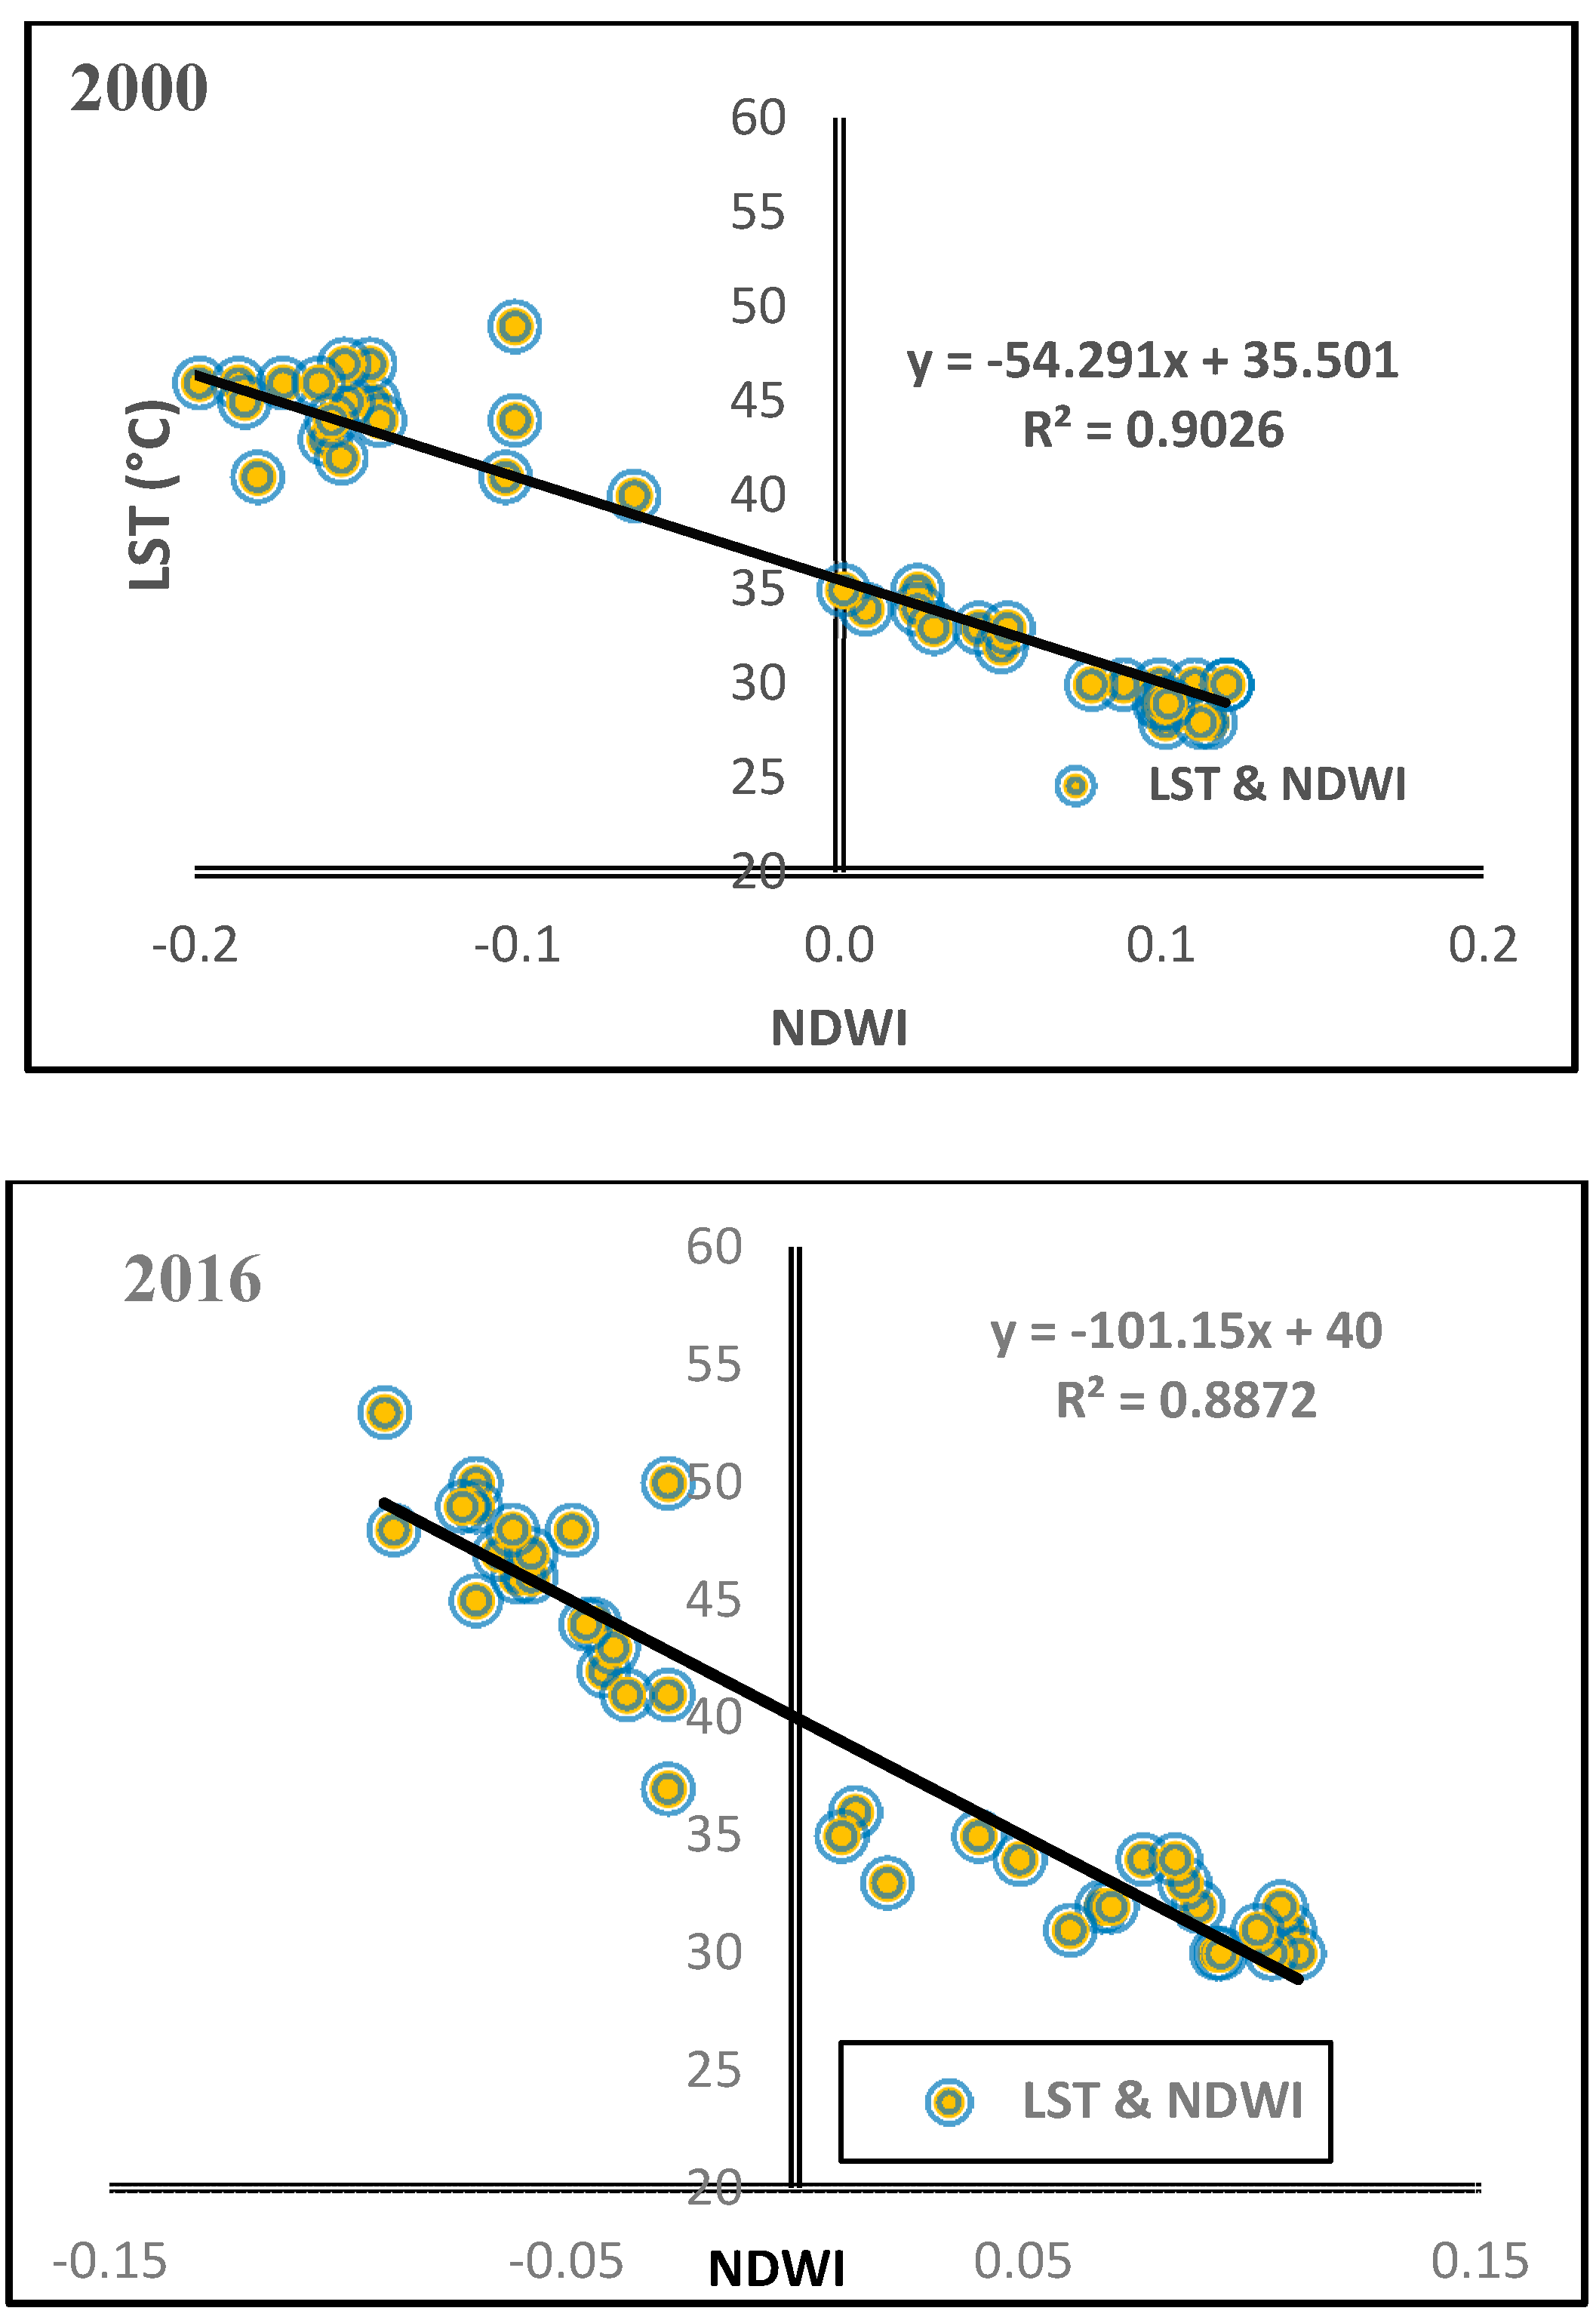
- To examine the relationship between LST with NDVI, NDWI NDBAI and NDBI values.
2. Materials and Methods
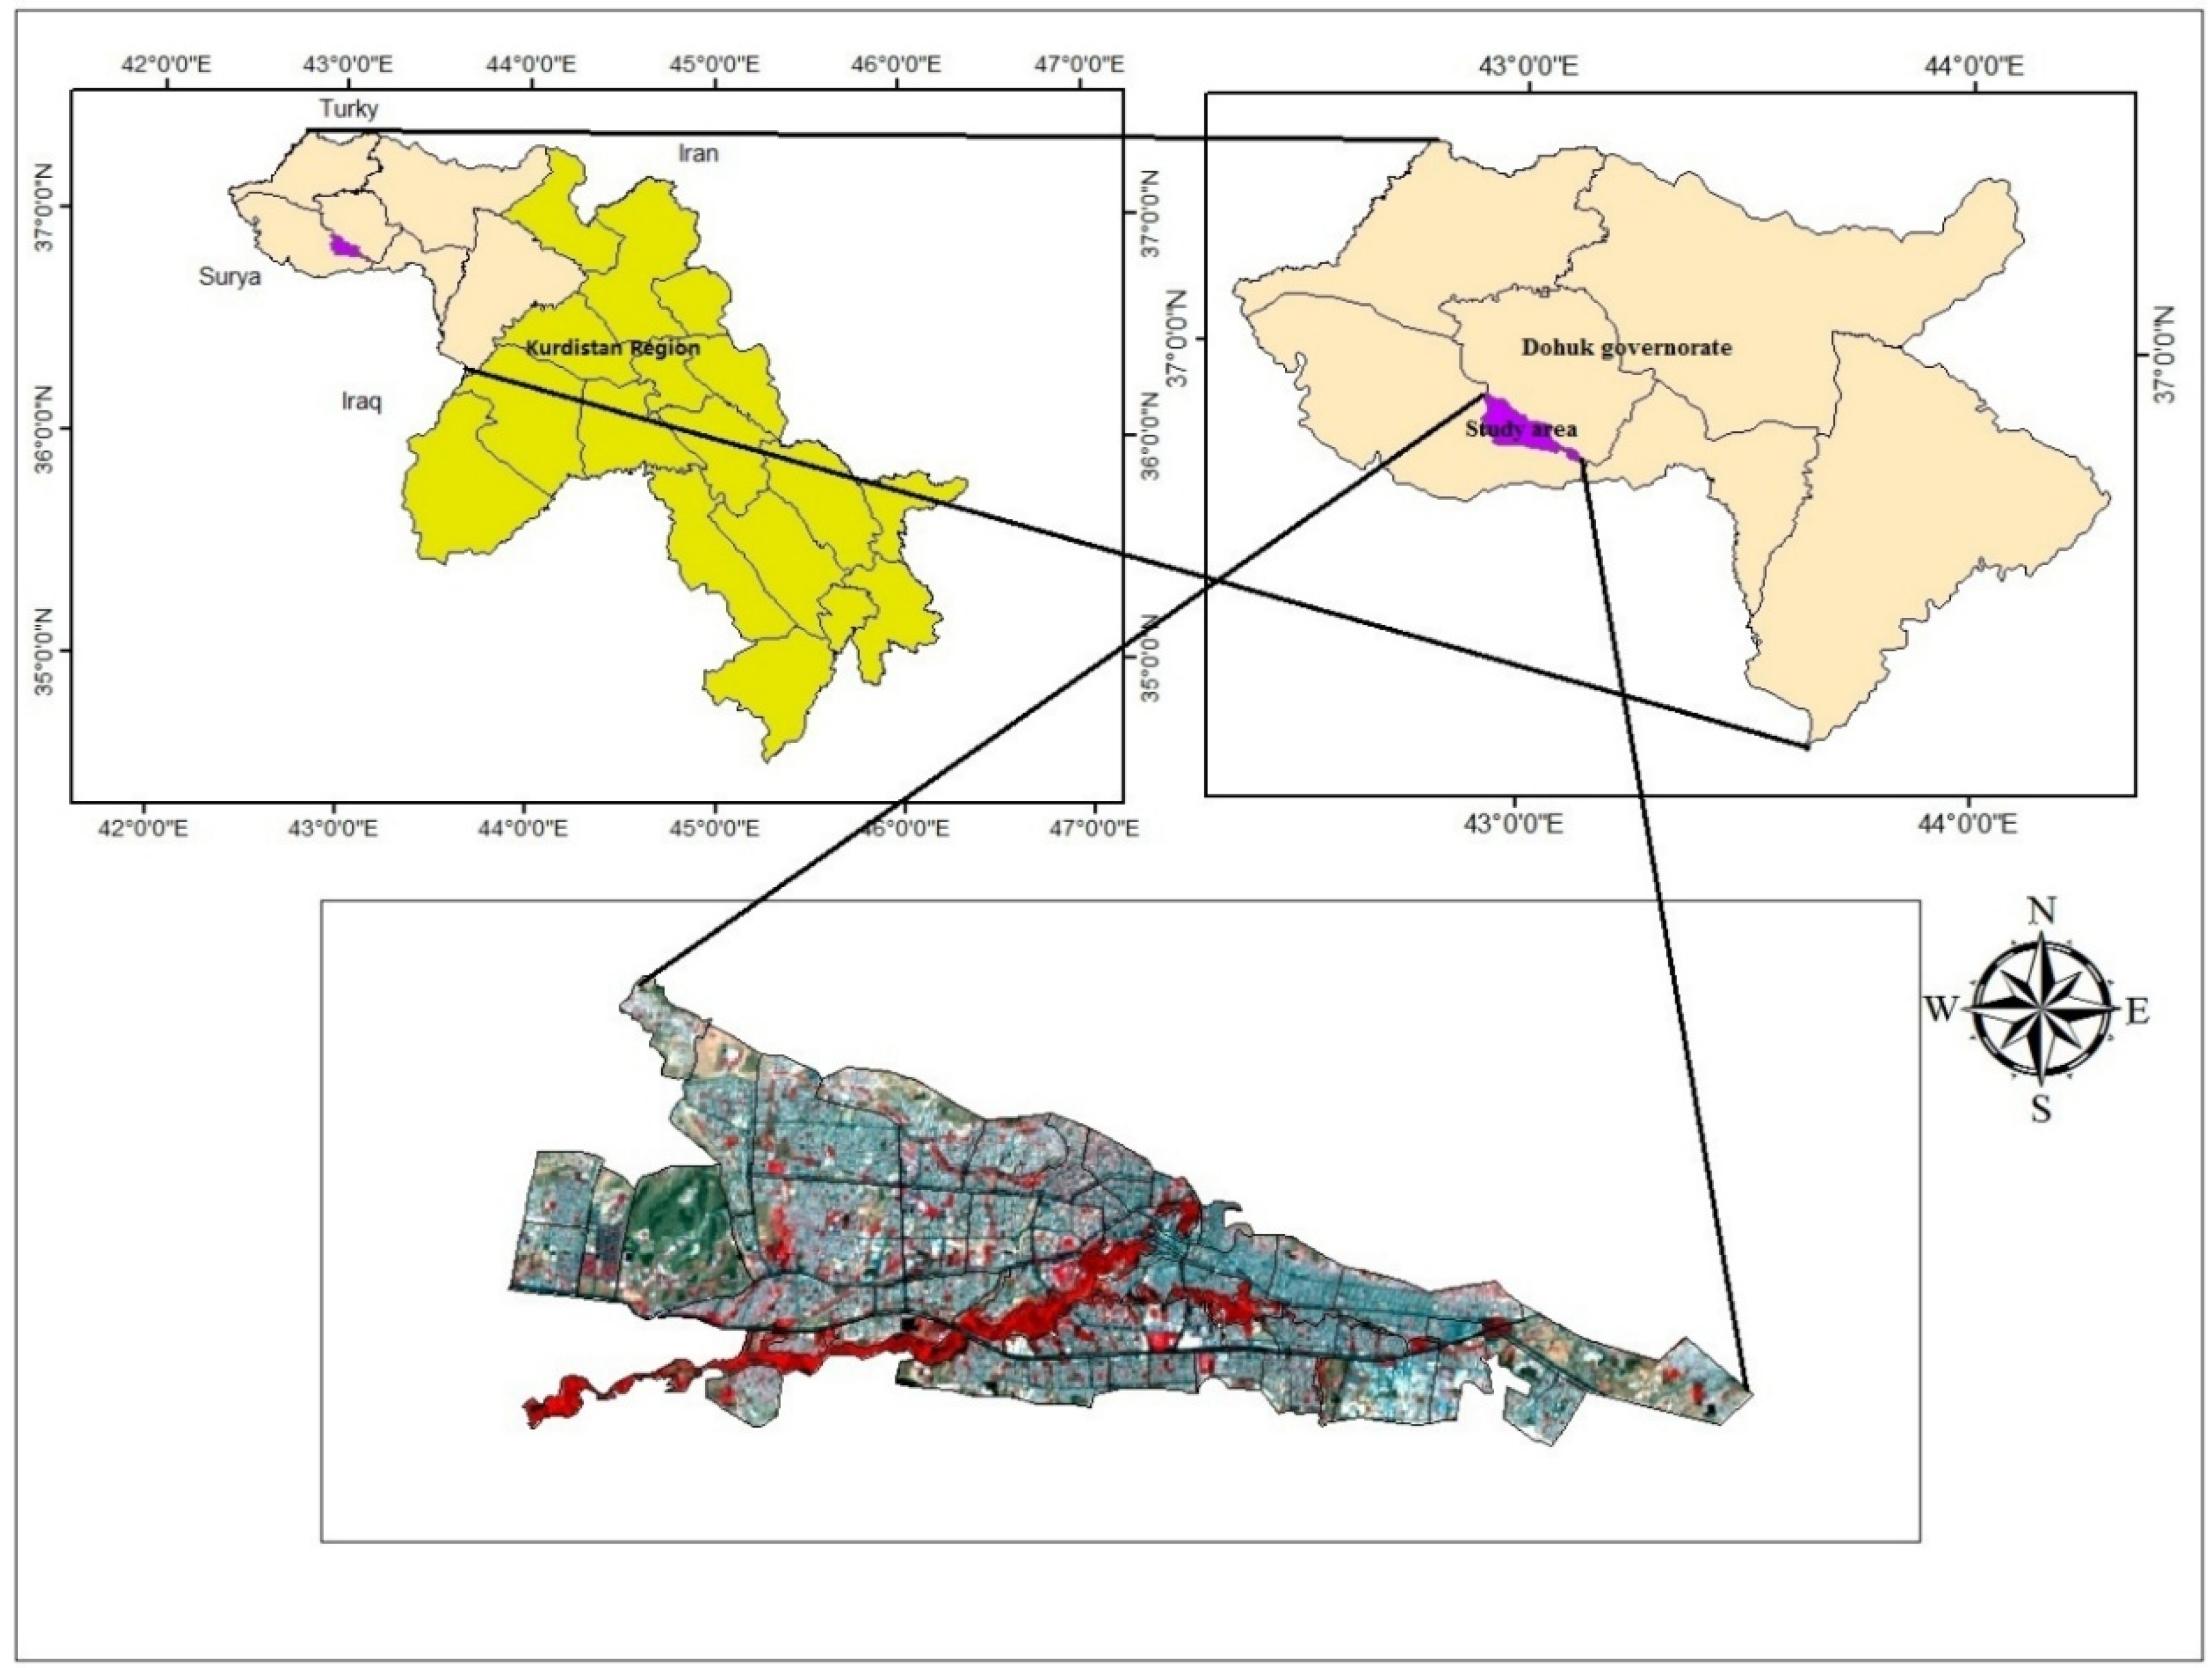
2.1. Study Area
2.2. Data Used
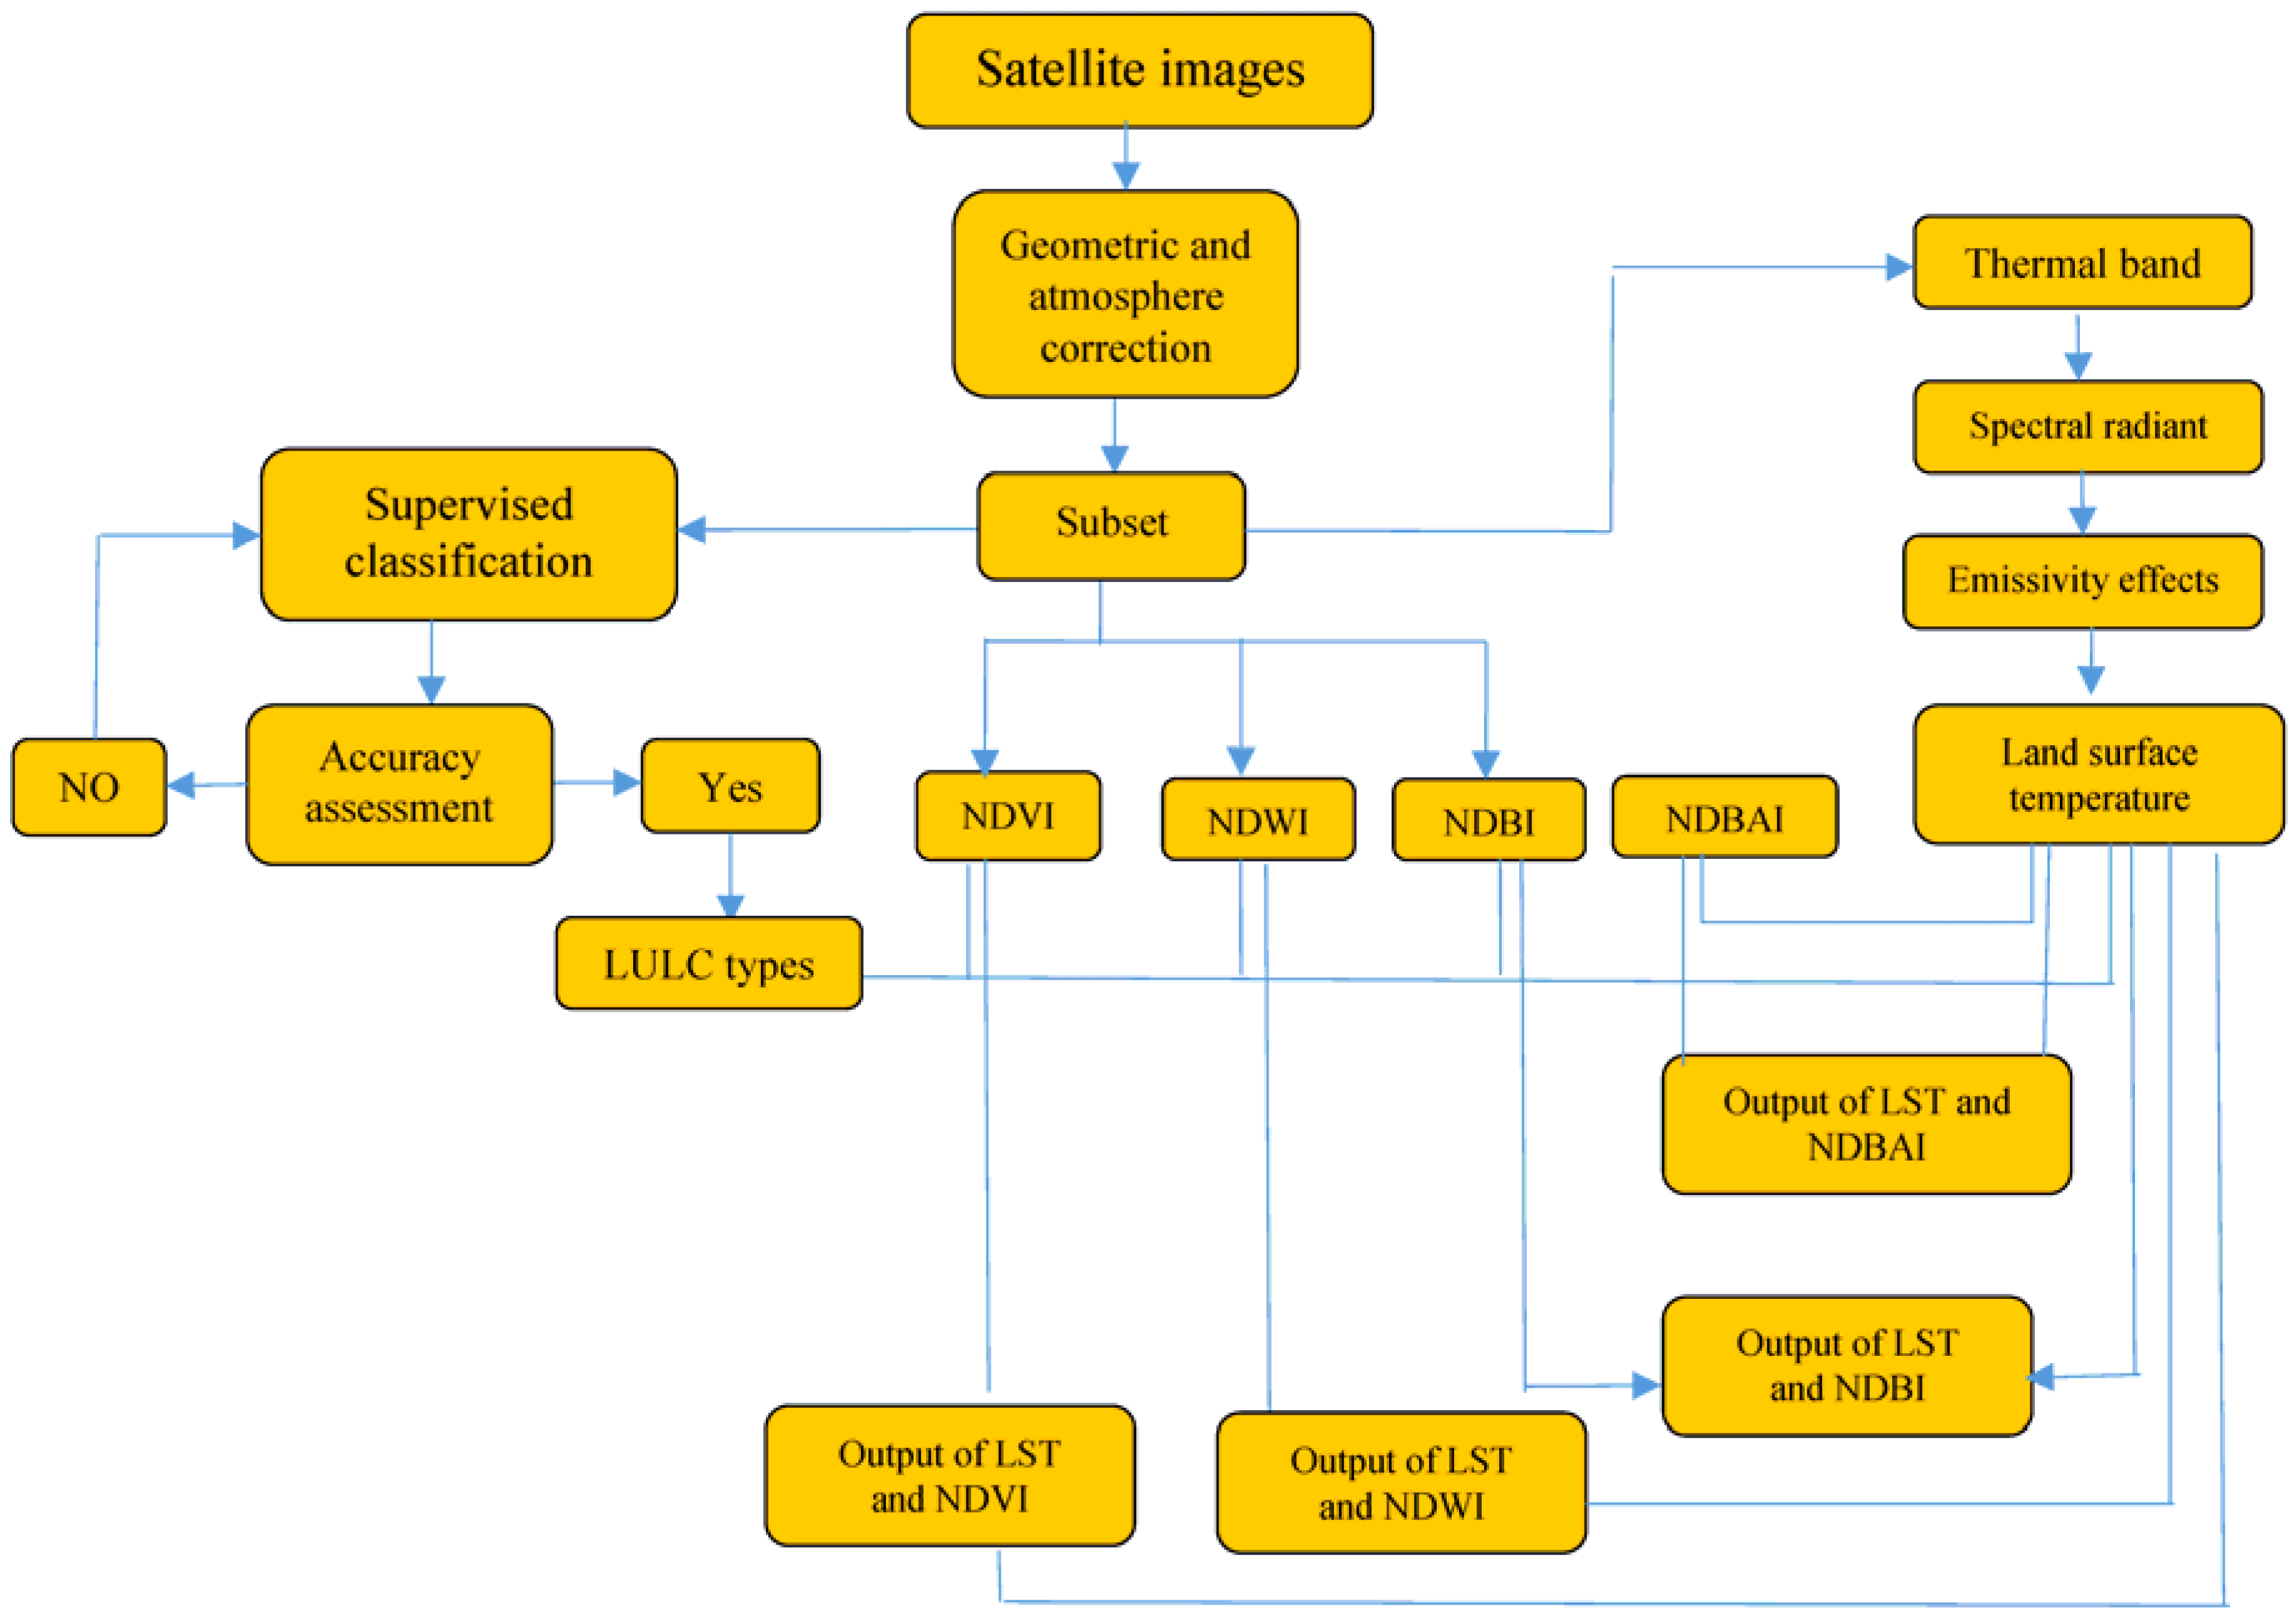
2.3. Methodology
2.3.1. Image Classification and Accuracy Assessment
2.3.2. Computation of NDVI, NDWI, NDBI and NDBAI
2.3.3. Computation of Land Surface Temperature LST
- = Spectral radiance w·sr−1·m−3
- LMIN = 1.238 (Spectral radiance of DN value 1)
- LMAX = 15.600 (Spectral radiance of DN value 255)
- DN = Digital Number
- K1 = Calibration Constant 1 (607.76)
- K2 = Calibration Constant 2 (1260.56)
- R = Radiance values W/m2 SRμm
- TB = Surface Temperature °C
3. Results and Discussion
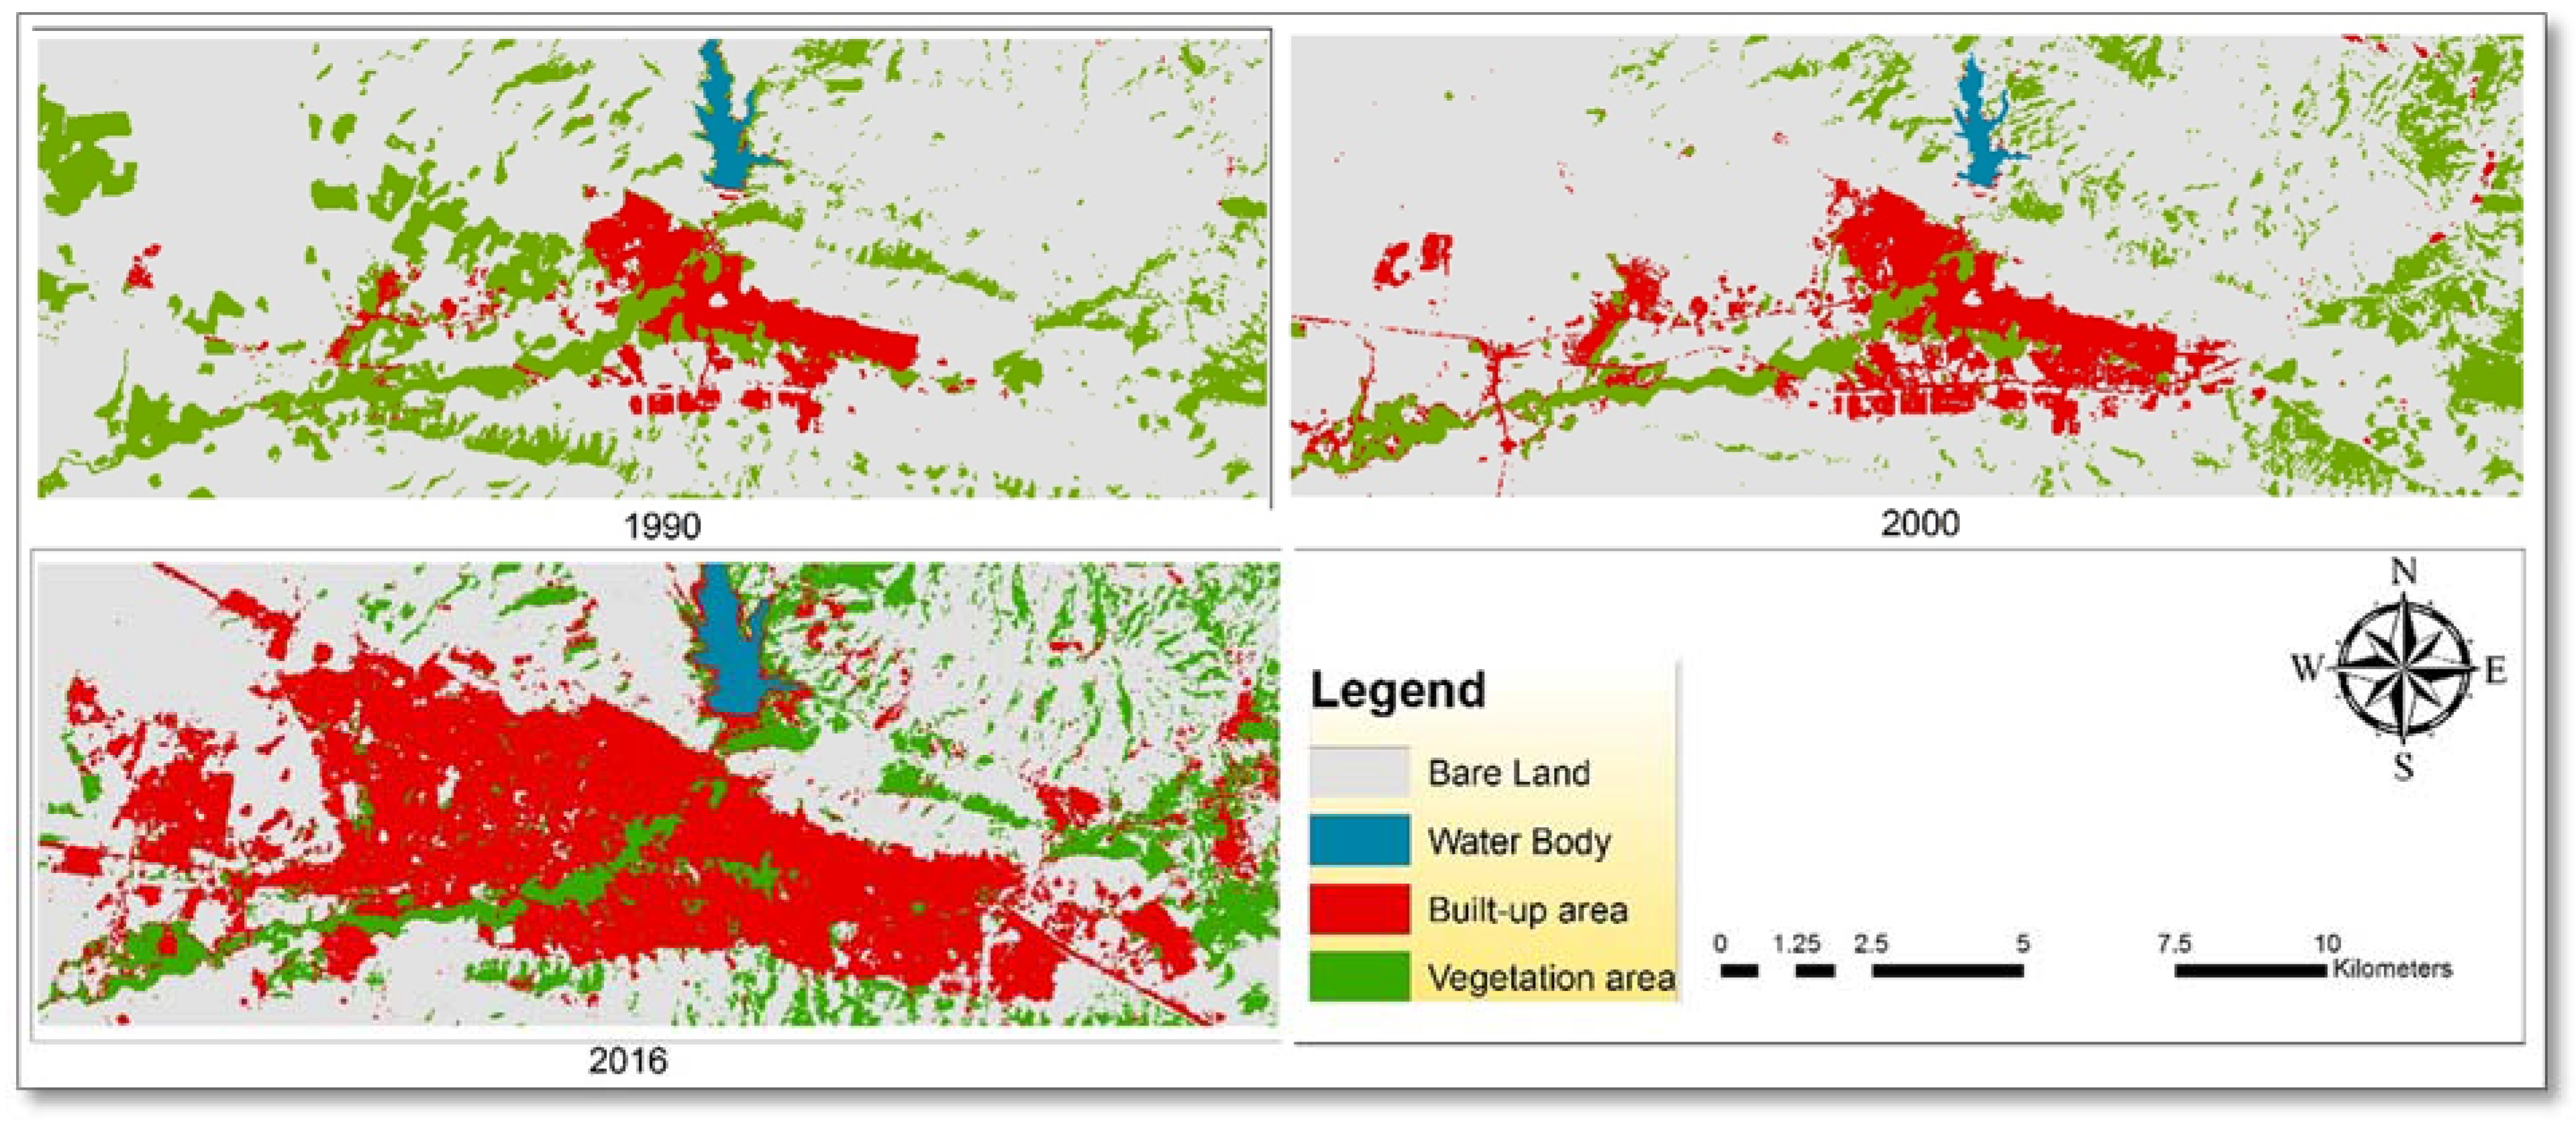
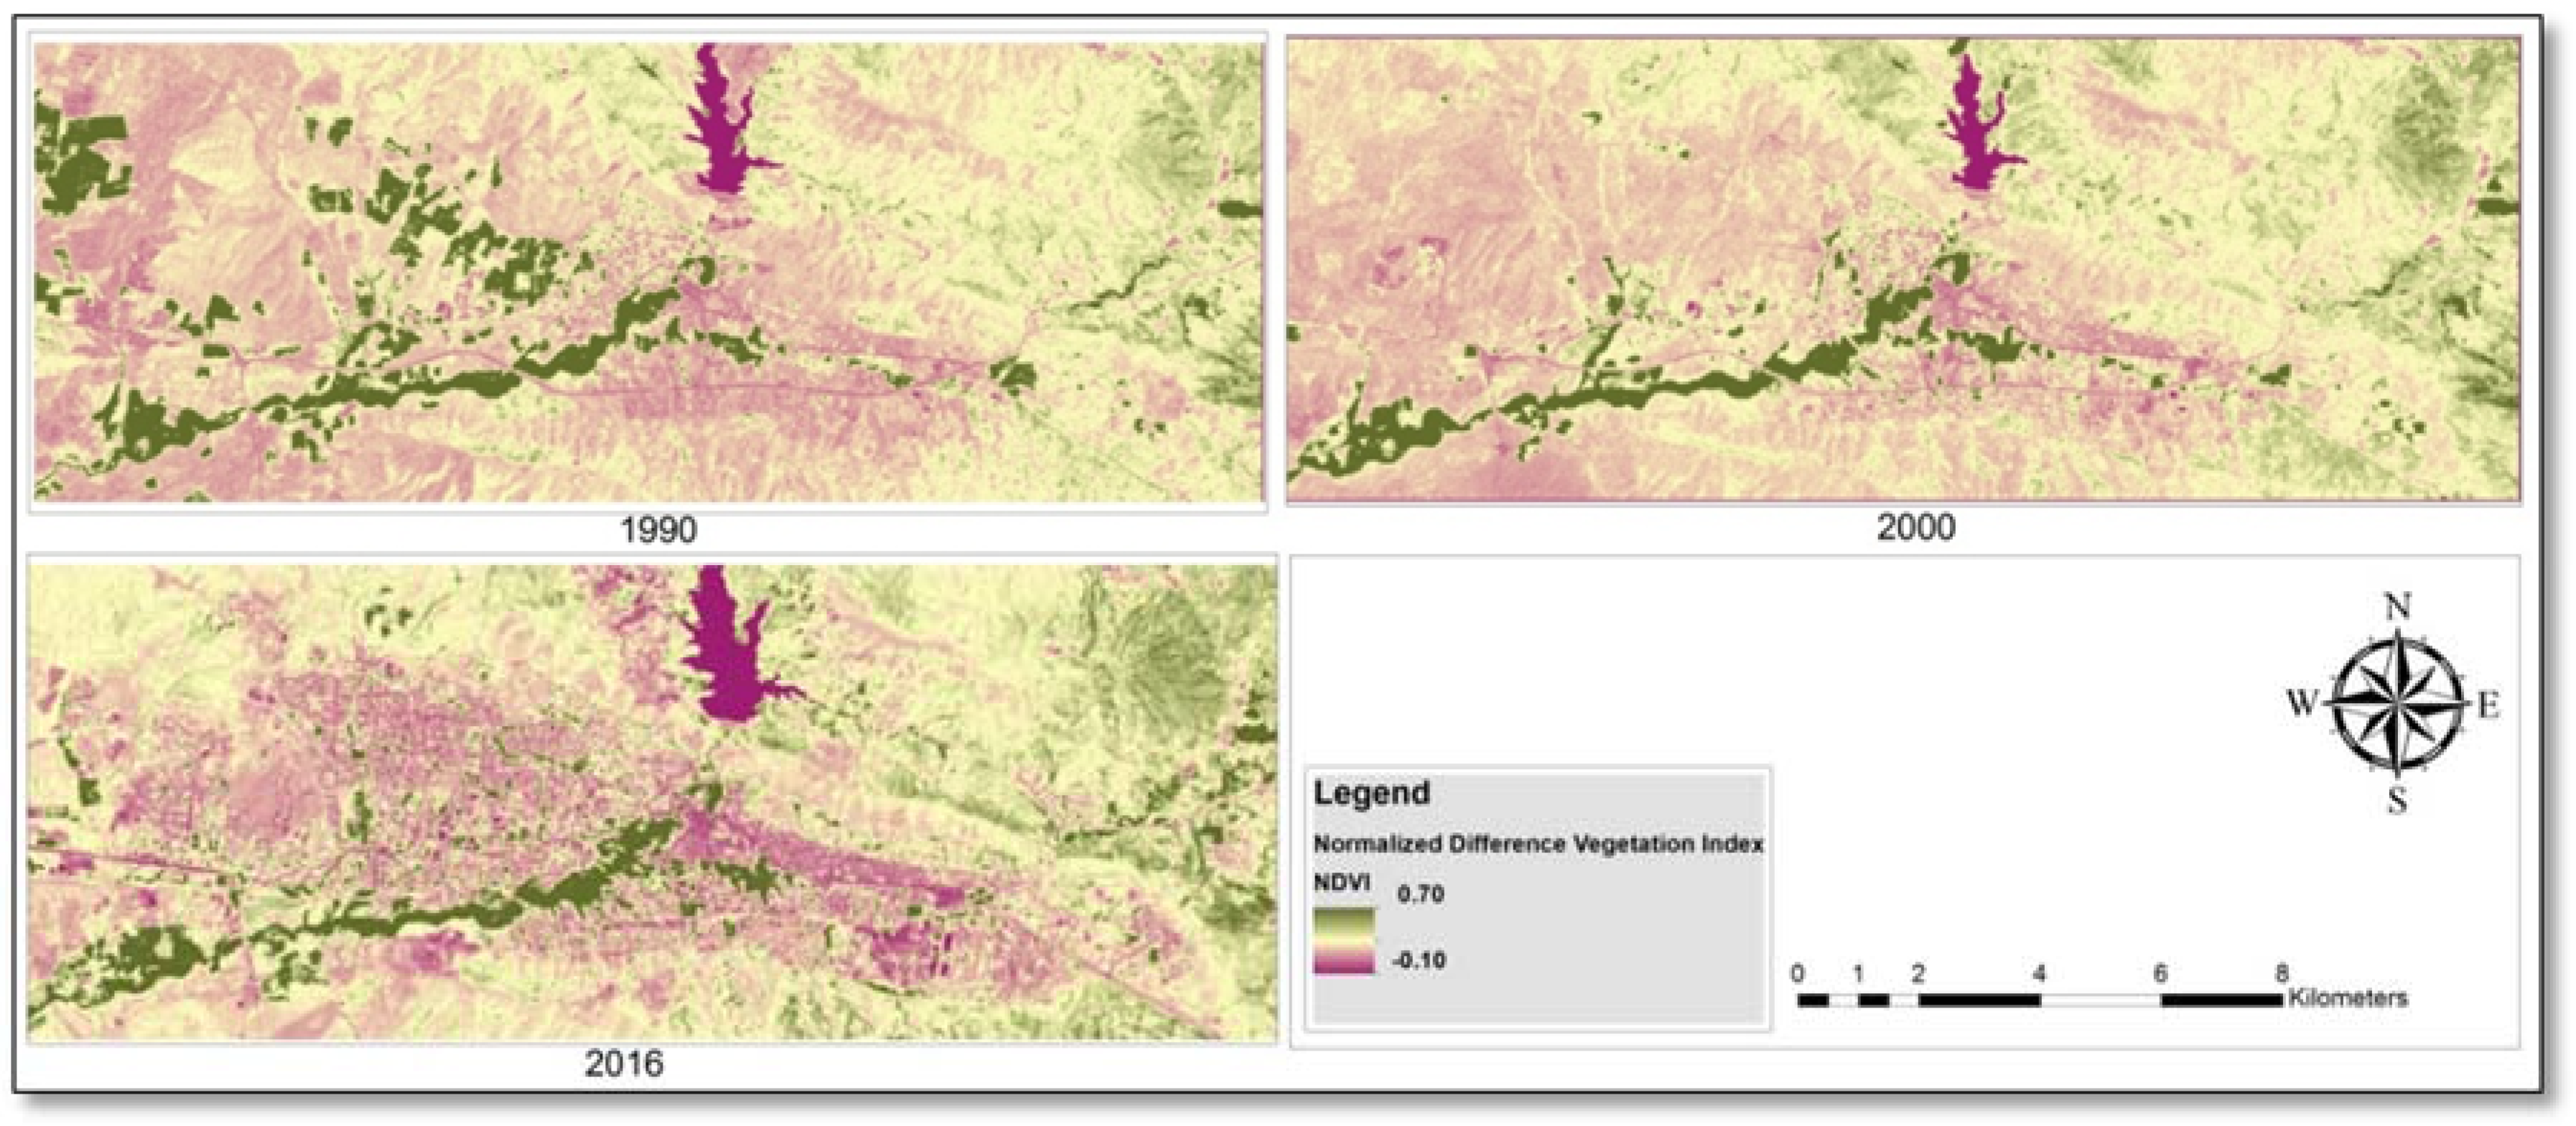
3.1. Land Use/Land Cover Maps
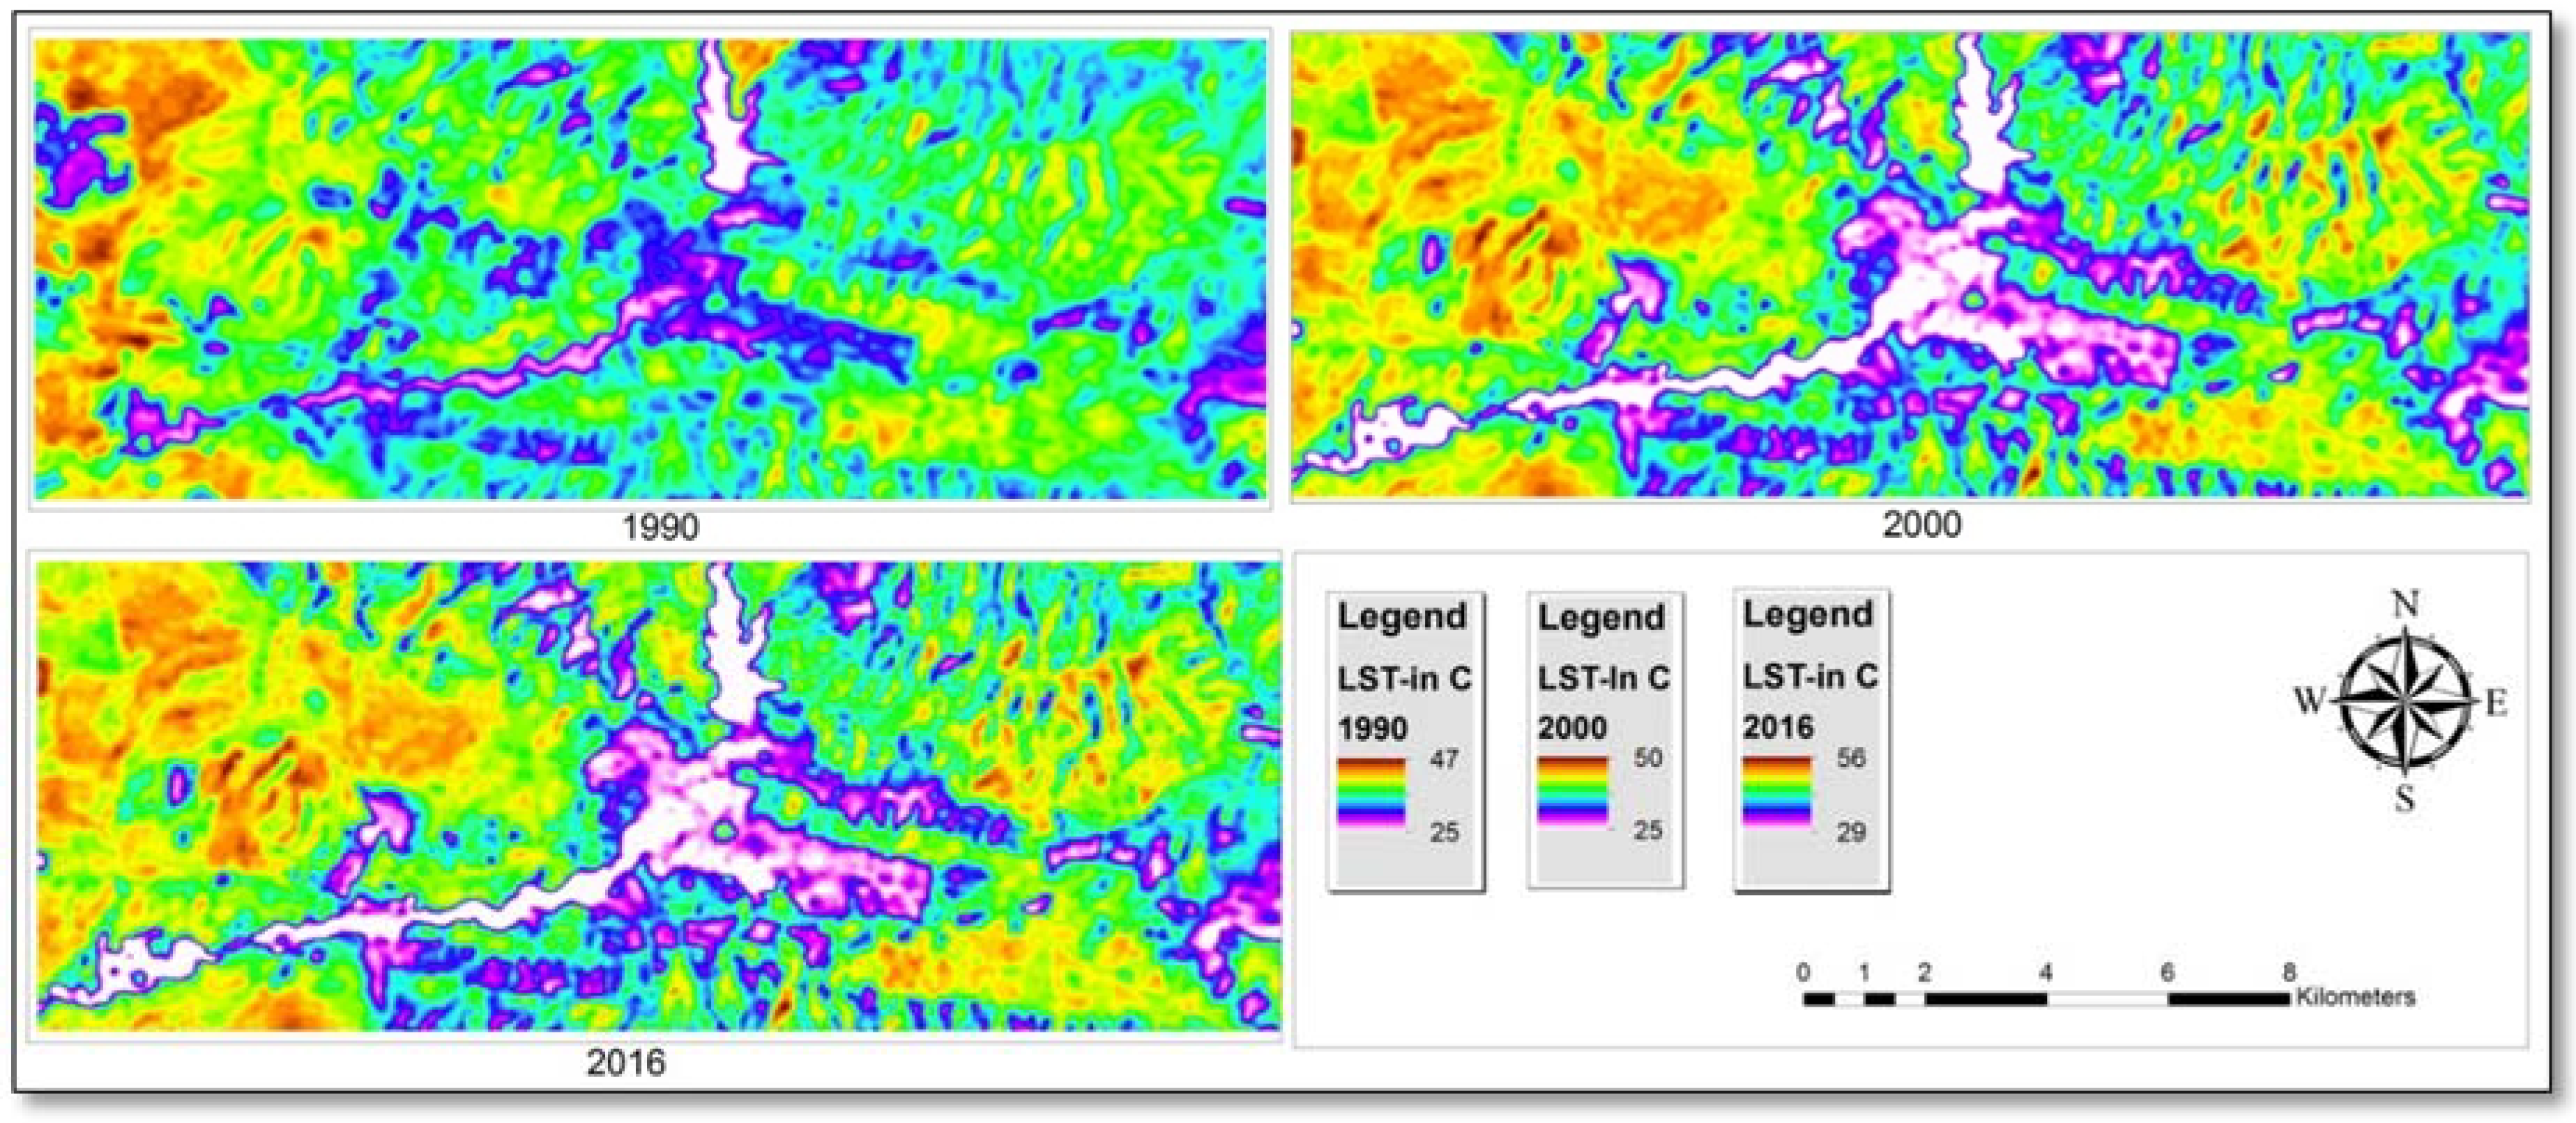
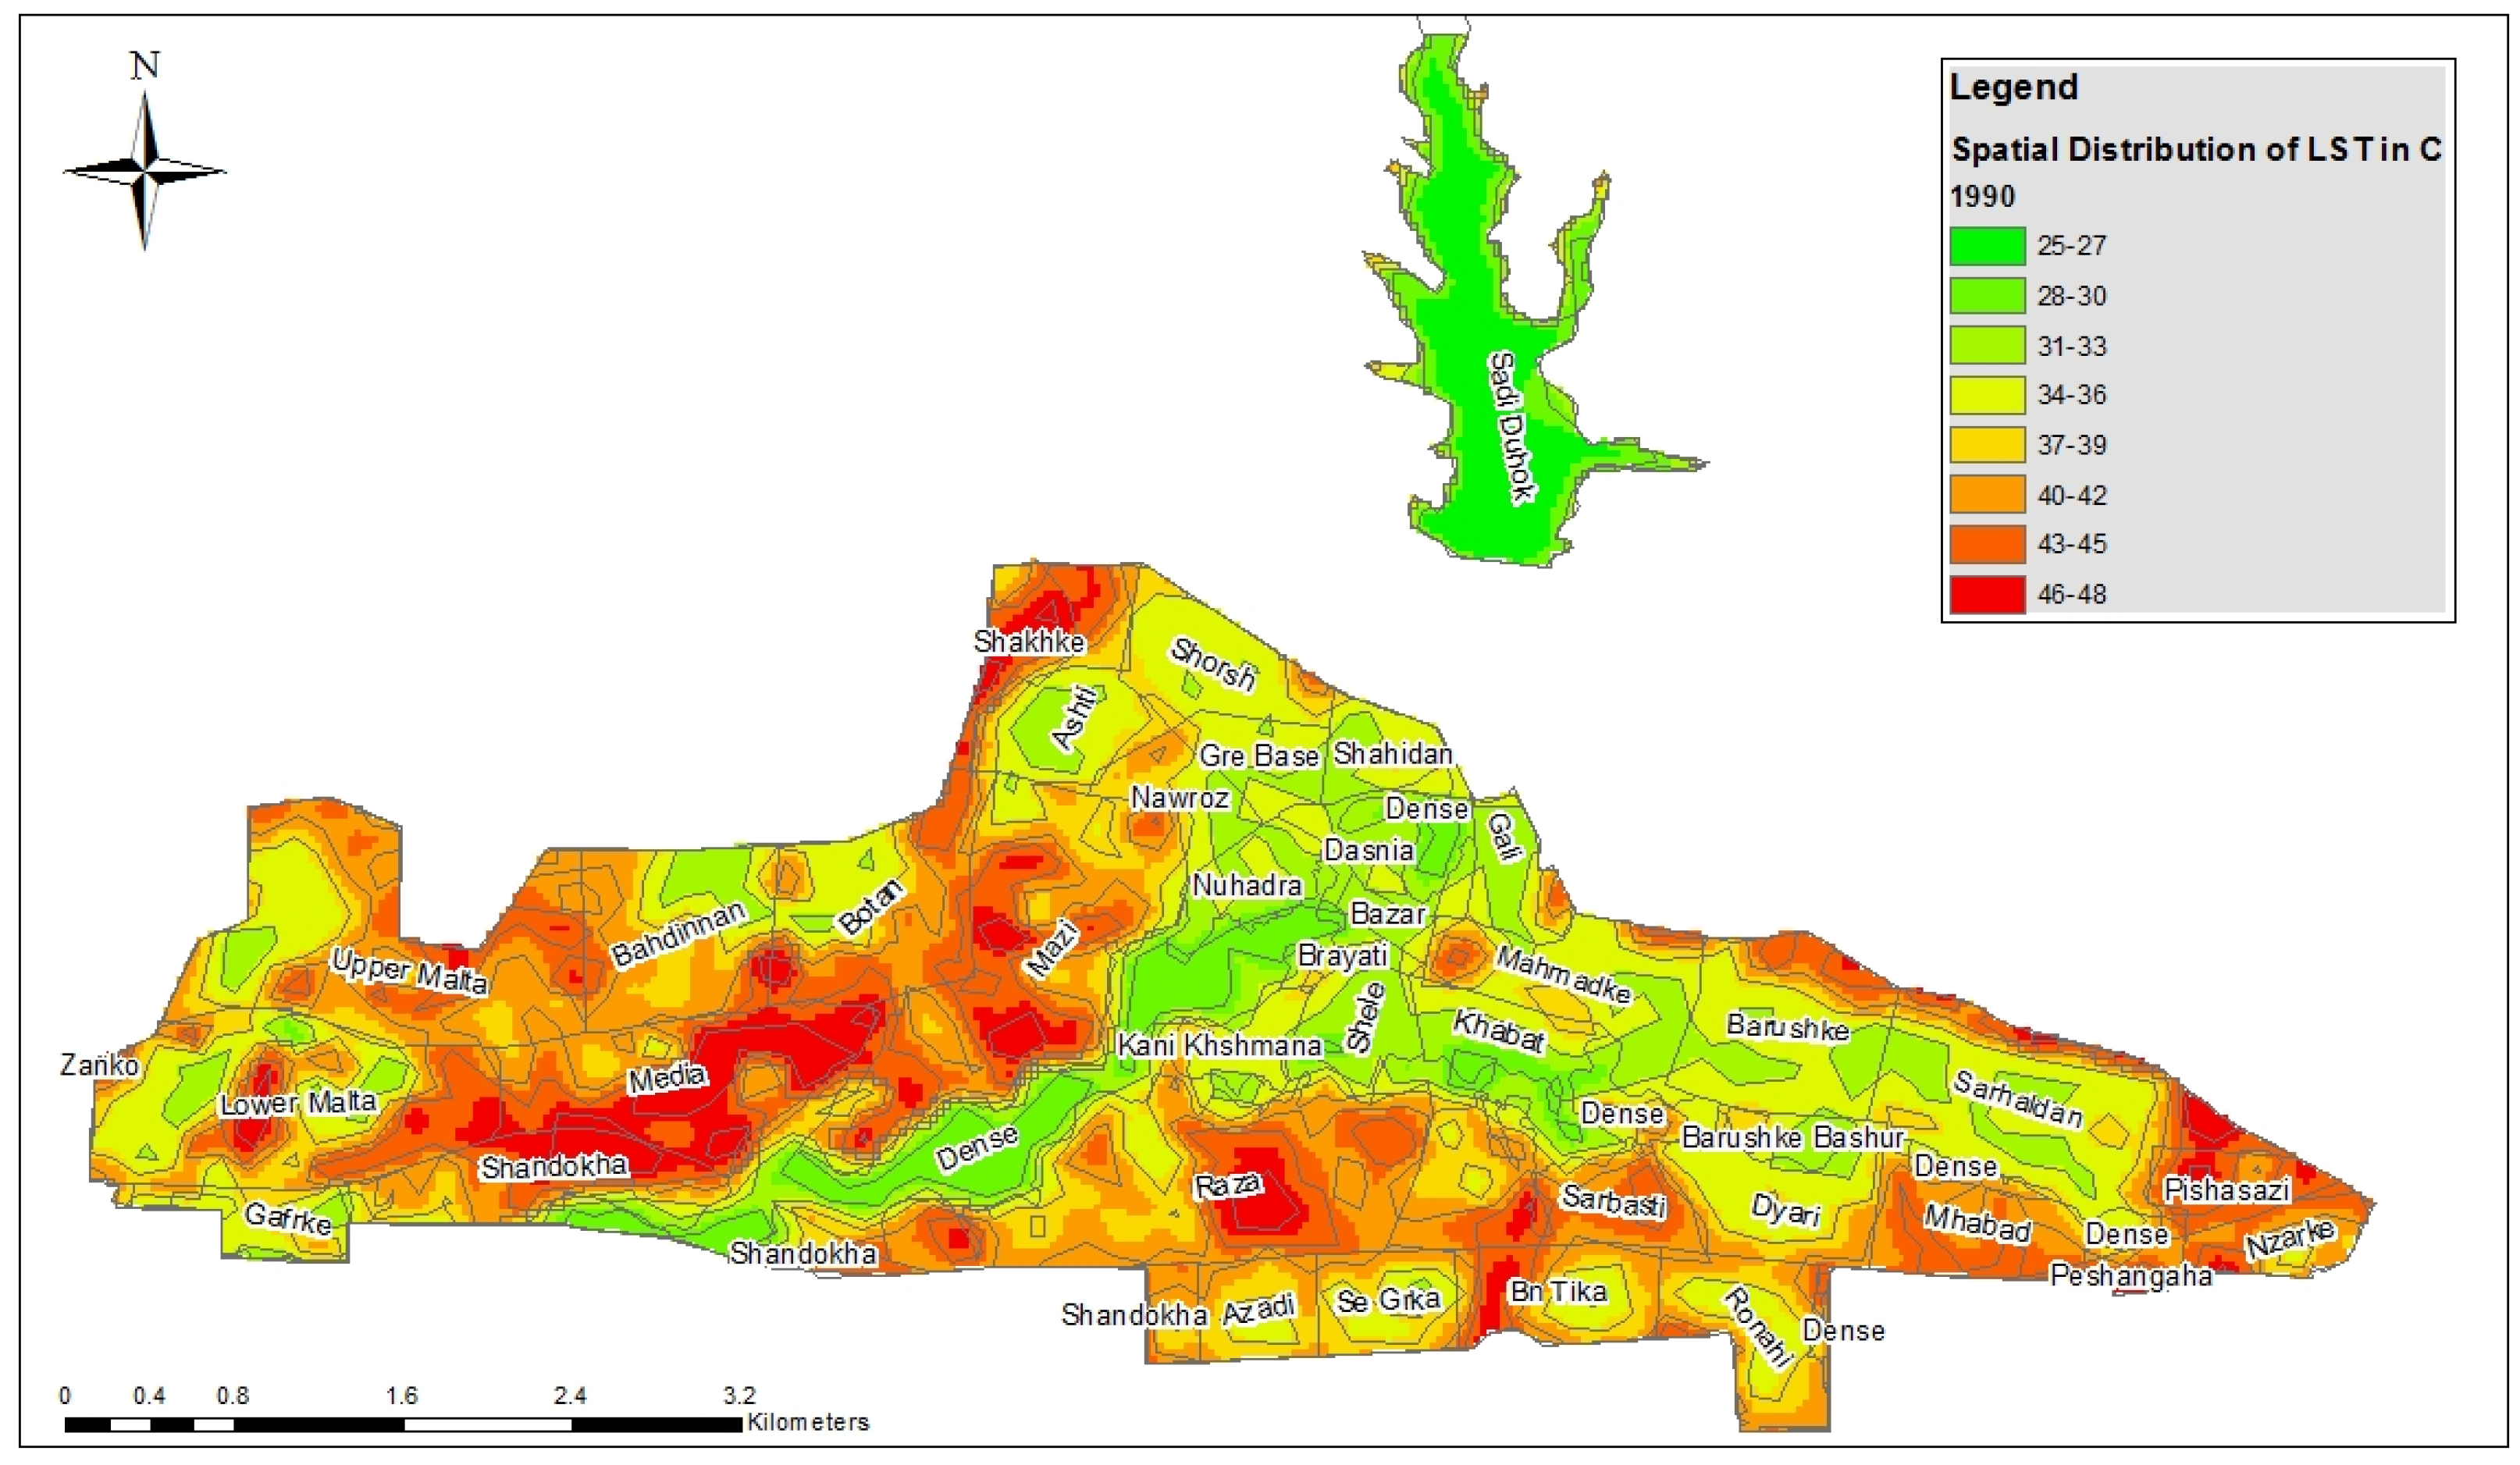
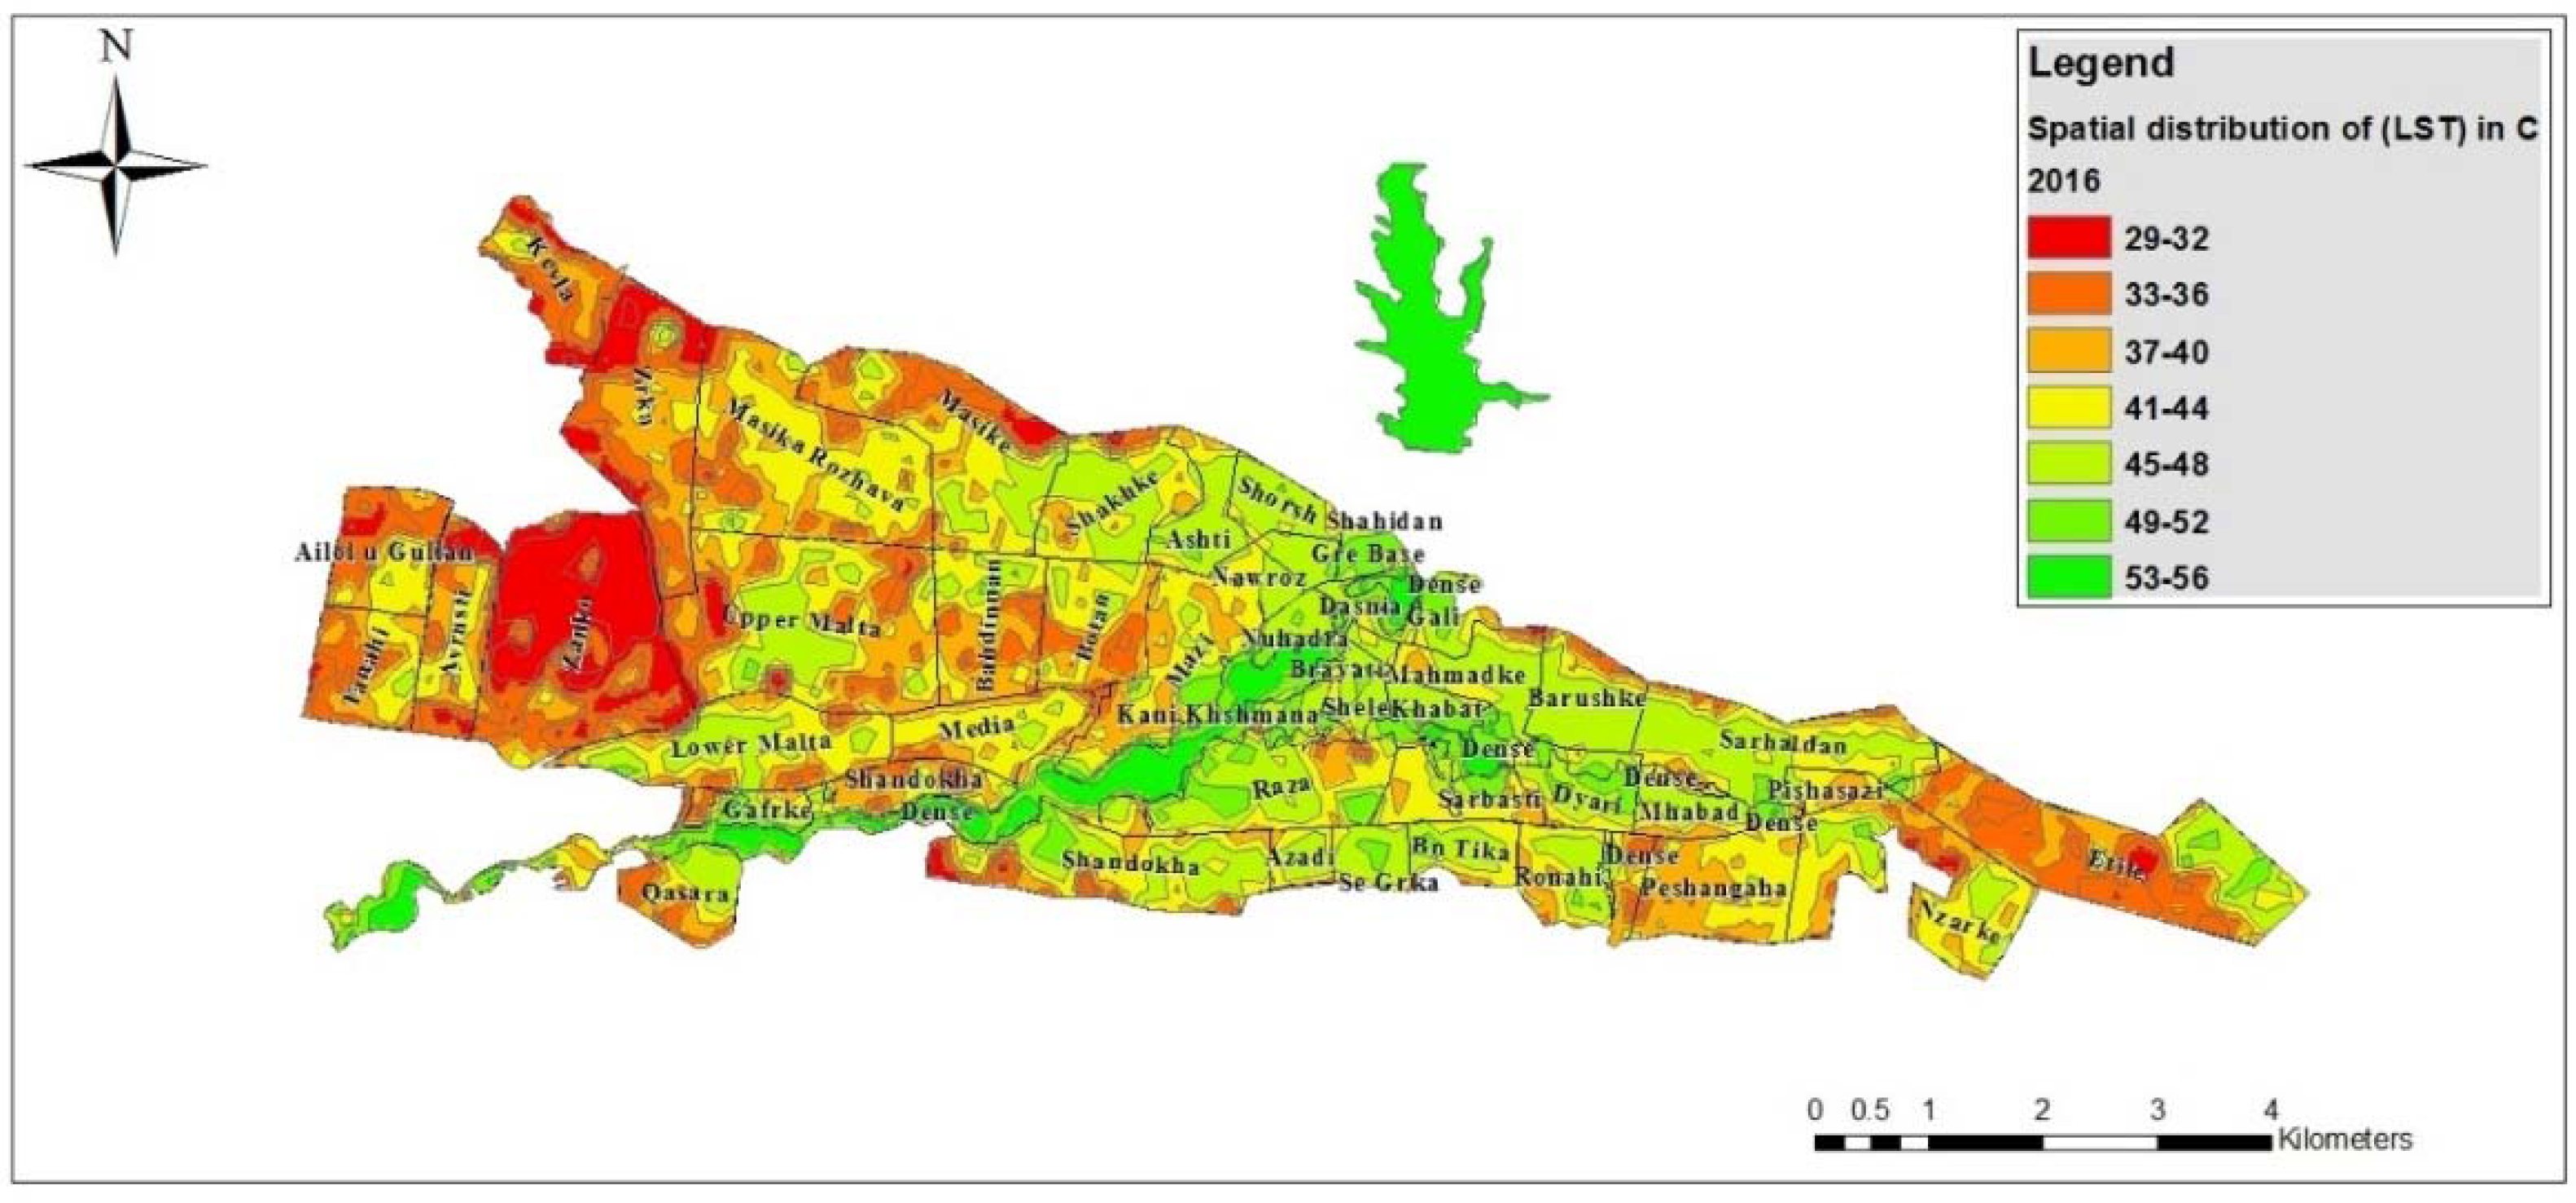
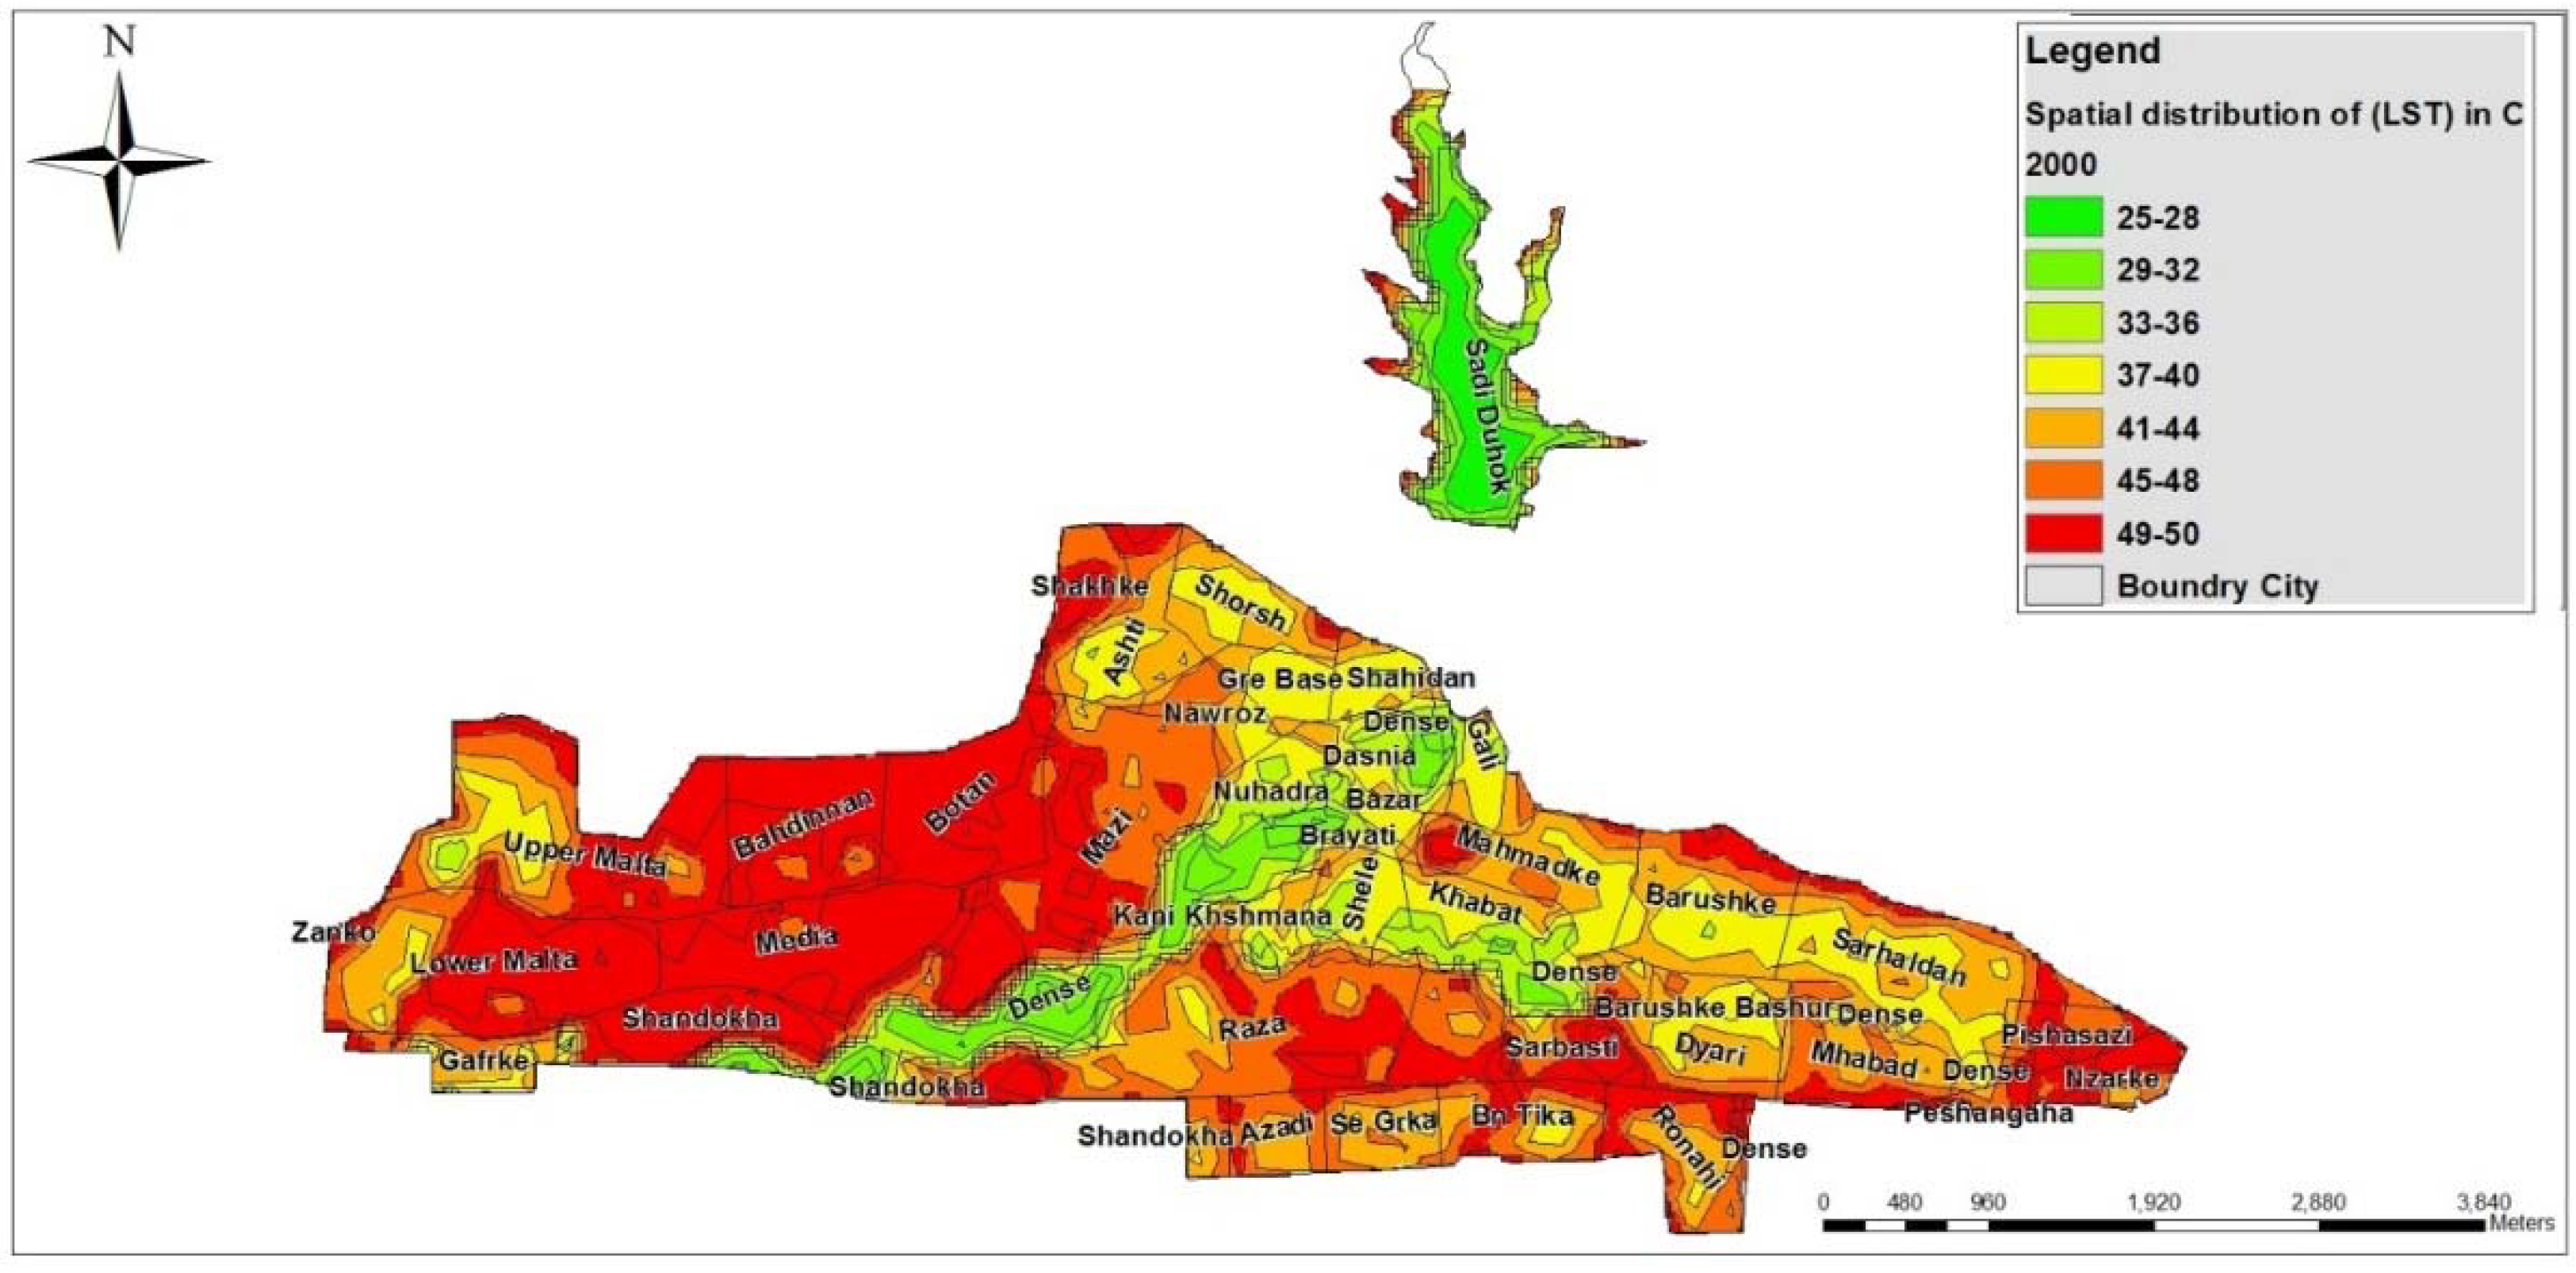
3.2. Land Surface Temperature Retrieval (LST)
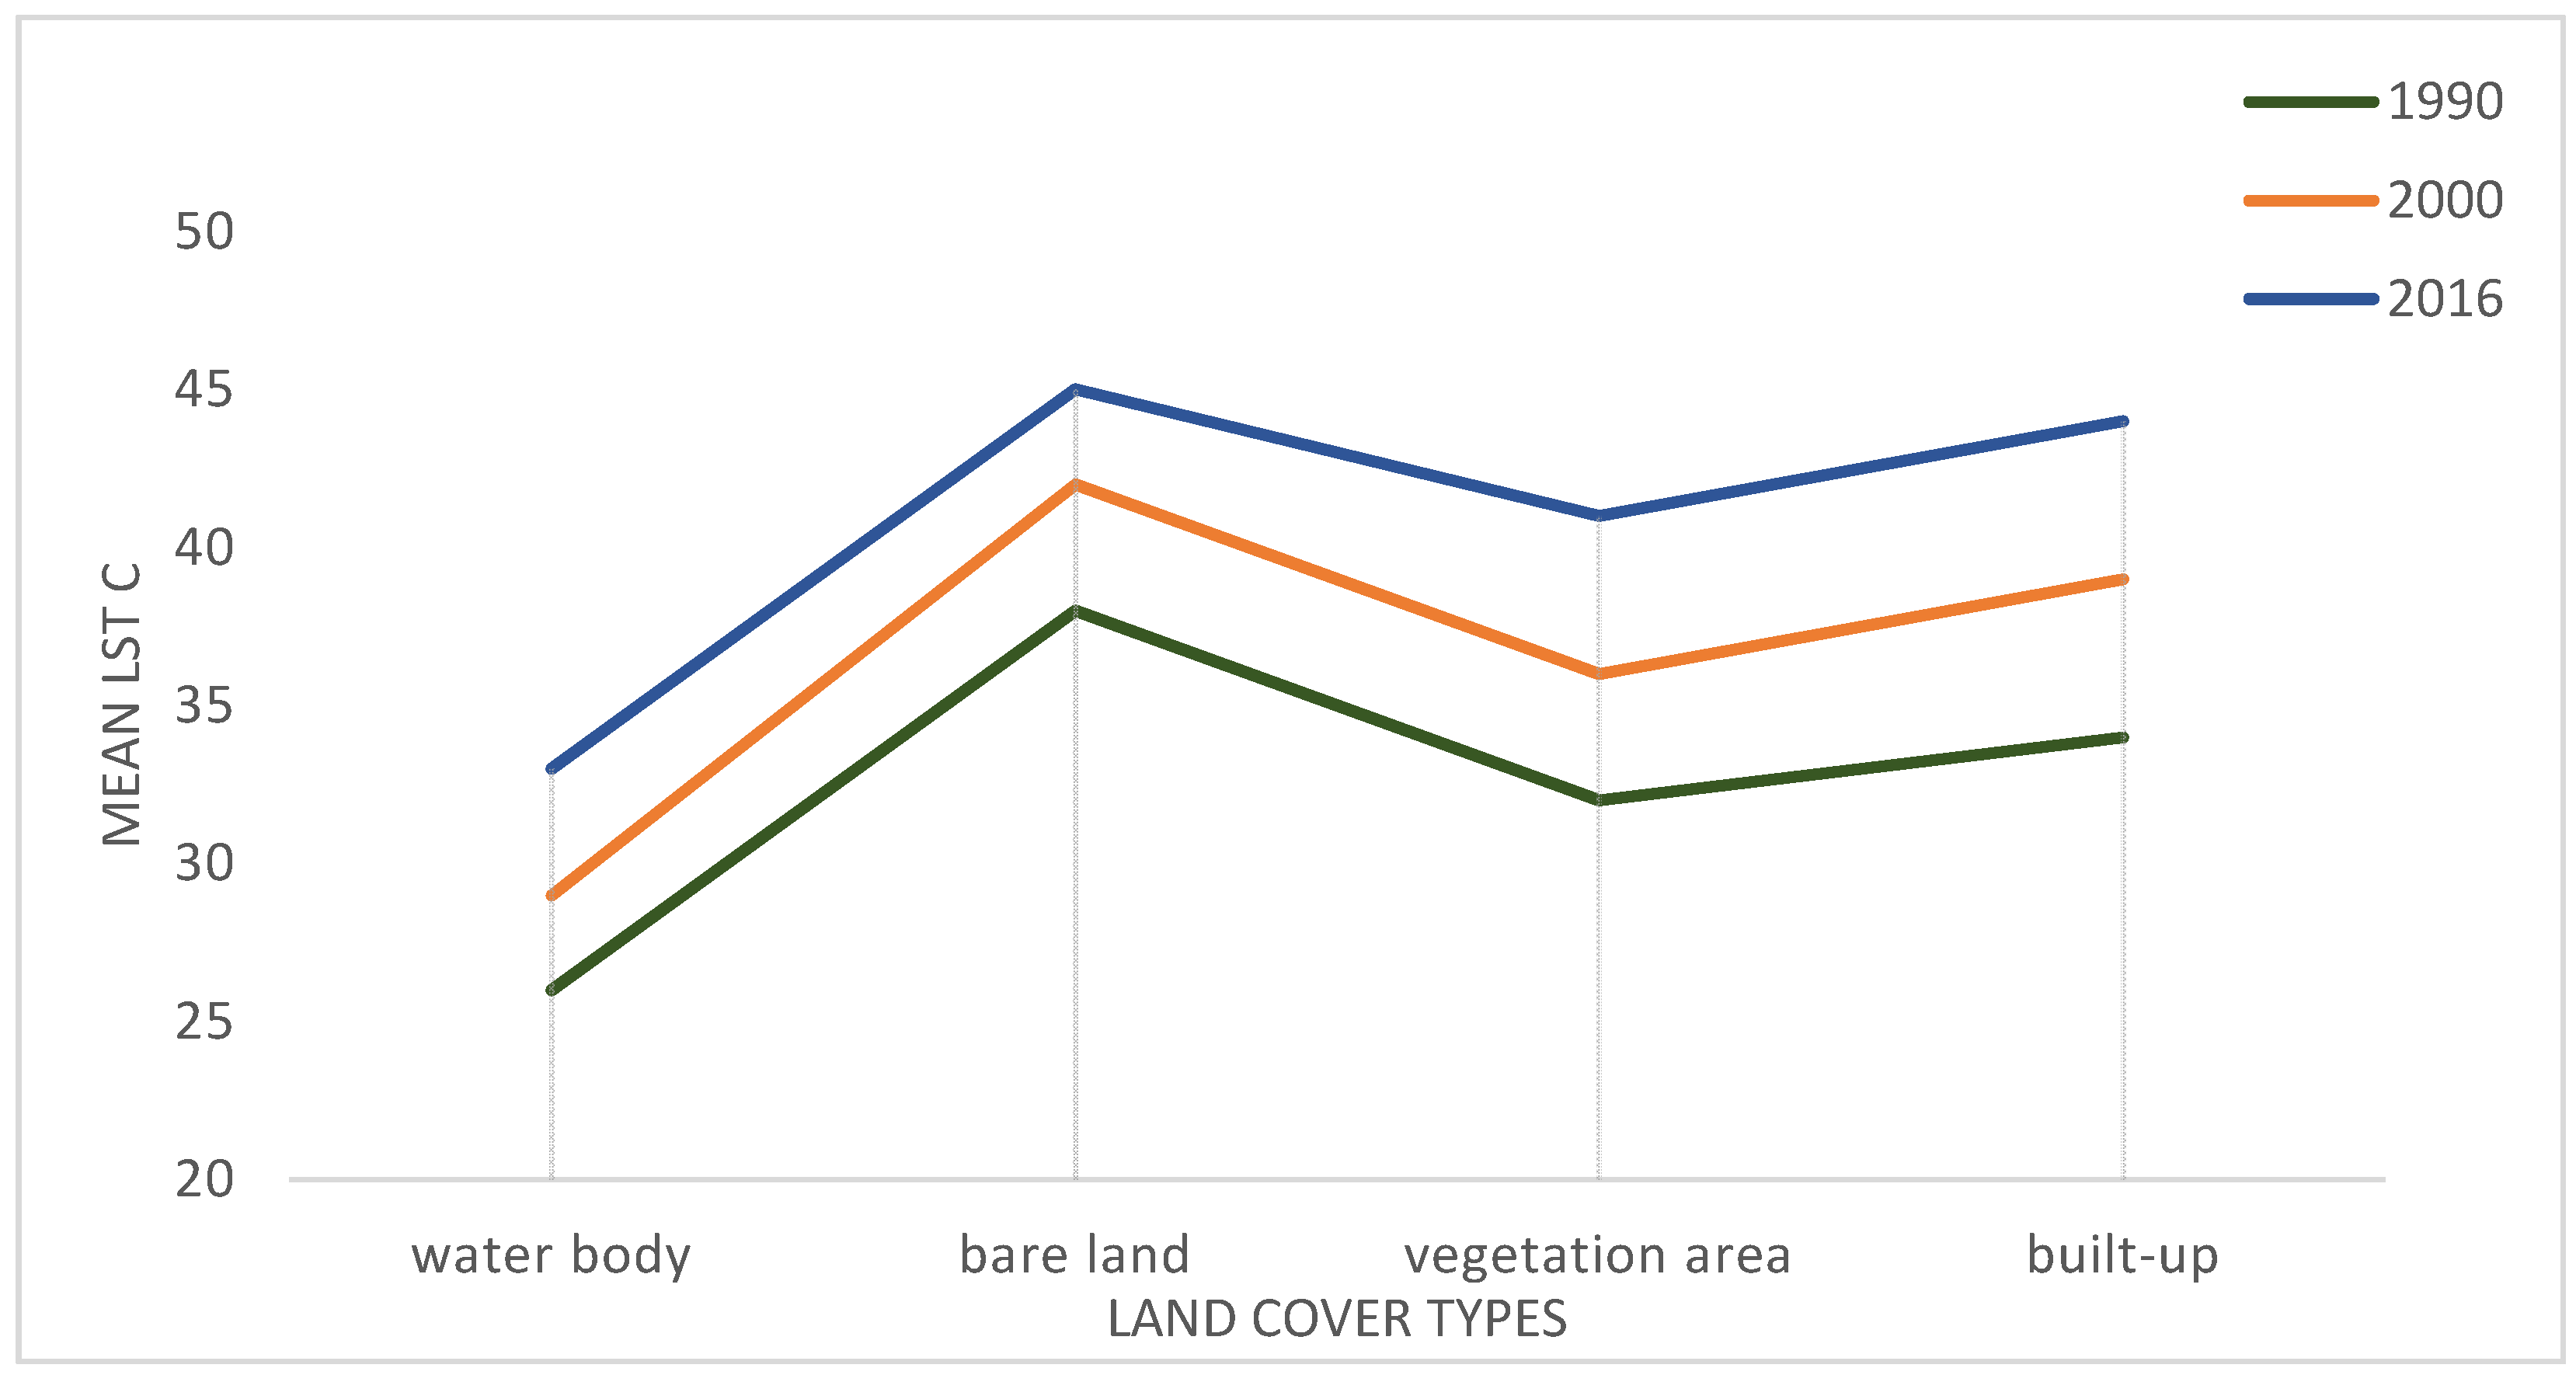
3.3. Relationship between Land Surface Temperature and Different Land Covers
4. Conclusions
Conflicts of Interest
References
- Adegoke, J.O.; Pielke, R.A., Sr.; Eastman, J.; Mahmood, R.; Hubbard, K.G. Impact of irrigation on midsummer surface fluxes and temperature under dry synoptic conditions: A regional atmospheric model study of the US High Plains. Mon. Weather Rev. 2003, 131, 556–564. [Google Scholar] [CrossRef]
- Kant, Y.; Bharath, B.D.; Mallick, J.; Atzberger, C.; Kerle, N. Satellite-based analysis of the role of land use/land cover and vegetation density on surface temperature regime of Delhi, India. J. Indian Soc. Remote Sens. 2009, 37, 201–214. [Google Scholar] [CrossRef]
- Hussain, A.; Bhalla, P.; Palria, S. Remote sensing based analysis of the role of land use/land cover on surface temperature and temporal changes in temperature; A case study of Ajmer District, Rajasthan. Int. Arch. Photogramm. Remote Sens. Spat. Inf. Sci. 2014, 8, 1447–1454. [Google Scholar] [CrossRef]
- Fall, S.; Niyogi, D.; Gluhovsky, A.; Pielke, R.A.; Kalnay, E.; Rochon, G. Impacts of land use land cover on temperature trends over the continental United States: Assessment using the North American Regional Reanalysis. Int. J. Climatol. 2010, 30, 1980–1993. [Google Scholar] [CrossRef]
- Kumar, K.S.; Bhaskar, P.U.; Padmakumari, K. Estimation of land surface temperature to study urban heat island effect using Landsat ETM+ image. Int. J. Eng. Sci. Technol. 2012, 4, 771–778. [Google Scholar]
- Buyadi, S.N.A.; Mohd, W.M.N.W.; Misni, A. Impact of land use changes on the surface temperature distribution of area surrounding the National Botanic Garden, Shah Alam. Procedia Soc. Behav. Sci. 2013, 101, 516–525. [Google Scholar] [CrossRef]
- Weng, Q. A remote sensing? GIS evaluation of urban expansion and its impact on surface temperature in the Zhujiang Delta, China. Int. J. Remote Sens. 2001, 22, 1999–2014. [Google Scholar] [CrossRef]
- Xiao, H.; Weng, Q. The impact of land use and land cover changes on land surface temperature in a karst area of China. J. Environ. Manag. 2007, 85, 245–257. [Google Scholar] [CrossRef] [PubMed]
- Guo, Z.; Wang, S.D.; Cheng, M.M.; Shu, Y. Procedia Environmental sciences assess the effect of different degrees of urbanization on land surface temperature using remote sensing images. Procedia Environ. Sci. 2012, 13, 935–942. [Google Scholar] [CrossRef]
- Abdullah, H.J. The Use of Landsat-5 TM Imagery to Detect Urban Expansion and Its Impact on Land Surface Temperatures in The City of Erbil. Iraqi Kurdistan. Master’s Thesis, Leicester University, Leicester, UK, 2012. [Google Scholar]
- Campbell, J.B. Introduction to Remote Sensing, 3rd ed.; The Guilford Press: New York, NY, USA, 2002. [Google Scholar]
- Quattrochi, D.A.; Luvall, J.C. Thermal Infrared Remote sensing for analysis of landscape ecological processes: methods and applications. Landsc. Ecol. 1999, 14, 577–598. [Google Scholar] [CrossRef]
- Weng, Q.; Lu, D.; Schubring, J. Estimation of Land Surface Temperature—Vegetation abundance relationship for urban heat island studies. Remote Sens. Environ. 2004, 89, 467–483. [Google Scholar] [CrossRef]
- Weng, Q. Thermal infrared remote sensing for urban climate and environmental studies: Methods, applications, and trends. ISPRS J. Photogramm. Remote Sens. 2009, 64, 335–344. [Google Scholar] [CrossRef]
- Vorovencii, I.; Oprea, L.; Ienciu, I.; Popescu, C. Evaluation of land surface temperature for different land cover using Landsat TM Thermal Infrared band. Ann. West Univ. Timis. Ser. Chem. 2013, 22, 1–6. [Google Scholar]
- Feizizadeh, B.; Blaschke, T.; Nazmfar, H.; Akbari, E.; Kohbanani, H.R. Monitoring land surface temperature relationship to land use/land cover from satellite imagery in Maraqeh County, Iran. J. Environ. Plan. Manag. 2013, 56, 1290–1315. [Google Scholar] [CrossRef]
- Kerr, Y.H.; Lagouarde, J.P.; Nerry, F.; Ottlé, C. Land surface temperature retrieval techniques and applications. In Thermal Remote Sensing in Land Surface Processes; Quattrochi, D.A., Luvall, J.C., Eds.; CRC Press: Boca Raton, FL, USA, 2000; pp. 33–109. [Google Scholar]
- Bendib, A.; Dridi, H.; Kalla, M.I. Contribution of Landsat 8 data for the estimation of Land Surface Temperature in Batna city, Eastern Algeria. Geocarto Int. 2016, 6049, 1–11. [Google Scholar] [CrossRef]
- Kogan, F.N. Operational space technology for global vegetation assessment. Bull. Am. Meteorol. Soc. 2001, 82, 1949–1964. [Google Scholar] [CrossRef]
- Li, Z.-L.; Tang, B.H.; Wu, H.; Ren, H.; Yan, G.; Wan, Z.; Trigo, I.F.; Sobrino, J.A. Satellite-derived Land Surface Temperature: Current status and perspectives. Remote Sens. Environ. 2013, 131, 14–37. [Google Scholar] [CrossRef]
- Rozenstein, O.; Qin, Z.; Derimian, Y.; Karnieli, A. Derivation of Land Surface Temperature for Landsat-8 TIRS using a split window algorithm. Sensors 2014, 14, 5768–5780. [Google Scholar] [CrossRef] [PubMed]
- Randrianjatovo, R.N.; Rakotondraompiana, S.; Rakotoniaina, S. Estimation of Land Surface Temperature over Reunion Island using the thermal infrared channels of Landsat-8. In Proceeding of the 2014 IEEE Canada International Humanitarian Technology Conference-(IHTC), Montréal, QC, Canada, 1–4 June 2014.
- Shi, T.; Huang, Y.; Wang, H.; Shi, C.E.; Yang, Y.J. Influence of urbanization on the thermal environment of meteorological station: Satellite-observed evidence. Adv. Clim. Chang. Res. 2015, 6, 7–15. [Google Scholar] [CrossRef]
- Chen, X.L.; Zhao, H.M.; Li, P.X.; Yin, Z.Y. Remote sensing image-based analysis of the relationship between urban heat island and land use/cover changes. Remote Sens. Environ. 2006, 104, 133–146. [Google Scholar] [CrossRef]
- Yu, X.; Guo, X.; Wu, Z. Land surface temperature retrieval from LANDSAT 8 TIRS-comparison between radiative transfer equation-based method, split window algorithm and single channel method. Remote Sens. 2014, 6, 9829–9852. [Google Scholar] [CrossRef]
- Rose, L.; Devadas, M.D. Analysis Of Land Surface Temperature And Land Use/Land Cover Types Using Remote Sensing Imagery—A Case In Chennai city, India. In Proceeding of the Seventh International Conference on Urban Climate, Yokohama, Japan, 29 June–3 July 2009; pp. 1998–2001.
- Fu, P.; Weng, Q. A time series analysis of urbanization induced Land Use and Land Cover change and its impact on Land Surface Temperature with Landsat imagery. Remote Sens. Environ. 2016, 175, 205–214. [Google Scholar] [CrossRef]
- Lv, Z.; Zhou, Q. Utility of Landsat image in the study of Land Cover and Land Surface Temperature change. Procedia Environ. Sci. 2011, 10, 1287–1292. [Google Scholar] [CrossRef]
- Xiao, R.B.; Ouyang, Z.Y.; Zheng, H.; Li, W.F.; Schienke, E.W.; Wang, X.K. Spatial pattern of impervious surfaces and their impacts on Land Surface Temperature in Beijing, China. J. Environ. Sci. 2007, 19, 250–256. [Google Scholar] [CrossRef]
- Dewan, A.M.; Yamaguchi, Y. Using remote sensing and GIS to detect and monitor Land Use and Land Cover change in Dhaka Metropolitan of Bangladesh during 1960–2005. Environ. Monit. Assess. 2009, 150, 237–249. [Google Scholar] [CrossRef] [PubMed]
- Belal, A.A. Detecting urban growth using remote sensing and GIS techniques in Al Gharbiya governorate, Egypt. Egypt. J. Remote Sens. Space Sci. 2011, 14, 73–79. [Google Scholar] [CrossRef]
- Rahman, A.; Kumar, S.; Fazal, S. Assessment of Land use/Land Cover Change in the North-West District of Delhi Using remote sensing and gis techniques. J. Indian Soc. Remote Sens. 2012, 40, 689–697. [Google Scholar] [CrossRef]
- Takeuchi, W.; Hashim, N.; Thet, K.M. Application of remote sensing and GIS for monitoring urban heat island in Kuala Lumpur Metropolitan area. In Proceedings of the Map Asia 2010 and the International Symposium and Exhibition on Geo-information, Kuala Lumpur, Malaysia, 26–28 July 2010.
- Zurina, M.; Hukil, S. Appraising Good Governance in Malaysia Based on Sustainable Development Values. J. Asian Behav. Stud. Sustain. Sci. Manag. 2012, 7, 247–253. [Google Scholar]
- Jiang, J.; Tian, G. Analysis of the impact of Land use/Land cover change on Land Surface Temperature with remote sensing. Proc. Environ. Sci. 2010, 2, 571–575. [Google Scholar] [CrossRef]
- Carlson, T.N.; Arthur, S.T. The impact of land Use Land Cover changes due to urbanization on surface microclimate and hydrology: A satellite perspective. Glob. Planet. Chang. 2000, 25, 49–65. [Google Scholar] [CrossRef]
- Huang, J.; Wang, R.; Li, F.; Yang, W.; Zhou, C.; Jin, J.; Shi, Y. Simulation of thermal effects due to different amounts of urban vegetation within the built-up area of Beijing, China. Int. J. Sustain. Dev. World Ecol. 2009, 16, 67–76. [Google Scholar] [CrossRef]
- Chen, S.; Zeng, S.; Xle, C. Remote Sensing and GIS for urban growth analysis in China. Photogramm. Eng. Remote Sens. 2000, 66, 593–598. [Google Scholar]
- Abdulla, H.H. Rock Slop Analysis in Duhok Governorate/Bekhair anticline by using GIS technique. J. Al-Nahrain Univ. 2013, 16, 46–54. [Google Scholar]
- Mohammed, H.D.; Ali, M.A. Monitoring and prediction of urban growth using GIS techniques: A Case study of Dohuk City Kurdistan Region of Iraq. Int. J. Sci. Eng. Res. 2014, 5, 1480–1488. [Google Scholar]
- Koeppe, C.E.; De Long, G.C. Weather and Climate; McGraw-Hill: New York, NY, USA, 1958. [Google Scholar]
- Mohammed, J. Land use and cover change assessment using Remote Sensing and GIS: Dohuk City, Kurdistan, Iraq (1998–2011). Int. J. Geomat. Geosci. 2013, 3, 552–569. [Google Scholar]
- Lillesand, T.; Kiefer, R.W.; Chipman, J. Remote Sensing and Image Interpretation; John Wiley and Sons: Hoboken, NJ, USA, 2008. [Google Scholar]
- Raynolds, M.K.; Comiso, J.C.; Walker, D.A.; Verbyla, D. Relationship between satellite-derived Land Surface Temperatures, arctic vegetation types, and NDVI. Remote Sens. Environ. 2008, 112, 1884–1894. [Google Scholar] [CrossRef]
- Grover, A. Monitoring Spatial patterns of Land Surface Temperature and urban heat island for sustainable megacity: A case study of Mumbai, India, using Landsat TM data. Environ. Urban Asia 2016, 7, 38–54. [Google Scholar] [CrossRef]
- Jalili, S.Y. The effect of land use on land surface temperature in The Netherlands. In Proceedings of the 2015 International Conference on Sensors & Models in Remote Sensing & Photogrammetry, Kish Island, Iran, 23–25 November 2015.
- He, C.; Shi, P.; Xie, D.; Zhao, Y. Improving the normalized difference built-up index to map urban built-up areas using a semiautomatic segmentation approach. Remote Sens. Lett. 2010, 1, 213–221. [Google Scholar] [CrossRef]
- Ahmed, B.; Kamruzzaman, M.; Zhu, X.; Rahman, M.S.; Choi, K. Simulating land cover changes and their impacts on Land Surface Temperature in Dhaka, Bangladesh. Remote Sens. 2013, 5, 5969–5998. [Google Scholar] [CrossRef] [Green Version]
- Qin, Z.; Karnieli, A.; Berliner, P. A mono-window algorithm for retrieving land surface temperature from Landsat TM data and its application to the Israel-Egypt border region. Int. J. Remote Sens. 2001, 22, 3719–3746. [Google Scholar] [CrossRef]
- Liu, L.; Zhang, Y. Urban heat island analysis using the Landsat TM data and ASTER data: A case study in Hong Kong. Remote Sens. 2011, 3, 1535–1552. [Google Scholar] [CrossRef]
- Rodriguez-galiano, V.; Pardo-Iguzquiza, E.; Sanchez-Castillo, M.; Chica-Olmo, M.; Chica-Rivas, M. Downscaling Landsat 7 ETM + thermal imagery using Land Surface Temperature and NDVI images. Int. J. Appl. Earth Obs. Geoinform. 2012, 18, 515–527. [Google Scholar] [CrossRef]
- Abas, K.A. Analysis of Climate and Drought Conditions in the Fedral Region of Kurdistan; College of Basic Education, Salahaddin University: Erbil, Iraq, 2012. [Google Scholar]
- Rogan, J.; Ziemer, M.; Martin, D.; Ratick, S.; Cuba, N.; DeLauer, V. The impact of tree cover loss on Land Surface Temperature: A case study of central Massachusetts using Landsat Thematic Mapper thermal data. Appl. Geogr. 2013, 45, 49–57. [Google Scholar] [CrossRef]
- Essa, W.; Verbeiren, B.; van der Kwast, J.; Van de Voorde, T.; Batelaan, O. Evaluation of the DisTrad thermal sharpening methodology for urban areas. Int. J. Appl. Earth Obs. Geoinform. 2012, 19, 163–172. [Google Scholar] [CrossRef]
- Adegoke, J.O.; Carleton, A.M. Relations between soil moisture and satellite vegetation indices in the US Corn Belt. J. Hydrometeorol. 2002, 3, 395–405. [Google Scholar] [CrossRef]
- Hanamean, J.R., Jr.; Pielke, R.A., Sr.; Castro, C.L.; Ojima, D.S.; Reed, B.C.; Gao, Z. Vegetation greenness impacts on maximum and minimum temperatures in northeast Colorado. Meteorol. Appl. 2003, 10, 203–215. [Google Scholar] [CrossRef]


| Details of Landsat 5-TM Satellite Images | |||
| Band Number | Spectral Range µm | Spatial Resolution (m) | Band Name |
| 1 | 0.450–0.515 | 30 | Blue |
| 2 | 0.525–0.605 | 30 | Green |
| 3 | 0.630–0.690 | 30 | Red |
| 4 | 0.760–0.900 | 30 | Near IR |
| 5 | 1.550–1.750 | 30 | Mid IR |
| 6 | 10.40–12.5 | 120 | Thermal |
| 7 | 2.080–2.35 | 30 | Mid IR |
| Details of Landsat-8 OLI Satellite Images | |||
| Band Number | Spectral Range µm | Spatial Resolution (m) | Band Name |
| 1 | 0.435–0.451 | 30 | Coastal/Aerosol |
| 2 | 0.452–0.512 | 30 | Blue |
| 3 | 0.533–0.590 | 30 | Green |
| 4 | 0.636–0.673 | 30 | Red |
| 5 | 0.851–0.879 | 30 | NIR |
| 6 | 1.566–1.651 | 30 | SWIR-1 |
| 7 | 2.107–2.294 | 30 | SWIR-2 |
| 8 | 0.503–0.676 | 15 | Pan |
| 9 | 1.363–1.384 | 30 | Cirrus |
| 10 | 10.60–11.19 | 100 | TIR-1 |
| 11 | 11.50–12.51 | 100 | TIR-2 |
| Years | 1990 | 2000 | 2016 |
|---|---|---|---|
| Overall accuracy % | 88 | 91 | 87 |
| Kappa Index % | 85 | 90 | 84 |
| Class Name | Area Hectares 1990 | Area % 1990 | Area Hectares 2000 | Area % 2000 | Area Hectares 2016 | Area % 2016 |
|---|---|---|---|---|---|---|
| Barren Land | 13,141.13 | 77.27 | 13,420.7 | 78.9 | 11,342.2 | 66.7 |
| Vegetation Land | 2629.78 | 15.46 | 2206.26 | 12.98 | 2381.13 | 14 |
| Built-up Land | 1095.77 | 6.44 | 1241.55 | 7.3 | 3140.01 | 18.5 |
| Water | 140.57 | 0.83 | 138.74 | 0.82 | 143.91 | 0.84 |
| Total | 17,007.25 | 100 | 17,007.25 | 100 | 17,007.25 | 100 |
© 2017 by the author. Licensee MDPI, Basel, Switzerland. This article is an open access article distributed under the terms and conditions of the Creative Commons Attribution (CC BY) license ( http://creativecommons.org/licenses/by/4.0/).
Share and Cite
Faqe Ibrahim, G.R. Urban Land Use Land Cover Changes and Their Effect on Land Surface Temperature: Case Study Using Dohuk City in the Kurdistan Region of Iraq. Climate 2017, 5, 13. https://doi.org/10.3390/cli5010013
Faqe Ibrahim GR. Urban Land Use Land Cover Changes and Their Effect on Land Surface Temperature: Case Study Using Dohuk City in the Kurdistan Region of Iraq. Climate. 2017; 5(1):13. https://doi.org/10.3390/cli5010013
Chicago/Turabian StyleFaqe Ibrahim, Gaylan Rasul. 2017. "Urban Land Use Land Cover Changes and Their Effect on Land Surface Temperature: Case Study Using Dohuk City in the Kurdistan Region of Iraq" Climate 5, no. 1: 13. https://doi.org/10.3390/cli5010013