Article

Assessment of Urban Heat Islands in Small- and Mid-Sized Cities in Brazil

by
Renata Dos Santos Cardoso
*,
Larissa Piffer Dorigon
*,
Danielle Cardozo Frasca Teixeira
* and
Margarete Cristiane de Costa Trindade Amorim
*
Department of Geography, São Paulo State University (UNESP), 305 Roberto Simonsen Street, Presidente Prudente, São Paulo 19060-900, Brazil
*
Authors to whom correspondence should be addressed.
Climate 2017, 5(1), 14; https://doi.org/10.3390/cli5010014
Submission received: 30 December 2016 / Revised: 20 February 2017 / Accepted: 21 February 2017 / Published: 25 February 2017
(This article belongs to the Special Issue Studies and Perspectives of Climatology in Brazil)

Abstract

:
Urban heat islands (UHIs) in large cities and different climatic regions have been thoroughly studied; however, their effects are becoming a common concern in smaller cities as well. We assessed UHIs in three tropical cities, analyzing how synoptic conditions, urban morphology, and land cover affect the heat island magnitude. Data gathering involved mobile surveys across Paranavaí (Paraná), Rancharia (São Paulo), and Presidente Prudente (São Paulo), Brazil, during summer evenings (December 2013–January 2014). Temperature data collected over five days in each city point to heat islands with magnitudes up to 6 °C, under calm synoptic conditions, whereas summer average UHI magnitudes peak at 3.7 °C. In addition, UHI magnitudes were higher in areas with closely spaced buildings and few or no trees and building materials that are not appropriate for the region’s climate and thermal comfort.

1. Introduction

The transformation of natural surfaces by built urban forms affects several climatological variables, especially air temperature, and consequently humans and the environment. Given the increasing number of people living in cities and the atmospheric changes caused by urbanization, urban heat islands (UHIs) have been detected within very different sized cities and differentiated by their intensities or magnitudes [1,2,3,4,5].
Early studies of UHIs focused almost exclusively on large cities or metropolitan regions [6,7,8,9,10,11,12], owing to the greater importance placed on air circulation and pollution [13]. However, a number of studies for small- and medium-sized cities have described problems in the air and temperature of these cities that are unique [13].
Different thermal patterns in the atmosphere over smaller urban areas have been reported [13,14,15,16]. Besides the specific characteristics of the studied areas, these studies showed that nocturnal heat islands were evident in small and nonindustrial cities with low population densities. Apparently, heat islands can develop under ideal conditions (i.e., light winds and clear skies), and surface relief tends to modify UHIs regardless of the city size.
Heat islands are strongly related to the size and morphology of urban areas [17], however, even in small cities that are neither polluted nor have excessive verticalization, UHIs are associated with thermal and hygrometric discomfort because of the rise in temperature [18]. Gartland ([19], p.11) points out that not only do heat islands cause minor additional discomfort, but also the higher temperature and lack of shading and the consequent increase in air pollution increase the mortality rates and affect the population health.
The importance of urban climate studies is justified by the fact that small- and mid-sized cities, which are generally not well studied, show increases in population and socioeconomic, political, and environmental significance. In addition, urban planning in these cities, owing to their stages of development, is more effective than in large and metropolitan ones [20].
The use of urban climate studies, however, as a support to urban planning is still incipient in Brazilian cities. Urban space in tropical cities prioritizes the economic rather than the social and environmental aspects, subdividing the land into small lots, removing the vegetation cover, and using building elements that increase the ambient room temperatures. These factors lead to an urban thermal environment that impacts the residents’ health, especially the low-income population, who are less likely to adapt to climate changes owing to their limited access to cooling facilities.
In light of these concerns, we attempted to analyze the heat islands detected in three tropical cities to unravel the main factors that are responsible for heat island development in small- and mid-sized cities. By using information about land use, land cover, and atmospheric systems, we identified the maximum nocturnal UHI magnitudes during stable weather conditions, distributed among densely built areas with reduced vegetation cover.

2. Materials and Methods
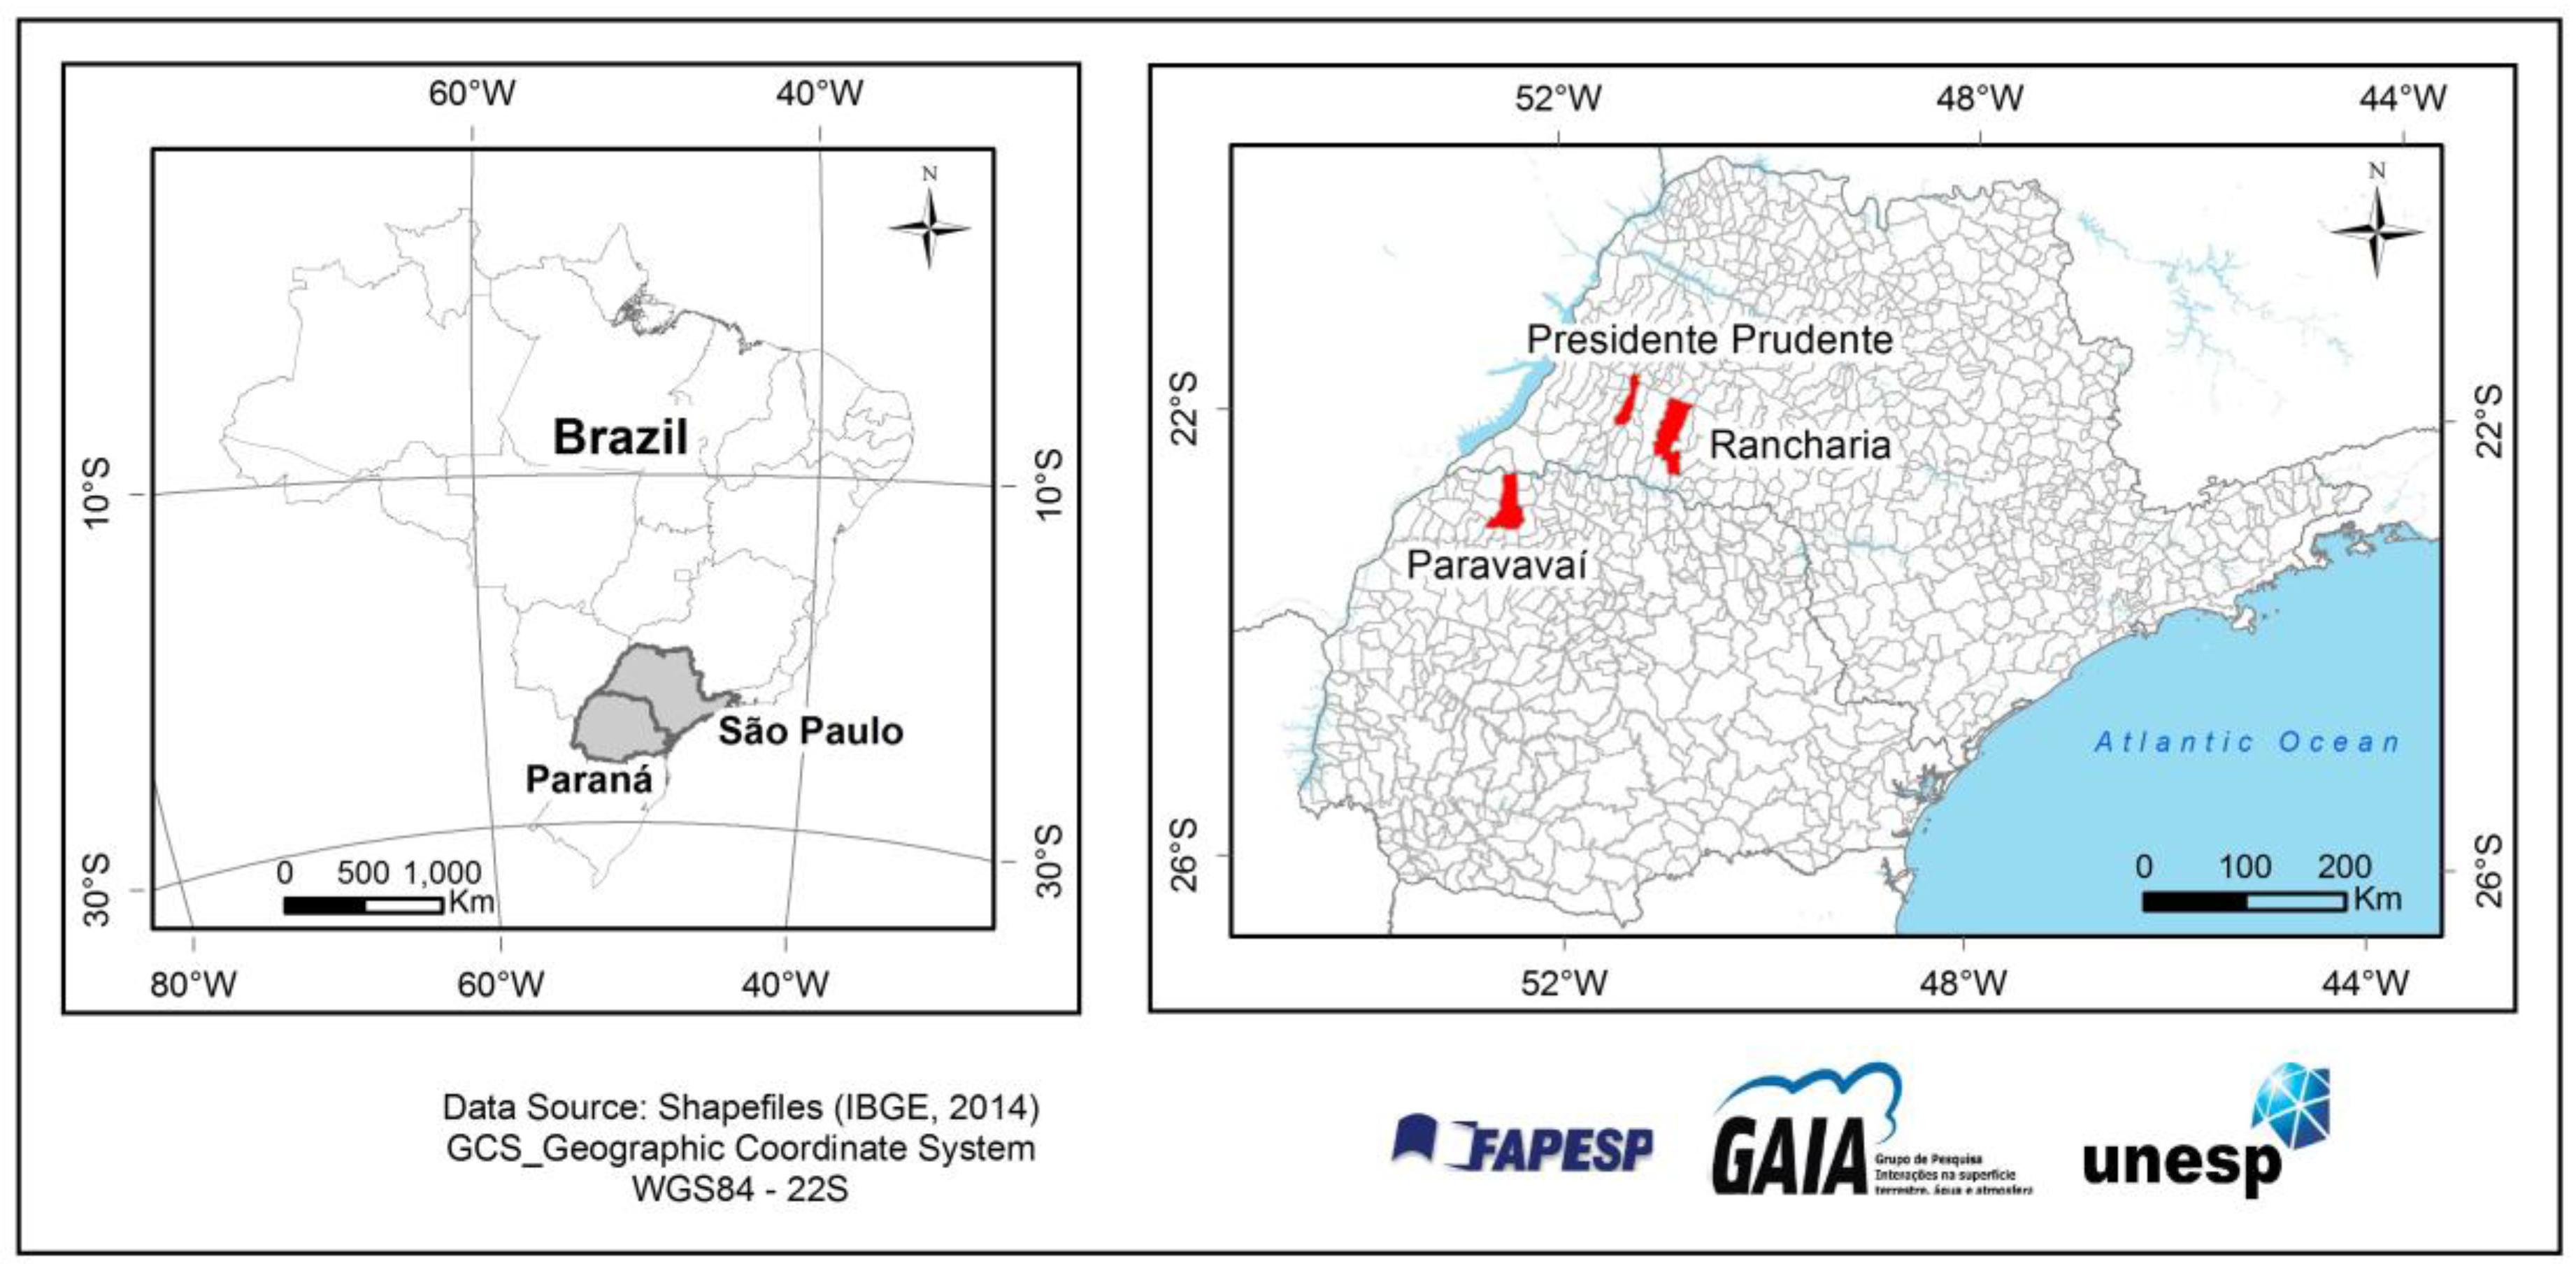
2.1. Study Areas

Paranavaí is a medium-sized city in the Northwest region of Paraná State (Figure 1). The city is approximately 530 m above sea level, and according to the Brazilian Institute of Geography and Statistics (IBGE) [21], Paranavaí has an estimated population at 87,316, with nearly 90% of them residing in urban areas, which correspond to 41 km2.
The history of the city's occupation and colonization began in the 1930s. The colonization in the Northwest of Paraná was based on the construction of roads and small urban centers, such as the medium-sized cities of Maringá, Paranavaí, Cianorte, and Umuarama [22]. Even though the occupation of Paranavaí was initially planned, it subsequently followed housing market demand without adhering to the initial urban plan.
Both Rancharia and Presidente Prudente are in the Western region of São Paulo State (Figure 1). Rancharia is a small city at approximately 520 m above sea level, and its establishment was associated with the construction of the Sorocabana Railroad. Urban expansion occurred along the west and south. In the southeast, areas of high slopes were urbanized and occupied by low-income housing. Currently, almost 90% of the population (25,828) lives in the urban area [21].
Presidente Prudente is a medium-sized city at 470 m above mean sea level. Its population is estimated at 223,749 people [21], and most of them are living within the urban area (~ 60 km2) as well. The oldest neighborhoods were built between 1950 and 1970, and they correspond to densely built areas with trees scattered across streets and in residential yards. Residential areas built in the 1980s and 1990s have some scattered buildings, low plants, and trees. However, most of them are characterized by low-income housing with building materials that are not appropriate for the region’s climate and thermal comfort (i.e., thin walls and fiber cement roofs) [23,24].
The main types of air masses that affect these three cities are the Atlantic Tropical mass (aTm), the Continental Tropical mass (cTm), the Continental Equatorial mass (cEm), and the Atlantic Polar mass (aPm), among other atmospheric systems. The tropical air masses are associated with high temperatures during spring and summer, whereas extratropical systems, such as frontal systems (FS) and aPm in autumn and winter cause temperatures to drop. Generally, the climate of the cities is warm and wet from October to March, but milder and drier from April to September, when temperatures decrease with the advance of polar masses throughout the region [25].

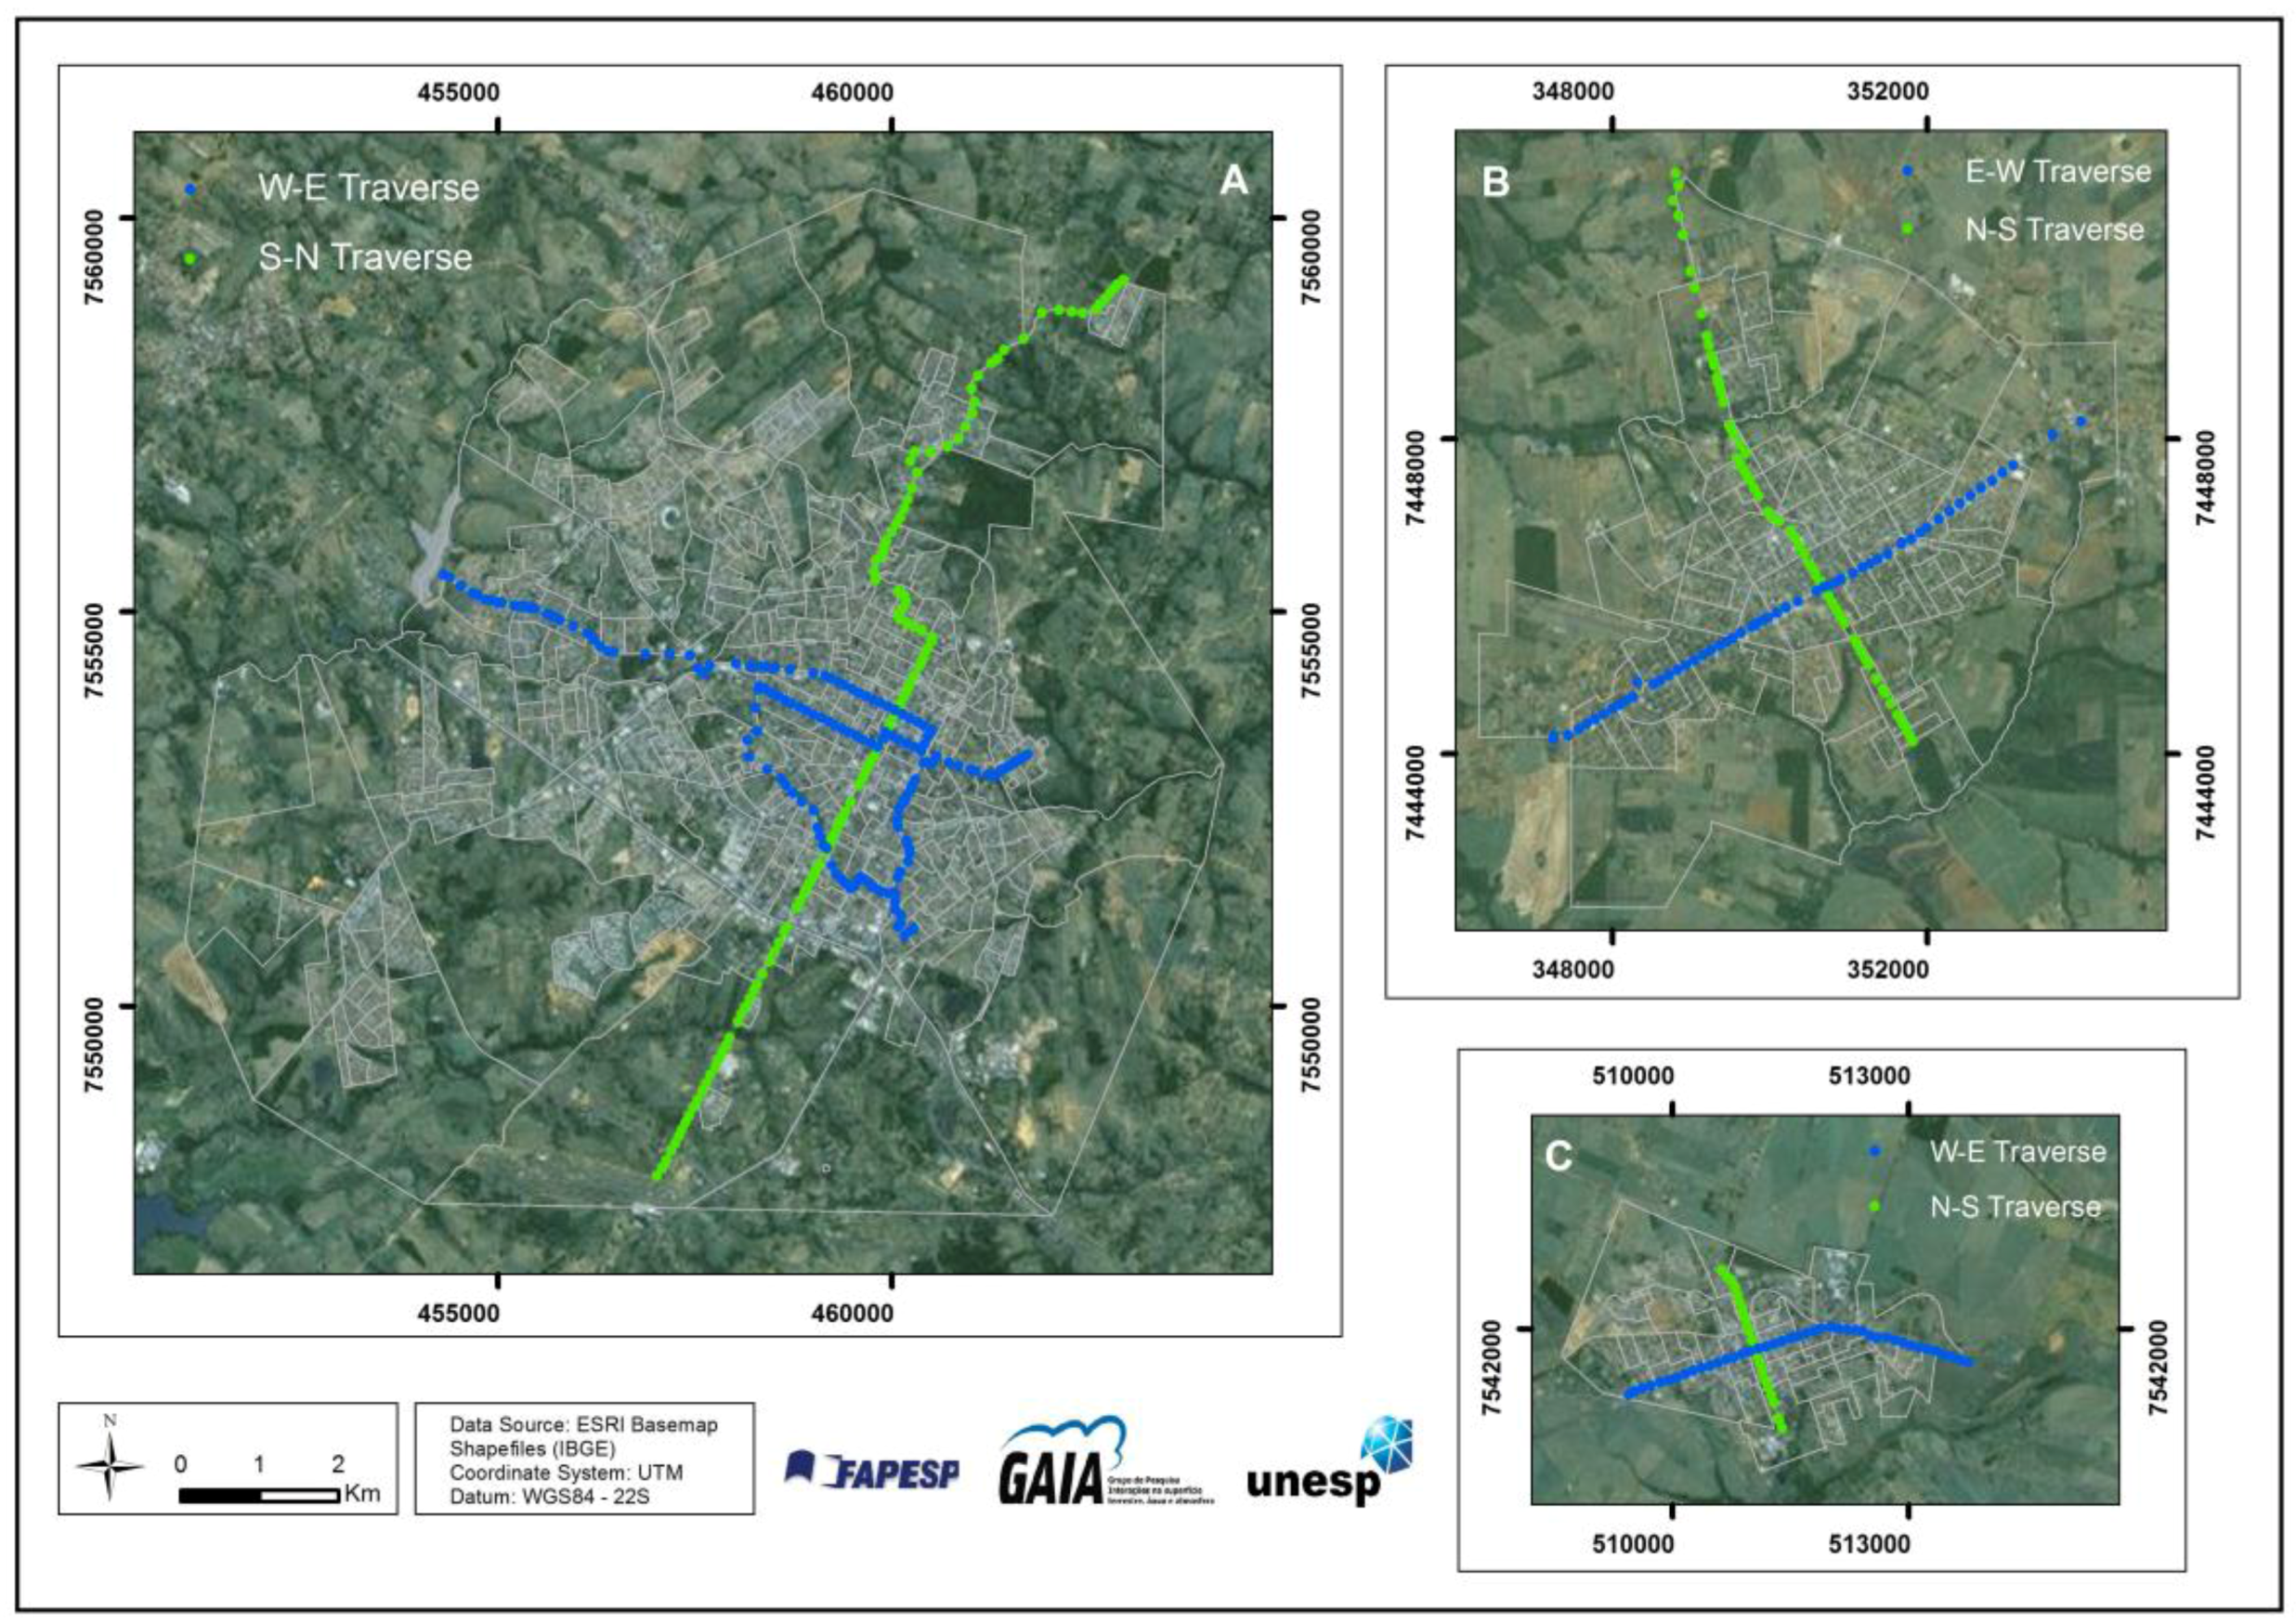
2.2. Measuring UHIs in Small- and Mid-Sized Cities

Heat islands are defined by easily measurable parameters, and various studies on urban climate have reported UHIs in Brazil [18,23,24,26,27,28,29]. Typically, air temperatures are measured using either thermometers via mobile surveys or a stationary network of sensors. However, because of the financial difficulties in maintaining a network of meteorological stations in and around medium- and small-sized cities, using fixed-point stations for short periods, and mobile measurements across a city has been found to be efficient for assessing urban heat islands in Brazil [30].
Mobile surveys have been extensively used in detecting UHIs in urban and rural areas [6,13,31]. The routes may be linear or circuitous and provide a dense sample of temperatures in a relatively short period of time. When using automobiles during this type of surveys, the sensors can be placed on top of the cars or attached to the side of the vehicle, ~1.8 m above the ground, to minimize the effect of the engine heat on the measured temperatures. The recommended average vehicle speed is 30 km h−1, and traverses are conducted a few hours after sunset, on evenings with light winds and clear sky because, then, micro and local climate differences are maximized [18,32,33,34,35].
To assess UHIs in Paranavaí, Rancharia, and Presidente Prudente, mobile surveys were conducted after sunset during summer (December–January) evenings to gather temperatures from different traverse routes (Figure 2). The measurements were performed using digital thermohygrometers (model 7664.01.0.00 in Paranavaí and Presidente Prudente, and model TH-03B in Rancharia, with precision of ±0.1 °C), fixed on a 1.5-meter-long wooden rod attached to the side of the vehicle.
Data gathering involved two traverse modes. Only one car was used to cover the routes in approximately 1 h in both Paranavaí and Rancharia. The route in Paranavaí was 8 km long from east to west and 8.3 km long from north to south. In Rancharia, the west–east traverse was 4.6 km and the north–south traverse was 2.2 km. Two vehicles were simultaneously used in Presidente Prudente to complete the west–east (18.3 km) and south–north (14.8 km) traverses, which took approximately 1 h.
The automobile surveys measured air temperatures at 118 sites in Paranavaí, 65 in Rancharia, and 275 in Presidente Prudente (average distance of ~100 m between points). The cities’ UHI magnitudes were calculated for each day of the traverses to facilitate analysis (Section 3.1).
Average temperatures were then computed for each city individually. The average minimum temperature was subtracted from the other values registered through the traverses to obtain the summer average UHI magnitudes. The average UHI magnitudes were plotted as a function of the elevation profile of each city to depict the temperature differences along the traverses (Section 3.2).

3. Results and Discussion

3.1. UHIs and Synoptic Conditions

Urban heat islands (UHIs) have been documented for over a century and their formation is associated with changes in the Earth’s surface and atmosphere caused by urbanization [1,36,37,38,39,40,41,42]. A combination of factors, such as the removal of vegetation, thermal and physical properties of construction materials, building morphology, surface roughness, and anthropogenic heat sources, modifies the local energy and water balances, leading to increases in atmospheric temperature in cities compared to their surroundings [1,3,5,42,43].
Urban heat islands are subsurface, surface, and atmospheric types, with the third being the most typical. Considering heat islands in the atmosphere, two types are distinguished [1,44]. The canopy-layer urban heat island (CLHI) occurs close to the surface in cities and extends to approximately the mean building height. Microscale processes govern the UHI climate, and this concerns geographers and climatologists because it affects the spaces where human activities take place every day [3,45]. Above the CLHI lies the boundary-layer urban heat island, which is governed by local or mesoscale processes and refers to that portion of the planetary boundary layer whose characteristics are affected by an urban area.
The magnitude or intensity of the UHI is traditionally defined as the temperature difference between urban and rural areas (∆Tu-r) [43]. According to previous studies [9,17,39,42,45], synoptic conditions strongly exert control on the heat island magnitude, which is pronounced at night when the sky is cloudless and the winds are weak. In addition, the prevailing weather conditions during heat island measurements, as well as antecedent conditions leading up to a heat island event, strongly affect the observed temperature differences between urban and rural sites [45].
Since synoptic weather conditions greatly affect the UHI magnitude, we selected data from three cities in the countryside of Brazil where mobile traverses were performed during summer evenings. Table 1, Table 2 and Table 3 list the nocturnal UHI magnitudes in Paranavaí, Rancharia, and Presidente Prudente as a function of wind speed and direction, and atmospheric systems.
In Paranavaí (Table 1), the traverses were carried out in January 2014 (five nights), when the city was under the influence of the Atlantic Tropical mass (aTm). With the aging of the aTm owing to its displacement toward the interior of the continent, the air becomes hotter and drier, and the weather conditions stabilize. Under these conditions and without precipitation, the urban heat island magnitudes in the city ranged from 2.3 °C to 5.5 °C, with higher values when the wind speed was below 1 ms−1 (January 29 and 30).
The field campaigns in Rancharia also occurred during five nights in January 2014 (Table 2). It rained two days before the measurements (50 mm), but the greatest urban heat island magnitudes were associated with atmospheric stability, which was governed by light winds and no precipitation.
The phenomenon of urban heat island was intensified when Rancharia was affected by both the modified Atlantic Polar mass (aPm) and Atlantic Tropical mass (aTm). As the aPm, a high-pressure system that causes atmospheric stability, moves toward the continental area, it becomes hot owing to the region’s low latitude. Even highly modified, the polar mass (January 19), together with the aTm (January 29), provided calm conditions that highlighted the temperature differences.
The measurements in Presidente Prudente were carried out in December 2013, and because of atmospheric instability, we were not able to perform the mobile traverses under completely calm conditions. On the other hand, the minimum UHI magnitude verified during all field campaigns was 3.5 °C and the maximum 6 °C (Table 3). These values are significant for a mid-sized city, considering that even after an episode of atmospheric instability and precipitation (57 mm on December 14), the temperature difference recorded on the next day reached 3.5 °C [48].
Besides gathering temperatures during the summer, the nocturnal UHIs of the cities were maximized under clear skies and light winds, defined as <3 m s−1 by Oke and Maxwell [6], with moderate to strong magnitudes [2].
The differences registered in Paranavaí and Presidente Prudente exceeded 5 °C and agree well with previous work for medium-sized cities elsewhere. For instance, Unger [49] found temperature differences of approximately 4 °C during clear and windless nights in Szeged, Hungary, and for winds equal or inferior to 3 m s−1, and Balkestahl et al. [50] verified the occurrence of heat islands in Oporto, Portugal, with temperature differences up to 7 °C.
In smaller cities, a similar correspondence between the UHI magnitudes in Rancharia and those in Oke [31] were found during a survey along the St. Lawrence Lowland region in the Province of Quebec, Canada. Based on four traverses in the summer, the magnitudes varied from 2.3 °C to 5.2 °C in Saint-Hubert, and from 3.8 °C to 6 °C in Saint-Hyacinthe, whereas in Rancharia they varied from 2.2 °C to 4.7 °C.

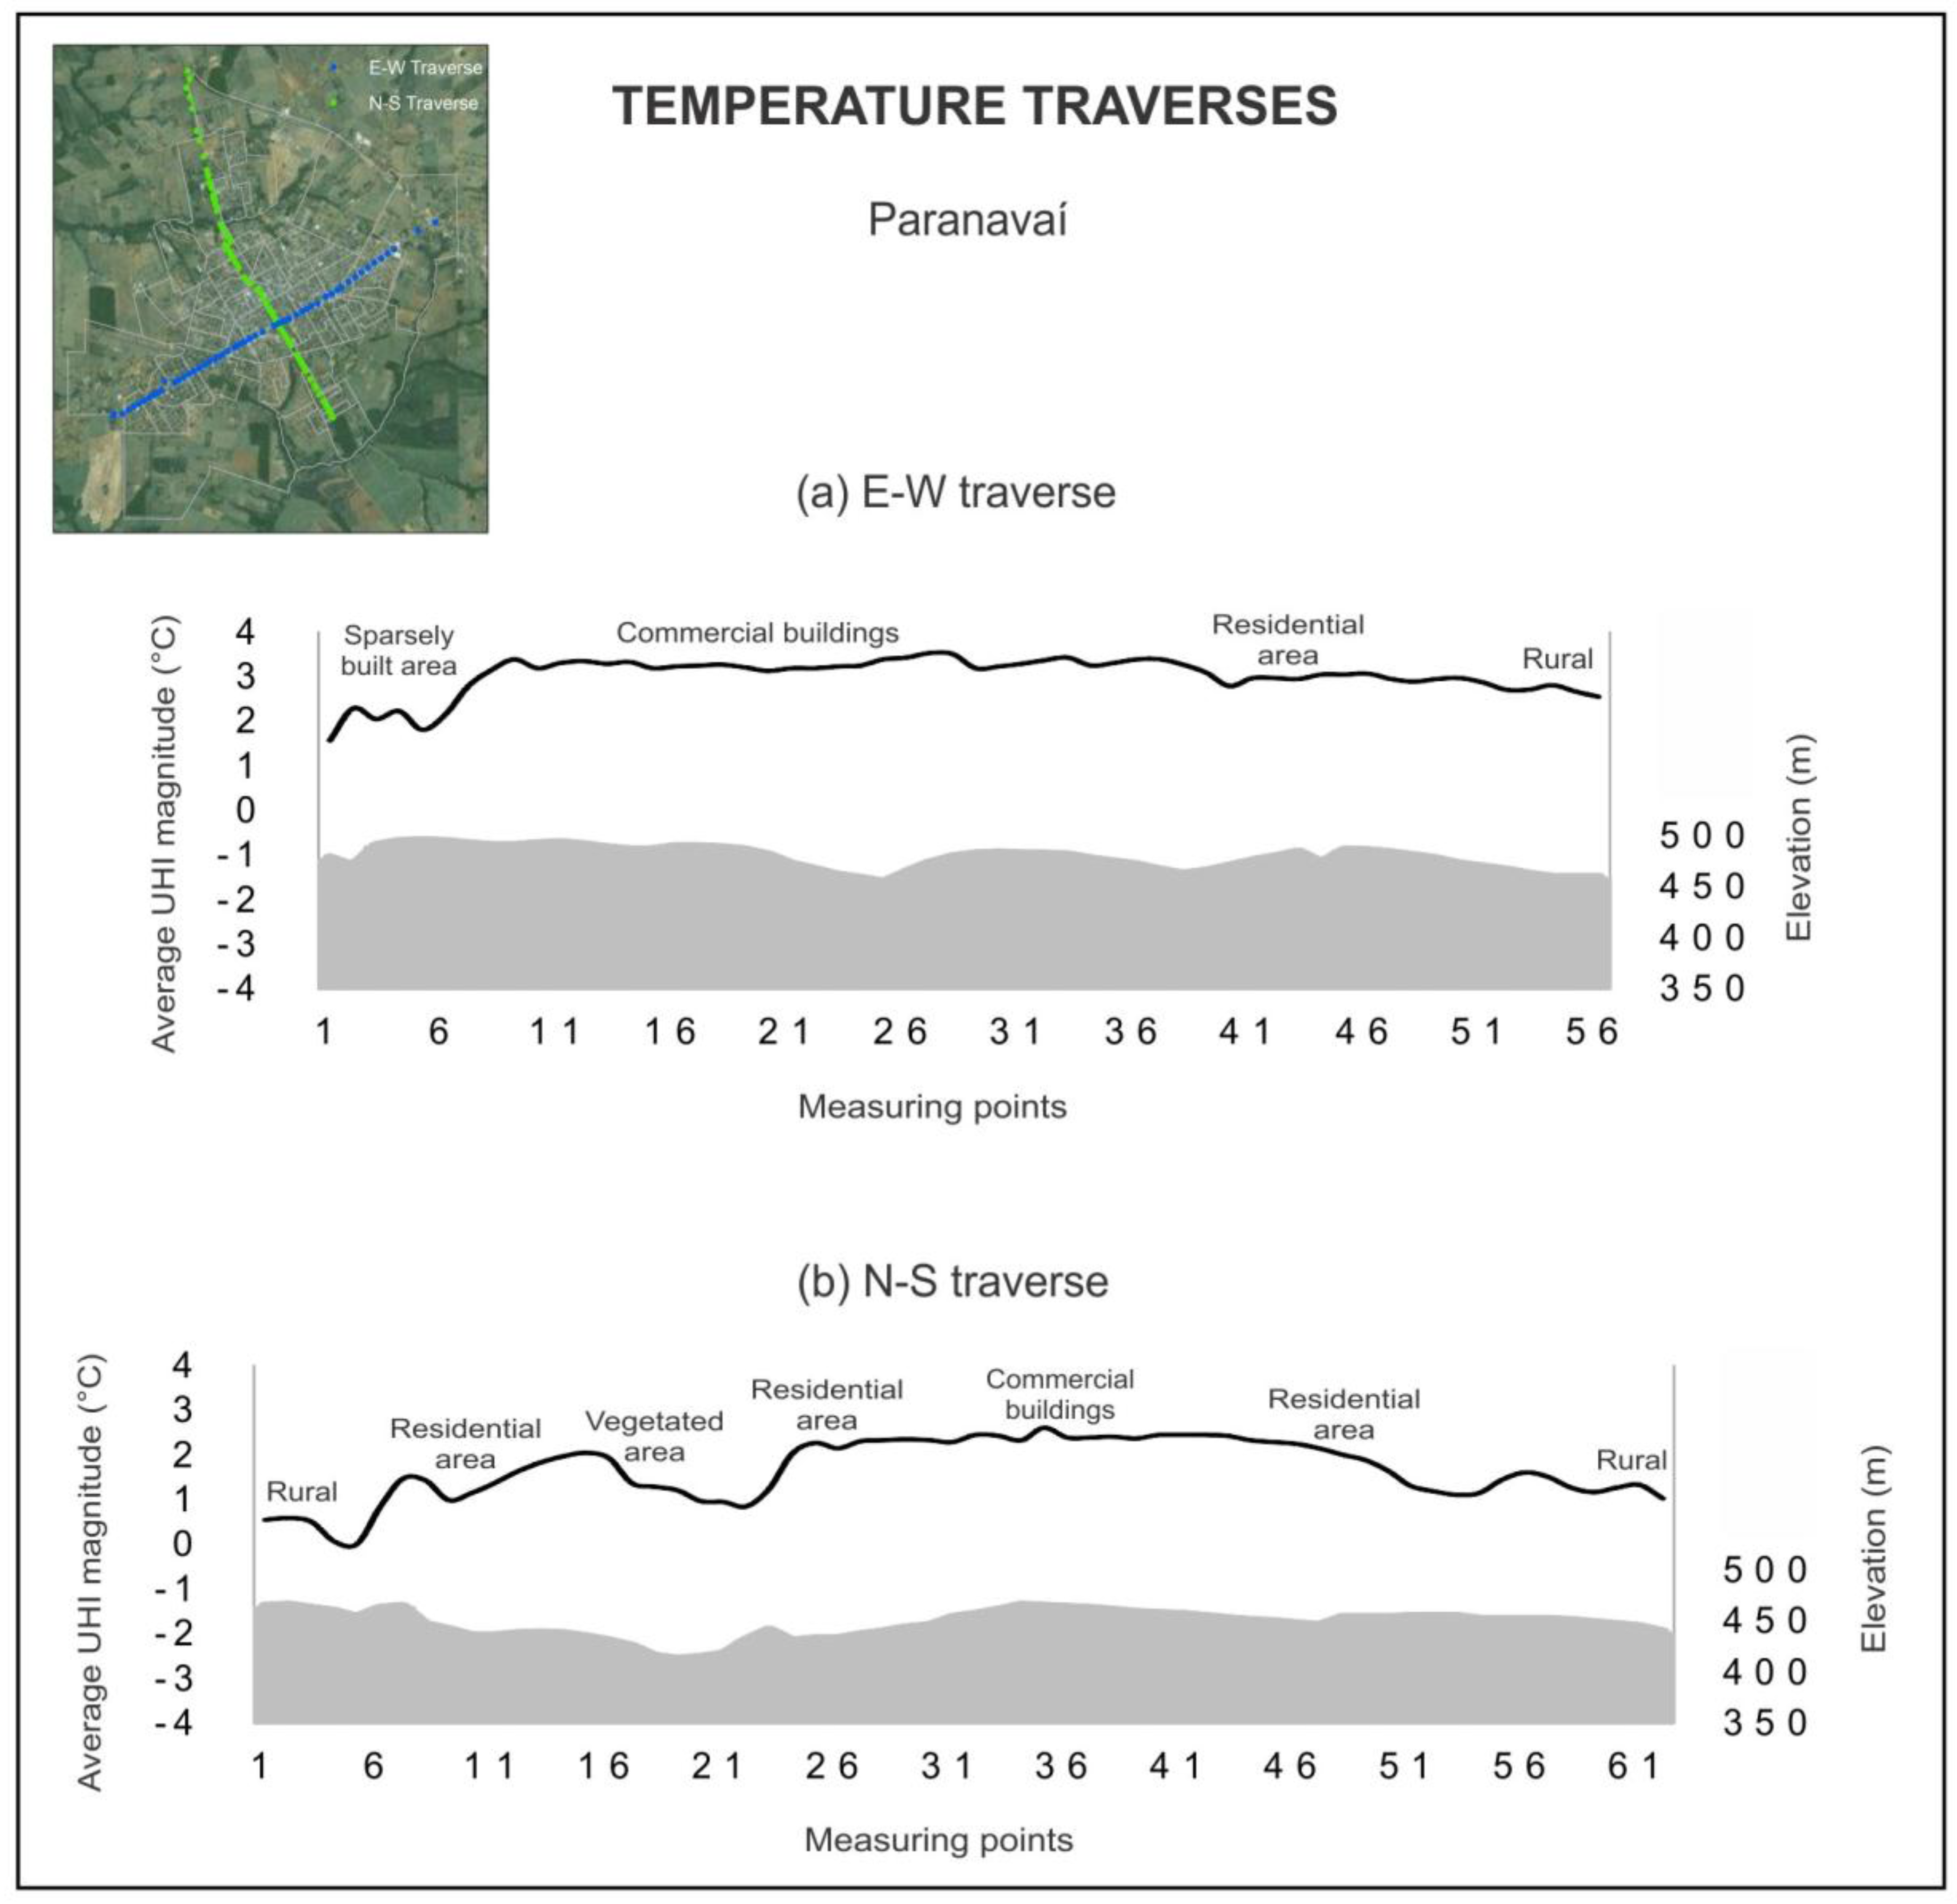
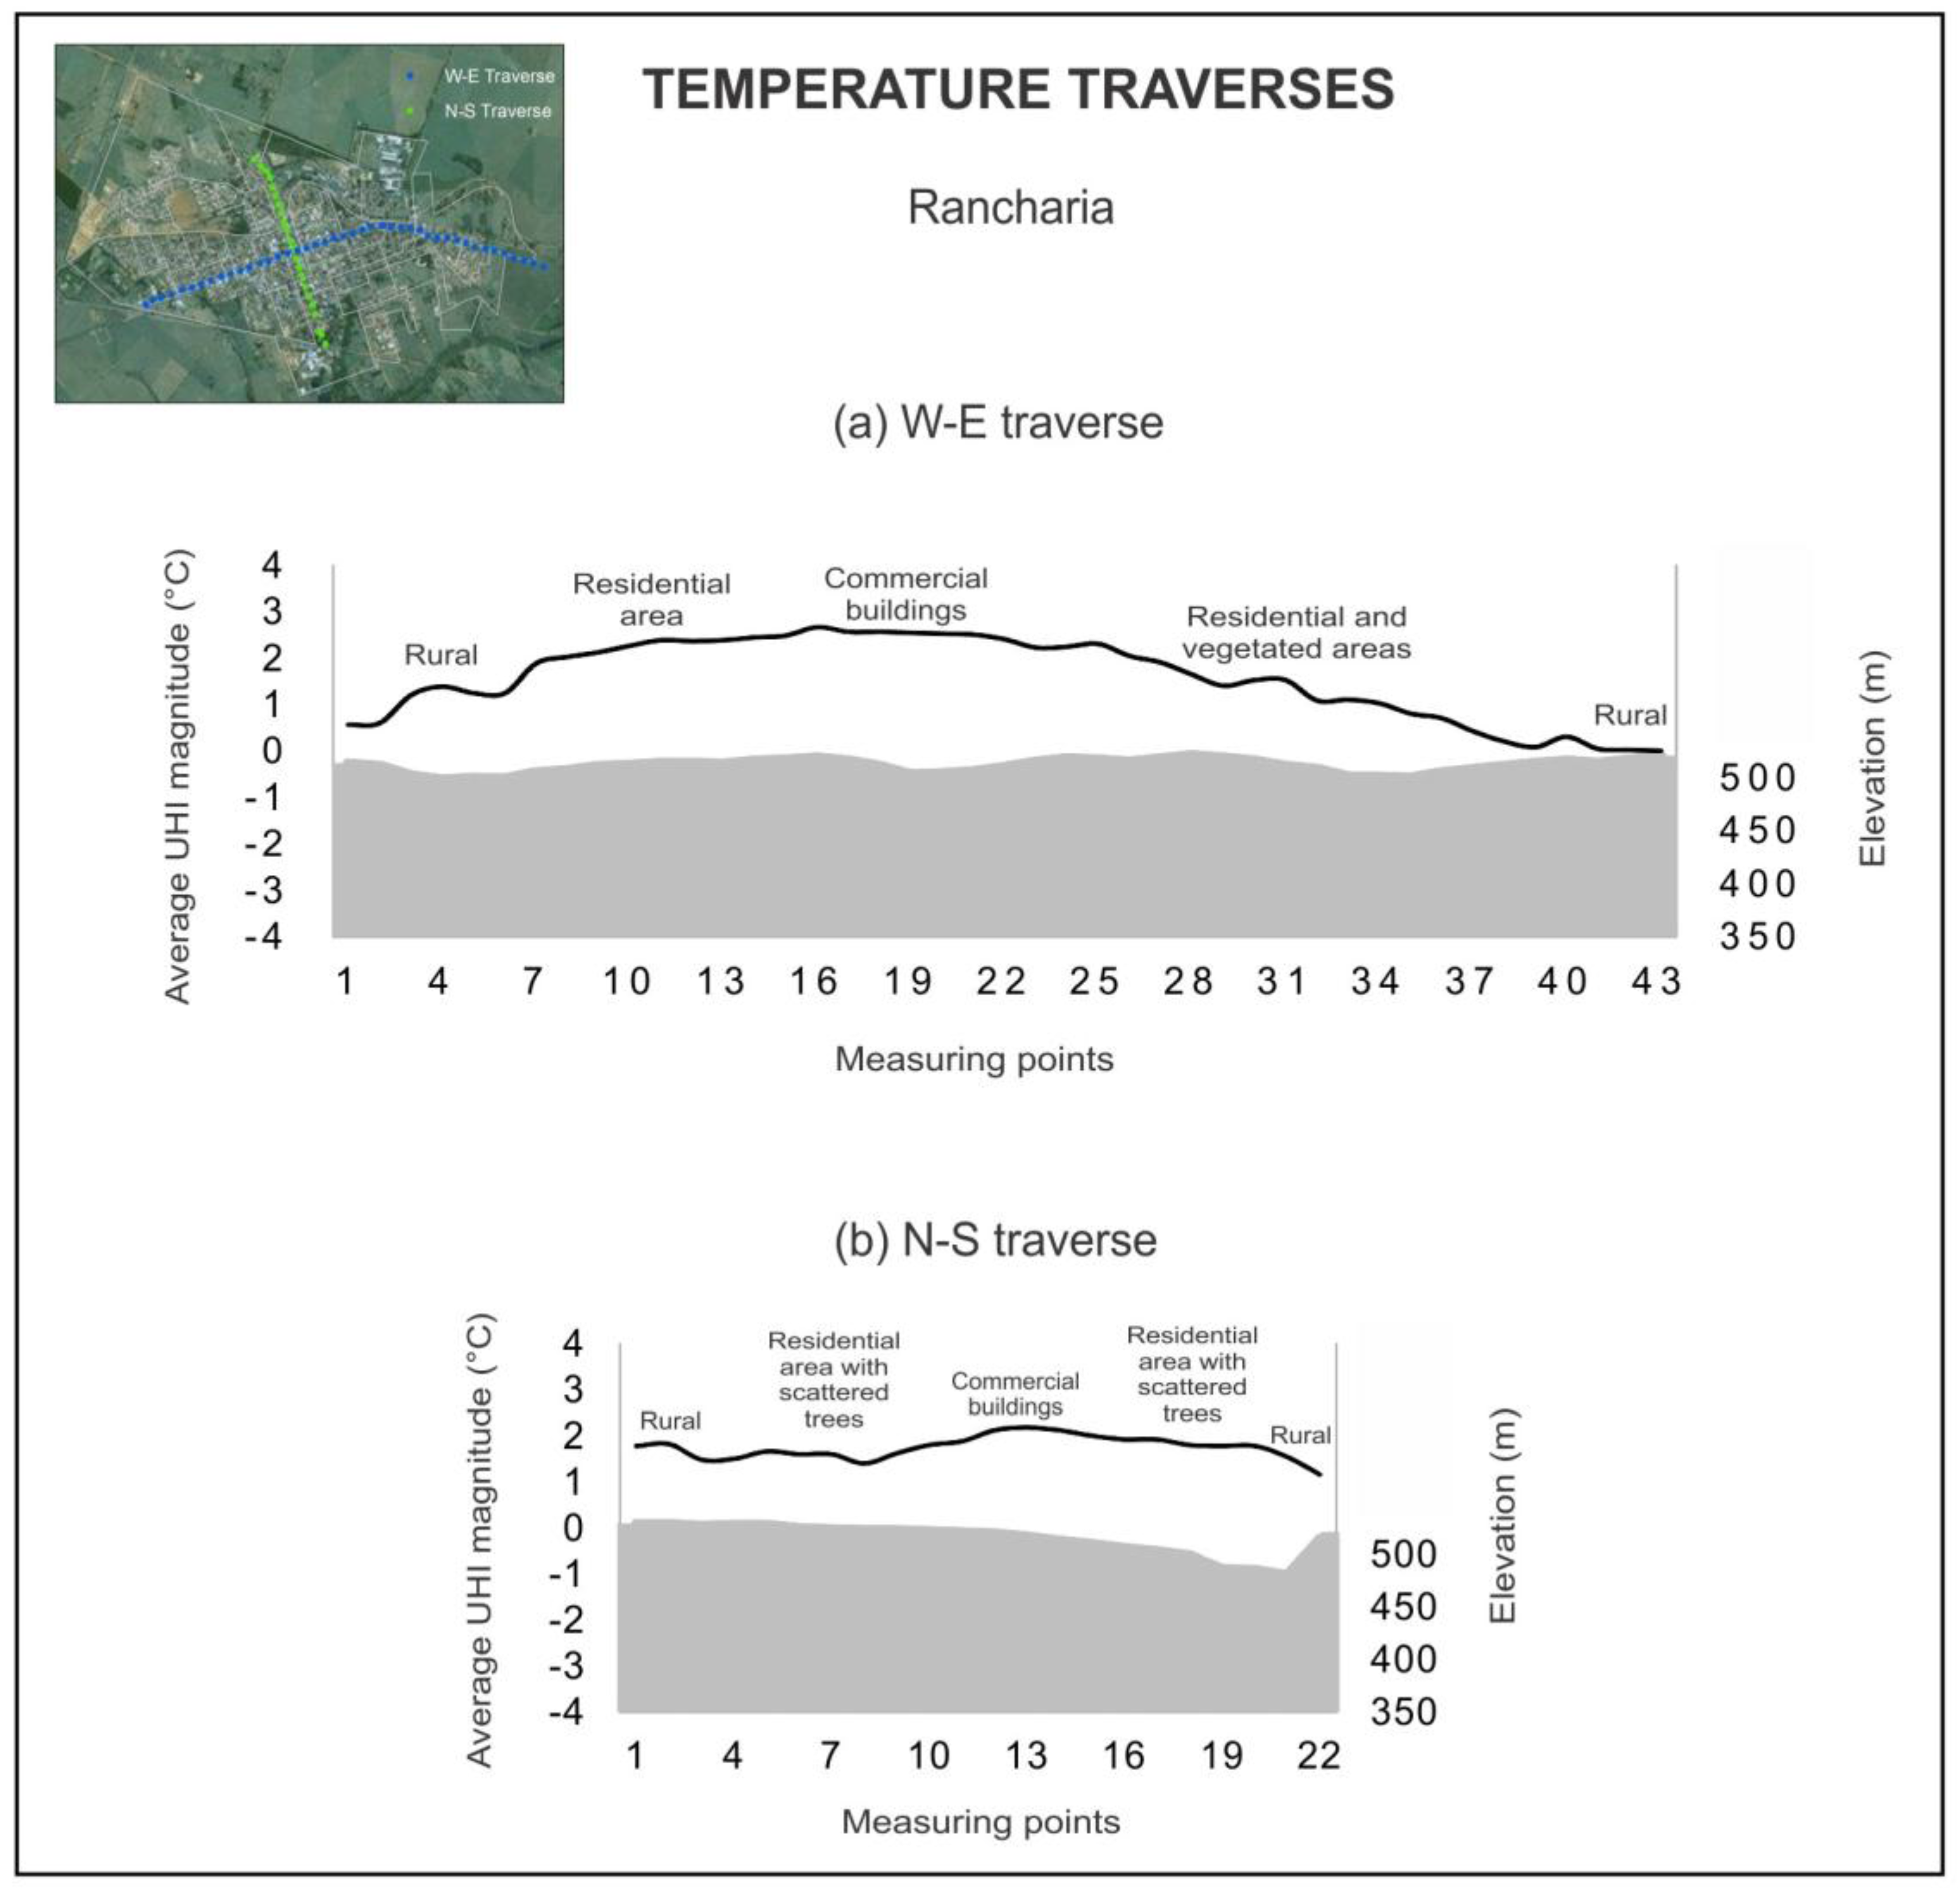
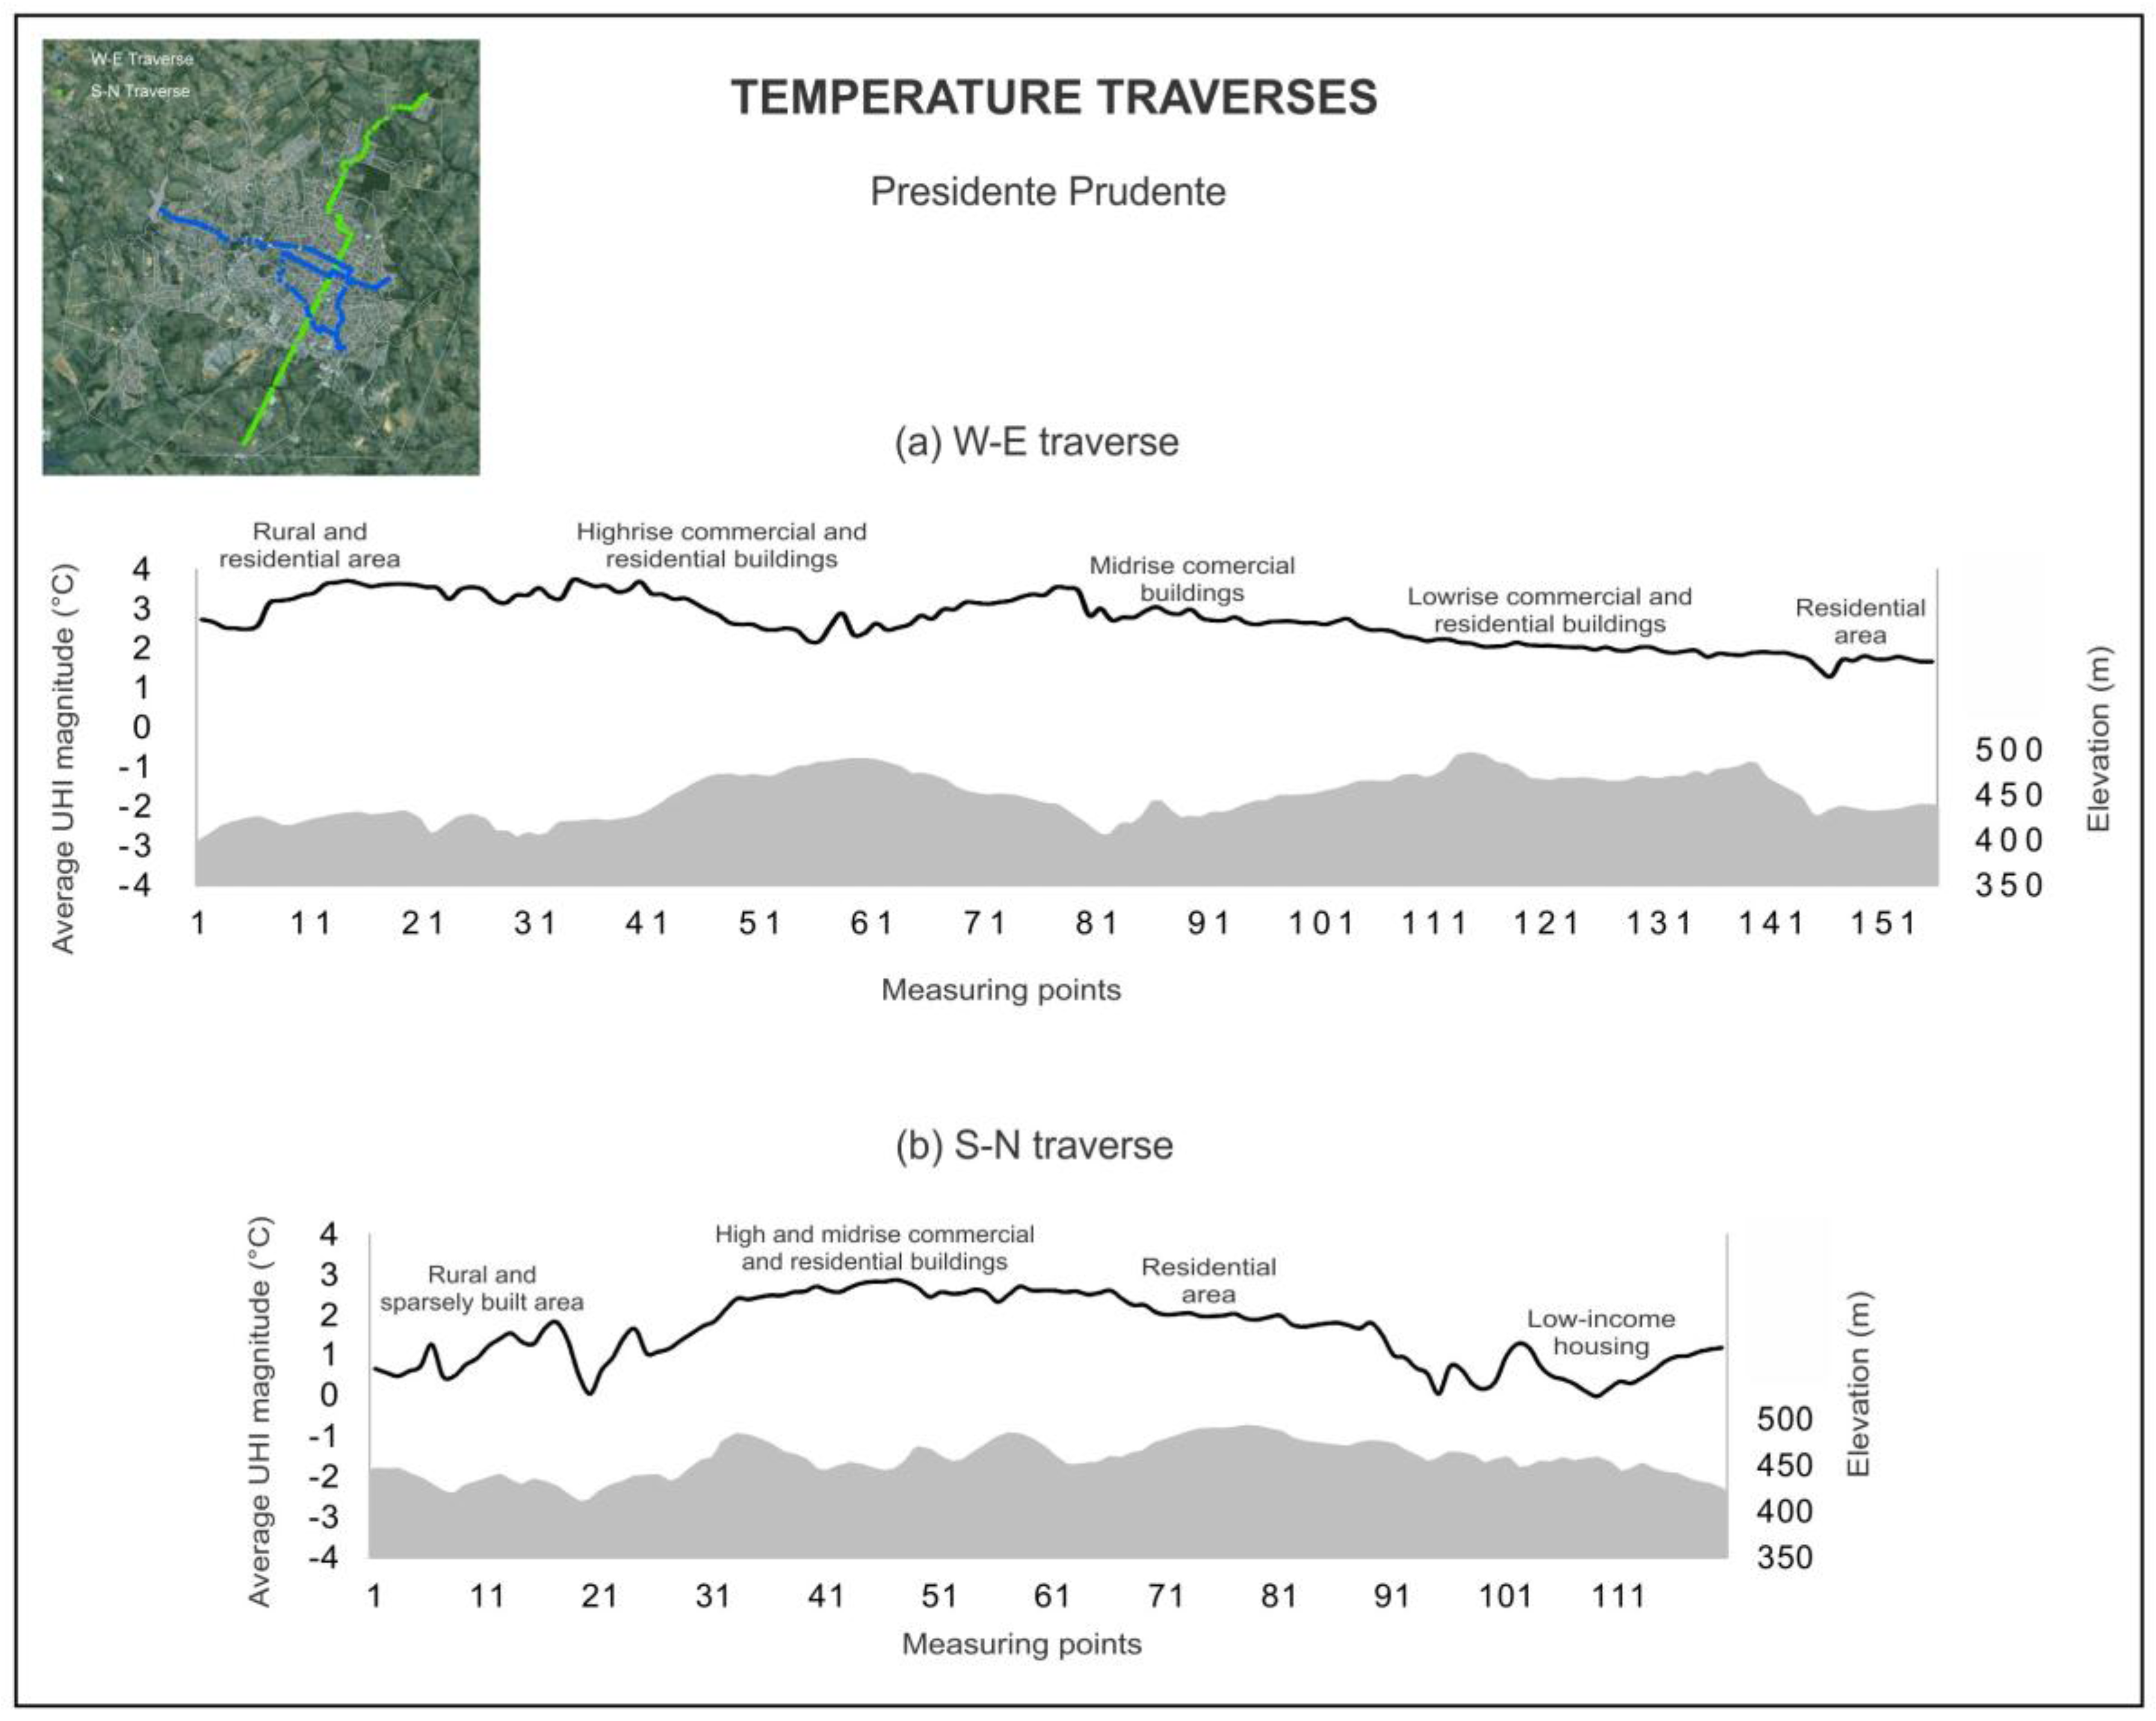
3.2. Urban Morphology, Land Cover, and UHI Magnitude

It has already been shown that cities can significantly alter the natural surface conditions and atmospheric properties, resulting in different heating patterns within urban areas [40,43,51]. Moreover, there is a strong relation between land cover and temperature, especially regarding vegetation and built density [1,35,52,53], which allows inferring that different types of land cover within each city can affect the spatial pattern of its UHI [3].
Based on land cover materials and built densities, Oke [1] organized the classic heat island profile. According to the physical properties of the materials, thermal conductivity, and heat capacity, the materials with higher thermal conductivity conduct heat to their interior easier, whereas materials with high heat capacity store more heat and, as more heat is retained, the temperature of the material increases.
Normally, the distribution of temperature depends on the urban arrangement. The classic urban heat island described by Oke [1] is characterized by high thermal gradient at the urban–rural boundary, followed by a gradual rise in temperature toward the city's core; that is, the closer to downtown (high built density, commercial areas, less vegetation) an area is, the higher the temperature is, whereas the farther away from downtown (fewer buildings and more vegetation) an area is, the lower the temperature is.
Nevertheless, a different pattern has been identified throughout small- and medium-sized cities in Brazil, where neighborhoods far from the urban core show higher temperatures [18,23,54,55,56]. Surface heterogeneities are associated with the formation of one or more heat islands that are not necessarily located in the old core. To determine whether a similar pattern occurs in Paranavaí, Rancharia, and Presidente Prudente, summer average UHI magnitudes were analyzed.
As mentioned above, these cities have different population sizes and present different forms of urbanization; nonetheless, the temperature distribution pattern was very similar in all of them. As Figure 3, Figure 4 and Figure 5 show, the UHIs with the highest magnitudes were clearly related to the density, whereas the lowest ones were in areas with fewer buildings and greater vegetation cover.
In Paranavaí (Figure 3a), the east–west route was characterized by low surface homogeneity, considering that there were no big variations in building morphology, land cover, or surface relief. The main steep temperature gradient was verified at the very beginning of this traverse, where there was a sparsely built area. The predominance of commercial buildings was responsible for the highest UHI magnitude (3.5 °C) and the magnitude just started to decrease when the traverse passed residential and rural sites, with more open areas and vegetation.
The north–south traverse (Figure 3b) showed greater heterogeneity in surface morphology and land cover, with an elevation difference of 55 m between the highest and lowest points along the traverse. These characteristics increased the variability along the profile and lowered the UHI magnitudes compared to the east–west traverse. The lowest magnitude in both traverses was found along this route, near a densely-vegetated area, whereas the peak of the heat island (2.6 °C) was detected in the commercial area of the city.
In Rancharia (Figure 4), the classic center–periphery heating pattern was identified, with greater values along densely built areas. The urban density and the presence of tree cover were mainly responsible for the UHI magnitude variations.
Along the first route (west–east), the heating from the rural area to commercial buildings downtown was significant, and it can be related to changes in urban morphology (Figure 4a). The UHI reached maximum magnitude (2.7 °C) at the urban core, corresponding with the locations of the commercial buildings. Moving forward, the magnitude decreased as the land cover changed from residential to rural areas.
The north–south traverse (Figure 4b) showed a similar pattern, although the magnitudes were smaller. The highest value was 2.2 °C and was again found among commercial buildings. Residential areas with scattered trees had magnitudes below 2 °C, followed by rural sites at the end of the traverse, where dense trees and lower elevations were associated with decreasing temperatures.
Along the west–east traverse in Presidente Prudente (Figure 5a), the temperature profile frequently varied. At the beginning of the traverse, rural with little vegetation areas and residential areas had a magnitude of 2.7 °C, moving forward the magnitude varied between 3 °C and 3.7 °C. Besides crossing an area with high and midrise commercial and residential buildings, the trees at the urban core were responsible for low magnitudes. Leaving this area, the temperature decreased again when passing by a valley bottom with few trees and low plants.
The UHI magnitude increased once more across midrise commercial buildings (up to 2.7 °C). When getting into a neighborhood with low-rise commercial and residential buildings, the temperature decreased from 2.2 °C to 1.9 °C. Reaching the end of the traverse, the magnitude was 1.3 °C at a vegetated valley bottom and rose to 1.8 °C in the last residential area.
The south–north traverse (Figure 5b) was similar with the classic UHI pattern. High magnitudes up to 2.9 °C were identified in areas with high and midrise commercial and residential buildings, whereas the lowest values were found at the extremes of the route.
At the beginning of this traverse, the temperatures were up to 1.8 °C along rural (predominance of tree and low plants cover) and sparsely built areas and rose above 2 °C when crossing densely built areas. From closely spaced buildings toward a residential area with scattered trees, the UHI magnitudes varied from 2.6 °C to 1.7 °C. Passing low-income housings, where buildings were in compact arrangement but scattered trees and abundant plant cover predominated in the surroundings, the temperatures decreased, and the magnitudes were less than 1.2 °C.
The temperature profiles in this section showed how intraurban temperature patterns and UHI magnitudes vary along different surface characteristics. Besides the classic UHI profile [1], the cities’ new arrangements were more heterogeneous, leading to different patterns of increasing temperatures within the urban area, as in Presidente Prudente.
Compared to other studies [57,58], the UHI magnitudes from traverse data and the type of urban morphology and land cover were correlated. For instance, in Nagano, Japan, densely built areas with tall buildings were 3 °C warmer than areas with low plants and open-set trees [57]. At our traverses, a total difference of 3.5 °C (Paranavaí) and 3.7 °C (Presidente Prudente) separated the warmest and the coolest areas.
Lelovics et al. [59] used mobile measurements to examine thermal variations in Szeged, Hungary. The average UHI magnitudes derived here were consistent with their results, especially the ones for sparsely built areas, with magnitudes under 1 °C. Compact areas with midrise buildings were 4.2 °C higher than field sites with low plant cover. Based on our traverse data, the difference between the corresponding areas was, on average, 3.5 °C.
Regarding our findings in Rancharia, these are similar to those reported by Doyle and Hawkins [16] for the small urban area of Shippensburg, Pennsylvania. The average difference between the most urban and most rural areas in Shippensburg was 1.9 °C, whereas the average UHI magnitudes in this study suggest that urban areas were up to 2.7 °C warmer than rural.

4. Conclusions

Although urban areas cover only a small fraction of the Earth’s surface, their effects on local climate are large and increasing, especially regarding the development of urban heat islands within cities of different sizes. Furthermore, the inhabitants cannot always counterbalance the warmer conditions in the cities and this makes them increasingly vulnerable to heat waves or other extreme conditions. Thus, it is crucial to investigate the main factors behind the formation of heat islands and insight into mitigation strategies [5].
Assessing UHIs involves several procedures (measurement variables, time and scale definition, instruments, data collection, reporting, etc.); moreover, the magnitude of impact is strongly affected by synoptic conditions, especially precipitation, cloudiness, and wind. In this study, we show the relationship between atmospheric stability and heat islands in tropical cities, where the temperature differences are pronounced under calm conditions.
Urban morphology and land cover are important to the formation of UHIs in Paranavaí, Rancharia, and Presidente Prudente. By analyzing the temperature profiles of the cities, we verified the role of built density in increasing the UHI magnitudes, whereas vegetation is directly related to lower temperatures. Although high magnitudes are identified in densely built areas, the effects of surface relief on lowering the city temperatures are noteworthy, especially when traversing vegetated valleys.
The UHI magnitudes depend on the method of reporting [43]. For example, the average UHI magnitude was up to 2.7 °C in Rancharia, 3.5 °C in Paranavaí, and 3.7 °C in Presidente Prudente for five summer nights (December 2013–January 2014). In contrast, using daily data from the traverses, magnitudes were 4.7 °C, 5.5 °C, and 6 °C, respectively.
Tropical cities are constantly warm and sunny, and the heat islands can intensify the thermal discomfort in urban areas. Therefore, the urban climate of small- and medium-sized cities in the tropics needs to be studied. As urban areas are growing, knowing where UHIs are going to happen and what affects their magnitude will allow for better urban design and planning methods.

Acknowledgments

The authors thank the São Paulo Research Foundation (FAPESP) for the financial support, grants 2013/02057-0, 2013/02056-3, and 2013/02081-8.

Author Contributions

The authors contributed equally to this work.

Conflicts of Interest

The authors declare no conflict of interest. The founding sponsor had no role in the design of the study; in the collection, analyses, or interpretation of data; in the writing of the manuscript, and in the decision to publish the results.

References

  1. Oke, T.R. Boundary Layer Climates, 2nd ed.; Methuen and Co.: New York, NY, USA, 1987; pp. 262–303. [Google Scholar]
  2. García, F.F. Manual de Climatologia Aplicada: Clima, Medio Ambiente y Planificación, 1st ed.; Editorial Síntesis: Madrid, España, 1995. [Google Scholar]
  3. Yow, D.M. Urban heat islands: Observations, impacts and adaptation. Geogr. Compass 2007, 1, 1227–1251. [Google Scholar] [CrossRef]
  4. Souch, C.; Grimmond, S. Applied climatology: Urban climate. Prog. Phys. Geogr. 2006, 30, 270–279. [Google Scholar] [CrossRef]
  5. Grimmond, S. Urbanization and global environmental change: Local effects of urban warming. Geogr. J. 2007, 173, 83–88. [Google Scholar] [CrossRef]
  6. Oke, T.R.; Maxwell, G.B. Urban heat island dynamics in Montreal and Vancouver. Atmos. Environ. 1975, 9, 191–200. [Google Scholar] [CrossRef]
  7. Graham, E. The urban heat island of Dublin city during the summer months. J. Ir. Geogr. 1993, 26, 45–57. [Google Scholar] [CrossRef]
  8. Tso, C.P. A survey of urban heat island studies in two tropical cities. Atmos. Environ. 1996, 30, 507–519. [Google Scholar] [CrossRef]
  9. Kim, Y.; Baik, J. Maximum urban heat island intensity in Seoul. J. Appl. Meteor. 2002, 41, 651–659. [Google Scholar] [CrossRef]
  10. Hart, M.; Sailor, D.J. Assessing causes in spatial variability in urban heat island magnitude. In Proceedings of the Seventh Symposium on the Urban Environment, San Diego, CA, USA, 10–13 September 2007.
  11. Coutts, A.M.; Beringer, J.; Tapper, N.J. Impact of increasing urban density on local climate: Spatial and temporal variations in the surface energy balance in Melbourne, Australia. J. Appl. Meteor. Climatol. 2007, 46, 477–493. [Google Scholar] [CrossRef]
  12. Holt, T.; Pullen, J. Urban canopy modeling of the New York City metropolitan area: A comparison and validation of single- and multilayer parameterizations. Mon. Wea. Rev. 2007, 135, 1906–1930. [Google Scholar] [CrossRef]
  13. Kopec, R. Further observations of the urban heat island in a small city. Bull. Amer. Meteor. Soc. 1970, 51, 602–606. [Google Scholar] [CrossRef]
  14. Duckworth, F.S.; Sandberg, J.S. The effect of cities upon horizontal and vertical temperature gradients. Bull. Am. Meteor. Soc. 1954, 35, 198–207. [Google Scholar]
  15. Hutcheon, R.J.; Johnson, R.H.; Lowry, W.P.; Black, C.H.; Hadley, D. Observations of the urban heat island in a small city. Bull. Am. Meteorol. Soc. 1967, 48, 7–9. [Google Scholar]
  16. Doyle, D.; Hawkins, T. Assessing a small summer urban heat island in rural south central Pennsylvania. Geogr. Bull. 2008, 49, 65–76. [Google Scholar]
  17. Roth, M. Urban heat islands. In Handbook of Environmental Fluid Dynamics: Systems, Pollution, Modeling, and Measurements, 1st ed.; Fernando, H.J.S., Ed.; CRC Press/Taylor & Francis Group: Boca Raton, FL, USA, 2012; Volume 2, pp. 143–159. [Google Scholar]
  18. Amorim, M.C.C.T. Intensidade e forma da ilha de calor urbana em Presidente Prudente/SP. Geosul 2005, 20, 65–82. [Google Scholar]
  19. Gartland, L. Ilhas de Calor: Como Mitigar Zonas de Calor em Áreas Urbanas; 1st ed.; Oficina de Textos: São Paulo, Brazil, 2010. [Google Scholar]
  20. Mendonça, F. Clima e Planejamento urbano em Londrina—Proposição metodológica e de intervenção urbana a partir do estudo do campo térmico. In Clima Urbano, 1st ed.; Monteiro, C.A.F., Mendonça, F., Eds.; Editora Contexto: São Paulo, Brasil, 2003; pp. 93–120. [Google Scholar]
  21. Cidades. IBGE. Available online: http://cidades.ibge.gov.br/v3/cidades/home-cidades (accessed on 23 November 2016).
  22. Passos, M.M. A Raia Divisória—Geosistema, Paisagem e Eco-História, 1st ed.; EDUEM: Maringá, Brasil, 2006. [Google Scholar]
  23. Amorim, M.C.C.T. O clima urbano de Presidente Prudente/SP. Ph.D. Thesis, Tese (Doutorado em Geografia) - Faculdade de Filosofia, Letras e Ciências Humanas, Universidade de São Paulo, São Paulo, Brazil, 2000. [Google Scholar]
  24. Amorim, M.C.C.T.; Dubreuil, V.; Quenol, H.; Sant’Ana Neto, J.L. Características das ilhas de calor em cidades de porte médio: Exemplos de Presidente Prudente (Brasil) e Rennes (França). Confins 2009, 7, 1–16. [Google Scholar] [CrossRef]
  25. Barrios, N.A.Z.; Sant’anna Neto, J.L. A circulação atmosférica no extremo oeste paulista. Bol. Climatol. 1996, 1, 8–9. [Google Scholar]
  26. Tarifa, J.R. Análise comparativa da temperatura e umidade na área urbana e rural de São José dos Campos (SP). Geografia 1977, 2, 59–80. [Google Scholar]
  27. Mendonça, F.A. O clima e o planejamento urbano de cidades de porte médio e pequeno. Proposição metodológica para estudo e sua aplicação à cidade de Londrina/PR. Ph.D. Thesis, Tese (Doutorado em Geografia Física)-Faculdade de Filosofia, Letras e Ciências Humanas, Universidade de São Paulo, São Paulo, Brizil, 1994. [Google Scholar]
  28. Sant’Anna Neto, J.L. Os Climas das Cidades Brasileiras, 1st ed.; Programa de Pós-Graduação em Geografia da FCT/UNESP: Presidente Prudente, Brasil, 2002. [Google Scholar]
  29. Dumke, E.M.S. Clima urbano/conforto térmico e condições de vida na cidade—Uma perspectiva a partir do Aglomerado Urbano da Região Metropolitana de Curitiba (AU-RMC). Ph.D. Thesis, Tese de Doutorado-Programa de Doutorado em Meio Ambiente e Desenvolvimento, Universidade Federal do Paraná, Curitiba, 2007. [Google Scholar]
  30. Dubreuil, V.; Amorim, M.C.C.T.; Froissard, X.; Quenol, H. Métodos e monitoramento da variabilidade espaçotemporal da ilha de calor em cidades de porte médio—Rennes/França e Presidente Prudente/Brasil. In Experimentos em Climatologia Geográfica; 1st ed.; Silva, C.A., Fialho, E.S., Steinke, E.T., Eds.; Editora da UFGD: Dourados, Brasil, 2014; Volume 1, p. 391. [Google Scholar]
  31. Oke, T.R. City size and the urban heat island. Atmos. Environ. 1973, 7, 769–779. [Google Scholar] [CrossRef]
  32. Oke, T.R. Initial Guidance to Obtain Representative Meteorological Observations at Urban Sites; IOM Report 81; World Meteorological Organization: Geneva, Switzerland, 2004. [Google Scholar]
  33. Gomez, A.L.; Garcia, F.F. La isla de calor en Madrid: Avance de un estudio de clima urbano. Estud. Geogr. 1984, 174, 5–34. [Google Scholar]
  34. Johnson, D.B. Urban modification of diurnal temperature cycles in Birmingham, U.K. J. Climatol. 1985, 5, 221–225. [Google Scholar] [CrossRef]
  35. Eliasson, I. Intra-urban noctural temperature differences: Multivariate approach. Clim. Res. 1996, 7, 21–30. [Google Scholar] [CrossRef]
  36. Howard, L. Climate of London Deduced from Meteorological Observations, 3rd ed.; Harvey and Darton: London, UK, 1833. [Google Scholar]
  37. Myrup, L. A Numerical model of the urban heat island. J. Appl. Meteor. 1969, 8, 908–918. [Google Scholar] [CrossRef]
  38. Landsberg, H.E. The Urban Climate, 1st ed.; Academic Press: New York, NY, USA, 1981. [Google Scholar]
  39. Yague, C.; Zurita, E.; Martinez, A. Statistical analysis of the Madrid urban heat island. Atmos. Environ. 1991, 25, 327–332. [Google Scholar] [CrossRef]
  40. Morris, C.; Simmonds, I.; Plummer, N. Quantification of the influences of wind and cloud on the nocturnal urban heat island of a large city. J. Appl. Meteor. 2001, 40, 169–182. [Google Scholar] [CrossRef]
  41. Voogt, J.A. Urban Heat Islands: Hotter Cities. Available online: http://www.actionbioscience.org/environment/voogt.html (accessed on 15 July 2016).
  42. Montavez, J.P.; Rodriguez, A.; Jimenez, J.I. A study of the urban heat island of Granada. Int. J. Climatol. 2000, 20, 899–911. [Google Scholar] [CrossRef]
  43. Hinkel, K.M.; Nelson, F.E.; Klene, A.E.; Bell, J.H. The urban heat island in winter at Barrow, Alaska. Int. J. Climatol. 2003, 23, 1889–1905. [Google Scholar] [CrossRef]
  44. Oke, T.R. The distinction between canopy and boundary-layer heat islands. Atmosphere 1976, 14, 268–277. [Google Scholar]
  45. Stewart, I.D. Redefining the urban heat island. Ph.D. Thesis, The University of British Columbia, Vancouver, BC, Canada, 2011. [Google Scholar]
  46. Dorigon, L.P. Clima urbano em Paranavaí: Análise do espaço intraurbano. Master’s Thesis, Dissertação (Mestrado em Geografia)-Faculdade de Ciências e Tecnologia de Presidente Prudente, Universidade Estadual Paulista, São Paulo, Brazil, 2015. [Google Scholar]
  47. Teixeira, D.C.F. O clima urbano de Rancharia (SP). Ph.D. Thesis, Dissertação (Mestrado em Geografia)-Faculdade de Ciências e Tecnologia de Presidente Prudente, Universidade Estadual Paulista, Presidente Prudente, 2015. [Google Scholar]
  48. Cardoso, R.S.; Amorim, M.C.C.T. Variações espaciais das temperaturas noturnas de Presidente Prudente-SP em episódios de verão. Ra'e Ga 2017. under review. [Google Scholar]
  49. Unger, J. Heat island intensity with different meteorological conditions in a medium-sized town: Szeged, Hungary. Theor. Appl. Climatol. 1996, 54, 147–151. [Google Scholar] [CrossRef]
  50. Balkestahl, L.; Monteiro, A.; Góis, J.; Taesler, R.; Quenol, H. The influence of weather types on the urban heat island’s magnitude and patterns at Paranhos (Porto)—A case study from November 2003 to January 2005. In Proceedings of the Sixth International Conference on urban climate, Gothenburg, Sweden, 12–16 June 2006.
  51. Arnfield, A.J. Two decades of urban climate research: A review of turbulence, exchanges of energy and water, and the urban heat island. Int. J. Climatol. 2003, 23, 1–26. [Google Scholar] [CrossRef]
  52. Unger, J.; Sümeghy, Z.; Gulyás, Á.; Bottyán, Z.; Mucsi, L. Land-use and meteorological aspects of the urban heat island. Met. Apps. 2001, 8, 189–194. [Google Scholar] [CrossRef]
  53. Duarte, D.H.S.; Serra, G.G. Padrões de ocupação do solo e microclimas urbanos na região de clima continental tropical brasileira: Correlaçõe e proposta de um indicador. Ambient. Constr. 2003, 3, 7–20. [Google Scholar]
  54. Ortiz, G.F.; Amorim, M.C.C.T. Ilhas de Calor em Cândido Mota/SP: Algumas Considerações. Formação (Presidente Prudente) 2011, 18, 238–257. [Google Scholar]
  55. Ugeda Júnior, J.C.; Amorim, M.C.C.T. Estudo do clima urbano de Jales-SP através do transecto móvel. Rev. GeoNorte 2012, 9, 365–377. [Google Scholar]
  56. Moreira, J.L. O Clima Urbano em Penápolis/SP: Análise da Temperatura e Umidade Intraurbano. Ph.D. Thesis, Dissertação (Mestrado em Geografia)-Faculdade de Ciências e Tecnologia de Presidente Prudente, Universidade Estadual Paulista, São Paulo, Brazil, 2016. [Google Scholar]
  57. Stewart, I.D.; Oke, T.R. Thermal differentiation of local climate zones using temperature observations from urban and rural field sites. In Proceedings of the Ninth Symposium on Urban Environment, Boulder, CO, USA, 1–6 August 2010.
  58. Stewart, I.D.; Oke, T.R.; Krayenhoff, E.S. Evaluation of the “local climate zone” scheme using temperature observations and model simulations. Int. J. Climatol. 2014, 34, 1062–1080. [Google Scholar] [CrossRef]
  59. Lelovics, E.; Gál, T.; Unger, J. Mapping local climate zones with a vector-based GIS method. In Proceedings of the Air and Water Components of the Environment: Conference Dedicated to World Meteorological Day and World Water Day, Cluj-Napoca, Romania, 22–23 March 2013.
Figure 1. Location map of the study areas.
Climate 05 00014 g001
Figure 2. Traverses across (a) Presidente Prudente (São Paulo), (b) Paranavaí (Paraná), and (c) Rancharia (São Paulo).
Climate 05 00014 g002
Figure 3. Summer average urban heat island (UHI) magnitudes in Paranavaí during nighttime traverses, January 2014 (5 = five nights): (a) east–west traverse; and (b) north–south traverse. Horizontal lines indicate the temperature profile. Surface relief is shown the along bottom axes.
Climate 05 00014 g003
Figure 4. Summer average UHI magnitudes in Rancharia during nighttime traverses, January 2014 (five nights): (a) west–east traverse; and (b) north–south traverse. Horizontal lines indicate the temperature profile. Surface relief is shown along the bottom axes.
Climate 05 00014 g004
Figure 5. Summer average UHI magnitudes in Presidente Prudente during nighttime traverses, December 2013 (five nights): (a) west–east traverse; and (b) south–north traverse. Horizontal lines indicate the temperature profile. Surface relief is shown along the bottom axes.
Climate 05 00014 g005
Table 1. Urban heat island magnitude and atmospheric systems during nighttime traverses in Paranavaí, January 2014.
Date∆Tu-r (°C)Wind Speed (m s−1)Wind DirectionAtmospheric Systems
11 January 20144.71.9NEmodified Atlantic Tropical mass (aTm)
12 January 20143.51.9Nmodified Atlantic Tropical mass (aTm)
28 January 20142.31.5NEmodified Atlantic Tropical mass (aTm)
29 January 20145.40.7Emodified Atlantic Tropical mass (aTm)
30 January 20145.50.6Smodified Atlantic Tropical mass (aTm)
Data source: Dorigon [46].
Table 2. Urban heat island magnitude and atmospheric systems during nighttime traverses in Rancharia, January 2014.
Date∆Tu-r (°C)Wind Speed (m s−1)Wind DirectionAtmospheric Systems
5 January 20142.22.8EAtlantic Tropical mass (aTm)
9 January 20142.70.6EFrontal System (FS)
19 January 20143.90.2SEmodified Atlantic Polar mass (aPm)
20 January 20142.91.7Emodified Atlantic Polar mass (aPm)
29 January 20144.70.6EAtlantic Tropical mass (aTm)
Data source: Teixeira [47].
Table 3. Urban heat island magnitude and atmospheric systems during nighttime traverses in Presidente Prudente, December 2013.
Date∆Tu-r (°C)Wind Speed (m s−1)Wind DirectionAtmospheric Systems
11 December 201361,6EContinental Equatorial mass (cEm)
12 December 20133.82,5SEContinental Equatorial mass (cEm)
13 December 20135.52,4SEContinental Equatorial mass (cEm)
15 December 20133.51,1EContinental Tropical mass (cTm)
16 December 20135.10-Continental Tropical mass (cTm)
Data source: Cardoso and Amorim [48].

