
Rising Precipitation Extremes across Nepal

 , , and
Abstract
:1. Introduction
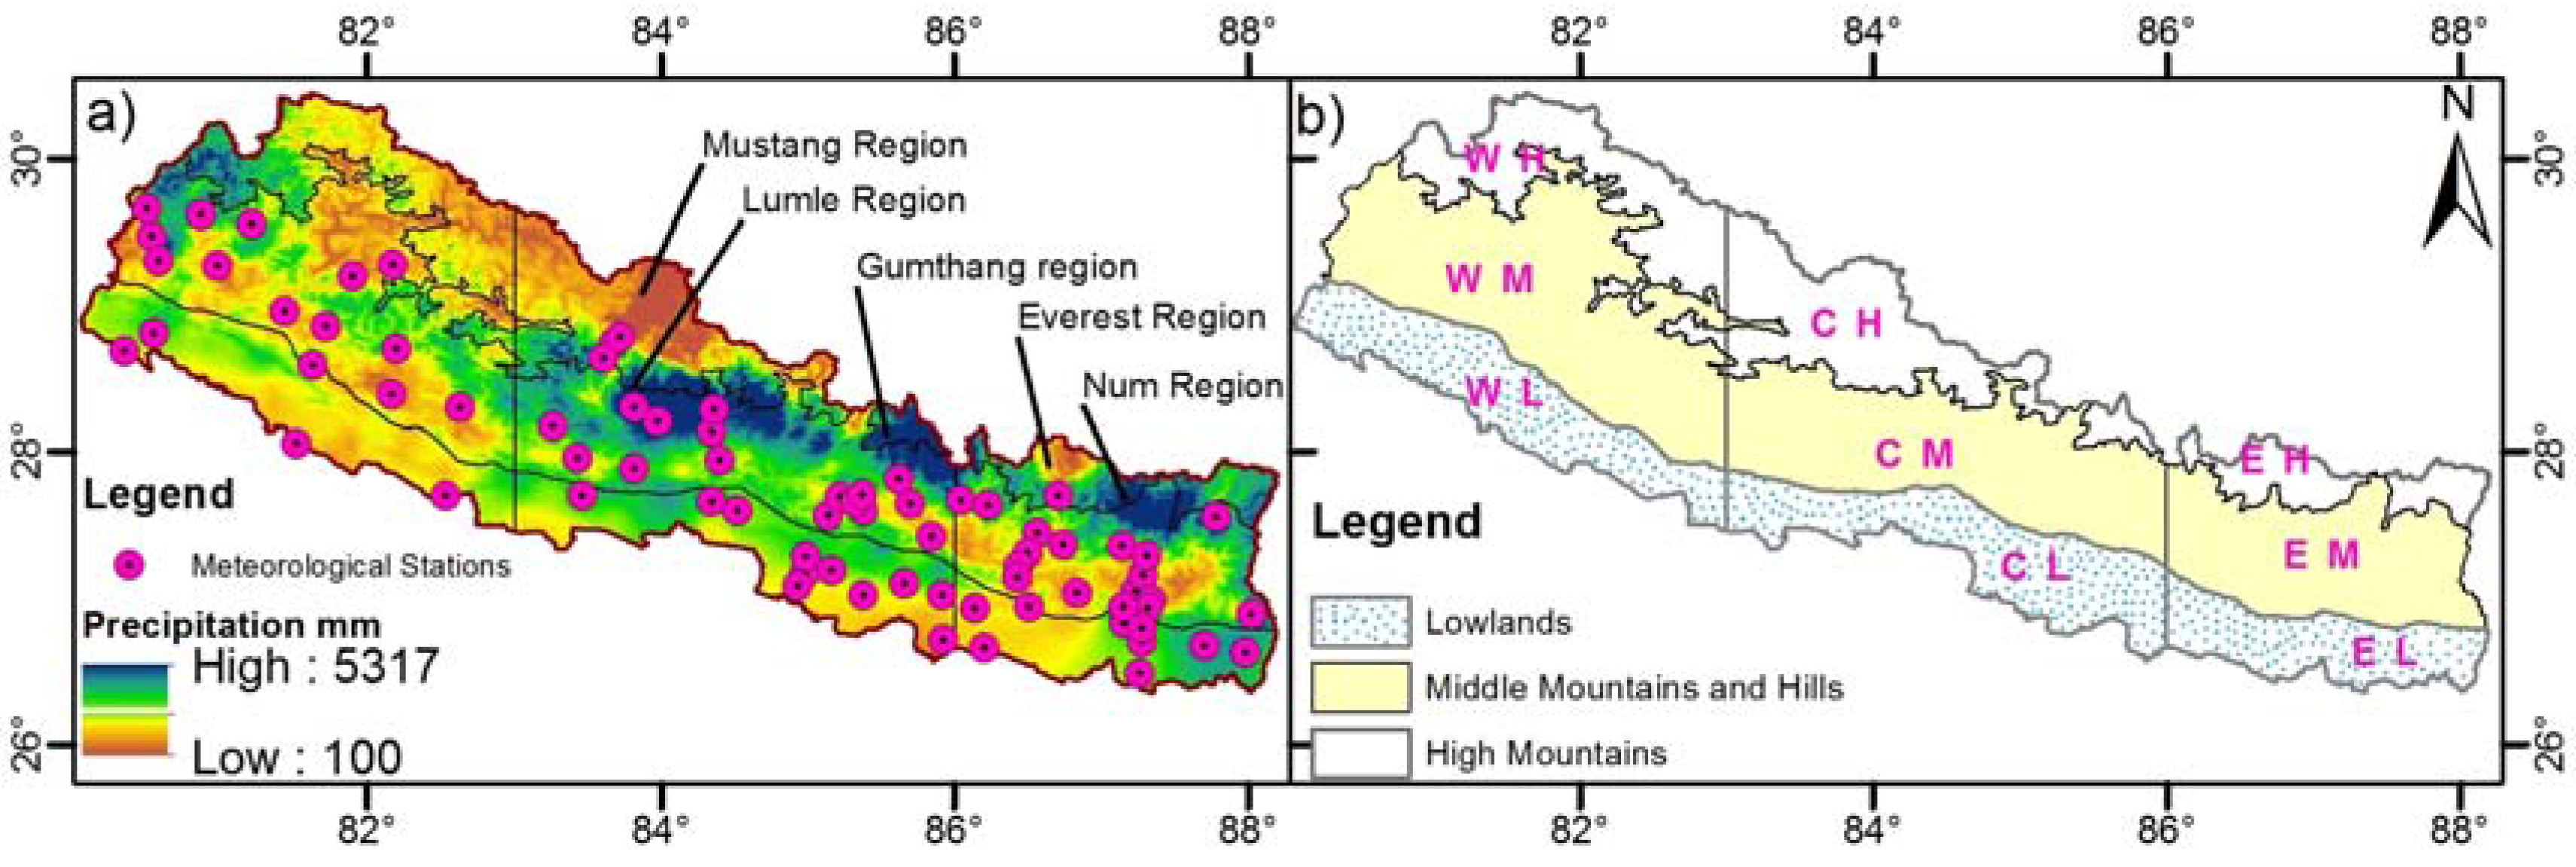
2. Study Area
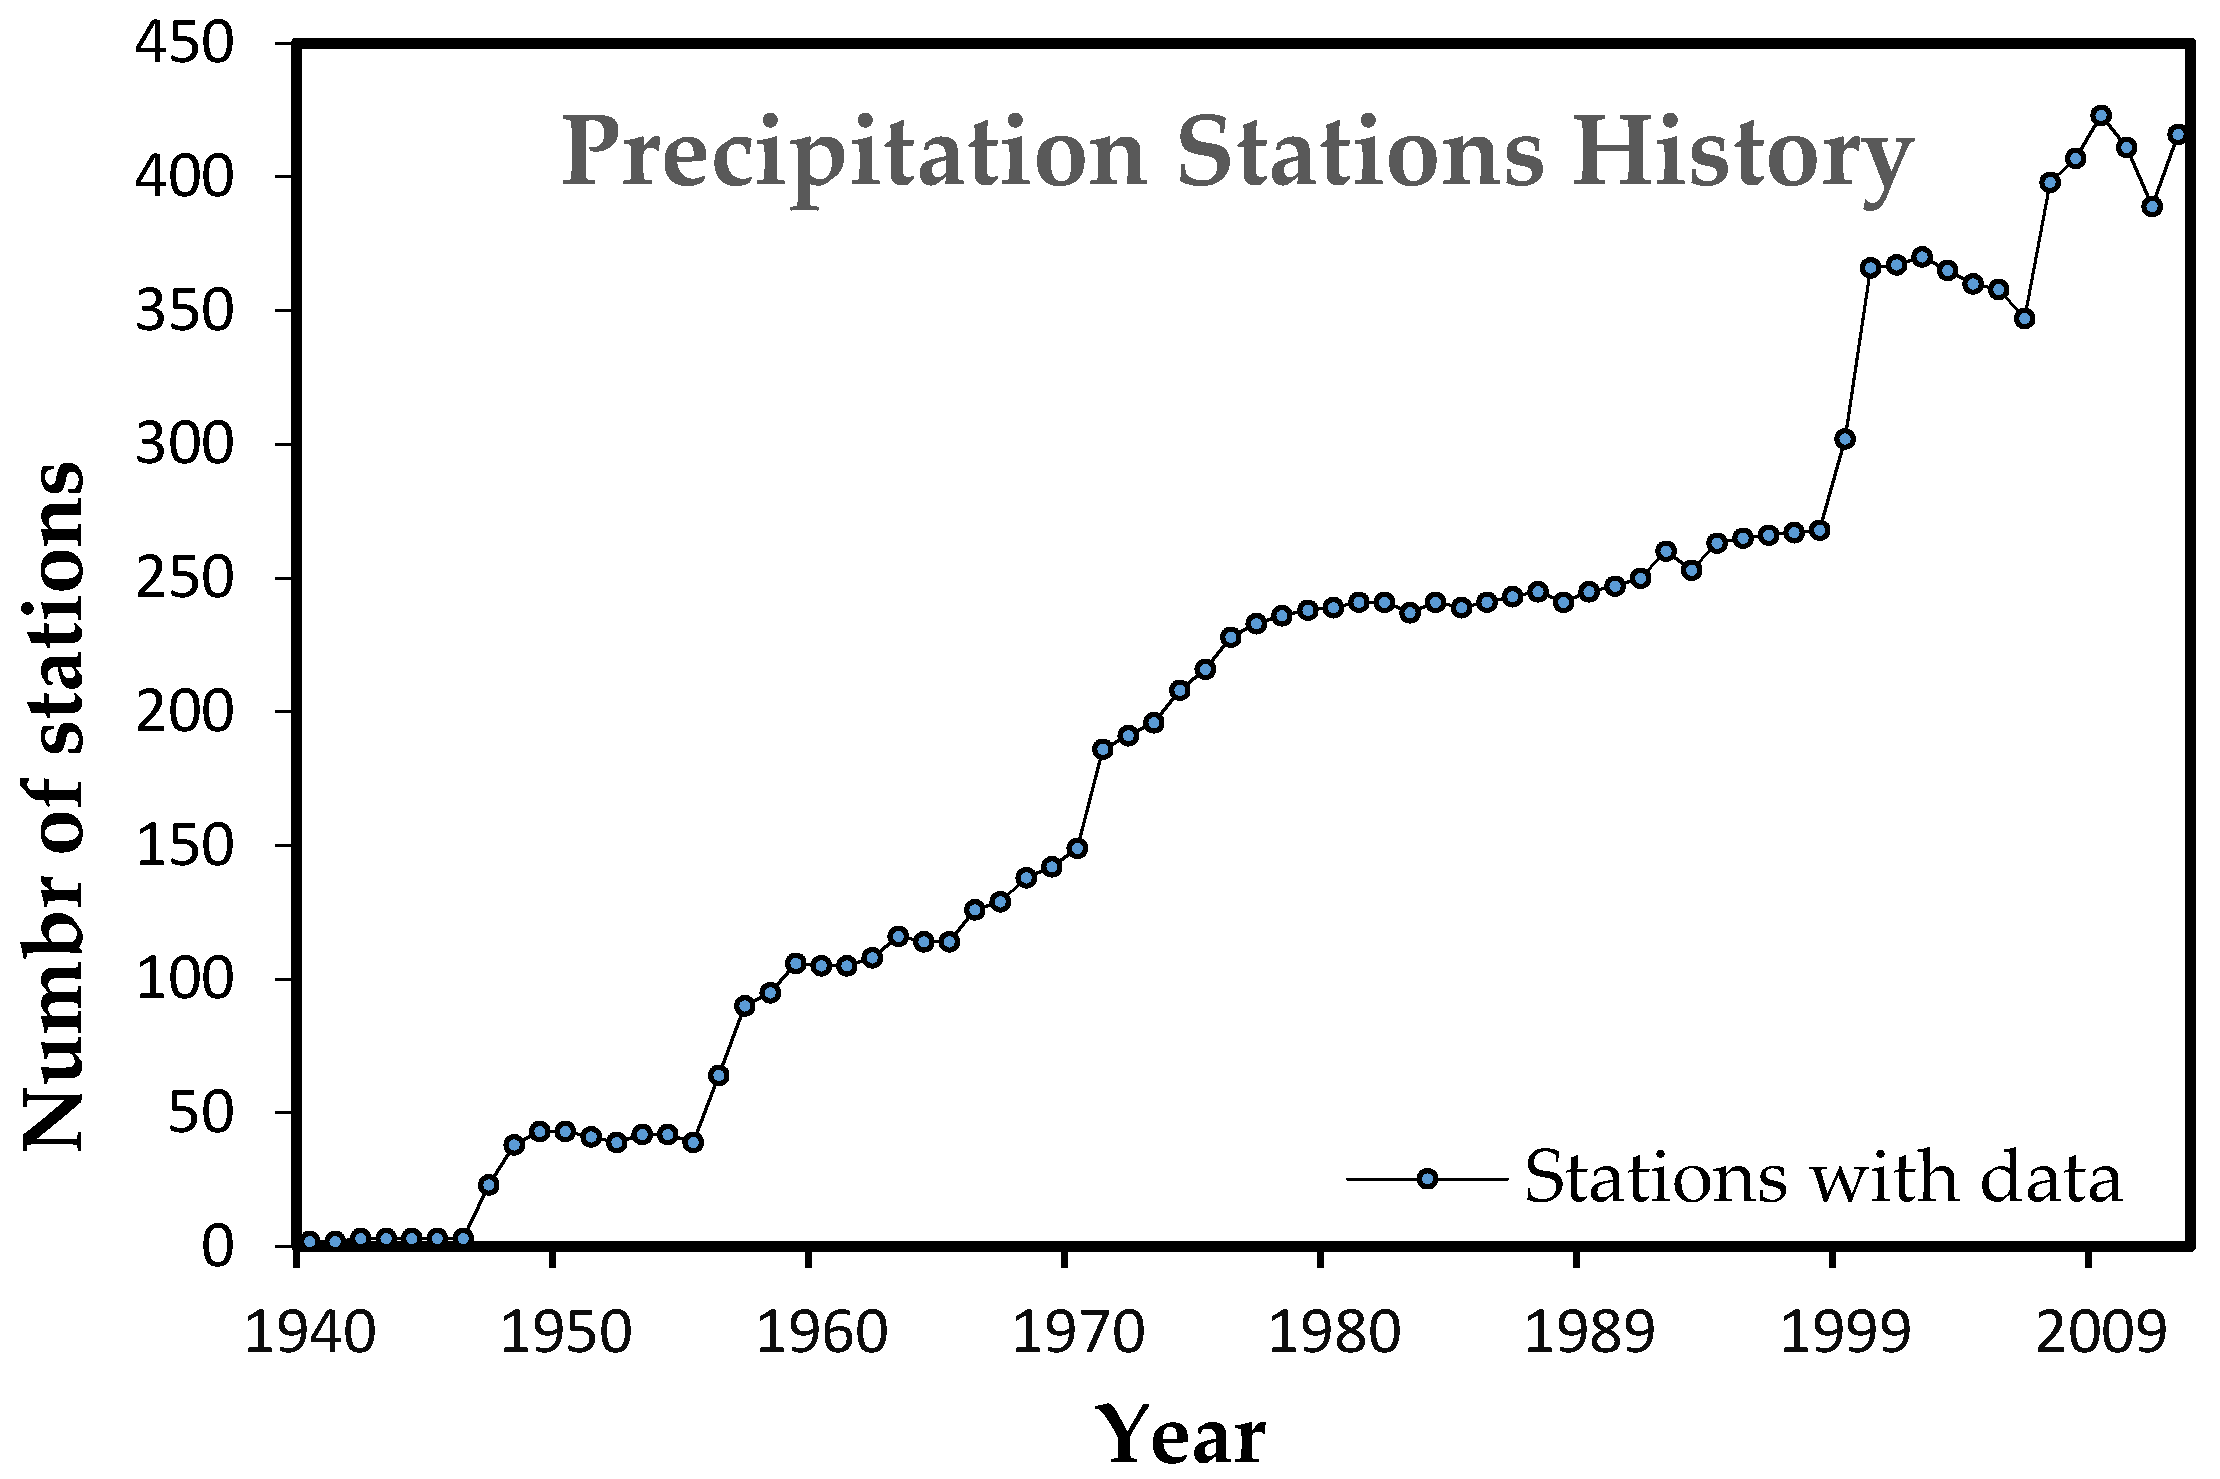
3. Data
4. Methodology
4.1. Precipitation Indices
4.2. Trend Analysis
4.2.1. Mann−Kendall Trend
4.2.2. Theil−Sen’s Slope
4.2.3. Trend-Free Pre-Whitening
4.2.4. Field Significance
5. Results and Discussion
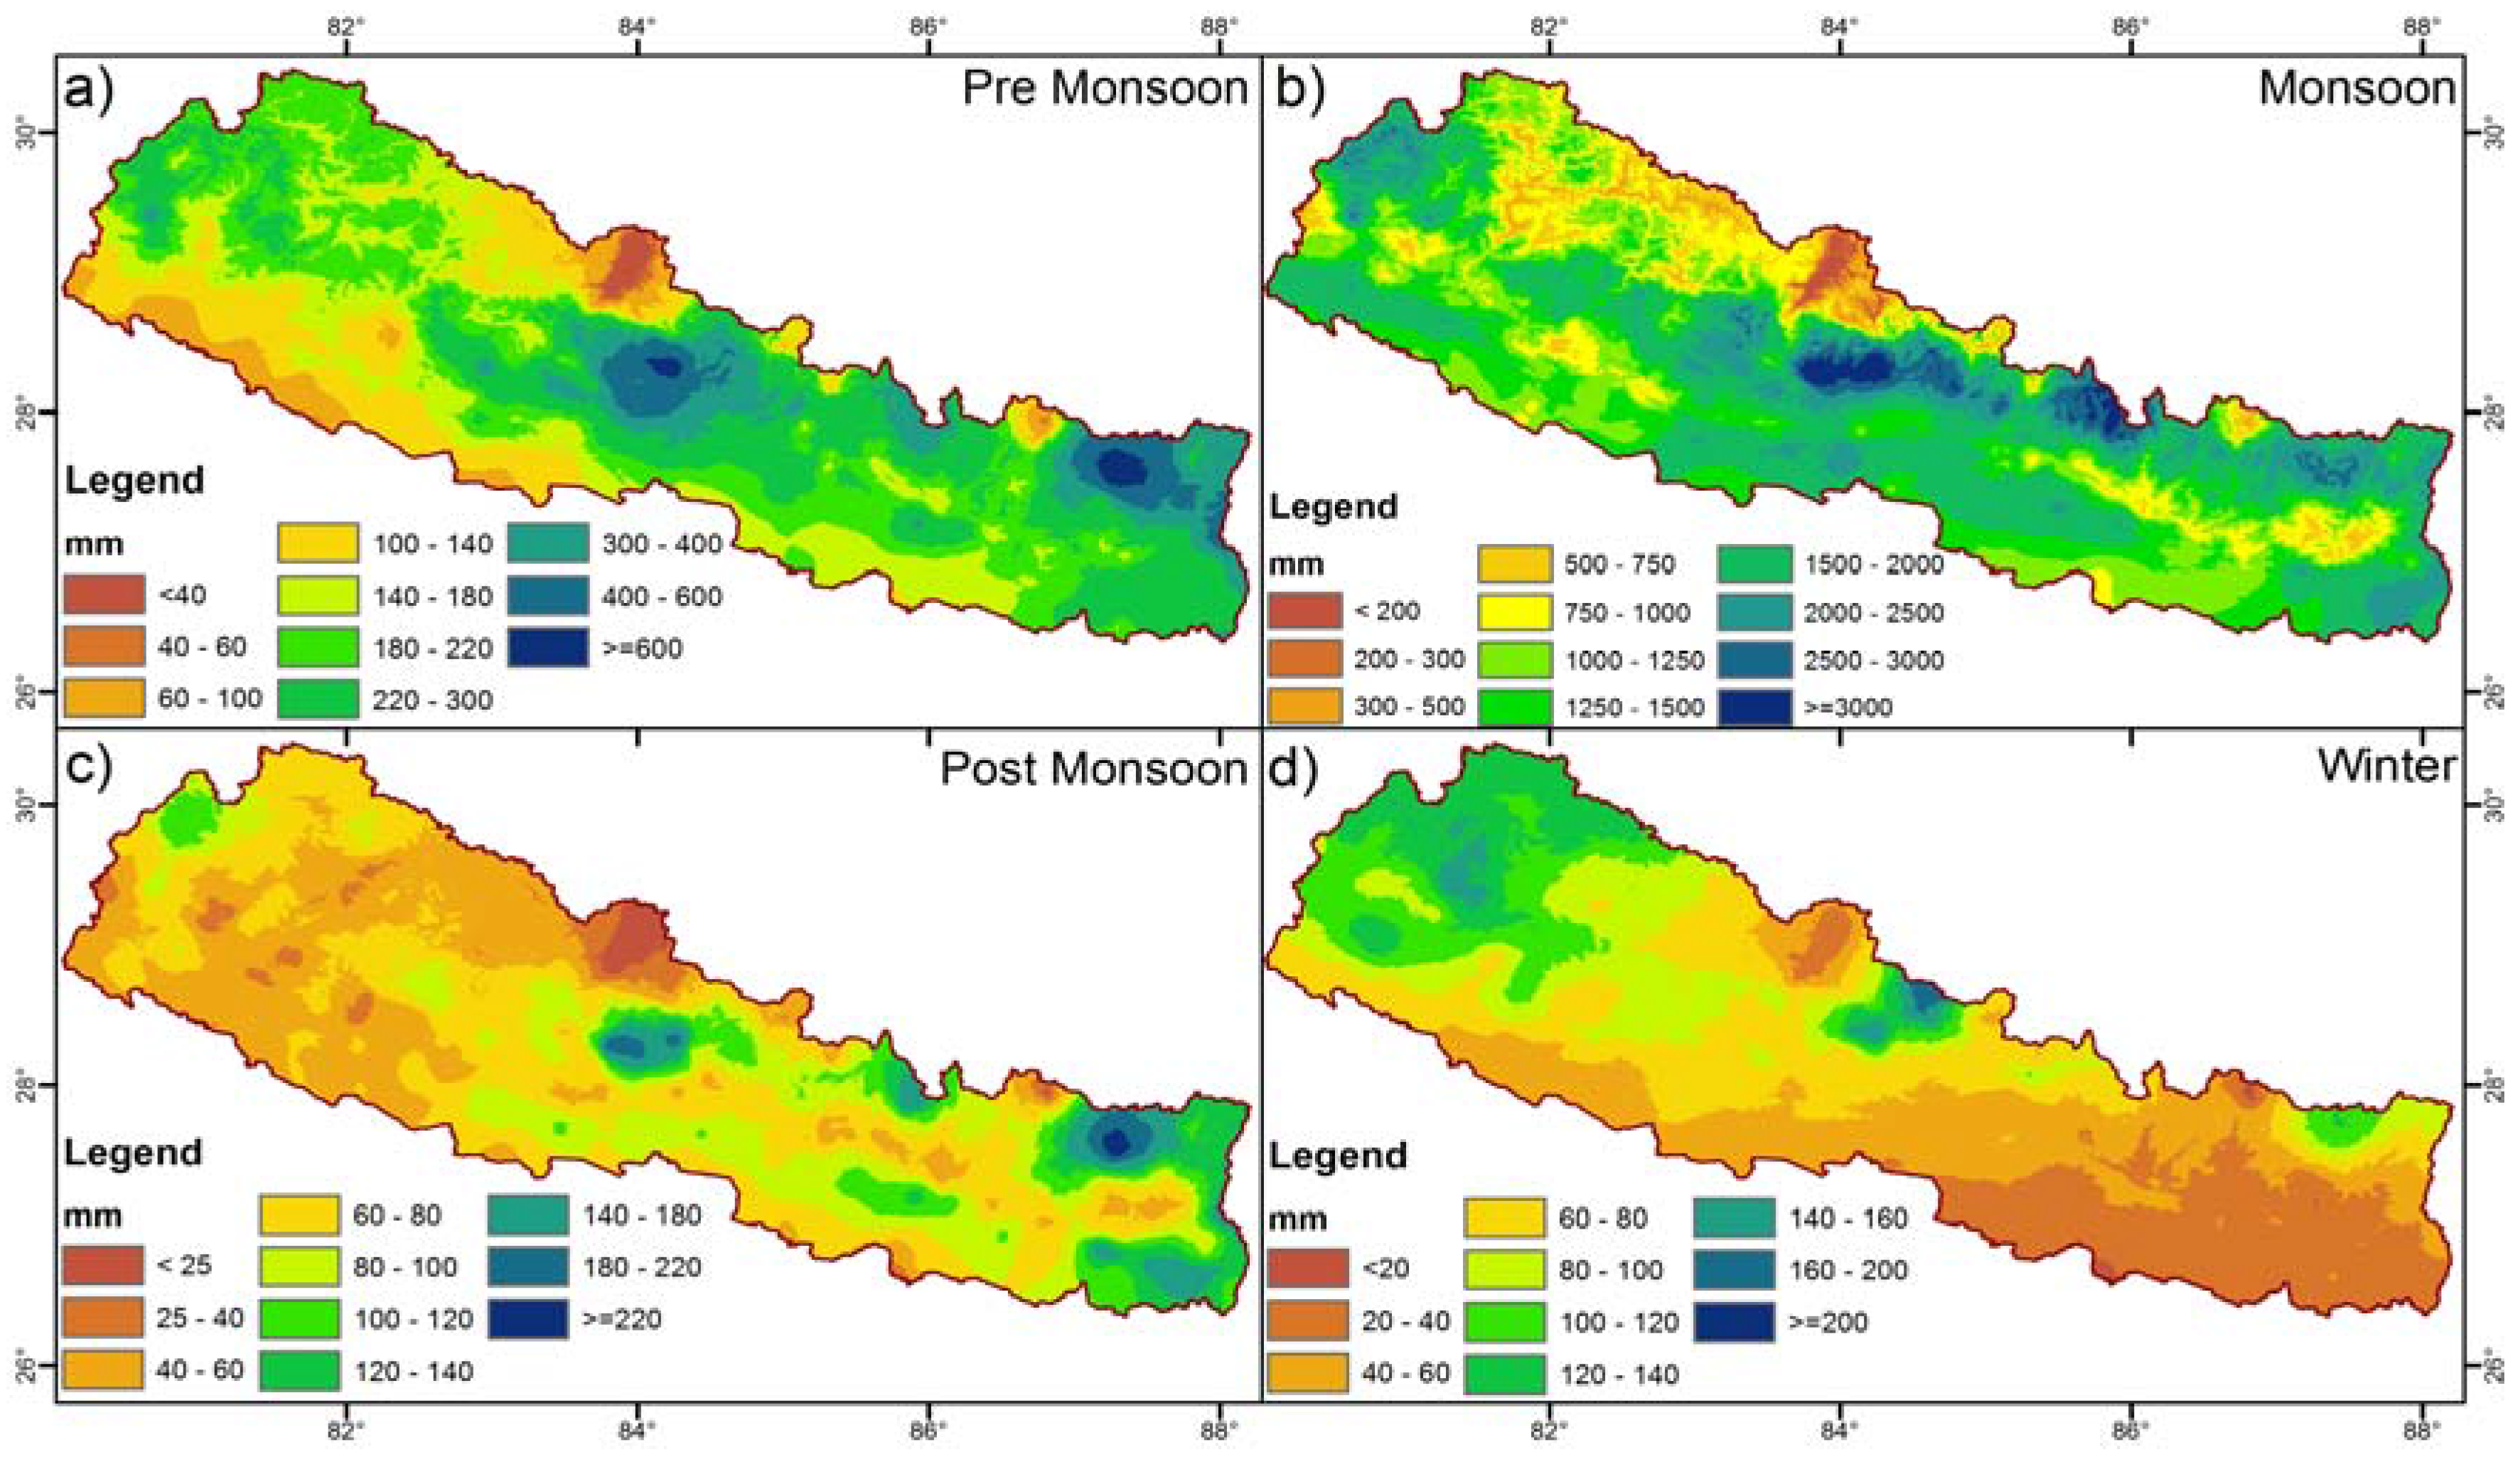
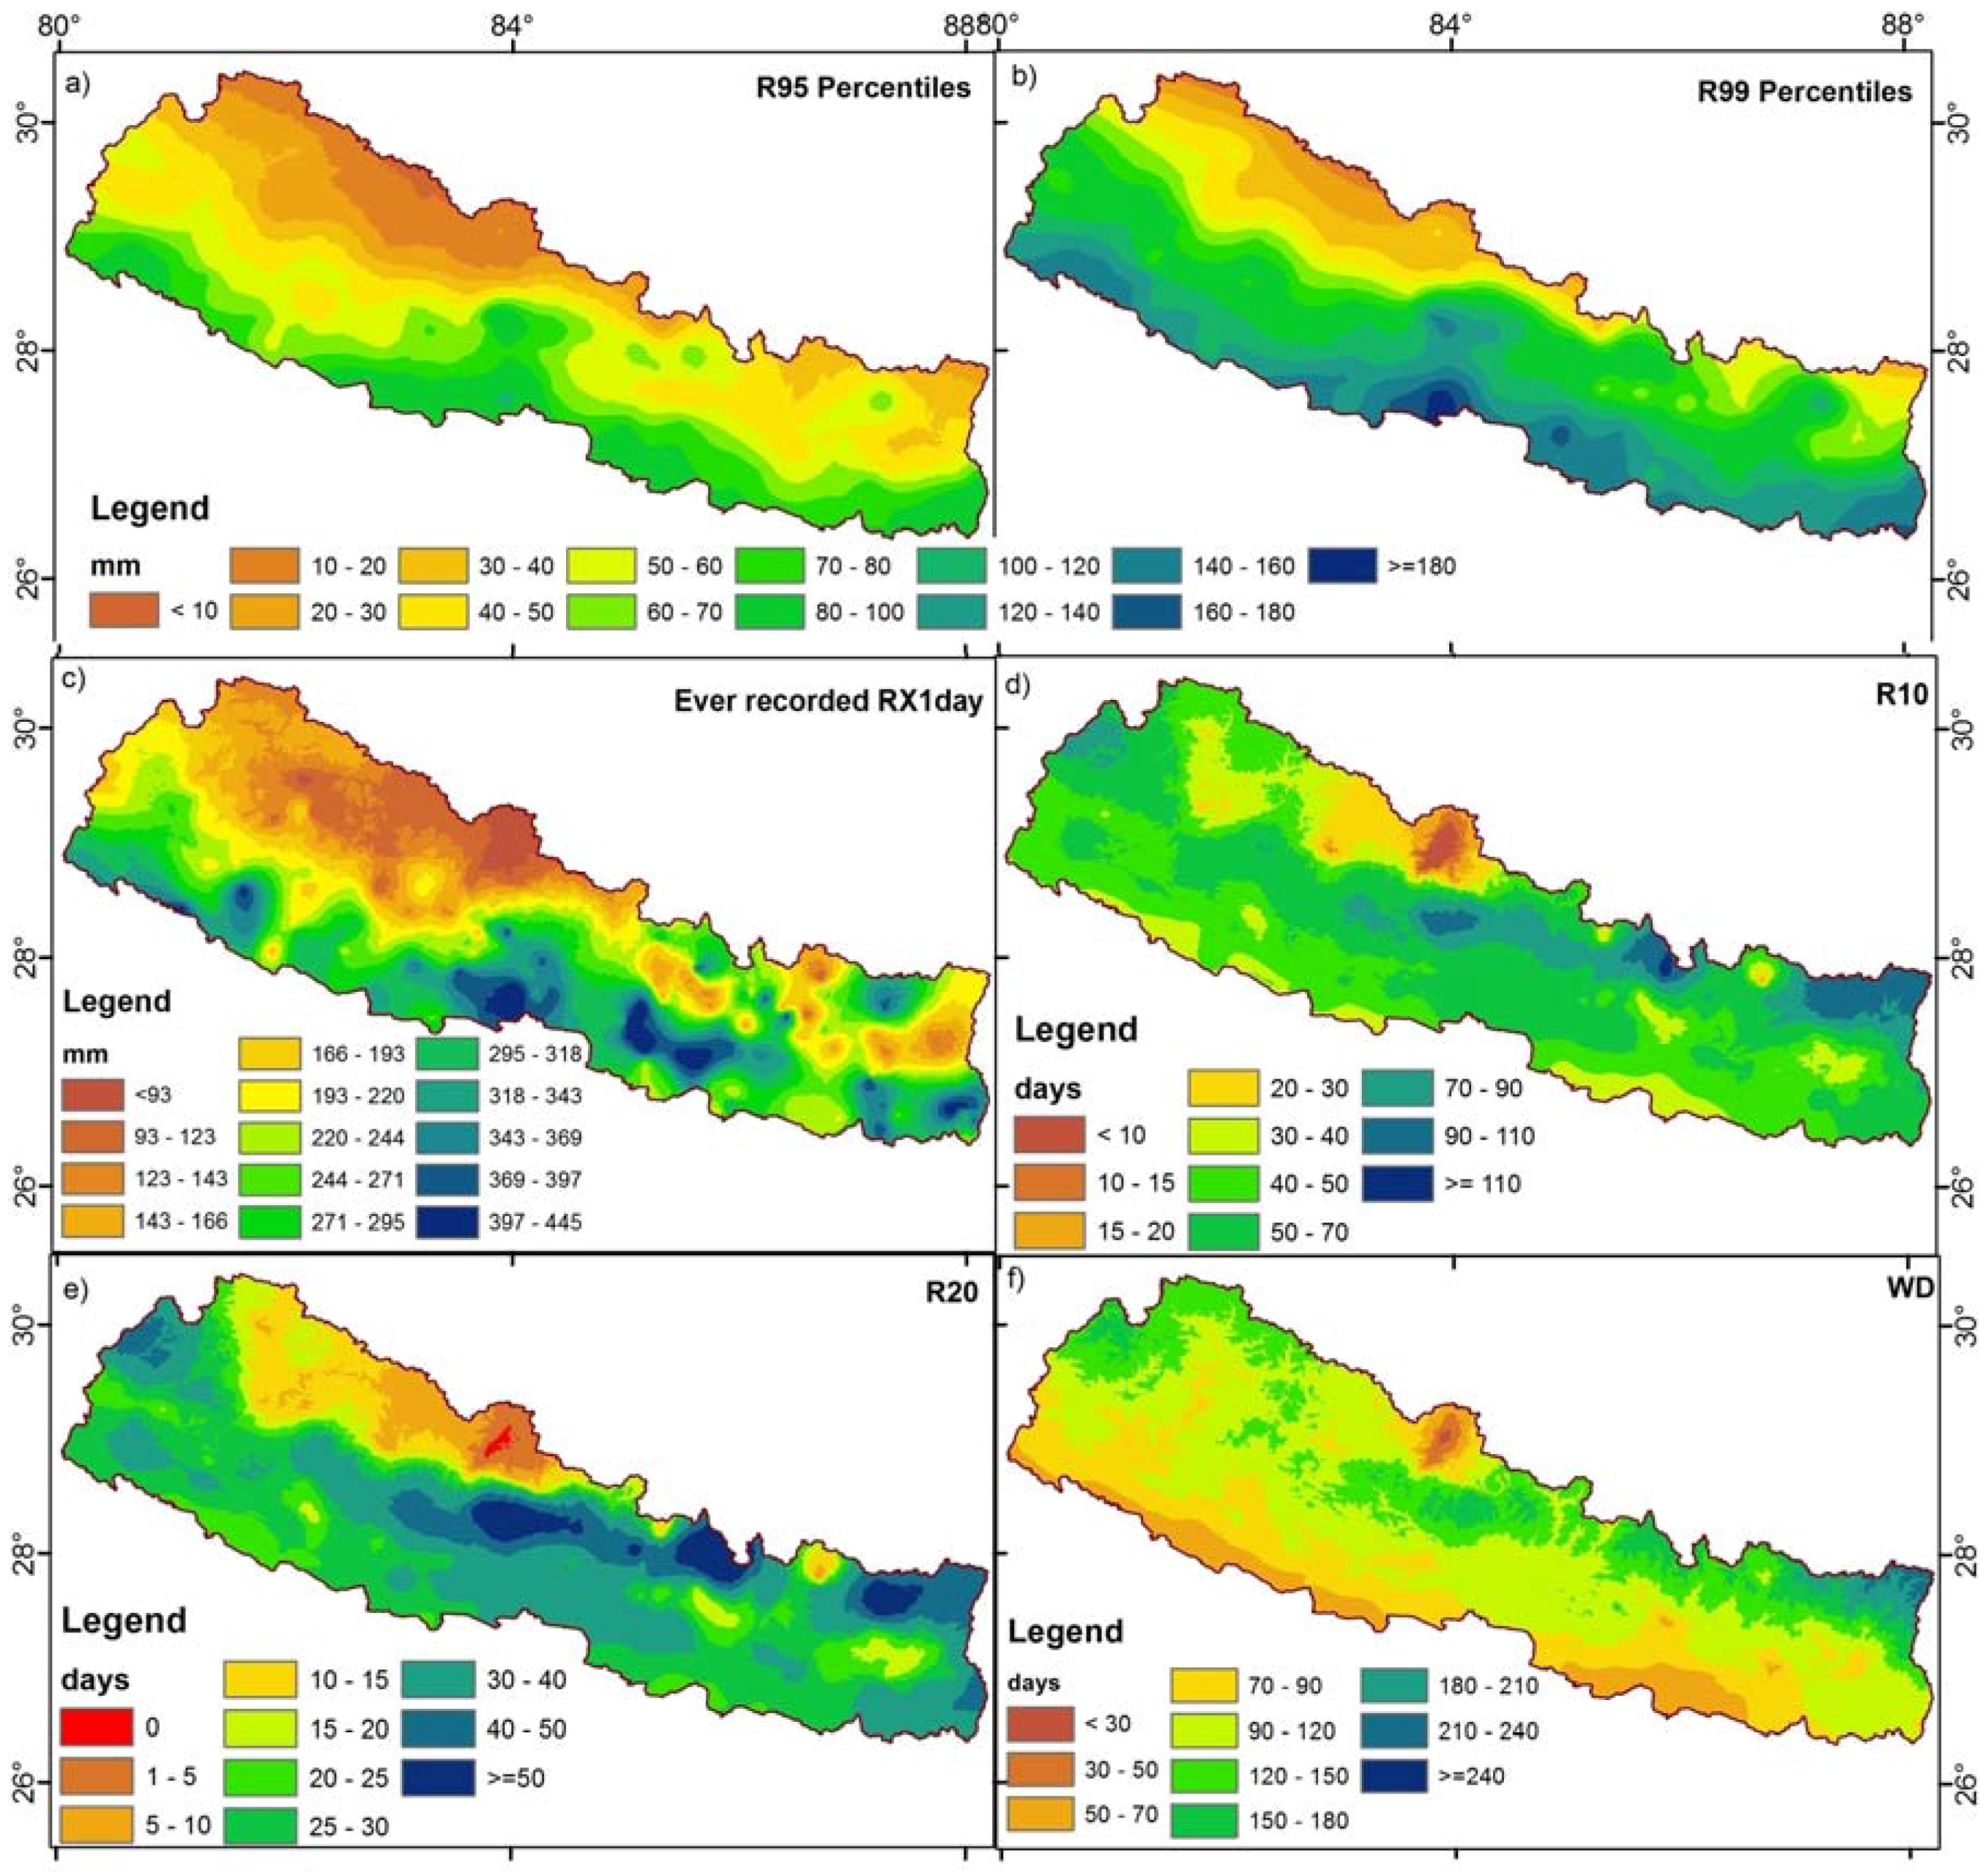
5.1. Spatial Distribution of Mean Seasonal and Daily Precipitation Indices
5.2. Trend Analysis
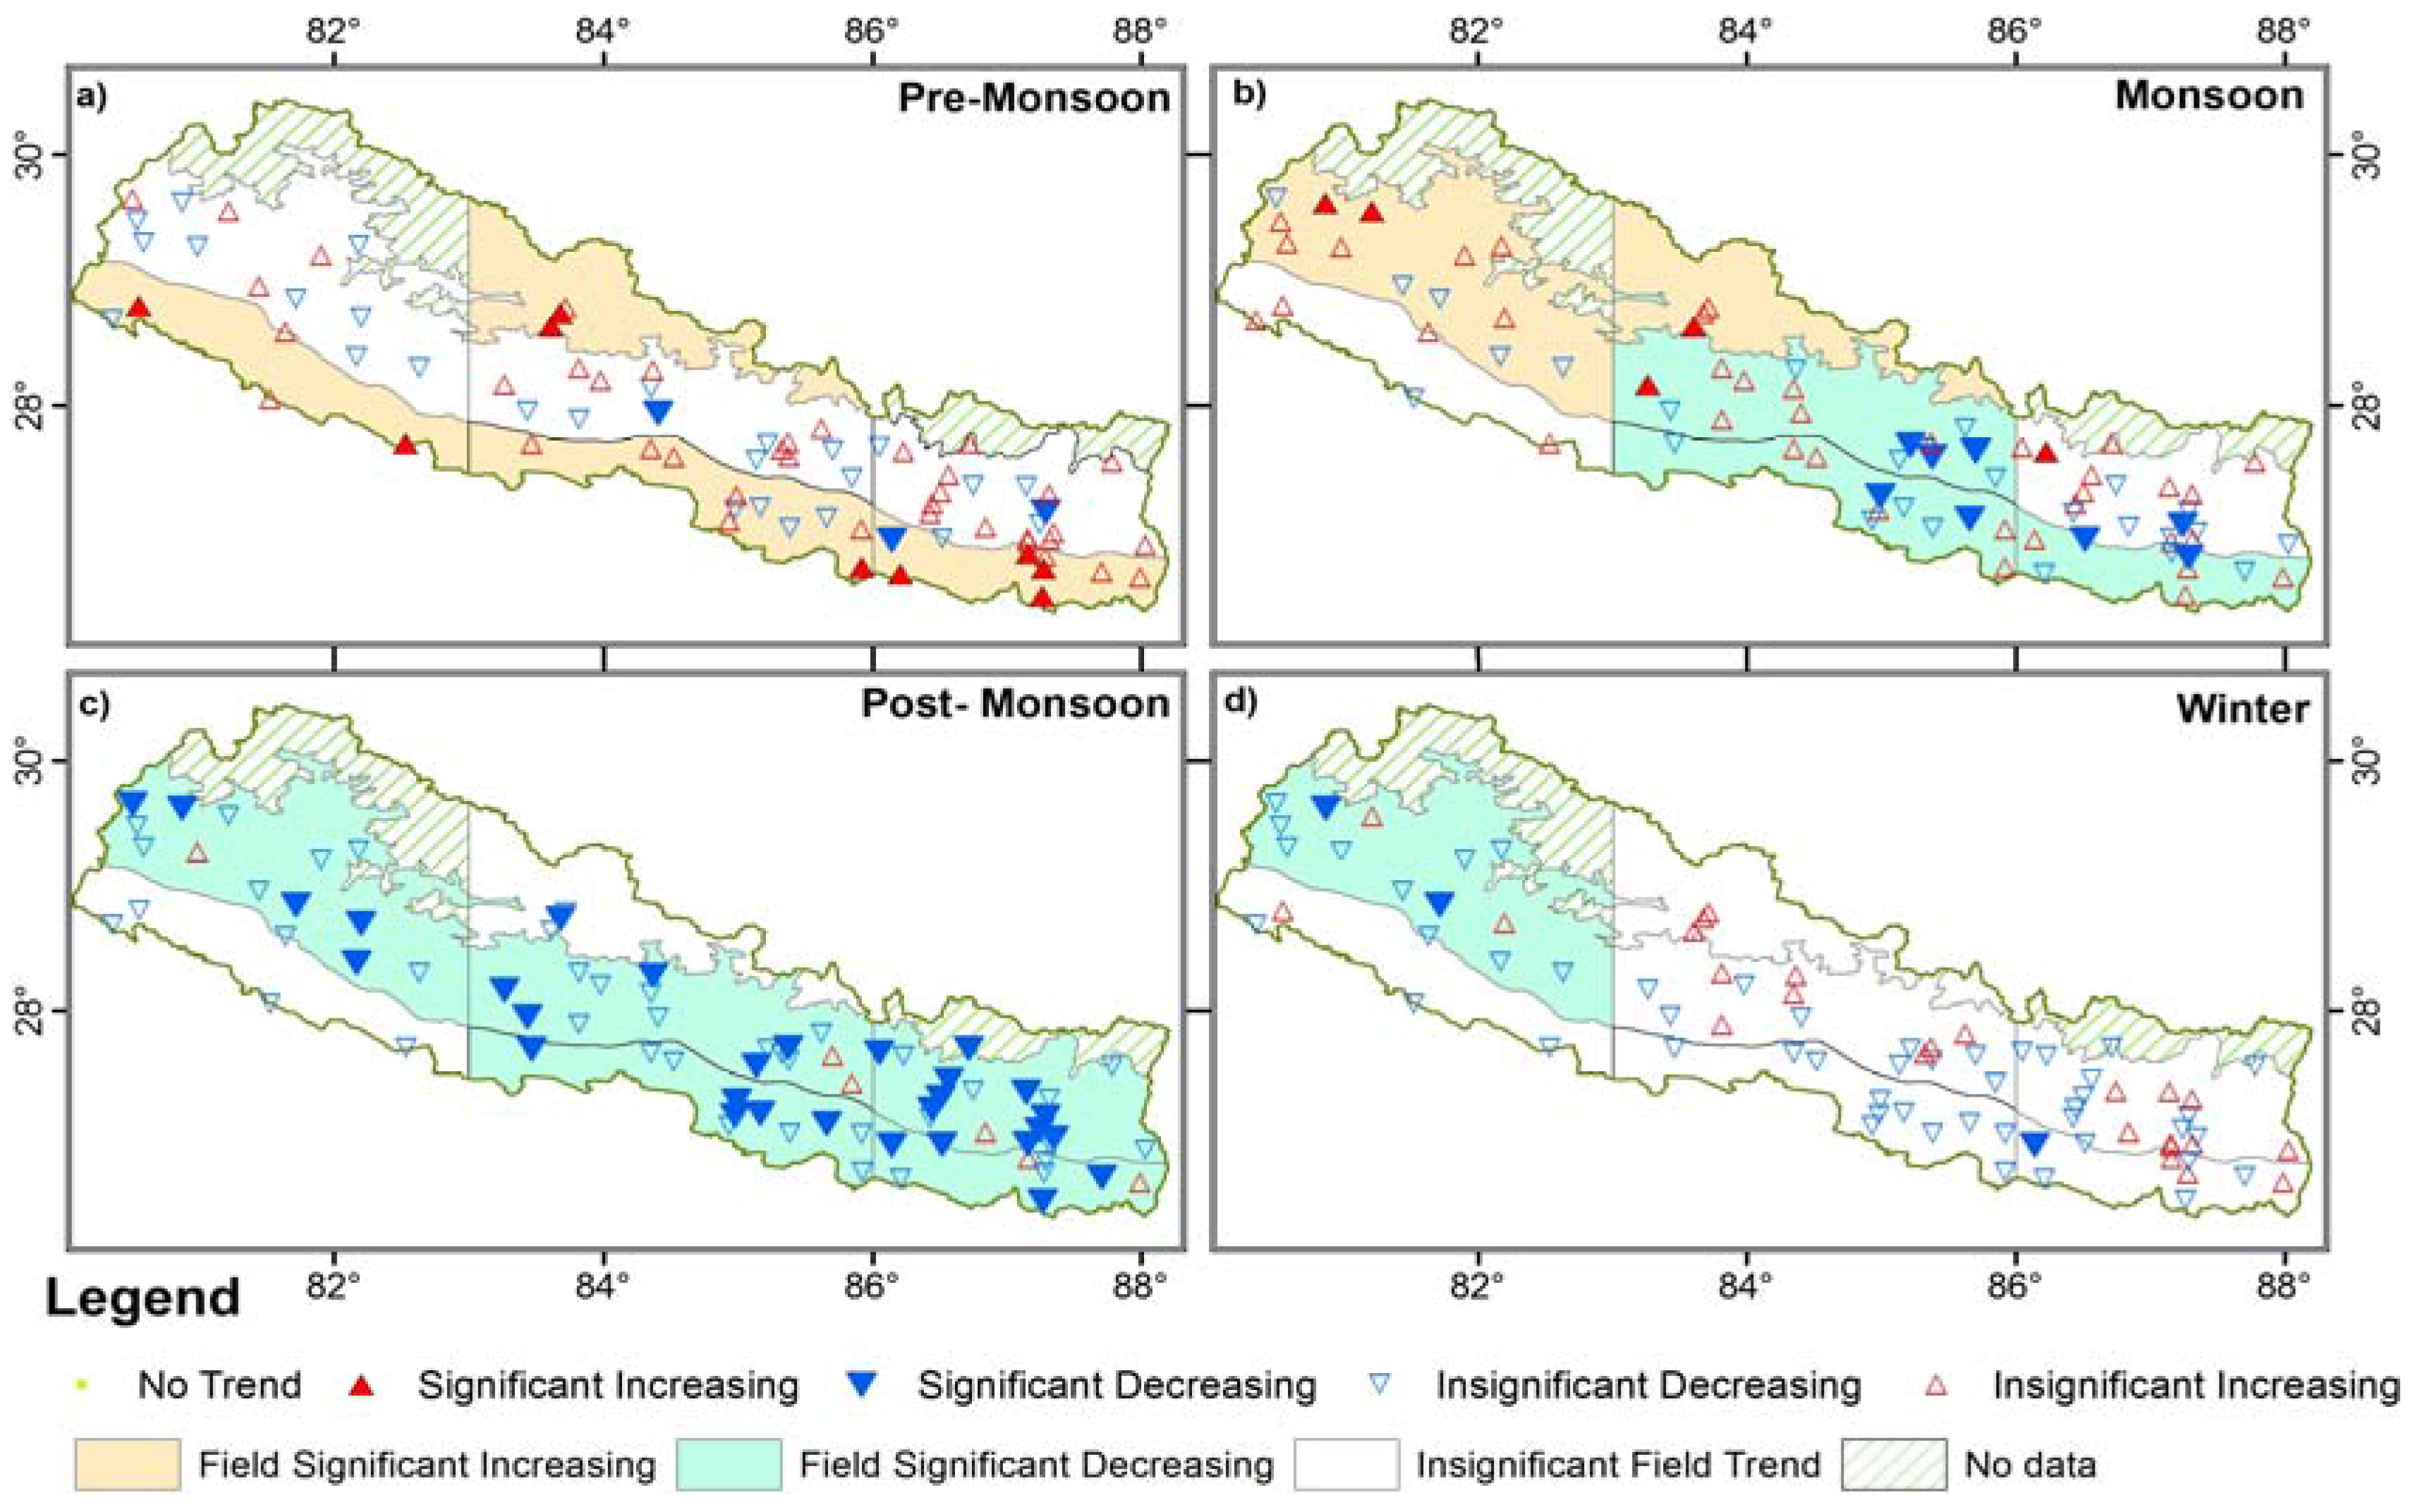
5.2.1. Seasonal Precipitation
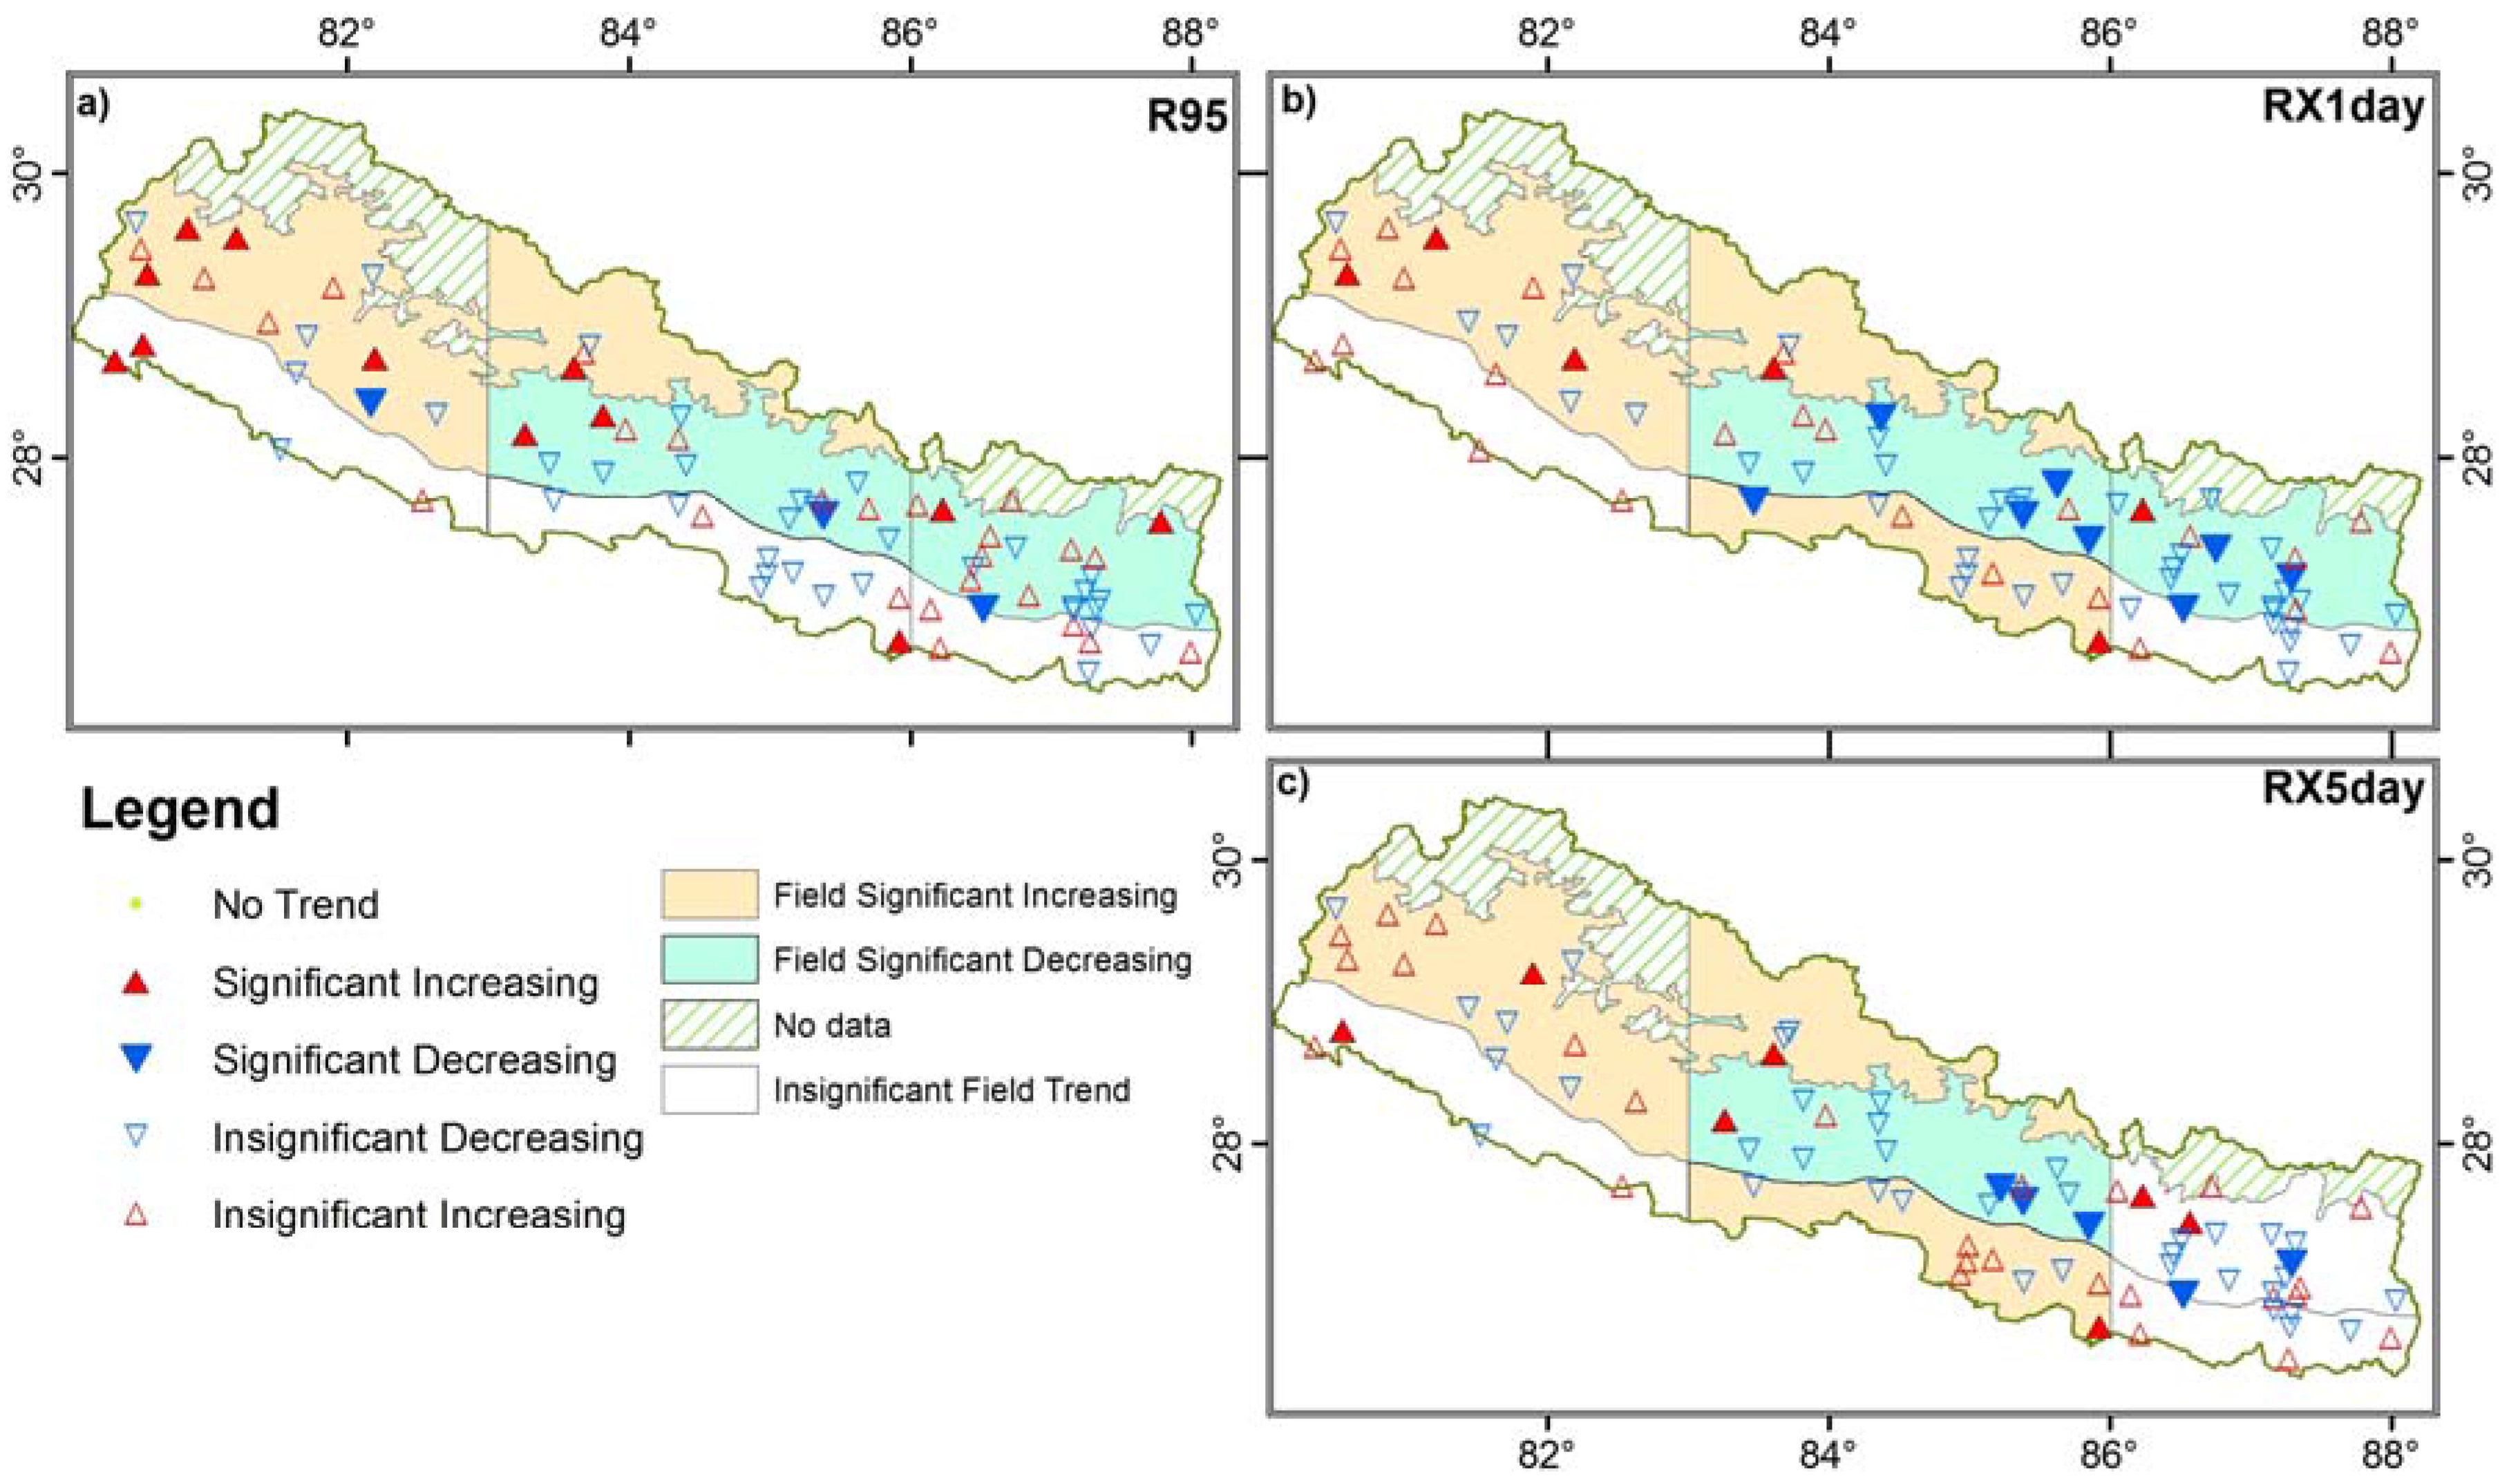
5.2.2. High-Intensity-Related Precipitation Extremes
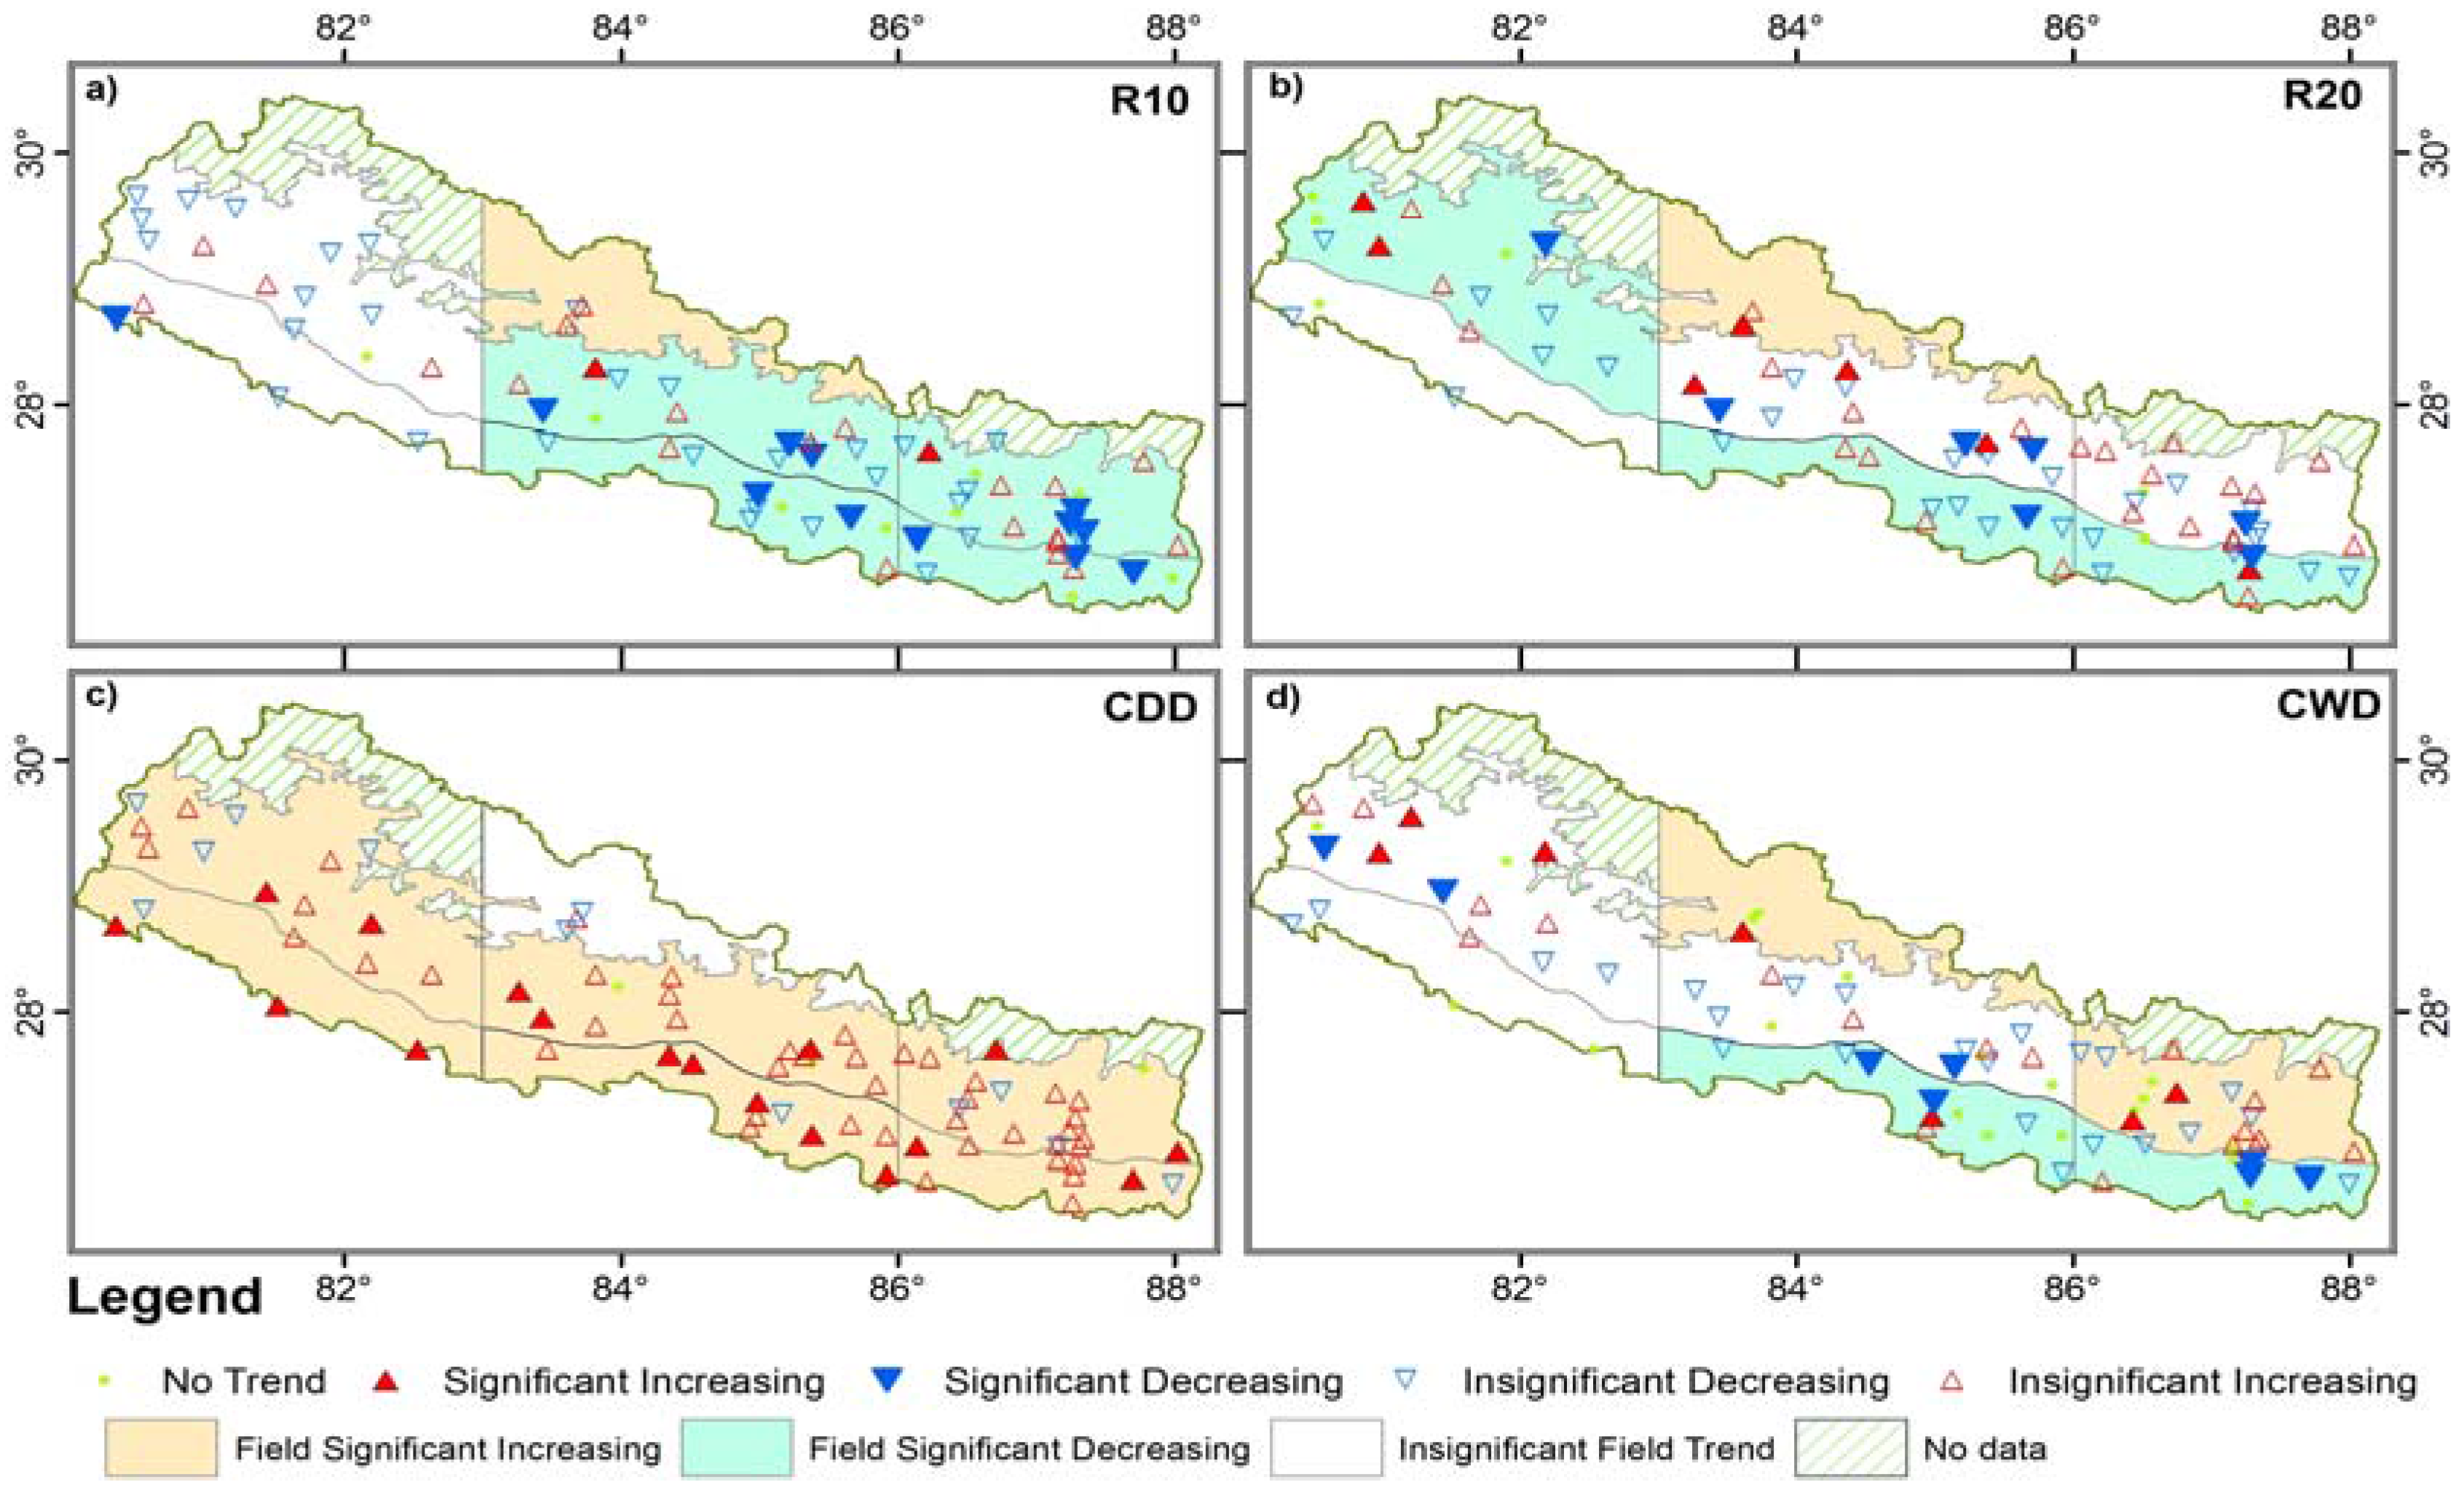
5.2.3. Frequency-Related Precipitation Extremes
5.2.4. Dry and Wet Spells
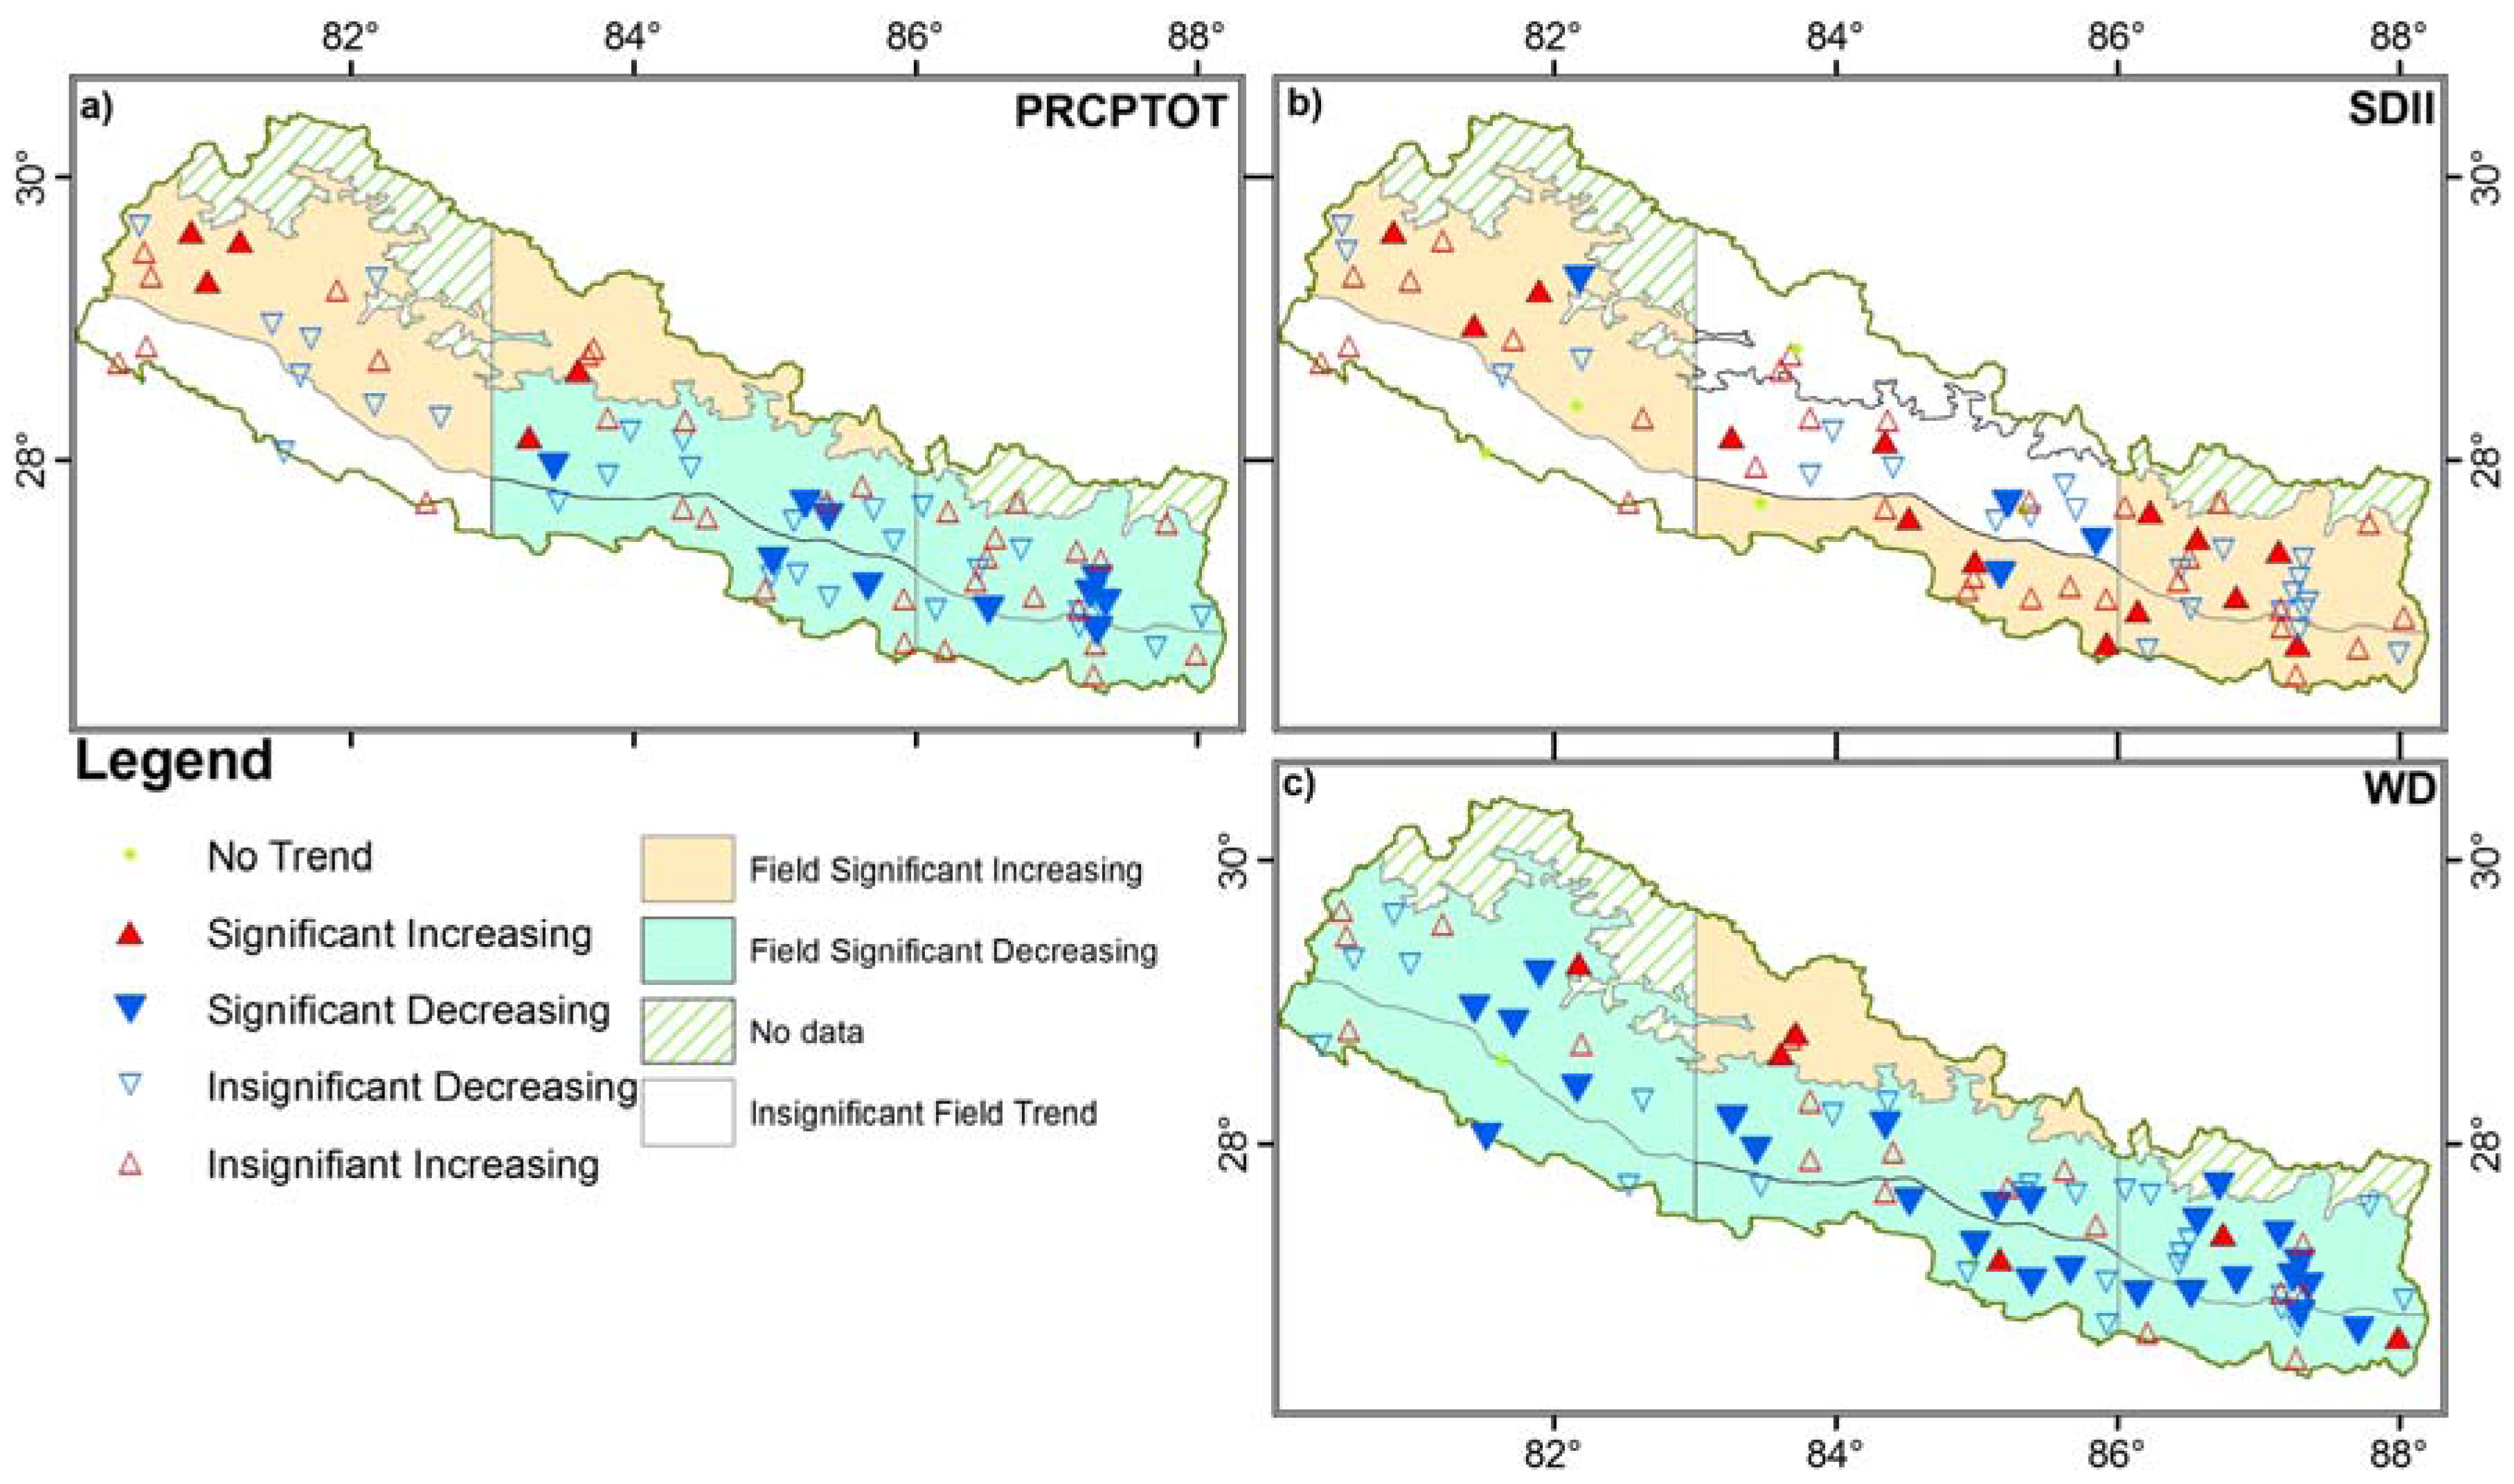
5.2.5. Extra Indices (PRCPTOT, SDII and WD)
6. Conclusions
- Spatial distribution of monsoonal precipitation across Nepal indicates three high-precipitation pocket areas, such as surrounding regions of Lumle, Gumthang and Num, and four regions of low precipitation on the leeward side of high mountains, namely, Mustang, Manang, Dolpa, and Everest. Likewise, depending on the orientation of surrounding mountain ranges, lower precipitation is also found in the river valleys lying within the middle mountains and hill regions. Pre- and post-monsoonal precipitation more or less follow the spatial pattern of monsoonal precipitation in terms of representing three-peak precipitation pocket areas, as well as the east to west gradient. In contrast to other seasons, winter precipitation is higher over the western middle and high mountainous (WM) areas and lower over the eastern lowlands (EL), clearly depicting west to east and north to south gradients.
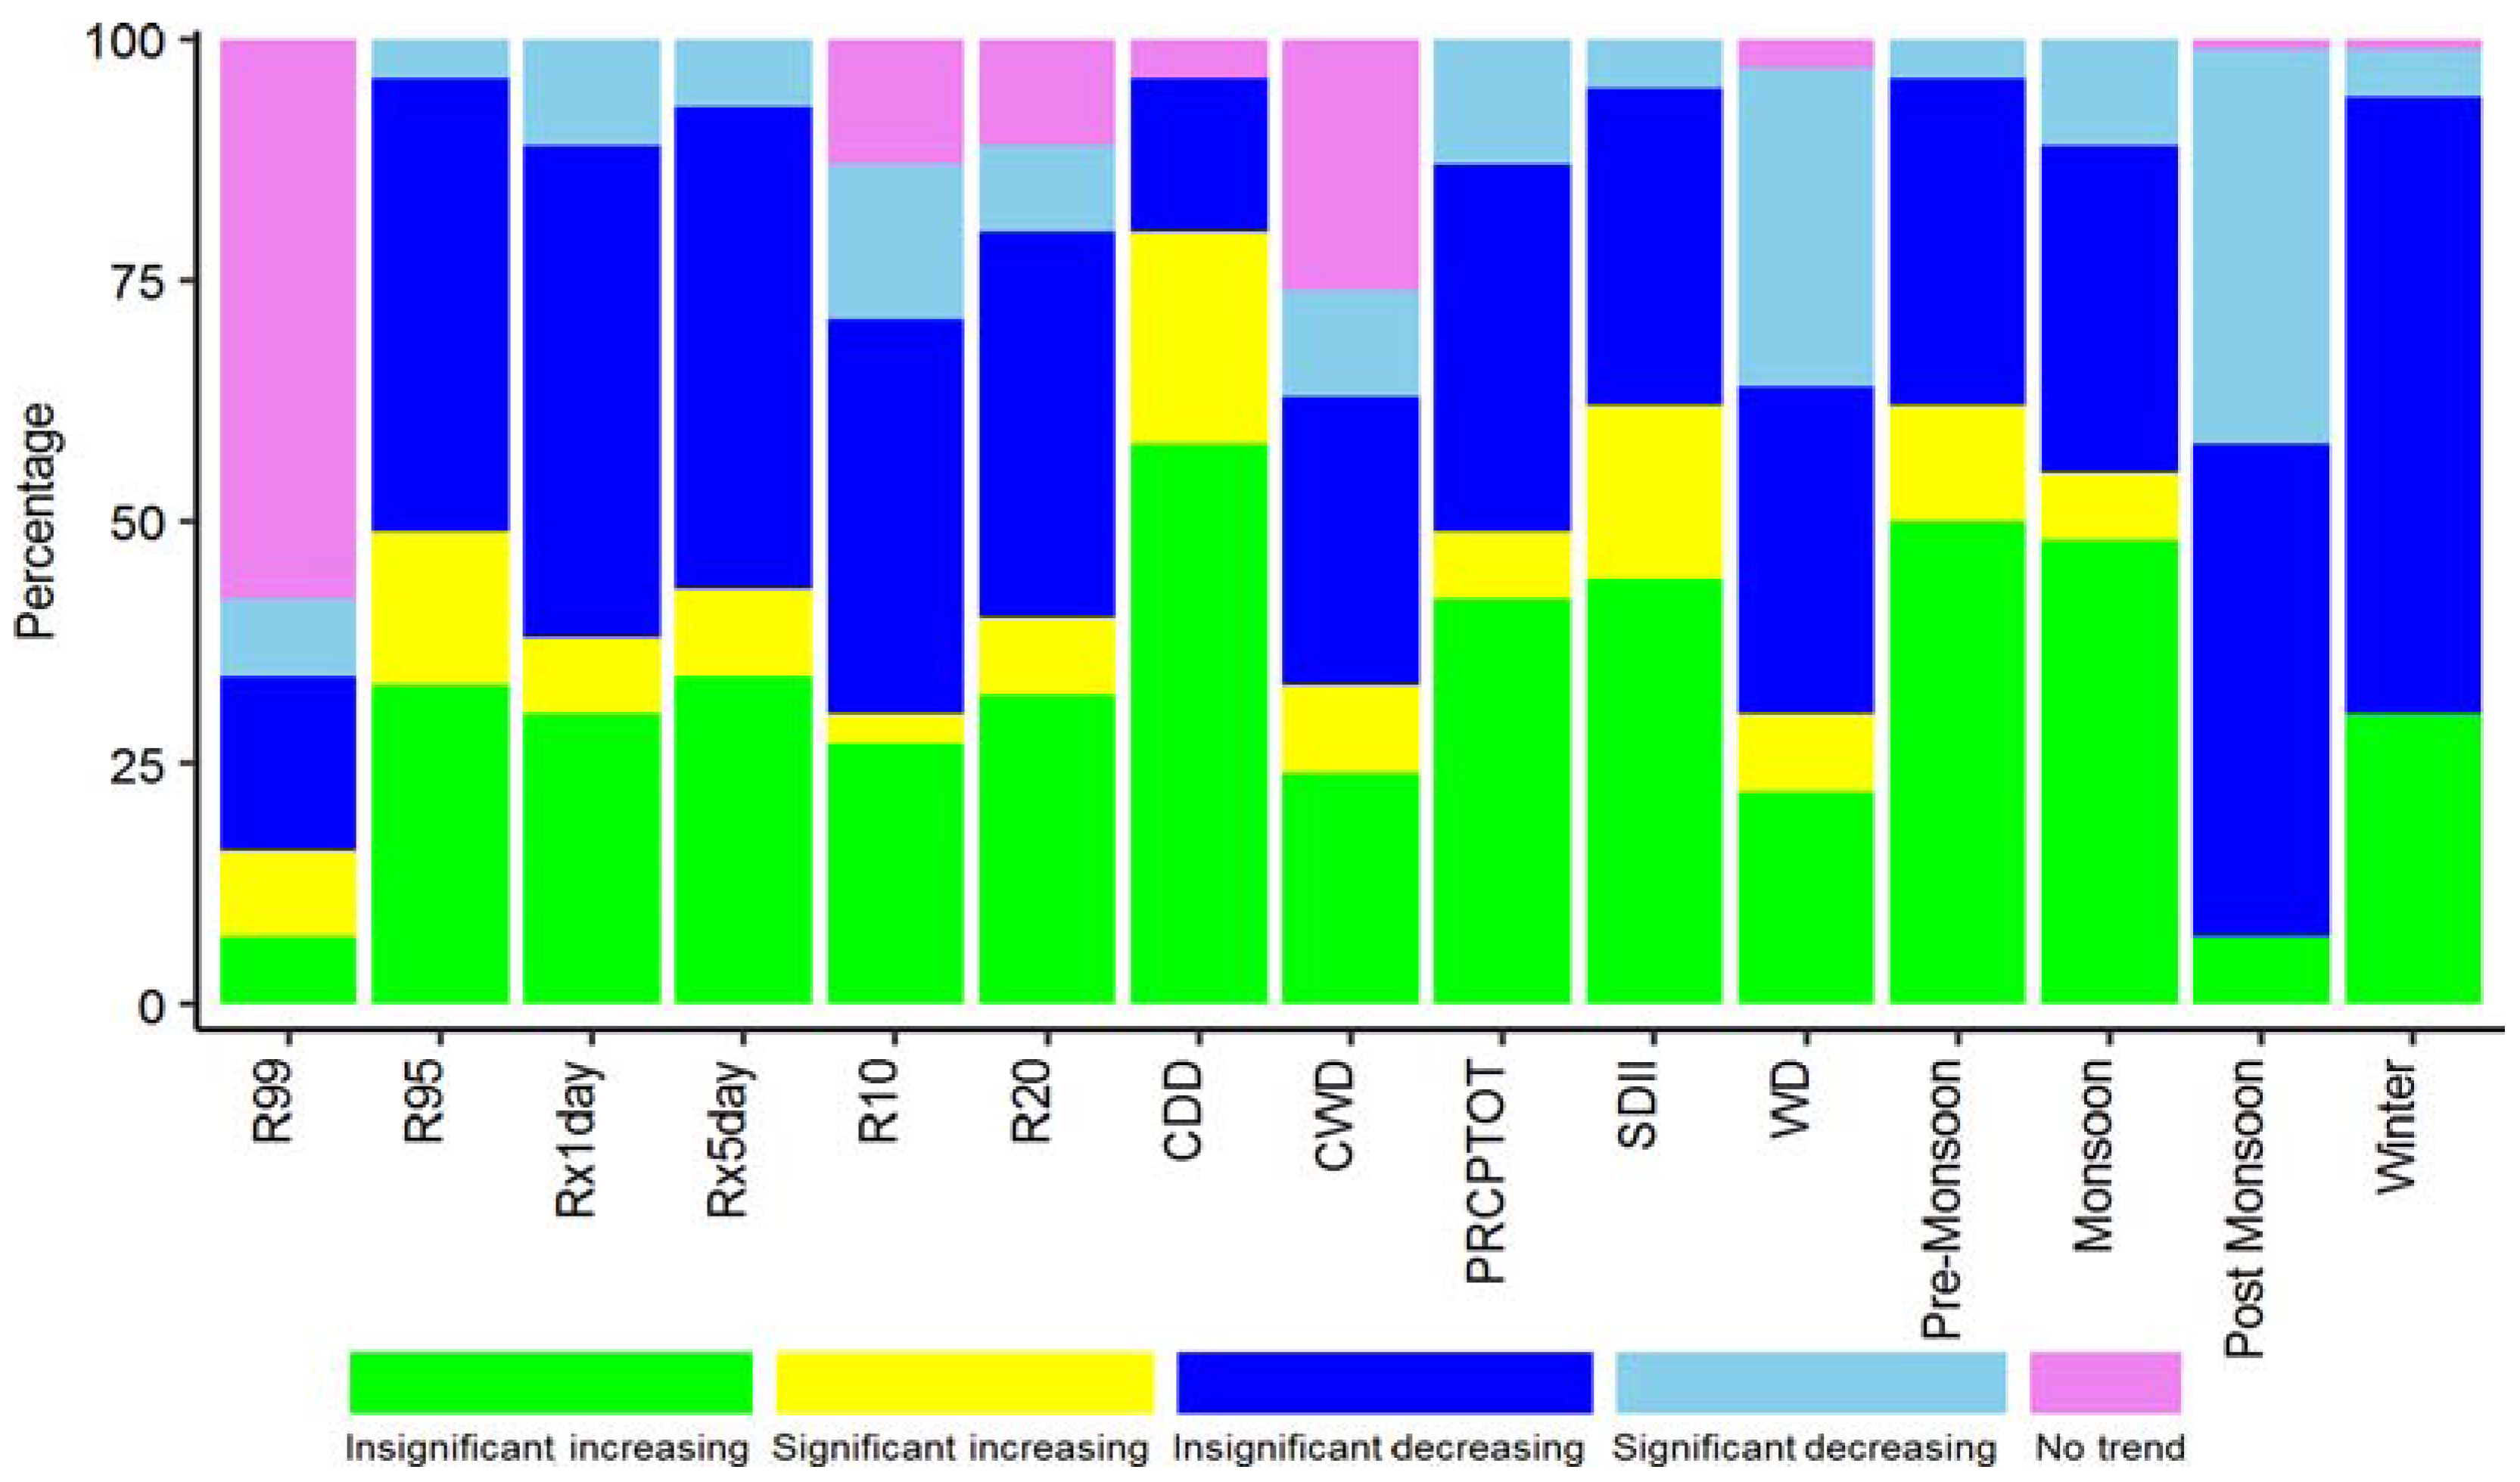
- Spatial distribution of precipitation extremes suggests that the high-intensity-related extremes (95th and 99th percentile thresholds and one-day extreme precipitation) are relatively more intense over the southern lowlands as compared to other regions suggesting higher chances of flooding and inundation in the region. However, the frequency-related extreme indices (WD—wet days, R10 and R20—heavy and very heavy precipitation days) generally feature low values.
- Long-term trends in the monsoonal and annual precipitation (PRCPTOT) indicate their significant increases over the middle mountains and hills within the western region (WM), and over the high mountains within the central region (CH). However, the monsoonal and annual precipitations feature significantly decreasing trends over the whole central and eastern regions, except for the former over the eastern middle-mountain and hills (EM).
- Pre-monsoon precipitation features a significant positive trend over the central high mountain region (CH) and over all lowland regions. On the other hand, winter precipitation features a decreasing trend over most of Nepal; however, such a trend is significant only over the western middle mountains and hills (WM). Similarly, a significantly decreasing trend in the post-monsoonal precipitation has also been observed across Nepal, except over CH and WL.
- A coherent significant positive trend in the high-intensity-related extreme precipitation indices (RX1day, RX5day and R95) has been observed over the middle mountains and hills of the western region (WM) and central high mountains (CH), suggesting more intense precipitation therein. This is further supported by the evidence of significant positive trends in the monsoonal and annual precipitation, with a negative trend in the wet days over that region. In contrast, decreasing trends in the annual precipitation, wet days (WD) and high-intensity-related precipitation extremes (R95, RX1day), together with an increasing trend in the consecutive dry days (CDD) over the central and eastern middle mountains and hills reveals weakening of the intense precipitation extremes.
- Significant positive trend in consecutive dry days (CDD) but negative trend in wet days (WD) are observed across the country, suggesting the prolongation of the dry period.
Supplementary Materials
Acknowledgments
Author Contributions
Conflicts of Interest
References
- Karl, T.R.; Knight, R.W. Secular trends of precipitation amount, frequency, and intensity in the United States. Bull. Am. Meteorol. Soc. 1998, 79, 231–241. [Google Scholar] [CrossRef]
- Kunkel, K.E.; Easterling, D.R.; Redmond, K.; Hubbard, K. Temporal variations of extreme precipitation events in the United States: 1895–2000. Geophys. Res. Lett. 2003, 30, 51–54. [Google Scholar] [CrossRef]
- Kunkel, K.E.; Easterling, D.R.; Kristovich, D.A.R.; Gleason, B.; Stoecker, L.; Smith, R. Recent increases in U.S. heavy precipitation associated with tropical cyclones. Geophys. Res. Lett. 2010, 37, 2–5. [Google Scholar] [CrossRef]
- Alexander, L.V.; Zhang, X.; Peterson, T.C.; Caesar, J.; Gleason, B.; Klein Tank, A.M.G.; Haylock, M.; Collins, D.; Trewin, B.; Rahimzadeh, F.; et al. Global observed changes in daily climate extremes of temperature and precipitation. J. Geophys. Res. Atmos. 2006, 111, D05109. [Google Scholar] [CrossRef]
- Klein Tank, A.M.G.; Peterson, T.C.; Quadir, D.A.; Dorji, S.; Zou, X.; Tang, H.; Santhosh, K.; Joshi, U.R.; Jaswal, A.K.; Kolli, R.K.; et al. Changes in daily temperature and precipitation extremes in central and south Asia. J. Geophys. Res. 2006, 111, D16105. [Google Scholar] [CrossRef]
- Dai, A. Drought under global warming: A review. WIREs Clim. Chang. 2011, 2, 45–65. [Google Scholar] [CrossRef]
- Coumou, D.; Rahmstorf, S. A decade of weather extremes. Nat. Clim. Chang. 2012, 2, 491–496. [Google Scholar] [CrossRef]
- Groisman, P.Y.; Knight, R.W.; Karl, T.R. Changes in intense precipitation over the central United States. J. Hydrometeorol. 2011, 13, 47–66. [Google Scholar] [CrossRef]
- Stocker, T.F.; Qin, D.; Platner, G.K. IPCC Climate Change 2013: The Physical Science Basis; Intergovernmental Panel on Climate Change Working Group I Contribution to the Fifth Assessment Report (AR5); Cambridge University Press: New York, NY, USA, 2013. [Google Scholar]
- Westra, S.; Alexander, L.V.; Zwiers, F.W. Global increasing trends in annual maximum daily precipitation. J. Clim. 2013, 26, 3904–3918. [Google Scholar] [CrossRef]
- Sheikh, M.M.; Manzoor, N.; Ashraf, J.; Adnan, M.; Collins, D.; Hameed, S.; Manton, M.J.; Ahmed, A.U.; Baidya, S.K.; Borgaonkar, H.P.; et al. Trends in extreme daily rainfall and temperature indices over South Asia. Int. J. Climatol. 2014, 1637, 1625–1637. [Google Scholar] [CrossRef]
- United Nations Environment Programme (UNEP). GEO Year Book 2003; UNEP: Nairobi, Kenya, 2003. [Google Scholar]
- Caesar, J.; Alexander, L.V.; Trewin, B.; Tse-ring, K.; Sorany, L.; Vuniyayawa, V.; Keosavang, N.; Shimana, A.; Htay, M.M.; Karmacharya, J.; et al. Changes in temperature and precipitation extremes over the Indo-Pacific region from 1971 to 2005. Int. J. Climatol. 2011, 31, 791–801. [Google Scholar] [CrossRef]
- Donat, M.G.; Alexander, L.V.; Yang, H.; Durre, I.; Vose, R.; Dunn, R.J.H.; Willett, K.M.; Aguilar, E.; Brunet, M.; Caesar, J.; et al. Updated analyses of temperature and precipitation extreme indices since the beginning of the twentieth century: The HadEX2 dataset. J. Geophys. Res. Atmos. 2013, 118, 2098–2118. [Google Scholar] [CrossRef]
- Goswami, B.N.; Venugopal, V.; Sengupta, D.; Madhusoodanan, M.S.; Xavier, P.K. Increasing trend of extreme rain events over India in a warming environment. Science 2006, 314, 1442–1445. [Google Scholar] [CrossRef] [PubMed]
- Joshi, U.R.; Rajeevan, M. Trends in Precipitation Extremes over India; Research Report No.: 3/2006; National Climate Centre, India Meteorological Department: Pune, India, 2006. [Google Scholar]
- Rajeevan, M.; Bhate, J.; Jaswal, A.K. Analysis of variability and trends of extreme rainfall events over India using 104 years of gridded daily rainfall data. Geophys. Res. Lett. 2008, 35, L18708. [Google Scholar]
- Krishnamurthy, C.K.B.; Lall, U.; Kwon, H.H. Changing frequency and intensity of rainfall extremes over India from 1951 to 2003. J. Clim. 2009, 22, 4737–4746. [Google Scholar] [CrossRef]
- Pattanaik, D.R.; Rajeevan, M. Variability of extreme rainfall events over India during southwest monsoon season. Meteorol. Appl. 2010, 17, 88–104. [Google Scholar] [CrossRef]
- Hussain, M.S.; Lee, S. The regional and the seasonal variability of extreme precipitation trends in Pakistan. Asia Pac. J. Atmos. Sci. 2013, 49, 421–441. [Google Scholar] [CrossRef]
- Roy, S.S.; Balling, R.C. Trends in extreme daily precipitation indices in India. Int. J. Climatol. 2004, 24, 457–466. [Google Scholar]
- Revadekar, J.V.; Hameed, S.; Collins, D.; Manton, M.; Sheikh, M.; Borgaonkar, H.P.; Kothawale, D.R.; Adnan, M.; Ahmed, A.U.; Ashraf, J.; et al. Impact of altitude and latitude on changes in temperature extremes over South Asia during 1971–2000. Int. J. Climatol. 2013, 33, 199–209. [Google Scholar] [CrossRef]
- 2013 North India floods. Available online: https://en.wikipedia.org/wiki/2013_North_India_floods (accessed on 25 October 2014).
- Nepal: Landslides and Floods Information Bulletin. Available online: http://reliefweb.int/report/nepal/nepal-landslides-and-floods-information-bulletin-n-1-17-august-2014 (accessed on 25 October 2014).
- Ministry of Agriculture and Cooperatives (MOAAC); World Food Programme (WFP); Food and Agriculture Organization (FAO). 2008/09 Winter Drought in Nepal-Crop and Food Security Assessment Joint Technical Report; Ministry of Agriculture and Cooperatives, Government of Nepal, World Food Programme, Food and Agriculture Organization of the United Nations: Kathmandu, Nepal, 2009.
- Revadekar, J.V.; Preethi, B. Statistical analysis of the relationship between summer monsoon precipitation extremes and foodgrain yield over India. Int. J. Climatol. 2012, 32, 419–429. [Google Scholar] [CrossRef]
- Central Bureau of Statistics (CBS). Statistical Information on Nepalese Agriculture; Central Bureau of Statistics: Kathmandu, Nepal, 2013.
- Baidya, S.K.; Shrestha, M.L.; Sheikh, M.M. Trends in daily climatic extremes of temperature and precipitation in Nepal. J. Hydrol. Meteorol. 2008, 5, 1. [Google Scholar]
- Duncan, J.M.A.; Biggs, E.M.; Dash, J.; Atkinson, P.M. Spatio-temporal trends in precipitation and their implications for water resources management in climate-sensitive Nepal. Appl. Geogr. 2013, 43, 138–146. [Google Scholar] [CrossRef]
- Hofstra, N.; Haylock, M.; New, M.; Jones, P.D. Testing E-OBS European high-resolution gridded data set of daily precipitation and surface temperature. J. Geophys. Res. Atmos. 2009. [Google Scholar] [CrossRef]
- Sharma, K.P. Climate Change: Trends and Impacts on the Livelihoods of People; Technical Report; Jalsrot Vikas Sanstha/Nepal Water Partnership: Kathmandu, Nepal, 2009. [Google Scholar]
- Shrestha, A.B.; Bajracharya, S.R.; Sharma, A.R.; Duo, C.; Kulkarni, A. Observed trends and changes in daily temperature and precipitation extremes over the Koshi river basin 1975–2010. Int. J. Climatol. 2016. [Google Scholar] [CrossRef]
- Mann, H.B. Nonparametric tests against trend. Econometrica 1945, 13, 245–259. [Google Scholar] [CrossRef]
- Kendall, M.G. Rank Correlation Method; Griffin: London, UK, 1975. [Google Scholar]
- Kansakar, S.R.; Hannah, D.M.; Gerrard, J.; Rees, G. Spatial pattern in the precipitation regime in Nepal. Int. J. Climatol. 2004, 24, 1645–1659. [Google Scholar] [CrossRef]
- Shrestha, A.B.; Aryal, R. Climate change in Nepal and its impact on Himalayan glaciers. Reg. Environ. Chang. 2010, 11, 65–77. [Google Scholar] [CrossRef]
- Duncan, J.M.A.; Biggs, E.M. Assessing the accuracy and applied use of satellite-derived precipitation estimates over Nepal. Appl. Geogr. 2012, 34, 626–638. [Google Scholar] [CrossRef]
- Karki, R.; Talchabhadel, R.; Aalto, J.; Baidya, S.K. New climatic classification of Nepal. Theor. Appl. Climatol. 2016, 125, 799–808. [Google Scholar] [CrossRef]
- Nayava, J.L. Rainfall in Nepal. Himal. Rev. 1981, 12, 1–18. [Google Scholar]
- Lang, T.J.; Barros, A.P. Winter storms in the central Himalayas. J. Meteorol. Soc. Jpn. 2004, 82, 829–844. [Google Scholar] [CrossRef]
- Böhner, J. General climatic controls and topoclimatic variations in Central and High Asia. Boreas 2006, 35, 279–295. [Google Scholar] [CrossRef]
- Böhner, J.; Miehe, G.; Miehe, S.; Nagy, L. Climate and weather variability: An introduction to the natural history, ecology, and human environment of the Himalayas, a companion volume to the flora of Nepal. R. Bot. Gard. Edinb. 2015, 4, 23–89. [Google Scholar]
- Hasson, S.; Lucarini, V.; Pascale, S. Hydrological cycle over South and Southeast Asian river basins as simulated by PCMDI/CMIP3 experiments. Earth Syst. Dyn. 2013, 4, 199–217. [Google Scholar] [CrossRef]
- Ichiyanagi, K.; Yamanaka, M.D.; Muraji, Y.; Vaidya, V.K. Precipitation in Nepal between 1987 and 1996. Int. J. Climatol. 2007, 27, 1753–1762. [Google Scholar] [CrossRef]
- Barros, A.P.; Kim, G.; Williams, E.; Nesbitt, S.W. Probing orographic controls in the Himalayas during the monsoon using satellite imagery. Nat. Hazards Earth Syst. Sci. 2004, 4, 29–51. [Google Scholar] [CrossRef]
- Dhar, O.N.; Nandargi, S. Areas of heavy precipitation in the Nepalese Himalayas. Weather 2005, 12, 354–356. [Google Scholar] [CrossRef]
- Bookhagen, B.; Burbank, D.W. Topography, relief, and TRMM-derived rainfall variations along the Himalaya. Geophys. Res. Lett. 2006, 33, L08405. [Google Scholar]
- Miehe, G. Langtang Himal. A Prodormus of the Vegetation Ecology of the Himalayas. Mit Einer Kommentierten Flechtenliste von Josef Poelt; Borntrager: Stuttgart, Germany, 1990. [Google Scholar]
- Putkonen, J. Continuous snow and rain data at 500 to 4400 m altitude near Annapurna, Nepal, 1999–2001. Arct. Antarct. Alp. Res. 2004, 36, 244–248. [Google Scholar] [CrossRef]
- Salerno, F.; Guyennon, N.; Thakuri, S.; Viviano, G.; Romano, E.; Vuillermoz, E.; Cristofanelli, P.; Stocchi, P.; Agrillo, G.; Ma, Y.; et al. Weak precipitation, warm winters and springs impact glaciers of south slopes of Mt. Everest (central Himalaya) in the last 2 decades (1994–2013). Cryosphere 2015, 9, 1229–1247. [Google Scholar] [CrossRef]
- Gerlitz, L.; Bechtel, B.; Böhner, J.; Bobrowski, M.; Bürzle, B.; Müller, M.; Scholten, T.; Schickhoff, U.; Schwab, N.; Weidinger, J. Analytic comparison of temperature lapse rates and precipitation gradients in a Himalayan treeline environment: Implications for statistical downscaling. In Climate Change, Glacier Response, and Vegetation Dynamics in the Himalaya: Contributions toward Future Earth Initiatives; Singh, R.B., Schickhoff, U., Mal, S., Eds.; Springer: Cham, Switzerland, 2016; pp. 49–64. [Google Scholar]
- Barros, A.P.; Lang, T.J. Monitoring the Monsoon in the Himalayas: Observations in Central Nepal, June 2001. Mon. Weather Rev. 2003, 131, 1408–1427. [Google Scholar] [CrossRef]
- Shrestha, A.B.; Awake, C.P.; Dibb, J.E.; Mayewski, P.A. Precipitation fluctuations in the Nepal Himalaya and its vicinity and relationship with some large scale climatological parameters. Int. J. Climatol. 2000, 2, 317–327. [Google Scholar] [CrossRef]
- Sharma, K.P.; Moore, B., III; Vorosmarty, C.J. Anthropogenic, climatic and hydrologic trends in the Koshi Basin, Himalaya. Clim. Chang. 2000, 47, 141–165. [Google Scholar] [CrossRef]
- Shrestha, M.L. Interannual variation of summer monsoon rainfall over Nepal and its relation to southern oscillation index. Meteorol. Atmos. Phys. 2000, 75, 21–28. [Google Scholar] [CrossRef]
- Gautam, D.K.; Regmi, S.K. Recent trends in the onset and withdrawal of summer monsoon over Nepal. Ecopersia 2013, 1, 353–367. [Google Scholar]
- Panthi, J.; Dahal, P.; Shrestha, M.; Aryal, S.; Krakauer, N.; Pradhanang, S.; Lakhankar, T.; Jha, A.; Sharma, M.; Karki, R. Spatial and temporal variability of rainfall in the Gandaki River Basin of Nepal Himalaya. Climate 2015, 3, 210–226. [Google Scholar] [CrossRef]
- Talchabhadel, R.; Karki, R.; Parajuli, B. Intercomparison of precipitation measured between automatic and manual precipitation gauge in Nepal. Measurement 2016. [Google Scholar] [CrossRef]
- Zhang, X.; Yang, F. User Manual; RClimDex 1.0; Climate Research Branch Environment: Downsview, ON, Canada, 2004. [Google Scholar]
- Vincent, L.A.; Peterson, T.C.; Barros, V.R.; Marino, M.B.; Rusticucci, M.; Carrasco, G.; Ramirez, E.; Alves, L.M.; Ambrizzi, T.; Berlato, M.A.; et al. observed trends in indices of daily temperature extremes in South America 1960–2000. J. Clim. 2005, 18, 5011–5023. [Google Scholar] [CrossRef]
- Aguilar, E.; Auer, I.; Brunet, M.; Peterson, T.C.; Wieringa, J. Guidelines on Climate Metadata and Homogenization; World Meteorological Organization: Geneva, Switzerland, 2003. [Google Scholar]
- Wang, X.L. Penalized maximal F-test for detecting undocumented mean-shifts without trend-change. J. Atmos. Ocean. Techol. 2008, 25, 368–384. [Google Scholar] [CrossRef]
- Hasson, S.; Böhner, J.; Lucarini, V. Prevailing climatic trends and runoff response from Hindukush–Karakoram–Himalaya, upper Indus basin. Earth Syst. Dyn. 2015, 6, 579–653. [Google Scholar] [CrossRef]
- Hasson, S.U.; Gerlitz, L.; Schickhoff, U.; Scholten, T.; Böhner, J. Recent climate change over High Asia. In Climate Change, Glacier Response, and Vegetation Dynamics in the Himalaya: Contributions toward Future Earth Initiatives; Singh, R.B., Schickhoff, U., Mal, S., Eds.; Springer: Cham, Switzerland, 2016; pp. 29–48. [Google Scholar]
- Duan, W.; He, B.; Takara, K.; Luo, P.; Hu, M.; Alias, N.E.; Nover, D. Changes of precipitation amounts and extremes over Japan between 1901 and 2012 and their connection to climate indices. Clim. Dyn. 2015, 45, 2273–2292. [Google Scholar] [CrossRef]
- Zhang, X.; Alexander, L.; Hegerl, G.C.; Jones, P.; Tank, A.K.; Peterson, T.C.; Trewin, B.; Zwiers, F.W. Indices for monitoring changes in extremes based on daily temperature and precipitation data. WIREs Clim. Chang. 2011, 2, 851–870. [Google Scholar] [CrossRef]
- Bookhagen, B. Appearance of extreme monsoonal rainfall events and their impact on erosion in the Himalaya. Geomat. Nat. Hazards Risk 2010, 1, 37–50. [Google Scholar] [CrossRef]
- Casanueva, A.; Rodríguez-Puebla, C.; Frías, M.D.; González-Reviriego, N. Variability of extreme precipitation over Europe and its relationships with teleconnection patterns. Hydrol. Earth Syst. Sci. 2014, 18, 709–725. [Google Scholar] [CrossRef]
- Sen, P.K. Estimates of the regression coefficient based on Kendall’s tau. J. Am. Stat. Assoc. 1968, 63, 1379–1389. [Google Scholar] [CrossRef]
- Theil, H. A rank-invariant method of linear and polynomial regression analysis, I, II, III. In Henri Theil’s Contributions to Economics and Econometrics; Springer: Amsterdam, The Netherlands, 1992; pp. 386–392, 512–525, 1397–1412. [Google Scholar]
- Douglas, E.M.; Vogel, R.M.; Kroll, C.N. Trends in floods and low flows in the United States: Impact of spatial correlation. J. Hydrol. 2000, 240, 90–105. [Google Scholar] [CrossRef]
- Zhang, X.; Vincent, L.A.; Hogg, W.D.; Niitsoo, A. Temperature and precipitation trends in Canada during the 20th century. Atmos. Ocean 2000, 38, 395–429. [Google Scholar] [CrossRef]
- Yue, S.; Wang, C.Y. Regional streamflow trend detection with consideration of both temporal and spatial correlation. Int. J. Climatol. 2002, 22, 933–946. [Google Scholar] [CrossRef]
- Yue, S.; Pilon, P.; Phinney, B. Canadian streamflow trend detection: Impacts of serial and cross-correlation. Hydrol. Sci. J. 2003, 48, 51–63. [Google Scholar] [CrossRef]
- Yue, S.; Pilon, P.; Phinney, B.; Cavadias, G. The influence of autocorrelation on the ability to detect trend in hydrological series. Hydrol. Process. 2002, 16, 1807–1829. [Google Scholar] [CrossRef]
- Von Storch, V.H. Misuses of statistical analysis in climate research. In Analysis of Climate Variability: Applications of Statistical Techniques; von Storch, H., Navarra, A., Eds.; Springer: Berlin, Germany, 1995; pp. 11–26. [Google Scholar]
- Hamed, K.H.; Rao, A.R. A modified Mann-Kendall trend test for autocorrelated data. J. Hydrol. 1998, 204, 182–196. [Google Scholar] [CrossRef]
- Burn, D.H.; Cunderlik, J.; Pietroniro, A. Climatic influences on streamflow timing in the headwaters of the Mackenzie River Basin. J. Hydrol. 2008, 352, 225–238. [Google Scholar] [CrossRef]
- Shadmani, M.; Marofi, S.; Roknian, M. Trend analysis in reference evapotranspiration using Mann-Kendall and Spearman’s Rho tests in arid regions of Iran. Water Resour. Manag. 2012, 26, 211–224. [Google Scholar] [CrossRef]
- Wu, H.; Soh, L.; Samal, A. Trend analysis of streamflow drought events in Nebraska. Water Resour. Manag. 2008, 22, 145–164. [Google Scholar] [CrossRef]
- Lacombe, G.; McCartney, M. Uncovering consistencies in Indian rainfall trends observed over the last half century. Clim. Chang. 2014, 123, 287–299. [Google Scholar] [CrossRef]
- Vogel, R.M.; Kroll, C.N. Low-flow frequency analysis using probability plot correlation coefficients. J. Water Resour. Plan. Manag. 1989, 115, 338–357. [Google Scholar] [CrossRef]
- Lettenmaier, D.P.; Wood, E.F.; Wallis, J.R. Hydro-climatological trends in the continental United-States, 1948–88. J. Clim. 1994, 7, 586–607. [Google Scholar] [CrossRef]
- Livezey, R.E.; Chen, W.Y. Statistical field significance and its determination by Monte Carlo techniques. Mon. Weather Rev. 1983, 111, 46–59. [Google Scholar] [CrossRef]
- Ventura, V.; Paciorek, C.J.; Risbey, J.S. Controlling the proportion of falsely rejected hypotheses when conducting multiple tests with climatological data. J. Clim. 2004, 17, 4343–4356. [Google Scholar] [CrossRef]
- Renard, B.; Lang, M. Use of a Gaussian copula for multivariate extreme value analysis: Some case studies in hydrology. Adv. Water Resour. 2007, 30, 897–912. [Google Scholar] [CrossRef]
- Efron, B. Bootstrap methods: Another look at the Jackknife. Ann. Stat. 1979, 7, 1–26. [Google Scholar] [CrossRef]
- Weibull, W. A statistical theory of strength of materials. Ing. Vetensk. Akad. Handl. 1939, 151, 1–45. [Google Scholar]
- Petrow, T.; Merz, B. Trends in flood magnitude, frequency and seasonality in Germany in the period 1951–2002. J. Hydrol. 2009, 371, 129–141. [Google Scholar] [CrossRef]
- Department of Hydrology and Meteorology (DHM). Study of Climate and Climatic Variation over Nepal; Technical Report; Department of Hydrology and Meteorology: Kathmandu, Nepal, 2015. Available online: http://www.dhm.gov.np/climate/ (accessed on 1 October 2016).
- Shrestha, D.; Singh, P.; Nakamura, K. Spatiotemporal variation of rainfall over the central Himalayan region revealed by TRMM precipitation radar. J. Geophys. Res. Atmos. 2012, 117, D22106. [Google Scholar] [CrossRef]
- Dahal, R.K.; Hasegawa, S. Representative rainfall thresholds for landslides in the Nepal Himalaya. Geomorphology 2008, 100, 429–443. [Google Scholar] [CrossRef]
- Practical Action Nepal Office. Temporal and Spatial Variability of Climate Change over Nepal (1976–2005); Technical Report; Practical Action Nepal Office: Kathmandu, Nepal, 2009; Available online: http://practicalaction.org/file/region_nepal/Climate Change 1976–2005.pdf (accessed on 4 October 2014).
- Mäkelä, A.; Shrestha, R.; Karki, R. Thunderstorm characteristics in Nepal during the pre-monsoon season 2012. Atmos. Res. 2014, 137, 91–99. [Google Scholar] [CrossRef]
- Hasson, S.U.; Pascale, S.; Lucarini, V.; Böhner, J. Seasonal cycle of precipitation over major river basins in South and Southeast Asia: A review of the CMIP5 climate models data for present climate and future climate projections. Atmos. Res. 2016, 180, 42–63. [Google Scholar] [CrossRef]
- Hasson, S.; Lucarini, V.; Pascale, S.; Böhner, J. Seasonality of the hydrological cycle in major South and Southeast Asian river basins as simulated by PCMDI/CMIP3 experiments. Earth Syst. Dyn. 2014, 5, 67–87. [Google Scholar] [CrossRef]
- Nayava, J.L. Variations of rice yield with rainfall in Nepal during 1971–2000. J. Hydrol. Meteorol. 2008, 5, 93–102. [Google Scholar]
- Khatiwada, K.R.; Panthi, J.; Shrestha, M.L. Hydro-climatic variability in the Karnali River Basin. Climate 2016. [Google Scholar] [CrossRef]
- Dahal, P.; Shrestha, N.S.; Shrestha, M.L.; Krakauer, N.Y.; Panthi, J.; Pradhanang, S.M.; Jha, A.; Lakhankar, T. Drought risk assessment in central Nepal: Temporal and spatial analysis. Nat. Hazards 2016, 80, 1913–1932. [Google Scholar] [CrossRef]
- Aryal, S. Rainfall and water requirement of rice during growing period. J. Agric. Environ. 2012, 13, 1–4. [Google Scholar] [CrossRef]
- Wang, S.Y.; Yoon, J.H.; Gillies, R.R.; Cho, C. What caused the winter drought in western Nepal during recent years? J. Clim. 2013, 26, 8241–8256. [Google Scholar] [CrossRef]
- Cannon, F.; Carvalho, L.M.V.; Jones, C.; Bookhagen, B. Multi-annual variations in winter westerly disturbance activity affecting the Himalaya. Clim. Dyn. 2015, 44, 441–455. [Google Scholar] [CrossRef]
- Shekhar, M.S.; Chand, H.; Kumar, S.; Srinivasan, K.; Ganju, A. Climate-change studies in the western Himalaya. Ann. Glaciol. 2010, 51, 105–112. [Google Scholar] [CrossRef]
- Sigdel, M.; Ma, Y. Variability and trends in daily precipitation extremes on the northern and southern slopes of the central Himalaya. Theor. Appl. Climatol. 2016. [Google Scholar] [CrossRef]
- Cho, C.; Li, R.; Wang, S.Y.; Ho, J.; Robert, Y. Anthropogenic footprint of climate change in the June 2013 Northern India flood. Clim. Dyn. 2016, 46, 797–805. [Google Scholar] [CrossRef]
- Vellore, R.K.; Kaplan, M.L.; Krishnan, R.; Lewis, J.M.; Sabade, S.; Deshpande, N.; Singh, B.B.; Madhura, R.K.; Rama Rao, M.V.S. Monsoon-extratropical circulation interactions in Himalayan extreme rainfall. Clim. Dyn. 2016, 46, 3517–3546. [Google Scholar] [CrossRef]
- Vellore, R.K.; Krishnan, R.; Pendharkar, J.; Choudhury, A.D.; Sabin, T.P. On the anomalous precipitation enhancement over the Himalayan foothills during monsoon breaks. Clim. Dyn. 2014, 43, 2009–2031. [Google Scholar] [CrossRef]
- Song, X.; Song, S.; Sun, W.; Mu, X.; Wang, S.; Li, J.; Li, Y. Recent changes in extreme precipitation and drought over the Songhua River Basin, China, during 1960–2013. Atmos. Res. 2015, 157, 137–152. [Google Scholar] [CrossRef]
- Shahid, S. Trends in extreme rainfall events of Bangladesh. Theor. Appl. Climatol. 2011, 104, 489–499. [Google Scholar] [CrossRef]
- Sigdel, M.; Ikeda, M. Spatial and temporal analysis of drought in Nepal using standardized precipitation index and its relationship with climate indices. J. Hydrol. Meteorol. 2010, 7, 59–74. [Google Scholar] [CrossRef]
- Kafle, H.K. Spatial and temporal variation of drought in far and mid-western regions of Nepal: Time series analysis (1982–2012). Nepal J. Sci. Technol. 2014, 15, 65–76. [Google Scholar] [CrossRef]
- Miyan, M.A. Droughts in Asian least developed countries: Vulnerability and sustainability. Weather Clim. Extremes 2015, 7, 8–23. [Google Scholar] [CrossRef]
- Yao, T.; Thompson, L.; Yang, W.; Yu, W.; Gao, Y.; Guo, X.; Yang, X.; Duan, K.; Zhao, H.; Xu, B.; et al. Different glacier status with atmospheric circulations in Tibetan Plateau and surroundings. Nat. Clim. Chang. 2012, 2, 663–667. [Google Scholar] [CrossRef]
- Manton, M.J.; Haylock, M.R.; Hennessy, K.J.; Nicholls, N.; Chambers, L.E.; Collins, D.A.; Daw, G.; Finet, A.; Gunawan, D.; Inape, K.; et al. Trends in extreme daily rainfall and temperature in Southeast Asia and the South Pacific: 1961–1998. Int. J. Climatol. 2001, 21, 269–284. [Google Scholar] [CrossRef]


| Region | ID | Name | Lat (°) | Lon (°) | Height (m) |
|---|---|---|---|---|---|
| WL | 106 | Belauri santipur | 28.683 | 80.35 | 159 |
| 209 | Dhangadhi (atariya) | 28.8 | 80.55 | 187 | |
| 416 | Nepalgunj Reg. off. | 28.052 | 81.523 | 144 | |
| 510 | Koilabas | 27.7 | 82.533 | 320 | |
| WM | 101 | Kakerpakha | 29.65 | 80.5 | 842 |
| 103 | Patan (west) | 29.467 | 80.533 | 1266 | |
| 104 | Dadeldhura | 29.3 | 80.583 | 1848 | |
| 201 | Pipalkot | 29.617 | 80.867 | 1456 | |
| 202 | Chainpur (west) | 29.55 | 81.217 | 1304 | |
| 203 | Silgadhi doti | 29.267 | 80.983 | 1360 | |
| 206 | Asara ghat | 28.953 | 81.442 | 650 | |
| 303 | Jumla | 29.275 | 82.18 | 2366 | |
| 308 | Nagma | 29.2 | 81.9 | 1905 | |
| 402 | Dailekh | 28.85 | 81.717 | 1402 | |
| 404 | Jajarkot | 28.7 | 82.2 | 1231 | |
| 406 | Surkhet | 28.587 | 81.635 | 720 | |
| 504 | Libang gaun | 28.3 | 82.633 | 1270 | |
| 511 | Salyan bazar | 28.383 | 82.167 | 1457 | |
| CL | 703 | Butwal | 27.694 | 83.466 | 205 |
| 902 | Rampur | 27.654 | 84.351 | 169 | |
| 903 | Jhawani | 27.591 | 84.522 | 177 | |
| 907 | Amlekhganj | 27.281 | 84.992 | 310 | |
| 909 | Simara airport | 27.164 | 84.98 | 137 | |
| 910 | Nijgadh | 27.183 | 85.167 | 244 | |
| 911 | Parwanipur | 27.079 | 84.933 | 115 | |
| 912 | Ramoli bairiya | 27.017 | 85.383 | 152 | |
| 1109 | Pattharkot (east) | 27.1 | 85.66 | 162 | |
| 1110 | Tulsi | 27.013 | 85.921 | 251 | |
| 1111 | Janakpur airport | 26.711 | 85.924 | 78 | |
| CM | 701 | Ridi bazar | 27.95 | 83.433 | 442 |
| 722 | Musikot | 28.167 | 83.267 | 1280 | |
| 802 | Khudi bazar | 28.283 | 84.367 | 823 | |
| 804 | Pokhara airport | 28.2 | 83.979 | 827 | |
| 807 | Kunchha | 28.133 | 84.35 | 855 | |
| 808 | Bandipur | 27.942 | 84.406 | 995 | |
| 810 | Chapkot | 27.883 | 83.817 | 460 | |
| 814 | Lumle | 28.297 | 83.818 | 1740 | |
| 904 | Chisapani gadhi | 27.56 | 85.139 | 1729 | |
| 1008 | Nawalpur | 27.813 | 85.625 | 1457 | |
| 1015 | Thankot | 27.688 | 85.221 | 1457 | |
| 1022 | Godavari | 27.593 | 85.379 | 1527 | |
| 1023 | Dolal ghat | 27.639 | 85.705 | 659 | |
| 1029 | Khumaltar | 27.652 | 85.326 | 1334 | |
| 1030 | Kathmanduairport | 27.704 | 85.373 | 1337 | |
| 1115 | Nepalthok | 27.42 | 85.849 | 698 | |
| CH | 601 | Jomsom | 28.78 | 83.72 | 2744 |
| 604 | Thakmarpha | 28.739 | 83.681 | 2655 | |
| 607 | Lete | 28.633 | 83.609 | 2490 | |
| EL | 1112 | Chisapani bazar | 26.93 | 86.145 | 107 |
| 1213 | Udayapur gadhi | 26.933 | 86.517 | 1175 | |
| 1216 | Siraha | 26.656 | 86.212 | 102 | |
| 1311 | Dharan bazar | 26.792 | 87.285 | 310 | |
| 1316 | Chatara | 26.82 | 87.159 | 105 | |
| 1319 | Biratnagar airport | 26.481 | 87.264 | 72 | |
| 1320 | Tarahara | 26.699 | 87.279 | 121 | |
| 1408 | Damak | 26.671 | 87.703 | 119 | |
| 1409 | Anarmani birta | 26.625 | 87.989 | 122 | |
| EM | 1102 | Charikot | 27.667 | 86.05 | 1940 |
| 1103 | Jiri | 27.633 | 86.233 | 2003 | |
| 1202 | Chaurikhark | 27.7 | 86.717 | 2619 | |
| 1203 | Pakarnas | 27.443 | 86.569 | 1944 | |
| 1204 | Aisealukhark | 27.36 | 86.749 | 2063 | |
| 1206 | Okhaldhunga | 27.308 | 86.504 | 1731 | |
| 1207 | Mane bhanjyang | 27.215 | 86.444 | 1528 | |
| 1210 | Kurule ghat | 27.136 | 86.43 | 341 | |
| 1211 | Khotang bazar | 27.029 | 86.843 | 1305 | |
| 1303 | Chainpur (east) | 27.292 | 87.317 | 1262 | |
| 1305 | Leguwa ghat | 27.154 | 87.289 | 444 | |
| 1306 | Munga | 27.05 | 87.244 | 1457 | |
| 1307 | Dhankuta | 26.983 | 87.346 | 1192 | |
| 1308 | Mul ghat | 26.932 | 87.32 | 286 | |
| 1309 | Tribeni | 26.914 | 87.16 | 146 | |
| 1322 | Machuwaghat | 26.938 | 87.155 | 168 | |
| 1325 | Dingla | 27.353 | 87.146 | 1169 | |
| 1403 | Lungthung | 27.55 | 87.783 | 1780 | |
| 1410 | Himali gaun | 26.887 | 88.027 | 1654 |
| Category | ID | Name of Index | Definition | Unit |
|---|---|---|---|---|
| HIP | R95 | Very wet days | Annual total precipitation of days in >95th percentile | mm |
| HIP | RX1day | Max 1-day precipitation amount | Annual maximum 1-day precipitation | mm |
| HIP | RX5day | Max 5-day precipitation amount | Annual maximum consecutive 5-day precipitation | mm |
| HIP | R99 | Extremely wet days | Annual total precipitation of days in >99th percentile | mm |
| FP | R10 | Number of heavy precipitation days | Annual count of days when precipitation is ≥10 mm | Days |
| FP | R20 | Number of very heavy precipitation days | Annual count of days when precipitation is ≥20 mm | Days |
| DWS | CDD | Consecutive dry days | Maximum number of consecutive dry days (precipitation <1 mm) | Days |
| DWS | CWD | Consecutive wet days | Maximum number of consecutive wet days (precipitation ≥1 mm) | Days |
| EX | WD | Annual wet/rainy days | Annual count of days when precipitation is ≥1 mm | Days |
| EX | PRCPTOT | Annual total wet-day precipitation | Annual total from days ≥1 mm precipitation | mm |
| EX | SDII | Simple daily intensity index | Ratio of annual total to WD in a year | mm/day |
© 2017 by the authors. Licensee MDPI, Basel, Switzerland. This article is an open access article distributed under the terms and conditions of the Creative Commons Attribution (CC BY) license ( http://creativecommons.org/licenses/by/4.0/).
Share and Cite
Karki, R.; Hasson, S.u.; Schickhoff, U.; Scholten, T.; Böhner, J. Rising Precipitation Extremes across Nepal. Climate 2017, 5, 4. https://doi.org/10.3390/cli5010004
Karki R, Hasson Su, Schickhoff U, Scholten T, Böhner J. Rising Precipitation Extremes across Nepal. Climate. 2017; 5(1):4. https://doi.org/10.3390/cli5010004
Chicago/Turabian StyleKarki, Ramchandra, Shabeh ul Hasson, Udo Schickhoff, Thomas Scholten, and Jürgen Böhner. 2017. "Rising Precipitation Extremes across Nepal" Climate 5, no. 1: 4. https://doi.org/10.3390/cli5010004