Article

Hydroclimatic Characteristics of the 2012–2015 California Drought from an Operational Perspective

Division of Flood Management, California Department of Water Resources, 3310 El Camino Avenue, Sacramento, CA 95821, USA
*
Author to whom correspondence should be addressed.
Climate 2017, 5(1), 5; https://doi.org/10.3390/cli5010005
Submission received: 29 November 2016 / Revised: 11 January 2017 / Accepted: 16 January 2017 / Published: 21 January 2017
(This article belongs to the Special Issue Climate Extremes, the Past and the Future)

Abstract

:
California experienced an extraordinary drought from 2012–2015 (which continues into 2016). This study, from an operational perspective, reviewed the development of this drought in a hydroclimatic framework and examined its characteristics at different temporal and spatial scales. Observed and reconstructed operational hydrologic indices and variables widely used in water resources planning and management at statewide and (hydrologic) regional scales were employed for this purpose. Parsimonious metrics typically applied in drought assessment and management practices including the drought monitor category, percent of average, and rank were utilized to facilitate the analysis. The results indicated that the drought was characterized by record low snowpack (statewide four-year accumulated deficit: 280%-of-average), exceptionally low April-July runoff (220%-of-average deficit), and significantly below average reservoir storage (93%-of-average deficit). During the period from 2012–2015, in general, water year 2015 stood out as the driest single year; 2014–2015 was the driest two-year period; and 2013–2015 tended to be the driest three-year period. Contrary to prior studies stating that the 2012–2015 drought was unprecedented, this study illustrated that based on eight out of 28 variables, the 2012–2015 drought was not without precedent in the record period. Spatially, on average, the South Coast Region, the Central Coast Region, the Tulare Region, and the San Joaquin Region generally had the most severe drought conditions. Overall, these findings are highly meaningful for water managers in terms of making better informed adaptive management plans.

1. Introduction

Drought is an economically and environmentally disruptive natural hazard typically characterized by deficits in water resources. Different from other natural hazards including floods, hurricanes, and earthquakes, drought is a gradual hazard with a slow onset but can last for months to years and cover extensively large areas [1,2,3]. Drought affects millions of people and causes widespread damages in the world every year [1]. In the United States alone, drought causes an annual loss of $6–8 billion on average [4,5]. The specific impacts of drought vary from region to region depending on regional resilience and coping capacities [6]. Advanced management practices are required to mitigate the adverse impacts of drought, which is particularly the case for dry areas including the state of California. Foremost in these practices is to understand the characteristics of drought events from an operational perspective. This understanding is critical in guiding drought response actions.
As a state with over 38 million people and a globally important economy, California is prone to drought with frequent drought events recorded. The most noticeably previous drought periods include 1929–1934, 1976–1977, 1987–1992, and 2007–2009. Currently, the state is in the fifth year of another prolonged drought originating in 2012. The first four years (2012–2015) of the drought stand out as the driest and warmest four consecutive years in terms of statewide precipitation and temperature, respectively. The drought had both well perceived and profound negative impacts on the economy, society, and environment of the state.
Large deficits in precipitation combined with higher than average temperatures caused progressive canopy water loss in California’s forests and devastating wildfires in the mountainous areas. An estimate of 888 million large trees experienced measurable canopy water loss of which about 58 million trees had larger than 30% loss [7]. From 2011 to August 2015, it was estimated that about 27 million trees died in the forests [8]. If this drought continues, hundreds of millions of trees may suffer sufficient canopy water loss, resulting in death [7]. Forests undergoing significant canopy water loss are more vulnerable to wildfires. Two of the largest three California wildfires occurred within 2012–2015, including the Rush Fire (August 2012 in Lassen County) and Rim Fire (August 2013 in Tuolumne County), which collectively burned an area of about 2140 km2 (0.53 million acres versus an area of 0.27 million acres burned by the largest fire in the record period) [9]. Two of the top 10 most damaging wildfires also occurred in the drought period, including the Valley Fire (September 2015 in Lake, Napa, and Sonoma counties) and the Butte Fire (September 2015 in Amador and Calaveras counties). Those two fires caused six fatalities and damaged 2876 structures (versus 25 fatalities and 2900 structures claimed by the most damaging fire in the record period) [10].
Furthermore, low river flows induced from shortfalls in precipitation and snowpack combined with high temperatures caused widespread water quality deterioration in streams and wetlands, leading to degraded habitat for native fishes and water birds and significantly reduced their populations [11]. Record low water allocation (5%) for State Water Project contractors was registered in calendar year 2014. Additionally, groundwater was largely over pumped during the drought to offset the deficits in surface water. This led to significant land subsidence, most notably in the Central Valley. Specifically, parts of the San Joaquin Region have been falling at a rate of five centimeters (two inches) per month [12], putting the integrity of the water supply and conveyance facilities in this region at greater than ever risk of damage.
The drought also had widespread impact on the economy of the state. On a single-year level, it was estimated that 17,100 jobs were lost and about 170 km2 of farmland (428,000 acres) were fallowed in the 2014 drought, about 50% more severe than the 2009 drought, which was the last year of the previous modern drought (2007–2009) in the state [13]. The impacts of the 2015 drought were even more severe, with an estimation of 21,000 jobs lost and about 220 km2 (54,000 acres) fallowed [14]. The monetary losses to all economic sectors were estimated at about $2.7 billion in 2015 versus $2.2 billion caused by the 2014 drought.
In light of the adverse impacts of the drought, water usage and management adaptions have been taken during the drought period across the state to mitigate those impacts. Water conservation efforts have been ongoing in urban areas, including the mandate of a 25% cut in urban water usage (California Governor’s Executive Order B-29-15, https://www.gov.ca.gov/). Shifts toward perennial high revenue (per unit of water usage) crops have been in progress, leading to continued increases in the economic value of crops in spite of increasing acreages of field crop land fallowed during the drought [15]. The drought has also led to the enactment of the most comprehensive groundwater legislation, the Sustainable Groundwater Management Act (SGMA), in state history. The SGMA requires the most stressed basins to reach sustainability by 2040 [16].
Given the uniqueness of the 2012–2015 drought, a wealth of studies have been dedicated to exploring the cause and severity of the drought. The major cause of the drought has been identified as multi-year deficits in precipitation over the state linked to an abnormal high pressure ridge over the northeastern Pacific Ocean [17,18,19]. It was also reported that warming temperatures contributed to the evolvement of the drought [20,21,22,23,24,25,26,27].
Despite the high consensus on the cause of the drought, there was low consensus across the literature on the severity of the drought. Using paleoclimate reconstruction data (dating back to AD 800) for Central and Southern California, Griffin and Anchukaitis [28] found out that (1) according to the June/July/August (June-August) Palmer Drought Severity Index (PDSI) [29], the 2012–2014 drought was the worst in the analysis period (800–2014) while 2014 was the driest year in at least the past 1200 years; (2) evaluating precipitation deficits, however, the conditions in 2014 and 2012–2014 were not unique in the analysis period. In contrast, using the same raw PDSI reconstructions but with different spatial average and bias correction procedures, Robeson [30] observed that based on June-August PDSI, the 2014 drought had a return period of 140–180 years, the 2012–2014 drought was almost a 10,000 year event, and the 2012–2015 drought was unprecedented with a nearly incalculable return period. In spite of having strikingly different findings, both studies shared a number of limitations including (1) the PDSI is determined from precipitation and temperature data. While both variables are indispensable in drought analysis, they need to be considered together with other variables including streamflow, snowpack, reservoir storage, and groundwater level; (2) the wet season of California is typically from November to April (rather than June-August) when the majority of the annual precipitation falls. The June-August PDSI may not be the most appropriate index in assessing the severity of the drought for California; (3) the results tend to be sensitive to the statistical methods employed. However, with significant theoretical implications in the research community, their practical meaning in terms of guiding real-world drought management operations seems to be circumscribed; (4) the study area is focused on Central and Southern California. Northern California is also important, particularly due to the fact that most of the state’s annual precipitation and runoff occurs in the northern half of the state.
This study aims to present a comprehensive assessment of the 2012–2015 California Drought from an operational perspective. The study extends previous studies [28,30] in the context of (1) examining typical hydroclimatic variables and operational drought assessment metrics applied in routine drought management practices; and (2) covering all hydrologic regions across the state including the Northern half. The study addresses the following science questions, which are critical for drought managers in making adaptive plans: (1) how does the 2012–2015 drought evolve in a hydroclimatic framework; (2) what are the temporal characteristics of the drought in a historical context at one- to four-year levels; and (3) what is the spatial pattern of the drought in terms of which regions have the most severe conditions and by what means? The rest of the paper is organized as follows. Section 2 describes the study variables and metrics employed. Section 3 presents the results and findings. Discussion and conclusions are provided in Section 4.

2. Materials and Methods

2.1. Study Variables

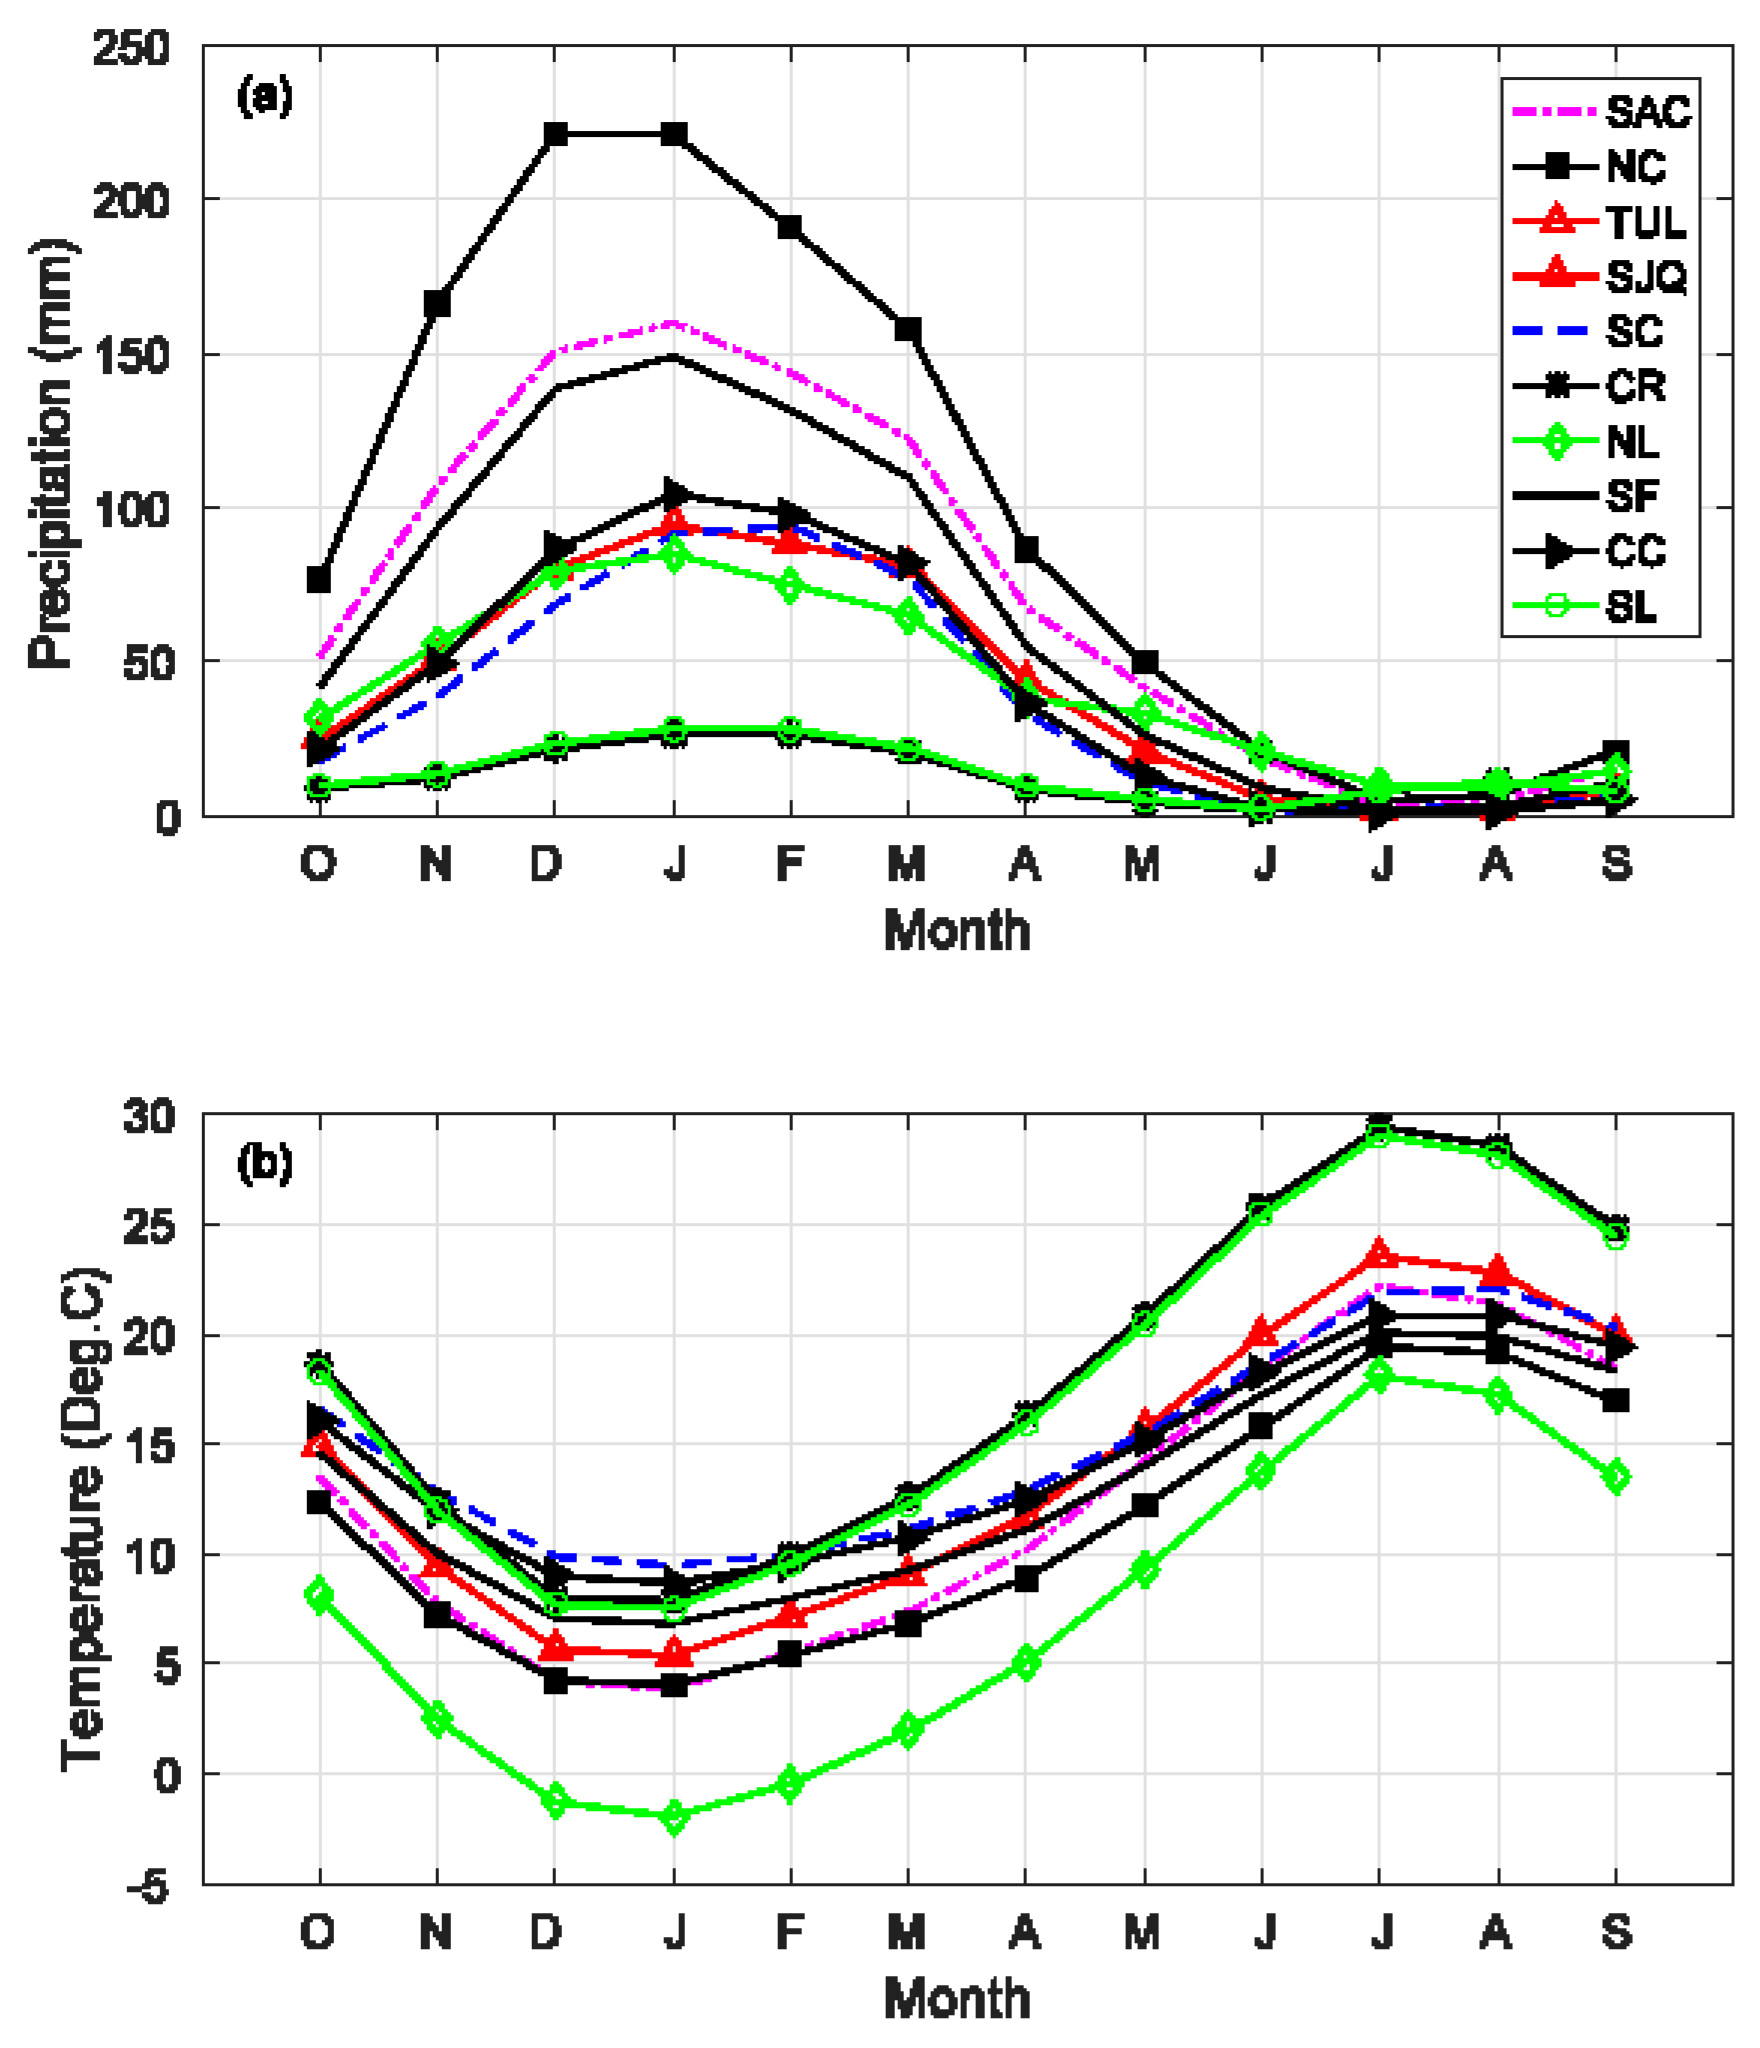
Due to its Mediterranean-like climate, California receives the majority (85%) of its annual precipitation in the wet season (November–April) and very limited (3%) precipitation in the summer (June–August) (refer to Figure A1 in the Appendix) when the demand for water is typically the highest [31]. The orographic effects of the Cascade Range in the northern part of the state and the Sierra Nevada make much of the winter precipitation fall as snowfall on the windward side of the mountains. Snowmelt in late spring and early summer contributes to runoff in major rivers and groundwater recharge. Precipitation also varies in amount among regions, with the North Coast area receiving about 1223 mm annually on average while the Southeast Desert area receives only 156 mm. While most precipitation falls in the northern half, most of the state’s population and farmlands are located in the southern half. To counter the spatially and temporally unbalanced supply versus demand on water, the state has traditionally relied on water storage and transfer projects including the State Water Project (SWP) and the Central Valley Project (CVP) to redistribute water resources following preset protocols along with current and projected hydroclimatic conditions. These projections are typically designed based on historical precipitation, runoff, groundwater level, and reservoir storage information.
The California Department of Water Resources (CDWR) divides the state into 10 major hydrologic regions (Table 1; Figure 1a). Of these 10 regions, three regions in the Central Valley are of the primary interest from a water supply perspective: the Sacramento River Region (SAC), the San Joaquin River Region (SJQ), and the Tulare Lake Region (TUL). CDWR maintains a network of precipitation, streamflow and reservoir level gauges, snow courses and pillows, and groundwater wells within these regions along with a range of cooperating federal, local, and private agencies. CDWR relies on this network of stations to monitor water conditions year-around in the state. CDWR conducts quality control of raw measurements from this observational network along with cooperating agencies. Based on quality-controlled data, CDWR calculates a number of hydroclimatic indices (refer to access links provided in Appendix A) and uses them in water resource planning and management practices. Those indices include three precipitation indices, three runoff indices, and two water supply indices [32]. The precipitation indices include the Northern Sierra 8-Station Precipitation Index (8SI), San Joaquin 5-Station Precipitation Index (5SI), and Tulare Basin 6-Station Precipitation Index (6SI) (Figure 1a; Table A1). These indices are calculated by averaging the precipitation recorded at corresponding amount of representative stations located in a specific region. The runoff indices include the SAC Four River Index (SAC4), SJQ Four River Index (SJQ4), and TUL Four River Index (TUL4). These four rivers in the SAC region are the Sacramento River above Bend Bridge (SBB), the Feather River (FTO), the Yuba River (YRS), and the American River (AMF); for the SJQ region, they are the Stanislaus River (SNS), the Tuolumne River (TLG), the Merced River (MRC), and the San Joaquin River inflow to Millerton Lake (SJF); four rivers in the TUL region include the Kings River (KGF), the Kaweah River (KWT), the Tule River (SCC), and the Kern River (KRI) (Figure 1c). These indices are determined by summing the unimpaired full natural runoff (FNF) for four rivers of each of these three regions. The water supply indices include the Sacramento Valley 40-30-30 Index (SAC WYI) and the San Joaquin Valley 60-20-20 Index (SJQ WSI). The former (latter) is determined by summing up 40% (60%) of the current year’s April through July SAC4 (SJQ4) unimpaired runoff, 30% (20%) of the current year’s October through March SAC4 (SJQ4) unimpaired runoff, and 30% (20%) of the previous year’s index with a cap of 10 (4) million acre-feet.
In addition to those hydroclimatic indices, snowpack, reservoir storage, groundwater level, and reconstructed FNF data are also applied in water resource-related operations across the state. Winter snowfall mostly occurs in the high elevations of the three Central Valley regions. Most of the snow stations are therefore located in these regions (Figure 1b). Snowpack is traditionally deemed to peak around 1 April [33,34]. 1 April Snow Water Equivalent (A1 SWE) of the snowpack is typically used as the snow index to represent the annual peak snow condition. CDWR monitors the storage of 154 reservoirs with a total capacity of 47 billion m3 across the state (Figure 1d). The end of the (water) year reservoir storage is often used as an index in water supply planning operations. CDWR monitors groundwater levels with cooperating agencies semiannually (Spring and Fall) in a large number of wells mostly located in the Central Valley. The groundwater level information is critical for groundwater management practices. On top of field observations which are often characterized with a short record period (less than a century), CDWR also uses reconstructed flow data (from tree ring chronologies) for major watersheds in assessing flow variability over centuries to millennia in support of drought management. Particularly, reconstructed annual FNF for major rivers in the SAC region and the SJQ region from 900–2010 are available [35]. In this study, the observed annual FNF of these two regions in the instrumental period are used to replace (up to 2010) or supplement (from 2011–2015) the reconstructed annual FNF to produce a hybrid annual FNF record. The hybrid dataset represents the best available flow data for these two regions in the context of record period (from 900 to 2015) and quality (using observed data in the instrumental period).
This study focuses on the aforementioned operational hydroclimatic indices and variables. Specifically, when analyzing the development of the drought, the focus is on precipitation, runoff, snow water equivalent, reservoir storage (September), temperature, and groundwater level data. When assessing the temporal characteristics of the drought in a historical context, the groundwater level data are not considered due to limited availability of long-term relevant data. The variables considered are tabulated in Table 2. When investigating the spatial characteristics, based on data availability, only precipitation, temperature, AJ FNF, annual FNF, and reservoir storage are considered. Reconstructed FNF data and groundwater level data are obtained from CDWR (http://www.water.ca.gov). Climate-divisional precipitation and temperature data are acquired from the National Centers for Environmental Information Climate Divisional Database (http://www.ncdc.noaa.gov) and converted to hydrologic-regional values using a simple (area-based) weighting method following our practical operations. Historical records of other data are obtained from the California Data Exchange Center (CDEC, http://www.cdec.water.ca.gov), an open-access CDWR data archive. It is worth noting that when examining the development and temporal characteristics of the drought, focus is placed on statewide conditions and the conditions over the Central Valley. When exploring the spatial characteristics of the drought, however, all ten hydrologic regions are considered. It should also be noted that detailed information on data sources and access links are provided in Appendix A.

2.2. Study Metrics

Drought conditions are often quantified by drought indices which normally measure the departure of interested variables from their normal conditions according to their corresponding historical distributions. They often serve as a link between the data, the public, and decision-makers to understand, assess, and act in response to drought events. Numerous drought indices have been developed for the purposes of drought monitoring, assessment, and prediction [36,37,38], ranging from parsimonious measures (e.g., percentiles or rank of interested hydro-meteorological variables) to more sophisticated statistical or physical model-based measures (e.g., the Standardized indices [39,40,41] and the Palmer Index [29]). Despite their popularity in the research community, the sophisticated metrics generally possess a number of limitations for operational usage. For example, those indicators often lack spatial and temporal consistency in a statistical sense. Particularly, a specific value (or drought severity level) of an index may have different occurrence probabilities at different locations and different times [42]. In addition, they are generally not comparable with each other and are disconnected from historic conditions and relative risk [42]. Those properties make it difficult for decision-makers to make sound decisions based on them. A recent study conducted a survey of 19 drought managers from western U.S. states. The study found out that 16 out of 18 states did not use their indicators in their drought plans since they found them “not at all useful”, “never tested”, “a guess”, among others [43]. In light of this observation, this study employs parsimonious metrics including the percentiles-based drought categories (Table 3), percent of average, and historical rank, mainly because these metrics are the primary metrics applied in drought management practices across California.

3. Results

3.1. Development of the 2012–2015 California Drought

Water year 2011 preceding the 2012–2015 drought has above average precipitation, A1 SWE, AJ FNF, and reservoir storage statewide and in the SAC, SJQ, and TUL regions (Figure 2). In contrast, water years 2012–2015 indicate significantly below average precipitation, A1 SWE, and AJ FNF on the annual scale. Reservoir storages by the end of the water year 2012 (September 2012), however, are slightly above average statewide as well as for SAC and SJQ regions. In general, an overall declining trend is evident in all four variables from 2011–2015 except for that statewide precipitation in 2015 is higher than the previous three years. Among four variables, A1 SWE has the largest deficit followed by the AJ FNF. In 2015, the statewide A1 SWE (AJ FNF/reservoir storage) is only 5% (23%/58%) of average. Among the three regions, the TUL region tends to be impacted the most with the lowest percent of average (POA) values in four variables in 2015. Overall, from 2012–2015, the progressively increasing severity of the drought is evident.
Four-year (2012–2015) accumulated deficiencies in those four variables presented in Figure 2 are determined (Table 4). Statewide, a shortfall of 117% of average (660 mm) in precipitation is observed from 2012–2015. This shortfall has a cascading effect, leading to shortfalls in snowpack (280% accumulated deficiency in A1 SWE), streamflow (220% deficiency in AJ FNF), and reservoir storage (93% deficiency). Similar deficits are also evident for the other three regions. In general, the TUL region has the largest deficiencies (in percent of average) for all four variables, indicating that the region has the most severe drought conditions in the Central Valley. This is in line with what Figure 2 illustrates. Among the four variables, snowpack indicates the most significant shortage on average, with a percent of average value consistently above 250% for all study regions. This is also consistent with what Figure 2 shows regarding the snowpack conditions. It is worth noting that for the SJQ region, the deficiency in AJ FNF (260% of average) is slightly higher than that of the A1 SWE (250% of average). This is due to the fact that snow is not the unique source for AJ FNF. Precipitation within the period from April to July is another contributor. The deficiency in AJ FNF partially stems from the lack of April-July precipitation over the SJQ region. It should also be highlighted that the deficiencies in snowpack are far more significant than precipitation. This is due to the fact that temperature is an important factor in snowfall and rainfall partition from precipitation as well as the accumulation of snowpack.
The departures of annual average temperature from the long-term (1896–2015) average values for the past five years are calculated (Figure 3a). In 2011, statewide temperature is slightly (0.05 °C) above the long-term average. For three Central Valley regions, it is slightly below the long-term average (−0.32 °C for SAC; −0.09 °C for SJQ and TUL). However, since 2011, annual average temperature for each region is consistently above the long-term mean. Statewide, increases (over long-term average) in annual average temperature from 2012–2015 are 0.83 °C, 1.12 °C, 1.71 °C, and 2.24 °C, respectively. A similar monotonically increasing trend in the departure is also observed for three Central Valley regions. In comparison, increases in the SAC region are the least significant. In the record period (1896–2015), year 2015 is the hottest year followed by 2014 statewide. High temperature along with shortfalls in precipitation leads to significantly lower than average A1 SWE (Figure 2; Table 4).
Groundwater provides about 40% of the urban and agricultural water demand across the state. Groundwater usages in regions SAC, SJQ, and TUL account for 30%, 38%, and 53% of respective total regional water use. During drought periods when surface water supplies are reduced, groundwater usage typically increases to mitigate the adverse impact of water shortage. This is the case for the 2012–2015 drought across the state (Figure 3b). Out of 2109 groundwater monitoring wells, in the five-year period from Fall 2010 to Fall 2015, about 68% (1436) of the wells experience declines in water level larger than 0.8 m (2.5 ft). Particularly, 37.8% (797) of the wells observe declines more than 3 m (10 ft) in magnitude. A small number of wells (5.9%), however, observe increases (greater than 0.8 m) in water level in this five-year period.

3.2. Temporal Characteristics of the Drought

To obtain a general understanding on the severity of the drought at different temporal scales, the 28 variables tabulated in Table 2 are ranked in their corresponding record periods according to their specific values at one- to four-year levels. For temperature, the highest value is ranked first, indicating the hottest condition. For other variables, the lowest value is ranked first, indicative of the driest condition. Either way, rank one generally indicates the most severe drought condition.
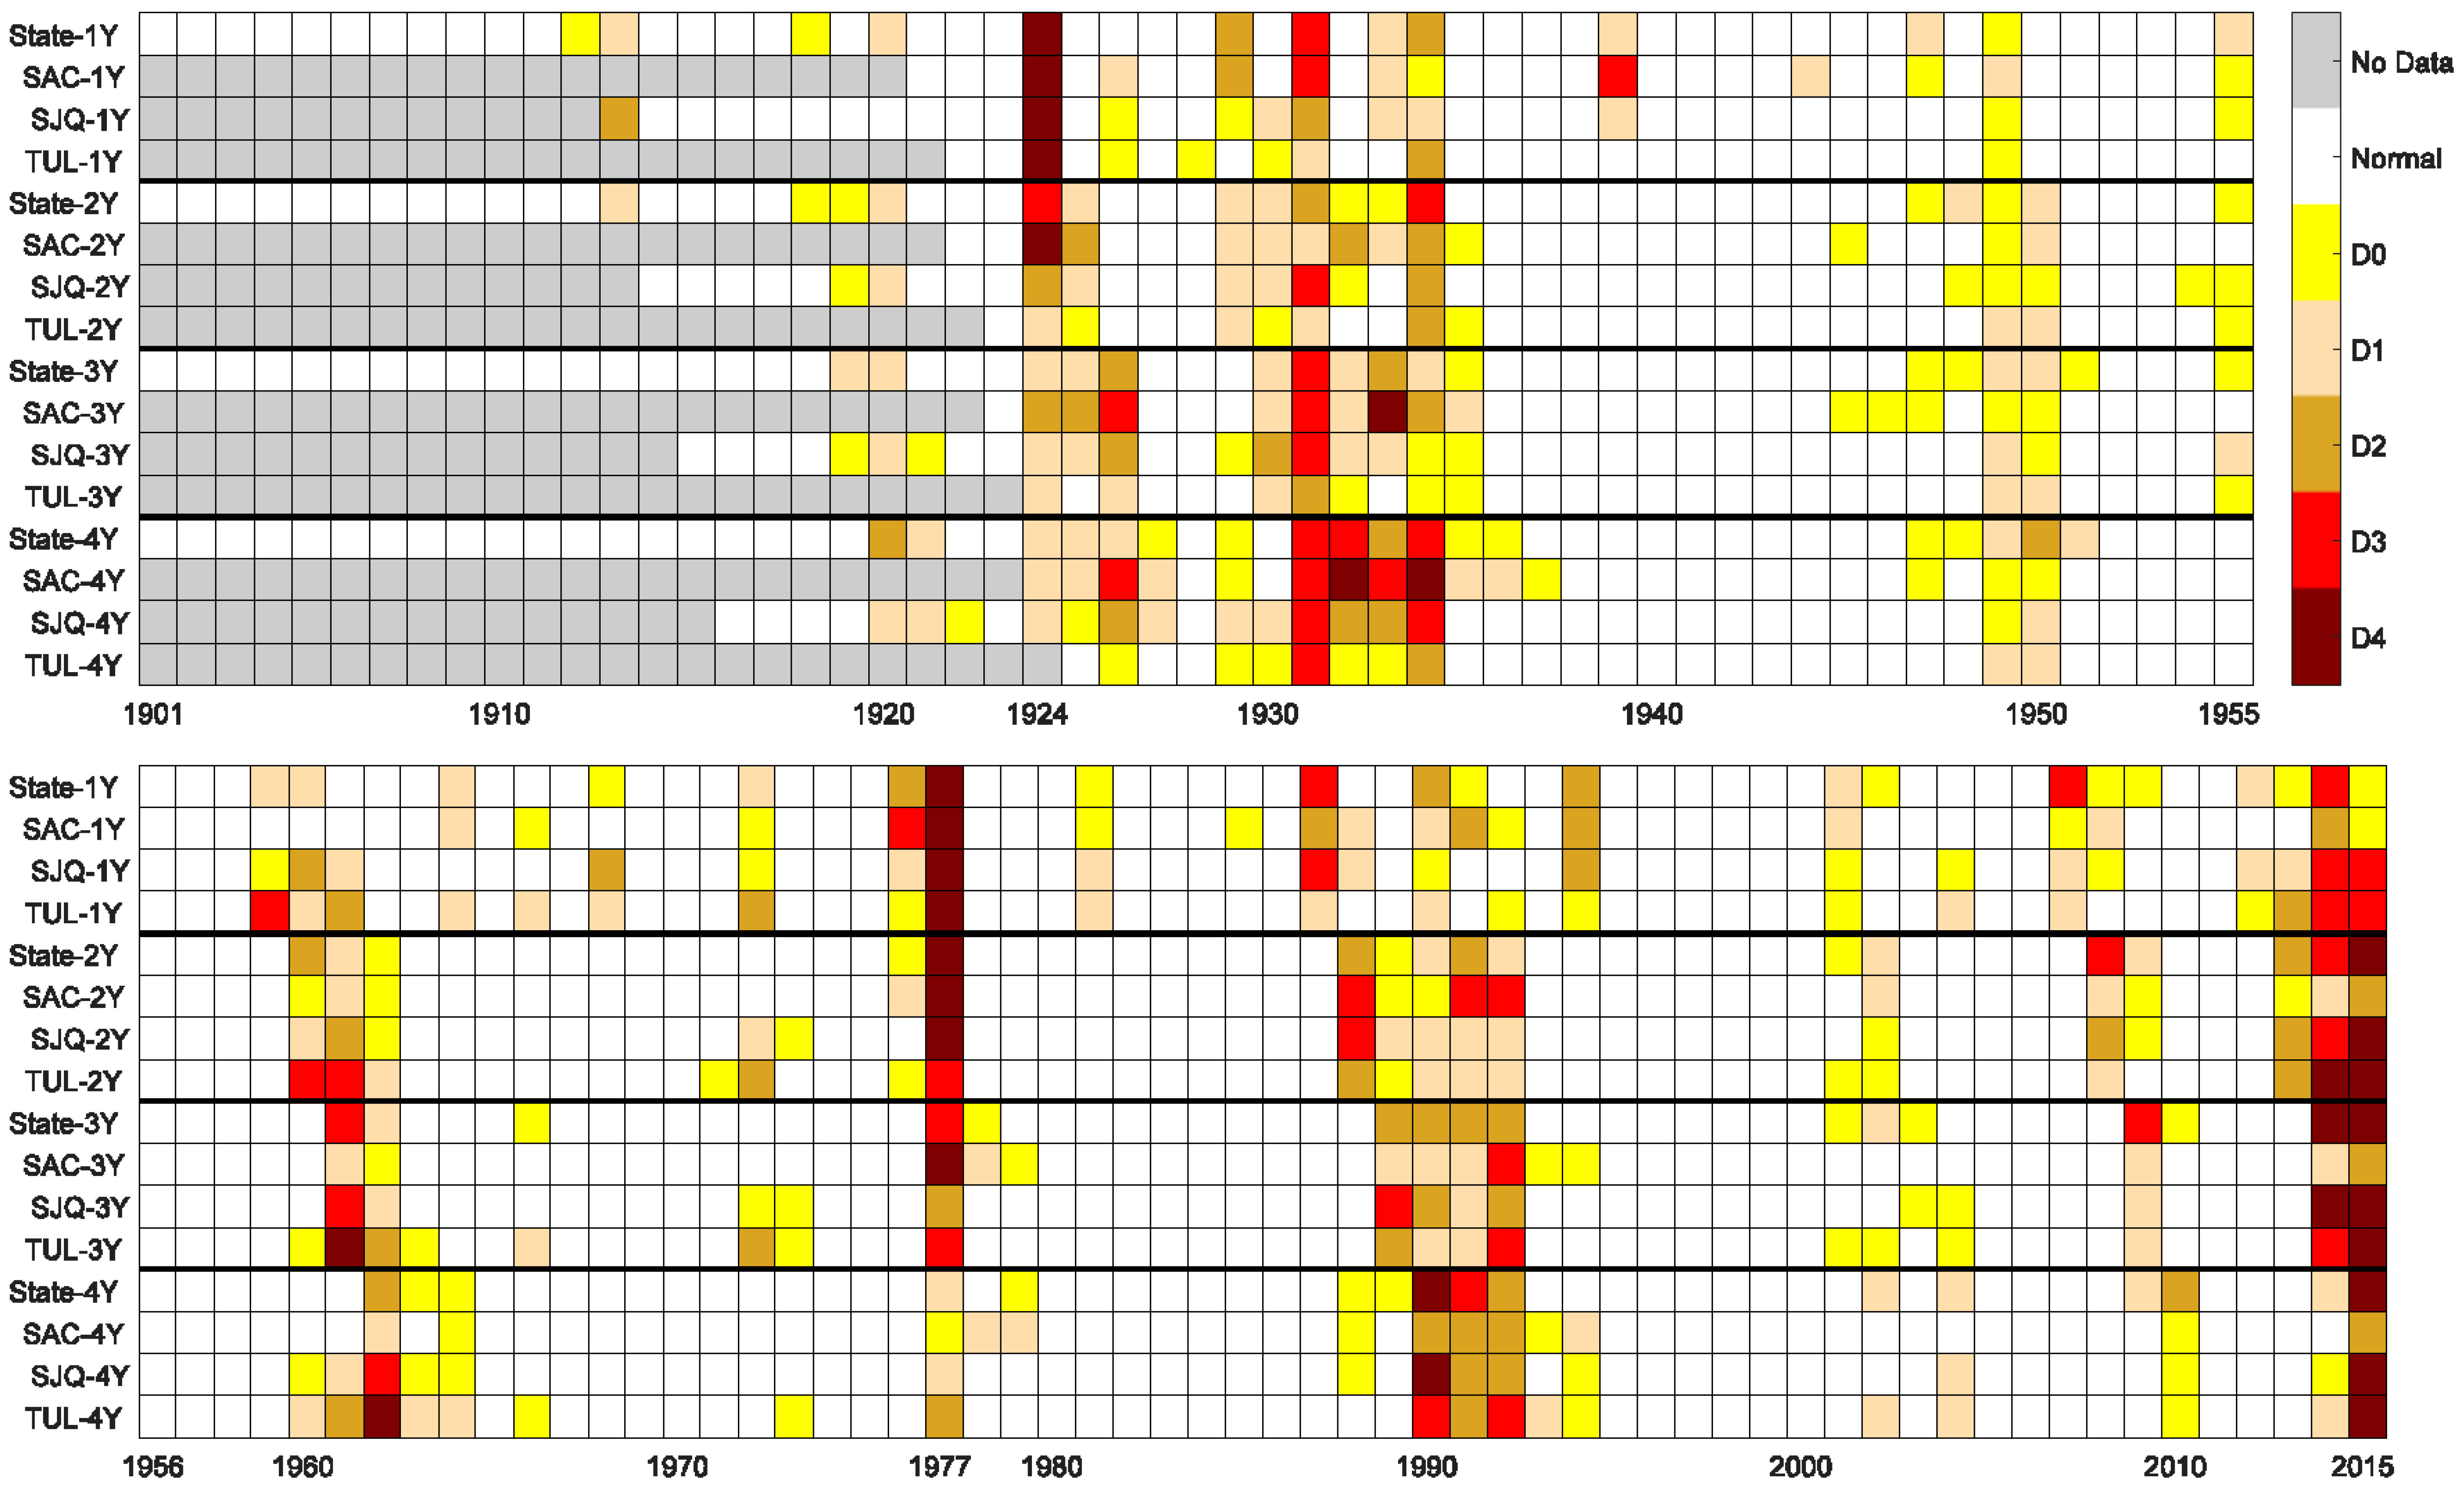
Drought monitor categories of statewide precipitation, 8SI, 5SI, and 6SI at one- to four-year levels are shown first (Figure 4). At the one-year scale, during the period from 2012–2015, on average year 2014 tends to be the driest year (D3 for 5SI, 6SI, and statewide; D2 for 8SI). Over the entire record period, however, precipitation conditions (statewide, 8SI, 5SI, and 6SI) of year 1977 and 1924 are both exceptional (D4). At the two-year level, 1976–1977 stands out as the driest two-year period, with statewide precipitation, 8SI, and 5SI deemed as exceptionally low (D4) and 6SI extremely low (D3). The period 2014–2015 is also dry with exceptionally low statewide precipitation, 5SI, and 6SI (D4) and severe conditions (D2) when looking at the 8SI. At the three-year scale, for statewide condition and 5SI, both 2012–2014 and 2013–2015 are exceptional (D4); for 8SI, both 1931–1933 and 1975–1977 are exceptional (D4), while 2012–2015 is categorized as severe (D2); for 6SI, the period 2013–2015 is exceptional (D4) along with 1959–1961. At the four-year level, for statewide conditions and the 5SI, both periods 2012–2015 and 1987–1990 are exceptional (D4). For 6SI, the period 2012–2015 is exceptional (D4) but not unprecedented (1959–1962 is also with D4 category). For 8SI, the period 2012–2015 is severe (D2); however, periods 1929–1932 and 1931–1934 are drier with exceptionally low amount of precipitation observed (D4). Overall, no single year within the period 2012–2015 is unprecedented in terms of statewide precipitation, 8SI, 5SI, and 6SI. At the two-year level, both 2013–2014 and 2014–2015 for 6SI are unparalleled before 2012. At the three-year scale, statewide precipitation and 5SI within 2012–2014 and 2013–2015 are unprecedented before 2012. Among the three precipitation indices, 8SI has relatively less severe conditions.
In contrast to the observation that statewide precipitation along with 8SI, 5SI, and 6SI are not all exceptional in different sub-periods within 2012–2015, AJ FNF in 2015 across the state and over three Central Valley regions are all in the exceptional (D4) category (Figure 5). It is the same case for 2014–2015, 2013–2015, and 2012–2015 at two-year, three-year, and four-year levels, respectively. Particularly, statewide AJ FNF of 2014–2015 and 2012–2015 is unparalleled at two-year and four-year levels, respectively. At the three-year level, statewide AJ FNF from 2013–2015 is unparalleled; for the SJQ and TUL regions, both 2012–2014 and 2013–2015 are unprecedented before 2012 in the record period. This contrast between precipitation and AJ FNF in the past four years (Figure 4 and Figure 5) is due to the fact that AJ FNF largely depends on the snowmelt. Record low snowpack (Figure 1) reduces snowmelt contribution to AJ FNF. Additionally, record high temperature (Figure 3a) likely shifts the snowmelt timing earlier, contributing to less snowmelt from April–July.
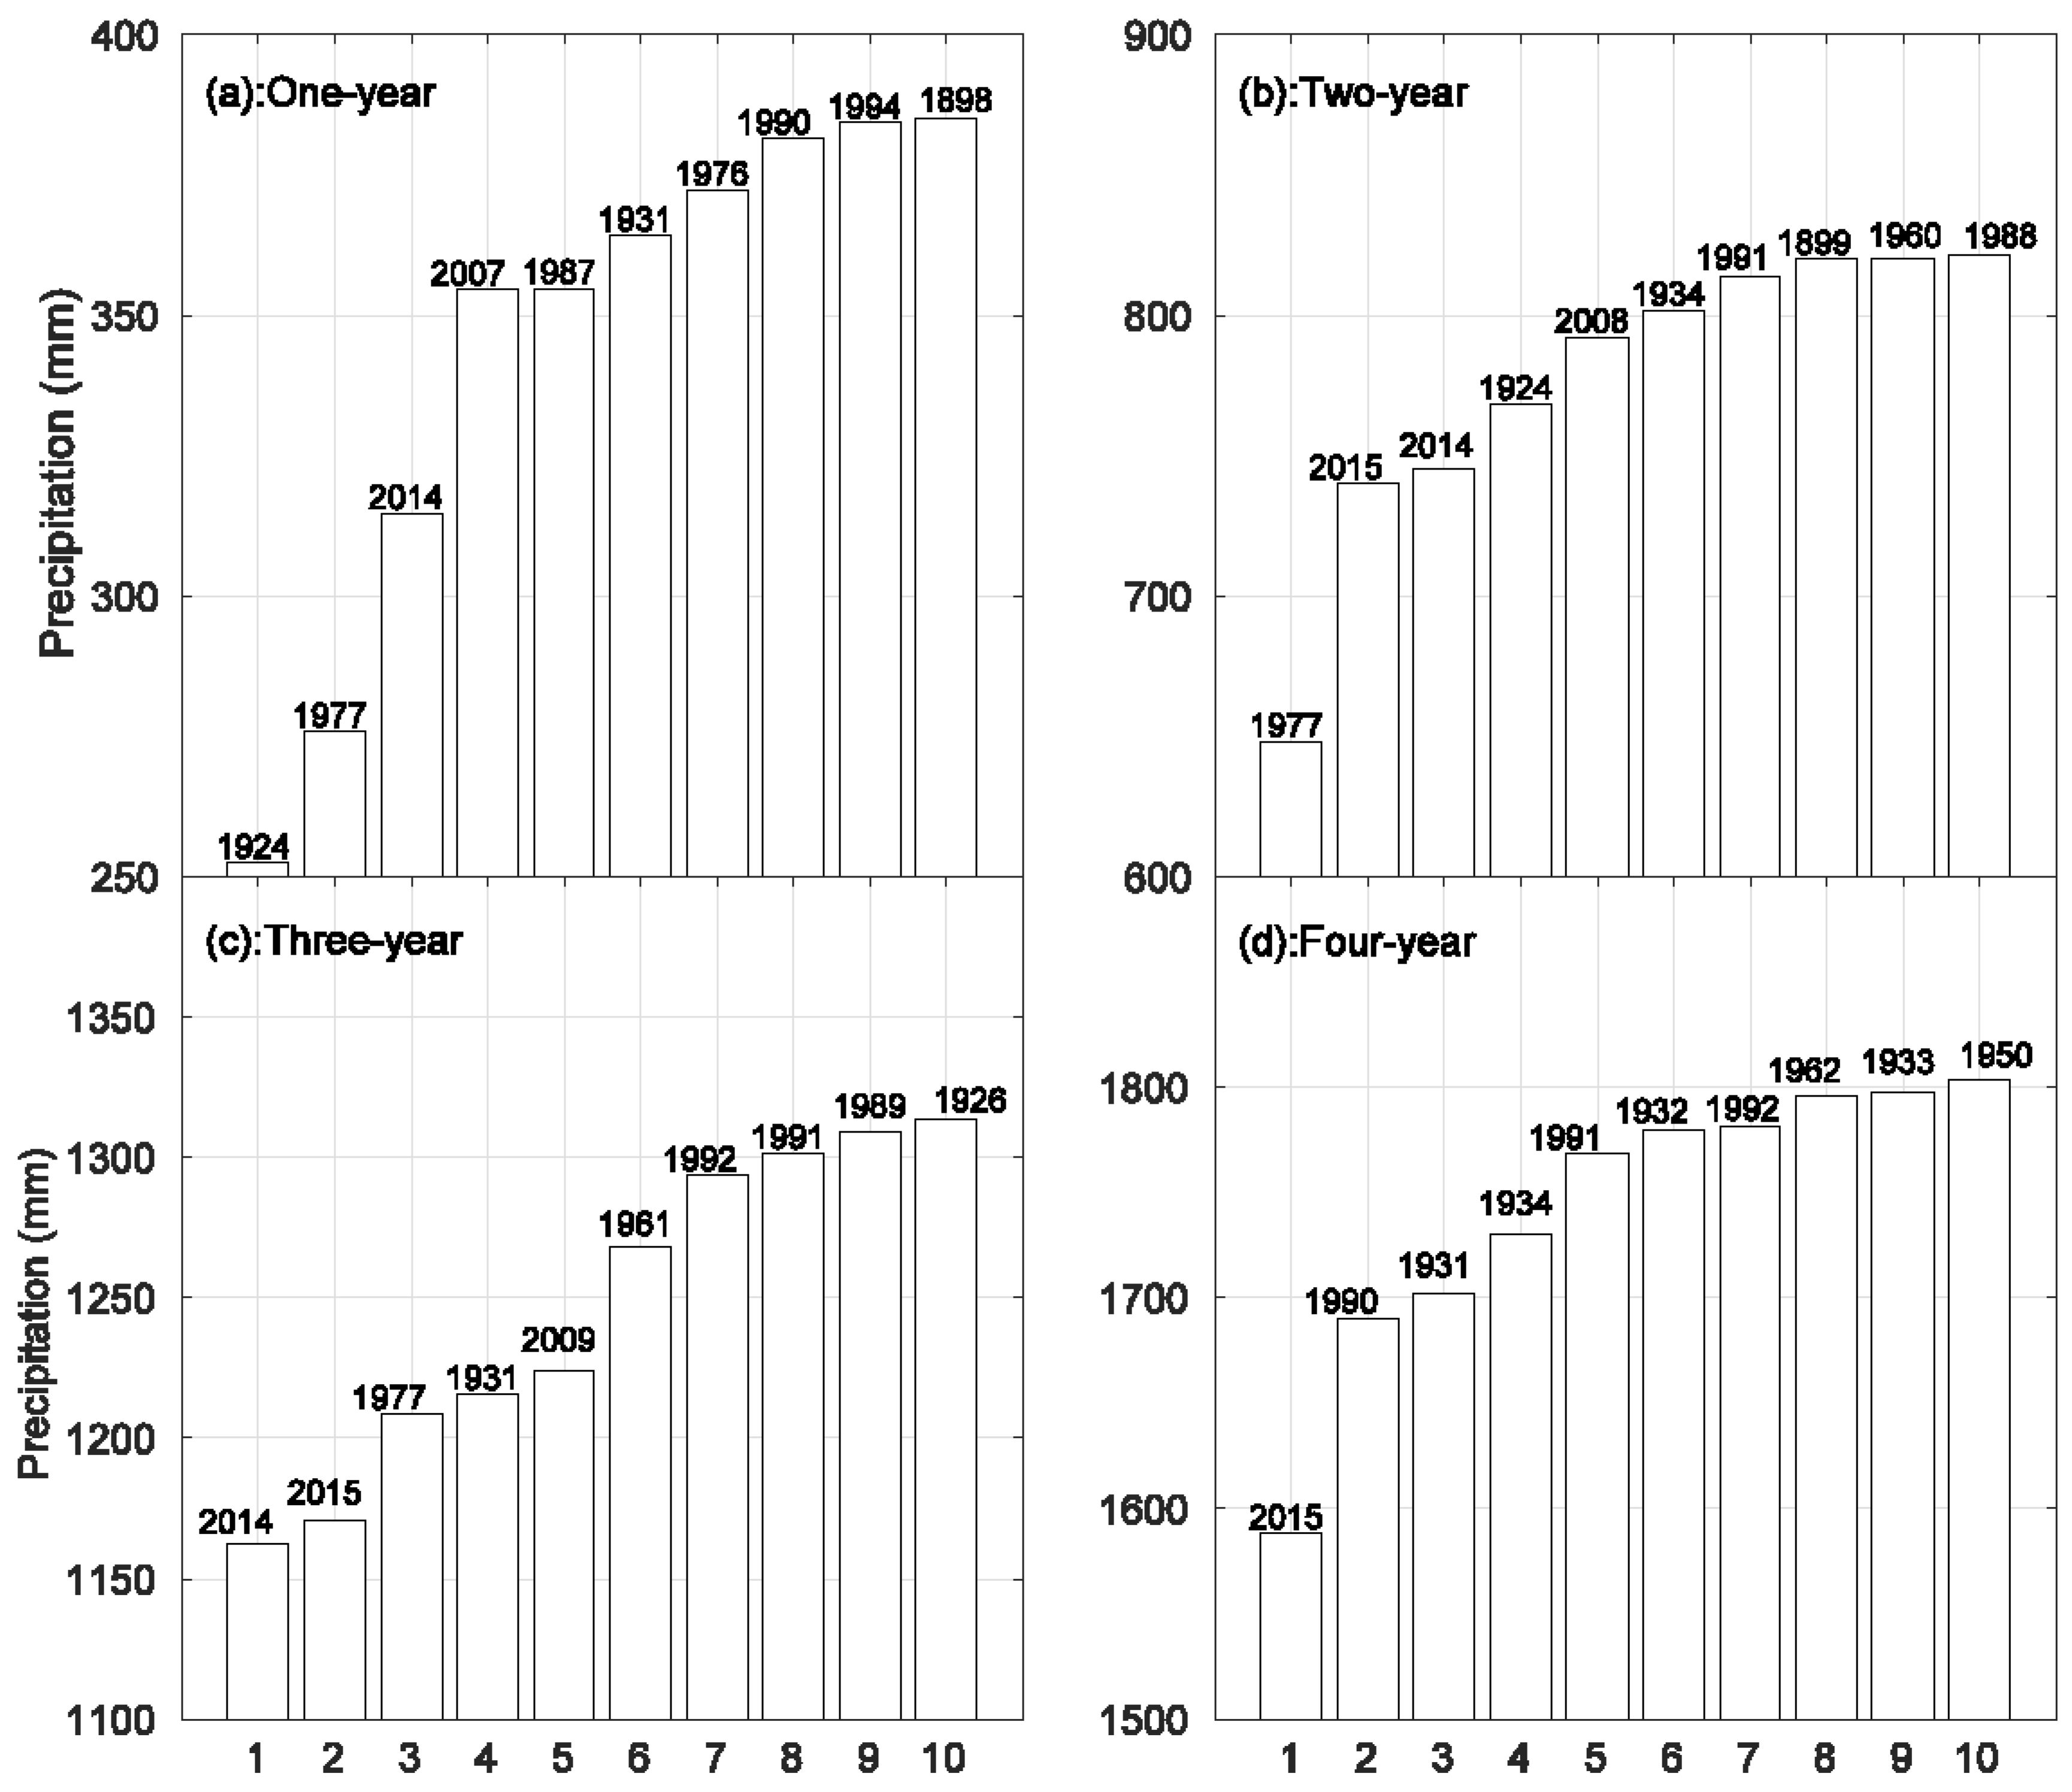
In addition to drought monitor category, it is also a common practice in drought planning and management to compare the driest periods at different levels of periods. The ten driest periods in terms of statewide precipitation at one- to four-year levels are applied as an example (Figure 6). It is clear that year 1924 receives the lowest annual precipitation (Figure 6a) followed by 1977. At two-year, three-year, and four-year levels, the periods 1976–1977, 2012–2014, and 2012–2015 observe the lowest amount of precipitation, respectively (Figure 6b–d). This indicates that, at one-year and two-year levels, no sub-periods of 2012–2015 are unprecedented in terms of precipitation, whilst it is the case at three-year and four-year levels. Though not making the top of the list, water year 2014 is the third driest year (Figure 6a); the precipitation amounts of 2014–2015 and 2013–2014 rank the second the third lowest, respectively, at the two-year level. These observations are generally consistent with what is shown in Figure 4.
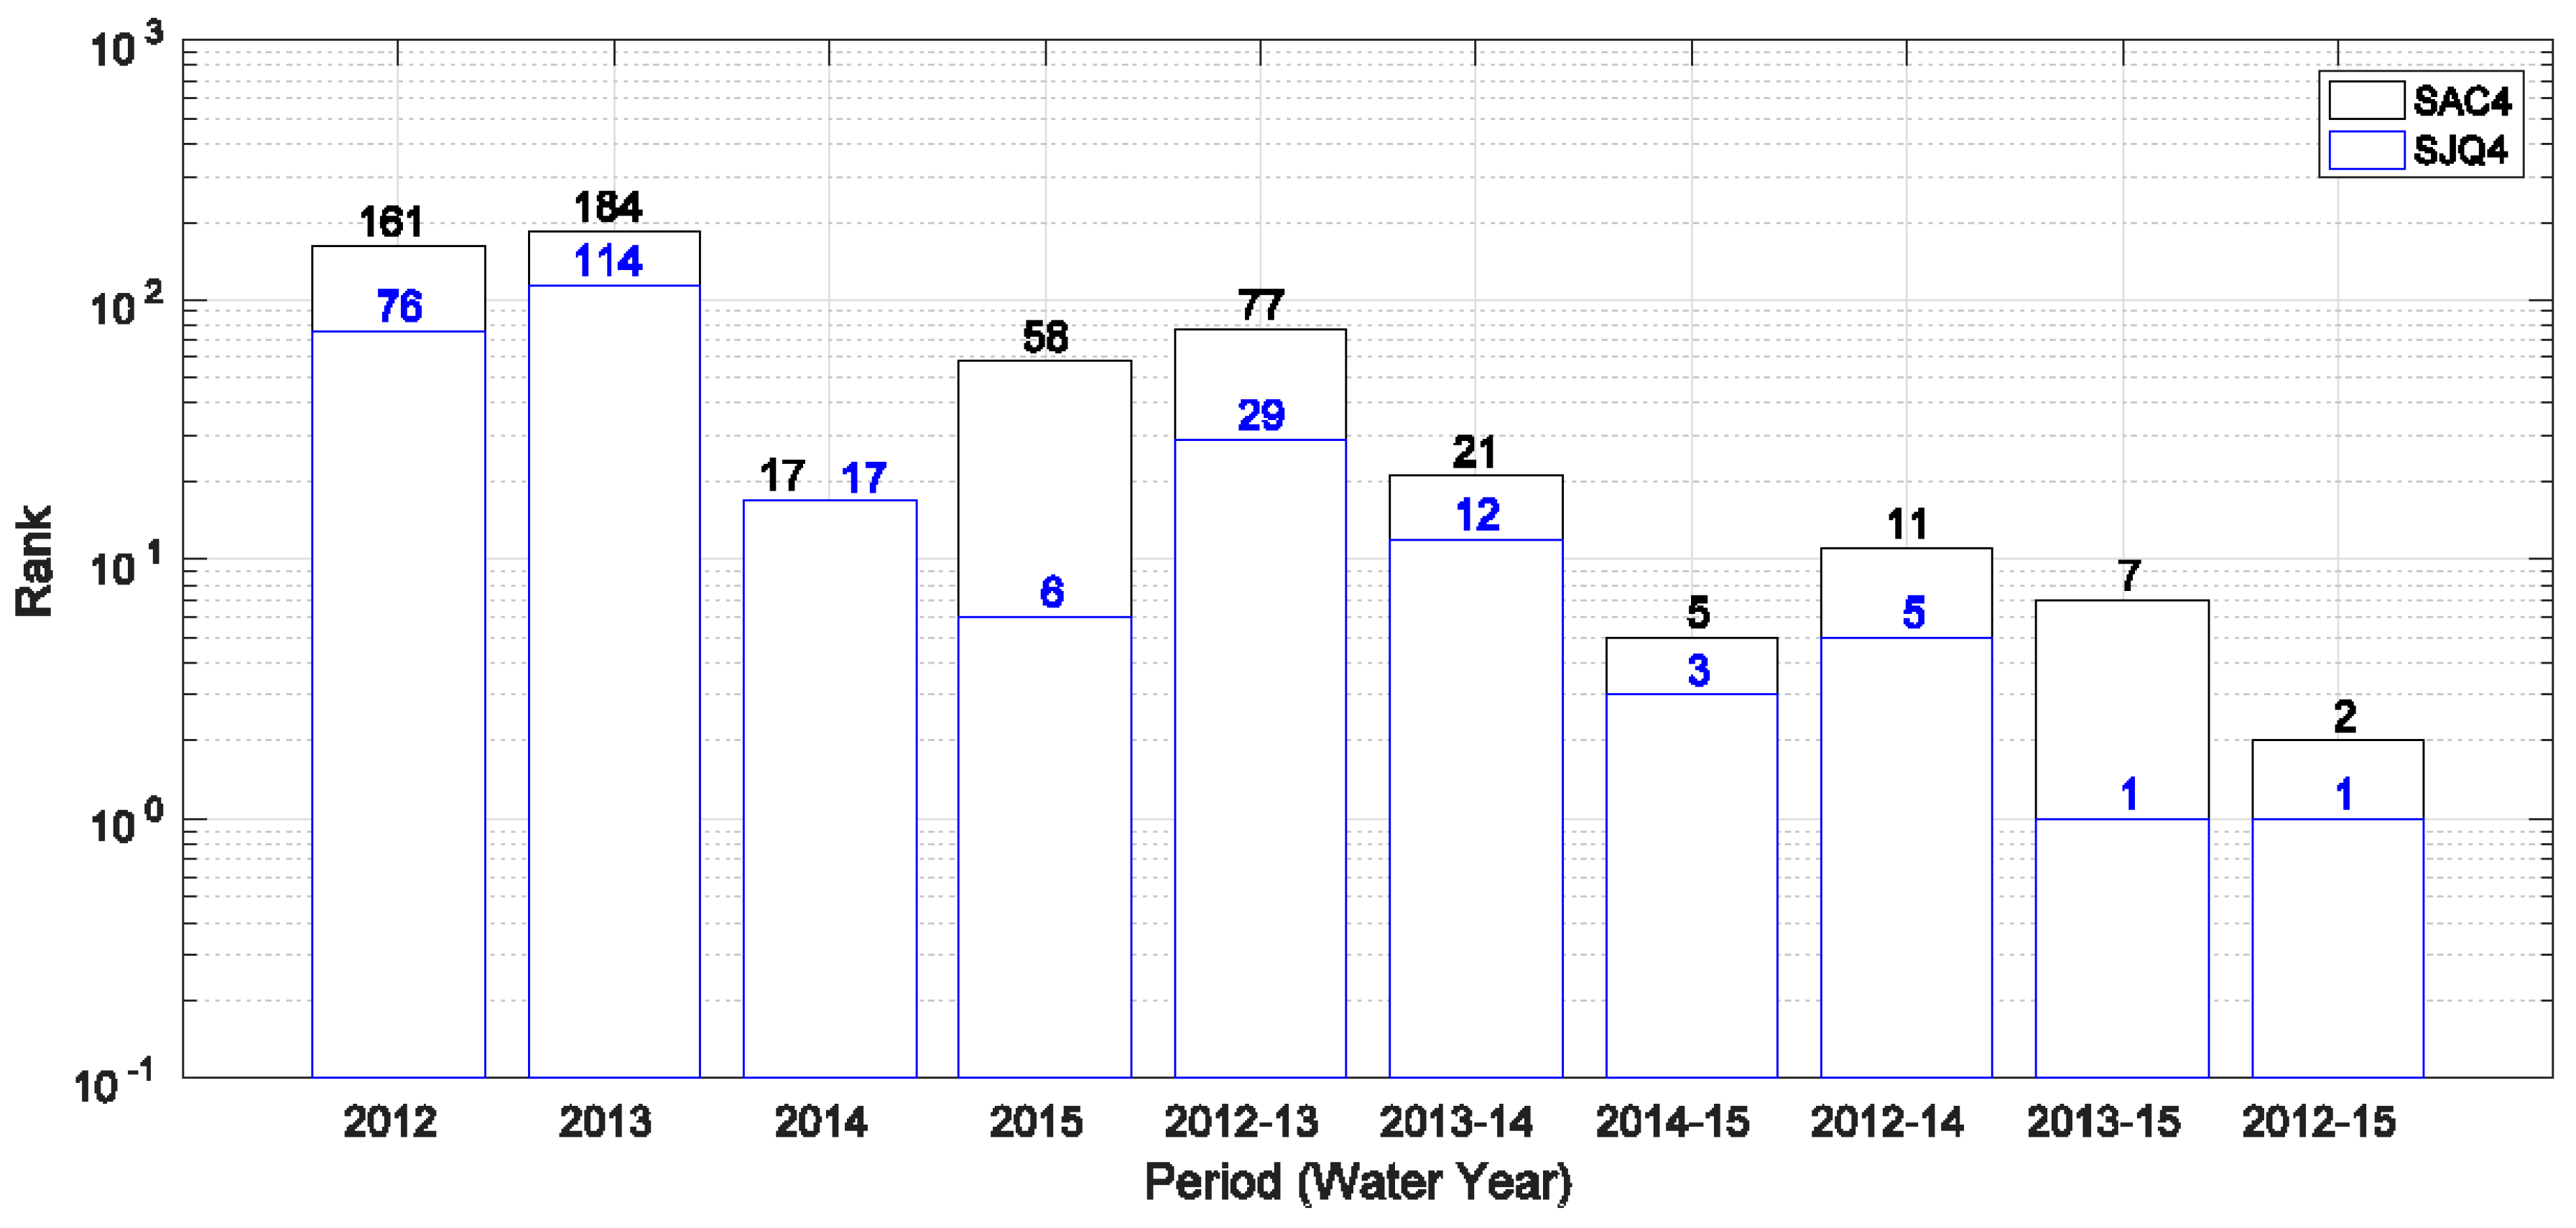
Instrumental data are often limited by the length of the record period. Reconstructed paleoclimatic data supplement the instrumental data in terms of extending the analysis period, making it feasible to assess current drought events on a millennial scale. Based on reconstructed flow data (dating back to 900) and corresponding observed data (in the instrumental period), the SAC4 and SJQ4 annual FNFs at different levels of years within 2012–2015 are analyzed in a paleoclimatic context (Figure 7). Looking at a single year, only water year 2015 is a top 10 driest (rank sixth) year in terms of annual FNF for the SJQ four rivers. At the two-year level, the period 2014–2015 ranks third for the SJQ4 and fifth for the SAC4. On the three-year scale, average annual FNF of 2013–2015 for the SJQ4 and the SAC4 ranks first and seventh, respectively. At the four-year level, 2012–2015 FNF of the SJQ4 is also unparalleled, while it is the second lowest for SAC4. This shows that at three-year and four-year levels, the drought conditions (measured by annual FNF) in San Joaquin region are exceptional even within a prolonged millennial period (900–2015), while it is not the case for the Sacramento region. At one-year and two-year levels, neither of these two regions observes unprecedented annual FNFs.
In addition to statewide precipitation and annual FNF for the SAC4 and the SJQ4, other variables (as tabulated in Table 2) are also ranked in their record periods. The corresponding periods at one- to four-year levels when these variables rank first are presented in this study (Table 5). For temperature, a period ranking first means the hottest (highest temperature) period. For other variables, a period ranking first indicates that the period is with the lowest value of the specific variable in the record period. Statewide, the driest year is 1924 (1977) in terms of precipitation (annual FNF and reservoir storage). However, water year 2015 has the highest temperature, lowest A1 SWE and AJ FNF. At the two-year level, the period 1976–1977 stands out as the driest in terms of precipitation, annual FNF, and reservoir storage. For the other three variables, the period 2014–2015 has the most severe conditions in the record period. Looking at the three-year level, the period 1990–1992 has the lowest annual FNF and reservoir storage and the period 2012–2014 is the driest (lowest precipitation). For the remaining three variables, the period 2013–2015 has the lowest values. At the four-year level, the period 2012–2015 tends to have the driest conditions in terms of all variables except for reservoir storage. The period 1989–1992 is the four-year period with the lowest reservoir storage. For the TUL region, the periods (one- to four-year levels) with the lowest reservoir storage all occur in the drought from 1988–1992. The driest single year is 1977 in terms of precipitation. For other variables, the driest conditions all occur within the 2012–2015 drought at one- to four-year levels. Except for variables WSI and hybrid FNF, which are specific to the SAC region and the SJQ region, the driest single years of these two regions for other variables are consistent with the statewide conditions. The driest two-year periods of these two regions are also consistent with the corresponding statewide conditions with one exception. The period 1976–1977 has the lowest AJ FNF for the SJQ region while it is 2014–2015 for the SAC region and statewide. At the three-year level, the conditions of the SAC region and the SJQ region are mostly similar to those of the statewide conditions with one exception for each region. The driest three-year (with lowest precipitation) period for the SAC region is 1975–1977 other than 2012–2014. The three-year period 2013–2015 (instead of 1990–1992) has the lowest annual FNF for the SJQ region. At the four-year level, the conditions over the SJQ region are in line with the corresponding statewide conditions. However, for the SAC region, the periods with the lowest precipitation and annual FNF are both 1931–1934 rather than 2012–2015. Focusing on the WSI, the driest one- to four-year periods for the SAC region differ from those of the SJQ region. The single year with the lowest WSI is 1977 (2015) for SAC (SJQ). The corresponding four-year periods are 2012–2015 and 1928–1931 for the SAC region and the SJQ region, respectively. In a paleoclimatic context, the one-year and two-year periods with the lowest annual FNF are 1580 and 1579–1580, respectively, for both the SAC region and the SJQ region. At three-year and four-year levels, as also indicated in Figure 7, the SJQ region observes the lowest annual FNF during the periods 2013–2015 and 2012–2015, respectively. For the SAC region, the corresponding periods are 1578–1580 and 1931–1934, respectively. In general, though differences exist across different regions, the period 2012–2015 and sub-periods within it are not unparalleled for all variables.
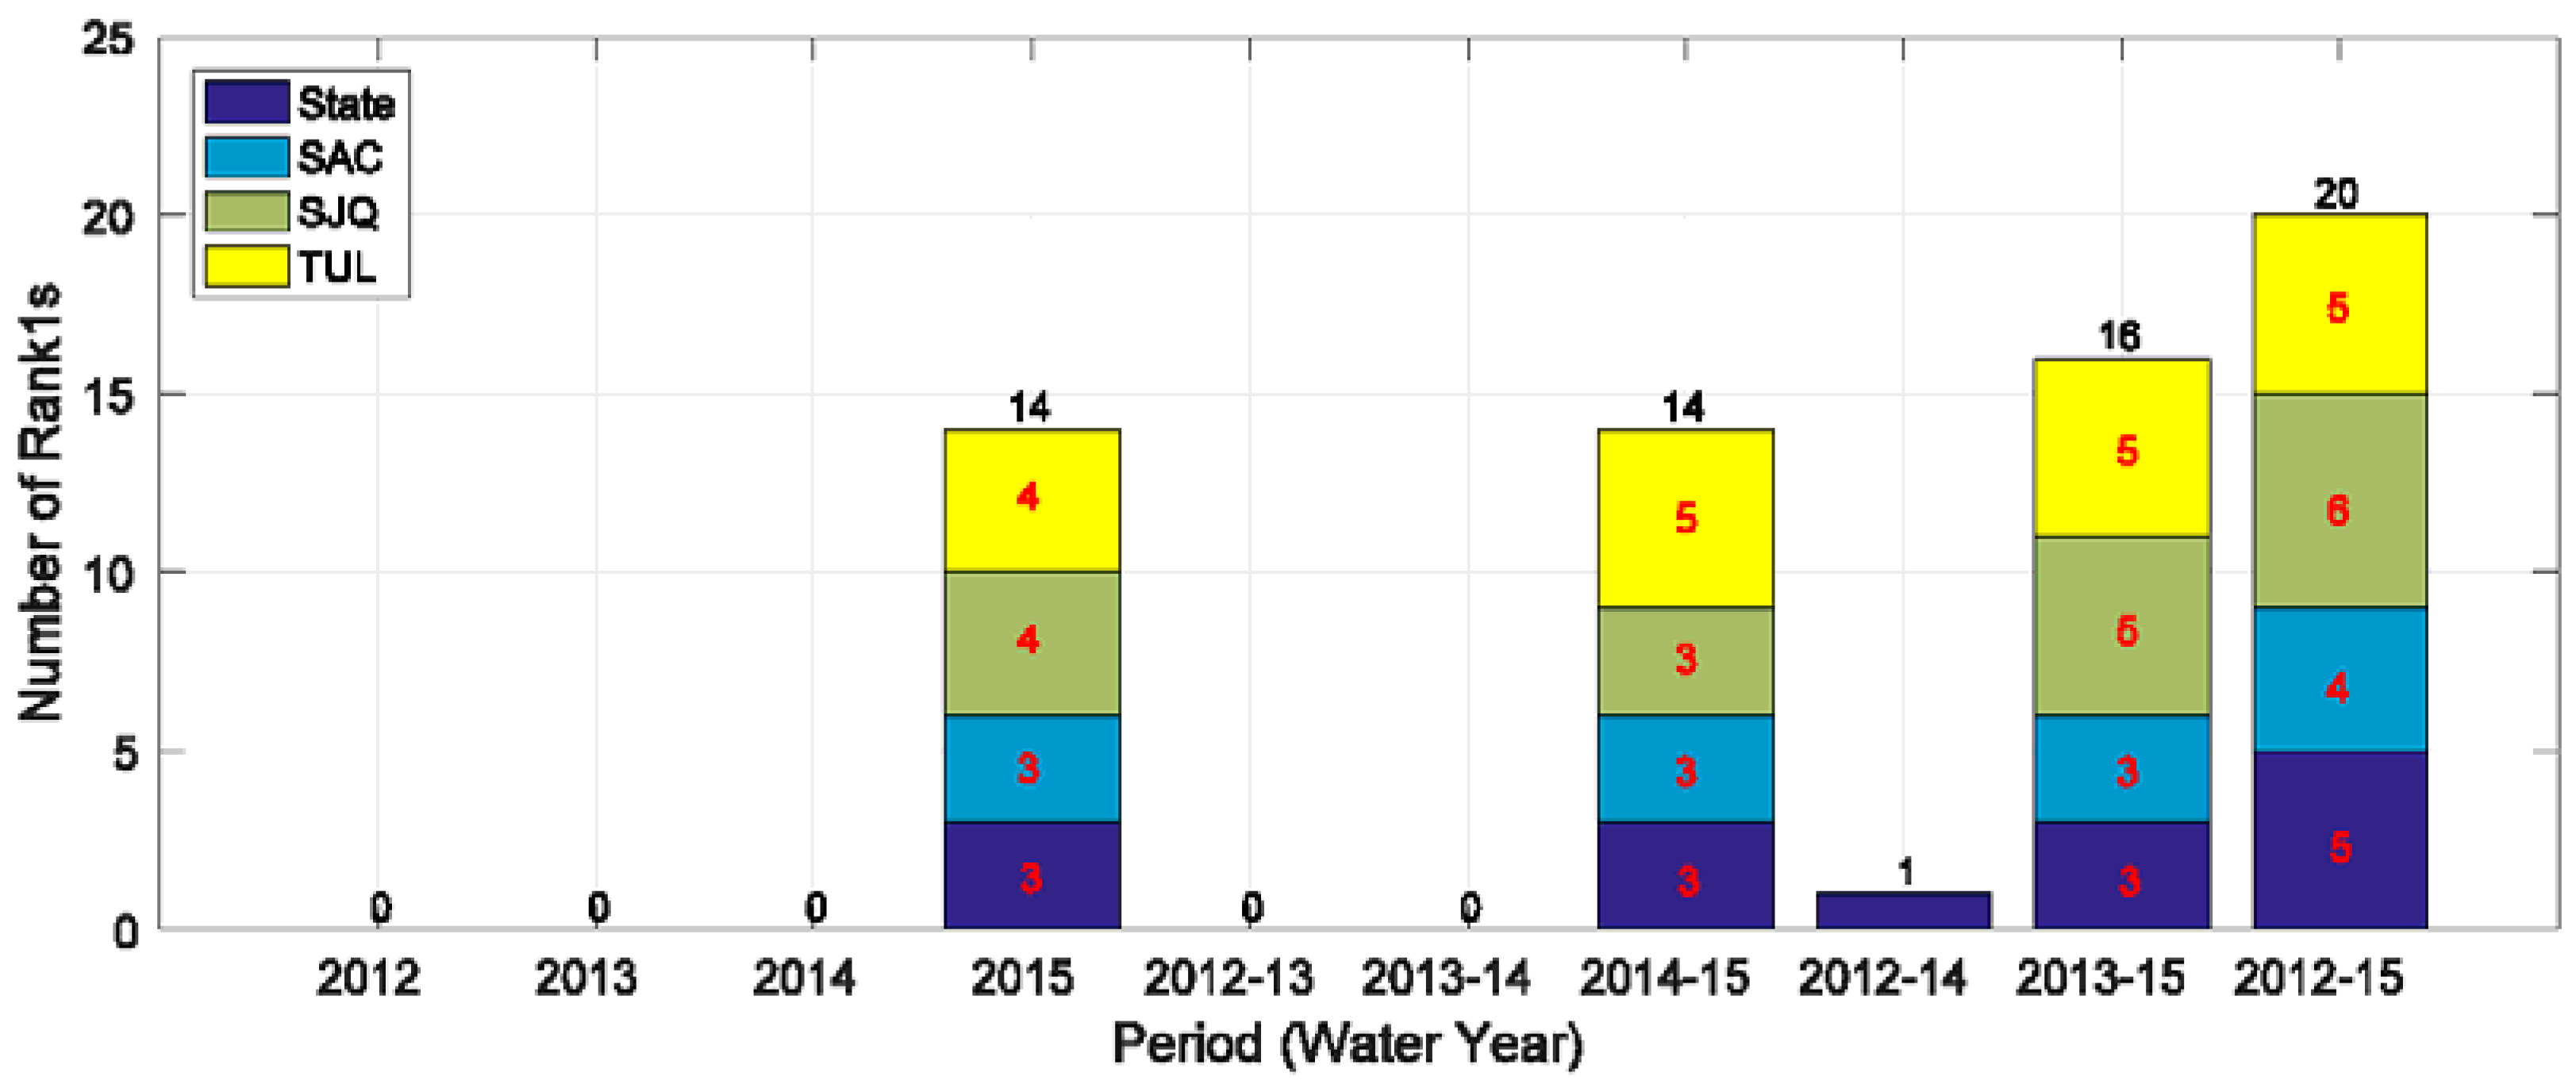
To identify which sub-periods within 2012–2015 have the most severe conditions, the number of variables ranked first is counted for each one- to four-year sub-period (Figure 8). It is evident that at the one-year level, no variables in (water) year 2012, year 2013, or year 2014 rank first in the record period. However, in 2015, 14 out of 28 variables rank first (three statewide and for the SAC region; four for the SJQ region and the TUL region each). At the two-year level, 14 variables rank first in 2014–2015 (three statewide, the SAC region, and the SJQ region each; five for the TUL region) versus none in other two two-year sub-periods. Looking at the three-year level, the sub-period 2013–2015 tends to be the drier one with 16 variables ranked first (three statewide and for the SAC region; five for the SJQ region and the TUL region each) versus one in 2012–2014. At the four-year scale, 20 out of 28 variables rank first (five statewide and for the TUL region; four for the SAC region; six for the SJQ region). Overall, it is evident that, within the period 2012–2015, 2015, 2014–2015, and 2013–2015 have the most (more) significant drought conditions at one- to three-year levels, respectively. At the four-year level, 2012–2015 is not unprecedented for eight out of 28 variables considered.

3.3. Spatial Characteristics of the Drought

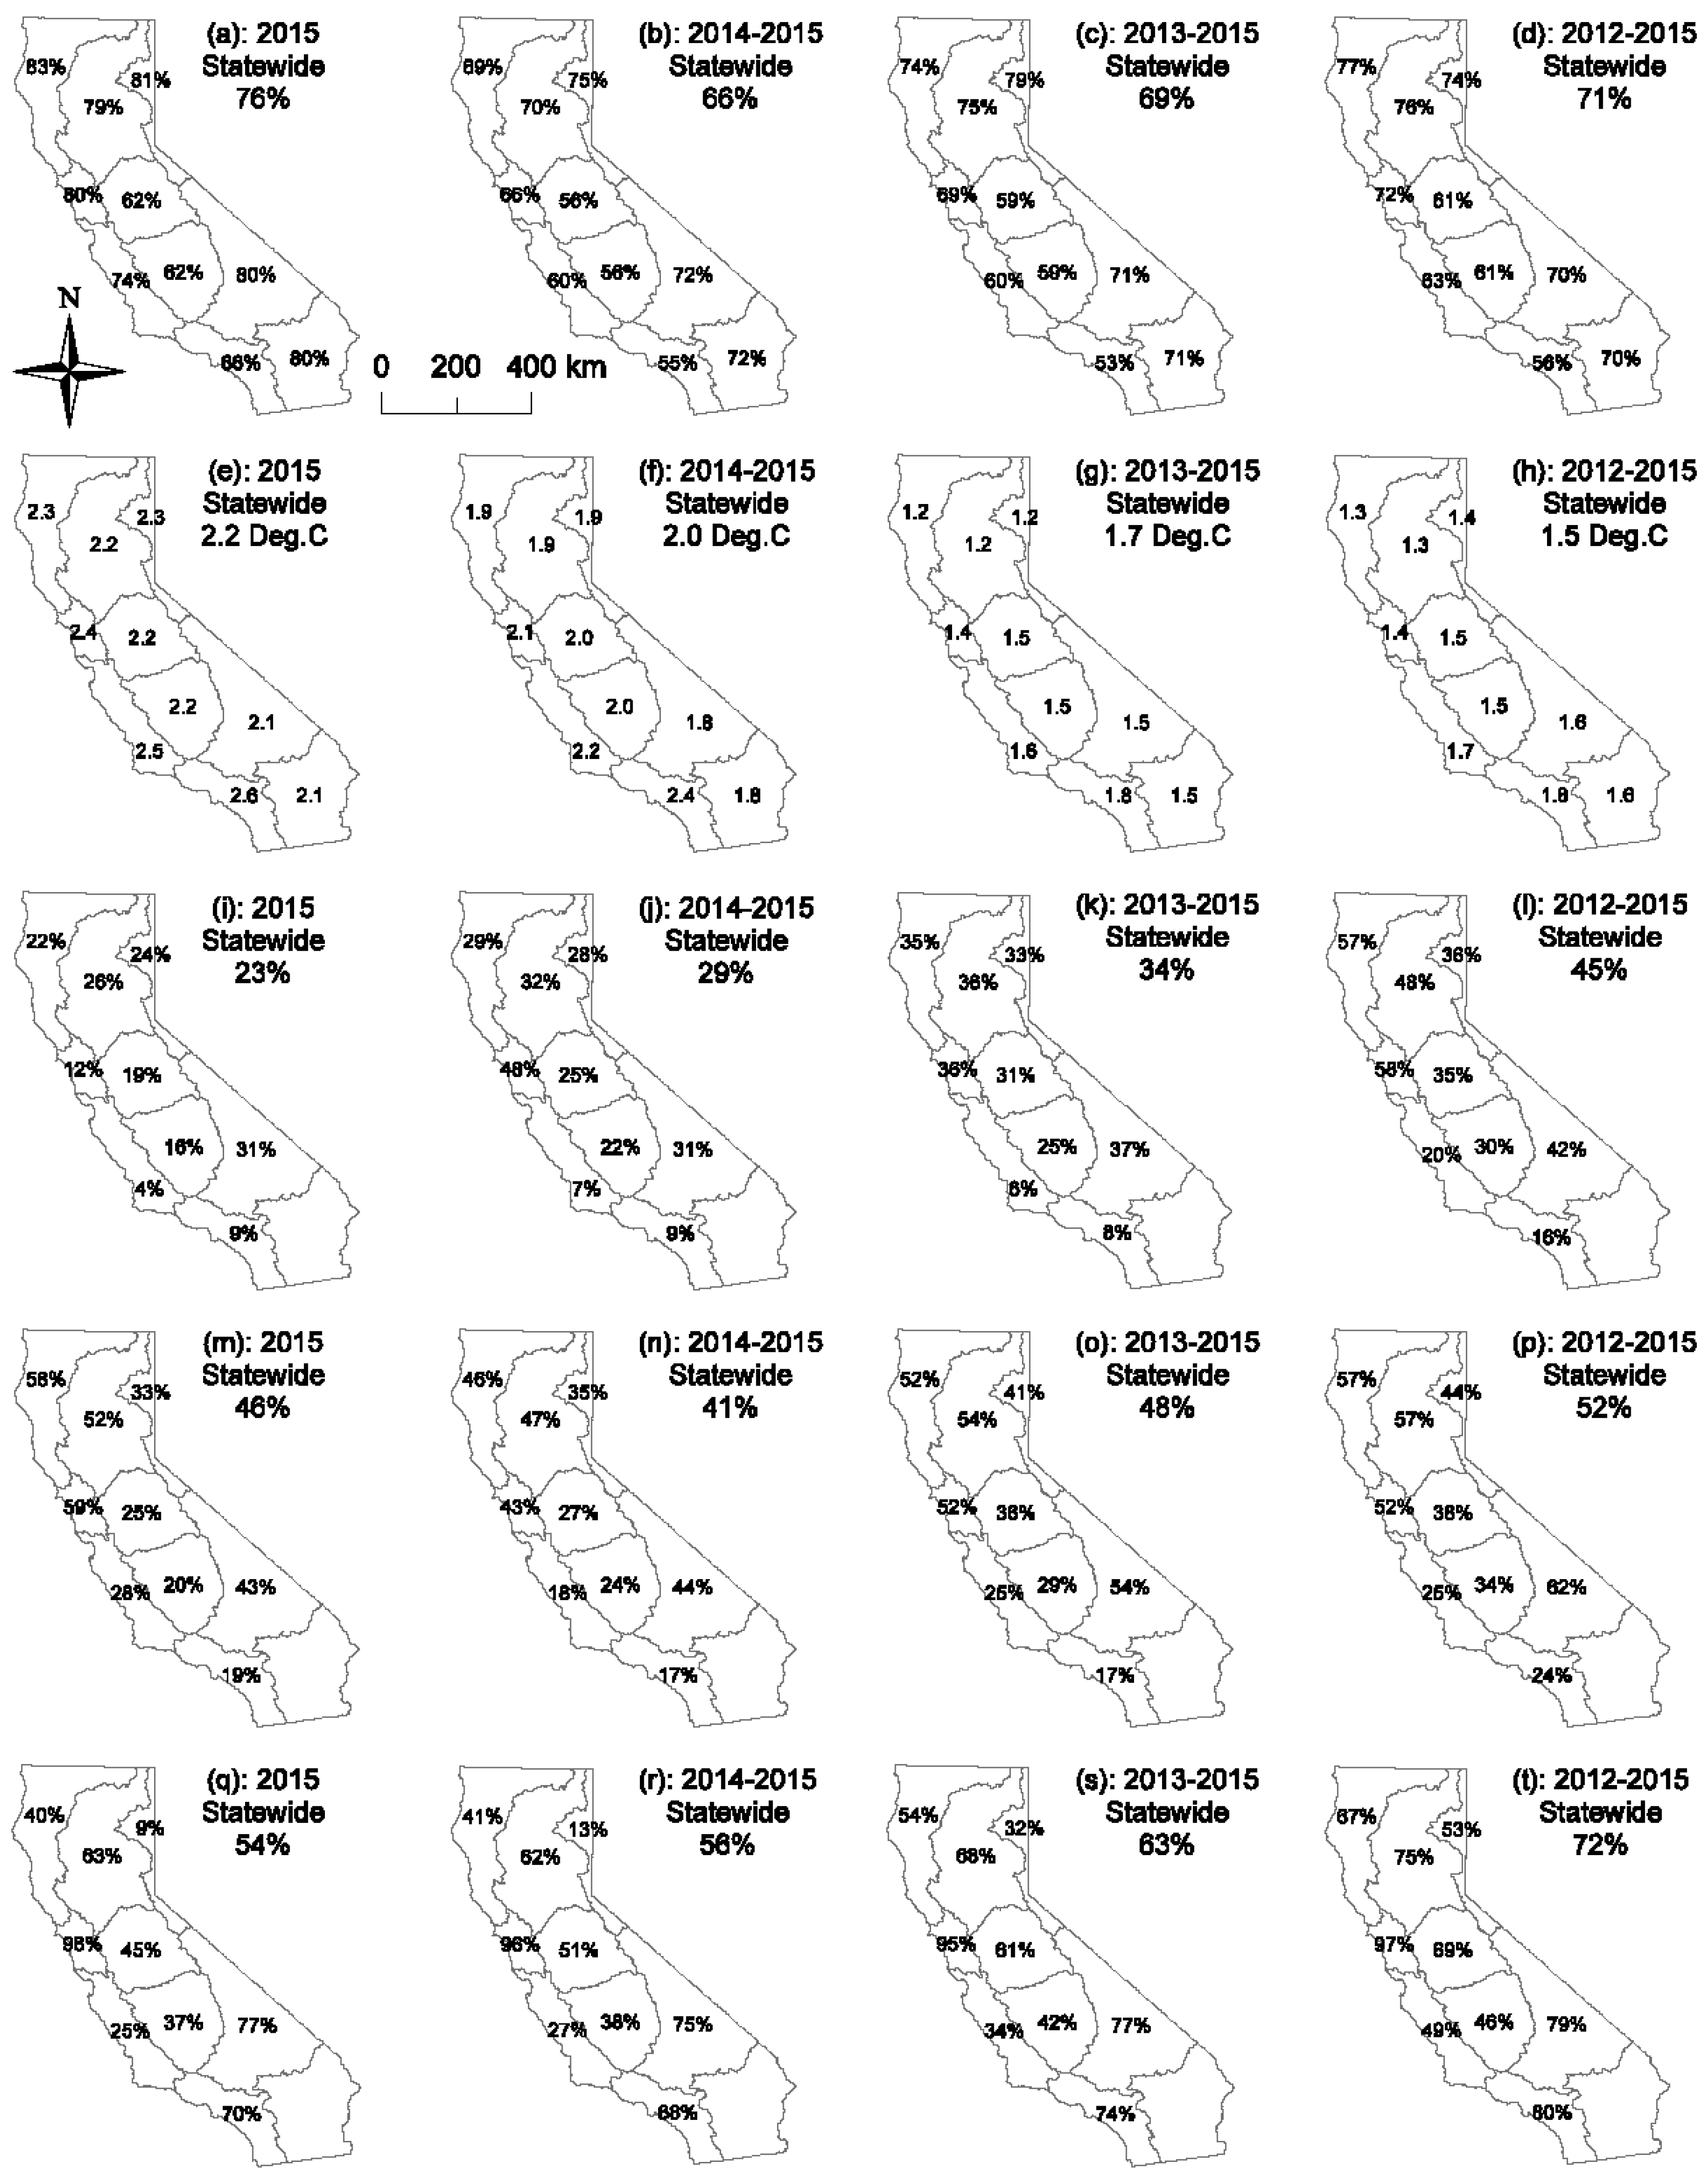
To investigate the spatial characteristics of the 2012–2015 drought, precipitation, temperature, AJ and annual FNF, and reservoir storage (September) are compared to the average conditions at the (hydrologic) regional scale in the driest one- to four-year sub-periods within 2012–2015 (Figure 9). It should be highlighted that the Colorado Region depends on the Colorado River for the majority of its water resources. The full natural flow and reservoir storage data of this region are normally not collected by CDWR and thus are not presented in this study.
It is clear that all regions observe less than average (percent of average less than 100%) precipitation during the 2012–2015 drought (Figure 9a–d). Particularly, both the SJQ region and the TUL region have the lowest percent of average among all regions at the one-year level (Figure 9a). At two- to four-year levels, the South Coast Region tops the list with percent of average values consistently less than 60%, followed by the SJQ Region and the TUL region (Figure 9c,d). The Central Coast Region is the next driest region following those three regions in all four periods. In comparison, three northern regions (North Coast, Sacramento, and North Lahontan) have distinctly higher percent of average (mostly above 70%) in all four periods considered, indicating that these regions have relatively less significant shortage in precipitation during the drought.
It is also evident that all regions have higher than average temperature in the past four years (Figure 9e–h). Particularly, the temperatures of all regions in 2015 exceed their corresponding long-term averages by an amount over 2 °C consistently (Figure 9e). Among all regions, the South Coast Region observes the most significant increases (above the long-term average) in temperature at all four temporal levels investigated, followed by the Central Coast Region. In comparison, temperature increases in the Central Valley regions are relatively milder. For instance, in 2015, the temperature of the South Coast region is 2.6 °C higher than the long-term average, while it is 2.2 °C for three Central Valley regions (Figure 9e).
It is noticeable that all regions observe less than one third of their average AJ FNF in 2015 (Figure 9i). This is most likely caused by record high temperature (Figure 9e), record low statewide snowpack conditions (Figure 2), below average precipitation (Figure 9a), and increased evapotranspiration (induced from high temperature) in 2015. At one- to three-year levels, the Central Coast Region has the lowest percent of average of AJ FNF (Figure 9i–k). The South Coast Region has the second lowest percent of average. The specific percent of average values of these two regions are persistently below 10%. At the four-year level (2012–2015), however, the South Coast Region observes the lowest AJ FNF (16% of average), followed by the Central Coast Region (20% of average). In general, the TUL region and the SJQ region also have significantly lower than average AJ FNF. Their percent of average values rank fourth (TUL) and fifth (SJQ) lowest in 2015 (Figure 9i), respectively. The corresponding ranks are third and fourth, respectively, at other three temporal scales (Figure 9j–l). The two wettest regions (North Coast and Sacramento) have relatively higher percent of average values in AJ FNF. In comparison to AJ FNF, all regions normally have higher percent of average values in annual FNF (Figure 9m–p). The difference is the most remarkable in 2015 (Figure 9m) when the statewide percent of average of annual FNF is twice of that for AJ FNF (46% versus 23%). These two regions with the lowest percent of average in AJ FNF (Central Coast: 4%; South Coast: 9%) have much higher percent of average values for annual FNF (Central Coast: 28%; South Coast: 19%). It is evident that the South Coast Region has the lowest percent of average values consistently at four temporal scales considered. The Central Coast Region has the second lowest percent of average values at two- to four year levels (Figure 9n–p). The TUL region also observes significantly less than average annual FNF, ranking second at the one-year level (2015) and third at two- to four-year levels. Similar to the case for the AJ FNF, the two wettest regions (North Coast and Sacramento) have relatively higher percent of average values in annual FNF. At the four-year level (2012–2015), both regions observe 57% (versus 24% of the South Coast Region) of average annual FNF.
Looking at reservoir storage (September), the North Lahontan Region has the lowest percent of average values (the TUL region ranks third) at one- to three- year levels while the TUL region has the lowest percent of average (North Lahontan region ranks third) at the four-year level. The Central Coast region and the North Coast region rank second and fourth, respectively, at all four temporal levels. In contrast, the San Francisco region reservoir storages are nearly at the average (ranging from 95% to 98% of average) in all four periods investigated.
In general, large differences are observed across different regions and different temporal scales. Water year 2015 tends to be the hottest year for all regions with the lowest AJ FNF recorded for every region. During the four-year period (2012–2015), all regions also have higher than normal temperature along with significant shortages in precipitation, AJ FNF, annual FNF, and reservoir storage. On average, the shortage in AJ FNF is the most significant. Judging by precipitation, the South Coast Region is the driest during the 2012–2015 drought, followed by the San Joaquin Region and TUL region. Assessing by temperature, the South Coast Region is the hottest during the drought with the Central Coast Region ranked second. Looking at streamflow runoff, the South Coast Region, Central Coast Region, and TUL region observe the most deficiencies. Measuring by reservoir storage, the North Lahontan Region, Central Coast Region, and TUL region generally have the most severe conditions.
Statewide, the percent of average values of precipitation, AJ FNF, annual FNF, and reservoir storage at four-year level are generally the highest comparing to their corresponding counterparts at other three temporal scales. The above average temperature is also the lowest at the four-year level. Those observations indicate that drought severity conditions are relatively milder in a longer period. This is due to the fact that drought conditions vary year to year and the severity is normally averaged out when looking over a longer period.
4. Discussion and Conclusions

This study examined the development of the 2012–2015 California drought and assessed the temporal and spatial patterns of the drought in a hydroclimatic framework. Observed and reconstructed operational hydrologic indices and variables employed in water resources planning and management practices at statewide and (hydrologic) regional scales were applied for this purpose. Parsimonious metrics typically used in operational drought assessment and management actions including the drought monitor category, percent of average, and rank were utilized to facilitate the analysis. The drought was characterized by below average precipitation and well above average temperature in the drought period, record low snowpack (statewide accumulated deficit: 280%-of-average), exceptionally low April-July runoff (statewide accumulated deficit 220%-of-average), and significantly below average reservoir storage (statewide four-year accumulated deficit 93%-of-average). Within the period from 2012–2015, in general, water year 2015 stood out as the driest single year; 2014–2015 was the driest two-year period; 2013–2015 tended to be the driest three-year period. Contrary to some previous studies stating that the 2012–2015 drought was unprecedented [28,30], this study illustrated that measuring by a certain number of variables (8 out of 28), the 2012–2015 drought was not without precedent in the record period.
On the spatial scale, based on precipitation, temperature, and full natural flow data, the South Coast Region, the Central Coast Region, the Tulare Region, and the San Joaquin Region generally had the most severe drought conditions. However, the North Lahontan Region, the Central Coast Region, the Tulare Region, and the North Coast Region had the lowest reservoir storage in the record period in terms of percent of average. This difference most likely stemmed from the fact that reservoirs are largely regulated for different purposes including water supply, flood control, hydropower generation, and recreation, among others. Reservoir storage is thus a variable reflecting both natural and anthropogenic footprints, which is different from other variables including precipitation, temperature, and full natural flow.
This extraordinary drought had both well perceived and more profound adverse impacts on the economy, society, and environment of the state. It caused progressive canopy water loss in California’s forests and devastating wildfires in the mountainous areas [7]. It also caused widespread water quality deterioration in streams and wetlands, leading to degraded habitat for native fishes and water birds and significantly reduced their populations [11]. The drought also had significant impact on the economy of the state particularly on the agriculture sector [13]. In light of these adverse impacts, water usage and management adaptions have been taken across the state to mitigate those impacts. Water conservation efforts have been ongoing, including the mandate of 25% cut in urban water usage and shifts toward perennial high revenue (per unit of water usage) crops in agriculture. The drought has also led to the enactment of the most comprehensive groundwater legislation, the Sustainable Groundwater Management Act (SGMA), in state history.
In a nutshell, this drought highlighted that California’s water supply system and ecosystem are susceptible and vulnerable to extreme drought events, as is the case for many other regions facing water scarcity. Projected warming [45,46,47], intensified occurrence of hydroclimatic extremes [31,48,49,50,51], and population increase [52] in the near future along with aging water infrastructure [53] pose further challenges for water managers striving to maintain the balance between reliable water supplies and healthy ecosystems. This study, from a retrospective standpoint, provides meaningful information for water managers to make effective adaptive management plans (in the context of guiding when and where to focus the adaption and recovery efforts based on the temporal and spatial patterns of the drought identified). From a prospective perspective, this study lays foundation for further drought responses should drought events (similar to the 2012–2015 drought in terms of severity and extent) reoccur.

Acknowledgments

The authors would like to thank their colleagues Stephen Nemeth, Maury Roos, John King, David Parker, Matt Winston, and Boone Lek for their valuable help in data collection. The authors would also like to thank two anonymous reviewers for their valuable comments that helped improve the quality of this study. Any findings, opinions, and conclusions expressed in this paper are solely the authors’ and do not reflect the views or opinions of their employer.

Author Contributions

The study was conceived by the authors together. Minxue He conducted the study and wrote the paper. Mitchel Russo and Michael Anderson provided critical discussions.

Conflicts of Interest

The authors declare no conflict of interest.

Appendix A

The Appendix provides detailed information on the sources and access links of data applied in this study, including (1) two figures showing long-term monthly precipitating and temperature values of 10 hydrologic regions (Figure A1) and the location of precipitation, streamflow, and snow course stations (Figure A2), respectively; (2) two tables shows the precipitation gauge information (Table A1) and streamflow gauge information (Table A2), respectively; and (3) access links.
Figure A1. (a) Mean monthly precipitation; and (b) mean monthly average temperature of the hydrologic regions for October (O), November (N), December (D), January (J), February (F), March (M), April (A), May (M), June (J), July (J), August (A), and September (S).
Climate 05 00005 g010
Figure A2. Location map of streamflow gauges (applied in determined runoff indices and water supply indices as well as regional runoff volume), precipitation gauges (applied in calculating precipitation indices), snow stations (applied in computing April 1st Snow Water Equivalent).
Climate 05 00005 g011
Table A1. Precipitation gauges applied in calculating precipitation indices.
Station IDStation NameHydrologic RegionLatitude(°)Longitude(°)Elevation (m)
MSCMount Shasta CitySacramento River41.314−122.3171094
SHAShasta DamSacramento River40.718−122.42325
MNRMineralSacramento River40.35−121.61486
QRDQuincySacramento River39.9366−120.9481042
BCMBrush CreekSacramento River39.694−121.341085
SRRSierraville RSSacramento River39.583−120.3671516
BYMBlue CanyonSacramento River39.283−120.71609
PCFPacific HouseSacramento River38.765−120.51036
CVTCalaveras Big TreesSan Joaquin River38.283−120.3171431
HTHHetch HetchySan Joaquin River37.95−119.7831180
YSVYosemite HeadquartersSan Joaquin River37.74−119.5831209
NFRNorth Fork RSSan Joaquin River37.233−119.5802
HNTHuntington LakeSan Joaquin River37.228−119.2212133
BALBalch PHTulare Lake36.909−119.089524
GNFGiant ForestTulare Lake36.562−118.7652027
ASMAsh MtTulare Lake36.483−118.833521
SGVSpringvilleTulare Lake36.1631−118.7071240
PSCPascoesTulare Lake35.967−118.352789
ISBIsabella DamTulare Lake35.646−118.473803
Table A2. Streamflow gauges applied in determining runoff indices and water supply indices.
Station IDStation NameHydrologic RegionLatitude(°)Longitude(°)Elevation (m)
0Russian R at HealdsburgNorth Coast38.61−122.8433
1Eel River at Scotia North Coast40.49−124.1049
2Trinity River at Lewiston Lake North Coast40.73−122.79570
3Klamath River from Copco to OrleansNorth Coast41.30−123.53131
4Napa River Near St Helena San Francisco Bay38.51−122.4659
5Arroyo Seco Near Soledad Central Coast36.28−121.32122
6Nacimiento below Nacimiento Dam Central Coast35.76−120.85182
7Arroyo Seco Near PasadenaSouth Coast34.22−118.18426
8Santa Ana River Near MentoneSouth Coast34.11−117.10594
9Truckee River from Tahoe oo FaradNorth Lahontan39.43−120.031574
10East Fork Carson near GardnervilleNorth Lahontan38.85−119.711519
11West Fork Carson at Woodfords North Lahontan38.77−119.831754
12East Walker near Bridgeport North Lahontan38.33−119.211951
13West Walker below Little Walker North Lahontan38.52−119.451682
14Owens River below Long Valley Dam South Lahontan37.59−118.71629
15Sacramento River above Bend Bridge Sacramento River40.29−122.1957
16Feather River at OrovilleSacramento River39.52−121.5545
17Yuba River near Smartville Sacramento River39.24−121.2785
18American River at Folsom Lake Sacramento River38.68−121.180
19Stanislaus River at Goodwin ReservoirSan Joaquin River37.85−120.6477
20Tuolumne River at La Grange ReservoirSan Joaquin River37.67−120.4452
21Merced River below Merced Falls San Joaquin River37.52−120.3395
22San Joaquin River below Millerton L San Joaquin River36.98−119.7290
23Kings River below Pine Flat Res Tulare Lake36.83−119.34296
24Kaweah River at Terminus ReservoirTulare Lake36.41−119.00145
25Tule River below Lake SuccessTulare Lake36.06−118.92211
26Kern River near Bakersfield Tulare Lake35.64−118.48742
Access links:

References

  1. Wilhite, D. Drought as a natural hazard: Concepts and definitions. In Drought, A Global Assessment; Routledge: New York, NY, USA, 2000; pp. 3–18. [Google Scholar]
  2. Mishra, A.K.; Singh, V.P. A review of drought concepts. J. Hydrol. 2010, 391, 202–216. [Google Scholar] [CrossRef]
  3. Dahal, P.; Shrestha, N.S.; Shrestha, M.L.; Krakauer, N.Y.; Panthi, J.; Pradhanang, S.M.; Jha, A.; Lakhankar, T. Drought risk assessment in Central Nepal: Temporal and spatial analysis. Nat. Hazards 2016, 80, 1913–1932. [Google Scholar] [CrossRef]
  4. Wilhite, D.; Hayes, M.; Knutson, C.; Smith, K. Planning for drought: Moving from crisis to risk management. J. Am. Water Resour. Assoc. 2000, 36, 697–710. [Google Scholar] [CrossRef]
  5. Federal Emergency Management Agency (FEMA). National Mitigation Strategy: Partnerships for Building Safer Communities; FEMA: Washington, DC, USA, 1995.
  6. Dai, A. Drought under global warming: A review. WIREs Clim. Chang. 2011, 2, 45–65. [Google Scholar] [CrossRef]
  7. Asner, G.P.; Brodrick, P.G.; Anderson, C.B.; Vaughn, N.; Knapp, D.E.; Martin, R.E. Progressive forest canopy water loss during the 2012–2015 California drought. Proc. Natl. Acad. Sci. USA 2016, 113, 249–255. [Google Scholar] [CrossRef] [PubMed]
  8. USFS. 2015 Forest Health Protection Arial Detection Survey. Available online: www.fs.usda.gov/detail/r5/forest-grasslandhealth/ (accessed on 5 April 2016).
  9. CALFire. Top 20 Largest California Wildfires. Available online: http://cdfdata.fire.ca.gov/incidents/incidents_statsevents/ (accessed on 5 April 2016).
  10. CALFire. Top 20 most damaging california wildfires. Available online: http://cdfdata.fire.ca.gov/incidents/incidents_statsevents/ (accessed on 5 April 2016).
  11. Hanak, E.; Mount, J.; Chappelle, C.; Lund, J.; Medellin-Azuara, J.; Moyle, P. What if California’s drought continues? Available online: http://www.ppic.org/main/publication_quick.asp?i=1160/ (accessed on 1 April 2016).
  12. Farr, T.G.; Jones, C.; Liu, Z. Progress Report: Subsidence in the Central Valley, California; NASA Jet Propulsion Laboratory (JPL): Pasadena, CA, USA, 2015. [Google Scholar]
  13. Howitt, R.; Medellin-Azuara, J.; MacEwan, D.; Lund, J.; Sumner, D. Economic Analysis of the 2014 Drought for California Agriculture; Center for Watershed Sciences, University of California: Oakland, CA, USA, 2014. [Google Scholar]
  14. Howitt, R.; MacEwan, D.; Medellin-Azuara, J.; Lund, J.; Sumner, D. Economic Analysis of the 2015 Drought for California Agriculture; Center for Watershed Sciences, University of California: Oakland, CA, USA, 2015. [Google Scholar]
  15. Hanak, E.; Mount, J. Putting California's latest drought in context. ARE Updat. 2015, 18, 2–5. [Google Scholar]
  16. CDWR. Sustainable Groundwater Management Act. Available online: http://groundwater.ca.gov/legislation.cfm/ (accessed on 5 April 2016).
  17. Swain, D.L.; Tsiang, M.; Haugen, M.; Singh, D.; Charland, A.; Rajaratnam, B.; Diffenbaugh, N.S. The extraordinary California drought of 2013/2014: Character, context, and the role of climate change. Bull. Am. Meteorol. Soc. 2014, 95, 3–7. [Google Scholar]
  18. Wang, S.Y.; Hipps, L.; Gillies, R.R.; Yoon, J.H. Probable causes of the abnormal ridge accompanying the 2013–2014 California drought: ENSO precursor and anthropogenic warming footprint. Geophys. Res. Lett. 2014, 41, 3220–3226. [Google Scholar] [CrossRef]
  19. Seager, R.; Hoerling, M.; Schubert, S.; Wang, H.; Lyon, B.; Kumar, A.; Nakamura, J.; Henderson, N. Causes of the 2011–14 California drought. J. Clim. 2015, 28, 6997–7024. [Google Scholar] [CrossRef]
  20. Diffenbaugh, N.S.; Swain, D.L.; Touma, D. Anthropogenic warming has increased drought risk in California. Proc. Natl. Acad. Sci. USA 2015, 112, 3931–3936. [Google Scholar] [CrossRef] [PubMed]
  21. Mann, M.E.; Gleick, P.H. Climate change and California drought in the 21st century. Proc. Natl. Acad. Sci. USA 2015, 112, 3858–3859. [Google Scholar] [CrossRef] [PubMed]
  22. AghaKouchak, A.; Cheng, L.; Mazdiyasni, O.; Farahmand, A. Global warming and changes in risk of concurrent climate extremes: Insights from the 2014 California drought. Geophys. Res. Lett. 2014, 41, 8847–8852. [Google Scholar] [CrossRef]
  23. Shukla, S.; Safeeq, M.; AghaKouchak, A.; Guan, K.; Funk, C. Temperature impacts on the water year 2014 drought in California. Geophys. Res. Lett. 2015, 42, 4384–4393. [Google Scholar] [CrossRef]
  24. Funk, C.; Hoell, A.; Stone, D. Examining the contribution of the observed global warming trend to the California droughts of 2012/13 and 2013/14. Bull. Am. Meteorol. Soc. 2014, 95, 11–15. [Google Scholar]
  25. Mao, Y.; Nijssen, B.; Lettenmaier, D.P. Is climate change implicated in the 2013–2014 California drought? A hydrologic perspective. Geophys. Res. Lett. 2015, 42, 2805–2813. [Google Scholar] [CrossRef]
  26. Williams, A.P.; Seager, R.; Abatzoglou, J.T.; Cook, B.I.; Smerdon, J.E.; Cook, E.R. Contribution of anthropogenic warming to California drought during 2012–2014. Geophys. Res. Lett. 2015, 42, 6819–6828. [Google Scholar] [CrossRef]
  27. Richman, M.B.; Leslie, L.M. Uniqueness and causes of the California drought. Procedia Comput. Sci. 2015, 61, 428–435. [Google Scholar] [CrossRef]
  28. Griffin, D.; Anchukaitis, K.J. How unusual is the 2012–2014 California drought? Geophys. Res. Lett. 2014, 41, 9017–9023. [Google Scholar] [CrossRef]
  29. Palmer, W.C. Meteorological Drought; US Department of Commerce, Weather Bureau: Washington, DC, USA, 1965.
  30. Robeson, S.M. Revisiting the recent California drought as an extreme value. Geophys. Res. Lett. 2015, 42, 6771–6779. [Google Scholar] [CrossRef]
  31. He, M.; Gautam, M. Variability and trends in precipitation, temperature and drought indices in the state of California. Hydrology 2016, 3, 14. [Google Scholar] [CrossRef]
  32. California Department of Water Resources (CDWR). Bulletin 132–14: Management of the California State Water Project; Sacramento, CA, USA, 2015.
  33. Cayan, D.R. Interannual climate variability and snowpack in the Western United States. J. Clim. 1996, 9, 928–948. [Google Scholar] [CrossRef]
  34. Serreze, M.C.; Clark, M.P.; Armstrong, R.L.; McGinnis, D.A.; Pulwarty, R.S. Characteristics of the Western United States snowpack from snowpack telemetry(SNOTEL) data. Water Resour. Res. 1999, 35, 2145–2160. [Google Scholar] [CrossRef]
  35. Meko, D.M.; Woodhouse, C.A.; Touchan, R. Klamath/San Joaquin/Sacramento hydroclimatic reconstructions from tree rings. In Draft Final Report to the California Department of Water Resources; University of Arizona: Tucson, AZ, USA, 2014; p. 117. [Google Scholar]
  36. Keyantash, J.; Dracup, J.A. The quantification of drought: An evaluation of drought indices. Bull. Am. Meteorol. Soc. 2002, 83, 1167–1180. [Google Scholar]
  37. Heim, R.R. A review of twentieth-century drought indices used in the United States. Bull. Am. Meteorol. Soc. 2002, 83, 1149–1165. [Google Scholar]
  38. Mishra, A.K.; Singh, V.P. Drought modeling—A review. J. Hydrol. 2011, 403, 157–175. [Google Scholar] [CrossRef]
  39. McKee, T.B.; Doesken, N.J.; Kleist, J. The relationship of drought frequency and duration to time scales. In Proceedings of the 8th Conference on Applied Climatology, Anaheim, CA, USA, 17–22 January 1993.
  40. Vicente-Serrano, S.M.; Begueria, S.; Lopez-Moreno, J.I. A multiscalar drought index sensitive to global warming: The standardized precipitation evapotranspiration index. J. Clim. 2010, 23, 1696–1718. [Google Scholar] [CrossRef]
  41. Shukla, S.; Wood, A.W. Use of a standardized runoff index for characterizing hydrologic drought. Geophys. Res. Lett. 2008. [Google Scholar] [CrossRef]
  42. Steinemann, A.; Iacobellis, S.F.; Cayan, D.R. Developing and evaluating drought indicators for decision-making. J. Hydrometeorol. 2015, 16, 1793–1803. [Google Scholar] [CrossRef]
  43. Steinemann, A. Drought information for improving preparedness in the Western States. Bull. Am. Meteorol. Soc. 2014, 95, 843–847. [Google Scholar] [CrossRef]
  44. Svoboda, M. An introduction to the drought monitor. Drought Netw. News 2000, 12, 15–20. [Google Scholar]
  45. Cayan, D.R.; Maurer, E.P.; Dettinger, M.D.; Tyree, M.; Hayhoe, K. Climate change scenarios for the California region. Clim. Chang. 2008, 87, 21–42. [Google Scholar] [CrossRef]
  46. Dettinger, M.D. Projections and downscaling of 21st century temperatures, precipitation, radiative fluxes and winds for the southwestern US, with focus on Lake Tahoe. Clim. Chang. 2013, 116, 17–33. [Google Scholar] [CrossRef]
  47. Scherer, M.; Diffenbaugh, N.S. Transient twenty-first century changes in daily-scale temperature extremes in the United States. Clim. Dyn. 2014, 42, 1383–1404. [Google Scholar] [CrossRef]
  48. Berg, N.; Hall, A. Increased interannual precipitation extremes over California under climate change. J. Clim. 2015, 28, 6324–6334. [Google Scholar] [CrossRef]
  49. Das, T.; Dettinger, M.D.; Cayan, D.R.; Hidalgo, H.G. Potential increase in floods in California’s Sierra Nevada under future climate projections. Clim. Chang. 2011, 109, 71–94. [Google Scholar] [CrossRef]
  50. Yoon, J.-H.; Wang, S.S.; Gillies, R.R.; Kravitz, B.; Hipps, L.; Rasch, P.J. Increasing water cycle extremes in California and in relation to ENSO cycle under global warming. Nat. Commun. 2015. [Google Scholar] [CrossRef] [PubMed]
  51. Wang, J.; Zhang, X. Downscaling and projection of winter extreme daily precipitation over North America. J. Clim. 2008, 21, 923–937. [Google Scholar] [CrossRef]
  52. USCB. Interim Projections 2000–2030 Based on Census 2000. Available online: http://www.census.gov/population/projections/data/state/ (accessed on 5 April 2016).
  53. Robinson, J.D.; Vahedifard, F. Weakening mechanisms imposed on California’s levees under multiyear extreme drought. Clim. Chang. 2016, 137, 1–14. [Google Scholar] [CrossRef]
Figure 1. (a) Hydrologic regions and precipitation stations used in determining precipitation indices; (b) spatial distribution of 262 active snow stations within different elevation bands; (c) 12 major watersheds in the Central Valley; (d) number of reservoirs and the corresponding aggregated capacity (in 109 m3) by hydrologic region.
Climate 05 00005 g001
Figure 2. Percent of Average of (POA) of annual precipitation, A1 SWE, AJ FNF, and reservoir storage (September) from water year 2011–2015 for regions: (a) Statewide; (b) Sacramento (SAC); (c) San Joaquin (SJQ); (d) Tulare (TUL). X-axis indicates water years. The average value (applied in POA calculation) is determined in the entire record period as tabulated in Table 2.
Climate 05 00005 g002
Figure 3. (a) Annual average temperature departures from long-term average values (°C) statewide and over three hydrologic regions in the Central Valley. X-axis represents water years. (b) Ground level change (m) of statewide (2109) wells between Fall 2010 and Fall 2015. X-axis denotes five categories of groundwater level changes. Negative (positive) numbers represent decrease (increase).
Climate 05 00005 g003
Figure 4. Drought monitor categories for statewide precipitation as well as major precipitation indices at different levels of periods (one- to four-year). At two-year, three-year, and four-year levels, the label of X-axis indicates the end year of the specific period. “Y” in the label of Y-axis stands for “Year”.
Climate 05 00005 g004
Figure 5. Drought monitor categories for statewide and central valley regional AJ FNF at different levels of periods (one- to four-year). At two-year, three-year, and four-year levels, the label of X-axis indicates the end year of the specific period. “Y” in the label of Y-axis stands for “Year”.
Climate 05 00005 g005
Figure 6. Ten driest (a) one-year; (b) two-year; (c) three-year; and (d) four-year periods in terms of statewide (accumulated over study period) precipitation. X-axis shows the ranks with rank 1 indicating the driest conditions. The numbers above bars represent the end year of the corresponding period.
Climate 05 00005 g006
Figure 7. Rank of Sacramento Four River flow and San Joaquin Four River flow in a paleoclimatic context (from 900–2015) in different sub-periods within 2012–2015.
Climate 05 00005 g007
Figure 8. Number of variables (out of 28) ranked first within different periods from 2012–2015.
Climate 05 00005 g008
Figure 9. Precipitation, temperature, AJ FNF, annual FNF, and September reservoir storage (first to fifth row, respectively) of the driest one- to four-year (first to fourth column, respectively) periods within 2012–2015 by hydrologic region. For temperature (eh), the numbers highlighted in each region denote the amount above average value (in °C); for other variables, the numbers represent the percent of average values (in %).
Climate 05 00005 g009
Table 1. General geographic and hydrologic characteristics of the 10 hydrologic regions.
IDRegion NameArea (km2)Annual Precipitation (109 m3)Annual Runoff (109 m3)Annual Runoff Ratio (%)
NCNorth Coast49,85969.035.651.7
SACSacramento River69,75064.627.642.7
NLNorth Lahontan15,6727.42.331.7
SFSan Francisco Bay11,5356.81.521.8
SJQSan Joaquin River38,94826.99.736.2
CCCentral Coast28,99515.23.120.3
TULTulare Lake43,60417.14.123.7
SLSouth Lahontan68,43411.51.614.0
SCSouth Coast27,96813.31.511.1
CRColorado River51,1035.30.24.7
Table 2. Record period length of study variables.
VariablesStateSACSJQTUL
Precipitation1896–20151921–20151913–20151922–2015
Temperature1896–20151896–20151896–20151896–2015
A1 SWE1950–20151930–20151930–20151930–2015
AJ FNF1941–20151906–20151901–20151931–2015
Annual FNF1941–20151906–20151901–20151931–2015
WSI-1906–20151901–2015-
Hybrid Annual FNF-900–2015900–2015-
Reservoir Storage (September)1976–20151976–20151976–20151976–2015
Table 3. Drought monitor categories 1.
Drought Monitor CategoryDescriptionPercentile
D0Abnormally Dry0.20–0.30
D1Moderate Drought0.10–0.20
D2Severe Drought0.05–0.10
D3Extreme Drought0.02–0.05
D4Exceptional Drought0.00–0.02
1 Adapted from [44].
Table 4. Four-year (2012–2015) accumulated deficiencies of study variables 1.
RegionPrecipitationA1 SWEAJ FNFReservoir Storage
POA (%)Amount (mm)POA (%)Amount (mm)POA (%)Amount (109 m3)POA (%)Amount (109 m3)
Statewide117660280200722046.19325.4
SAC911168260172721017.5809.7
SJQ1641575250198126012.3997.8
TUL176129531015492806.82031.7
1 The average value (applied in POA calculation) is determined for the entire record period as tabulated in Table 2.
Table 5. Periods with hydroclimatic variables ranked first in the record period 1.
StatewideTUL
VariablesOne-YearTwo-YearThree-YearFour-YearOne-YearTwo-YearThree-YearFour-Year
Precipitation19241976–19772012–20142012–201519772014–20152013–20152012–2015
Temperature20152014–20152013–20152012–201520152014–20152013–20152012–2015
A1 SWE20152014–20152013–20152012–201520152014–20152013–20152012–2015
AJ FNF20152014–20152013–20152012–201520152014–20152013–20152012–2015
Annual FNF19771976–19771990–19922012–201520152014–20152013–20152012–2015
Reservoir Storage19771976–19771990–19921989–199219901989–19901988–19901989–1992
VariablesSACSJQ
Precipitation19241976–19771975–19771931–193419242014–20152012–20142012–2015
Temperature20152014–20152013–20152012–201520152014–20152013–20152012–2015
A1 SWE20152014–20152013–20152012–201520152014–20152013–20152012–2015
AJ FNF20152014–20152013–20152012–201520151976–19772013–20152012–2015
Annual FNF19771976–19771990–19921931–193419771976–19772013–20152012–2015
Hybrid FNF15801579–15801578–15801931–193415801579–15802013–20152012–2015
WSI19771930–19311922–19242012–201520151976–19772012–20141928–1931
Reservoir Storage19771976–19771990–19921989–199219771976–19771990–19921989–1992
1 The periods within 2012–2015 with variables ranked first are highlighted in bold.