
An Ecological Study of the Association between Area-Level Green Space and Adult Mortality in Hong Kong

1
Merkle Shanghai, Pudong New Area, Shanghai 200136, China
2
School of Architecture, The Chinese University of Hong Kong, Hong Kong
3
Department of Architecture, National University of Singapore, Singapore
4
Department of Land Surveying and Geo-informatics, The Hong Kong Polytechnic University, Hong Kong
5
School of Public Health and Primary Care, The Chinese University of Hong Kong, Hong Kong
*
Author to whom correspondence should be addressed.
Climate 2017, 5(3), 55; https://doi.org/10.3390/cli5030055
Submission received: 25 April 2017
/
Revised: 7 July 2017
/
Accepted: 14 July 2017
/
Published: 18 July 2017
(This article belongs to the Special Issue Urban Climate, Air Pollution, and Public Health)
Abstract
:There is evidence that access to green spaces have positive effects on health, possibly through beneficial effects on exercise, air quality, urban heat islands, and stress. Few previous studies have examined the associations between green space and mortality, and they have given inconsistent results. This ecological study relates green space to mortality in Hong Kong from 2006 to 2011. The Normalized Difference Vegetation Index (NDVI), a measure of green space coverage, was measured for 199 small geographic areas in Hong Kong. Negative Binomial Regression Models were fit for mortality outcomes with NDVI, age, gender, population density, and area-level socio-economic variables as predictors, with Generalized Estimating Equations used to control for within-cluster correlation. An interquartile range (0.44 units) higher NDVI was significantly associated with lower cardiovascular (relative risk (RR) = 0.88, 95% confidence interval (CI) = 0.80, 0.98) and diabetes (RR = 0.72, 95% CI = 0.60, 0.92) mortality, and non-significantly associated with lower chronic respiratory mortality (RR = 0.90, 95% CI = 0.79, 1.02). Associations were stronger for males and low-income area residents. Lung cancer mortality had no significant association with green space. Better provision of urban green space, particularly in low-income areas, appears to have potential to reduce mortality in densely-populated Asian cities.
1. Introduction
Green space is defined as areas of grass, trees, or other vegetation set apart for recreational or aesthetic purposes [1], and examples of green space include national parks, forests, recreation areas, community gardens, green belts, and city parks. Hong Kong is a very densely populated city with over seven million people and limited land availability. There has been policy debate in Hong Kong as to whether the government should prioritize protecting green spaces or developing more built structures [2].
Green space not only enhances the beauty of the landscape but also has important significance for public health, and some studies have found evidence that green space improves people’s health [3,4], with potential benefits including stress reduction [5], improving mental health [6], preventing overweightness and obesity [7], promoting a healthy duration of sleep [8], lowering neonatal [9] and stroke mortality [10], absorbing air pollution [11], and providing space for individuals to participate in the physical activities. Having more green spaces has been found to be associated with a higher likelihood of walking maintenance [12], which has been shown to have a positive influence on citizens’ longevity in a densely populated city [13] and is associated with a lower odds of having any form of impaired glucose regulation [14].
The few studies examining associations between area-level green space and mortality have given inconsistent results. There are many factors that could influence these results and explain the inconsistencies between studies including differences in local climate, nature, accessibility of green space, and individual characteristics of the populations, such as socioeconomic status and personal habits. Two studies from the United Kingdom found that living in areas with more green space was associated with health and lower mortality for all cause [4], circulatory [4,15], and respiratory mortality [15], but not lung cancer mortality [15], while a similar study from New Zealand found no association between green space and mortality from cardiovascular disease or lung cancer [16]. A study including several cities in Ontario, Canada [17], found that an increase of one interquartile range (IQR) in Normalized Difference Vegetation Index (NDVI) was associated with a 5% reduction in non-accidental mortality, with significant reductions being observed for several specific cardiopulmonary causes of death as well. A study examining associations between city level greenness and standardized mortality for 49 of the largest cities in the U.S. found that city-level greenness was weakly, but positively and significantly, associated with higher all-cause mortality, but not significantly associated with mortality from heart disease, diabetes, or lung cancer [18]. A cohort study of Japanese elderly found that self-reported nearby walkable green space was associated with a significantly 13% higher odds of 5-year survival after adjustment for age, gender, living arrangements and living expenses [13]. A study of stroke mortality in Northwest Florida found that higher risk of stroke mortality was associated with lower exposure to greenspace [10]. A recent systematic review [19] on residential green space and mortality found that the majority of studies reported that green space was associated with reductions in cardiovascular mortality, but that evidence for reductions in overall mortality was more limited.
Studies on associations between green space and mortality have not been done in densely populated Asian cities. Although Hong Kong is a high-income country, it also has a very high level of income inequality [20], and is one of the most densely populated places in the world [21]. In this Hong Kong-based ecological study, we examined the association between area-level green space, population density, and several socioeconomic indicators, with all non-accidental causes of mortality and cause-specific mortality from cardiovascular diseases, chronic respiratory diseases, diabetes, and lung cancer.
1.1. Materials and Methods
In Hong Kong, the Tertiary Planning Unit (TPU) is the smallest geographic area for which census level variables on mortality, population density and socioeconomic characteristics are available. For town planning purposes, the whole territory of Hong Kong is divided into 289 TPUs by the Planning Department of the Government of the Hong Kong Special Administrative Region. As there were three boundary changes between the 2006 by-census and the 2011 census 6 of these TPUs, 3 pairs were merged with adjacent TPUs to maintain consistency.
1.2. Population Data
We obtained population data by TPU, Gender, and 5-year age group ( 20–24, 25–29, 30–34, 35–39, 40–44, 45–49, 50–54, 55–59, 60–64, 65–69, 70–74, 75–79, 80–84, 85+) from the 2006 by-census and 2011 census conducted by the Hong Kong Census and Statistics Department. The population data in the remaining years was estimated using linear interpolation. Owing to privacy considerations, a TPU with less than 1000 persons was merged with an adjacent TPU(s) by the Hong Kong Census and Statistics Department. Indicators of TPU-level socioeconomic status included percentage of population over 15 years of age with a tertiary education, percentage over 15 with a primary education or less, median household income, and percentage working in professional or managerial occupations. Population density was calculated as the total population divided by the area of each TPU (km2). These variables were taken from the 2006 by-census. Age, in 5-year groups (0–4, …, 85+) and gender were controlled in the analysis.
1.3. Health Data
In Hong Kong, all deaths are registered in the regional vital registration system. The vital registration system covers the entire population in Hong Kong, and death registration is a legal requirement before burial or cremation. Mortality data for every registered death during the period of 2006–2011 from the Hong Kong Census and Statistics Department was obtained. The individual-level mortality data included the age, gender, occupation (most are retired), date of death, International Classification of Diseases (ICD)-10 code, marital status, TPU of residence at death, and country of birth of decedents.
Outcomes extracted from this data included counts of all (non-accidental) mortality (ICD-10: letters A-R), and cause-specific mortality due to lung cancer (C34.0-C34.9), chronic lower respiratory diseases (J40-J47), cardiovascular diseases (I00-I09, I10-I13, I20-I51, I60-I69), and diabetes mellitus (E10.9, E11.9-E14.9), stratified by age, gender, and TPU of residence, for decedents greater than or equal to 20 years of age at death.
1.4. Green Space Coverage Data
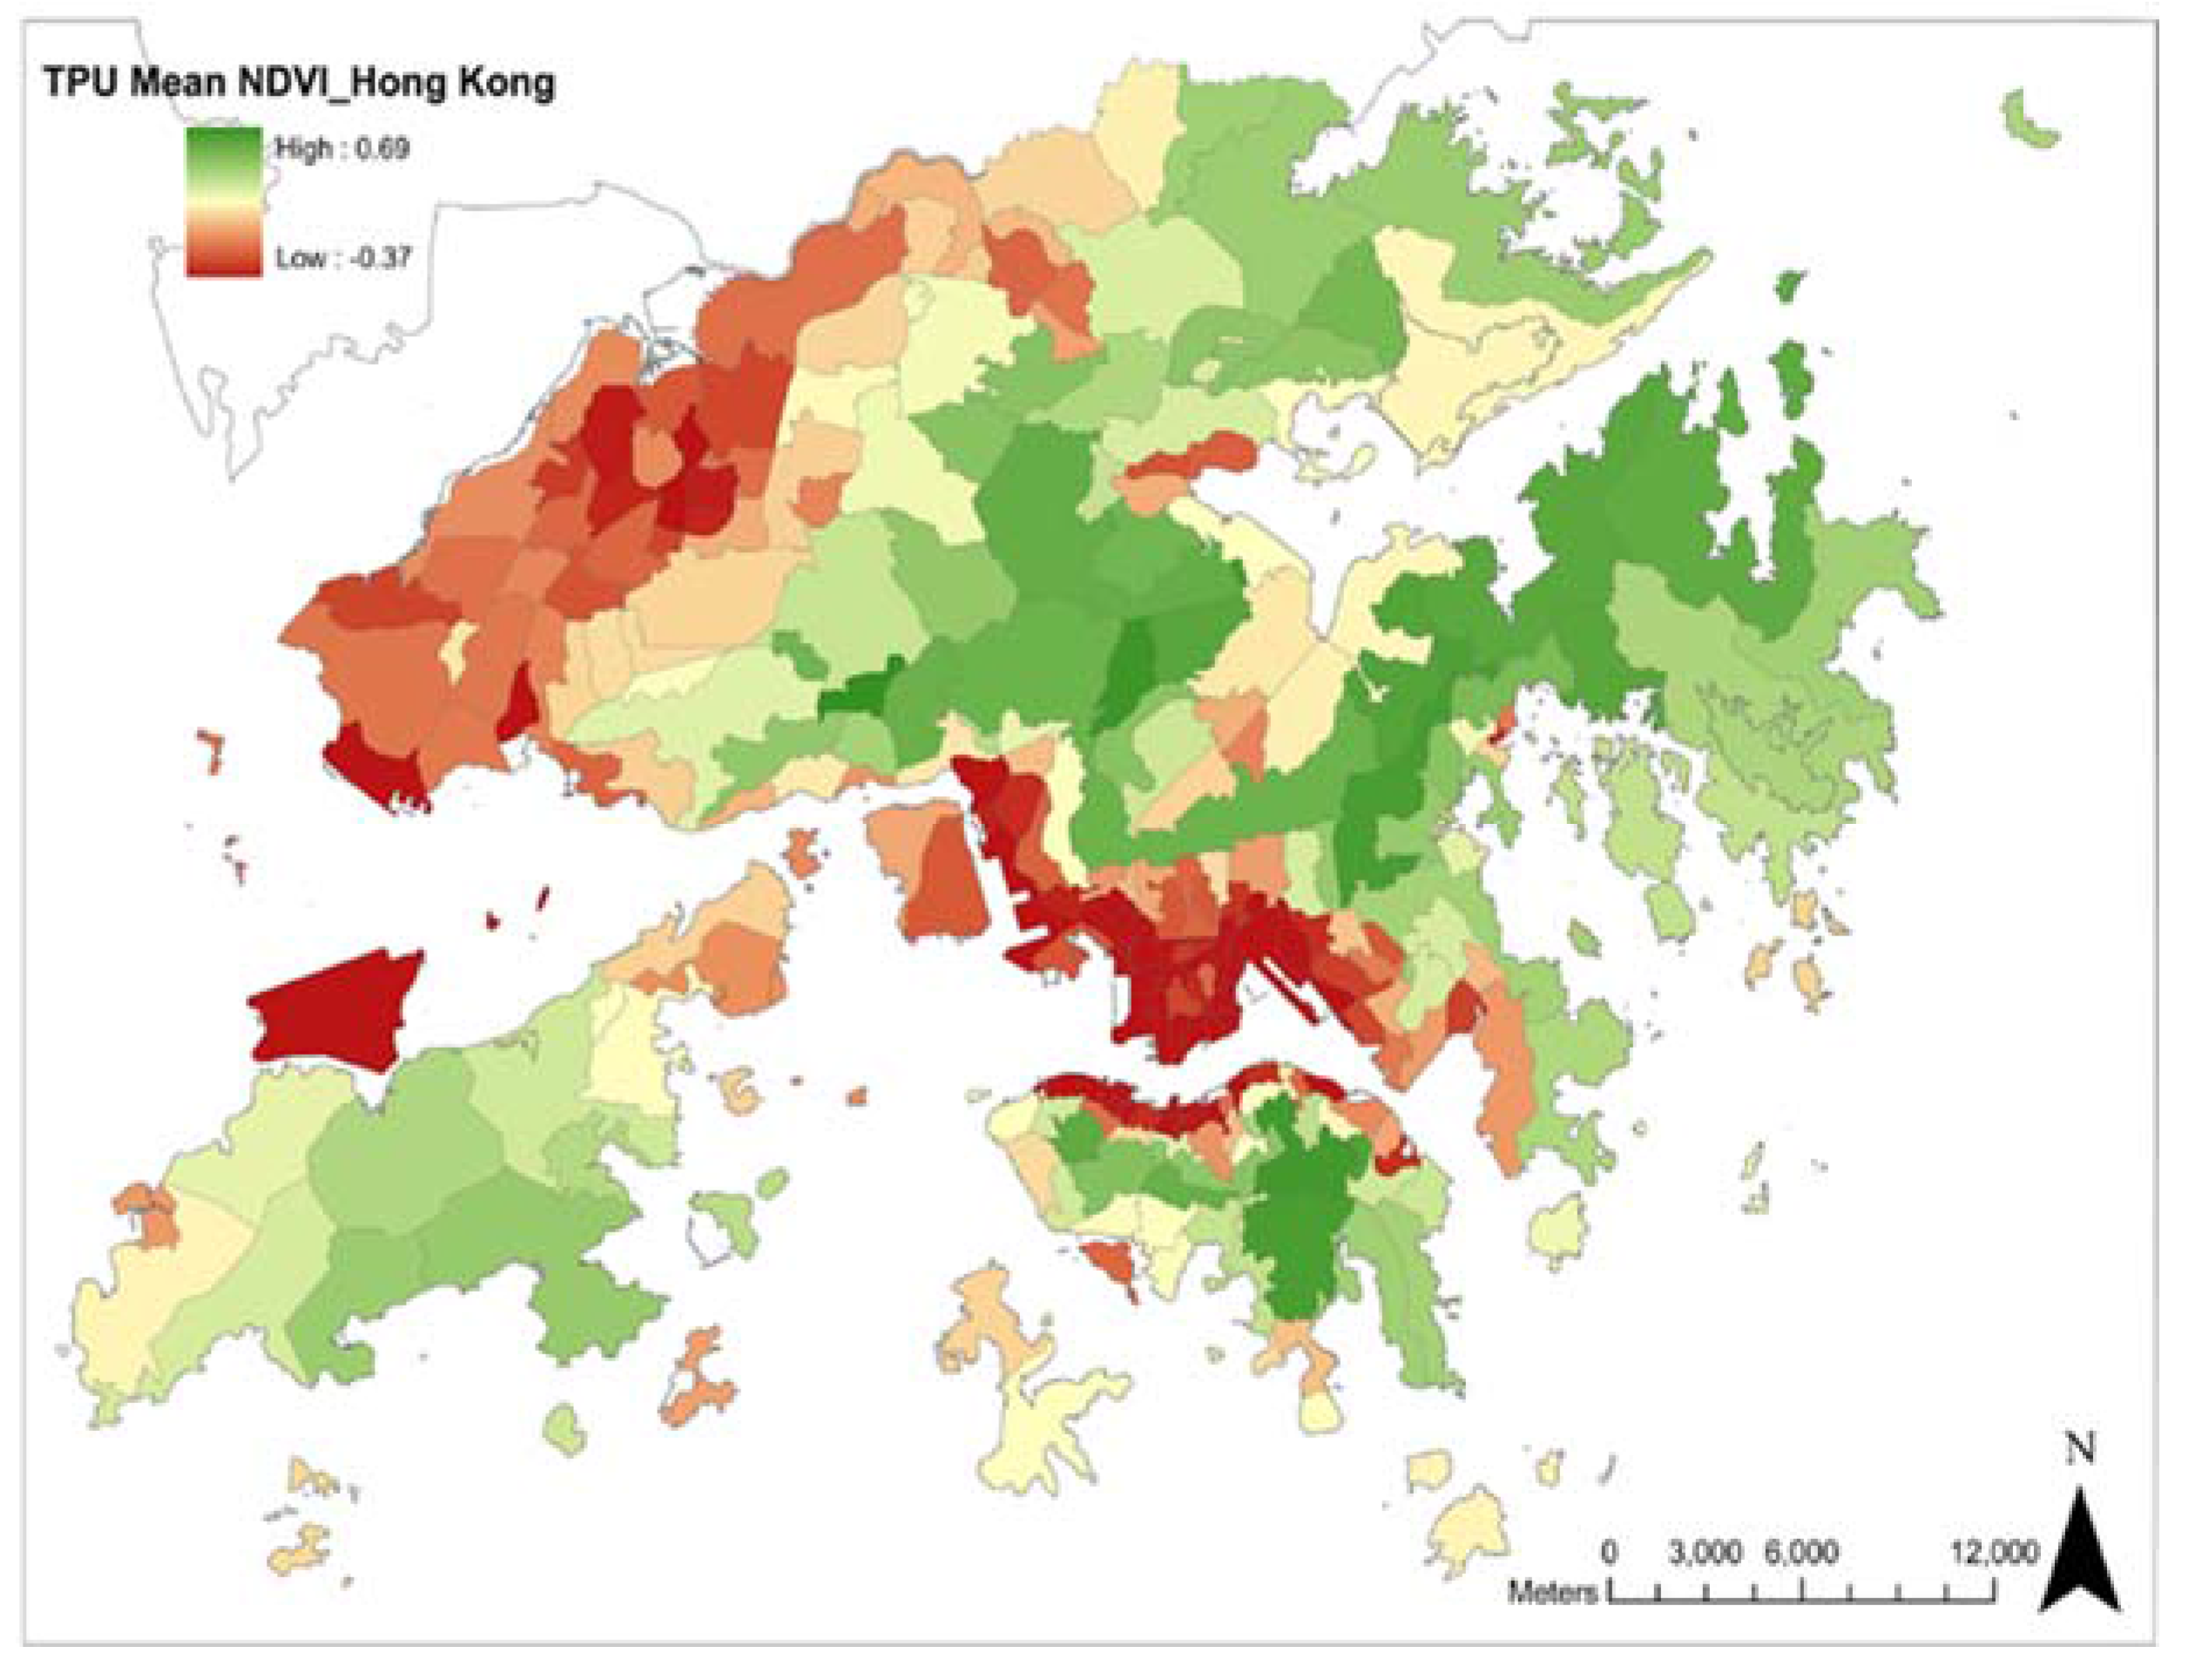
We chose to use the Normalized Difference Vegetation Indicator (NDVI) [22] to measure green space coverage. We obtained the NDVI for the year 2006 from a Landsat satellite image taken on 4 December 2006, at 30 m resolution. As most of vegetation in Hong Kong is evergreen, the NDVI is not expected to vary much seasonally. The NDVI is a simple numeric indicator derived from a ratio of the visible wavebands to assess the amount and density of green vegetation within the target area being observed. The ‘mean’ value is the spatial averaged NDVI for each TPU. The following are the threshold values of NDVI from the Hong Kong Planning Department [23]: NDVI < −0.1: urban/bare soil NDVI > −0.1: vegetation NDVI > 0.6: tree −0.1 < NDVI < 0.6: grass. Since green space coverage has not changed dramatically in Hong Kong in recent years, we assumed that the NDVI index remained constant during that study period. The map below shows the distribution of green space coverage in Hong Kong (see Figure 1). The mean NDVI was calculated at the TPU-level using ArcGIS software. For grid cells that overlapped, more than one TPU weighted averaging was performed using the Mosaic function in ArcGIS. Although some individual grids had NDVI values as high as 1.0, the maximum average value for an individual TPU was 0.57, as all TPUs had some non-green areas.
2. Data Analysis
The Statistical Analysis System (SAS) software version 9.3 [24] was used for data analysis. Since the outcomes were count variables showing over dispersion (variance > mean), negative binomial regression models were used to examine the association between area level predictors and mortality using proc genmod in SAS. Generalized Estimating Equations were used to account for the correlations with TPUs. Those that resulted in the minimum quasi-likelihood under the independence criterion were chosen as working correlation structures for each model [25]. For each outcome, models were fit adjusted for the confounding effects of age and gender with TPU level variables included one at a time (model 1), then with all TPU level variables included in the same model (model 2). The models used a log link, with log (population) on the right side of the equation as the offset term. Females and age group 85+ were the reference groups for gender and age, respectively, while TPU level characteristics were entered into the models as continuous variables. The model equation is as follows:
where i = 1, …, 17 indexes age group, j = M,F indexes gender, k indexes tertiary planning unit, and Σ represents summation of the 17 age groups. Stratified analyses were also performed with separate models fit for mortality for each gender, age groups classified as <75 years old or ≥75, and for TPUs stratified by median household income and median population density.
E[Log (deathsijk)] = β0 + β1genderj + Σ βiAgeGroupi + β19NDVI+ β20PopDensity + β21MedianHouseholdIncomek + β22PercentwithTertiaryEducationk + β23PercentManagementk + β24 PercentwithPrimaryEducationk + log (populationijk)
3. Results
During the period from 2006 to 2011, there were 238,441 total deaths from natural causes among Hong Kongers 20 years of age or older. Some cases (about 2.4%) were lacking in information about TPU, and were dropped, leaving 236,734 deaths from natural causes, 58,854 deaths from cardiovascular diseases, 2964 deaths from diabetes, 21,422 deaths from lung cancer, and 11,744 deaths from chronic respiratory diseases for analysis. The mean (SD) and median (Interquartile Range), 5th and 95th percentiles for NDVI values across TPUs were 0.04 (0.26), 0.02 (−0.19, 0.25), −0.31, and 0.50, respectively. TPU level NDVI had a strong negative association with population density (r = −0.65, p < 0.0001), a weak positive association with median household income (r = 0.17, p < 0.0001), and correlations near 0 with the other TPU level variables. All SES-related variables were highly correlated with absolute values of r ranging between 0.78 and 0.93. Basic descriptive statistics for TPU level variables are shown in Table 1. The median, interquartile range, and range of mean daily temperatures during the study period were 24.5 °C, 19.3–27.8 °C, and 8.8–31.2 °C, respectively, and were 28.8 °C, 28.6–29.6 °C, and 21.7–31.2 °C, during the hot season (June–September). There were 8 heat waves, defined as 3 or more consecutive days with mean temperatures > hot season 90th percentile (30 °C) during the study period, but none lasted longer than 5 days.
The results for Model 1, controlling for age and gender, and Model 2 additionally controlling for all TPU-level variables, are shown in Table 2. The results for model 1 indicate that greater green space coverage was significantly associated with lower mortality from cardiovascular diseases (p = 0.012), and diabetes (p = 0.0016), and non-significantly associated with lower respiratory and all natural causes mortality, but had no association with lung cancer mortality. The other TPU level variables were significantly associated with most other outcomes, with lower percent of adults with tertiary education, lower median income, higher population density, a lower percentage of adults in management level positions, and a higher percentage with only kindergarten or primary education being associated with higher mortality. After entering all TPU level variables in the same models (model 2), living in a TPU with more green space coverage was significantly associated with lower CVD, and diabetes mortality, and marginally significantly associated with chronic respiratory mortality. Among the other TPU level variables only lower percentage of adults with a tertiary education was consistently associated with higher mortality for all types when including all TPU level variables in the model.
Table 3 shows the relative risks for mortality for a 0.44 unit increase in NDVI from models controlling for all TPU level variable stratified by gender. The results show that the protective association between NDVI was considerably stronger for males than for females for all-natural and CVD mortality, and slightly stronger for diabetes and chronic respiratory mortality.
Table 4 shows the results stratified by TPU level median household income, split at the median of this variable. The results show that the negative association between NDVI and mortality was stronger for those living in TPUs with lower median household income for CVD, diabetes, chronic respiratory disease, and all natural cause mortality.
Analysis stratified by population density (Table 5) indicated that the negative associations between NDVI and mortality were generally stronger for those living in higher density areas, although this difference was only statistically significant for diabetes mortality.
Results stratified by age group indicated very little difference between effect estimates for deaths among those < 75 vs. those ≥ 75, except for deaths from DM, for which the RR (95% CI) for the younger group was 0.61 (0.51, 0.74) vs. 0.78 (0.67, 0.90) for the older group (p < 75 vs. ≥ 75 = 0.044). In general, the associations between mortality and the other TPU level variables in the stratified analyses were similar to those in the overall analysis.
4. Discussion
Our study found that greater area-level green space was associated with lower mortality from cardiovascular disease, diabetes, and chronic respiratory disease, but not with lung cancer mortality. Our results are consistent with studies from the UK [4,15], which found negative associations between green space and mortality for all-cause, cardiovascular, and respiratory mortality, but not lung cancer mortality, but not with a study from New Zealand [16], which found no association between green space and mortality from either cardiovascular diseases or lung cancer.
When comparing our results to those from other countries, it is important to note that the urban environment in Hong Kong is quite different from those of cities in western countries. For instance, although the population density in Hong Kong overall, 6480 per square km [26], is not that much higher than London’s density of 5510 per square km [27], London’s most densely populated borough, Islington, has a population density of 15,118 [27], less than a third of that of Hong Kong’s densest district, Kwun Tong, with a population density of 53,110 [26]. Suburban ‘New Towns’ in Hong Kong usually consist of high-rise apartment buildings, and look more like urban areas in western countries, while rural ‘villages’ generally have houses quite close to one another and look suburban, although they are often surrounded by forests.
Several mechanisms by which green space might reduce mortality from certain diseases have been proposed, including promotion of physical activity, stress reduction, and increasing social contact [15,16]. Prior studies have provided evidence that more physical activity is associated with lower cardiovascular and respiratory mortality [15] and that stress may exacerbate, and social support ameliorate, cardiovascular diseases [15]. Another mechanism by which green space might reduce mortality is through mitigation of urban heat islands [28]. Our previous study found that increases in mortality during periods of extreme hot weather in Hong Kong were greater in areas of the city with high urban heat island intensity [26].
We also found that the negative green space mortality associations were generally stronger for males than for females, for those living in low SES areas relative to those in high SES areas, and for those living in areas with higher population density. Our findings regarding gender differences in the association between cardiovascular mortality and green space are partially in agreement with a study from the U.K. [15], although their study found no association for females, whereas our study found a weaker and non-significant association for females. The U.K. study [15] also found a stronger negative association between respiratory disease mortality and green space for males than for females, which is similar to our study finding. The authors of the U.K. study suggest possible explanations for a weaker association for women, including the possibility that women are less likely to engage in vigorous physical activity while in public parks, and that greater concerns about personal safety may limit women’s use of local green space [15]. These issues may also be responsible for the weaker associations we observe for women’s cardiovascular and diabetes mortality. A recent study examining the association between perceived neighborhood environment and physical activity in 11 countries, including Hong Kong, found that higher perceived safety was associated with more physical activity for women, but no association was found for men [29]. This result was consistent across all study locations, including Hong Kong (personal communication Professor Ester Cerin, 2015). Another possible explanation for the observed gender difference is that males may spend more time outdoors than females for occupational reasons, either because they work outdoors near where they live, or they spend time exposed to outdoor conditions in their TPUs when they commute to work.
Our finding of a stronger negative association between green space and mortality from cardiovascular diseases for those living in areas with median household income below the median is also consistent with a study from the U.K. [4]. Although they examined this effect modification in a different way, by looking at the association between income deprivation and mortality stratified by green space, their finding of a weaker income deprivation-mortality gradient in areas with more green space [4] implies a stronger green space mortality association in areas with more income deprivation. In Hong Kong, those with lower incomes are less likely to be able to afford gym memberships, and are less likely to have access to automobiles that would allow them easier access to green spaces further from their places of residence. Thus, they may rely more on local green spaces as areas in which to engage in physical activity. In addition, those with lower income are less able to afford to own air-conditioners, or the electricity needed to run them regularly. Thus the protective effects of green space in reducing urban heat island effects may be more important in poorer neighborhoods. We also note that the observed differences in the green space mortality associations between males and females, and between those living in high- vs. low-SES TPUs were not statistically significant at the conventional α = 0.05 level; therefore, we cannot rule out the possibility that these differences represent random error. Our finding of a generally stronger association between green space and mortality for those living in areas with higher population density is not surprising, as the beneficial effects of green space including exercise opportunities, pollution and urban heat island reduction, and stress relief, may be more needed among people living in more urbanized settings.
We found that green space had a particularly strong association with diabetes mortality. This could result from a lower prevalence of diabetes in areas with more green space, or lower mortality among diabetics living in these areas, or both. Either way, our result implies that the potential protective effects of green space are stronger for diabetes mortality than for the other causes we considered. One possible explanation is that the mechanisms through which green space affects mortality might be relatively more important for diabetes as compared to other causes of death. A recent meta-analysis examining the effect of physical inactivity on the burden of non-communicable diseases worldwide estimated that the unadjusted population attributable fraction (PAF) from physical inactivity was higher for diabetes mortality than for all-cause for mortality, coronary heart disease (CHD) mortality and mortality from breast or colon cancer [30]. While the adjusted PAF for diabetes was only higher than that for CHD, the authors point out that some of the adjusted confounders, such as overweight and hypertension, can be exacerbated by physical inactivity, and hence the adjusted estimates may be over-adjusting [30]. Diabetics may also be particularly sensitive to the adverse health effects of hot weather. Studies have shown that circulation to the skin [31] and sweating response [32] are impaired in diabetics, and hospital admissions among diabetics have been found to be more sensitive to heat wave effects [33].
Our study has some limitations. We do not have individual data on socioeconomic status, and thus this variable could only be adjusted using TPU level SES indicators. In addition, we were unable to adjust for behavioral factors related to mortality, including smoking, at either the individual or TPU level. As smoking is by far the most important risk factor for lung cancer, if smoking prevalence was higher in areas with less green space, we would expect to have seen a protective association between green space and lung cancer. The fact that no such association was found suggests that TPU level differences in smoking prevalence are very unlikely to have confounded our results. We also note that lower individual socioeconomic status has been found to be associated with lung cancer incidence in Hong Kong after controlling for smoking status [34]; thus, residual confounding from individual level SES would be expected to have an effect on the lung cancer results as well. However, we cannot definitively rule out residual confounding from other behavioral or SES-related mortality risk factors with this study. A further limitation is that the TPU level green space may not accurately represent the accessibility of green space for individual residents of a particular TPU. Although TPUs are geographically small, an individual living on the border of a TPU with little green space might easily be able to access green space in a neighboring TPU. Likewise, green space in a resident’s own TPU might be difficult to access due to geographical distance or physical barriers. In addition, as TPU of residence at the time of death was used, some people may have only moved to that particular TPU shortly before dying. Such misclassification, though, is likely to be random, and thus would be more likely to bias estimates towards the null. Additionally, some subjects may spend considerable time outside their TPU of residence, and this would likely be more of an issue for males and younger subjects who would be more likely to be employed. However, we also note that about 90% of deaths from natural causes during the study period were among people classified as ‘economically inactive’.
Our study also has its own strengths. First, we had a large database which included nearly all deaths in Hong Kong from 2006 to 2011, and data on green space and other area level predictors for 199 TPUs. Thus we had good power to detect associations between green space coverage and mortality. Secondly, NDVI, which was used in the study to measure the green space coverage, has been found to be a valid and useful measure of green space coverage for epidemiologic studies [35]. While NDVI does have some limitations [36], the spatial distribution of NDVI in Hong Kong generally agreed quite well with land use data with densely populated and built up areas of Kowloon and northern Hong Kong Island having the lowest values, rural areas and country parks having the highest values, and suburban ‘new towns’ in between.
5. Conclusions
In conclusion, our study found that greater area-level green space had a significant protective association with mortality from cardiovascular diseases and diabetes. A protective association with chronic respiratory mortality was not significant, but close to it. We also found that these associations were stronger for males and those living in areas with below-average median household income. Greater provision of green space appears to have the potential to reduce mortality in densely populated sub-tropical Asian cities, and might also reduce SES-related mortality disparities. These findings should be considered by policy makers involved in urban planning. For example, recently, the Civil Engineering and Development Department of the Hong Kong SAR Government has developed the Greening Master Plans (GMPs) for all Hong Kong districts, and has started to plant more greeneries, especially in dense downtown areas. Our study results can provide scientific understanding about the greenery’s impact, which can be adopted and implemented in the GMPs to identify locations at district level where greenery can have the greatest public health point impact.
Acknowledgments
The authors wish to thank Ester Cerin from the School of Public Health of Hong Kong University for confirming that gender differences in the association between perceived safety and physical activity were found for Hong Kong as well. We also wish to thank the two reviewers whose helpful suggestions greatly improved the quality of the manuscript.
Author Contributions
Lixia Xu did most of the data analysis and drafted the first version of the text. Ren Chao and Yuan Chao contributed to the data analysis, interpretation of the results, and suggested the use of green space and NDVI as indicators of good urban planning potentially related to population health. Janet E. Nichols calculated the NDVI measurements and aided in interpretation of the results and answering reviewer queries. William B. Goggins planned the study, contributed to the data analysis and interpretation of results, and edited the final version of the manuscript.
Conflicts of Interest
The authors declare no conflict of interest.
References
- Nielsen, T.S.; Hansen, K.B. Do green areas affect health? Results from a Danish survey on the use of green areas and health indicators. Health Place 2007, 13, 839–850. [Google Scholar] [CrossRef] [PubMed]
- Abadal, E. Gold or green: The debate on open access policies. Int. Microbiol. 2013, 16, 199–203. [Google Scholar] [PubMed]
- De Vries, S.; Verheij, R.A.; Groenewegen, P.P.; Spreeuwenberg, P. Natural environments—Healthy environments? An exploratory analysis of the relationship between green space and health. Environ. Plan. 2003, 35, 1717–1731. [Google Scholar] [CrossRef]
- Mitchell, R.; Popham, F. Effect of exposure to natural environment on health inequalities: An observational population study. Lancet 2008, 372, 1655–1660. [Google Scholar] [CrossRef]
- Van den Berg, A.E.; Maas, J.; Verheij, R.A.; Groenewegen, P.P. Green space as a buffer between stressful life events and health. Soc. Sci. Med. 2010, 70, 1203–1210. [Google Scholar] [CrossRef] [PubMed]
- Alcock, I.; White, M.P.; Wheeler, B.W.; Fleming, L.E.; Depledge, M.H. Longitudinal effects on mental health of moving to greener and less green urban areas. Environ. Sci. Technol. 2014, 48, 1247–1255. [Google Scholar] [CrossRef] [PubMed] [Green Version]
- Coombes, E.; Jones, A.P.; Hillsdon, M. The relationship of physical activity and overweight to objectively measured green space accessibility and use. Soc. Sci. Med. 2010, 70, 816–822. [Google Scholar] [CrossRef] [PubMed]
- Astell-Burt, T.; Feng, X.; Kolt, G.S. Does access to neighbourhood green space promote a healthy duration of sleep? Novel findings from a cross-sectional study of 259 319 australians. BMJ Open 2013, 3. [Google Scholar] [CrossRef] [PubMed] [Green Version]
- Kihal-Talantikite, W.; Padilla, C.M.; Lalloue, B.; Gelormini, M.; Zmirou-Navier, D.; Dequen, S. Green space, social inequalities and neonatal mortality in France. BMC Pregnancy Childbirth. 2013, 13, 191. [Google Scholar] [CrossRef] [PubMed] [Green Version]
- Hu, Z.; Liebens, J.; Rao, K.R. Linking stroke mortality with air pollution, income, and greenness in northwest Florida: An ecological geographical study. Int. J. Health Geogr. 2008, 7, 20. [Google Scholar] [CrossRef] [PubMed]
- Amorim, J.H.; Rodrigues, V.; Tavares, R.; Valente, J.; Borrego, C. CFD modelling of the aerodynamic effect of trees on urban air pollution dispersion. Sci. Total Environ. 2013, 461, 541–551. [Google Scholar] [CrossRef] [PubMed]
- Sugiyama, T.; Giles-Corti, B.; Summers, J.; du Toit, L.; Leslie, E.; Owen, N. Initiating and maintaining recreational walking: A longitudinal study on the influence of neighborhood green space. Prev. Med. 2013, 57, 178–182. [Google Scholar] [CrossRef] [PubMed]
- Takano, T.; Nakamura, K.; Watanabe, M. Urban residential environments and senior citizens’ longevity in megacity areas: The importance of walkable green spaces. J. Epidemiol. Community Health 2002, 56, 913–918. [Google Scholar] [CrossRef] [PubMed]
- Yates, T.; Henson, J.; Khunti, K.; Morris, D.H.; Edwardson, C.; Brady, E.; Davies, M.J. Effect of physical activity measurement type on the association between walking activity and glucose regulation in a high-risk population recruited from primary care. Int. J. Epidemiol. 2013, 42, 533–540. [Google Scholar] [CrossRef] [PubMed]
- Richardson, E.A.; Mitchell, R. Gender differences in relationships between urban green space and health in the United Kingdom. Soc. Sci. Med. 2010, 71, 568–575. [Google Scholar] [CrossRef] [PubMed]
- Richardson, E.A.; Pearce, J.; Mitchell, R.; Day, P.; Kingham, S. The association between green space and cause-specific mortality in urban New Zealand: An ecological analysis of green space utility. BMC Public Health 2010, 10, 240. [Google Scholar] [CrossRef] [PubMed] [Green Version]
- Villeneuve, P.J.; Jerret, M.; Su, J.G.; Burnett, R.T.; Chen, H.; Wheeler, A.J.; Goldberg, M.S. A cohort study relating urban green space with mortality in Ontario, Canada. Environ. Res. 2012, 115, 51–58. [Google Scholar] [CrossRef] [PubMed]
- Richardson, E.A.; Mitchell, R.; Hartig, T.; de Vries, S.; Astell-Burt, T.; Frumkin, H. Green cities and health: A question of scale. J. Epidemiol. Community Health 2012, 66, 160–165. [Google Scholar] [CrossRef] [PubMed] [Green Version]
- Gascon, M.; Triguero-Mas, M.; Martinez, D.; Dadvand, P.; Rojas-Rueda, D.; Plasencia, A.; Nieuwenhuijsen, M.J. Residential green spaces and mortality: A systematic review. Environ. Int. 2016, 86, 60–67. [Google Scholar] [CrossRef] [PubMed] [Green Version]
- Central Intelligence Agency. Field listing: Distribution of family income—GINI index. In CIA World Factbook; Central Intelligence Agency: Washington, DC, USA. Available online: https://www.cia.gov/library/publications/the-world-factbook/fields/2172.html (accessed on 11 August 2016).
- World Bank Group. Data Bank Population Density (People per sq. km of Land Area), Overview per Country; The World Bank: Washington, DC, USA. Available online: http://data.worldbank.org/indicator/EN.POP.DNST (accessed on 11 August 2016).
- Nichol, J.; Wong, M.S.; Fung, C.; Leung, K.K.M. Assessment of urban environmental quality in a subtropical city using multispectral satellite images. Environ. Plan. B Plan. Des. 2006, 33, 39–58. [Google Scholar] [CrossRef]
- Hong Kong Planning Department: Urban Climatic Map and Standards for Wind Environment—Feasibility Study; Final Report. Available online: http://www.pland.gov.hk/pland_en/p_study/prog_s/ucmapwev/ucmap_project/content/reports/final_report.pdf (accessed on 12 June 2016).
- SAS Institute Inc. The SAS System for Windows; Release 9.2; SAS Institute Inc.: Cary, NC, USA, 2011. [Google Scholar]
- Pan, W. Akaike’s information criterion in generalized estimating equations. Biometrics 2001, 57, 120–125. [Google Scholar] [CrossRef] [PubMed]
- Goggins, W.B.; Chan, E.Y.Y.; Ng, E.; Ren, C.; Chen, L. Effect modification of the association between meteorological factors and mortality by urban heat islands in Hong Kong. PLoS ONE 2012, 7, e38551. [Google Scholar] [CrossRef] [PubMed]
- Greater London Authority. Land Area and Population Density, Ward and Borough. London Datastore: London, UK. Available online: https://data.london.gov.uk/dataset/land-area-and-population-density-ward-and-borough (accessed on 14 June 2017).
- Ng, E.; Chen, L.; Wang, Y.N.; Yuan, C. A study of the cooling effects of greening in a high-density city: An experience from Hong Kong. Build. Environ. 2011, 47, 256–271. [Google Scholar] [CrossRef]
- Van Dyck, D.; Cerin, E.; De Bourdeauhuij, I.; Salvo, D.; Christiansen, L.B.; Macfarlane, D.; Owen, N.; Mitas, J.; Troelsen, J.; Aquinaga-Ontoso, J.; et al. Moderating effects of age, gender and education on the associations of perceived neighborhood environment attributes with accelerometer-based physical activity: The IPEN adult study. Health Place 2015, 36, 65–73. [Google Scholar] [CrossRef] [PubMed]
- Lee, I.M.; Shiroma, E.J.; Lobelo, F.; Puska, P.; Blair, S.N.; Katzmarzyk, P.T. Effects of physical inactivity on major non-communicable diseases worldwide: An analysis of burden of disease and life expectancy. Lancet 2012, 380, 219–229. [Google Scholar] [CrossRef]
- Petrofsky, J.S. The effect of type-2-diabetes-related vascular endothelial dysfunction on skin physiology and activities of daily living. J. Diabetes Sci. Technol. 2011, 5, 657–667. [Google Scholar] [CrossRef] [PubMed]
- Kenney, G.P.; Yardley, J.; Brown, C.; Sigal, R.J.; Jay, O. Heat stress in older individuals and patients with common chronic diseases. CMAJ 2010, 182, 1053–1060. [Google Scholar] [CrossRef] [PubMed]
- Semenza, J.C.; McCullough, J.E.; Flanders, W.D.; McGeehin, M.A.; Lumpkin, J.R. Excess hospital admissions during the July 1995 heat wave in Chicago. Am. J. Prev. Med. 1999, 16, 269–277. [Google Scholar] [CrossRef]
- Chan-Yeung, M.; Koo, L.C.; Ho, J.C.M.; Tsnag, K.W.T.; Chau, W.S.; Chiu, S.W.; Ip, M.S.M.; Lam, W.K. Risk factors associated with lung cancer in Hong Kong. Lung Cancer 2003, 40, 131–140. [Google Scholar] [CrossRef]
- Rhew, I.C.; Vander Stoep, A.; Kearney, A.; Smith, N.L.; Dunbar, M.D. Validation of the normalized difference vegetation index as a measure of neighborhood greenness. Ann. Epidemiol. 2011, 21, 946–952. [Google Scholar] [CrossRef] [PubMed]
- Pettorelli, N.; Olav Vik, J.; Mysterud, A.; Gaillard, J.M.; Tucker, C.J.; Stenseth, N.S. Using the satellite-derived NDVI to assess ecological responses to environmental change. Trends Ecol. Evol. 2005, 20, 503–510. [Google Scholar] [CrossRef] [PubMed]
Figure 1.
Chloropeth map of mean NDVI by tertiary planning unit (TPU) in Hong Kong, 2006.

Table 1.
Characteristics of 199 TPUs in Hong Kong 2006.
| Mean | Median | Percentiles | ||||||
|---|---|---|---|---|---|---|---|---|
| 0% | 5% | 25% | 75% | 95% | 100% | |||
| Geographic variables | ||||||||
| NDVI | 0.041 | 0.022 | −0.36 | −0.31 | −0.19 | 0.25 | 0.50 | 0.57 |
| Population Density per km2 | 30,990 | 18,795 | 25 | 262 | 2200 | 45,651 | 118,945 | 150,700 |
| Land Area km2 | 3.86 | 1.84 | 0.04 | 0.21 | 0.64 | 4.65 | 15.99 | 28.49 |
| Demographic variables | ||||||||
| Percent 65 years or older | 15.8 | 15.5 | 2.3 | 6.5 | 10.9 | 19.7 | 26.8 | 55.1 |
| Percent 85 years or older | 2.2 | 2.0 | 0.1 | 0.4 | 1.2 | 2.7 | 4.6 | 16.7 |
| Percent female | 54 | 54 | 17 | 52 | 53 | 56 | 62 | 67 |
| Socioeconomic variables | ||||||||
| Median household income (US$ per year) | 39,321 | 27,484 | 4800 | 16,412 | 22,452 | 38,710 | 108,697 | 206,354 |
| Percent with tertiary education | 20.7 | 13.8 | 1.5 | 6.2 | 10.0 | 28.9 | 59.4 | 67.8 |
| Percent with primary or kindergarten education only or no education | 27.0 | 28.2 | 2.1 | 4.5 | 20.9 | 34.4 | 42.5 | 66.6 |
| Percent in professional or management occupations | 35.2 | 31.5 | 8.9 | 17.1 | 23.0 | 46.1 | 63.6 | 83.3 |
Table 2.
Relative risks, 95% confidence intervals, and p-values for all natural cause, and cause-specific mortality associated with increases in NDVI of 0.44 units (observed IQR) for TPU of residence, Hong Kong, 2006–2011.
Table 2.
Relative risks, 95% confidence intervals, and p-values for all natural cause, and cause-specific mortality associated with increases in NDVI of 0.44 units (observed IQR) for TPU of residence, Hong Kong, 2006–2011.
| Model 1 RR (95% CI) | p | Model 2 RR (95% CI) | p | |
|---|---|---|---|---|
| All Natural | 0.94 (0.85, 1.03) | 0.16 | 0.95 (0.86, 1.05) | 0.35 |
| Cardiovascular Diseases | 0.89 (0.81, 0.97) * | 0.0096 | 0.88 (0.80, 0.98) * | 0.016 |
| Chronic Respiratory Diseases | 0.95 (0.85, 1.06) | 0.38 | 0.90 (0.79, 1.02) | 0.11 |
| Lung Cancer | 1.00 (0.91, 1.10) | 0.98 | 1.07 (0.95, 1.18) | 0.26 |
| Diabetes | 0.80 (0.70, 0.92) * | 0.0016 | 0.72 (0.60, 0.85) * | 0.0002 |
* Statistically significant at the p < 0.05 level.
Table 3.
Relative risks (95% CI) and p-values (from Model 2) corresponding to a 0.44 unit increase in NDVI for models controlling for age and all other TPU level variables stratified by gender, Hong Kong, 2006–2011.
Table 3.
Relative risks (95% CI) and p-values (from Model 2) corresponding to a 0.44 unit increase in NDVI for models controlling for age and all other TPU level variables stratified by gender, Hong Kong, 2006–2011.
| Females RR (95% CI) | p-Value | Males RR (95% CI) | p-Value | p Male vs. Female | |
|---|---|---|---|---|---|
| All Natural | 1.00 (0.91, 1.12) | 0.88 | 0.91 (0.82, 1.01) | 0.083 | 0.18 |
| Cardiovascular Disease | 0.94 (0.84, 1.05) | 0.25 | 0.83 (0.74, 0.93) * | 0.0015 | 0.14 |
| Chronic Respiratory Disease | 0.93 (0.79, 1.09) | 0.36 | 0.90 (0.79, 1.02) | 0.099 | 0.76 |
| Lung Cancer | 1.08 (0.95, 1.24) | 0.23 | 1.03 (0.93, 1.15) | 0.33 | 0.56 |
| Diabetes | 0.74 (0.61, 0.90) * | 0.0019 | 0.69 (0.56, 0.85) * | 0.0005 | 0.64 |
* Statistically significant at the p < 0.05 level.
Table 4.
Relative risks (95% CI) and p-values (from Model 2) corresponding to a 0.25 unit increase in NDVI for models controlling for age, gender, and all other TPU level variables TPU median household income, Hong Kong, 2006–2011.
Table 4.
Relative risks (95% CI) and p-values (from Model 2) corresponding to a 0.25 unit increase in NDVI for models controlling for age, gender, and all other TPU level variables TPU median household income, Hong Kong, 2006–2011.
| Low Income TPUs Median Household Income ≤ 17,500 HKD/Month (≤27,100 US$/Year) RR (95% CI) | p-Value | High Income TPUs Median Household Income > 17,500 HKD/Month (>27,100 US$/Year) RR (95% CI) | p-Value | p-Value Comparing High and Low Income TPUs | |
|---|---|---|---|---|---|
| All Natural | 0.84 (0.68, 1.04) | 0.11 | 1.03 (0.89, 1.19) | 0.70 | 0.12 |
| Cardiovascular Diseases | 0.82 (0.68, 0.99) * | 0.036 | 0.96 (0.82, 1.12) | 0.57 | 0.21 |
| Chronic Respiratory Diseases | 0.83 (0.67, 1.04) | 0.11 | 0.97 (0.82, 1.15) | 0.72 | 0.28 |
| Lung Cancer | 1.00 (0.84, 1.20) | 0.97 | 1.09 (0.95, 1.26) | 0.22 | 0.46 |
| Diabetes | 0.66 (0.48, 0.85) * | 0.0023 | 0.78 (0.61, 0.99)* | 0.037 | 0.30 |
* Statistically significant at the p < 0.05 level.
Table 5.
Relative risks (95% CI) and p-values (from Model 2) corresponding to a 0.25 unit increase in NDVI for models controlling for age, gender, and all other TPU level variables TPU median household income, Hong Kong, 2006–2011.
Table 5.
Relative risks (95% CI) and p-values (from Model 2) corresponding to a 0.25 unit increase in NDVI for models controlling for age, gender, and all other TPU level variables TPU median household income, Hong Kong, 2006–2011.
| High Density TPUs Population Density > 19,000 pop/sq km RR (95% CI) | p | Low Density TPUs Population Density > 19,000 pop/sq km RR (95% CI) | p | p Comparing High and Low Density TPUs | |
|---|---|---|---|---|---|
| All Natural | 0.93 (0.79, 1.09) | 0.36 | 0.93 (0.80, 1.08) | 0.34 | 0.98 |
| Cardiovascular Diseases | 0.82 (0.68, 0.97) * | 0.019 | 0.91 (0.78, 1.07) | 0.25 | 0.36 |
| Chronic Respiratory Diseases | 0.80 (0.68, 0.98) * | 0.012 | 1.00 (0.81, 1.23) | 0.98 | 0.12 |
| Lung Cancer | 1.04 (0.89, 1.21) | 0.66 | 1.10 (0.97, 1.25) | 0.15 | 0.57 |
| Diabetes | 0.62 (0.47, 0.81) * | 0.0006 | 0.87 (0.72, 1.06) | 0.16 | 0.011 |
© 2017 by the authors. Licensee MDPI, Basel, Switzerland. This article is an open access article distributed under the terms and conditions of the Creative Commons Attribution (CC BY) license (http://creativecommons.org/licenses/by/4.0/).
Share and Cite
MDPI and ACS Style
Xu, L.; Ren, C.; Yuan, C.; Nichol, J.E.; Goggins, W.B. An Ecological Study of the Association between Area-Level Green Space and Adult Mortality in Hong Kong. Climate 2017, 5, 55. https://doi.org/10.3390/cli5030055
AMA Style
Xu L, Ren C, Yuan C, Nichol JE, Goggins WB. An Ecological Study of the Association between Area-Level Green Space and Adult Mortality in Hong Kong. Climate. 2017; 5(3):55. https://doi.org/10.3390/cli5030055
Chicago/Turabian StyleXu, Lixia, Chao Ren, Chao Yuan, Janet E. Nichol, and William B. Goggins. 2017. "An Ecological Study of the Association between Area-Level Green Space and Adult Mortality in Hong Kong" Climate 5, no. 3: 55. https://doi.org/10.3390/cli5030055
Note that from the first issue of 2016, this journal uses article numbers instead of page numbers. See further details here.