Comparative Study of Monsoon Rainfall Variability over India and the Odisha State

1
CSIR Fourth Paradigm Institute, Wind tunnel Road, Bengaluru, Karnataka 560037, India
2
Visvesvaraya Technological University, Belagavi, Karnataka 590018, India
*
Author to whom correspondence should be addressed.
Climate 2017, 5(4), 79; https://doi.org/10.3390/cli5040079
Submission received: 13 July 2017
/
Revised: 20 September 2017
/
Accepted: 9 October 2017
/
Published: 10 October 2017
(This article belongs to the Special Issue Climate Impacts and Resilience in the Developing World)
Abstract
:Indian summer monsoon (ISM) plays an important role in the weather and climate system over India. The rainfall during monsoon season controls many sectors from agriculture, food, energy, and water, to the management of disasters. Being a coastal province on the eastern side of India, Odisha is one of the most important states affected by the monsoon rainfall and associated hydro-meteorological systems. The variability of monsoon rainfall is highly unpredictable at multiple scales both in space and time. In this study, the monsoon variability over the state of Odisha is studied using the daily gridded rainfall data from India Meteorological Department (IMD). A comparative analysis of the behaviour of monsoon rainfall at a larger scale (India), regional scale (Odisha), and sub-regional scale (zones of Odisha) is carried out in terms of the seasonal cycle of monsoon rainfall and its interannual variability. It is seen that there is no synchronization in the seasonal monsoon category (normal/excess/deficit) when analysed over large (India) and regional (Odisha) scales. The impact of El Niño, La Niña, and the Indian Ocean Dipole (IOD) on the monsoon rainfall at both scales (large scale and regional scale) is analysed and compared. The results show that the impact is much more for rainfall over India, but it has no such relation with the rainfall over Odisha. It is also observed that there is a positive (negative) relation of the IOD with the seasonal monsoon rainfall variability over Odisha (India). The correlation between the IAV of monsoon rainfall between the large scale and regional scale was found to be 0.46 with a phase synchronization of 63%. IAV on a sub-regional scale is also presented.
1. Introduction
The variability in the Indian summer monsoon (ISM) at different spatio-temporal scales is large, and the monsoon patterns over a larger domain, such as the whole of India, and a smaller domain, like the Odisha state, are totally different. It is very important to quantify the variability of seasonal monsoon rainfall over different spatial scales because the geographic background and local climate of the state are different from those of India. The Odisha state (17°31′–22°31′ N and 81°31′–87°3°′ E) is situated on the eastern side of India, having a total area of 155,707 km2, consisting of four physiographical regions, viz. (i) coastal plain, (ii) northern upland, (iii) central river basin, and (iv) south west hilly regions. It is seen that some of the hill peaks in the northern upland and southwest hilly regions are as high as 1000–2000 m, and the eastern part is a coast. Though the Eastern Ghats of India extend mainly into the North Odisha and South Odisha regions, very large variations in the topography affect the seasonal advance and distribution of the monsoon flow at the sub-regional scale. A map is shown in Figure 1a.
The complexities of the ISM have been studied by several authors emphasizing its spatial variability [1,2,3,4,5,6,7,8,9]. The spatial variability of ISM has also been studied by a few researchers [10,11,12]. However, the study of the summer monsoon over a region like Odisha is unique and important due to its location being little explored. Few studies [13,14] on the monsoon rainfall over Odisha revealed the important feature of the monsoon at the regional scale. It is also important to quantify the inter-relationship of the ISM and the monsoon rainfall over the domain of Odisha, which can be used as an indicator for understanding the monsoonal variability at the regional scale.
The Indian monsoon is a global phenomenon that is influenced by various large-scale phenomena, like El Niño, La Niña, IOD, etc. [15,16,17,18,19]. The study of the impact of such large-scale processes on the ISM variability is very important for better understanding of the role of large-scale processes in monsoon variability. This understanding is critical to improve the predictability of ISM using numerical models like the General Circulation Model (GCM). Several recent research efforts are focused on multi-scale modelling of monsoons and their associated processes using numerical weather models, GCM [20,21,22,23,24], and coupled atmosphere-land-ocean models [25,26,27,28]. It is known that monsoons exhibit variability even on inter-decadal time scales in association with many other global climate variables.
Understanding monsoon rainfall at multiple scales and advanced prediction of southwest monsoons are crucial for India. It is also important to know the inter-relationship between monsoons and large-scale ocean-atmospheric processes. Now-a-days, with the improvement in the computation power and dynamical modelling capabilities, the prediction of weather and climate at various time scales, from daily to decadal, is possible using general circulation models (GCMs), and meso-scale models.
Generally, rainfall variability is considered over the country as a whole in several studies [21,22,26], but it is very important to study and quantify the rainfall variability at regional (state) and sub-regional scales of a state, so that the application of rainfall studies will be useful. This work mainly focuses on the comparative study of monsoon variability between the regional (India) and sub-regional (Odisha). Additionally, the sub-region scales, like North, South, Central, and Coastal Odisha are analysed and compared. Section 2 gives the details of the data used and methodology adopted for the study. Results and discussion are presented in Section 3, and Section 4 describes the conclusion of the study.
2. Materials and Methods
The analysis is carried out using high-resolution gridded daily rainfall data from the India Meteorological Department (IMD). The gridded daily rainfall data are based on observations from 6955 stations [29] with a minimum 90% data availability during the analysis period (1951–2013). The station rainfall data are projected onto a rectangular grid (0.25° × 0.25°) for each day for the period 1951–2013. The starting point of the grid is 6.5° N and 67.5° E.
Statistical analyses are carried out to understand the monsoon variability at the large scale (India), regional scale (Odisha), and sub-regional scale (zones of the Odisha state). The seasonal cycle, which is daily average (of N total years) rainfall over a domain, is calculated by the area average of total rainfall over the domain using the following formula:
where n is the year; i and j, respectively, represent the latitude and longitude of the domains; and im, and jm are the numbers of the latitude and longitude used in the domain.
Then, the inter-annual variability (IAV) is computed as the anomaly (departure from the mean) as given in the formula below:
where is the (N = 63 years) mean at location at a given time scale (daily, monthly and seasonal).
The normalized (to mean) anomaly is given by:
Finally, the area averaged anomaly is computed for the domain, and the respective IAV values are compared in the study.
For many applications, the rainfall category, in terms of excess or deficit from the normal rainfall can be a valuable input, for seasonal rainfall at the large scale, as well as the regional and sub-regional scales. Here, three rainfall categories, based on the normalized anomaly of season (JJAS) are considered following the method adopted in a previous study [22]. The categories are as follows:
The quantity used to assess the degree of variability over two domains is phase synchronization (PS), which is assigned a value 0 or 1 depending on whether the normalized anomaly over India has the same directional anomaly over Odisha.
By considering only those years with I(n) = 1, PS is computed by using the relation ; where p is number of years, where I(n) is 1 and N is the total number of years.
Additionally, correlation analysis between the rainfall pattern over India and Odisha is carried out and discussed in this study.
3. Results and Discussion
In the present study, a spatial analysis was carried out at a larger scale (India), regional scale (the Odisha state), and sub-regional scale (different zones of Odisha). For the regional scale analysis over the state, Odisha is divided into five zones based on physiographic regions, i.e., North (two districts), South (five district), Coastal (seven districts), Western (nine districts), and Central (seven districts) Odisha. The geographical location of Odisha in India is shown in Figure 1a. Table 1 shows the details of the districts in each region, and the spatial distribution of different zones of Odisha is shown in Figure 1a.
Since the topography of the region controls the rainfall tendency, it is very important to consider the topographical classification over the state. The variation of monsoon rainfall intensity and its distribution over the state of Odisha are the result of the scale interaction of the monsoon flow and the regional disturbances due to orographic variability of the Eastern Ghats in Odisha. The topographic distribution of Odisha is shown in Figure 1b. The elevation rises as low as 5 m from the coastal region to as high as 1600 m above mean sea level.
The spatial average (1951–2013) of monsoon rainfall (JJAS) over the Odisha State, as a whole, is presented in Figure 1c, which shows Central and Coastal Odisha generally receive copious rainfall compared to the rest of the state. The standard deviation (in 63 years) of the seasonal monsoon rainfall is about 2.42 mm/day over the state.
3.1. Intraseasonal Monsoon Variability
The seasonal cycle (63 year daily climatology) of daily rainfall is analysed for both India and Odisha and is shown in Figure 2a, indicating a strong correlation with a correlation co-efficient (CC) of 0.86. A trend of intense rainfall can be observed during July–August when the rainfall is more than 12 (9) mm/day averaged over Odisha (India). During September, Odisha shows maximum average rainfall as compared to India. The climatological daily rainfall in September is comparatively high over Odisha and its sub-region compared with India with the daily maximum rain received over Odisha (India) being about 11.5 mm/day (6.9 mm/day), whereas in the sub-regions of Odisha, the maximum daily rainfall is about 11–14.3 mm/day. This is apparently due to several factors, like highly variable topography and diurnal land-sea breeze circulation.
The seasonal climatology of monsoon rainfall in different zones of Odisha (sub-regional scale) shows wide variation from one zone to other (Figure 2b). Western Odisha receives more rain in the first half of the monsoon compared to other sub-regions, whereas the second-half of this region receives relatively less rainfall, and Western Odisha often faces drought. The standard deviation (SD) in the daily climatology for 121 days is about 2.42 mm/day at the state scale, whereas it is higher in Western Odisha (3.07 mm/day) and lower in South Odisha (2.36 mm/day). Similarly, CC of the seasonal cycle over the zones and the state are computed, and it is observed that Western and Central Odisha have a high correlation, of about 0.95 and 0.92, whereas other zones shows 0.8 (North and Coastal Odisha) and 0.9 (South Odisha). The comparisons of annual and monsoon rainfall over India and Odisha during 1951–2013 are shown in Figure S1, which shows a CC of about 0.2 at both annual and seasonal scales.
To identify the sub-regional scale monsoon rainfall over Odisha, a climatological analysis assessing the seasonal average, daily average, and the number of rainy days in the monsoon season over different regions of Odisha is carried out, and the results are presented in Table 2. It is observed that the number of days with significantly high rainfall (>12 mm) is very high over Western Odisha, but the number of rainy days is low in this region, as compared to others. Even though Western Odisha receives the highest seasonal average rainfall (9.89 mm/day), it usually faces drought-like situations due to fewer rainy days (around 37 out of 121) during the monsoon season. These findings need to be investigated further, considering the impact of topography and wind circulation patterns on the local monsoonal flow.
3.2. Inter-Annual Monsoon Variability
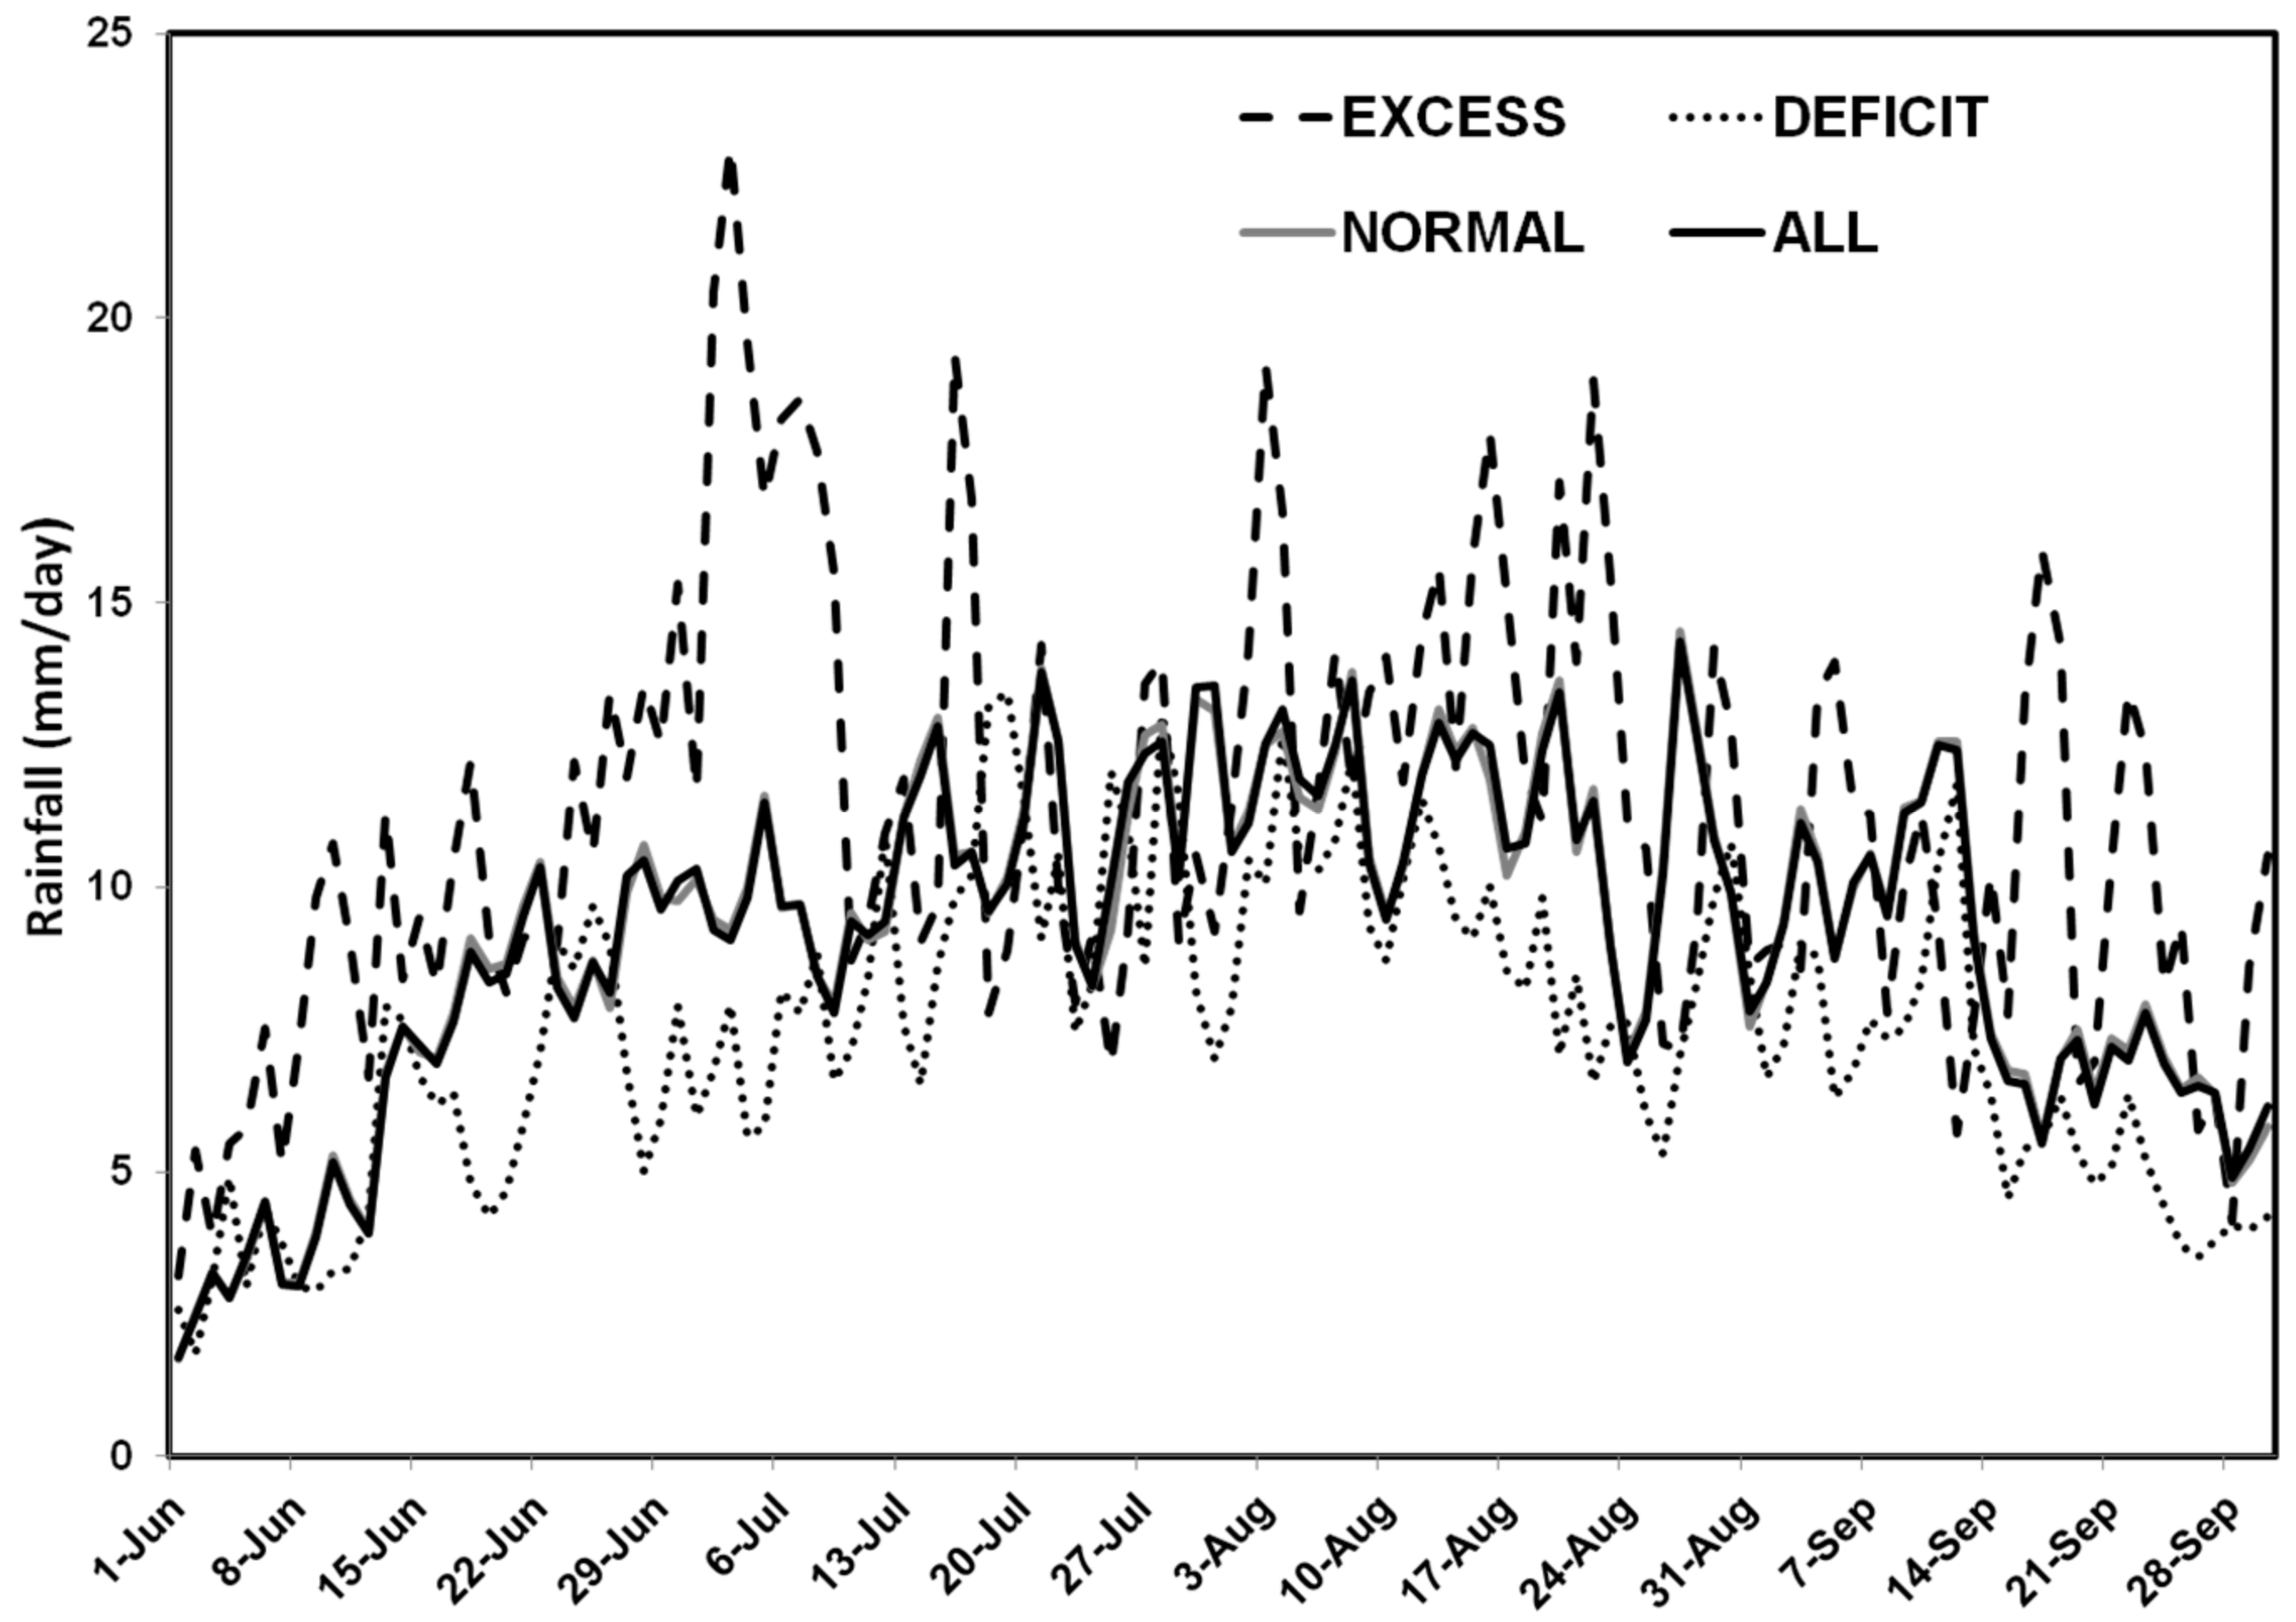
Interannual variability of monsoon rainfall is also computed for the period 1951–2013, and it is seen that the phase synchronization of IAV over Odisha and India is 63% among 63 years of variability. The CC of IAV is about 0.43, which is more significant (Figure 3a). Similarly, analyses over sub-regional zones of Odisha are presented in Figure 3b, and it is observed that, for Western Odisha, the variability is very high. Based on the IAV in the monsoon rainfall over all years, the different years are categorized into excess, deficit, and normal monsoon years for Odisha. The daily rainfall climatology for the period 1 June to 30 September composited over excess (10 years), deficit (17 years), normal (36 years), and all 63 years in the state is presented in Figure 4. It is inferred that, generally, the July rainfall is greater in excess years and August rainfall is lower in deficit years. The clear indication of the monsoon season rainfall (excess or deficit) is totally dependent on the July rainfall over the state. The role of rainfall in August can also be used as an indicator for the crop choices, in particular for the drought years.
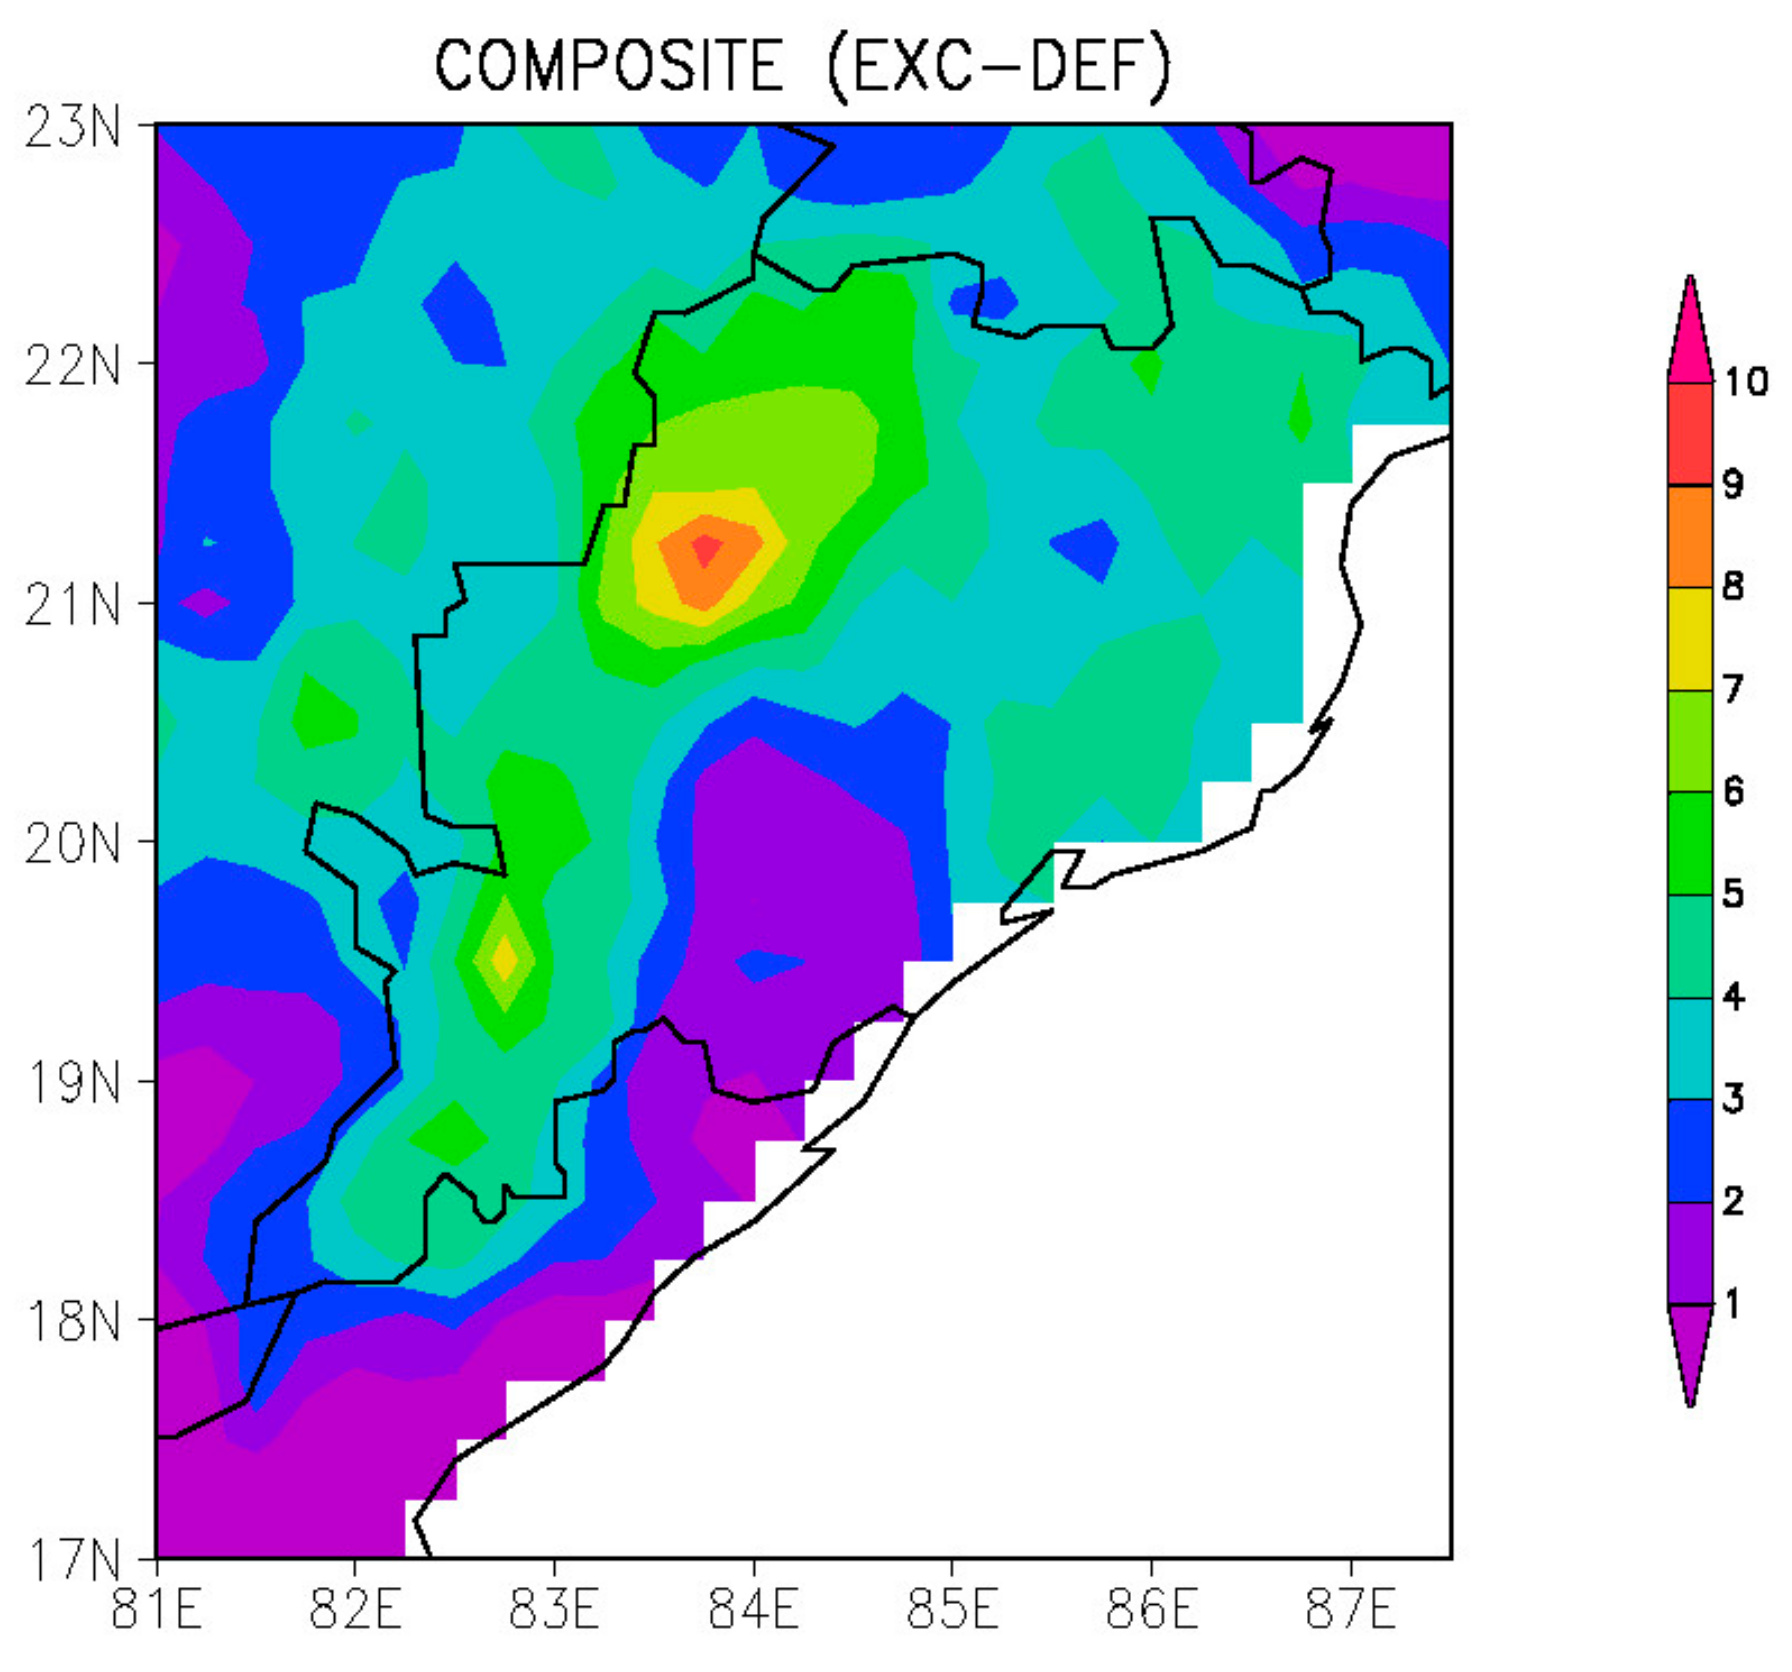
The monsoon composites are computed, and the seasonal rainfall climatology composites over the excess monsoon (10 years) and deficit monsoon (17 years) season are shown in Figure 5. It is observed from the spatial analysis that the rainfall amount is greater (about 18 mm/day) over the western part in the composite excess year, and the rainfall amount is moderate in the central and eastern part (about 8–10 mm/day). Rainfall drops to as low as 6 mm/day throughout the state with the minimum in the central and eastern parts of Odisha in the deficit monsoon years. The contrast in the rainfall climatology in excess and deficit years is also presented in the lower panel; the contrast between excess and deficit monsoon years is very high (about 9 mm/day) in the western region and low (about 1 mm/day) in the southeastern region of Odisha.
3.3. Circulation Pattern
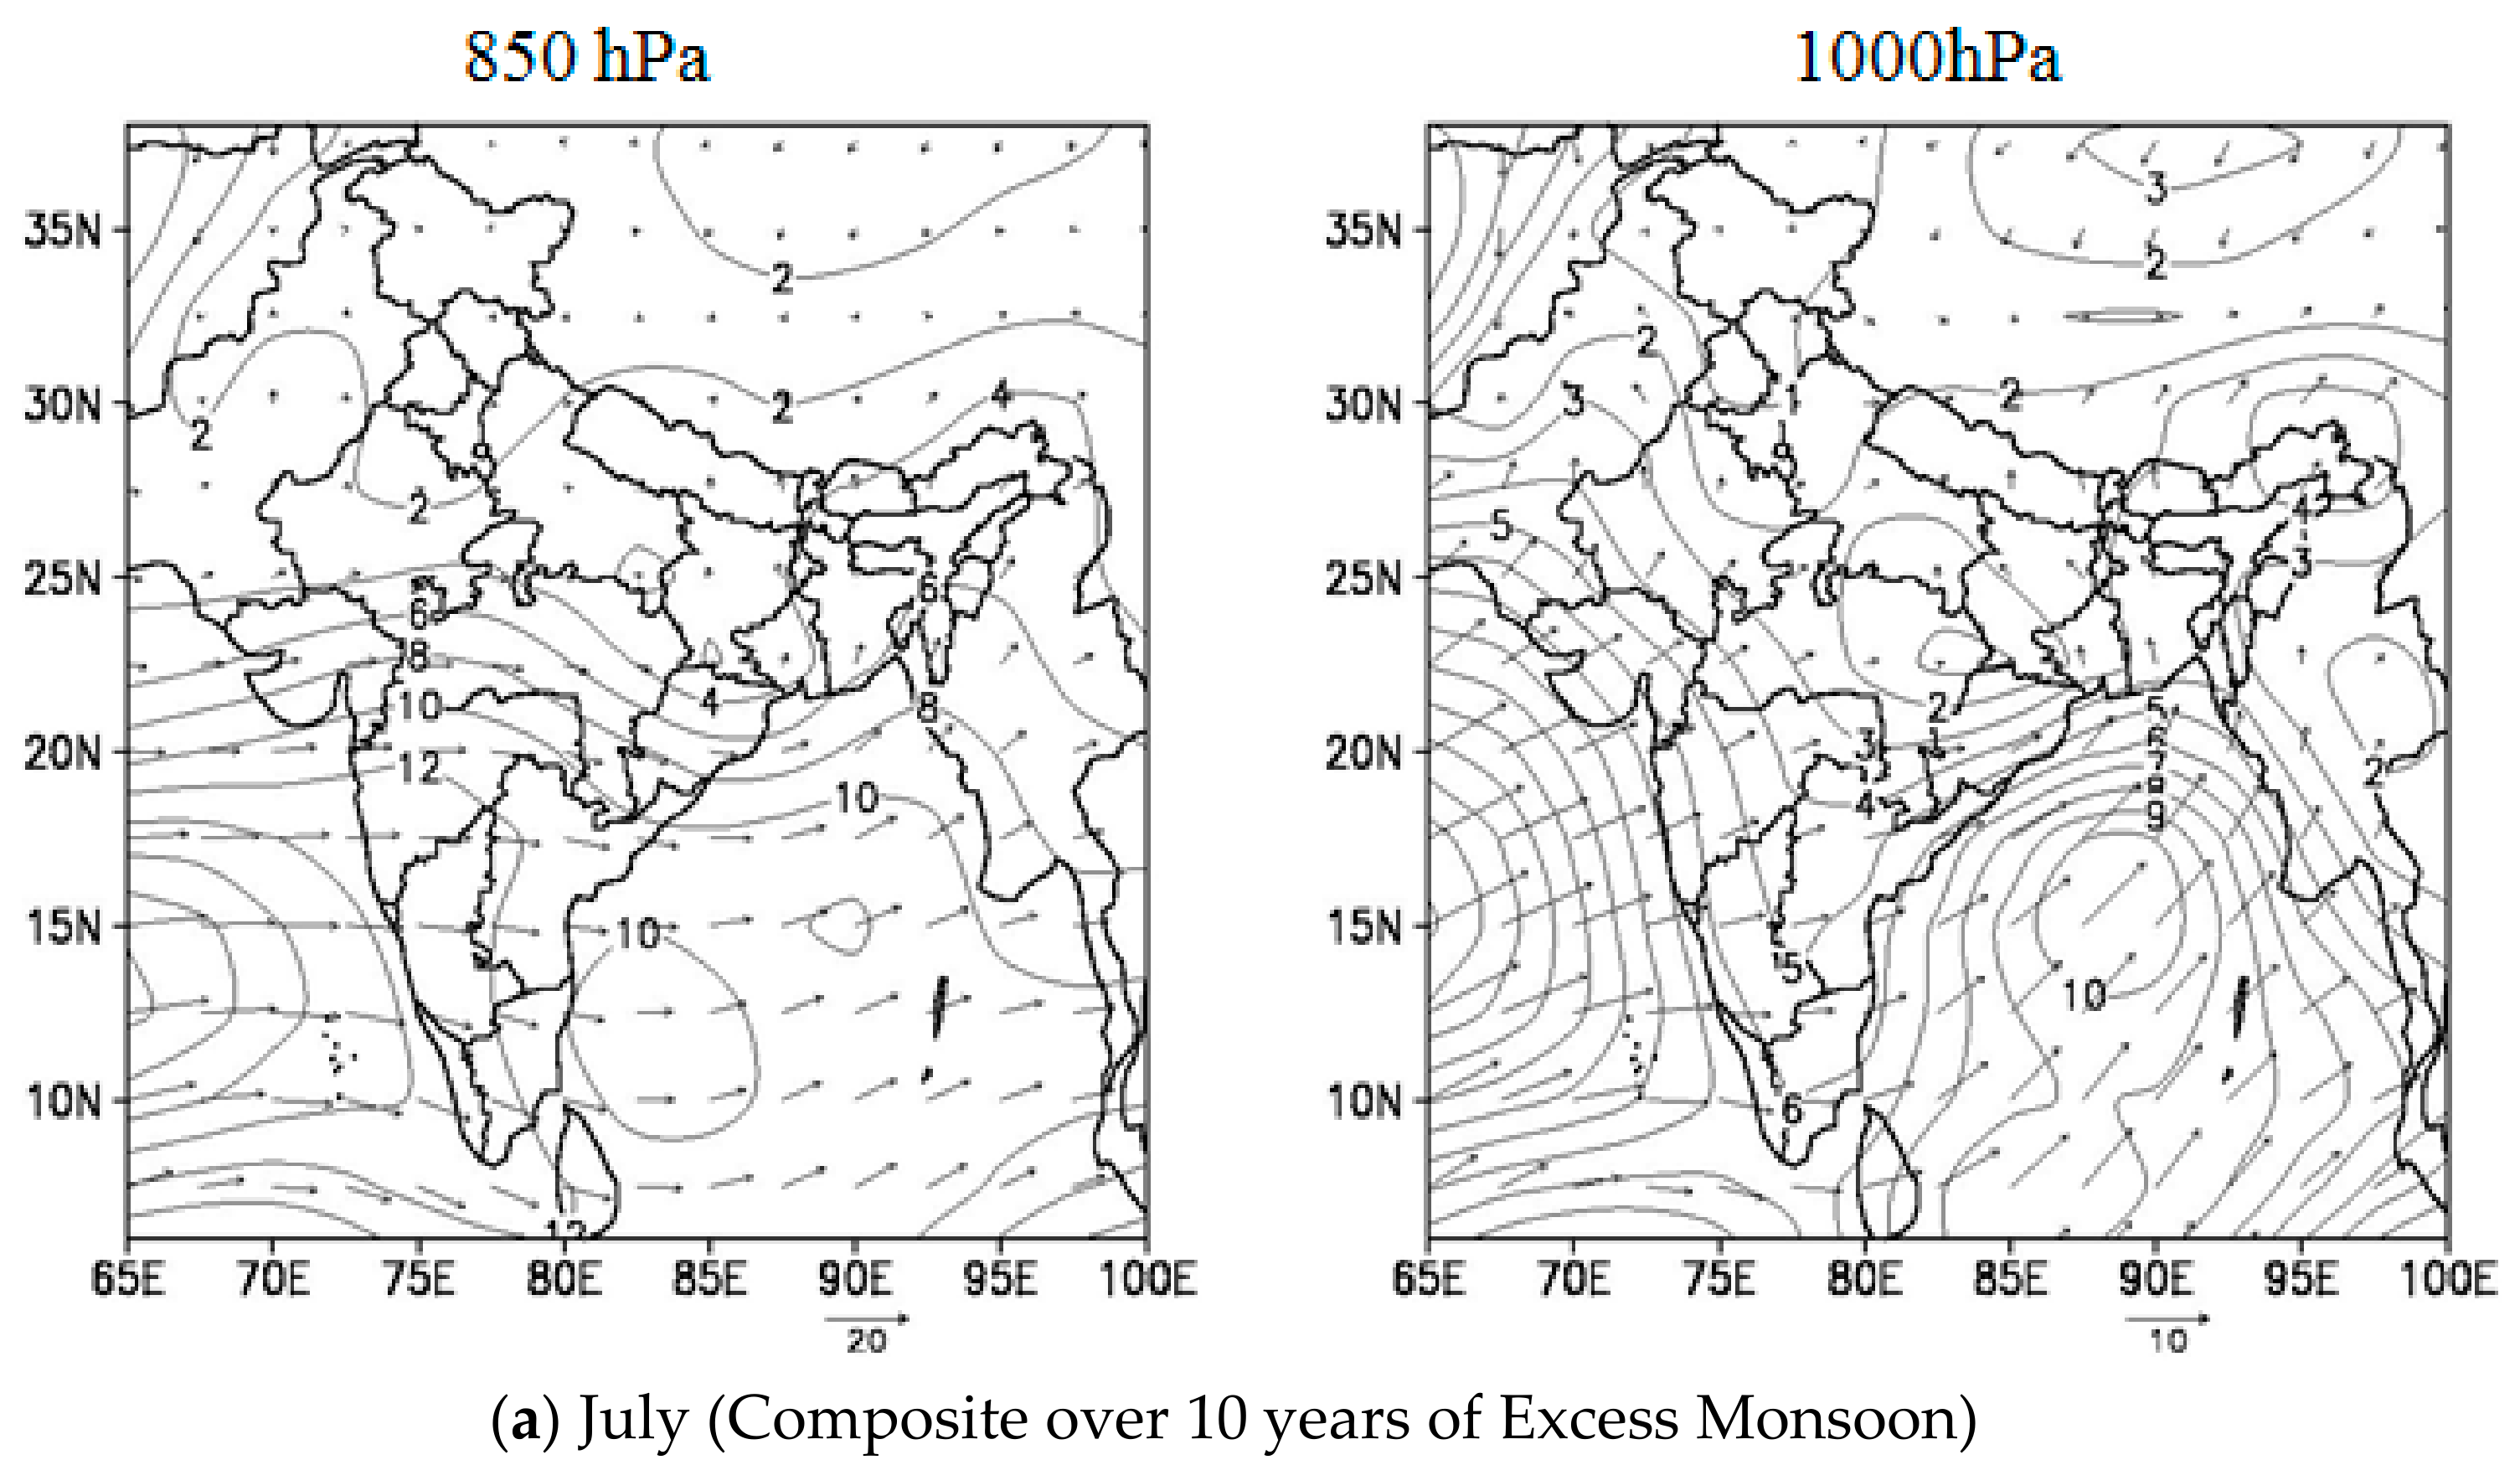
Circulation and moisture processes associated with the monsoon are very important to understand the variability and dynamics. Analysis of wind circulation (Figure 6) and moisture or humidity (Figure 7) at two levels, i.e., 1000 hPa and 850 hPa, is carried out using NCEP Reanalysis [30] for the month of July (August), by taking the composite over excess (deficit) years. It is generally observed that the variability in the synoptic disturbances, which develop over the Bay of Bengal, results in high interannual variability of wind. The strong tropospheric Westerlies during July (excess years) are very much responsible for the excess rainfall over the state. Over the deficit years, very low intensity winds result in the low rainfalls over the state of Odisha.
3.4. Impact of Global Phenomena on Monsoon Variability
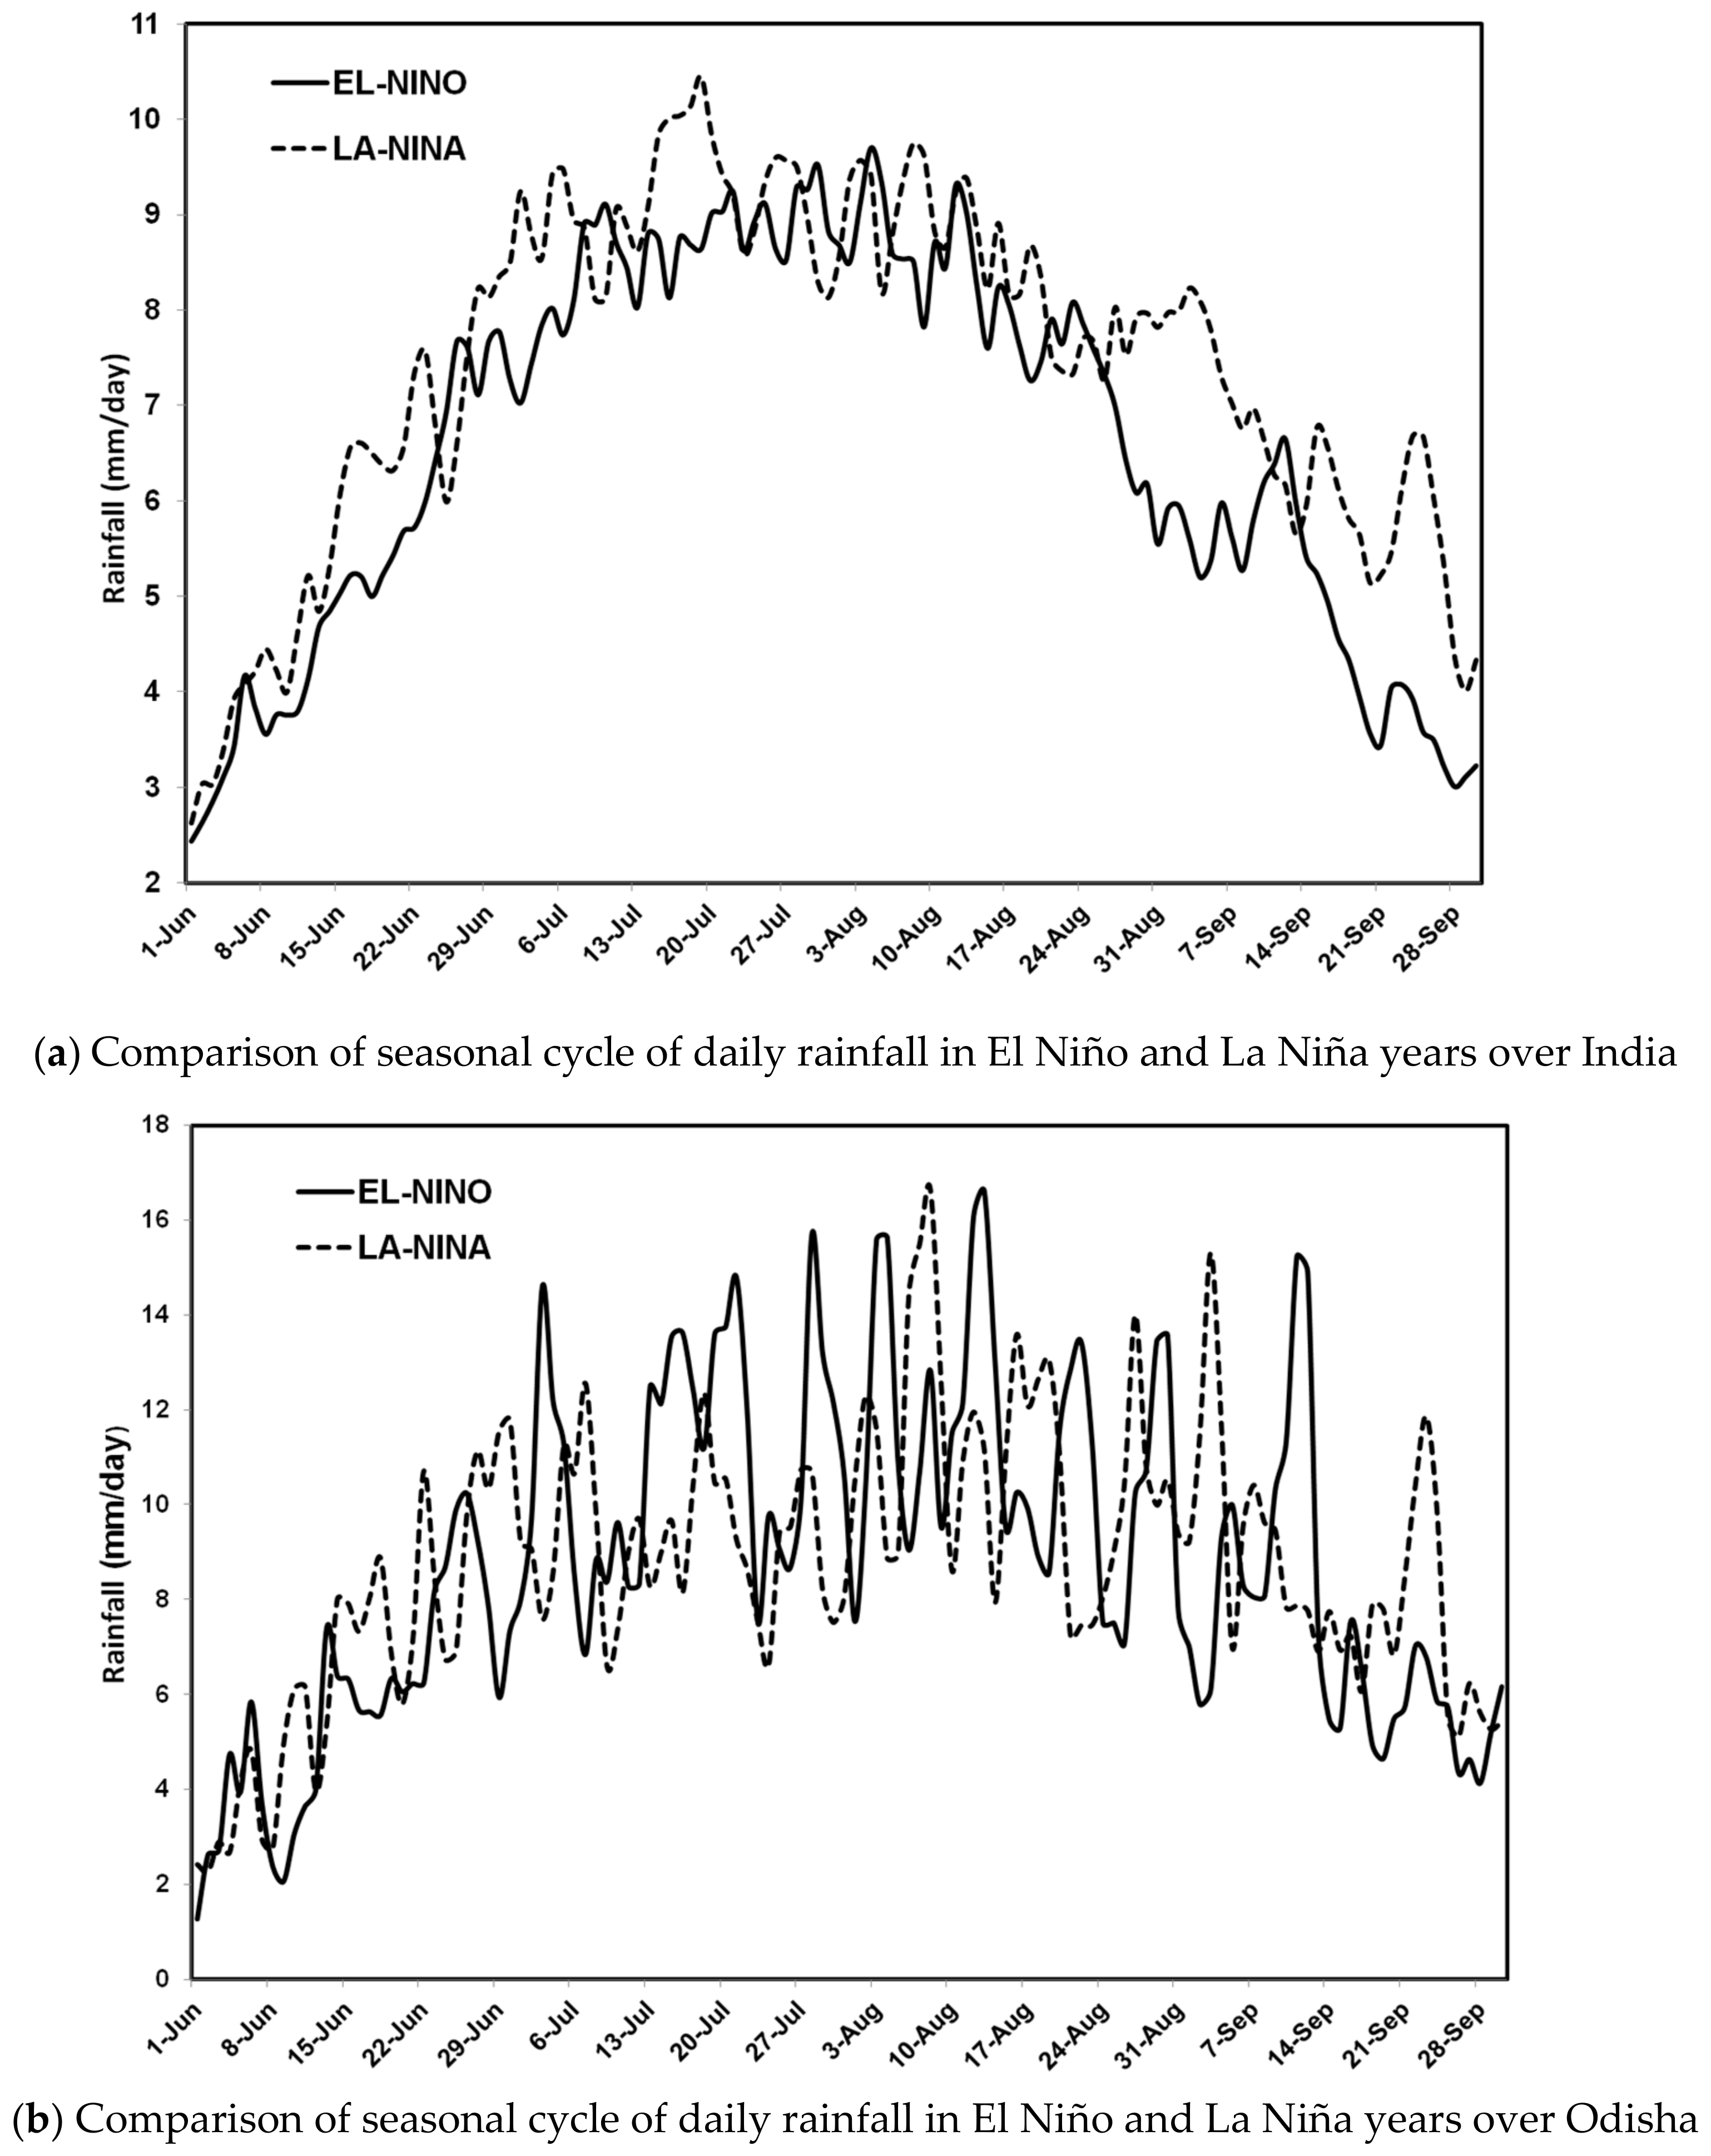
The role of large-scale mechanisms, like El Niño and La Niña, can be understood as quantifying the teleconnection of these mechanisms to the ISM rainfall over the Indian subcontinent, as well as over states like Odisha. Some earlier studies showed a close association between deficit monsoon rainfall and El Niño [15,16,17,18,19], whereas other studies showed a link between El Niño and the weakened monsoons in the last decade and, in fact, the ISMR anomaly was positive in the recent intense warm event of 1997 [20]. In order to quantify the role of large-scale processes like El Niño and La Niña on the monsoon rainfall over India and Odisha, the seasonal rainfall climatology is analysed and shown in Figure 8. The years considered for the composite analysis of the El Niño and La Niña years presented in Table 3 are retrieved from www.ggweather.com/enso/oni.htm.
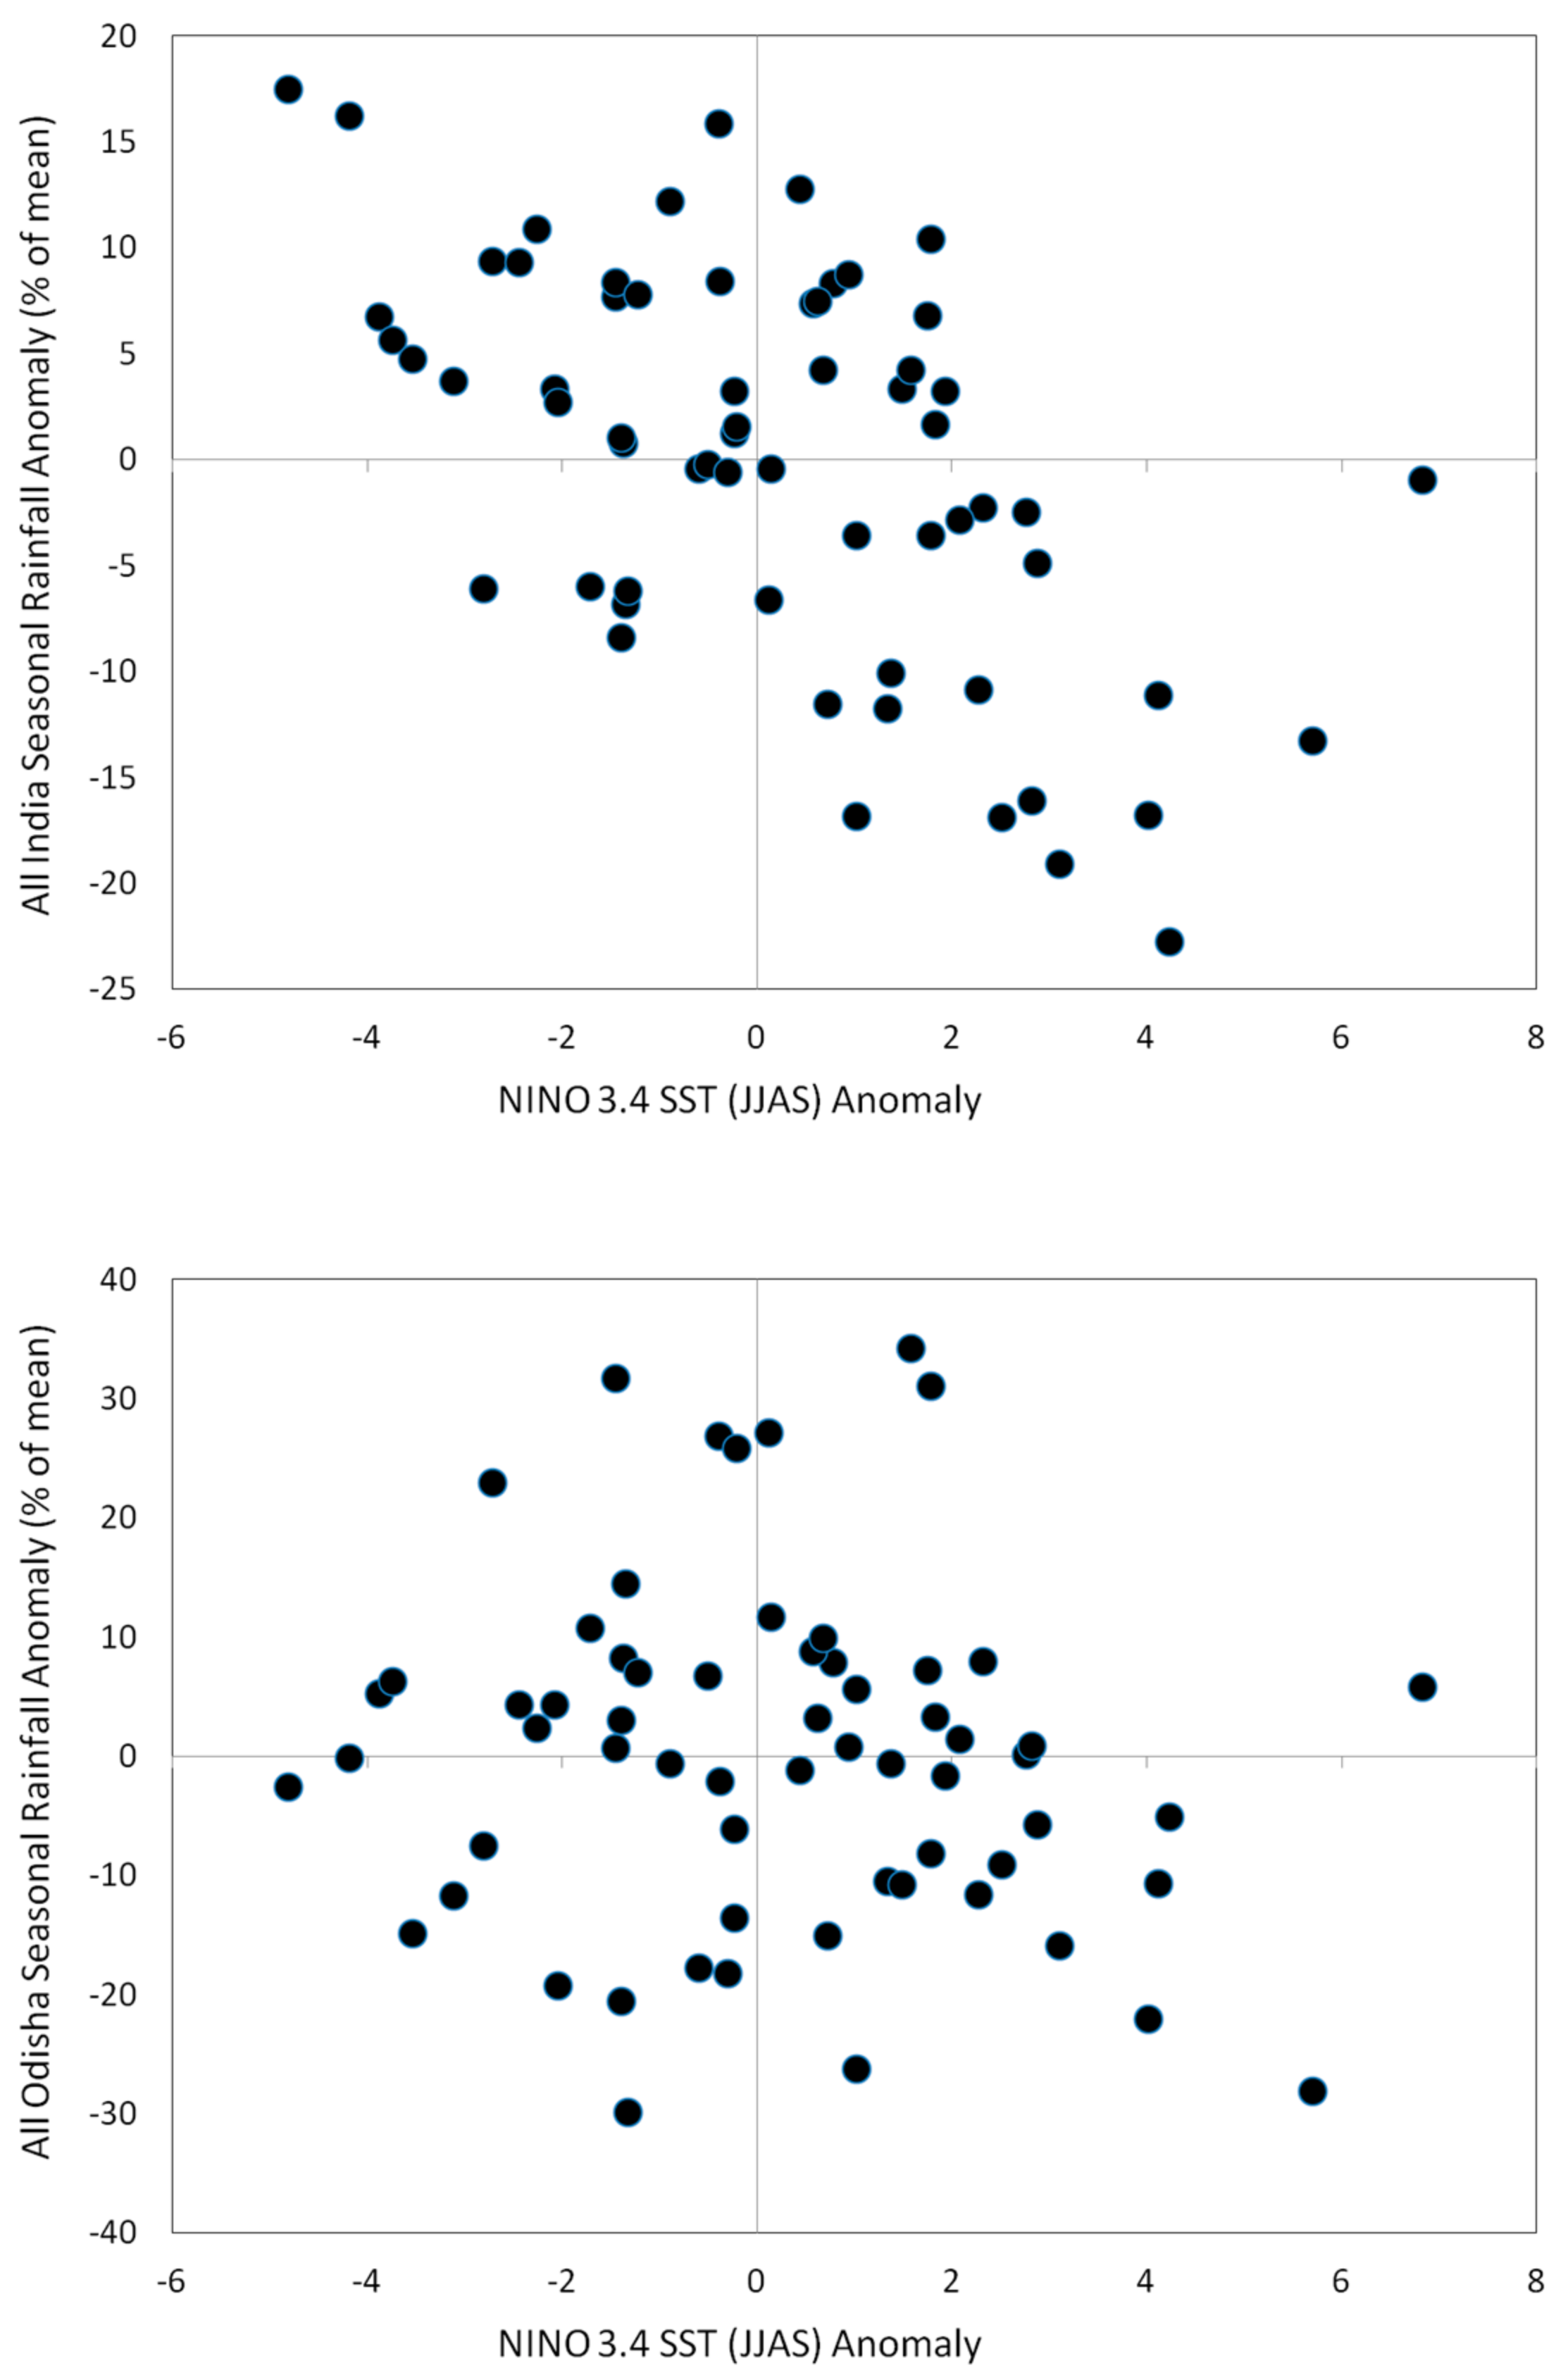
In order to find a relationship with global phenomena like ENSO, here we compared the seasonal (JJAS) rainfall, with the corresponding Niño-3.4 SST anomaly [31]. Figure 9 shows the scatterplot distribution of the seasonal (JJAS) Niño-3.4 anomaly, and the rainfall anomaly over India (top panel) and Odisha (bottom panel). The analysis shows that variations in Niño-3.4 explain about 40% and 37% of the variations of monsoon rainfall over Odisha and India, repectively.
The difference in rainfall in El Niño and La Niña years is found to be a maximum at the larger scale (India) as compared to the regional scale (Odisha). The SD of the rainfall in 121 days is about 3 mm (6 mm) for El Niño years over India (Odisha) and about 2 mm (6mm) for La Niña years over India (Odisha), indicating a higher variability in the rainfall during both El Niño and La Niña years at the state scale. Some studies also emphasized the impact of the Indian Ocean Dipole (IOD) mechanism on the ISM and ENSO [32,33]. In this work, the impact of IOD on the monsoon rainfall over India and Odisha is analysed and presented in Figure 10. It is clearly shown that there is no significant impact observed in the seasonal cycle, both in positive or negative IOD years, and either over India or Odisha. The phase synchronization between the monsoon rainfall at sub-regional zones (like Central Odisha, North Odisha, etc.) in the state of Odisha and the rainfall over regional (Odisha), as well as the larger (India) scale for the study period of 63 years is presented in Table 4. Here, if the sign of the interannual variability, i.e., the normalized anomaly in the smaller domains and larger domains (Odisha or India) are the same, then the phase is considered as synchronized. It is observed from the analysis (Table 4) that Western and Central Odisha domains have high percentages of phase with Odisha rainfall (89%). South Odisha, Western Odisha, and Central Odisha show high percentages of phase with all-India monsoon rainfall. Similarly, the correlation of monsoon rainfall over Western and Central Odisha is very strong with the monsoon rainfall over the larger domain. It is found that even if there is less impact of an ENSO on the interannual variability of total monsoon rainfall averaged over India, there is still a direct impact on the smaller regions like Western and Central Odisha. Similarly, there is hardly any impact of IOD on the monsoon rainfall intensity over Odisha.
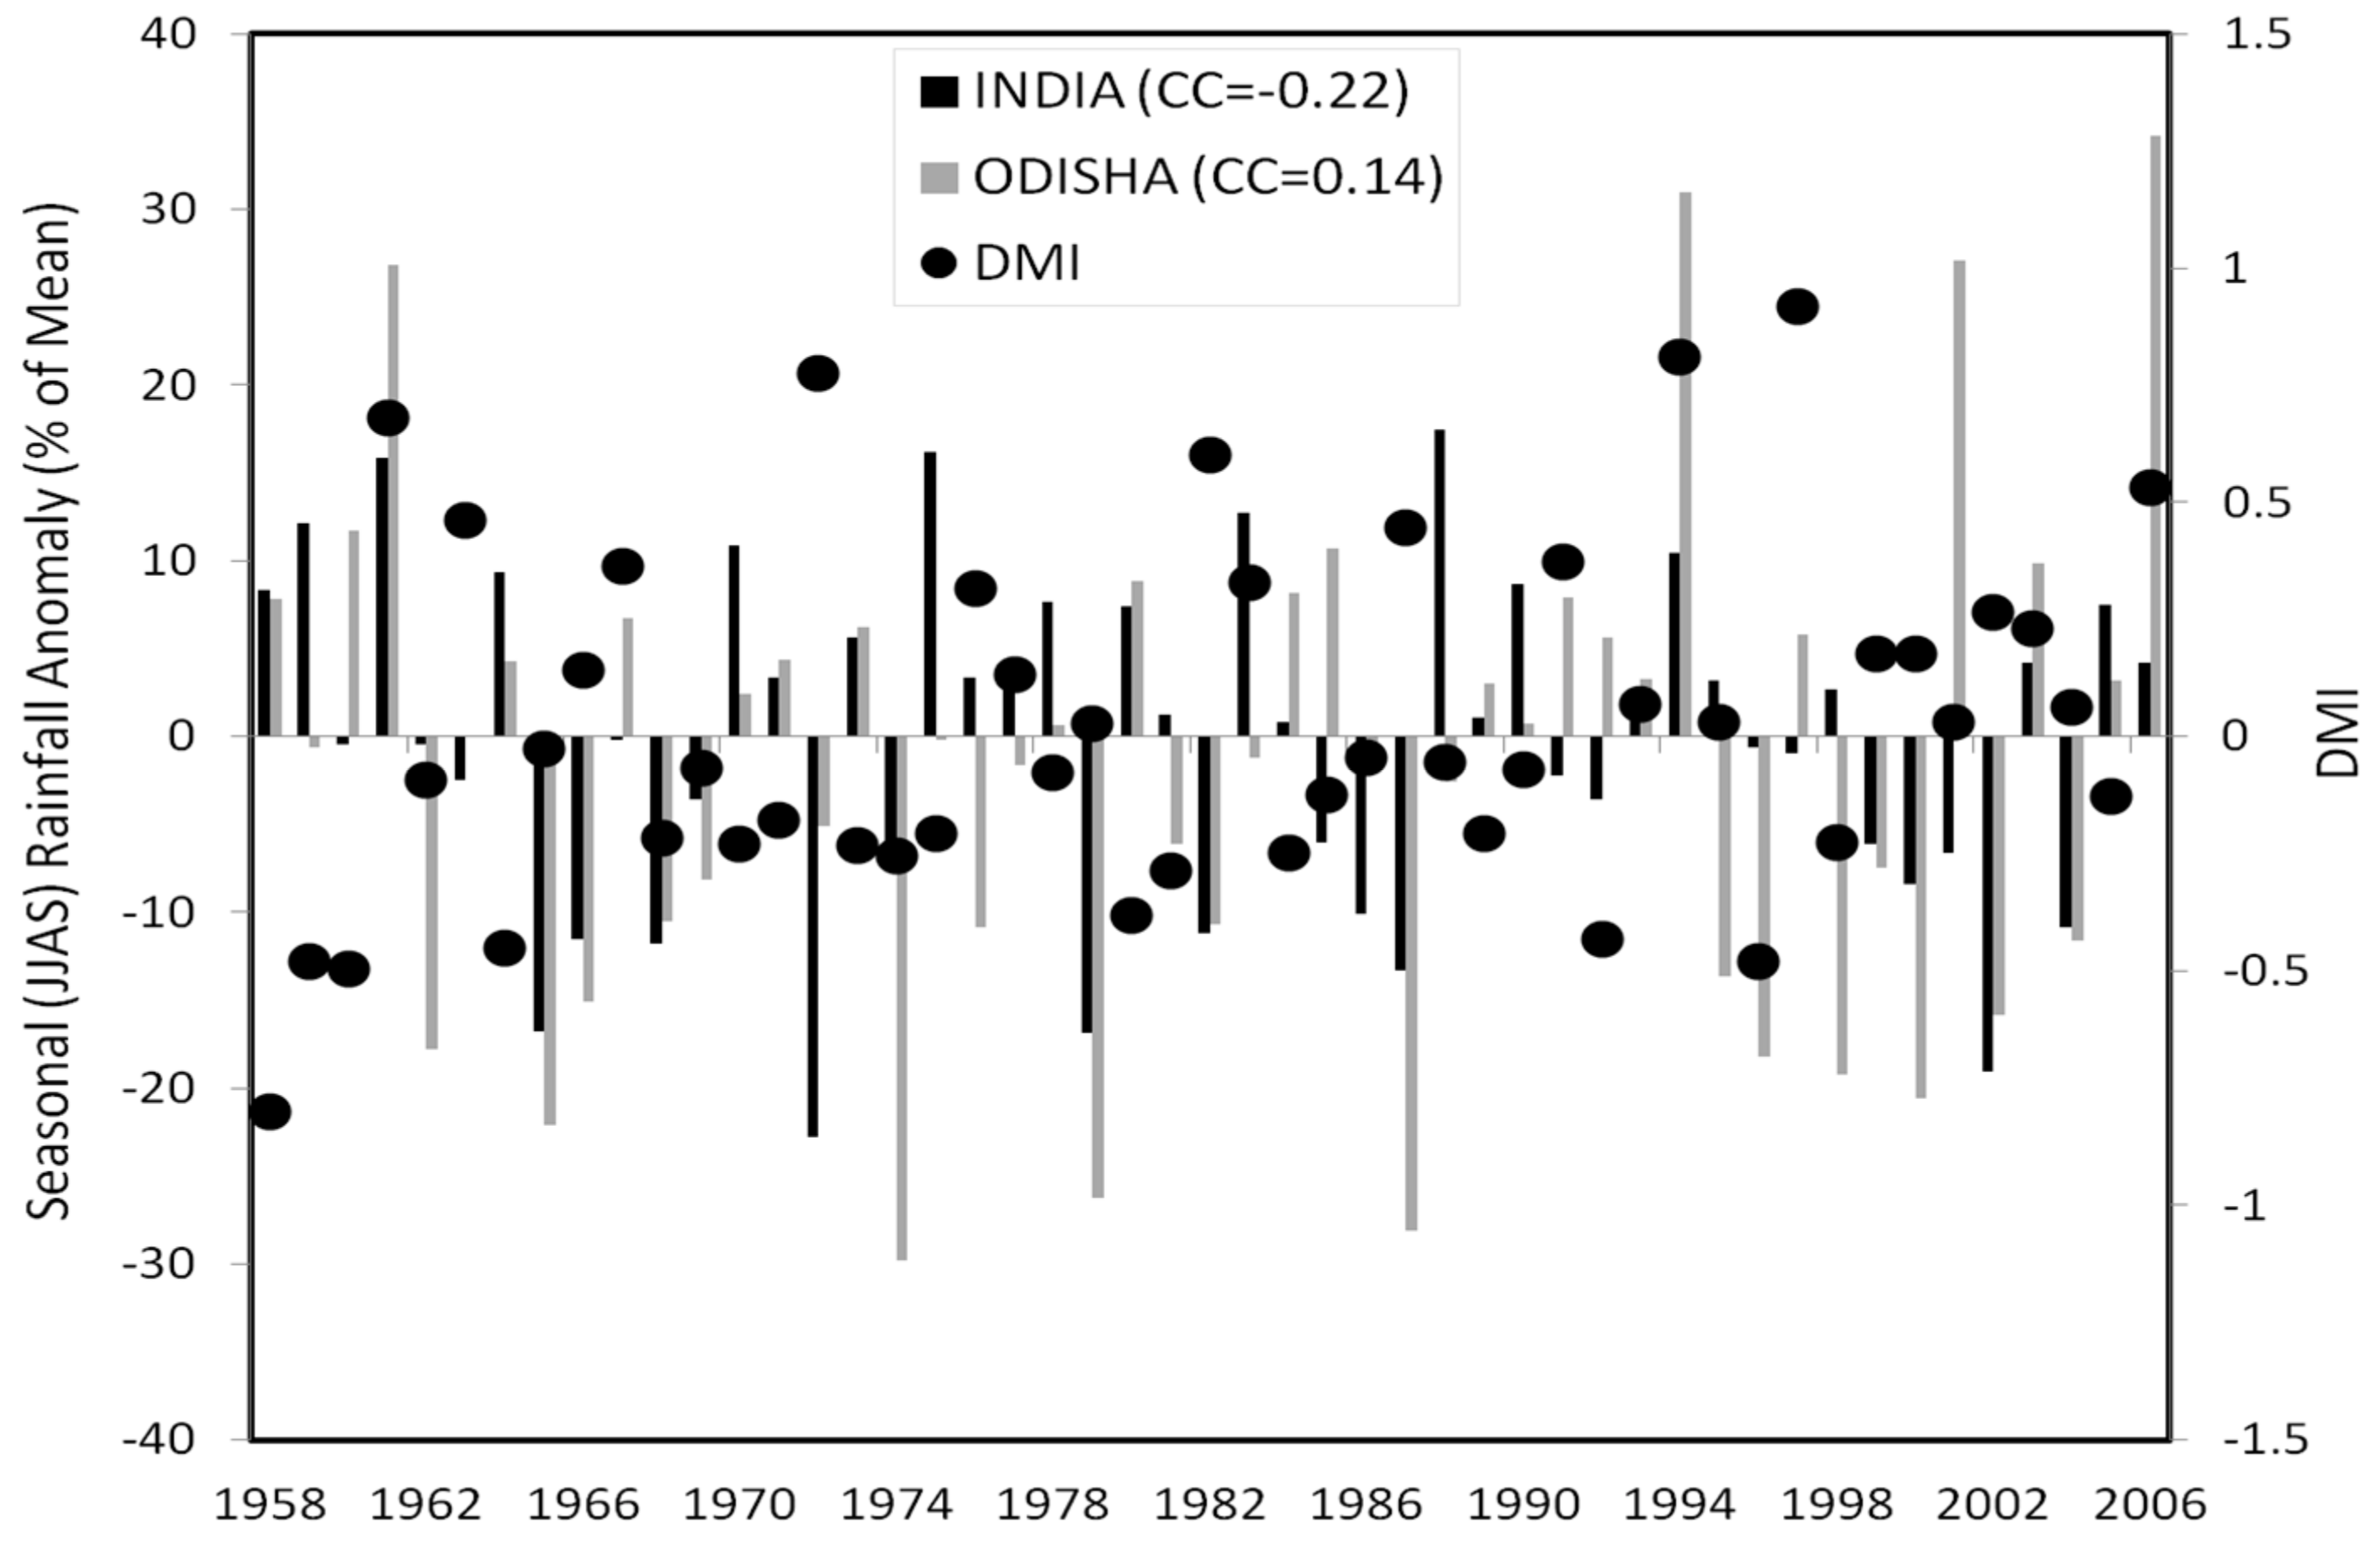
It is also important to find the relationship between the Dipole Mode Index (DMI) and the seasonal rainfall variability at the large scale (India) and regional scale (Odisha) to quantify the signature of the impact of IOD on the variation of seasonal rainfall at multiple spatial scales. The IOD is generally represented by DMI, which presents the anomalous SST gradient between the western equatorial Indian Ocean (50° E–70° E and 10° S–10° N) and the south-eastern equatorial Indian Ocean (90° E–110° E and 10° S–0° N) [34]. Figure 11 shows the comparison of the interannual variability of seasonal (JJAS) rainfall over India (black bars) and Odisha (shaded bars) in the principal y-axis along with the JJAS DMI calculated using the IOD SST presented on the secondary y-axis for the period 1958–2006, which shows that there is a positive (negative) relation of the DMI with the Odisha (India) seasonal rainfall.
4. Conclusions
The attempt at comparing the seasonality and the IAV of monsoon rainfall at a larger (India) and regional (Odisha) domain is carried out and presented here. It is observed from the present study that there is no linear or simple relation in the monsoon variability over both the scales as expected. It is also seen that there is no synchronization in the seasonal monsoon category (normal/excess/deficit) when analysed over India and Odisha. Similarly, within Odisha (different zones), there is also wide variation in the rainfall from zone to zone i.e., South Odisha shows much more variability in the rainfall distribution than the north or coastal part of Odisha. Western Odisha receives more rainfall compared to south and coastal Odisha during the monsoon, but this part of Odisha usually faces drought because of the high temperature and low humidity. The correlation of daily rainfall climatology of 63 year period during monsoon over Odisha and India is very strong (0.8), whereas the correlation between IAV and the seasonal rainfall, as a whole, is 0.45 (99% significant) and the phase synchronization of India and Odisha monsoon is about 70% (out of 63 years). The impact of large-scale atmospheric processes like El Niño, La Niña, and IOD, etc., compared with the monsoon rainfall at both India and Odisha scales, and it is quantified that the impact is much higher for India, but it has no such relation with the Odisha rainfall. The comparative analysis of the variations in Niño-3.4 explains about 40% and 37% of the variations of monsoon rainfall over Odisha and India. These results also infer the same conclusion as drawn by previous studies [19,35,36]. The phase synchronization and correlation analysis of the monsoon rainfall averaged over sub-regions in the state of Odisha with the monsoon rainfall over regional and larger scales, i.e., Odisha and India, are variable. Western, central, and southern regions of Odisha show strong correlation and are in phase with the interannual variability of monsoon rainfall. It is also observed that there is a positive (negative) relation of the DMI (which represents the IOD) with the seasonal monsoon rainfall variability over Odisha (India). This information is critical to seasonal monsoon prediction models for reliable prediction of the seasonal monsoon cycle and category forecast, both at India and Odisha scales.
Supplementary Materials
The following are available online at www.mdpi.com/2225-1154/5/4/79/s1; Figure S1: Relationship of (a) annual and (b) monsoon rainfall over India and Odisha.
Acknowledgments
This work is supported by the projects funded by Department of Science and Technology (Grant No. SB/S4/AS-120/2013 and SERB/F/0008/2014-15), Government of India.
Author Contributions
Krushna Chandra Gouda and Himesh Shivappa conceived and designed the experiments; Sanjeeb Kumar Sahoo and Payoshni Samantray performed the experiments; Krushna Chandra Gouda, Sanjeeb Kumar Sahoo and Payoshni Samantray analyzed the data; and Krushna Chandra Gouda and Himesh Shivappa wrote the paper.
Conflicts of Interest
The authors declare no conflict of interest.
References
- Rakhecha, P.R.; Mandal, B.N. The Use of Empirical Orthogonal Functions for Rainfall Estimates (Rajasthan); Cambridge University Press: Cambridge, UK, 1981. [Google Scholar]
- Hastenrath, S.; Rosen, A. Patterns of India monsoon rainfall anomalies. Tellus A Dyn. Meteorol. Oceanogr. 1983, 35, 324–331. [Google Scholar] [CrossRef]
- Rasmusson, E.M.; Carpenter, T.H. The relationship between eastern equatorial Pacific sea surface temperatures and rainfall over India and Sri Lanka. Mon. Weather Rev. 1983, 111, 517–528. [Google Scholar] [CrossRef]
- Prasad, K.D.; Singh, S.V. Large scale features of Indian summer monsoon rainfall and their association with some oceanic and atmospheric variables. Adv. Atmos. Sci. 1988, 5, 499–513. [Google Scholar] [CrossRef]
- Kripalani, R.H.; Singh, S.V.; Arkin, P.A. Large scale features of rainfall and outgoing long wave radiation over India and adjoining regions. Contrib. Atmos. Phys. 1991, 64, 159–168. [Google Scholar]
- Parthasarathy, B.; Munot, A.A.; Kothawale, D.R. All-India monthly and seasonal rainfall series: 1871–1993. Theor. Appl. Climatol. 1994, 49, 217–224. [Google Scholar] [CrossRef]
- Majumdar, A.B. Southwest monsoon rainfall in India: Part-1: Spatial variability. Mausam 1998, 49, 71–78. [Google Scholar]
- Mohanty, U.C.; Mohapatra, M. Prediction of occurrence and quantity of daily summer monsoon precipitation over Orissa (India). Meteorol. Appl. 2007, 14, 95–103. [Google Scholar] [CrossRef]
- Wang, B.; Lee, J.Y.; Xiang, B. Asian summer monsoon rainfall predictability: A predictable mode analysis. Clim. Dyn. 2015, 44, 61–74. [Google Scholar] [CrossRef]
- Goswami, B.N.; Krishnamurthy, V.; Annmalai, H. A broad-scale circulation index for the interannual variability of the Indian summer monsoon. Q. J. R. Meteorol. Soc. 1999, 125, 611–633. [Google Scholar] [CrossRef]
- Gadgil, S. The Indian monsoon and its variability. Annu. Rev. Earth Planet. Sci. 2003, 31, 429–467. [Google Scholar] [CrossRef]
- Rajeevan, M.; Pai, D.S.; Kumar, R.A.; Lal, B. New statistical models for long-range forecasting of southwest monsoon rainfall over India. Clim. Dyn. 2007, 28, 813–828. [Google Scholar] [CrossRef]
- Patra, J.P.; Mishra, A.; Singh, R.; Raghuwanshi, N.S. Detecting rainfall trends in twentieth century (1871–2006) over Orissa State, India. Clim. Chang. 2012, 111, 801–817. [Google Scholar] [CrossRef]
- Mohapatra, M.; Mohanty, U.C. Some characteristics of low pressure systems and summer monsoon rainfall over Orissa. Curr. Sci. 2004, 87, 1245–1255. [Google Scholar]
- Sikka, D.R. Some aspects of the large scale fluctuations of summer monsoon rainfall over India in relation to fluctuations in the planetary and regional scale circulation parameters. Proc. Indian Acad. Sci. Earth Planet. Sci. 1980, 89, 179–195. [Google Scholar] [CrossRef]
- Pant, G.B.; Parthasarathy, S.B. Some aspects of an association between the southern oscillation and Indian summer monsoon. Arch. Meteorol. Geophys. Bioclimatol. Ser. B 1981, 29, 245–252. [Google Scholar] [CrossRef]
- Webster, P.J.; Yang, S. Monsoon and ENSO: Selectively interactive systems. Q. J. R. Meteorol. Soc. 1992, 118, 877–926. [Google Scholar] [CrossRef]
- Ju, J.; Slingo, J. The Asian summer monsoon and ENSO. Q. J. R. Meteorol. Soc. 1995, 121, 1133–1168. [Google Scholar] [CrossRef]
- Krishnamurthy, V.; Goswami, B.N. Indian monsoon–ENSO relationship on interdecadal timescale. J. Clim. 2000, 13, 579–595. [Google Scholar] [CrossRef]
- Sperber, K.R.; Palmer, T.N. Interannual tropical rainfall variability in general circulation model simulations associated with the Atmospheric Model Intercomparison Project. J. Clim. 1996, 9, 2727–2750. [Google Scholar] [CrossRef]
- Goswami, B.N. Interannual variations of Indian summer monsoon in a GCM: External conditions versus internal feedbacks. J. Clim. 1998, 11, 501–522. [Google Scholar] [CrossRef]
- Goswami, P.; Gouda, K.C. Comparative evaluation of two ensembles for long-range forecasting of monsoon rainfall. Mon. Weather Rev. 2009, 137, 2893–2907. [Google Scholar] [CrossRef]
- Goswami, P.; Gouda, K.C. Evaluation of a dynamical basis for advance forecasting of the date of onset of monsoon rainfall over India. Mon. Weather Rev. 2010, 138, 3120–3141. [Google Scholar] [CrossRef]
- Ghosh, S.; Mujumdar, P.P. Future rainfall scenario over Orissa with GCM projections by statistical downscaling. Curr. Sci. 2006, 90, 396–404. [Google Scholar]
- Webster, P.J.; Moore, A.M.; Loschnigg, J.P.; Leben, R.R. Coupled ocean–atmosphere dynamics in the Indian Ocean during 1997–98. Nature 1999, 401, 356–360. [Google Scholar] [CrossRef] [PubMed]
- Kang, I.S.; Jin, K.; Wang, B.; Lau, K.M.; Shukla, J.; Krishnamurthy, V.; Schubert, S.; Wailser, D.; Stern, W.; Kitoh, A.; et al. Intercomparison of the climatological variations of Asian summer monsoon precipitation simulated by 10 GCMs. Clim. Dyn. 2002, 19, 383–395. [Google Scholar]
- Fu, X.; Wang, B. Differences of boreal summer intraseasonal oscillations simulated in an atmosphere–ocean coupled model and an atmosphere-only model. J. Clim. 2004, 17, 1263–1271. [Google Scholar] [CrossRef]
- Goswami, B.N. South Asian monsoon. In Intraseasonal Variability in the Atmosphere-Ocean Climate System; Lau, K., Waliser, D., Eds.; Springer: New York, NY, USA, 2005; pp. 19–61. [Google Scholar]
- Pai, D.S.; Latha, S.; Rajeevan, M.; Sreejith, O.P.; Satbhai, N.S.; Mukhopadhyay, B. Development of a new high spatial resolution (0.25° × 0.25°) long period (1901–2010) daily gridded rainfall data set over India and its comparison with existing data sets over the region. Mausam 2014, 65, 1–18. [Google Scholar]
- Kalnay, E.; Kanamitsu, M.; Kistler, R.; Collins, W.; Deaven, D.; Gandin, L.; Iredell, M.; Saha, S.; White, G.; Woollen, J.; et al. The NCEP/NCAR 40-year reanalysis project. Bull. Am. Meteorol. Soc. 1996, 77, 437–471. [Google Scholar] [CrossRef]
- Rayner, N.A.; Parker, D.E.; Horton, E.B.; Folland, C.K.; Alexander, L.V.; Rowell, D.P.; Kent, E.C.; Kaplan, A. Global analyses of sea surface temperature, sea ice, and night marine air temperature since the late nineteenth century. J. Geophys. Res. 2003, 108. [Google Scholar] [CrossRef] [Green Version]
- Saji, N.H.; Goswami, B.N.; Vinayachandran, P.N.; Yamagata, T. A dipole mode in the tropical Indian Ocean. Nature 1999, 401, 360–363. [Google Scholar] [CrossRef] [PubMed]
- Ashok, K.; Guan, Z.; Yamagata, T. Impact of the Indian Ocean dipole on the relationship between the Indian monsoon rainfall and ENSO. Geophys. Res. Lett. 2001, 28, 4499–4502. [Google Scholar] [CrossRef]
- Saji, N.H.; Yamagata, T. Possible impacts of Indian Ocean Dipole mode events on global climate. Clim. Res. 2003, 25, 151–169. [Google Scholar] [CrossRef]
- Krishna Kumar, K.; Rajagopalan, B.; Cane, M. On the weakening relationship between the Indian monsoon and ENSO. Science 1999, 284, 2156–2159. [Google Scholar] [CrossRef]
- Krishna Kumar, K.; Rajagopalan, B.; Hoerling, M.; Bates, G.; Cane, M. Unraveling the mystery of Indian monsoon failure during El Niño. Science 2006, 314, 115–119. [Google Scholar] [CrossRef] [PubMed]
Figure 1.
(a) Location of the Odisha state in India and a map showing the zones considered for study in the state of Odisha (b) topographic map of the state showing the elevation in meters; and (c) monsoon rainfall climatology over Odisha.
Figure 1.
(a) Location of the Odisha state in India and a map showing the zones considered for study in the state of Odisha (b) topographic map of the state showing the elevation in meters; and (c) monsoon rainfall climatology over Odisha.

Figure 2.
Seasonal cycle of the daily monsoon rainfall climatology averaged over (a) all of India and all of Odisha; and (b) different zones of Odisha for the period 1 June to 30 September.
Figure 2.
Seasonal cycle of the daily monsoon rainfall climatology averaged over (a) all of India and all of Odisha; and (b) different zones of Odisha for the period 1 June to 30 September.
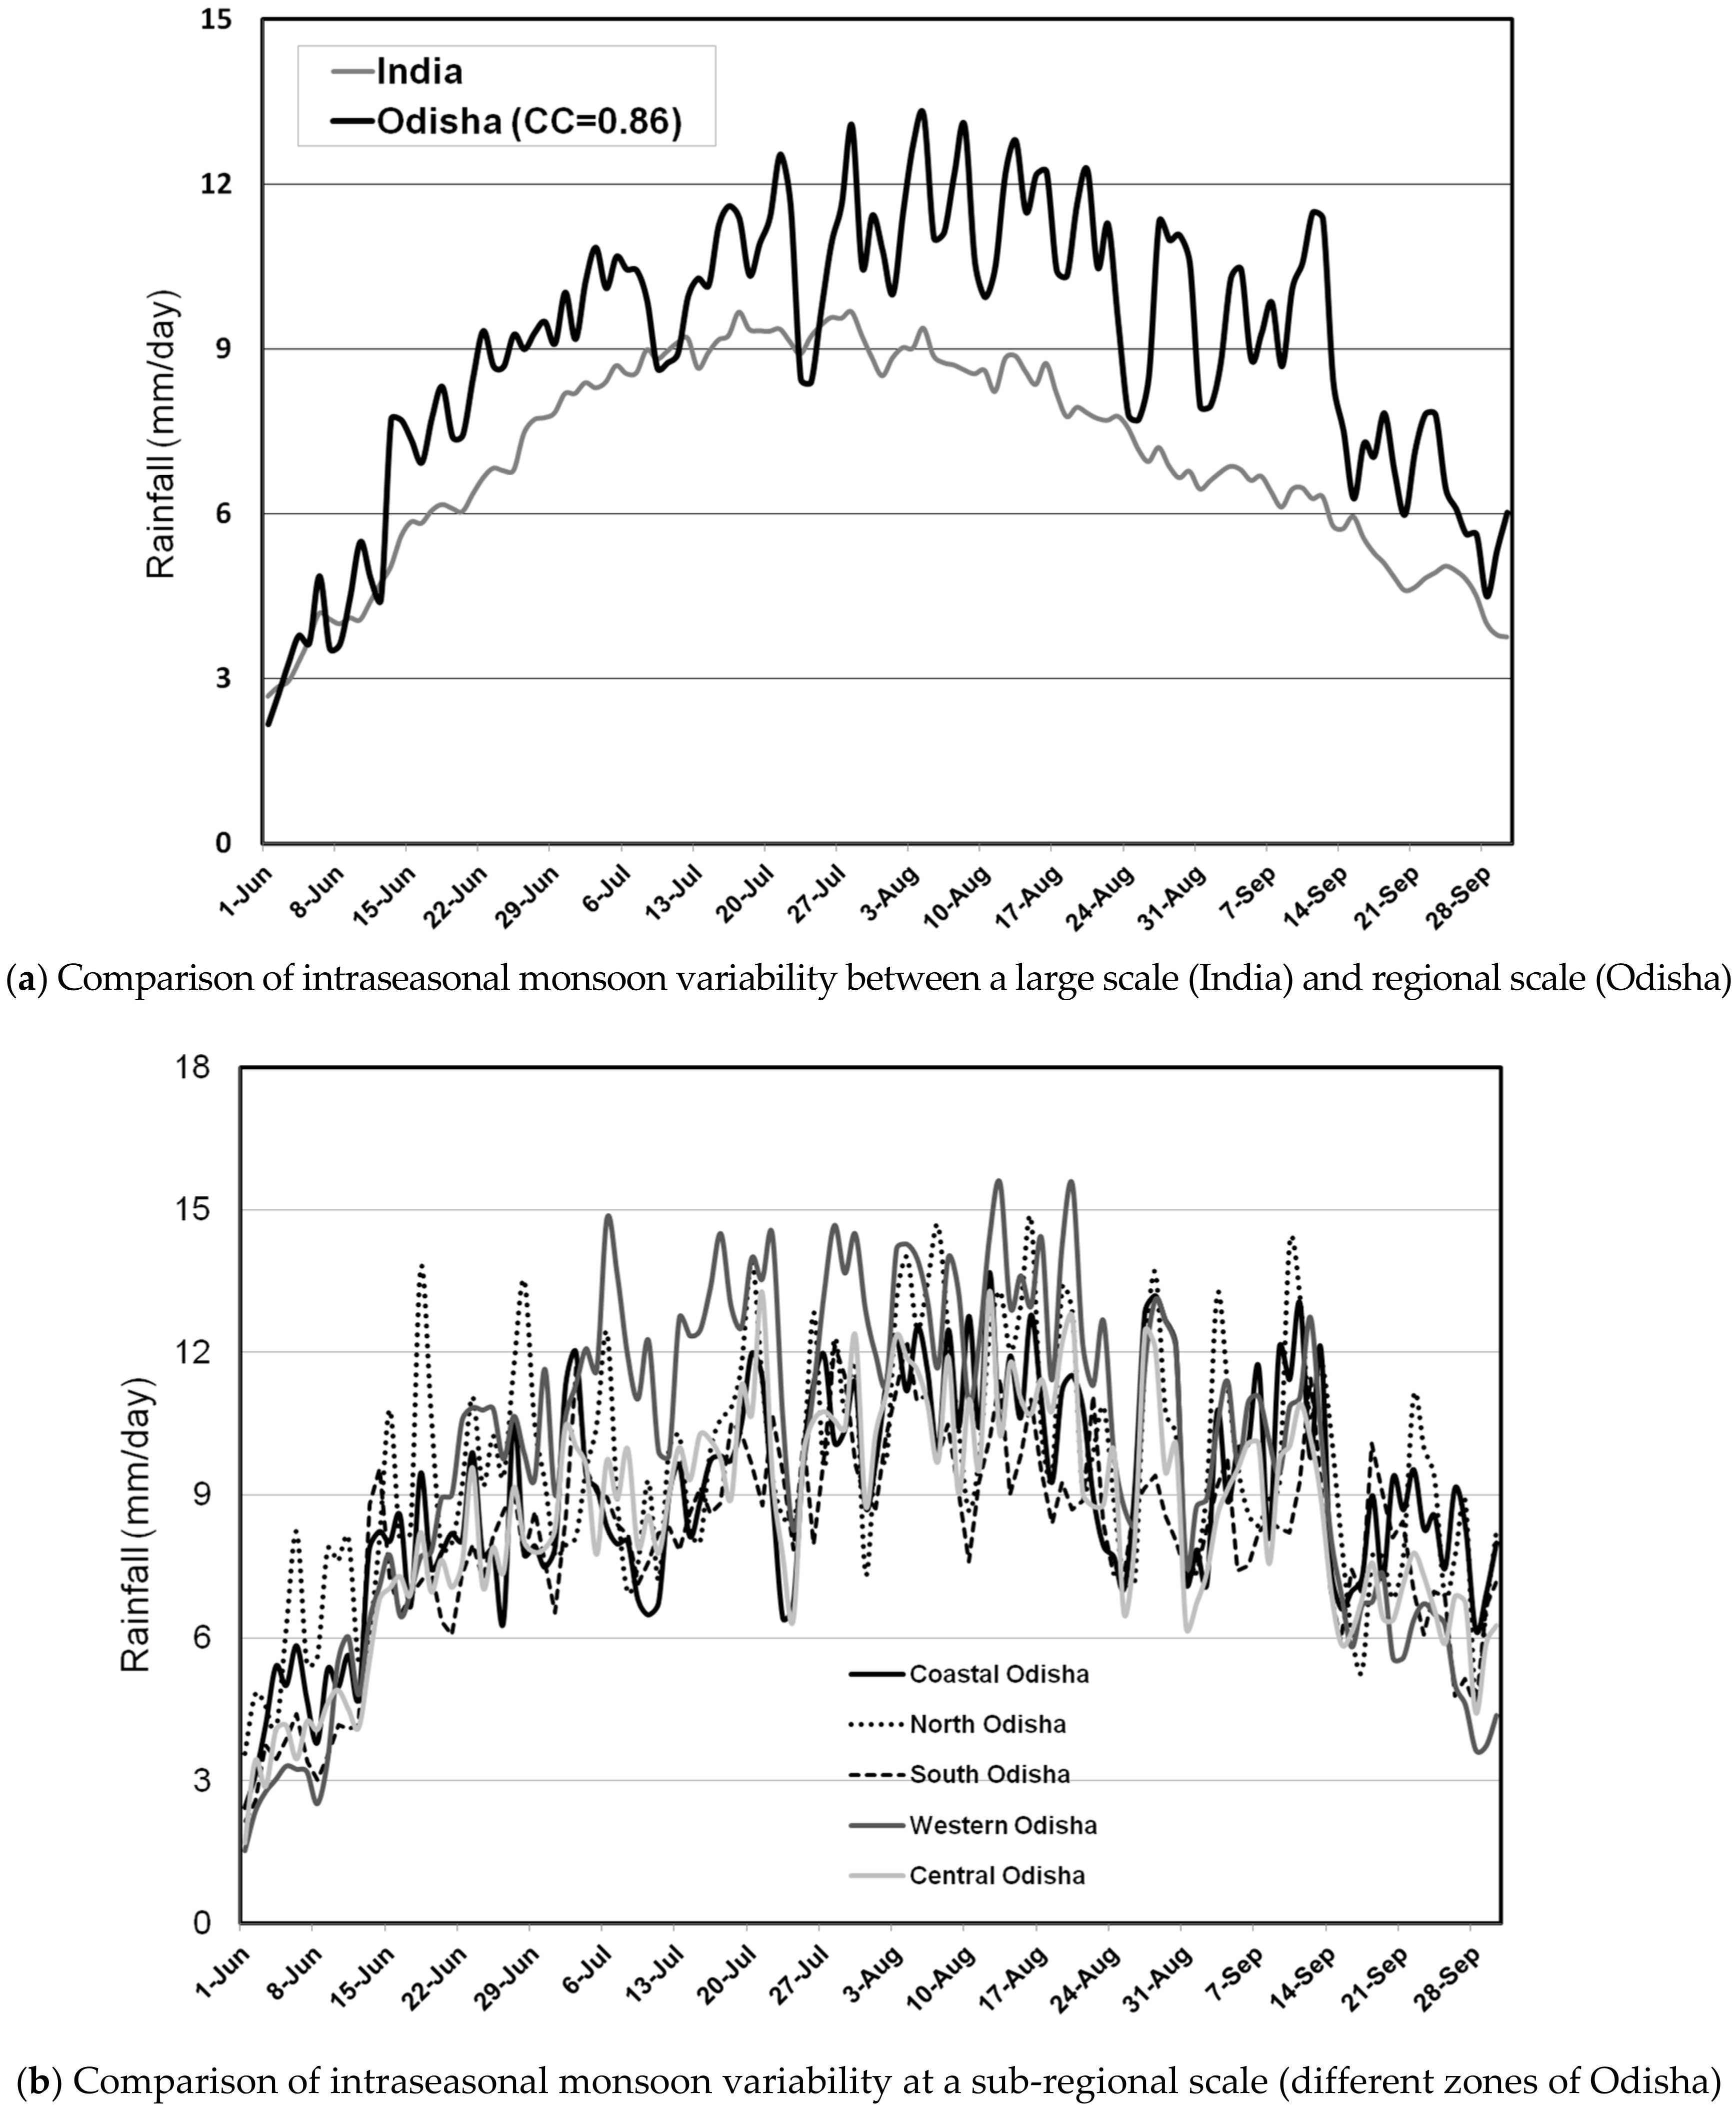
Figure 3.
(a) Comparison of the interannual variability of monsoon (JJAS) rainfall anomaly over Odisha (filled bars) and India (hollow bars). The correlation co-efficient and phase of two IAVs are mentioned in parentheses; (b) Comparison of the interannual variability of the monsoon (JJAS) rainfall anomaly over different regions of Odisha for the period 1951–2013.
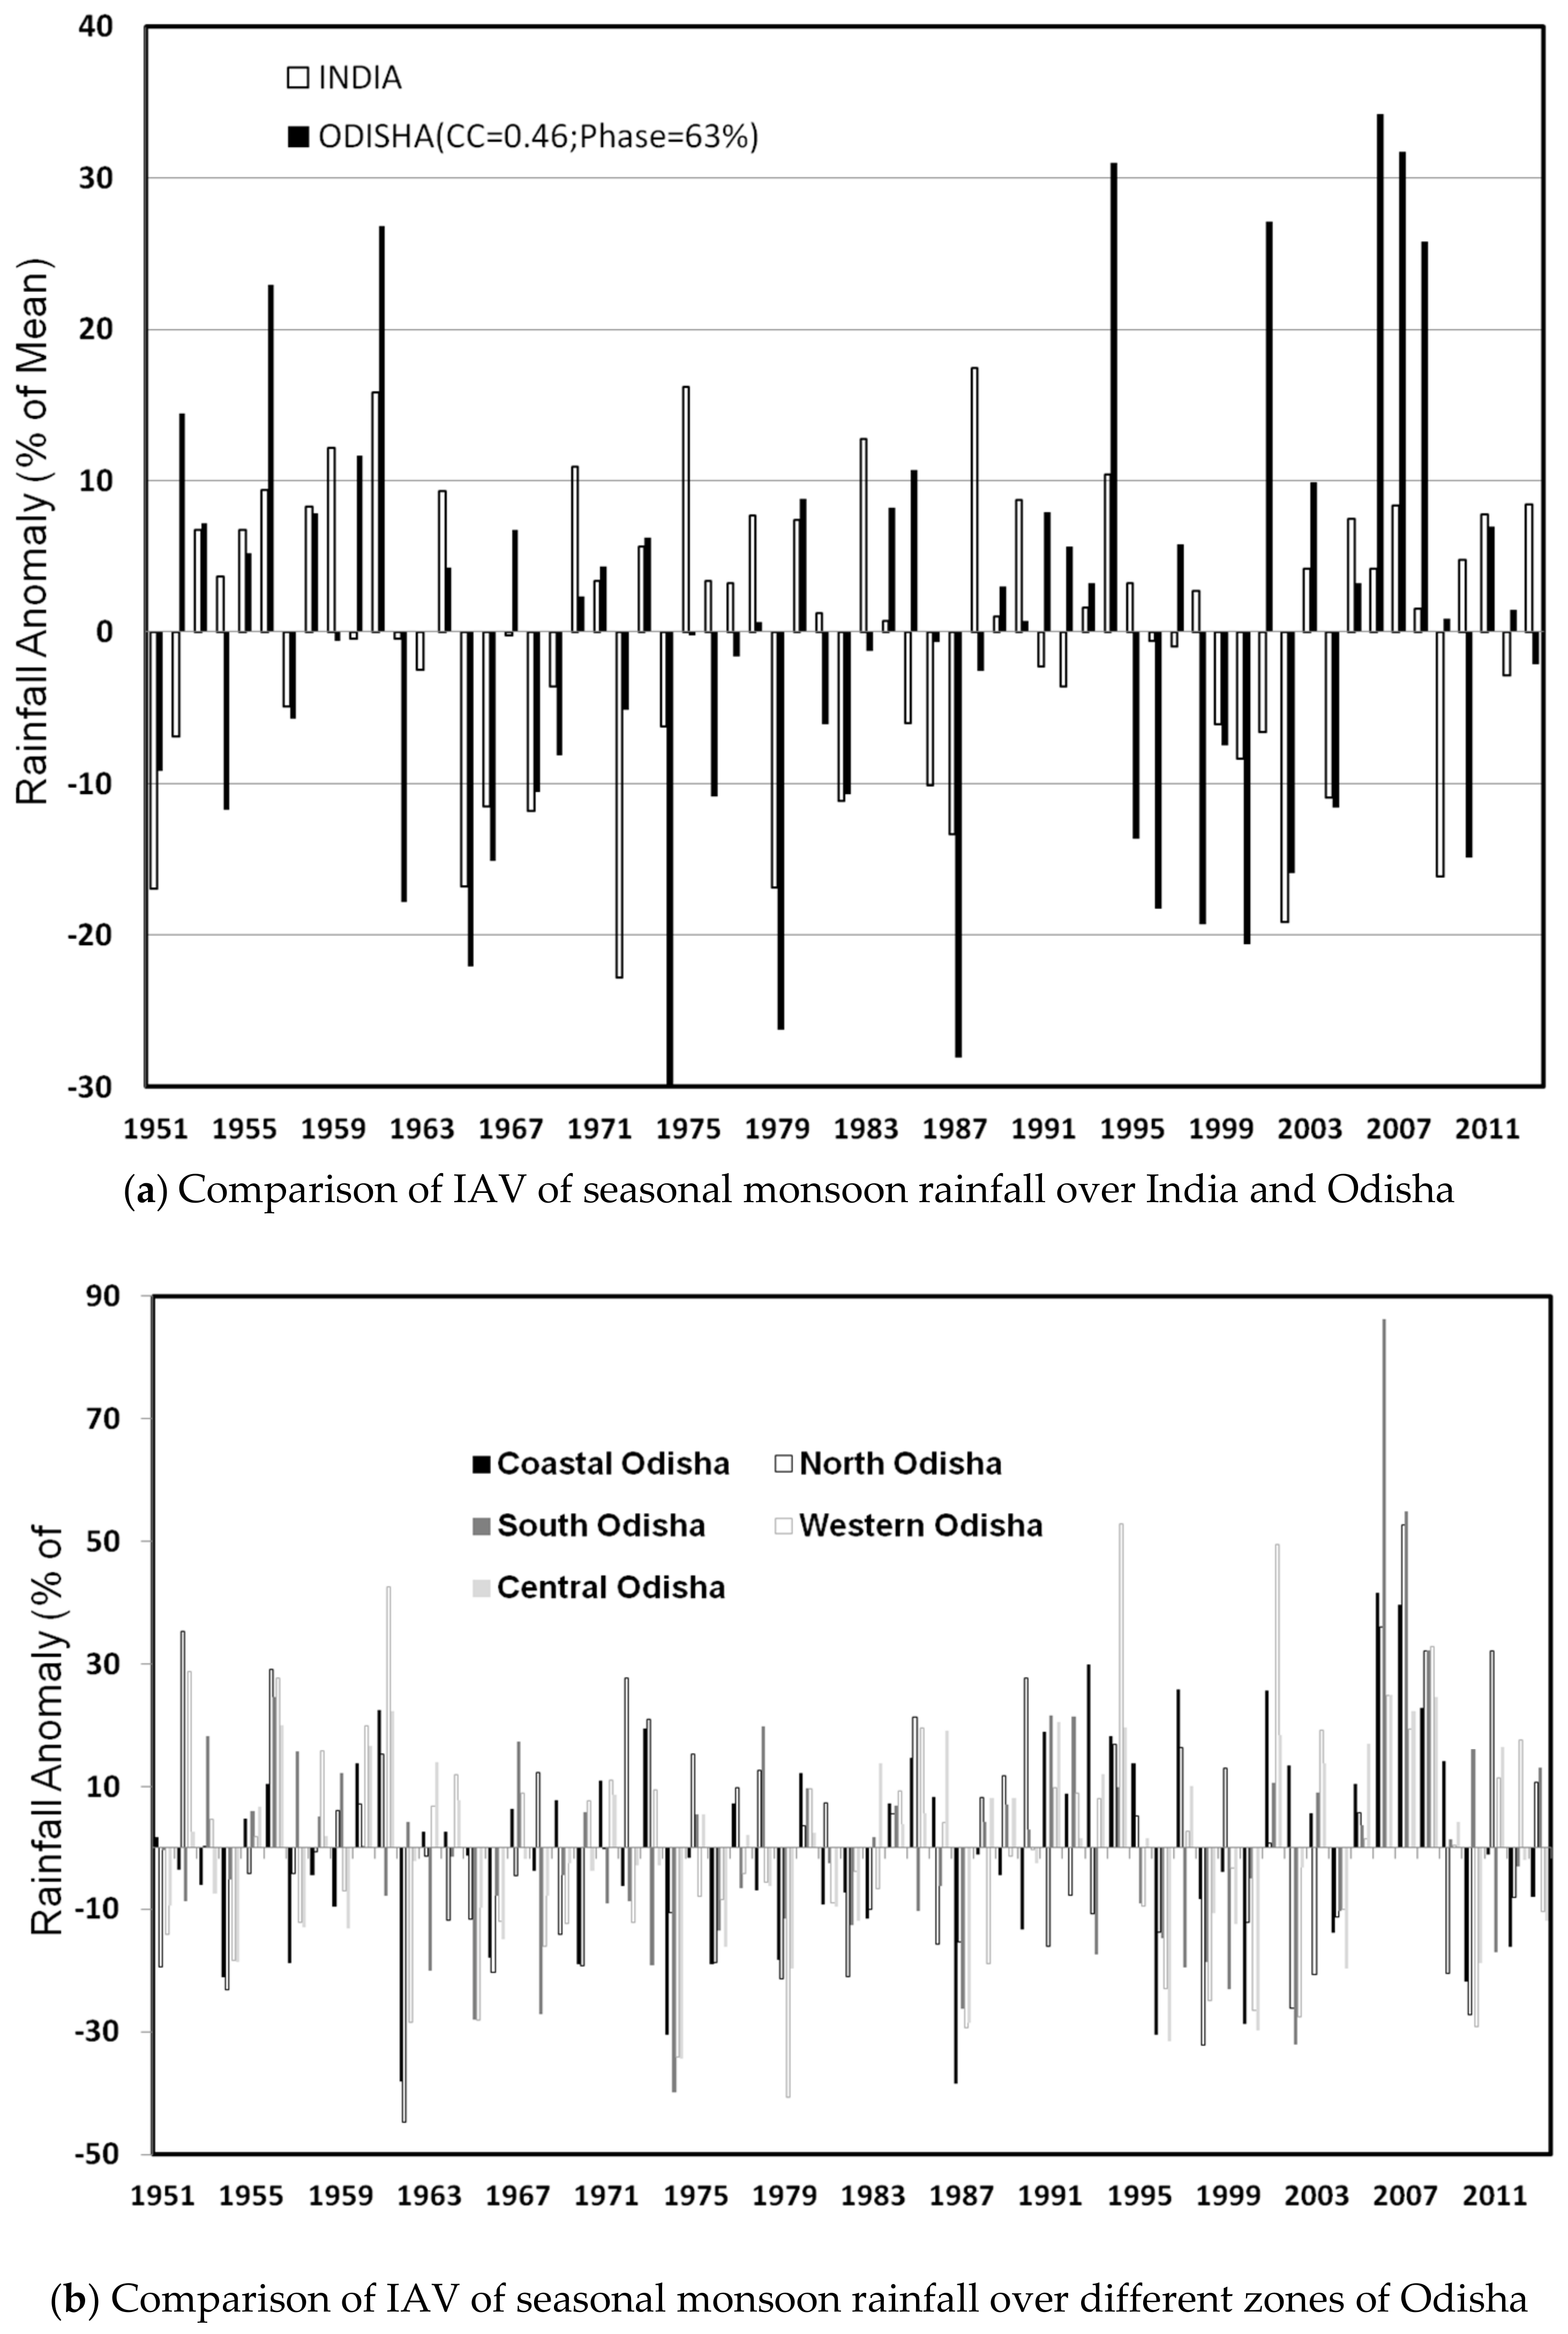
Figure 4.
Seasonal cycle of the daily monsoon rainfall climatology composite over excess (dashed line), deficit (dotted line), normal (shaded line), and all 63 (thick line) years in the state of Odisha.
Figure 4.
Seasonal cycle of the daily monsoon rainfall climatology composite over excess (dashed line), deficit (dotted line), normal (shaded line), and all 63 (thick line) years in the state of Odisha.

Figure 5.
Comparison of seasonal (JJAS) monsoon rainfall climatology composite over excess (top), deficit (middle), and the contrast between excess and deficit years (bottom).
Figure 5.
Comparison of seasonal (JJAS) monsoon rainfall climatology composite over excess (top), deficit (middle), and the contrast between excess and deficit years (bottom).
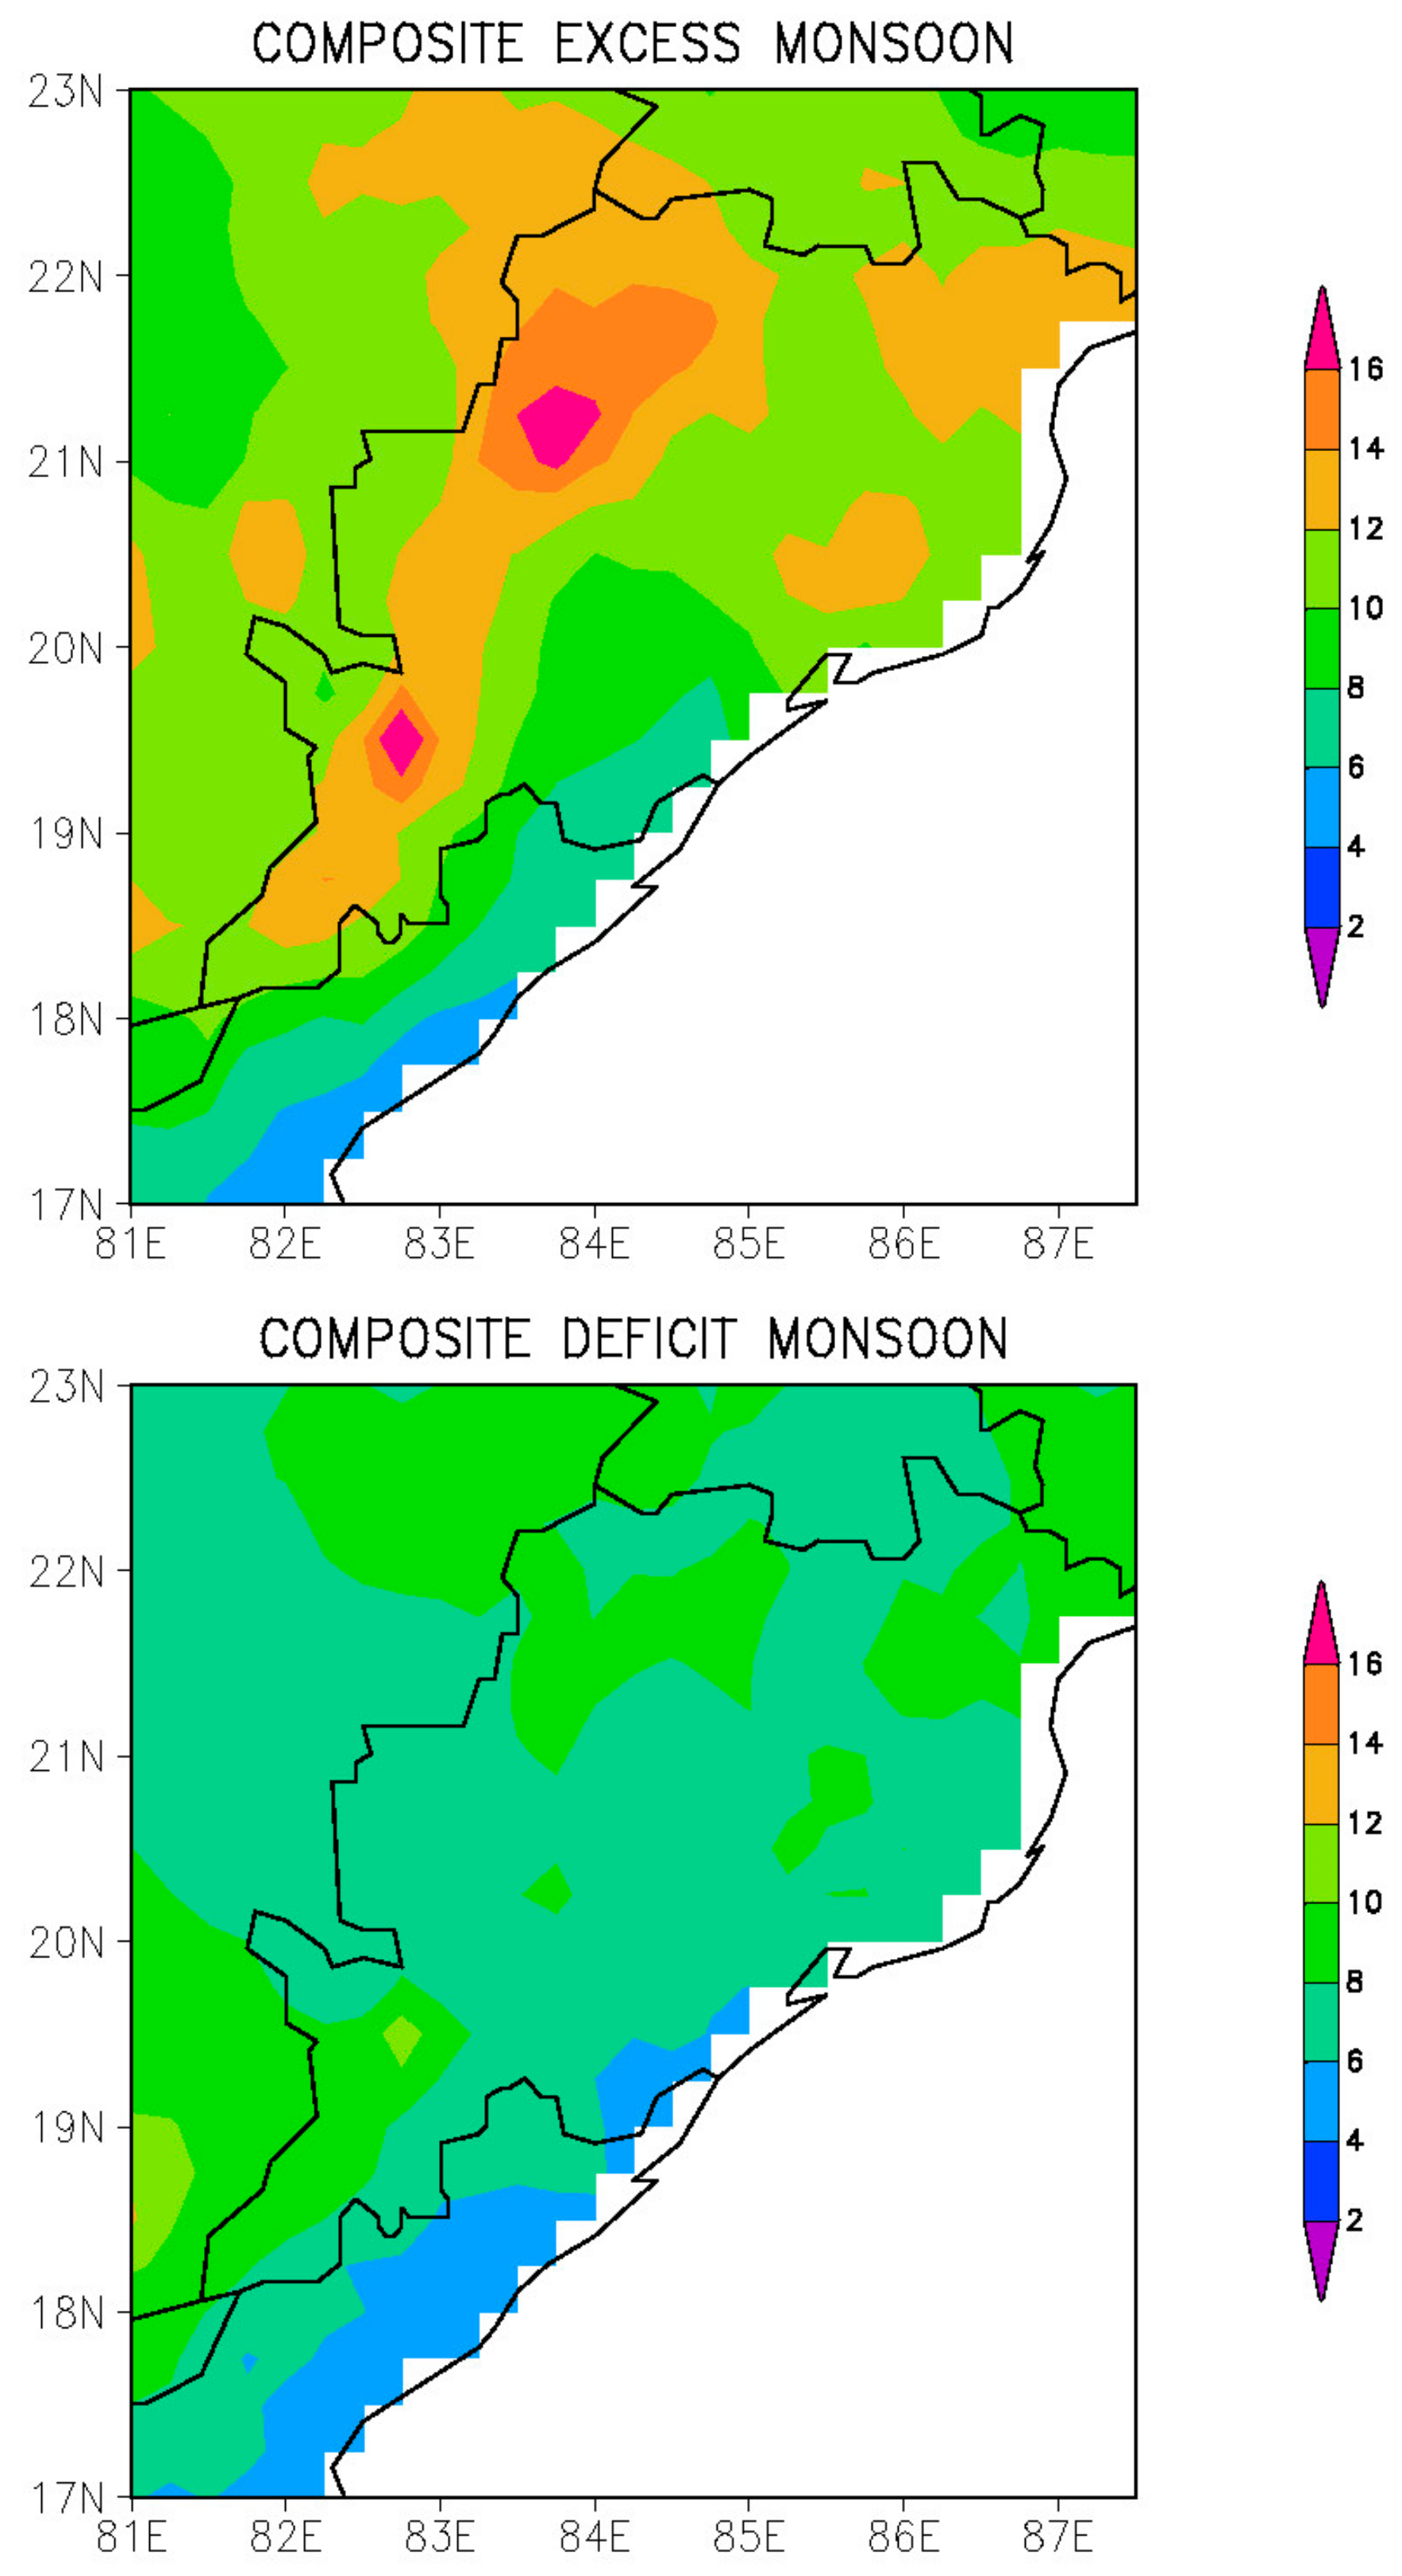

Figure 6.
Composite climatology of wind circulation using NCEP reanalysis for the month of July (a) and August (b) at 850 hPa (left) and 1000 hPa (right) levels. The July (August) analyses are composited over excess (deficit) monsoon years.
Figure 6.
Composite climatology of wind circulation using NCEP reanalysis for the month of July (a) and August (b) at 850 hPa (left) and 1000 hPa (right) levels. The July (August) analyses are composited over excess (deficit) monsoon years.

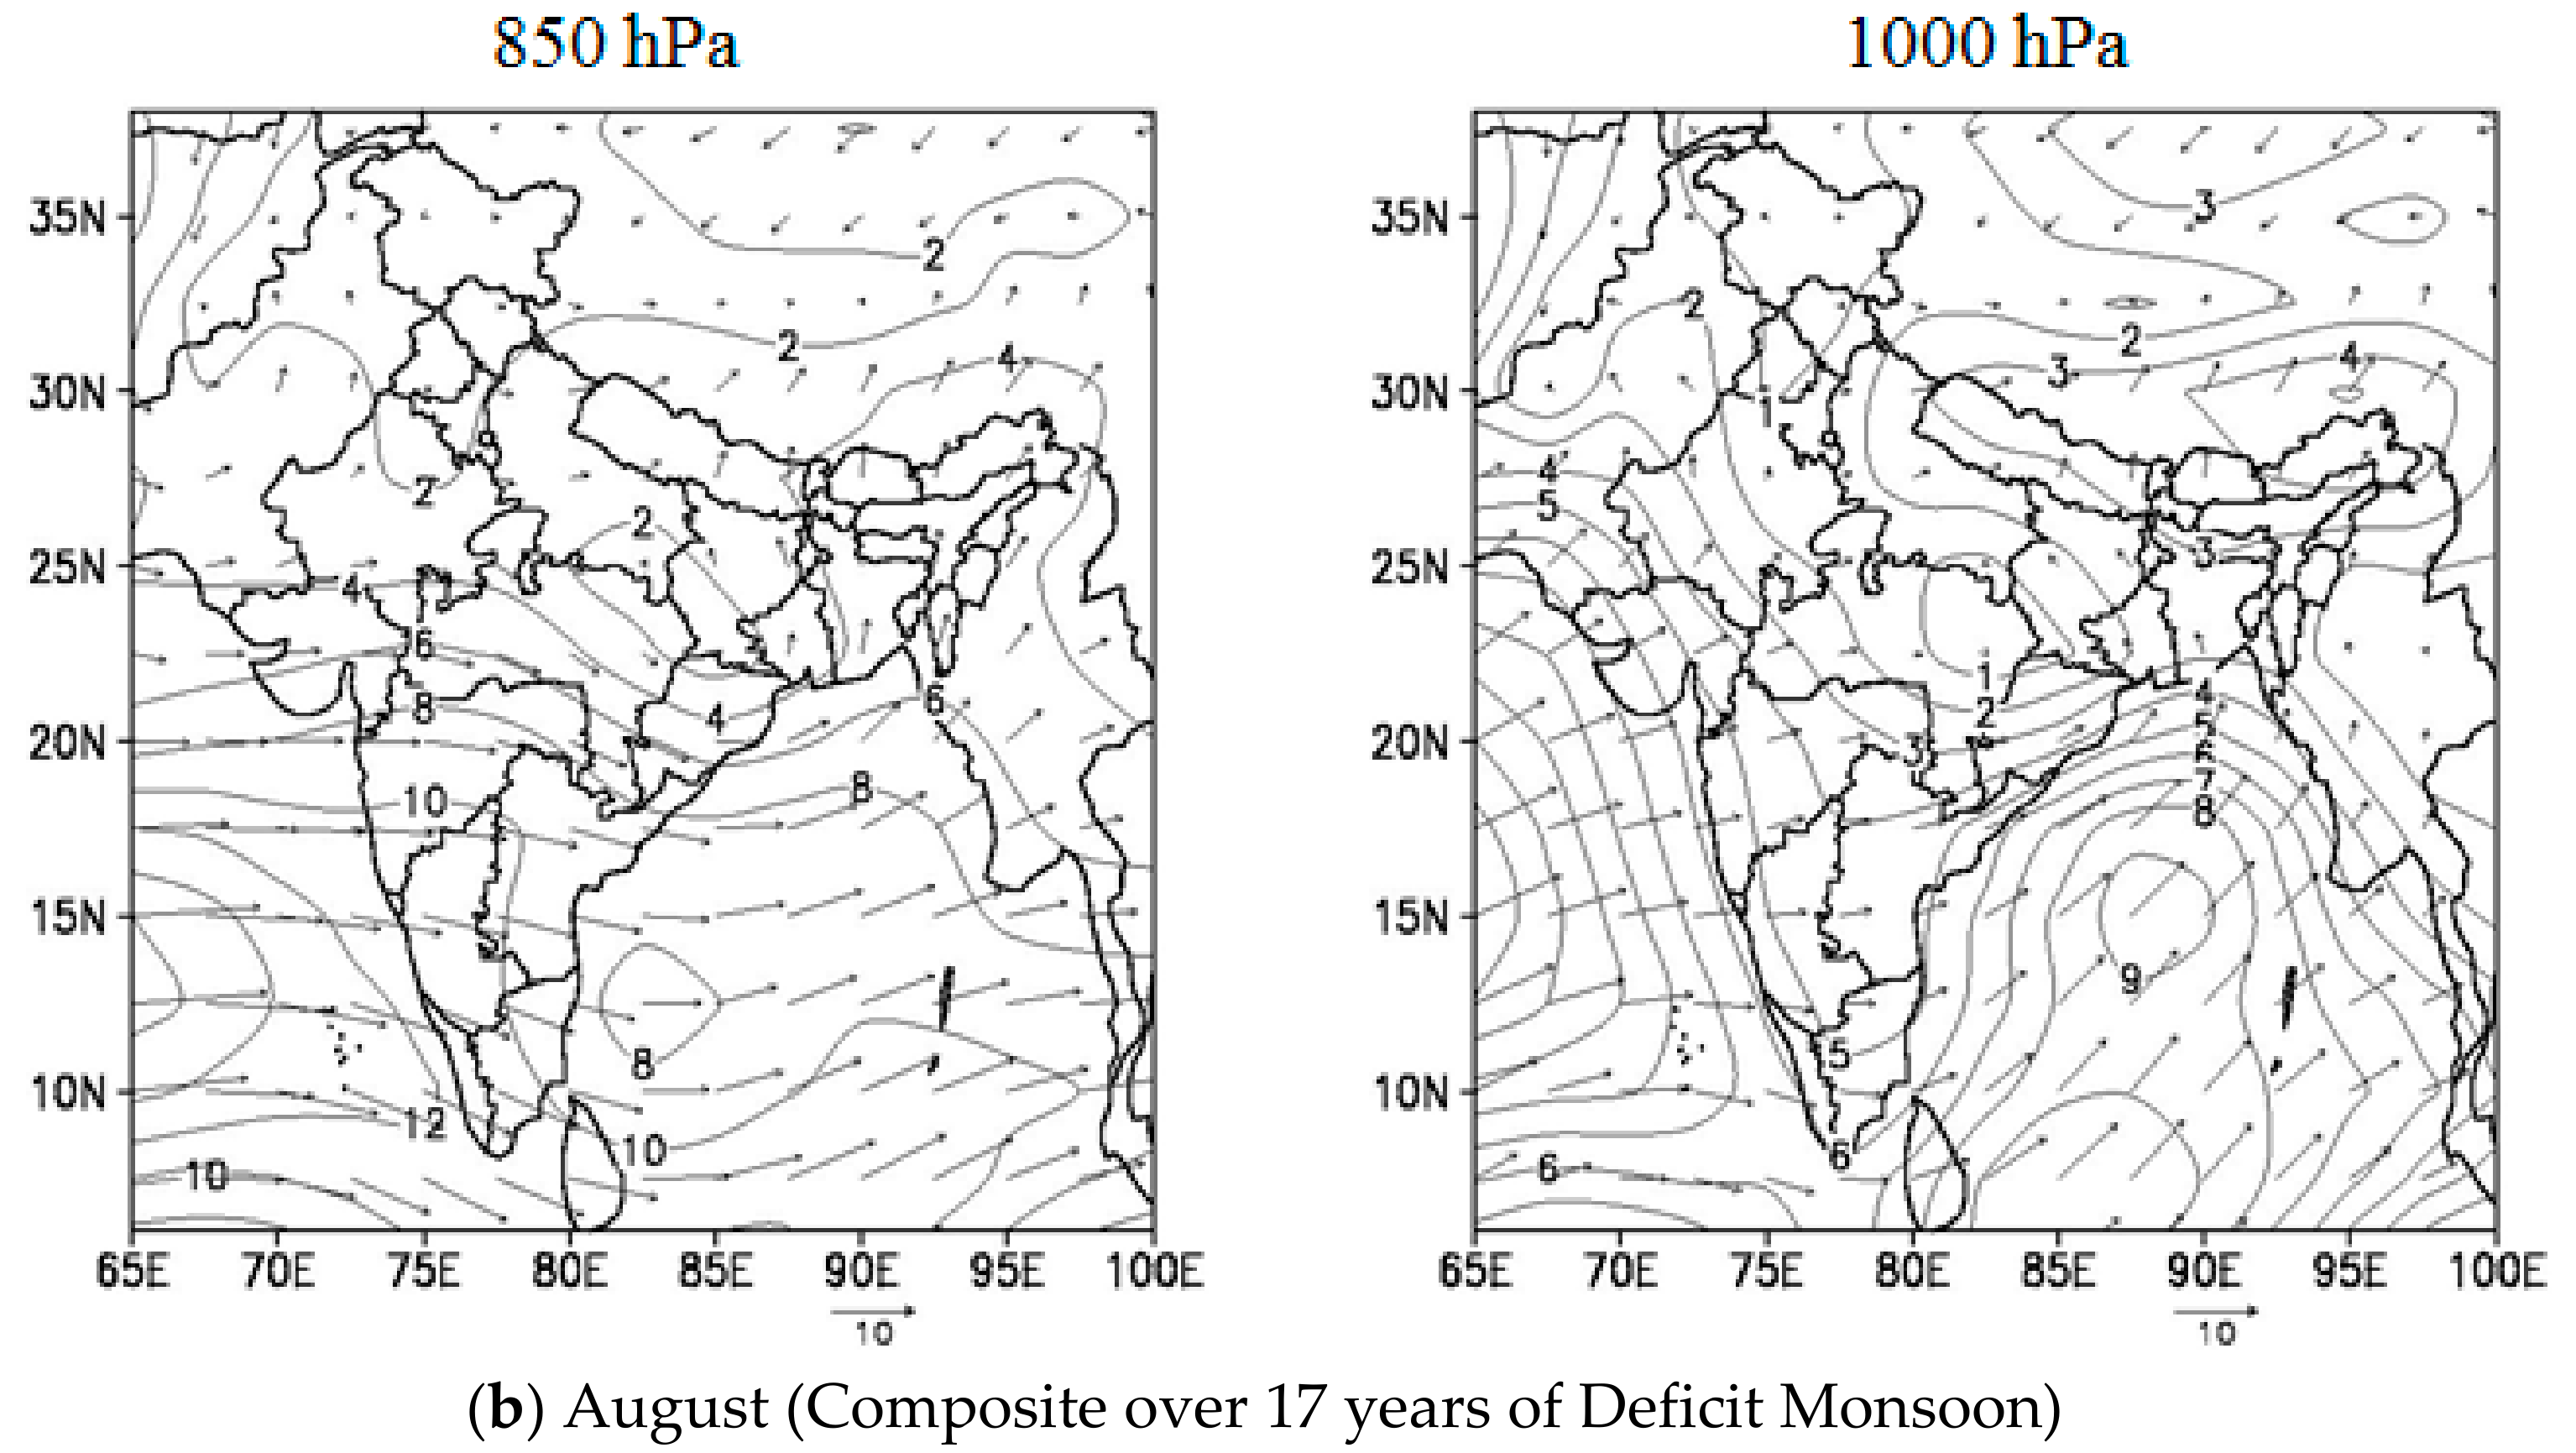
Figure 7.
Composite climatology of humidity using NCEP reanalysis for the month of July (a) and August (b) at 850 hPa (left) and 1000 hPa (right) levels. The July (August) analyses are composited over excess (deficit) monsoon years.
Figure 7.
Composite climatology of humidity using NCEP reanalysis for the month of July (a) and August (b) at 850 hPa (left) and 1000 hPa (right) levels. The July (August) analyses are composited over excess (deficit) monsoon years.
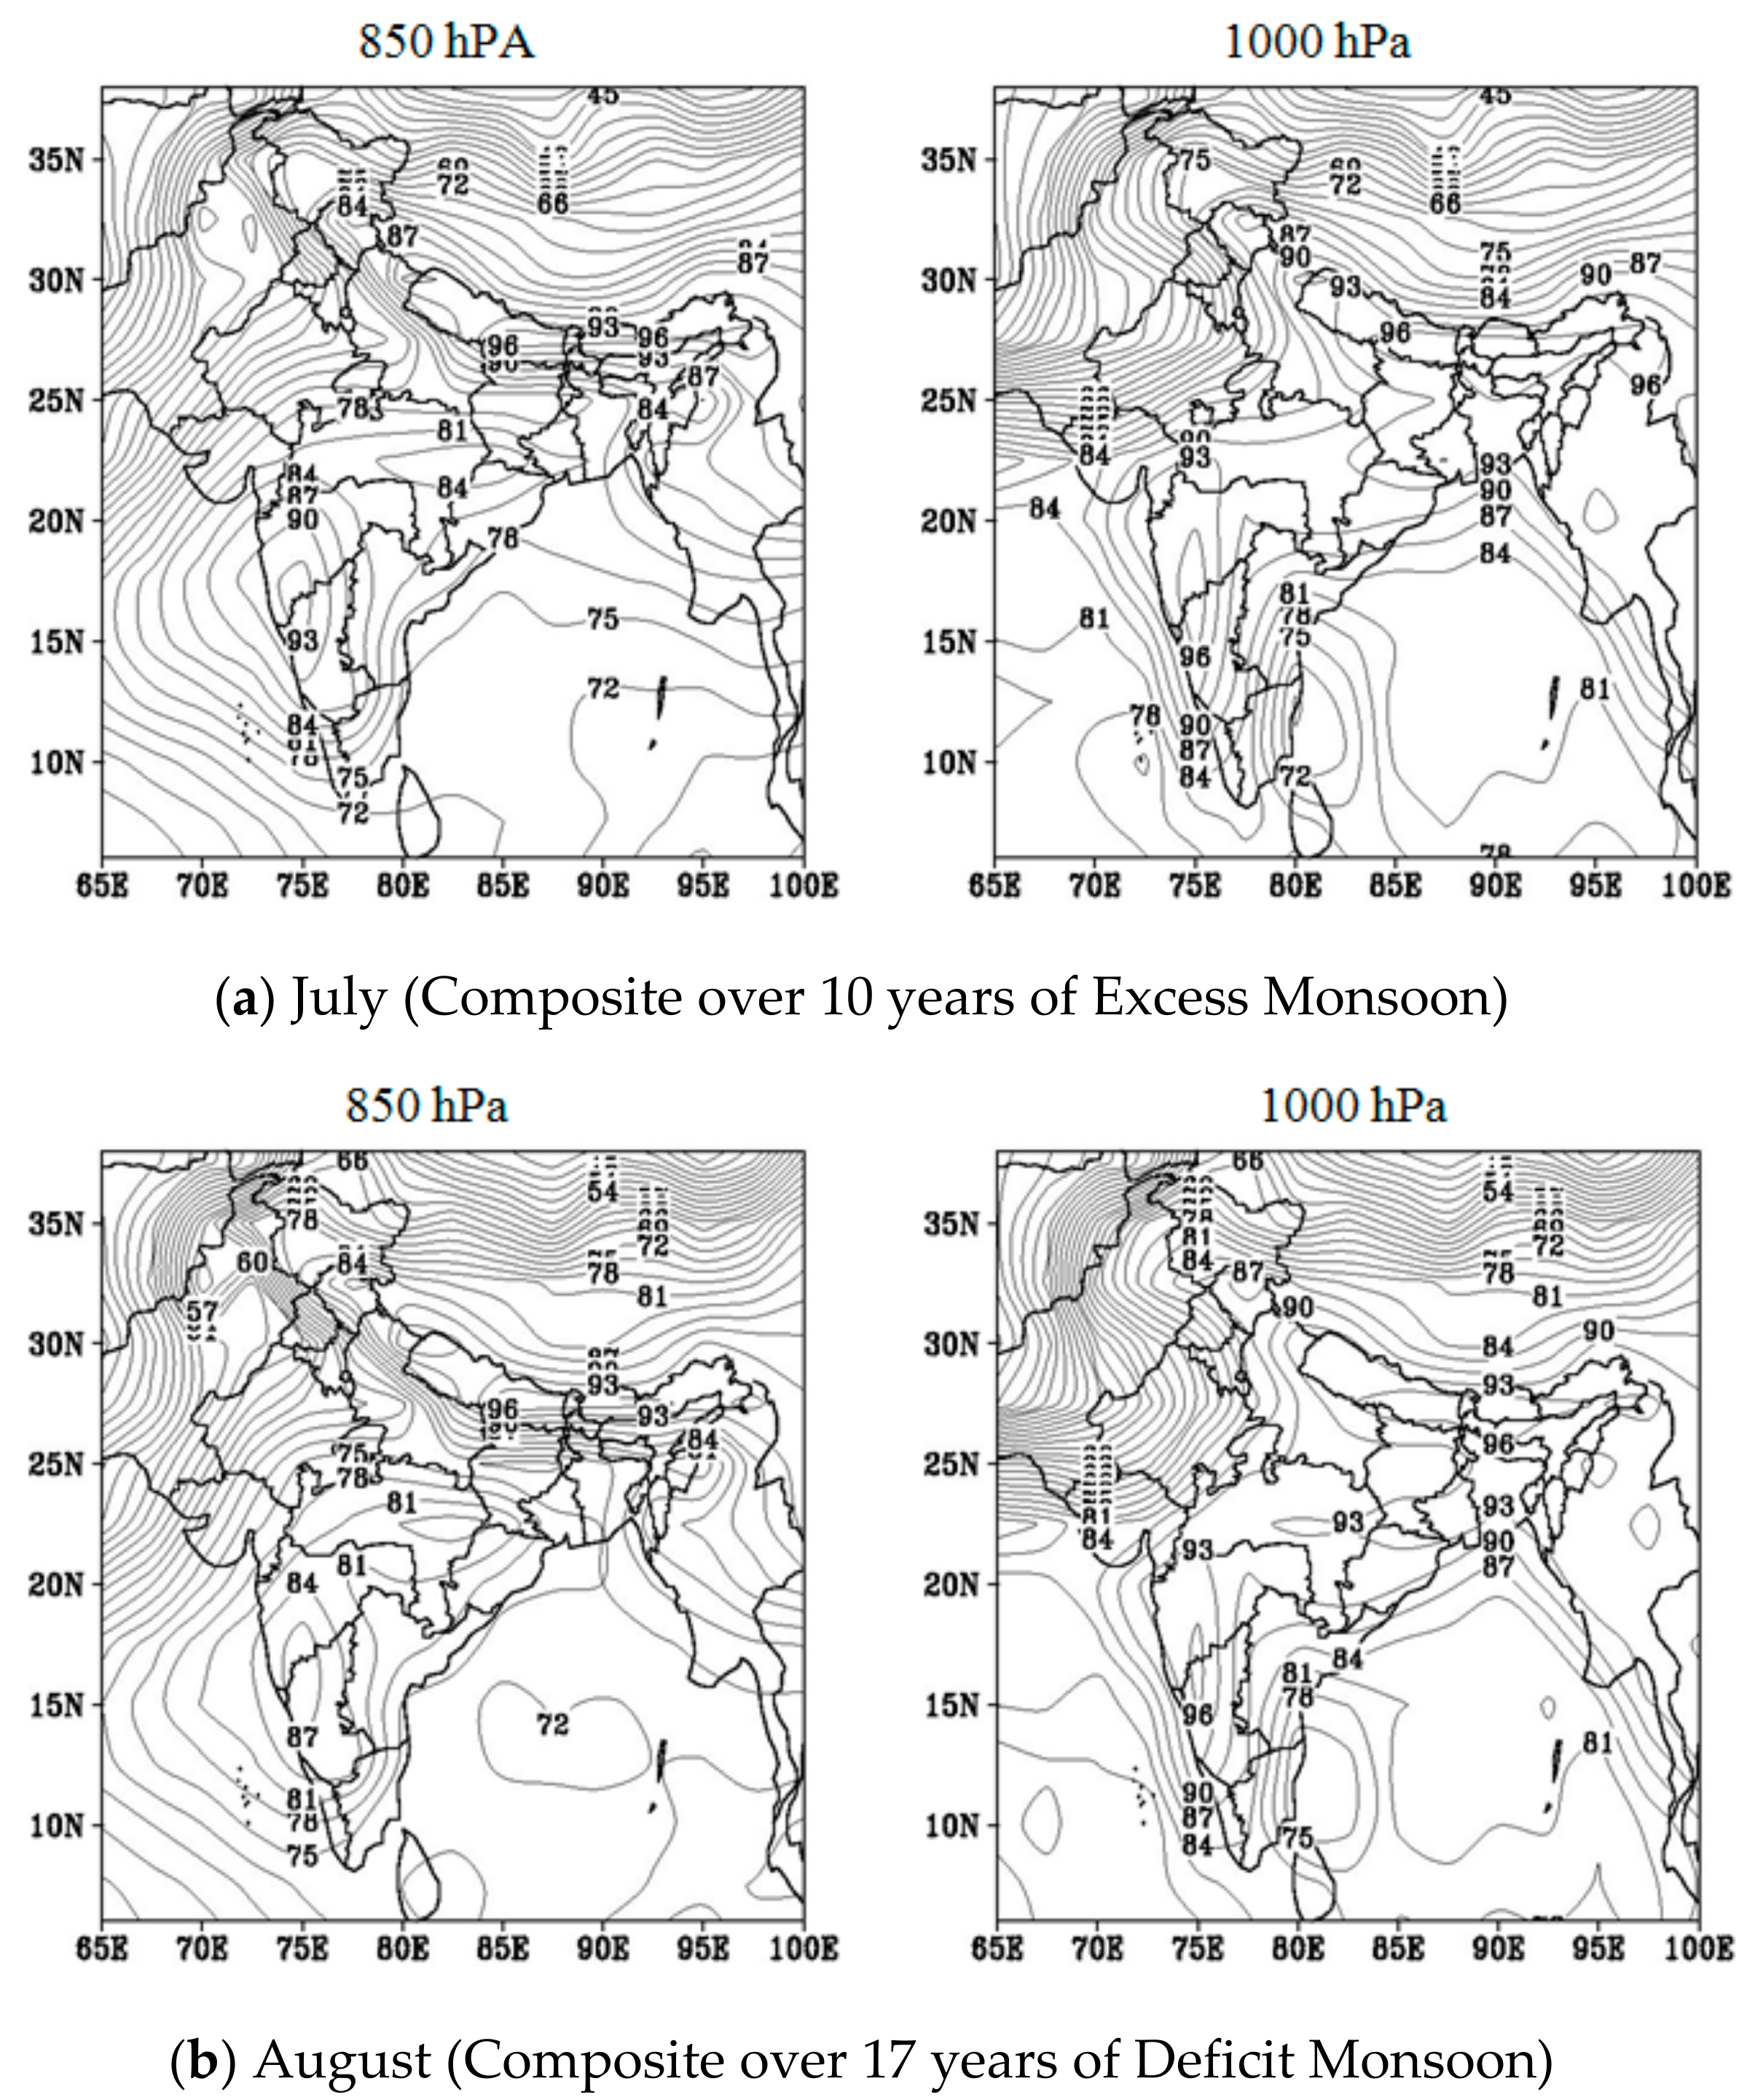
Figure 8.
Seasonal cycle of the daily rainfall climatology during the monsoon period (1 June to 30 September) averaged over (a) India and (b) Odisha composite over the El Niño (thick line) and La Niña (dotted line) years for the period 1 June to 32 September. The analysis is averaged over the El Niño and La Niña years separately.

Figure 9.
Scatterplot of the JJAS NINO 3.4 SST anomaly and the JJAS rainfall anomaly over all of India (top) and Odisha (bottom) for the period 1951–2013.
Figure 9.
Scatterplot of the JJAS NINO 3.4 SST anomaly and the JJAS rainfall anomaly over all of India (top) and Odisha (bottom) for the period 1951–2013.

Figure 10.
Seasonal cycle of the daily rainfall climatology during the monsoon period (1 June to 30 September) averaged over (a) India and (b) Odisha composite over the years with positive (thick line) and negative (dotted line) IOD for the period 1 June to 30 September.
Figure 10.
Seasonal cycle of the daily rainfall climatology during the monsoon period (1 June to 30 September) averaged over (a) India and (b) Odisha composite over the years with positive (thick line) and negative (dotted line) IOD for the period 1 June to 30 September.
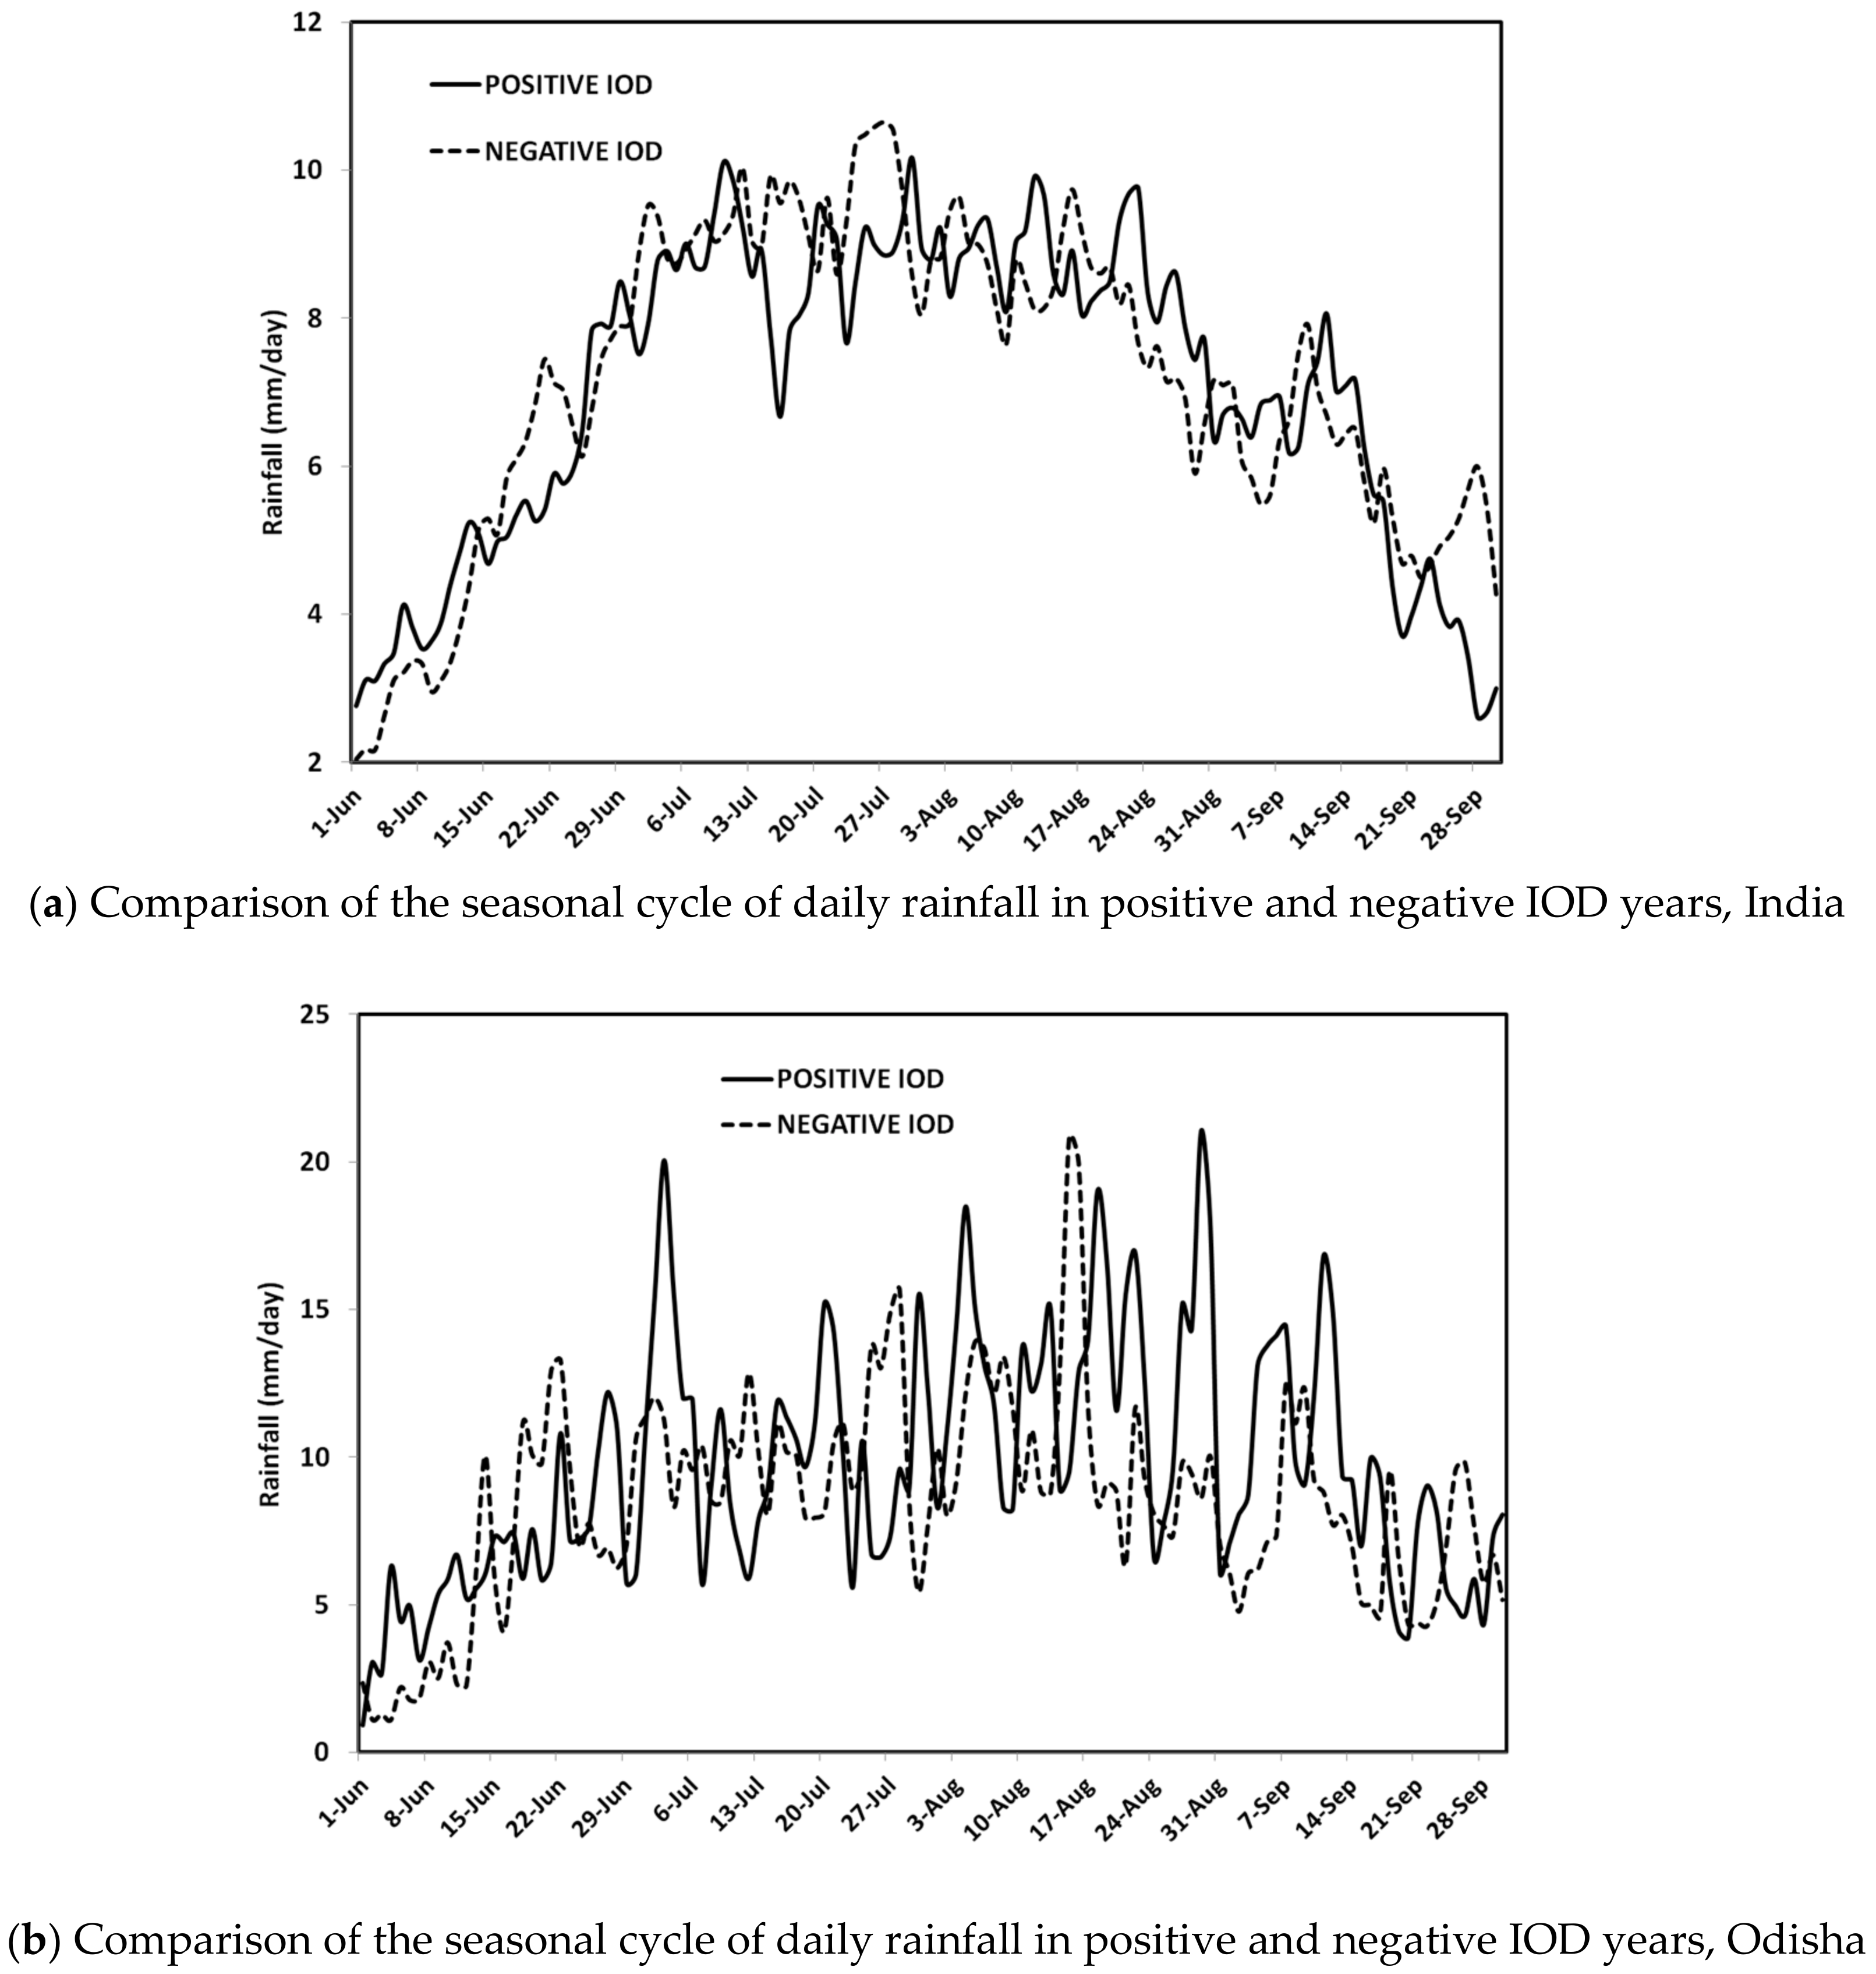
Figure 11.
Inter-relation of the Dipole Mode Index (DMI) and seasonal (JJAS) rainfall anomaly over India and Odisha for the period 1958–2006. The correlation of the seasonal rainfall anomaly and the DMI anomaly are given in bracket.
Figure 11.
Inter-relation of the Dipole Mode Index (DMI) and seasonal (JJAS) rainfall anomaly over India and Odisha for the period 1958–2006. The correlation of the seasonal rainfall anomaly and the DMI anomaly are given in bracket.


Table 1.
Detailed coverage of the different regions of Odisha.
| Region | Domain |
|---|---|
| India | Continental India |
| Odisha | All-Odisha |
| Districts considered | |
| North Odisha | Mayurbhanj, Keonjhar |
| South Odisha | Malkangiri, Koraput, Rayagada, Gajpati, Nabarangpur |
| Coastal Odisha | Balasore, Bhadrak, Kendrapada, Jagatsinghpur, Puri, Khurdha, Ganjam |
| Western Odisha | Sundergarh, Jharsuguda, Sambalpur, Deogarh, Baragarh, Sonepur, Balangir, Nuapada, Kalahandi |
| Central Odisha | Jajpur, Dhenkanal, Anugul, Cuttack, Kandhamal, Nayagarh, Boudh |
Table 2.
Sub-regional scale analysis of rainfall categories in daily climatology over the Odisha State.
Table 2.
Sub-regional scale analysis of rainfall categories in daily climatology over the Odisha State.
| Case | North Odisha | South Odisha | Coastal Odisha | Western Odisha | Central Odisha | All Odisha | All India |
|---|---|---|---|---|---|---|---|
| No of Days (>=12 mm) | 14 | 4 | 9 | 37 | 15 | 8 | 0 |
| No of Days (<=9 mm) | 60 | 74 | 75 | 42 | 57 | 59 | 80 |
| 120 days average rainfall (in mm) | 9.55 | 8.09 | 8.96 | 9.89 | 8.50 | 9.01 | 7.06 |
Table 3.
List of the years considered for large-scale phenomena (like El Niño, La Niña, positive, and negative IOD) years. The analyses are carried out for the period 1951–2013.
Table 3.
List of the years considered for large-scale phenomena (like El Niño, La Niña, positive, and negative IOD) years. The analyses are carried out for the period 1951–2013.
| Events | Years | Total Number of Years |
|---|---|---|
| El-nino | 1951, 1952, 1953, 1957, 1958, 1963, 1965, 1968, 1969, 1972, 1976, 1977, 1979, 1982, 1986, 1987, 1991, 1994, 1997, 2002, 2004, 2006, 2009 | 23 |
| La-nina | 1954, 1955, 1964, 1967, 1970, 1971, 1973, 1974, 1975, 1983, 1984, 1988, 1995, 1998, 1999, 2000, 2007, 2010, 2011 | 19 |
| Positive IOD | 1957, 1961, 1963, 1972, 1982, 1983, 1994, 1997, 2006, 2012 | 10 |
| Negative IOD | 1958, 1960, 1964, 1974, 1981, 1989, 1992, 1996, 1998, 2010 | 10 |
Table 4.
The phase and CC analysis of rainfall in different regions of Odisha with respect to all of Odisha and all of India rainfall. The analysis was carried out for the period 1951–2013.
Table 4.
The phase and CC analysis of rainfall in different regions of Odisha with respect to all of Odisha and all of India rainfall. The analysis was carried out for the period 1951–2013.
| Domain | CC or Phase | North Odisha (2) | South Odisha (5) | Coastal Odisha (7) | Western Odisha (9) | Central Odisha (7) |
|---|---|---|---|---|---|---|
| All Odisha Rainfall | CC | 0.82 | 0.76 | 0.88 | 0.95 | 0.92 |
| PS (%) | 76 | 59 | 71 | 94 | 76 | |
| All India Rainfall | CC | 0.59 | 0.58 | 0.76 | 0.89 | 0.79 |
| PS (%) | 54 | 70 | 68 | 60 | 63 |
© 2017 by the authors. Licensee MDPI, Basel, Switzerland. This article is an open access article distributed under the terms and conditions of the Creative Commons Attribution (CC BY) license (http://creativecommons.org/licenses/by/4.0/).
Share and Cite
MDPI and ACS Style
Gouda, K.C.; Sahoo, S.K.; Samantray, P.; Shivappa, H. Comparative Study of Monsoon Rainfall Variability over India and the Odisha State. Climate 2017, 5, 79. https://doi.org/10.3390/cli5040079
AMA Style
Gouda KC, Sahoo SK, Samantray P, Shivappa H. Comparative Study of Monsoon Rainfall Variability over India and the Odisha State. Climate. 2017; 5(4):79. https://doi.org/10.3390/cli5040079
Chicago/Turabian StyleGouda, K C, Sanjeeb Kumar Sahoo, Payoshni Samantray, and Himesh Shivappa. 2017. "Comparative Study of Monsoon Rainfall Variability over India and the Odisha State" Climate 5, no. 4: 79. https://doi.org/10.3390/cli5040079
Note that from the first issue of 2016, this journal uses article numbers instead of page numbers. See further details here.