Observed Regional Climate Variability during the Last 50 Years in Reindeer Herding Cooperatives of Finnish Fell Lapland


1
Faculty of Humanities, University of Oulu, 90014 Oulu, Finland
2
Research Unit of Mathematical Sciences, University of Oulu, 90014 Oulu, Finland
*
Author to whom correspondence should be addressed.
Climate 2017, 5(4), 81; https://doi.org/10.3390/cli5040081
Submission received: 10 August 2017
/
Revised: 10 October 2017
/
Accepted: 11 October 2017
/
Published: 16 October 2017
Abstract
:In Finnish Lapland, reindeer herders’ activity is strongly dependent on the surrounding natural environment, which is directly exposed to environmental changes and climatic variations. By assessing whether there is any evidence of change in climate in Fell Lapland over the last 50 years, this paper attempts to link global climatic trends with local conditions and respond to the need of information at the local level. It aims at assessing the changes in temperature, precipitation and snow cover at a regional and local scale, as well as determining the climatic trends for the period 1960–2011. Statistical methods were used to conduct analyses of the regional homogeneity, the annual and seasonal variability, and the cold intensity. The results show that the regional climate is not homogeneous and differences exist between locations. Nevertheless, it can be concluded that, in general, a warming trend is discernible for the period 1960–2011, frost and thaw cycles slightly increase, and variations in mean temperatures are more important in the winter. Precipitation is more variable according to the site but, in general, precipitation is increasing with time, especially in the winter, and the snow cover does not seem to contain any discernible trend.
Keywords:
climate variability; correlations; Lapland; precipitation; reindeer herding; snow cover; temperatures; trends
1. Introduction
The living conditions of Arctic and sub-Arctic communities are affected by climate variability and environmental changes [1,2,3], with direct impacts on health and quality of life [4]. In Northern Finland, where the population is scattered and land use needs can lead to conflict, climate change seems to be the most prominent driver of change, even though other environmental and socioeconomic pressures have an undeniable impact on socio-ecological systems too [5,6]. While the higher sensitivity of northern latitudes, compared to most other parts of the world, to climate change has been shown [1,7,8], few multidisciplinary studies have undertaken quantitative climate research in specific remote and vulnerable areas of Finnish Lapland [9]. Also, most of the studies conducted in Finland focus on the long-term variability of one single climate variable at local-scale [10] or national-scale [11,12], whereas the present one attempts to investigate the long-term and local-scale variability of all climate variables that are specifically crucial for reindeer herding.
The present study downscales the global approach to climate to the regional and local levels, and focuses on all the seasons with a specific focus on the winter season. In Northern Finland, winter is a critical season for reindeer herding [13,14,15] as ice and snow conditions remain particularly important environmental factors affecting reindeer populations dynamics, as well as the daily life of local communities [16,17]; in addition to the large natural variability of winter weather conditions, the Finnish Meteorological Institute predicts that warming and increased precipitation will be stronger in the winter (respectively by 3–9 °C and by 10–40%) than in the summer (by 1–5 °C and 0–20%), and winter changes will affect the north more than the south [18]. Moreover, the number of freezing point days (with a daily minimum temperature below zero and maximum temperature above zero) is another critical point for local livelihoods that are predicted to be larger than it is currently in the north. In that sense, the variability and change in winter weather conditions, and also the increasing occurrence of extreme winter weather events, will produce many public safety and economic problems, disrupting local socioeconomic activities.
A change in climate and weather conditions will affect local people and their livelihoods. In Finnish Lapland, reindeer herders’ activity is strongly dependent on the surrounding natural environment. Reindeer herding systems can be considered as nature-based cultural livelihood systems [19] whose practitioners are both Sámi and non-Sámi people [20], and it is an excellent indicator of livelihood welfare, especially as the activity is directly exposed to environmental changes and climatic variations [21,22]. Indeed, the seasonal migrations of reindeer, the availability of the ground and tree lichen [23] and the calving rate and period [13] can be affected by weather conditions, particularly in the wintertime.
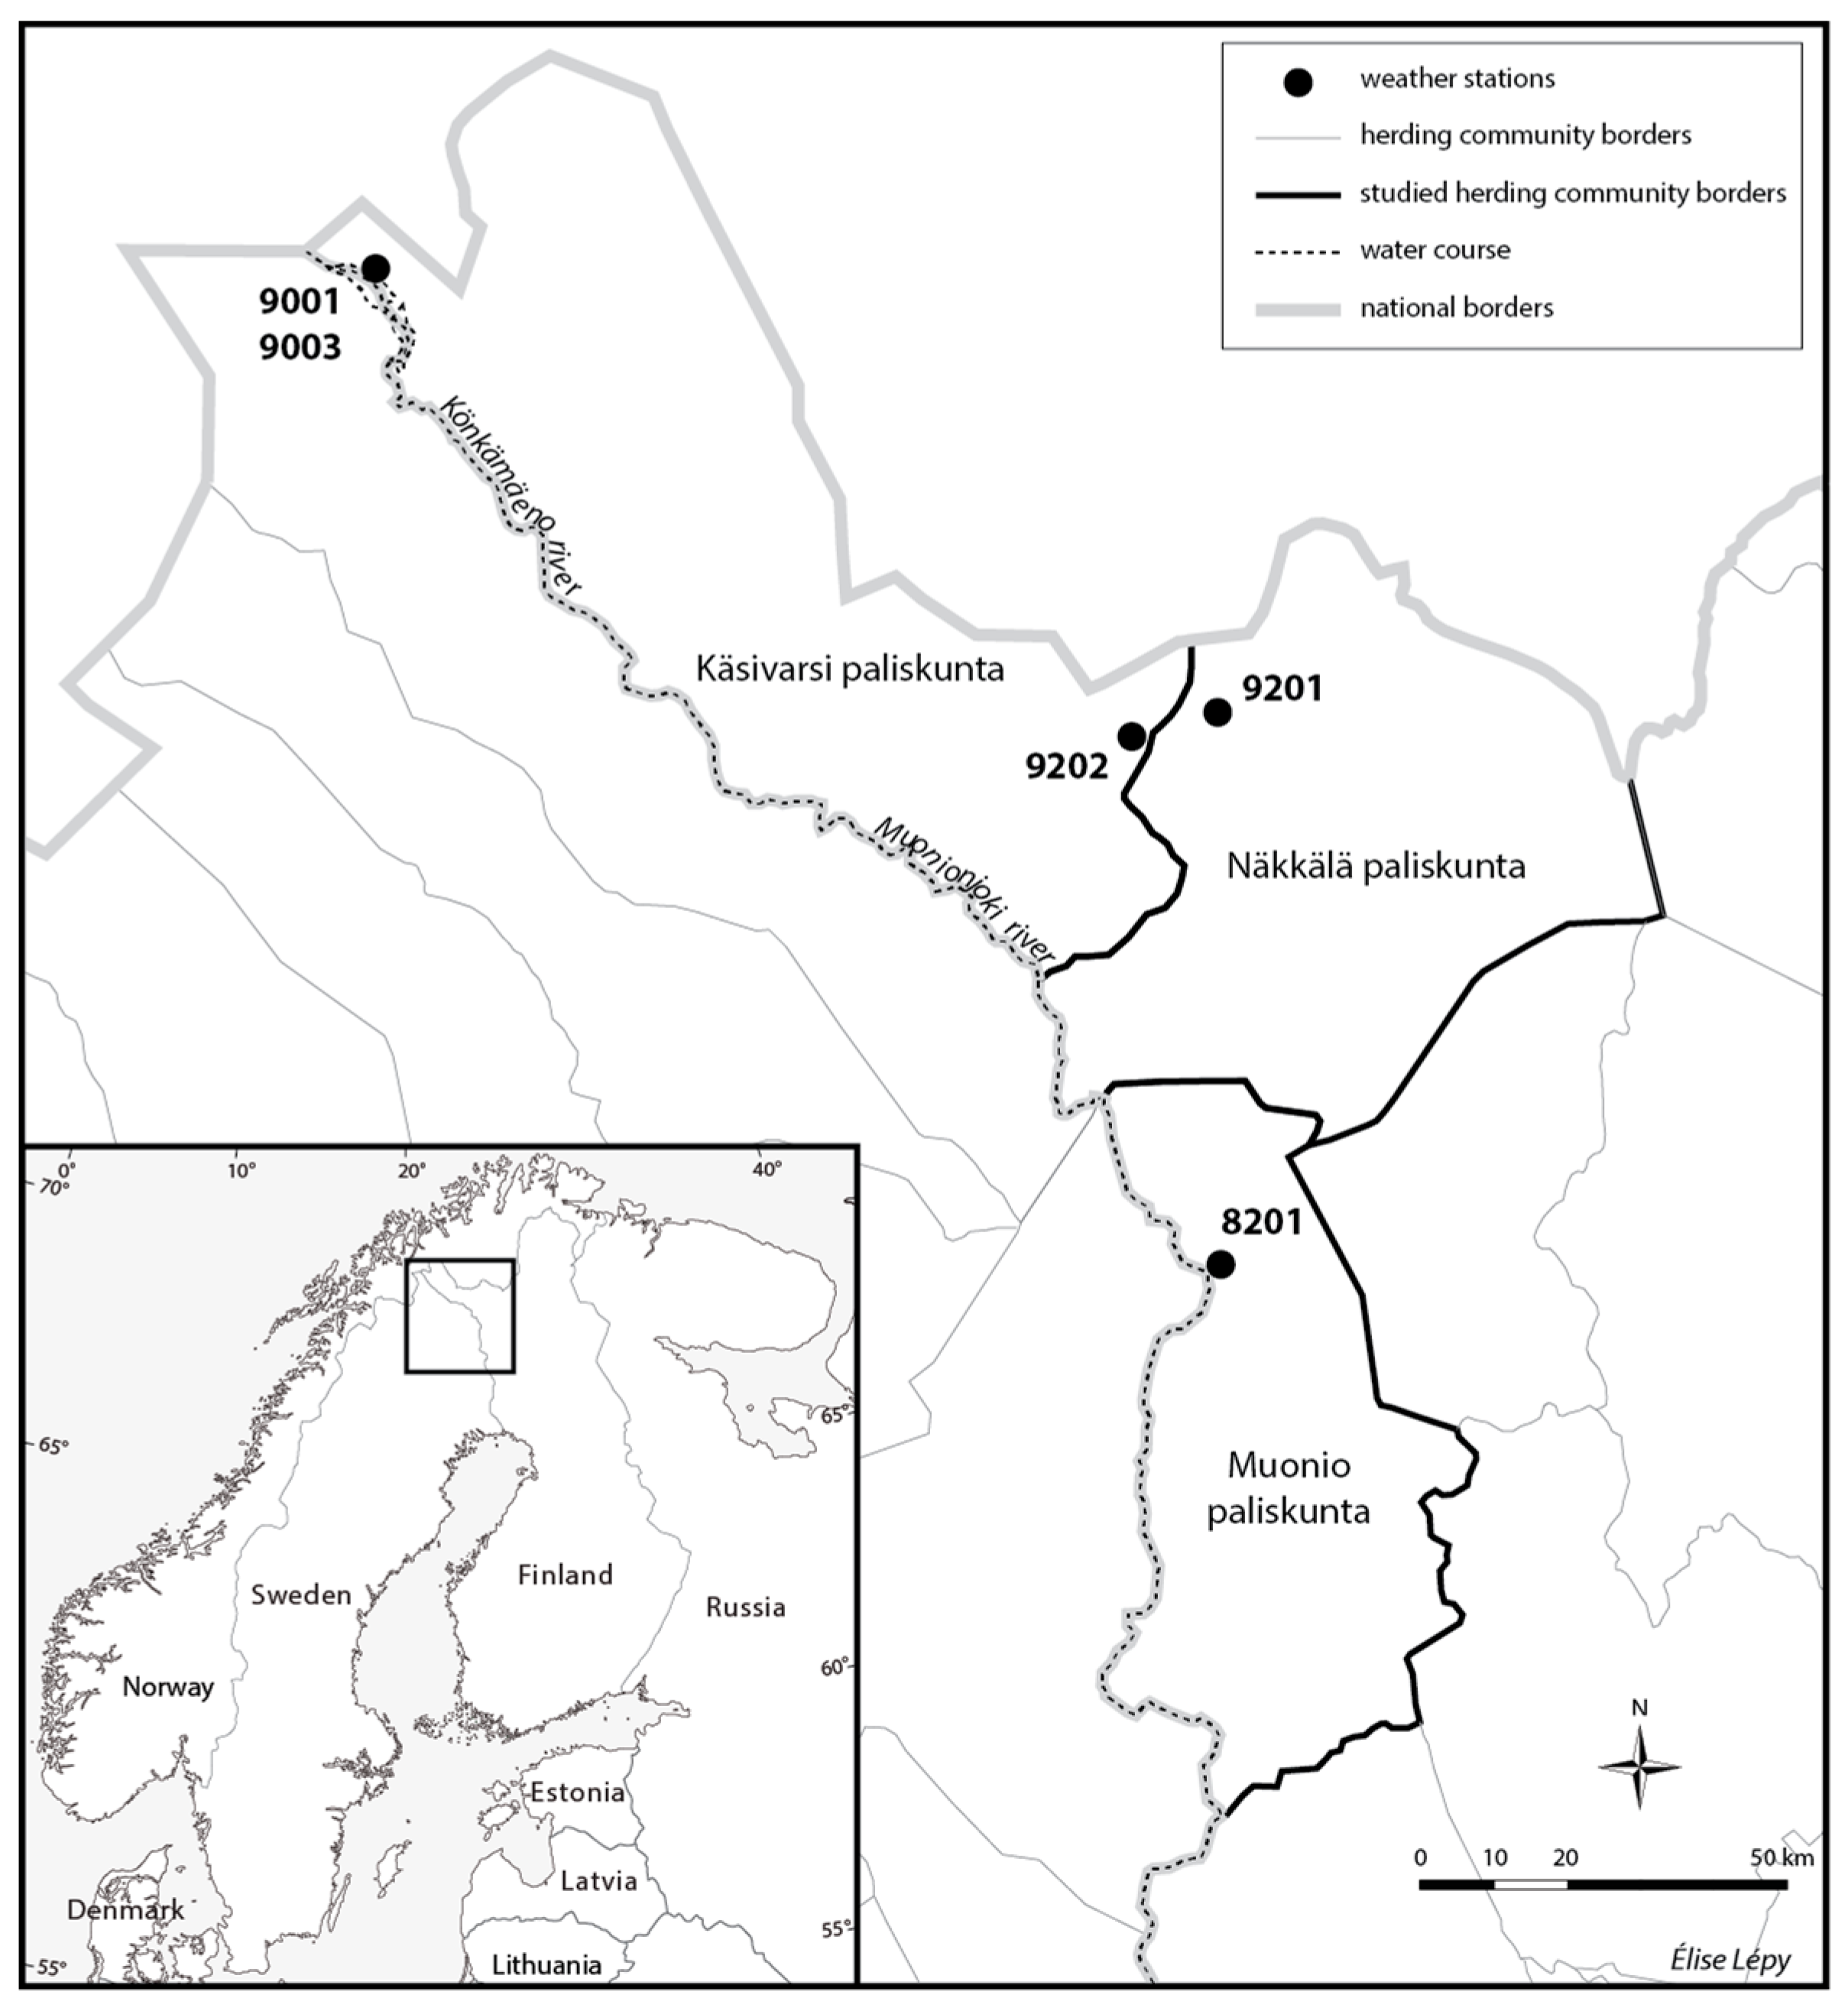
The study area is situated between 67 and 69° N in the Arctic region. Beyond the effects of high latitude, the regional climate is influenced by various geographical factors such as the proximity of the Scandinavian Alps that participates in the formation of the Foehn wind, which affects the distribution of temperatures and precipitation on both sides of the mountain range; the warm waters of the North Atlantic Current, which has a moderate maritime effect on temperatures; the continental landmass located south and east, which allows high pressure systems to drive warm air in summer and cold air in winter [10]; and the spatial distribution of waterbodies, including the Baltic Sea [24]. The study area comprises three reindeer herding cooperatives of Fell Lapland in the North of Finland (Table 1 and Figure 1). More precisely, the Käsivarsi reindeer herding cooperative is partly located in the Scandinavian Alps and offers a tundra landscape where Sámi herders breed around 10,000 reindeer (Reindeer Herder’s Association, n.d.) around the fells under, sometimes, very hazardous weather conditions [19]. Fell mountains are still present in the northern part of Näkkälä reindeer herding cooperative, which is located in the taiga-tundra transition zone. Further south, the boreal forest covers the partially hilly surface of Muonio reindeer herding cooperative, which includes about 6000 reindeer (Reindeer Herder’s Association, n.d.) that migrate around the pine and spruce forests and peat lands of the Muonionjoki River valley [19]. The whole study area is a region where the sustainability of reindeer herding and pasture conditions is at the heart of many debates involving a “complex set of ecological, political, cultural and socioeconomic issues” [25] (p. 141). The vulnerability of reindeer herding livelihood is prone to combined social-ecological pressures [19], whose starting point is often linked to climate change.
By assessing whether there is any evidence of change in climate in Fell Lapland over the last 50 years, the present paper attempts to link global climatic trends with local conditions and respond to the need of information at the local level. In addition, the obtained results from climate and weather data treatment and analysis were used in semi-structured interviews with Finnish and Sámi reindeer herders of Fell Lapland [14,19]. This paper finally aims at assessing the changes in temperature, precipitation and snow cover in Fell Lapland at a regional and local scale, and at determining the climatic trends over half a century in order to anticipate the future evolution.
2. Materials and Methods
The climate datasets used in this study are extracted from three meteorological stations that belonged to the national meteorological network of Finland (the Finnish Meteorological Institute, see Table 1). The stations of Kilpisjärvi, Enontekiö and Muonio were chosen due to their location in the reindeer herding cooperatives of Käsivarsi, Näkkälä and Muonio (Figure 1).
This study focuses on three meteorological variables—the mean air temperatures, total precipitation and snow cover properties—whose variations have considerable effects on the reindeer life cycle and, therefore, on reindeer herding activities. In fact, air temperature is a crucial parameter for reindeer herders as warm springs affect the end of the hibernation period of predators, warm summers and autumns make reindeer physiologically stressed, and frost and thaw cycles alter the reindeer digging for lichen and thereby feeding [13,14,19]. The combination of low air temperatures and precipitation can have a very negative effect on winter-feeding conditions; on the other hand, high moisture rate is essential in autumn for the growth of mushrooms, part of the reindeer diet [13]. Finally, snow cover properties are a key element for reindeer seasonal migrations [26], for the accessibility to ground lichen [22,23,27,28,29] and for the calving period [13].
Daily data for each variable for the common reference period 1960–2011 (year 1982 is missing) were analysed for determining the regional homogeneity, the interannual and seasonal variability, and the cold intensity.
2.1. Analysing the Regional Homogeneity
The Pearson correlation coefficients was calculated to analyse the regional homogeneity of the three meteorological variables: the mean air temperatures (annual, winter, spring, summer and autumn mean temperatures), the precipitation (total precipitation in the year, winter, spring, summer and autumn precipitation), the duration of permanent snow cover in number of days (longest snow cover with a minimum thickness of one centimetre), and the maximal snow depth in centimetres. This analysis is an indicator to determine if data is homogeneous within the study area and therefore will be treated at the regional level (regional climate variability); or heterogeneous and will be treated at the local level (local climate variability).
2.2. Analysing the Interannual and Seasonal Variability
The analysis of the interannual and seasonal variability of the three selected meteorological variables at a regional or local scale was conducted in order to outline some climatic trends. Anomaly data were calculated and used to easily compare the different meteorological stations. The anomalies represent the deviations from the 1960–2011 average temperature, average of total precipitation and average length (number of days) of permanent snow cover with a thickness of at least one centimetre, for each site.
We also inspected the existence and location of a significant change point in the annual temperature variation utilising the Lepage test [30], that is, a nonparametric location-scale test that detects significant differences between two samples. Here, the first sample consists of the temperatures before or at the change point and the second sample consists of the temperatures after the change point. As the location of the change point is not known in advance, the Lepage test statistic is computed for each year, and the maximum of the absolute values of the standardised statistics is used as test statistics whose distribution is estimated by simulation [31]. The test was conducted using the R software [32] package cpm [31].
At the regional scale, the climate variability is studied in correlation with two atmospheric circulation patterns, the North Atlantic Oscillation (NAO) and the Arctic Oscillation (AO), in order to show the possible impacts of larger scale atmospheric phenomena on the variability of the mean air temperatures in Fell Lapland. Whereas the NAO is characterised by a dipole in the atmospheric pressure at sea level between the Azores high and Iceland low [33,34,35], the AO “can be interpreted as the surface signature of modulations in the strength of the polar vortex aloft” [36] (p. 1297). Both patterns can be measured through the NAO and AO indices. The annual NAO and AO indices have been calculated from the monthly mean NAO and AO indices obtained from the online data sets of the Climate Prediction Centre of NOAA [37]. Correlations between the monthly average temperature anomalies and the monthly NAO and AO indices were calculated for the period 1960–2011. At the local scale, the climate variability is examined at interannual and seasonal time scales by displaying the variations in anomalies of variables for Kilpisjärvi, Enontekiö and Muonio. For some of the charts, the first (Q1) and third (Q3) quartiles were calculated in order to detect extreme cases.
2.3. Analysing the Cold Intensity
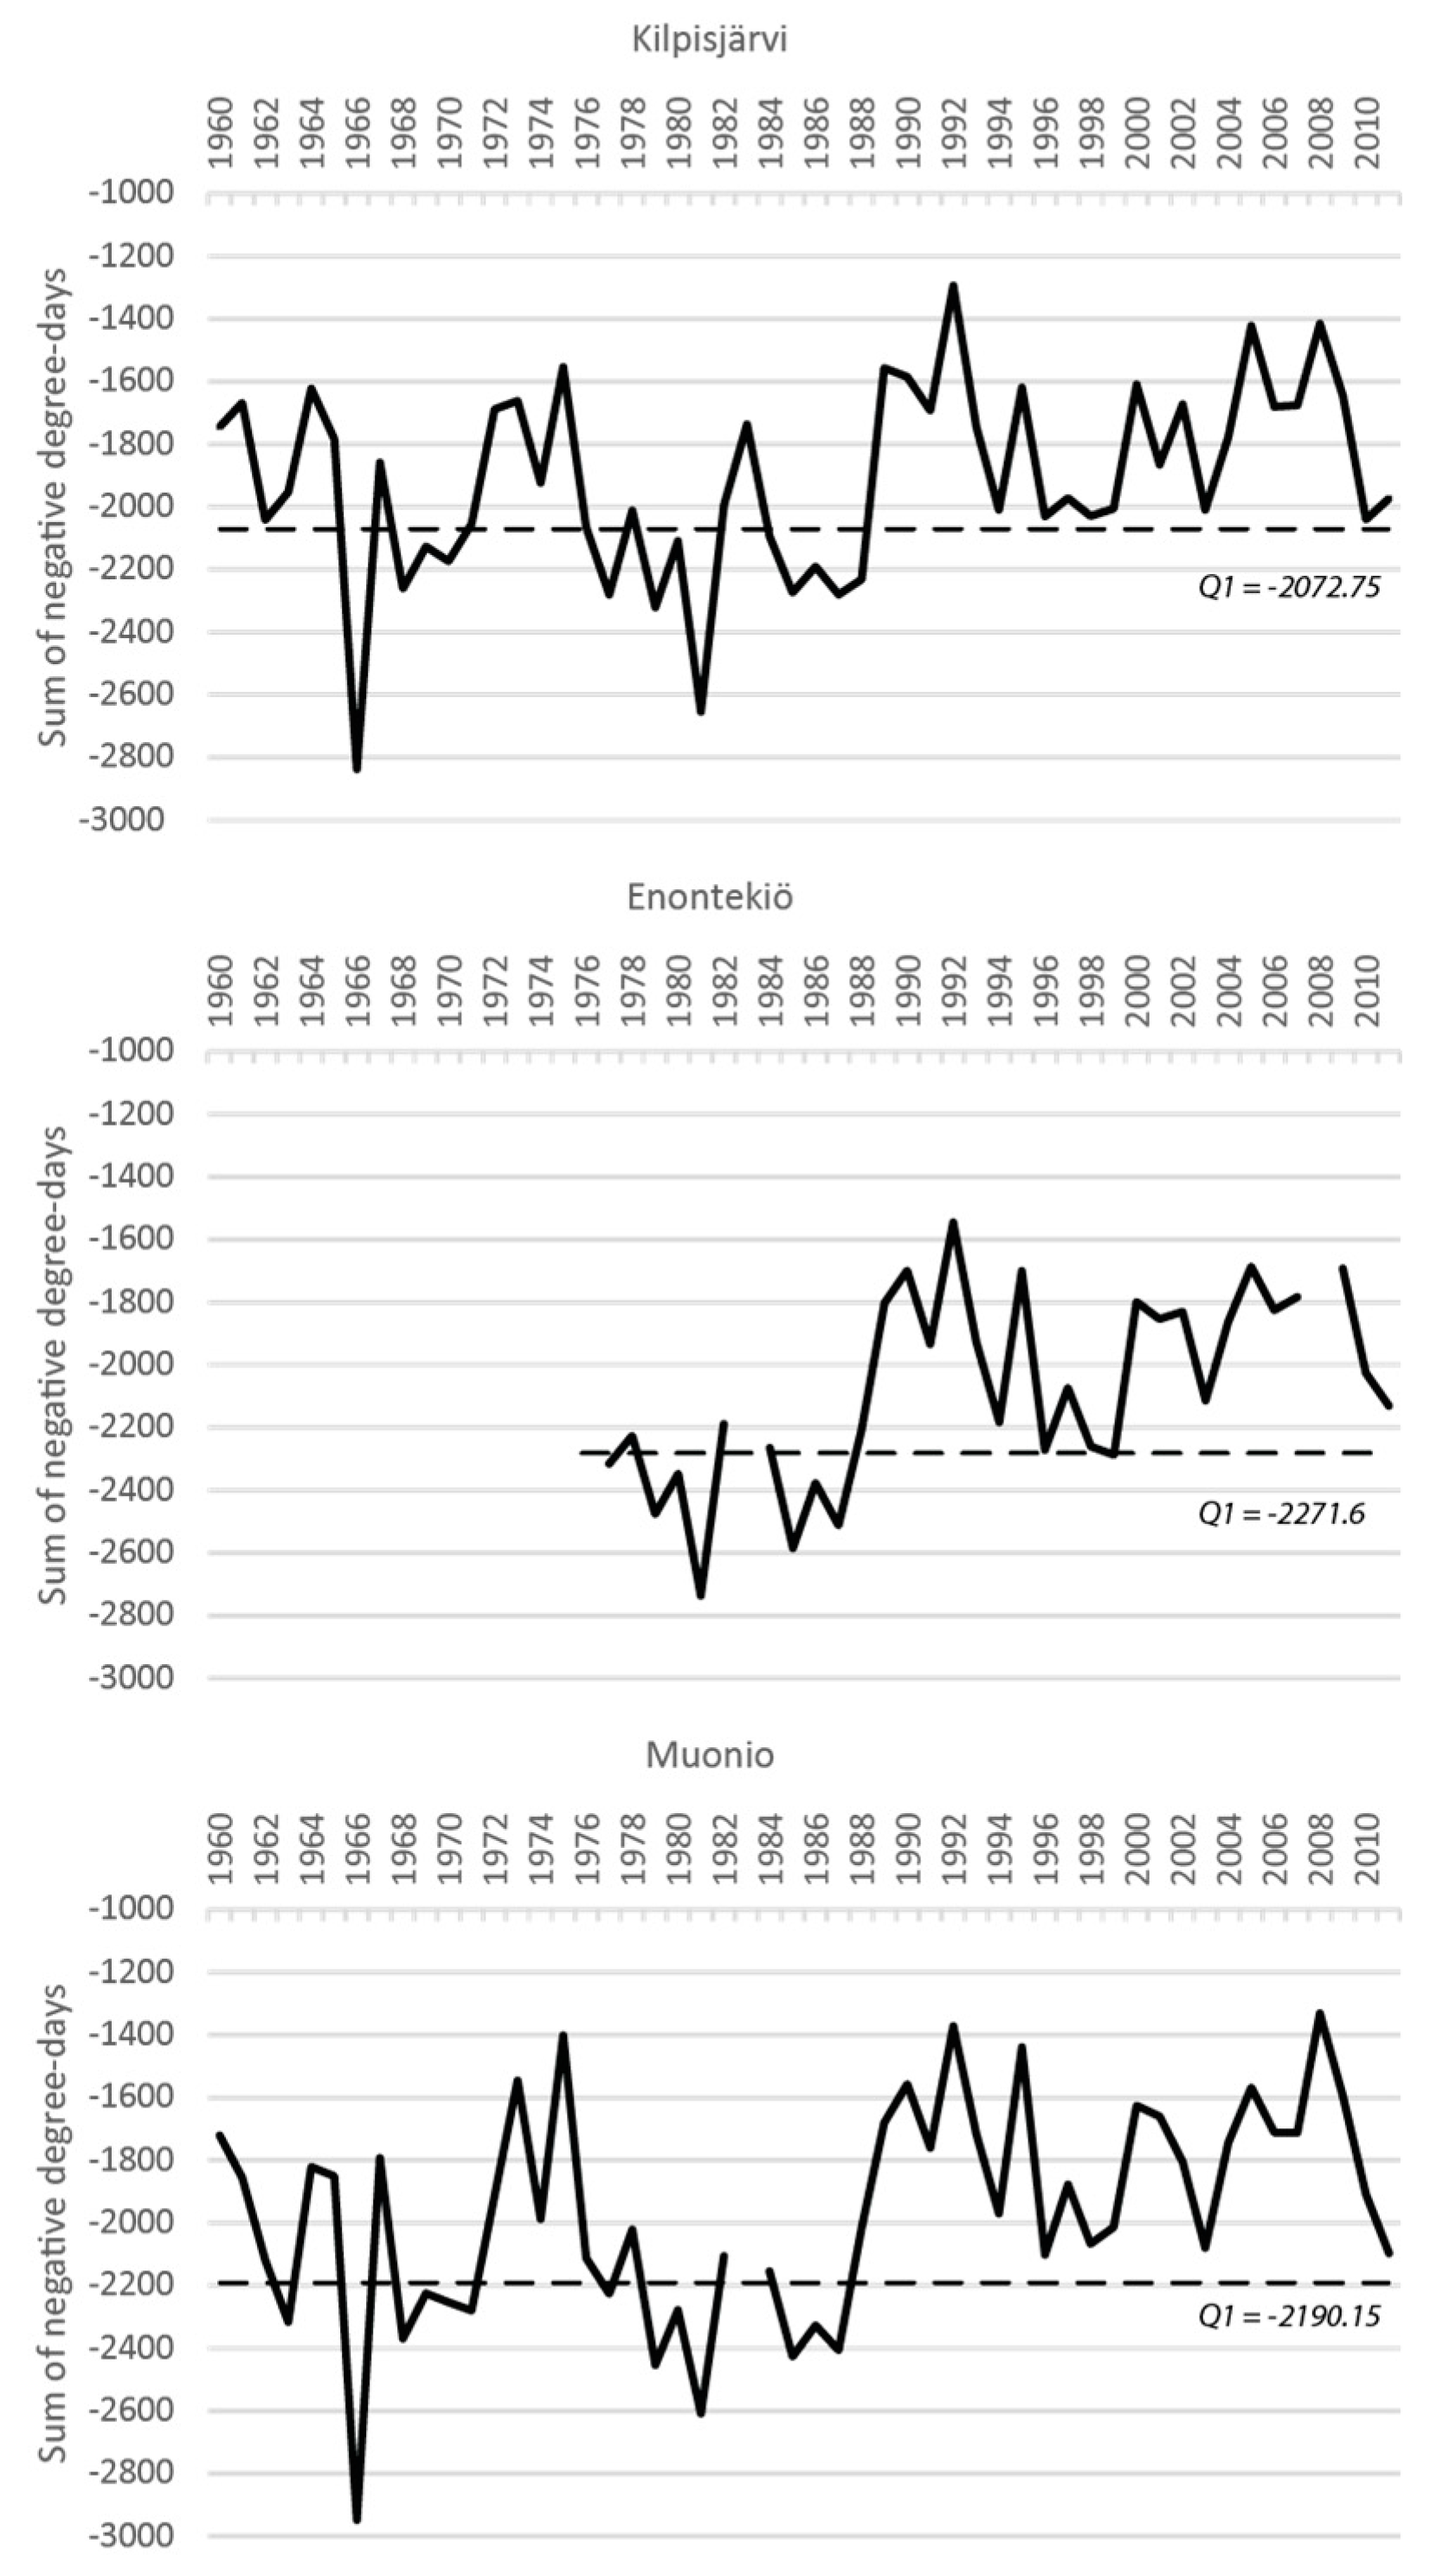
The negative sum of degree-days and the number of frost and thaw cycles were determined to analyse the intensity of the cold, which is an essential parameter for reindeer herding. The season starts on 1 July and ends on 30 June. The first quartile (Q1) was calculated for each of the three stations.
When analysing data by seasons, the four seasons are referred as follow: December, January and February for the winter; March, April and May for the spring; June, July and August for the summer; September, October and November for the autumn. Data is analysed for the available years; some years are missing sporadically.
3. Results
3.1. Regional Climate Homogeneity
In order to determine if the regional climate of Fell Lapland is spatially homogeneous, the relationship between the three meteorological stations of Kilpisjärvi, Enontekiö and Muonio is analysed by performing various regression analyses. Shown in Table 2, the Pearson correlation coefficients were calculated for the three major variables of the local climate (the numbers with the highest correlation coefficients are in bold).
Explained by the latitudinal location of the station, it was found that Kilpisjärvi is slightly colder than Enontekiö and Muonio with a mean annual temperature anomaly between Kilpisjärvi and Enontekiö of −0.05 °C and between Kilpisjärvi and Muonio of −0.91 °C. Nevertheless, the lower degree of continentality of Kilpisjärvi (24.48 °C) indicates that the presence of the warm waters of the North Atlantic Current is felt a bit more prominently there than in Enontekiö (27.33 °C) and Muonio (28.73 °C), although the observed average temperature is colder. Overall, although small disparities in temperatures exist between the three sites, the temperature varies similarly seasonally and annually (Table 2) and mean temperatures at the three sites are highly correlated (r > 0.9).
There was a modest regional heterogeneity in the distribution of precipitation (455.81 mm/year of average total precipitation for the period 1960–2011 at Kilpisjärvi, 443.14 mm/year at Enontekiö, and 489.42 mm/year at Muonio) and the existence of disparities in the precipitation variability. Table 2 shows that the three sites are moderately correlated annually and seasonally with the exception of the summertime (0.63 < r < 0.83). Again, Muonio and Enontekiö show the closest relationship.
Permanent snow cover revealed fairly strong correlations (r > 0.58) though not as high as the mean temperatures, it was found that Kilpisjärvi was poorly correlated to the two other sites concerning the maximal snow depth (r = −0.053 with Enontekiö and r = 0.296 with Muonio).
Overall, the results show a very close relationship between the stations for the temperatures and a weaker one for precipitation and snow conditions.
Based on those results, the temperature variability can be studied at a regional scale by using the mean temperatures of Kilpisjärvi, Enontekiö and Muonio meteorological stations (Section 3.2). On the other hand, disparities in precipitation and snow cover between the three sites are great enough that their variability must be examined at a local scale, that is, site by site (Section 3.3).
3.2. Regional Climate Variability
3.2.1. Annual Temperature Variability
An examination of the annual temperature variability and anomalies of the three sites shows that there is a slight discernible warming trend from 1960 to 2011 (Figure 2), the average annual temperature for 1960–2011 being −1.82 °C. More specifically, there appears to be a temperature shift from colder to warmer temperatures at the end of the 1980s. To confirm this shift, we performed a test based on the Lepage statistic that detected a statistically significant change point in the time series of temperature. Indeed the absolute values of standardised Lepage statistics show a peak in the year 1988 on a significance level of 0.01 (Figure 2a). The mean temperatures of the colder (from 1960 to 1988) and the warmer (from 1989 to 2011) periods are, respectively, −2.37 °C and −1.17 °C. The two periods are also discernible by the number of extreme years represented by the 25% of coldest (<Q1) and warmest years (>Q3). Indeed, the period 1960–1988 recorded the coldest annual temperatures (nine years < Q1 and none for the period 1989–2011) and the period 1989–2011 most of the warmest ones (10 years > Q3 and only two for the period 1960–1988).
3.2.2. Seasonal Temperature Variability
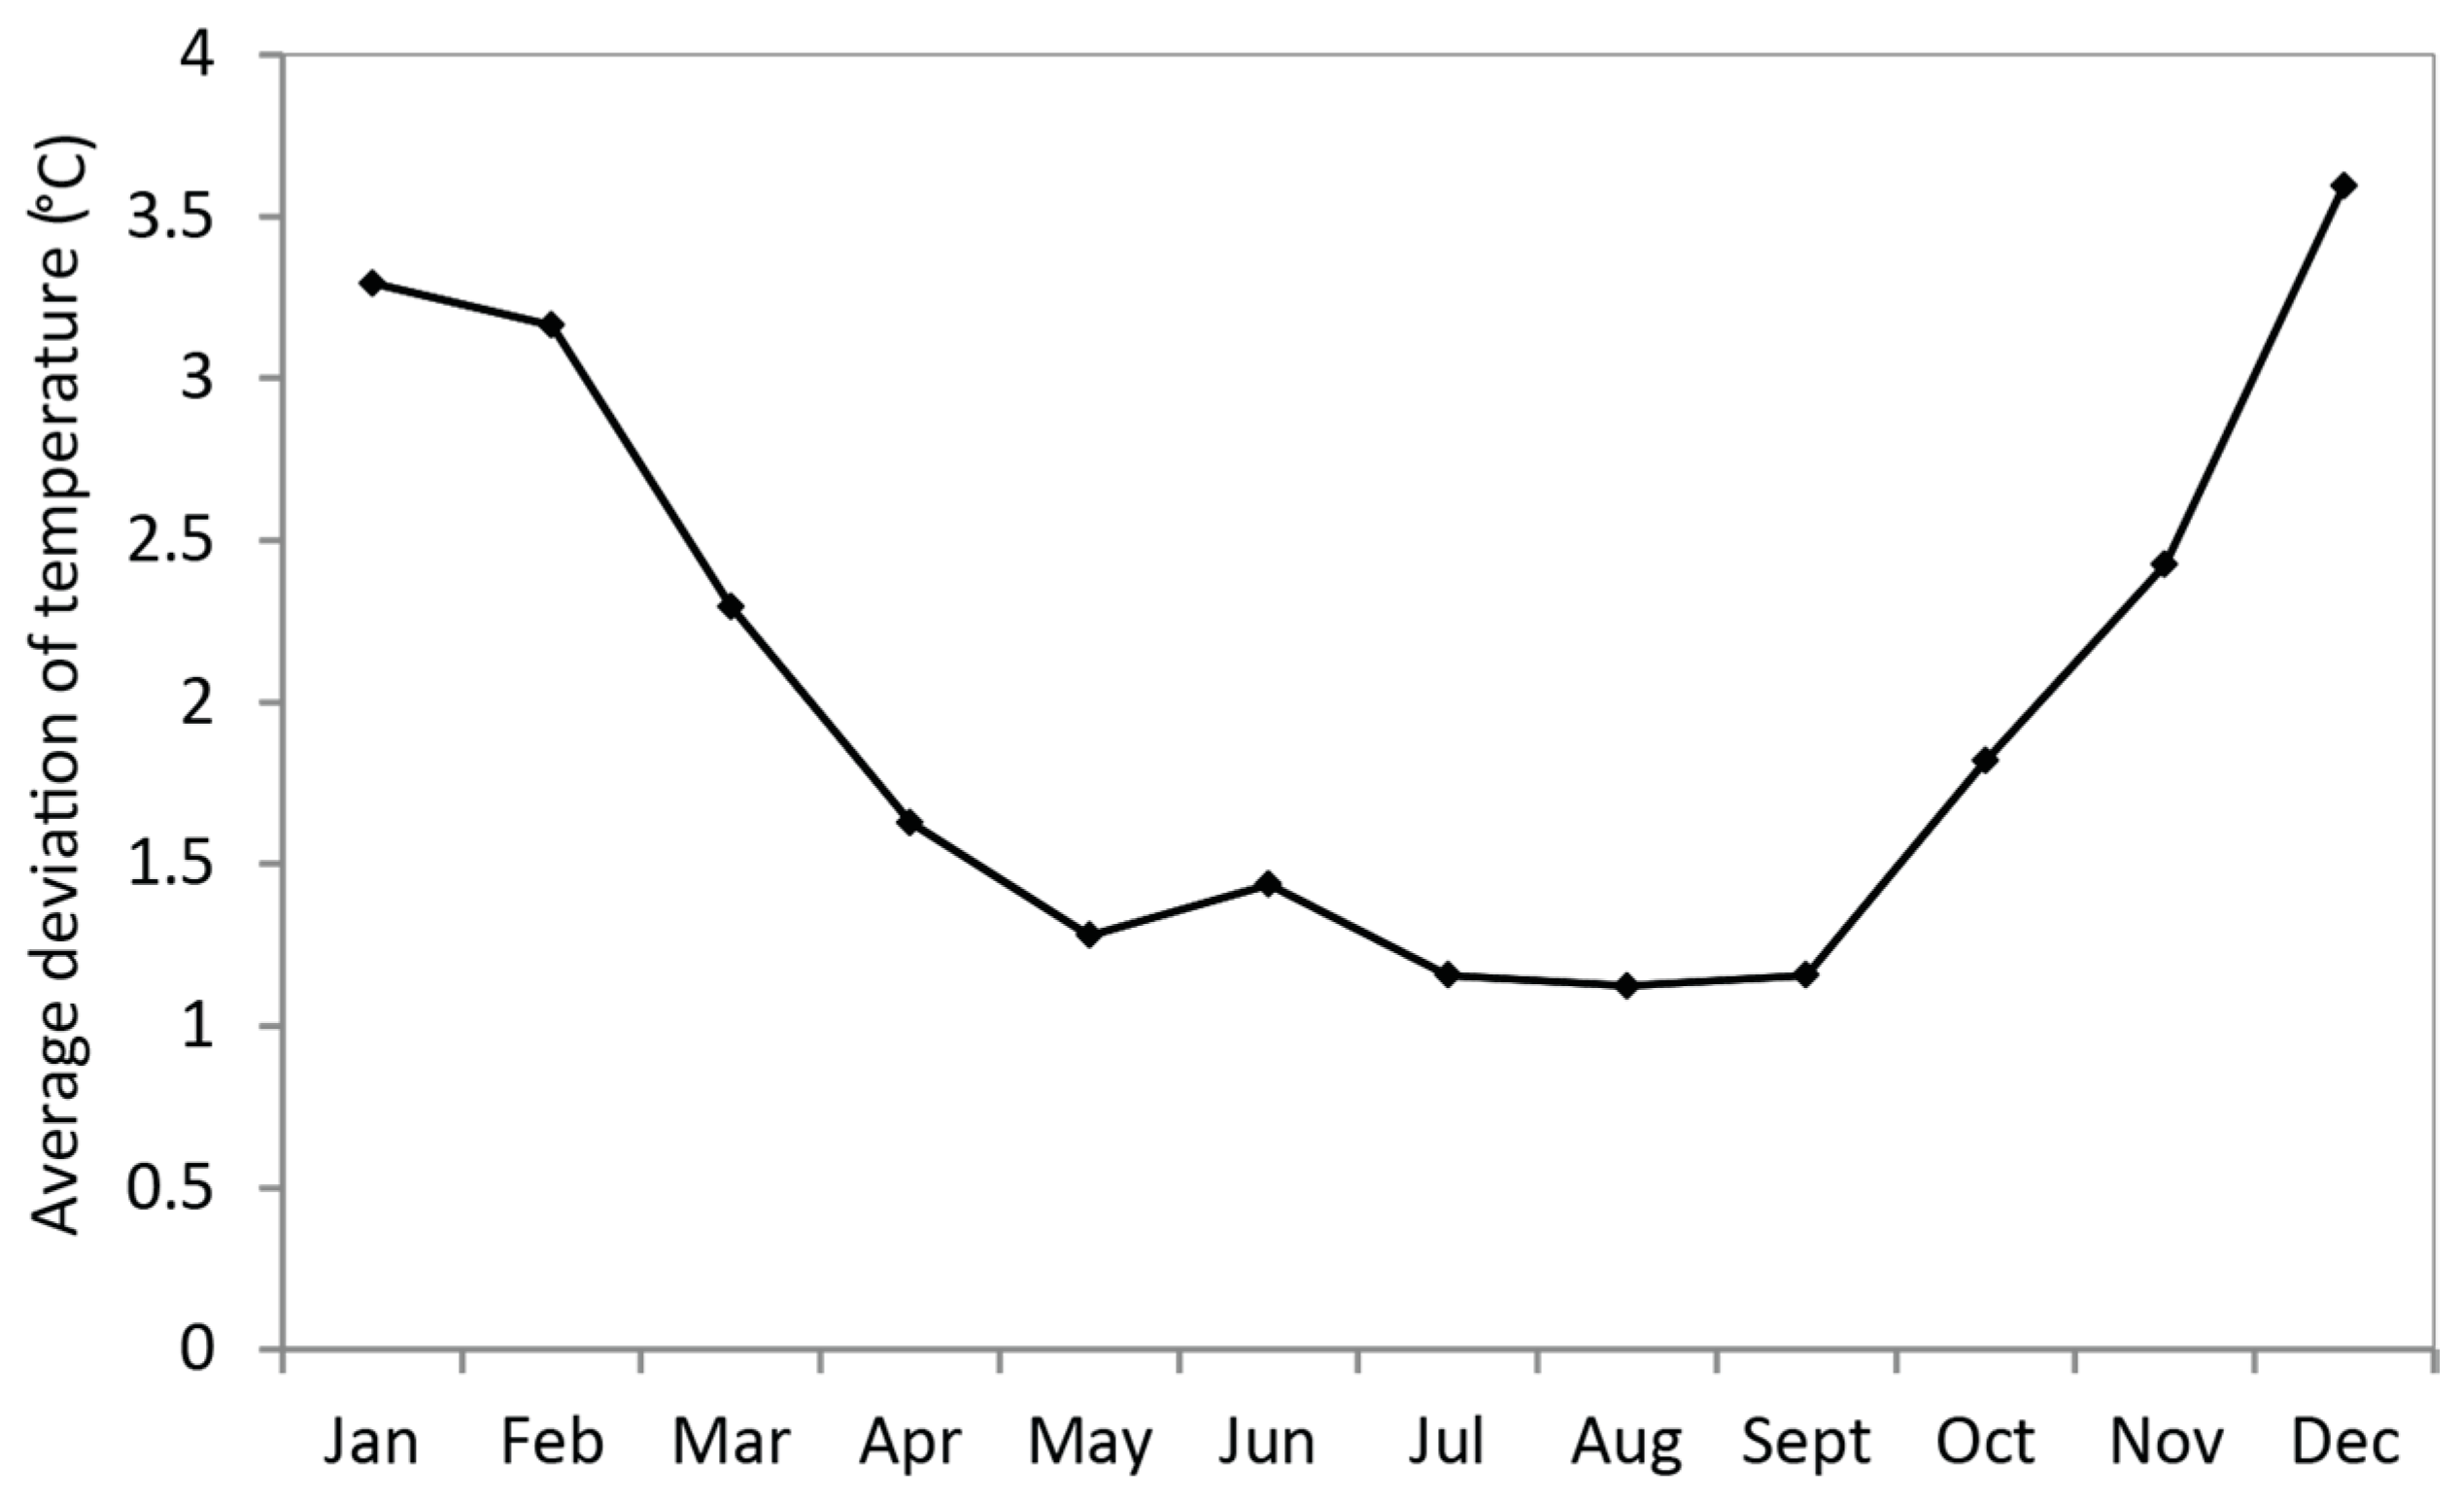
Results show that the temperature anomalies are greater during the coldest season (from November to March), that is, a quite high variability with a maximum in December, January and February (Figure 3). On the other hand, the warmest season (from April to October) is represented by weaker fluctuations.
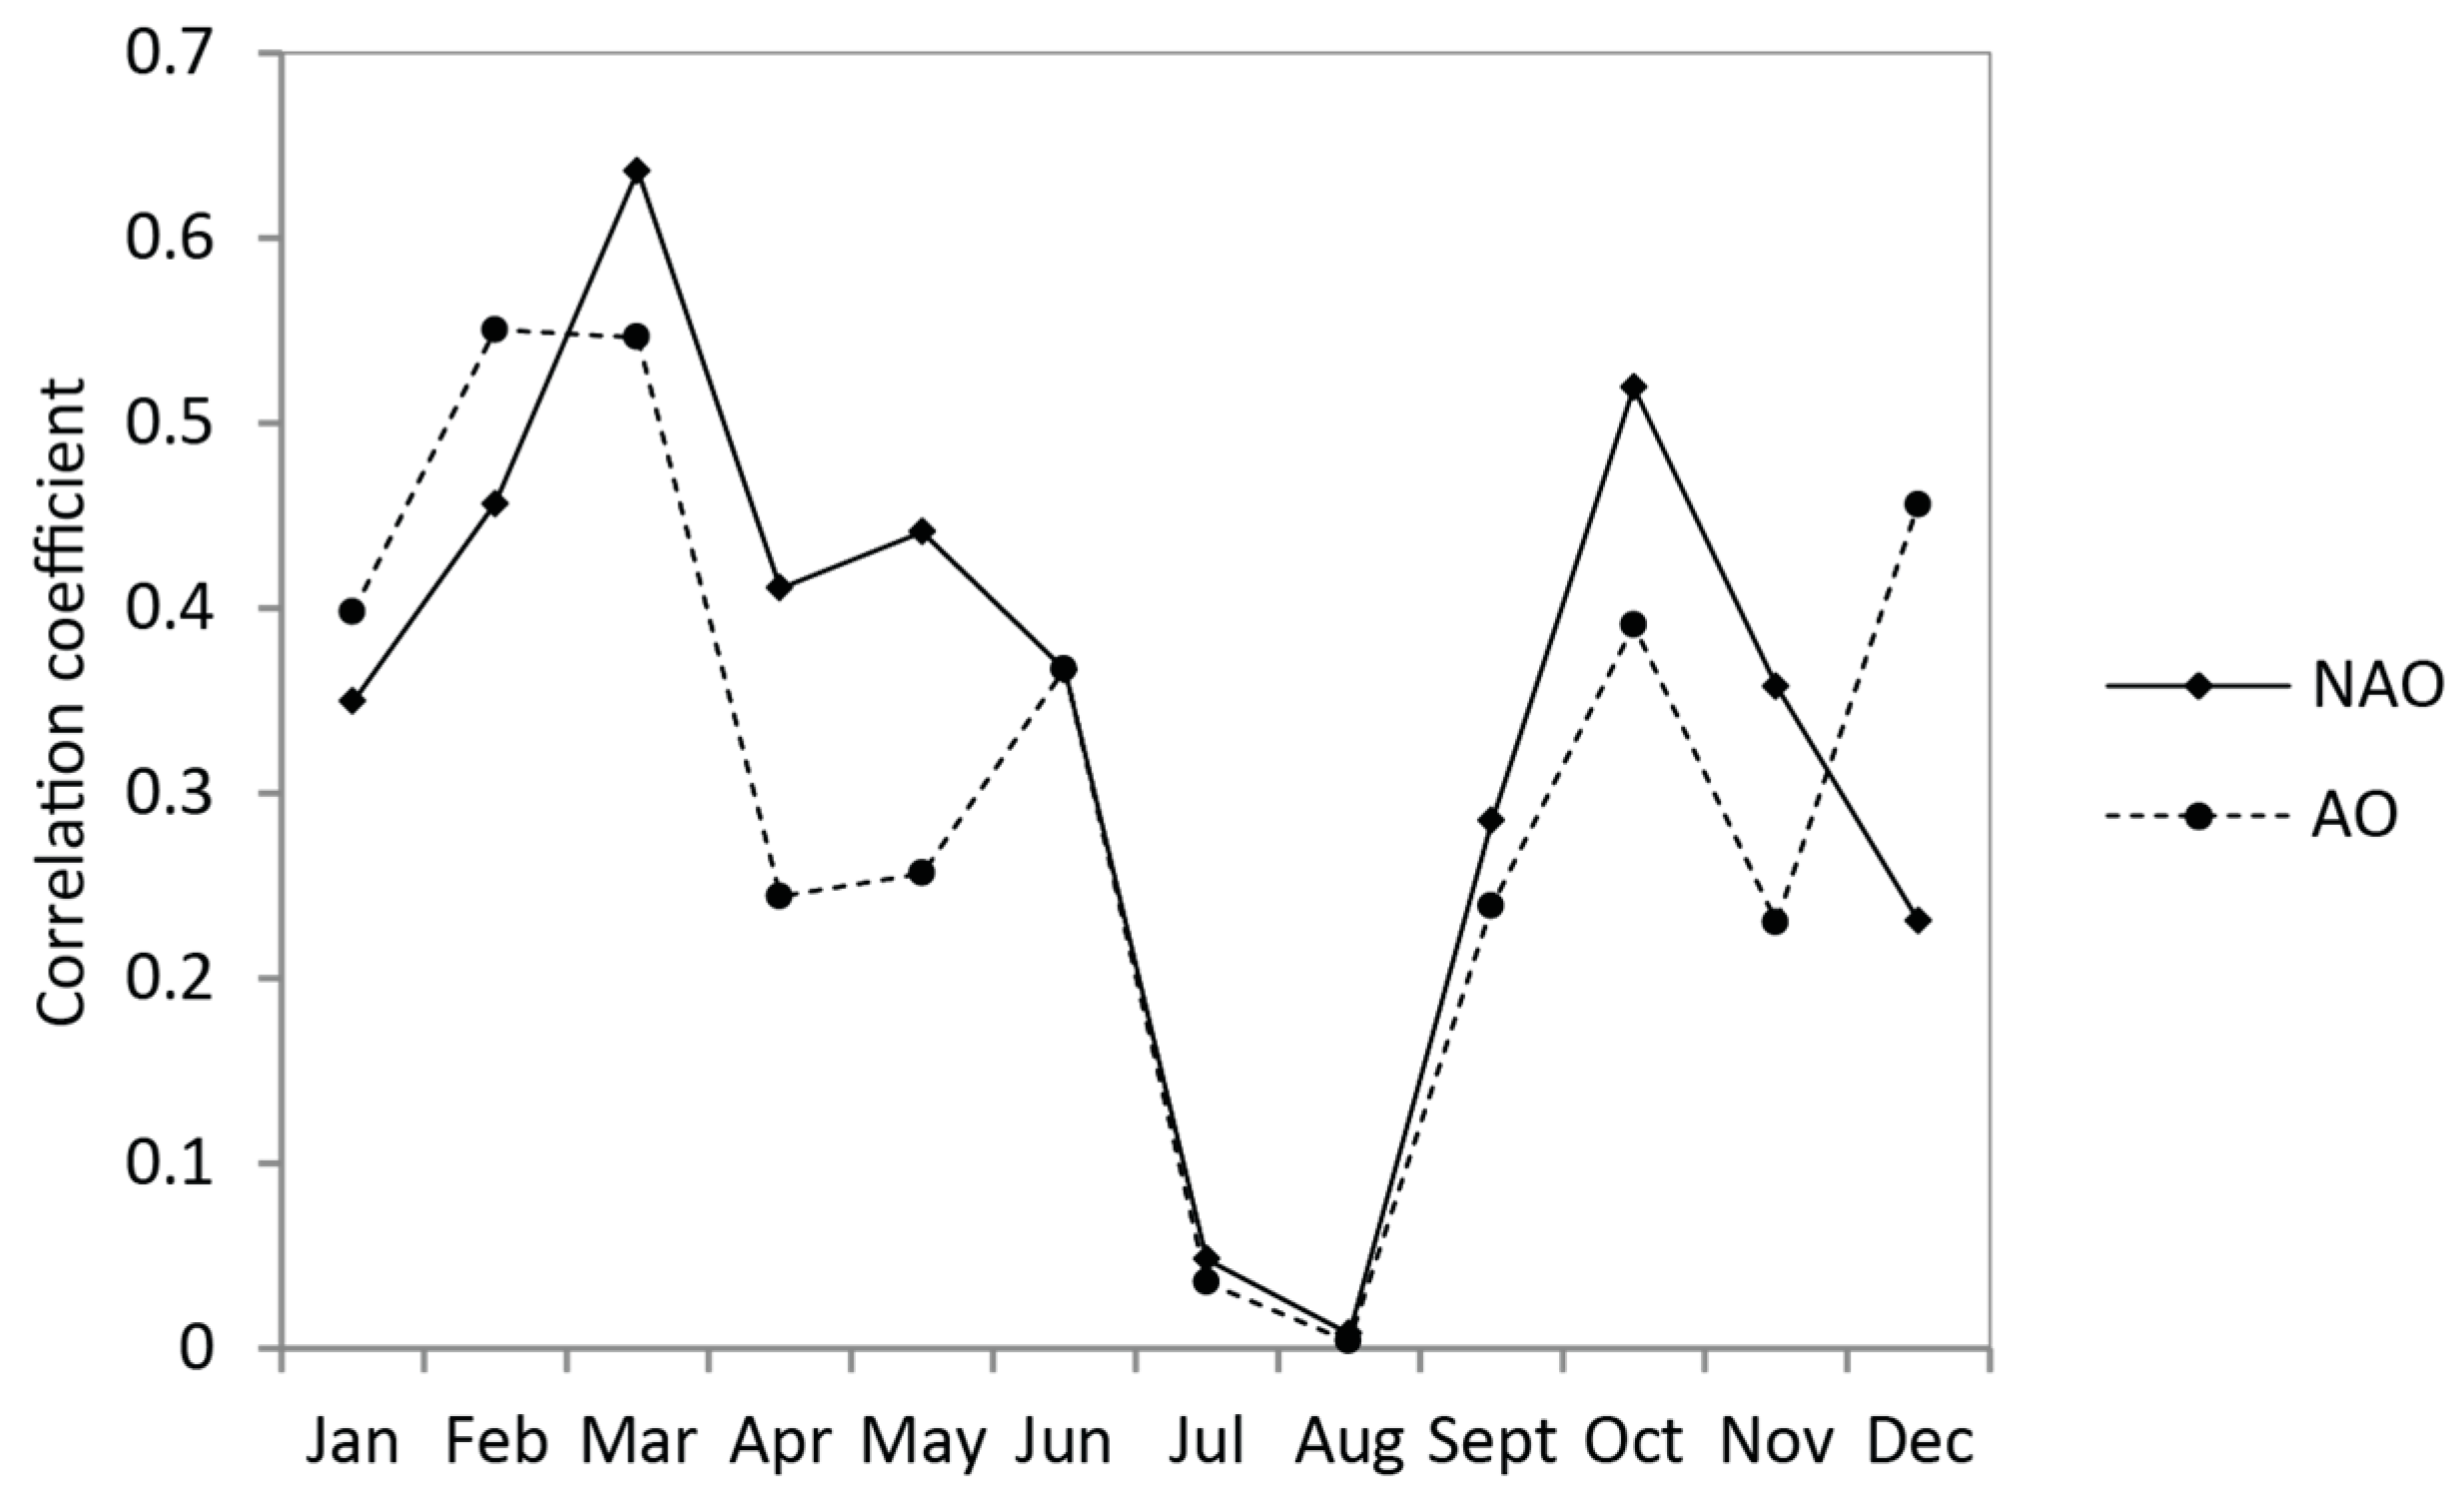
Both atmospheric patterns have a greater influence on temperature variations during the cold months in Fell Lapland with a maximum reached in March (Figure 4). Nevertheless, the AO index is slightly more associated with temperature variations than the NAO in winter.
3.3. Local Climate Variability
3.3.1. Interannual Variability of Precipitation and Snow Cover
With the lowest average amount of precipitation for the period 1960–2011, Enontekiö has the particularity of showing certain variability without a clear trend (Figure 5). On the other hand, the annual anomalies of total precipitation of the sites of Kilpisjärvi and Muonio show a clear trend: most of the negative anomalies, meaning that it rained less than the average, occurred before 1988; and after that most of the years have shown a net tendency to receive more precipitation. The calculations of the first and third quartiles also confirm these tendencies: the period 1961–1988 recorded the driest years (11 years < Q1 for Kilpisjärvi and only two years for the period 1989–2011; 10 years < Q1 for Muonio and only three years for the period 1989–2011) and 1989–2011 the wettest ones (10 years > Q3 for Kilpisjärvi and only three years for the period 1960–1988; 10 years > Q3 for Muonio and only three years for the period 1960–1988).
Concerning the number of days of permanent snow cover, the average number of days gets higher northwards, namely, 217 days in Kilpisjärvi against 201 days in Muonio (Figure 5). The latitudinal positions clearly explain the differences in duration of snow cover. None of the sites shows a discernible trend but instead an irregular succession of positive and negative anomalies. At Kilpisjärvi, Enontekiö and Muonio, the snow cover has had the tendency to last, respectively, 8, 7 and 9 days shorter since the beginning of the 21st century compared to the period 1960–2000.
3.3.2. Seasonality of Interannual Variability in Precipitation
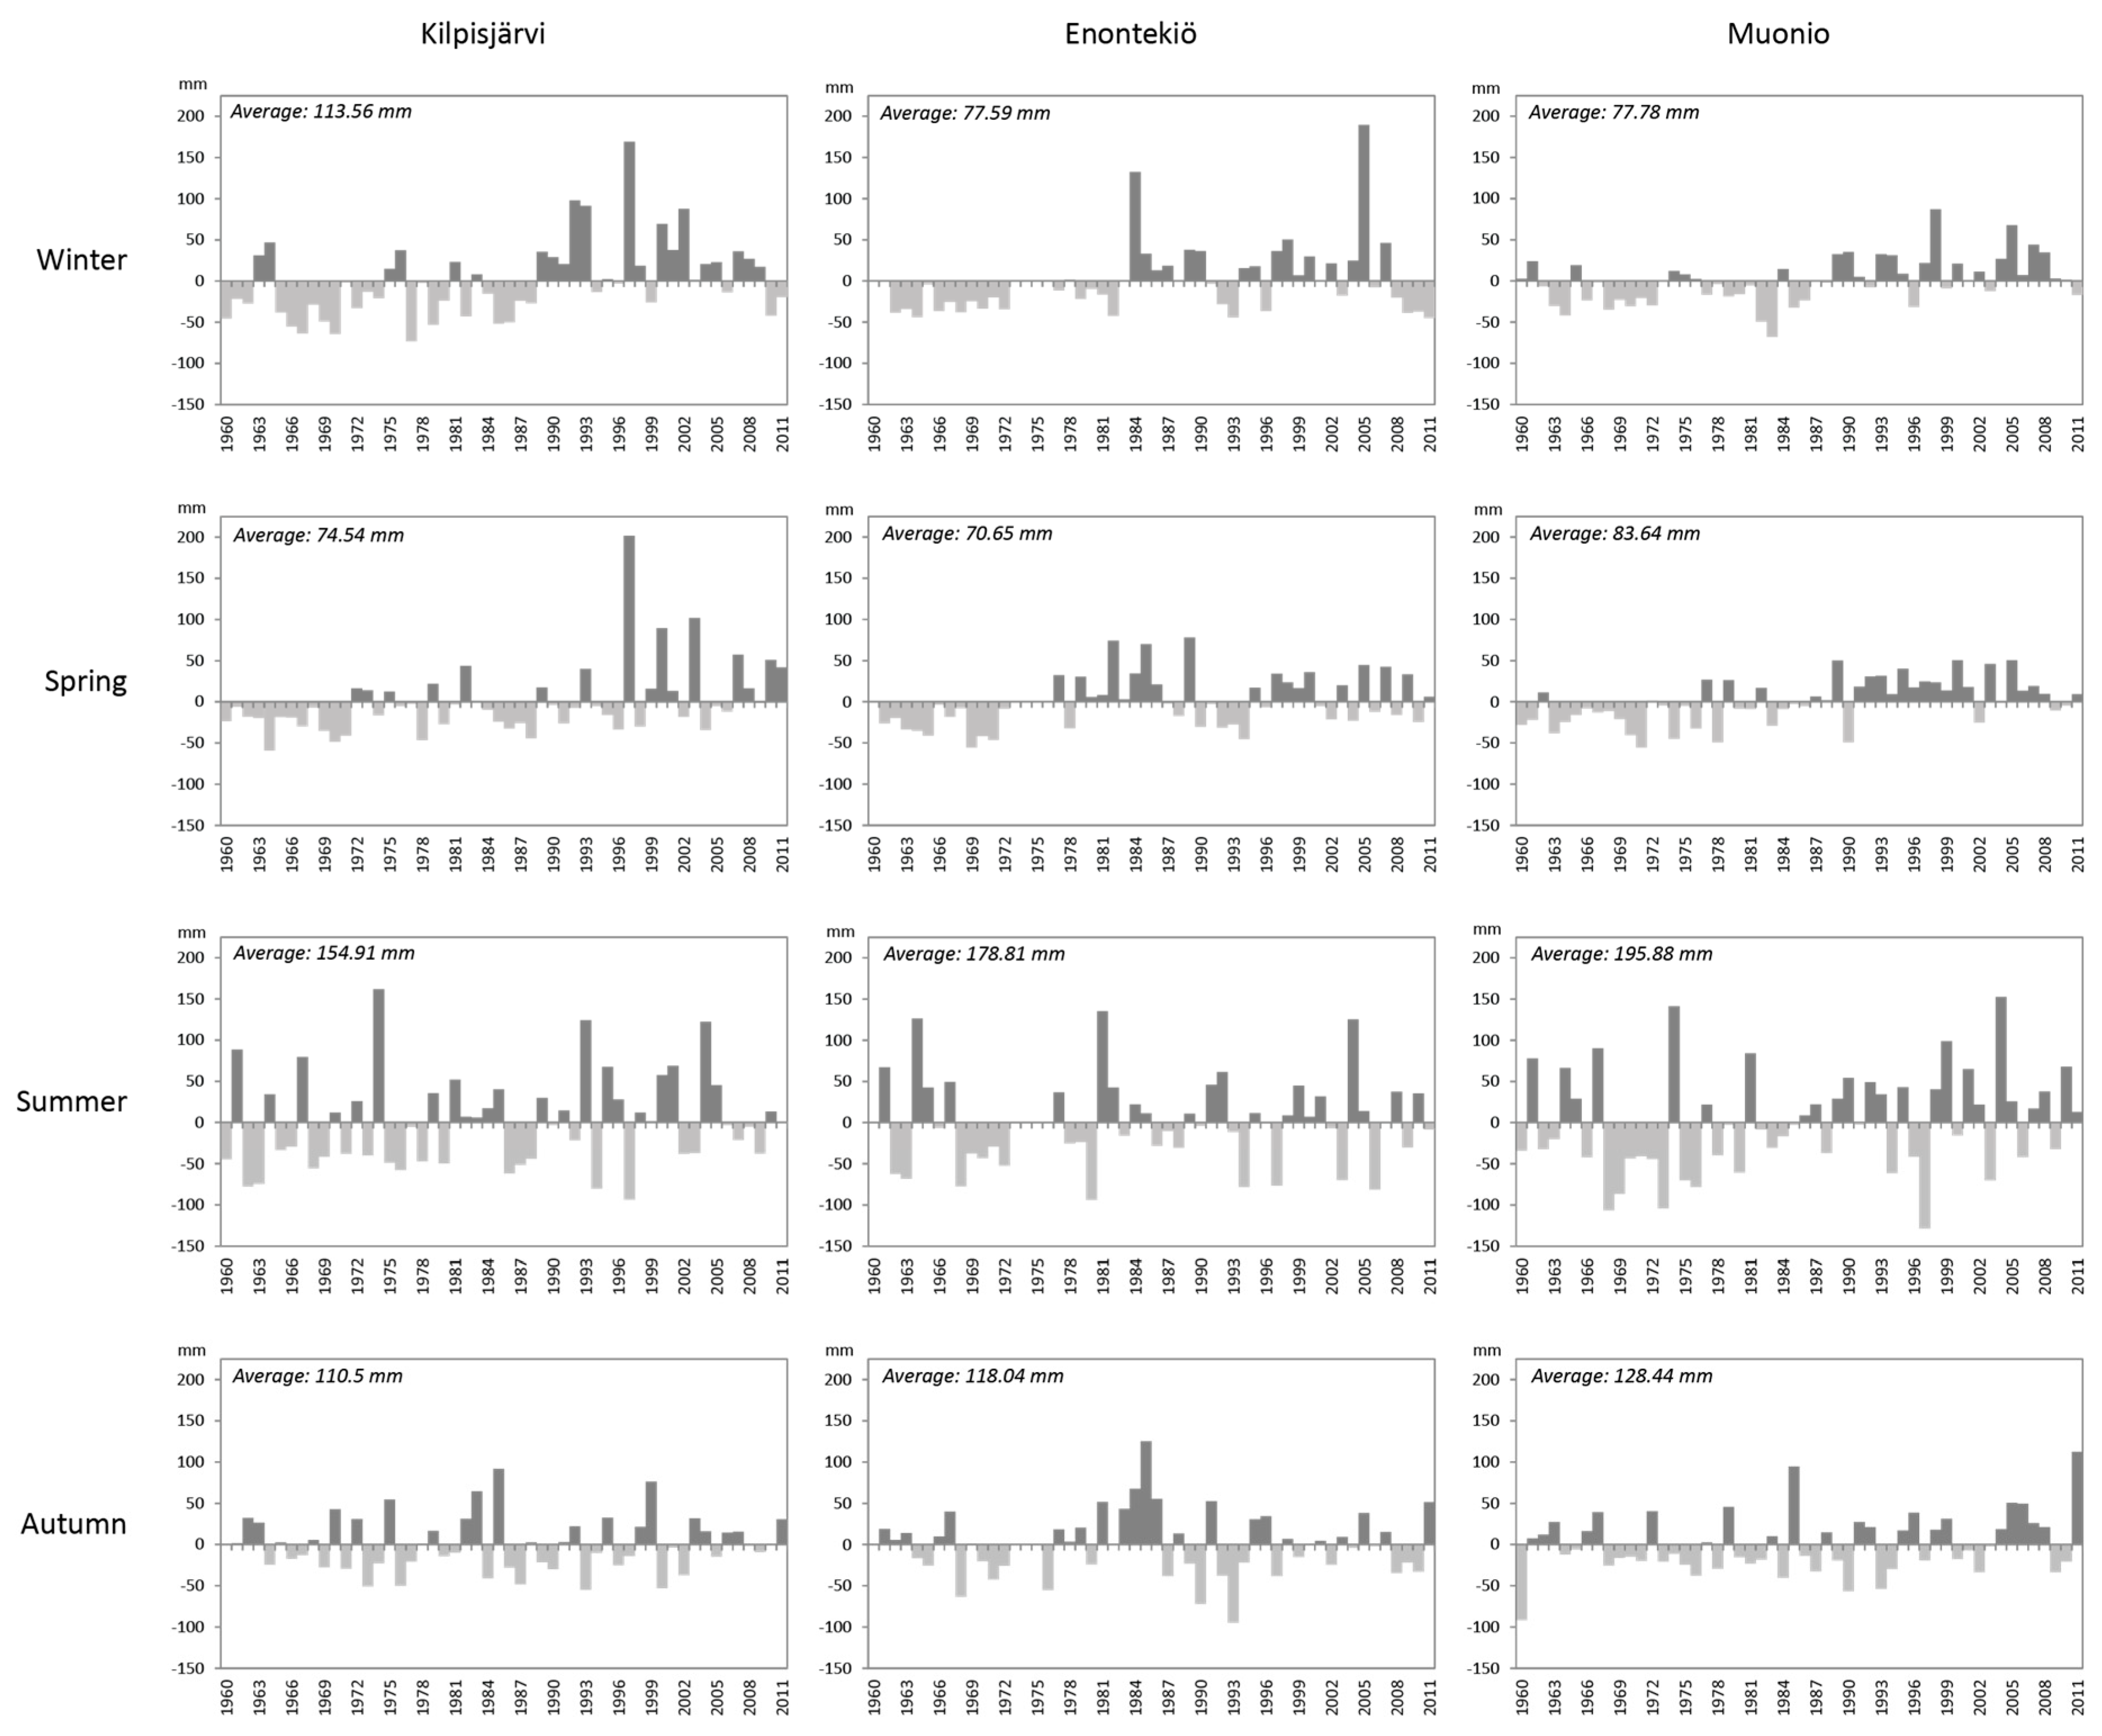
Results from the annual anomaly of precipitation for the four seasons at Kilpisjärvi, Enontekiö and Muonio reveal two main points (Figure 6). First, the site of Muonio is the one which records the largest amount of precipitation for all seasons except for the winter (Kilpisjärvi). Then, the summer precipitation is the most important for the three sites for the period 1960–2011: on average 154.91 mm for Kilpisjärvi, 178.81 mm for Enontekiö and 195.88 mm for Muonio; the driest season is the spring with, respectively, 74.54 mm, 70.65 mm and 83.64 mm.
Concerning the seasonal variability of precipitation, it can be observed that the amount and amplitude of fluctuations differ from site to site and from season to season:
- In the winter, the amplitude of the anomalies, especially positive ones, has increased with the time for all cases, even though it is more visible for Kilpisjärvi. For the three sites, two distinct periods are discernible: the first one from the 1960s to the end of the 1980s (a bit earlier for Enontekiö, mid-1980s), annual anomalies were mostly negative meaning less precipitation; and the second one from the late 1980s onwards, annual anomalies have been positive at the exception of the late 2000s. This increase in average amount of precipitation needs to be interpreted in concordance with temperature trends meaning that the share of rainy precipitation has probably grown at the expense of snowfall.
- In general, the variability of spring precipitation is quite low with the exception of the last decade in Kilpisjärvi. However, for the three sites, the first positive anomalies have been recorded in the 1970s and, since then, they have been much more frequent than the negative ones, meaning that springs get slightly wetter.
- The summer is the most variable season in terms of precipitation, and this is the case in the three case studies. The similarity of the variability of the three stations was already shown in Table 2. No specific trends can be noticed.
- Since the 1960s, the autumn season has recorded a quite low annual variability of precipitation for the three weather stations without any specific trend.
3.4. Cold Intensity
One of the major concerns of reindeer herders is the variability of temperatures. Combined with a high rate of precipitation, it can be harmful for their herds. Thus, negative temperatures are welcomed in the autumn only if the ground is dry; otherwise, reindeer lichen can be trapped under a solid layer of ice. In the winter, what reindeer herders fear the most is the variability of temperatures around zero, which affects the phase changes of the snow cover. During the birth season in the spring, cold temperatures are not preferable for reindeer calves. These are the reason why analysing degree-days and frost and thaw cycles are relevant for this study.
3.4.1. Degree-Days
The cold intensity can be represented by the sum of the degree-days below 0 °C. According to Jaagus [38], it is the most important indicator of the severity of a winter. This indicator is calculated by summing up all the negative mean daily temperatures of a cold season and by discarding the positive ones. In the case of Kilpisjärvi and Muonio (Figure 7), it is clear that the cold was more intense before 1990 in view of the number of years that recorded a negative degree-days sum inferior to −2072.75 and −2190.15, respectively. The winter of 1966 was definitely the coldest one. Since the beginning of the 1990s, none of the years has recorded a sum inferior to the first quartile limit. For Enontekiö, the data range was smaller, but every year before 1990 recorded a sum of negative degree-days below the first quartile limit set at −2067.25. Finally, the cold intensity is not always related with the length of the winter season. The interannual and long-term variability of degree-days is logically correlated to temperature variability (r > 0.67 for each of the three stations): the shift point appears at the same time. Moreover, it is also more strongly correlated to the AO index variability (r > 0.55 for each of the three stations) than the NAO index variability (r < 0.43 for each of the three stations), as winter temperatures depend more on the AO (see Figure 3).
3.4.2. Frost and Thaw Cycles
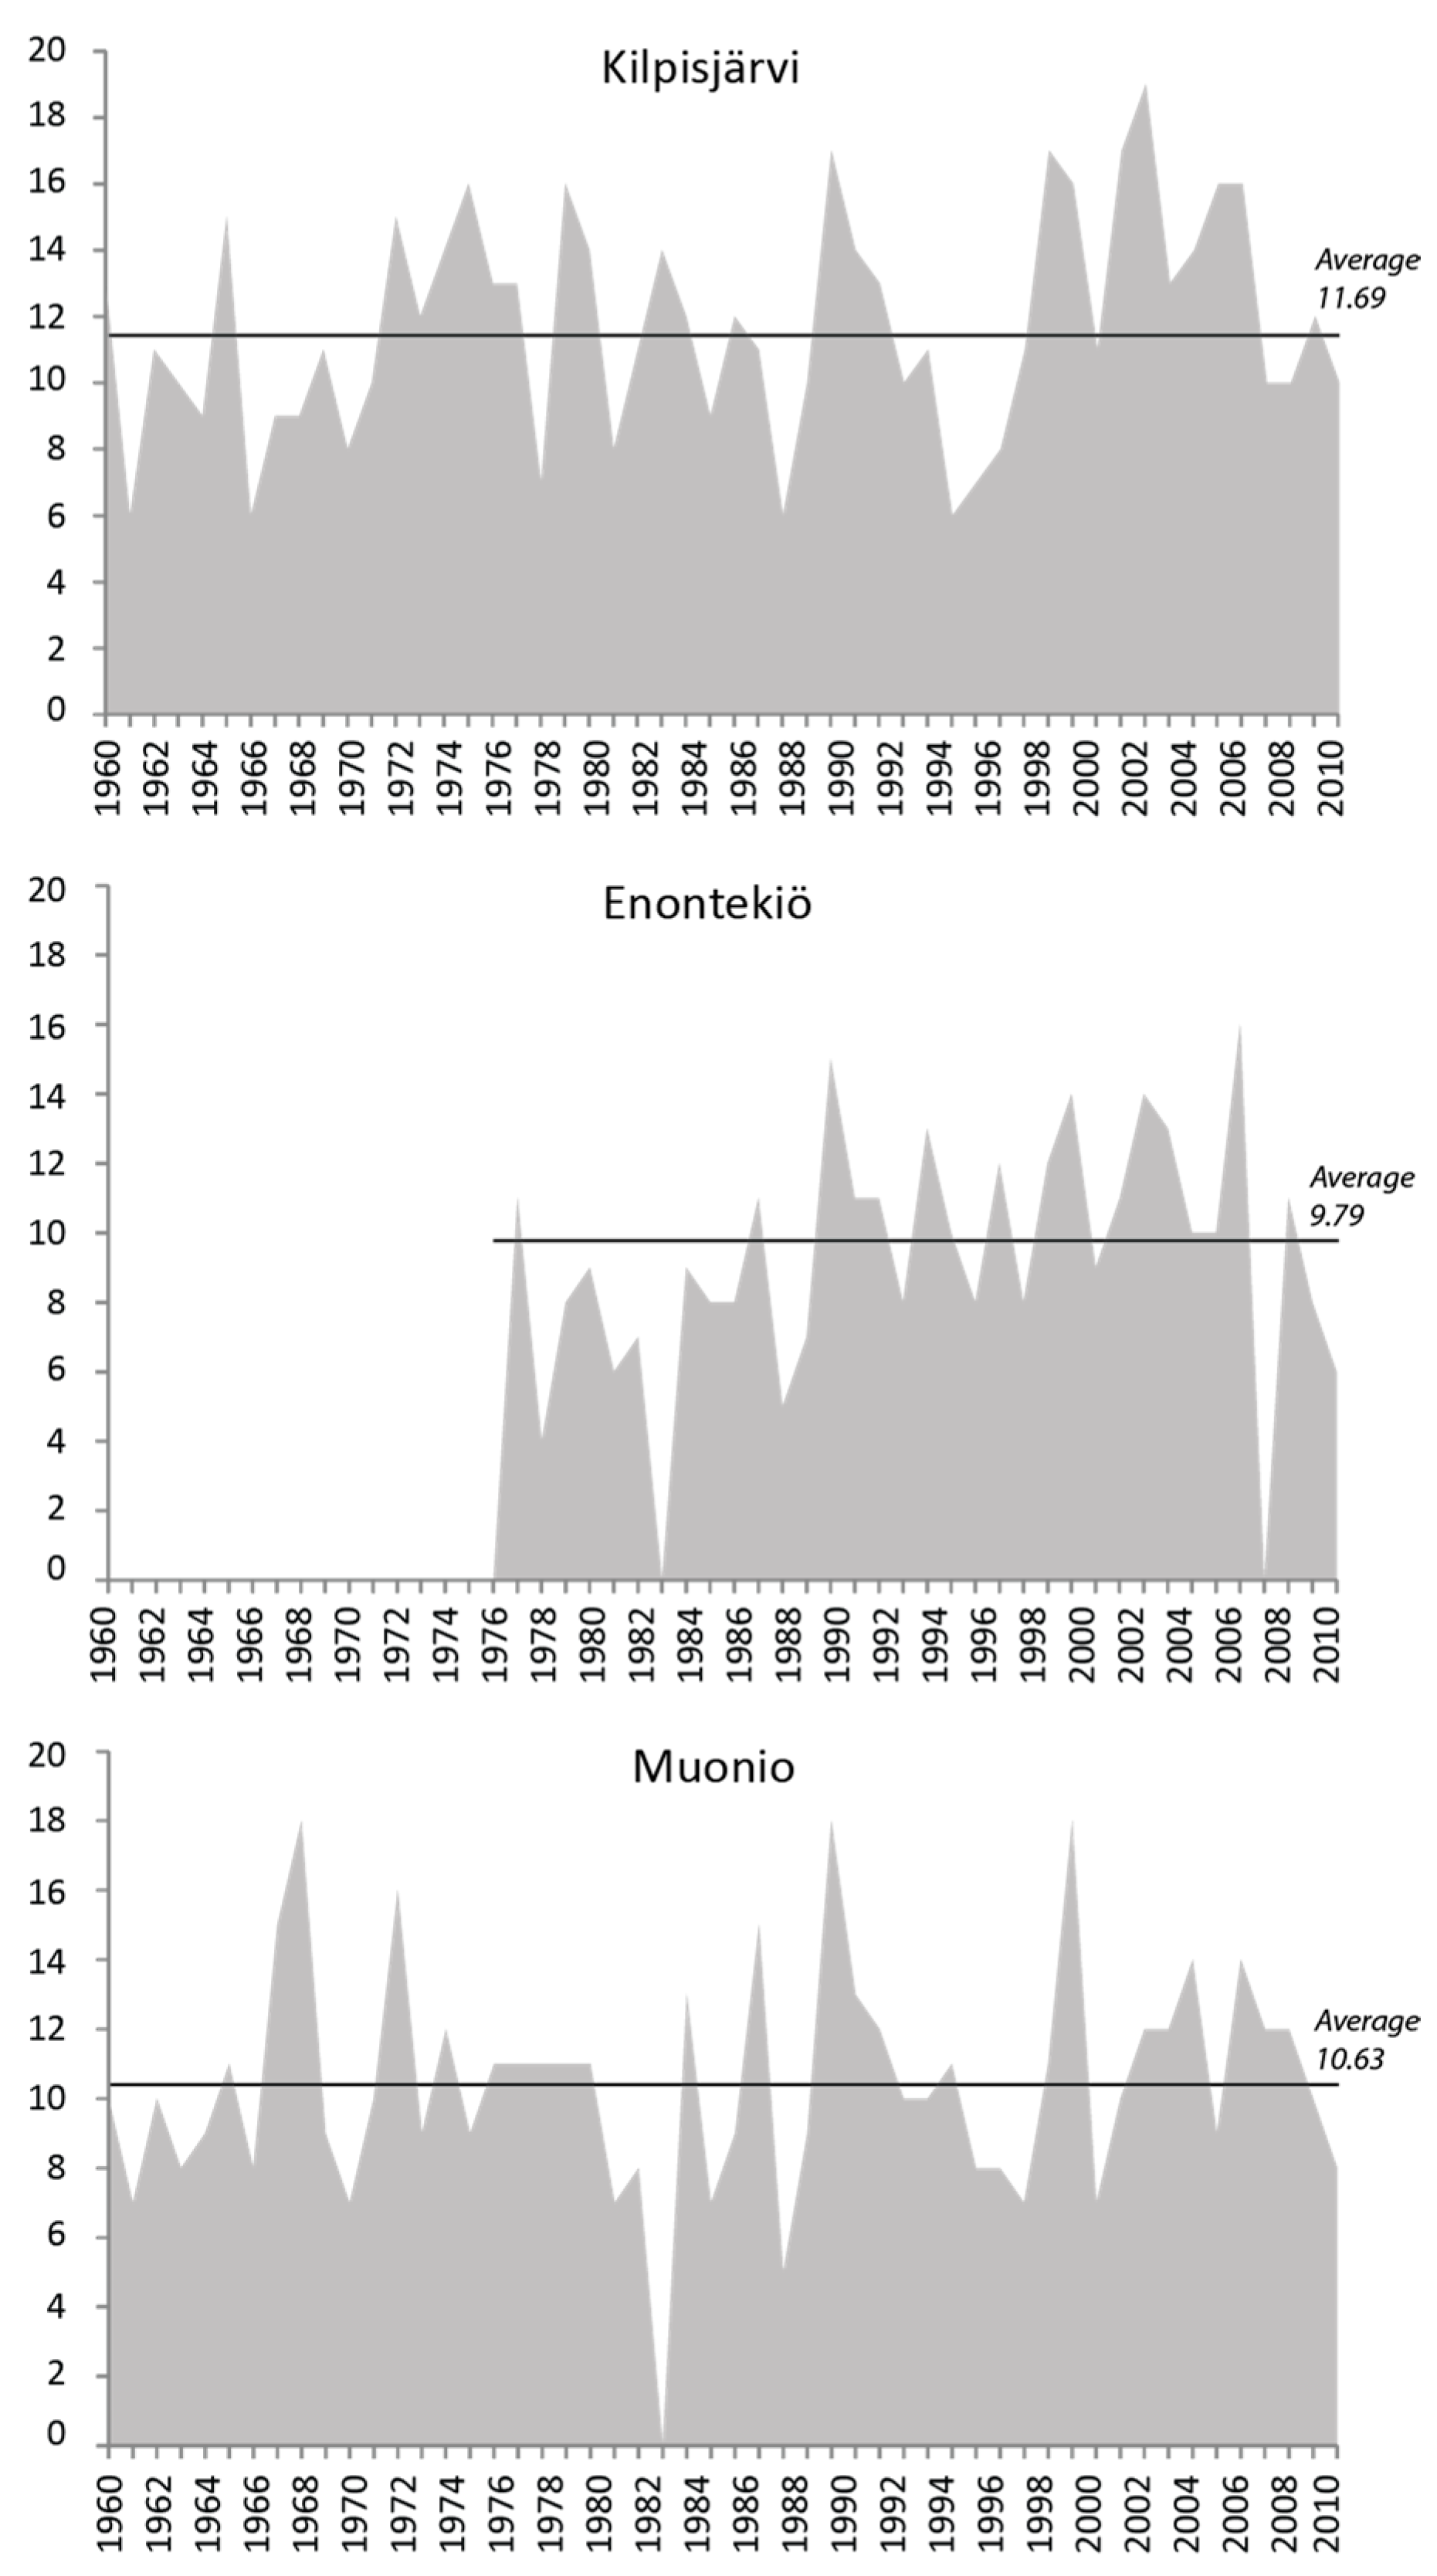
Frost and thaw cycles during the autumn and winter seasons are badly perceived by reindeer herders as they greatly affect lichen digging. Frost and thaw cycles mean the periods when temperatures pass from positive to negative, and vice versa. The more frost and thaw cycles there are, the more difficult it is to access the food that might be covered by a hard layer of ice. Figure 8 shows the number of frost and thaw cycles based on daily average temperatures from 1 July to 30 June for the three case stations. Each case represents a distinct trend:
- at Kilpisjärvi weather station, the average of cycles is approx. 11 per year. Among the three stations, it is the one that normally records the most of cycles every year, up to 19 in 2003. Since the 1990s, a slight increase of those cycles has occurred.
- at Enontekiö, whose average is about nine cycles per year, the increase is very clear even though the station does not record as many frost and thaw cycles as the two other stations.
- at Muonio, the number of cycles flows around the average of 10 per year without any discernible trend even for recent years.
4. Discussion
Spatial and temporal variations of climate of Finnish Fell Lapland in Northern Finland has been analysed over the last 50 years and have revealed changes in temperatures, precipitation and snow cover for three weather stations located in the Finnish reindeer husbandry area. The following conclusions can be drawn:
- It is difficult to speak about full climate regional homogeneity when only mean temperatures have revealed quite good correlation coefficients (r > 0.97), unlike precipitation and snow cover. Nevertheless, for all cases, annual and seasonal, Enontekiö and Muonio weather stations are the closest ones.
- For the annual temperature data, a warming trend is discernible for the period 1960–2011 with two distinct periods: a colder period between 1960 and 1988 with greater negative anomalies and strong cold intensity (lowest negative peaks of degree-days recorded before 1990); and a warmer period from 1989 to 2011 with greater positive anomalies and +1.20 °C of average temperatures compared to the previous period. It can also be seen that this most recent period has recorded slightly more frost and thaw cycles whose high occurrence is strongly linked to the warming of the climate at the high latitudes. As for seasonal data, variations in mean temperatures have been found to be more important during wintertime, partly due to the strong correlation with the AO index.
- Muonio is the weather station that has recorded the largest amount of precipitation. The annual data of precipitation have shown that a drier period occurred before 1988 for Kilpisjärvi and Muonio. Most of the positive anomalies have been recorded after 1988, meaning that the general trend is about receiving more precipitation. Nevertheless, no clear trend has appeared for Enontekiö. Concerning the seasonal variability of precipitation, the results have shown that summer is the season with the highest amplitude and number of variations for the three cases. As for the autumn, no specific trend is discernible. Winter and spring precipitation, however, has evolved differently, and Kilpisjärvi has stood out from the other weather stations. For both seasons, Kilpisjärvi has recorded larger amplitude of positive anomalies compared to Enontekiö and Muonio despite the quite low variability of precipitation. For both seasons and for the three sites, precipitation is increasing with time with more and more rainy winter precipitation, especially from the beginning of the 1990s. A slight decrease has been recorded from the beginning of the 2000s.
- None of the sites shows a discernible trend in the snow cover.
Besides the undeniable correlation between temperature and precipitation type and snow cover properties, the climate variability and shifts in Finnish Lapland is explained by the local geography and also by the impacts of the ocean-atmosphere coupling.
Indeed, with a sub-meridian orientation, the Scandinavian Mountains, which peak at 2469 m above sea level, induce important climatic contrasts on both sides of the mountain range. While the oceanic climate is confined at the Norwegian mountainside and, therefore, brings abundant precipitation, the drying effect of the Foehn wind plays an essential role in precipitation distribution on the eastern mountainside, especially in the Swedish coasts and in Lapland where precipitation is lower.
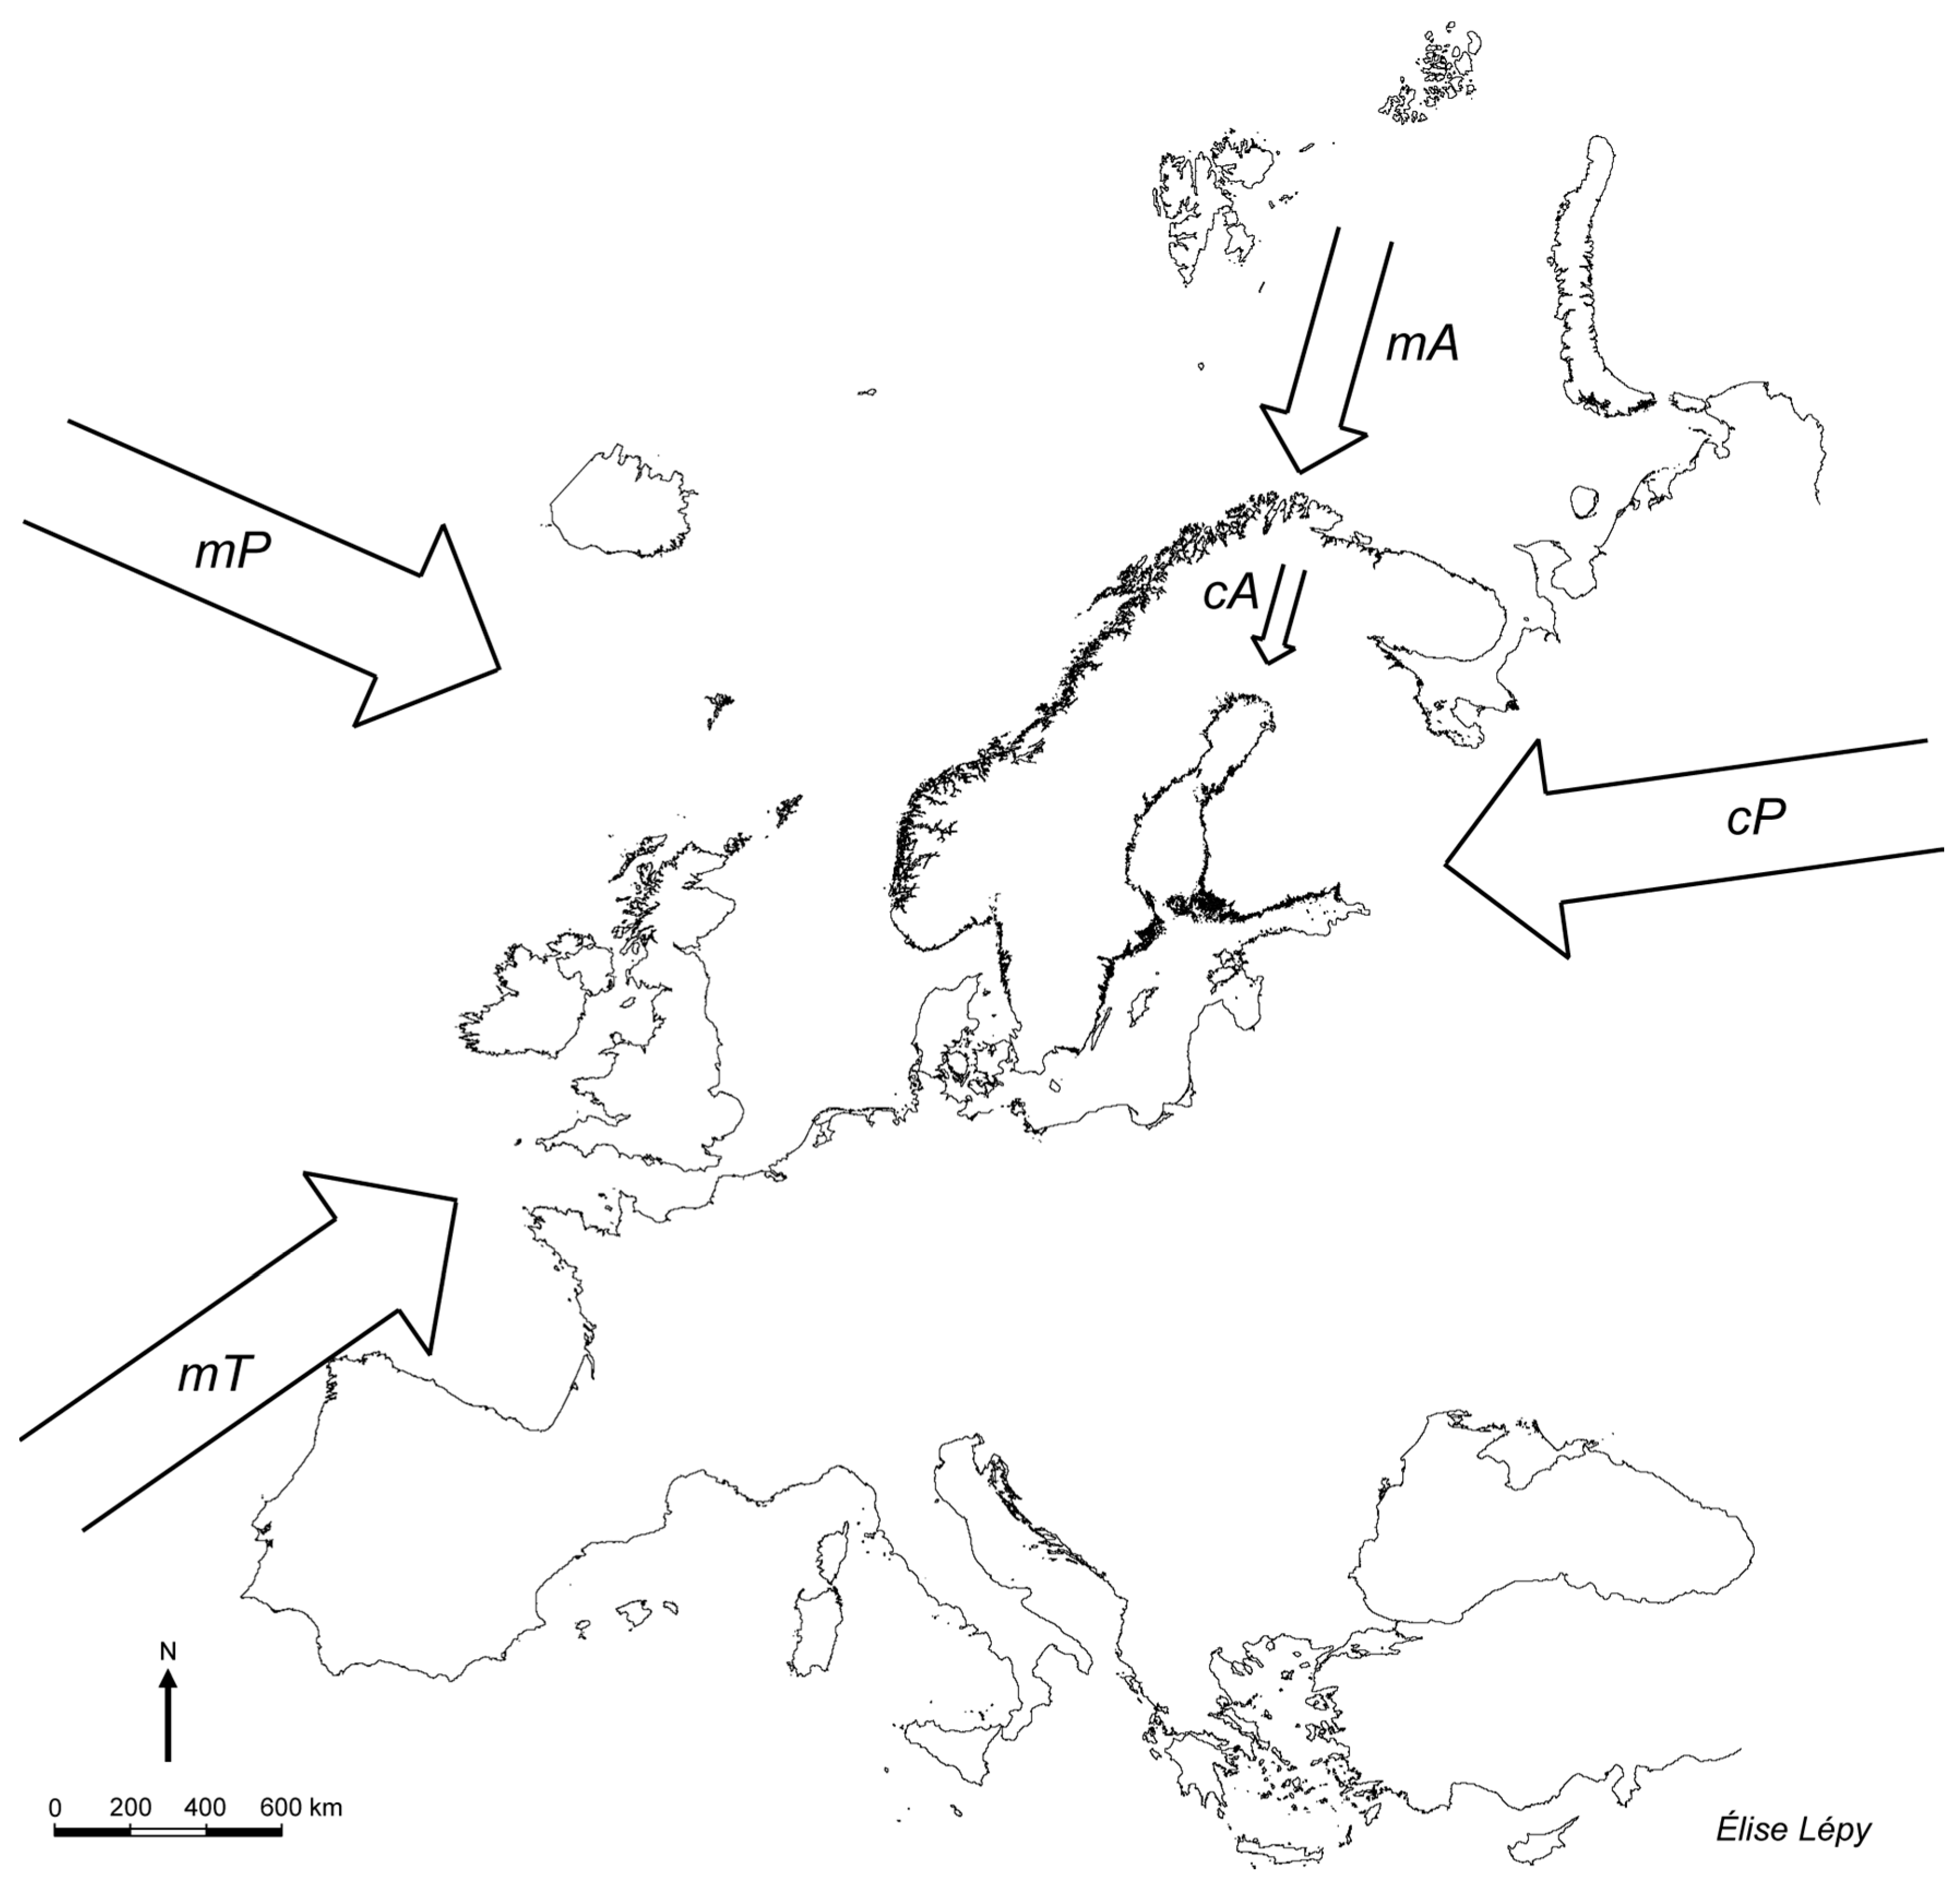
Moreover, the large-scale atmospheric phenomena have a great influence on the local and regional climate variability. Fell Lapland is located at relatively high latitudes and, as most of the northern regions, it experiences “the largest fluctuations due to [its] position in the transition zone between the west wind belt and the Arctic climate” [39] (p. 508). In fact, the position of Northern Europe between the ocean and the continent and between the tropical and polar regions favours the confluence of multiple air masses (Figure 9). Thus, this is a meeting place for the maritime polar air masses, cold and moist air from south of Greenland; the maritime tropical air masses, warm and moist air that is important for the energy transfer from the warm Atlantic waters to Northern Europe; the continental polar air masses that originate from the thermal high stabilised in Russia; the maritime Arctic air masses responsible for the coldness from February to the arrival of the spring; and the continental Arctic air masses that get formed in Lapland starting in the autumn [40]. Therefore, the climate variability is strongly governed by the position and the dynamic of the action centres. In Northern Europe, their distribution is affected by oscillations in pressure patterns that lead to change in temperature patterns. Even though it has been demonstrated that the NAO “is the most prominent and recurrent pattern of atmospheric variability over the middle and high latitude of the Northern Hemisphere, especially during the cold season” [41] (p. 113), and therefore has a major influence on winter temperatures as Hurrell [28] has pointed out, those results are in line with findings of previous research studies led in Finland. In fact, Irannezhad et al. [11] showed the significant influence of the AO in the winter in most areas of Finland and of the NAO in the spring in Northern Finland. Furthermore, the time series of the NAO and AO indices show a higher peak at the end of the 1980s that could be linked to the 1988 shift in temperature and precipitation time series. Also, some studies have demonstrated the linkages between the sea surface temperature (SST) variability of the North Atlantic [42] and the Baltic Sea [43] and the NAO, making the SST variability of both water bodies be a possible factor for the climate variability of Finnish Lapland. For instance, Buchan et al. [44] have shown the impacts of the North Atlantic SST anomalies on Northern cold weather events.
A time span of 50 years is too short to get an overview of long-term changes in the past for predicting the future climates, but this study can be considered as a complement to the works led by Lee et al. [9] in the eastern part of Finnish Lapland for the period 1876–1993. Interpretations of data might differ since great changes have occurred at the beginning of the 1990s emphasising warming trends, more precipitation and a slight diminution of snow cover in general. Indeed, Lee et al. [9] have not noticed any significant warming or cooling period between 1876 and 1993. As for the precipitation, they concluded that there was a significant increase for the winter, spring and autumn seasons, while this study confirms only the two first seasons.
Even though future climate changes will manifest themselves differently in different locations, we can attempt to draw a parallel between this study and others conducted in other Finnish reindeer management areas. Thus, Turunen et al. [15] have carried out climate model simulations for the period 2035–2064 in Sodankylä, and they have concluded that winters “will be characterized by ephemeral snow cover formation and melting several times during the winter” with a delay of the seasonal snow cover formation and earliness of snow cover melting. However, these results are also consistent with other studies conducted in Northern Fennoscandia, especially the ones of Kivinen et al. [45] reporting warming trends with an increase of extreme warm events and a decrease of extreme cold events (Figure 2), among other studies [46,47]. Moreover, the high variability of temperatures during the winter found in Figure 3 might explain the conclusion of Kivinen et al. [45] on the fact that any significant warming trends were detected in winter. The present results also confirm the conclusions of Lehtonen et al. [48] predicting an increase in winter precipitation in Northern Europe.
Disparities within Fell Lapland are maybe not huge but reindeer herders still have to cope with different weather situations according to their geographical location. Indeed, this study has shown, by different means, the particularity of Kilpisjärvi weather station that can be explained by the very close proximity of the Lake Kilpisjärvi. In their study on the influence of natural conditions on the spatial variation of climate in Lapland, Vajda and Venäläinen [24] have shown that lakes situated in Lapland influence the microclimate of their surroundings. In general, the parallel between reindeer herders’ perceptions and climatic trends is interesting. In fact, reindeer herders have estimated that shorter snow season and thinner snow cover in the winter would be advantageous for reindeer to access ground lichen, and more summer precipitation would also boost the vegetation growth and particularly mushrooms that reindeer eat [13,14]. However, an increase of frost and thaw cycles and heavy rain on snow in the winter are very badly perceived by herders, as it would have implications on snow cover properties and ground-icing blocking the access to winter food [29]. These changes in climate would also have other increasing adverse indirect effects on reindeer herding as the behaviour of predator populations and the development of competing land uses [19].
Acknowledgments
This study is part of the contribution to the WP8: Traditional livelihoods of the CLICHE (Impacts of climate change on Arctic environment, ecosystem services and society) project, part of the research programme on Climate Change (FICCA) launched by the Academy of Finland in 2011. Dr. Élise Lépy’s work was supported by the PITCH project (Primary Industries and Transformational Change) funded by the Norwegian Research Council and the project “Understanding the cultural impacts and issues of Lapland mining: a long-term perspective on sustainable mining policies in the North” part of the Arctic Academy Programme (ARKTIKO) launched by the Academy of Finland in 2014. Dr. Leena Pasanen’s work was supported by the EBOR project (Ecological history and long-term dynamics of the Boreal forest ecosystem) funded by the Academy of Finland. The authors also thank the two anonymous reviewers for their insightful comments and suggestions.
Author Contributions
Élise Lépy is responsible for the acquisition of data, the conception and design of the work, and the statistical analyses and interpretations of climate data at the exception of the Lepage test; she also drafted the manuscript as well as all tables and figures. Leena Pasanen has conducted and interpreted the results from the Lepage test. Both authors were involved in the final editorial revisions for publication.
Conflicts of Interest
The authors declare no conflict of interest.
References
- ACIA. Arctic Climate Impact Assessment Scientific Report; Cambridge University Press: Cambridge, UK, 2005. [Google Scholar]
- Barber, D.; Lukovich, J.V.; Keogak, J.; Baryluk, S.; Fortier, L.; Henry, G.H.R. The changing climate of the Arctic. Arctic 2008, 61, 7–26. [Google Scholar] [CrossRef]
- Larsen, J.N.; Anisimov, A.; Constable, A.; Hollowed, A.B.; Maynard, N.; Prestrud, P.; Prowse, T.D.; Stone, J.M.R. Polar regions. In Climate Change 2014: Impacts, Adaptation, and Vulnerability. Part B: Regional Aspects. Contribution of Working Group II to the Fifth Assessment Report of the Intergovernmental Panel on Climate Change; Barros, V.R., Field, C.B., Dokken, D.J., Mastrandrea, M.D., Mach, K.J., Bilir, T.E., Chatterjee, M., Ebi, K.L., Estrada, Y.O., Genova, R.C., et al., Eds.; Cambridge University Press: Cambridge, UK; New York, NY, USA, 2014; pp. 1567–1612. [Google Scholar]
- Rautio, A.; Poppel, B.; Young, K. Human health and well-being. In Arctic Human Development Report. Regional Processes and Global Linkages; Nymand, L., Fondahl, G., Eds.; Nordic Council of Ministers: Copenhagen, Denmark, 2015; pp. 297–346. [Google Scholar]
- Adger, W.N. Vulnerability. Glob. Environ. Chang. 2006, 16, 268–281. [Google Scholar] [CrossRef]
- Folke, C. Resilience: The emergence of a perspective for social-ecological systems analyses. Glob. Environ. Chang. 2006, 16, 253–267. [Google Scholar] [CrossRef]
- Callaghan, T.V.; Bergholm, F.; Christensen, T.R.; Jonasson, C.; Kokfelt, U.; Johansson, M. A new climate era in the sub-Arctic: Accelerating climate changes and multiple impacts. Geophys. Res. Lett. 2010, 37, L14705. [Google Scholar] [CrossRef]
- Stocker, T.F.; Qin, D.; Plattner, G.K.; Tignor, M.; Allen, S.K.; Boschung, J.; Nauels, A.; Xia, Y.; Bex, V.; Midgley, P.M. (Eds.) IPCC Climate Change 2013: The Physical Science Basis. Contribution of Working Group I to the Fifth Assessment Report of the Intergovernmental Panel on Climate Change; Cambridge University Press: Cambridge, UK; New York, NY, USA, 2013. [Google Scholar]
- Lee, S.E.; Press, M.C.; Lee, J.A. Observed climate variations during the last 100 years in Lapland, Northern Finland. Int. J. Climatol. 2000, 20, 329–346. [Google Scholar] [CrossRef]
- Pike, G.; Pepin, N.C.; Schaefer, M. High latitude local scale temperature complexity: The example of Kevo Valley, Finnish Lapland. Int. J. Climatol. 2013, 33, 2050–2067. [Google Scholar] [CrossRef] [Green Version]
- Irannezhad, M.; Marttila, H.; Kløve, B. Long-term variations and trends in precipitation in Finland. Int. J. Climatol. 2014, 34, 3139–3153. [Google Scholar] [CrossRef]
- Irannezhad, M.; Chen, D.; Kløve, B. Interannual variations and trends in surface air temperature in Finland in relation to atmospheric circulation patterns, 1961–2011. Int. J. Climatol. 2014, 35, 3078–3092. [Google Scholar] [CrossRef]
- Heikkinen, H.I.; Kasanen, M.; Lépy, É. Resilience, vulnerability and adaptation in reindeer herding communities in the Finnish-Swedish border area. Nordia Geogr. Publ. 2013, 41, 107–122. [Google Scholar]
- Lépy, É. Perceptions des éleveurs de rennes de Laponie finlandaise. Communications 2017, 2, 47–61. [Google Scholar]
- Turunen, M.T.; Rasmus, S.; Bavay, M.; Ruosteenoja, K.; Heiskanen, J. Coping with difficult weather and snow conditions: Reindeer herders’ views on climate change impacts and coping strategies. Clim. Risk Manag. 2016, 11, 15–36. [Google Scholar] [CrossRef]
- Rasmus, S.; Kumpula, J.; Jylhä, K. Suomen poronhoitoalueen muuttuvat talviset sää- ja lumiolosuhteet. Terra 126 2014, 4, 69–185. [Google Scholar]
- Riseth, J.A.; Tømmervik, H.; Bjerke, J.W. 175 years of adaptation: North Scandinavian Sámi reindeer herding between government policies and winter climate variability (1835–2010). J. For. Econ. 2016, 24, 186–204. [Google Scholar] [CrossRef]
- Jylhä, K.; Ruosteenoja, K.; Räisänen, J.; Venäläinen, A.; Tuomenvirta, H.; Ruokolainen, L.; Saku, S.; Seitola, T. The Changing Climate in Finland: Estimates for Adaptation Studies. ACCLIM Project Report 2009; Finnish Meteorological Institute: Helsinki, Finland, 2009. [Google Scholar]
- Lépy, É.; Heikkinen, H.; Komu, T.; Sarkki, S. Participatory meaning-making of environmental and cultural changes in reindeer herding in the northernmost border area of Sweden and Finland. Int. J. Bus. Glob. 2017, in press. [Google Scholar]
- Jernsletten, J.L.; Klokov, K. Sustainable Reindeer Husbandry; Centre for Saami Studies: Tromsø, Norway, 2002. [Google Scholar]
- Forbes, B.; Bölter, M.; Müller-Wille, L.; Hukkinen, J.; Müller, F.; Gunslay, N.; Konstatinov, Y. (Eds.) Reindeer Management in Northernmost Europe; Ecological Studies 184; Springer: Berlin, Germany, 2006. [Google Scholar]
- Helle, T.; Kojola, I. Demographics in an alpine reindeer herd: Effects of density and winter weather. Ecography 2008, 31, 221–230. [Google Scholar] [CrossRef]
- Riseth, J.A.; Tømmervik, H.; Helander-Renvall, E.; Labba, N.; Johansson, C.; Malnes, E.; Bjerke, J.W.; Jonsson, C.; Pohjola, V.; Sarri, L.E.; et al. Sámi traditional ecological knowledge as a guide to science: Snow, ice and reindeer pasture facing climate change. Polar Rec. 2011, 47, 202–217. [Google Scholar] [CrossRef]
- Vajda, A.; Venäläinen, A. The influence of natural conditions on the spatial variation of climate in Lapland, Northern Finland. Int. J. Climatol. 2003, 23, 1011–1022. [Google Scholar] [CrossRef]
- Kitti, H.; Gunslay, N.; Forbes, B.C. Defining the quality of reindeer pastures: The perspectives of Sámi reindeer herders. In Reindeer Management in Northernmost Europe; Ecological Studies 184; Forbes, B.C., Bölter, M., Müller-Wille, L., Hukkinen, J., Müller, F., Gunslay, N., Konstatinov, Y., Eds.; Springer: Berlin, Germany, 2006; pp. 141–165. [Google Scholar]
- Côté, S.; Festa-Bianchet, M.; Dussault, C.; Tremblay, J.P.; Brodeur, V.; Simard, M.; Taillon, J.; Hins, C.; Le Corre, M.; Sharma, S. Caribou herd dynamics: Impacts of climate change on traditional and sport harvesting. In Nunavik and Nunatsiavut: From Science to Policy. An Integrated Regional Impact Study (IRIS) of Climate Change and Modernization; Allard, M., Lemay, M., Eds.; ArcticNet Inc.: Quebec City, QC, Canada, 2012; pp. 249–269. [Google Scholar]
- Turunen, M.; Soppela, P.; Kinnunen, H.; Sutinen, M.L.; Martz, F. Does climate change influence the availability and quality of reindeer forage plants? Polar Biol. 2009, 32, 813–832. [Google Scholar] [CrossRef]
- Bartsch, A.; Kumpula, T.; Forbes, B.; Stammler, F. Detection of snow surface thawing and refreezing in the Eurasian Arctic with QuikSCAT: Implications for reindeer herding. Ecol. Appl. 2010, 20, 2346–2358. [Google Scholar] [CrossRef] [PubMed]
- Hansen, B.B.; Aanes, R.; Herfindal, I.; Kohler, J.; Sæther, B.E. Climate, icing, and wild arctic reindeer: Past relationships and future prospects. Ecology 2011, 92, 1917–1923. [Google Scholar] [CrossRef] [PubMed]
- Lepage, Y. A combination of Wilcoxon’s and Ansari-Bradley’s statistics. Biometrika 1971, 58, 213–217. [Google Scholar] [CrossRef]
- Ross, G.J. Parametric and nonparametric sequential change detection in R: The cpm package. J. Stat. Softw. 2015, 66, 1–20. [Google Scholar]
- R Core Team. R: A Language and Environment for Statistical Computing; R Foundation for Statistical Computing: Vienna, Austria, 2014. [Google Scholar]
- Rogers, J.C. The association between the North Atlantic Oscillation and the South Oscillation in the Northern Hemisphere. Mon. Weather Rev. 1984, 112, 1999–2015. [Google Scholar] [CrossRef]
- Hurrell, J.W. Decadal trends in the North Atlantic Oscillation: Regional temperatures and precipitation. Science 1995, 269, 676–679. [Google Scholar] [CrossRef] [PubMed]
- Cohen, J.; Barlow, M. The NAO, the AO, and global warming: How closely related? J. Clim. 2005, 18, 4498–4513. [Google Scholar] [CrossRef]
- Thompson, D.W.J.; Wallace, J.M. The Arctic Oscillation signature in the wintertime geopotential height and temperature fields. Geophys. Res. Lett. 1998, 25, 1297–1300. [Google Scholar] [CrossRef]
- NOAA. Available online: http://www.cpc.ncep.noaa.gov/products/precip/CWlink/pna/nao.shtml (accessed on 30 June 2017).
- Jaagus, J. Trends in sea ice conditions in the Baltic Sea near the Estonian coast during the period 1949/1950–2003/2004 and their relationships to large-scale atmospheric circulation. Boreal Environ. Res. 2006, 11, 169–183. [Google Scholar]
- Chen, D.; Hellström, C. The influence of the North Atlantic Oscillation on the regional temperature variability in Sweden: Spatial and temporal variations. Tellus 1999, 51A, 505–516. [Google Scholar] [CrossRef]
- Lépy, É. Les Glaces de mer en mer Baltique. Étude Géographique et Implications Environnementales et Sociétales à Partir de l’étude Comparée de la Baie de Botnie (Oulu, Finlande) et du Golfe de Riga (Lettonie). Doctor’s Thesis, University of Caen-Basse-Normandie, Caen, France, 2009. [Google Scholar]
- Hurrell, J.W.; Deser, C. Northern hemisphere climate variability during winter: Looking back on the work of Felix Exner. Meteorol. Z. 2015, 24, 113–118. [Google Scholar] [CrossRef]
- Gastineau, G.; Frankignoul, C. Influence of the North Atlantic SST variability on the atmospheric circulation during the twentieth century. J. Clim. 2015, 28, 1396–1416. [Google Scholar] [CrossRef]
- Stramska, M.; Bialogrodzka, J. Spatial and temporal variability of sea surface temperature in the Baltic Sea based on 32-years (1982–2013) of satellite data. Oceanologia 2015, 57, 223–235. [Google Scholar] [CrossRef]
- Buchan, J.; Hirschi, J.J-M.; Blaker, A.T.; Sinha, B. North Atlantic SST anomalies and the cold North European weather events of winter 2009/10 and December 2010. Mon. Weather Rev. 2014, 142, 922–932. [Google Scholar] [CrossRef]
- Kivinen, S.; Rasmus, S.; Jylhä, K.; Laapas, M. Long-term climate trends and extreme events in Northern Fennoscandia (1914–2013). Climate 2017, 5, 16. [Google Scholar] [CrossRef]
- Beniston, M.; Stephenson, D.B.; Christensen, O.B.; Ferro, C.A.; Frei, C.; Goyette, S.; Halsnaes, K.; Holt, T.; Jylhä, K.; Koffi, B.; et al. Future extreme events in European climate: An exploration of regional climate model projections. Clim. Chang. 2007, 81, 71–95. [Google Scholar] [CrossRef]
- Vikhamar-Schuler, D.; Isaksen, K.; Haugen, J.E.; Tømmervik, H.; Lucks, B.; Schuler, T.V.; Bjerke, J.W. Changes in winter warming events in the Nordic Arctic Region. J. Clim. 2016, 29, 6223–6244. [Google Scholar] [CrossRef]
- Lehtonen, I.; Ruosteenoja, K.; Jylhä, K. Projected changes in European extreme precipitation indices on the basis of global and regional climate model ensembles. Int. J. Climatol. 2014, 34, 1208–1222. [Google Scholar] [CrossRef]
Figure 1.
Location map.

Figure 2.
(a) Time series of the absolute values of standardised Lepage test statistics, denoted D. The year the maximum is attained is shown as vertical dashed line; (b) Regional average temperatures (°C) and anomalies for 1960–2011 (combination of the three weather stations). Note that year 1982 is missing.
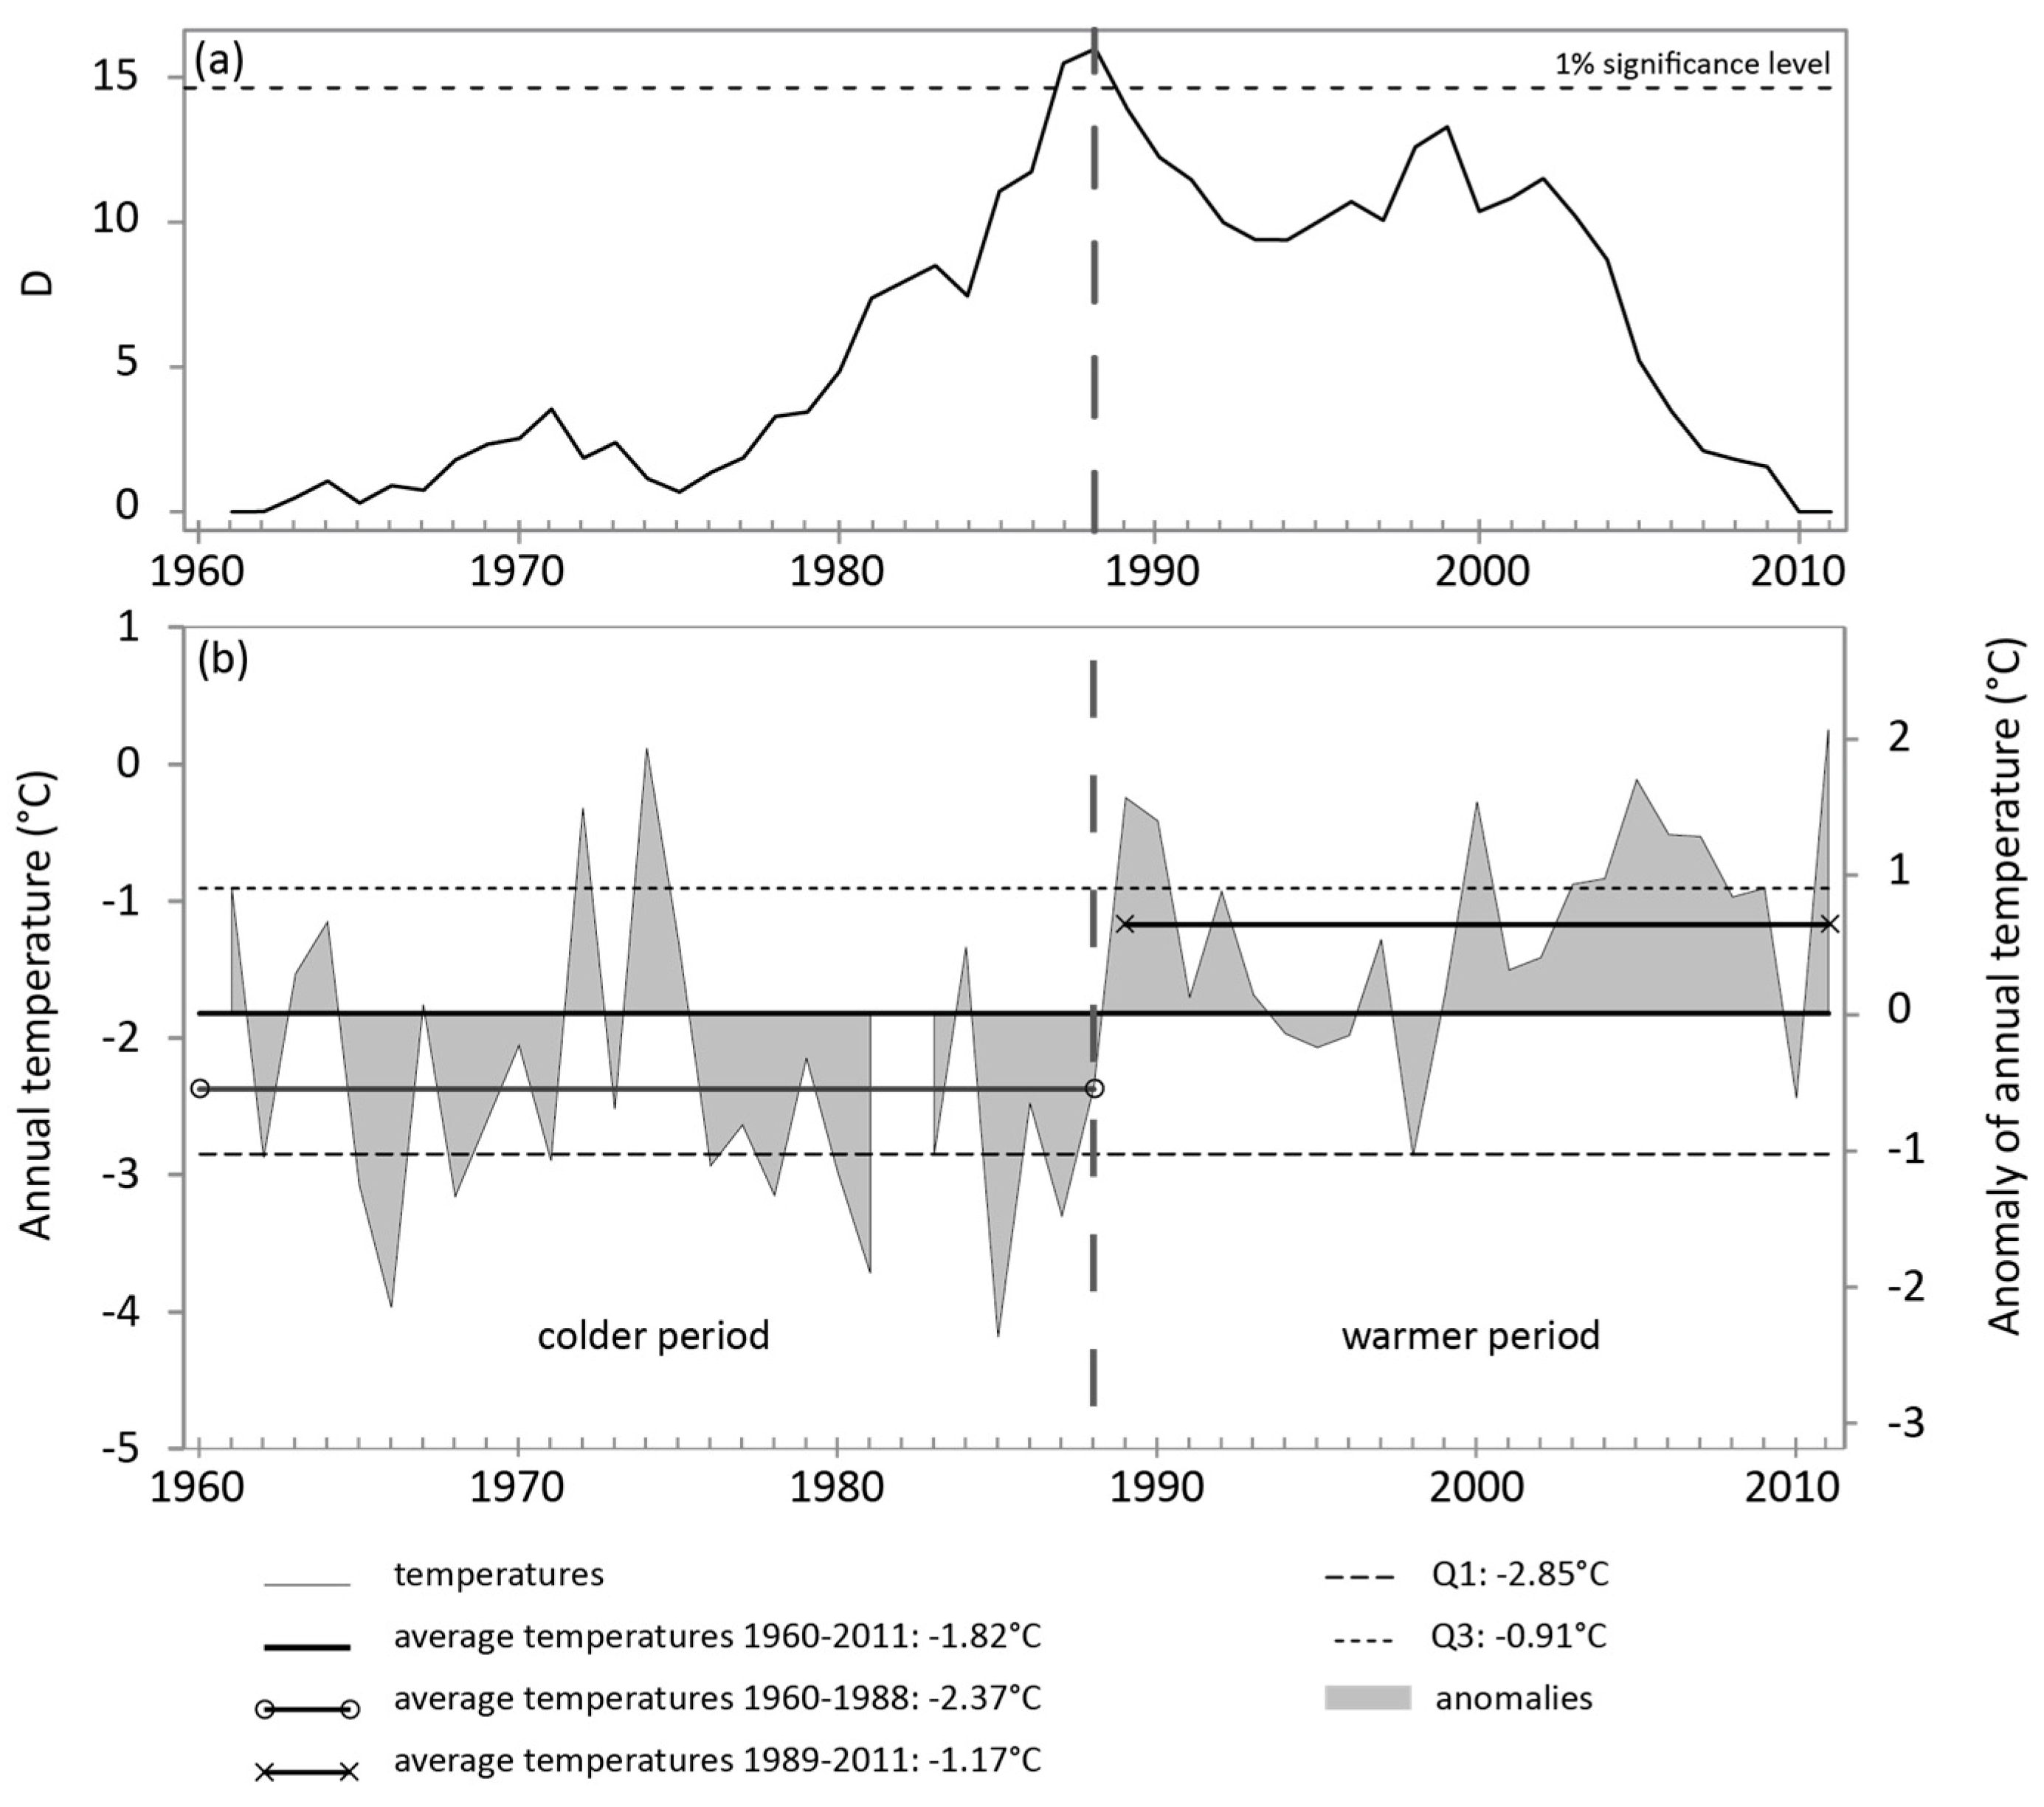
Figure 3.
Monthly variability of temperature anomalies for the period 1960–2011 (combination of the three weather stations).
Figure 3.
Monthly variability of temperature anomalies for the period 1960–2011 (combination of the three weather stations).

Figure 4.
Monthly variation of the correlation between the monthly average temperature anomalies and the monthly North Atlantic Oscillation (NAO) and Arctic Oscillation (AO) indices for the period 1960–2011.
Figure 4.
Monthly variation of the correlation between the monthly average temperature anomalies and the monthly North Atlantic Oscillation (NAO) and Arctic Oscillation (AO) indices for the period 1960–2011.

Figure 5.
Annual anomaly of the total precipitation (mm) and permanent snow cover >1 cm (number of days) at Kilpisjärvi, Enontekiö and Muonio, 1960–2011. The shift point is shown as vertical dashed line.
Figure 5.
Annual anomaly of the total precipitation (mm) and permanent snow cover >1 cm (number of days) at Kilpisjärvi, Enontekiö and Muonio, 1960–2011. The shift point is shown as vertical dashed line.
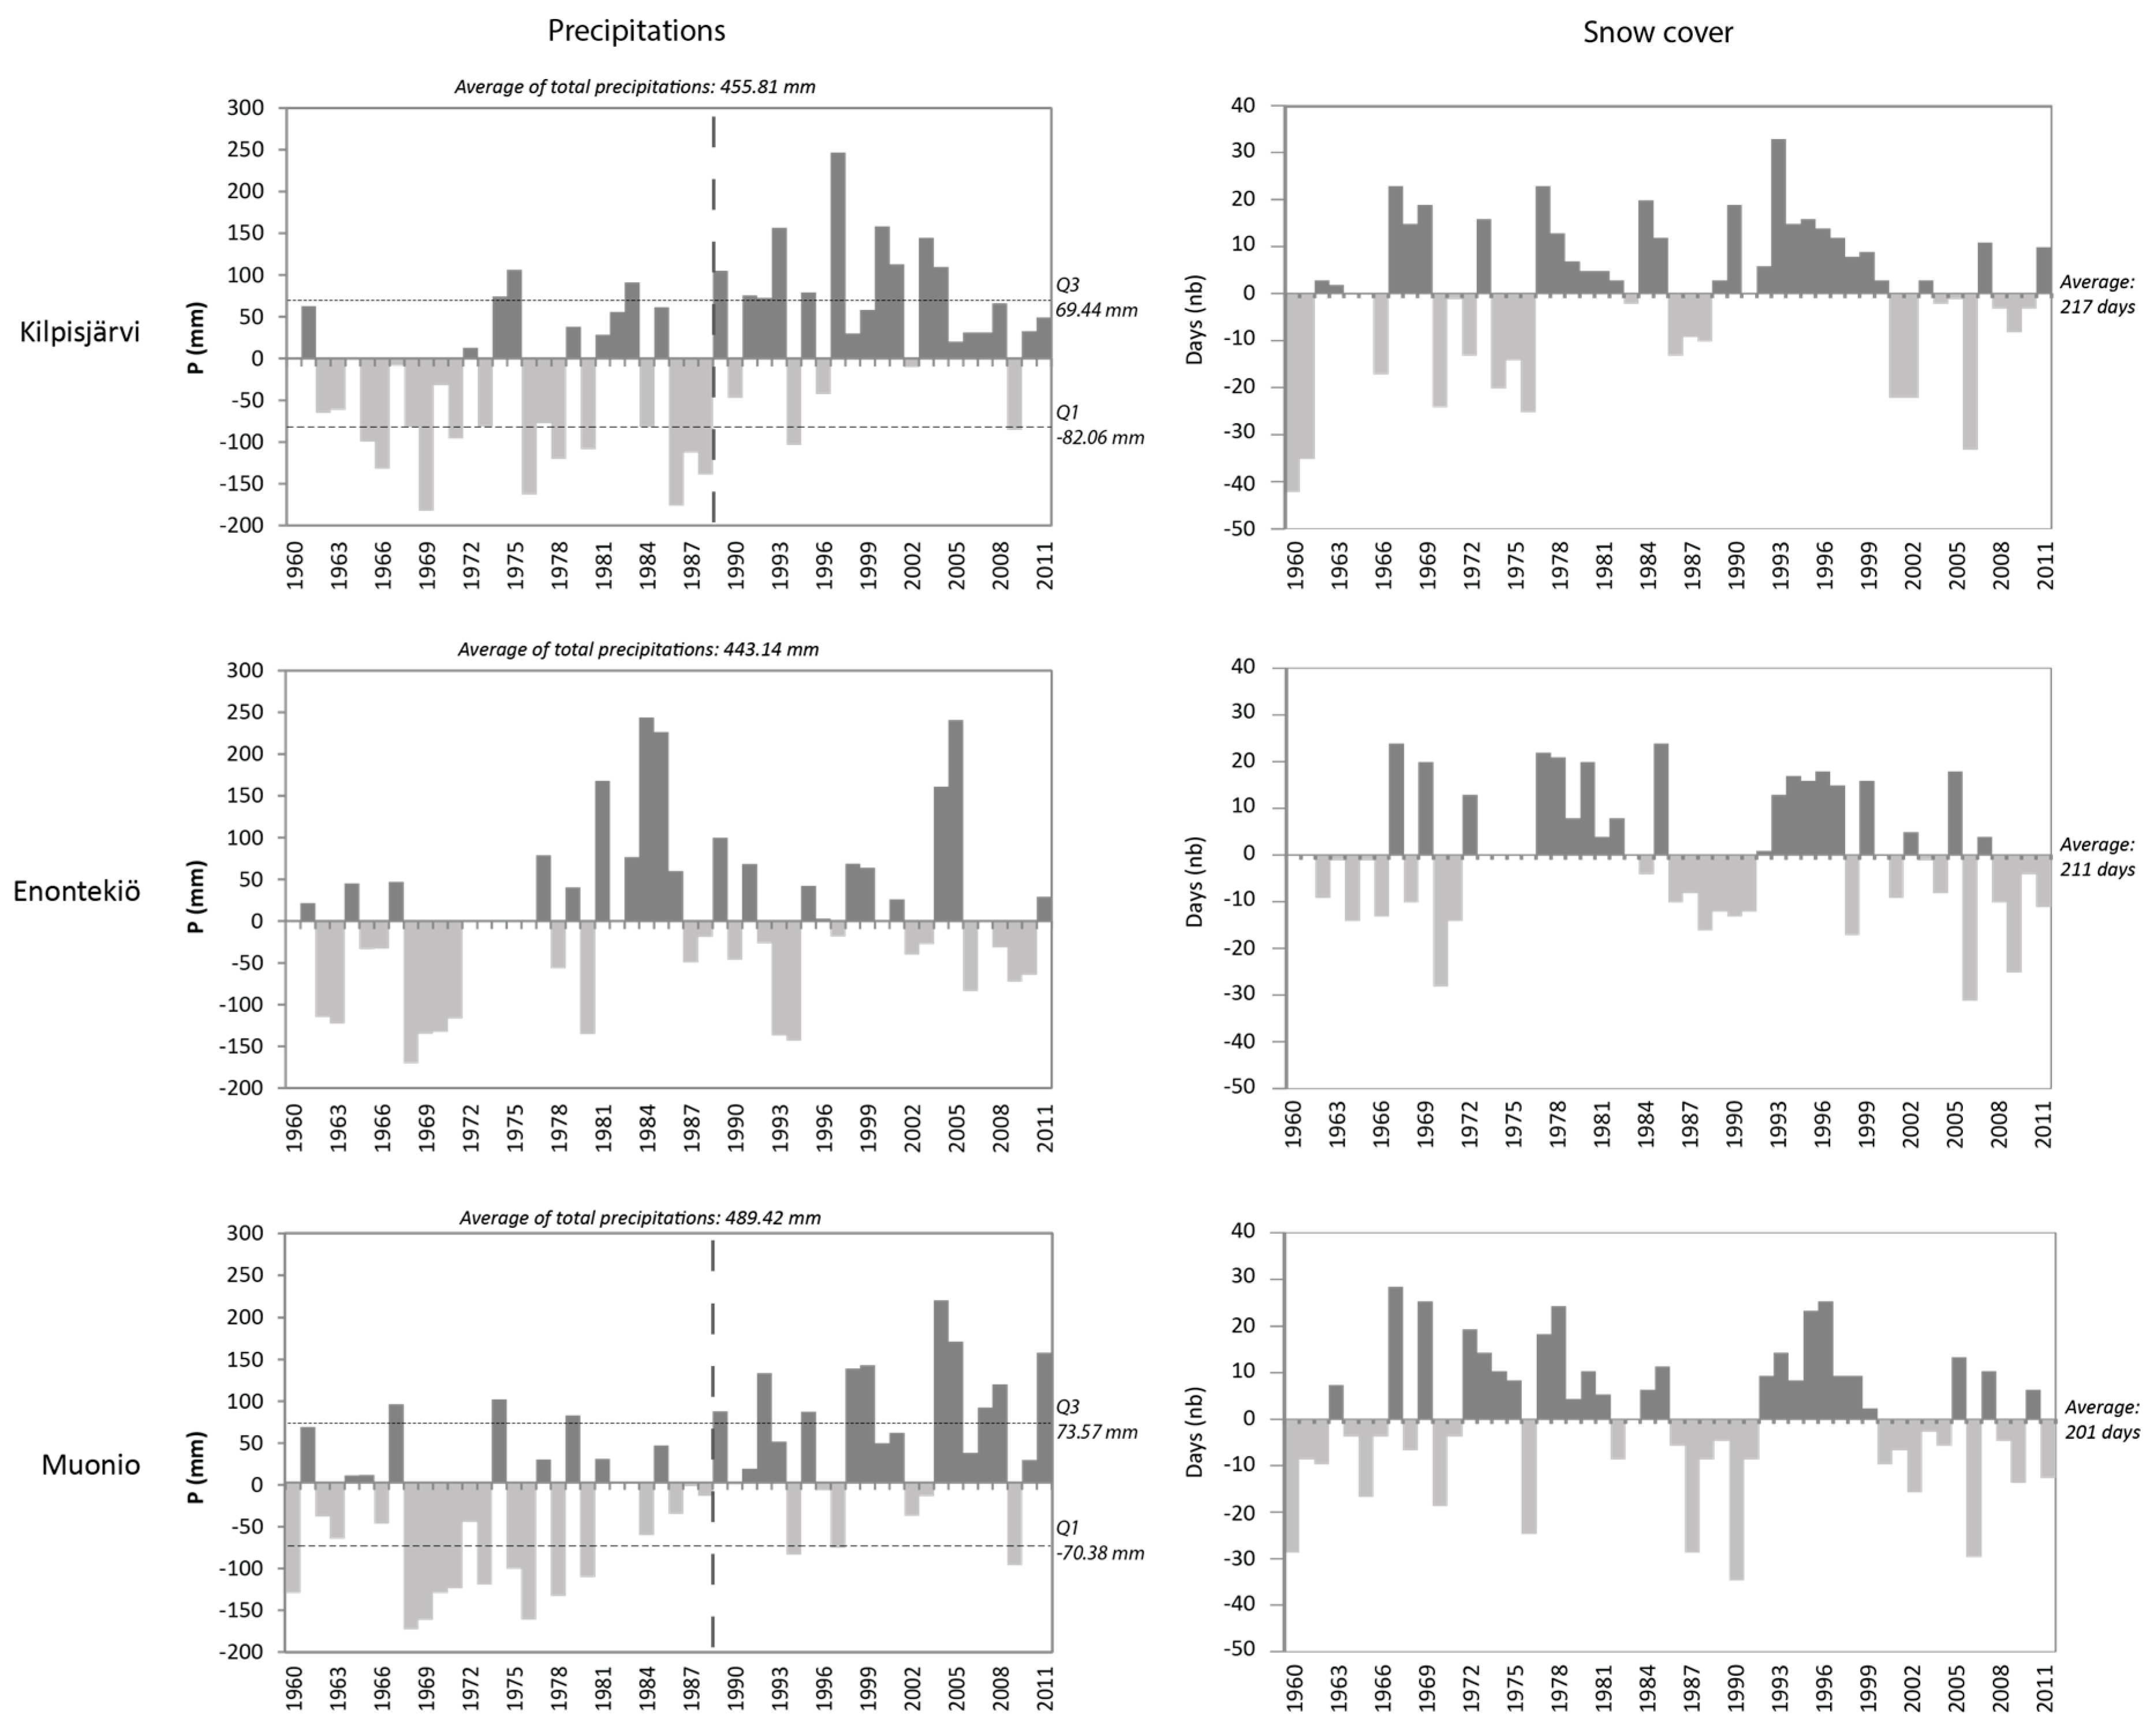
Figure 6.
Annual anomaly of seasonal precipitation (mm) at Kilpisjärvi, Enontekiö and Muonio, 1960–2011.
Figure 6.
Annual anomaly of seasonal precipitation (mm) at Kilpisjärvi, Enontekiö and Muonio, 1960–2011.

Figure 7.
Sum of negative degree-days at Kilpisjärvi Enontekiö and Muonio, 1960–2011.

Figure 8.
Number of frost and thaw cycles based on the daily average temperatures at Kilpisjärvi, Enontekiö and Muonio, 1960–2011.
Figure 8.
Number of frost and thaw cycles based on the daily average temperatures at Kilpisjärvi, Enontekiö and Muonio, 1960–2011.

Figure 9.
Air masses influencing the climate of Northern Europe (mP: maritime polar; mT: maritime tropical; mA: maritime arctic; cA: continental Arctic; cP: continental polar).
Figure 9.
Air masses influencing the climate of Northern Europe (mP: maritime polar; mT: maritime tropical; mA: maritime arctic; cA: continental Arctic; cP: continental polar).

Table 1.
Description of the three meteorological stations.
| Weather Stations | Station Reference Number | Coordinates | Elevation (m.a.s.l.) | Years Recorded |
|---|---|---|---|---|
| Enontekiö Kilpisjärvi | 9001 | 69°03′00″ N, 20°48′00″ E | 483 | 1951–1978 |
| Enontekiö Kilpisjärvi kyläkeskus | 9003 | 69°03′00″ N, 20°47′24″ E | 480 | |
| Enontekiö Palojärvi | 9202 | 68°34′12″ N, 23°19′48″ E | 356 | 1972–2000 |
| Enontekiö Näkkälä | 9201 | 68°36′00″ N, 23°34′48″ E | 374 | 1960–present |
| Muonio Alamuonio | 8201 | 67°57′36″ N, 23°40′48″ E | 236 | 1946–present |
Table 2.
Pearson correlation coefficients (r) between the different meteorological stations concerning the average temperatures, precipitation and snow conditions.
Table 2.
Pearson correlation coefficients (r) between the different meteorological stations concerning the average temperatures, precipitation and snow conditions.
| Mean Temperatures | |||||||
|---|---|---|---|---|---|---|---|
| Winter | K 1 | E 2 | M 3 | Summer | K | E | M |
| K | 1 | 1 | |||||
| E | 0.959 | 1 | 0.929 | 1 | |||
| M | 0.943 | 0.989 | 1 | 0.932 | 0.984 | 1 | |
| Spring | Autumn | ||||||
| K | 1 | 1 | |||||
| E | 0.943 | 1 | 0.957 | 1 | |||
| M | 0.947 | 0.988 | 1 | 0.901 | 0.976 | 1 | |
| Annual | |||||||
| K | 1 | ||||||
| E | 0.977 | 1 | |||||
| M | 0.967 | 0.982 | 1 | ||||
| Precipitation | |||||||
| Winter | K | E | M | Summer | K | E | M |
| K | 1 | 1 | |||||
| E | 0.206 | 1 | 0.629 | 1 | |||
| M | 0.383 | 0.639 | 1 | 0.717 | 0.827 | 1 | |
| Spring | Autumn | ||||||
| K | 1 | 1 | |||||
| E | 0.413 | 1 | 0.402 | 1 | |||
| M | 0.486 | 0.583 | 1 | 0.570 | 0.604 | 1 | |
| Total | |||||||
| K | 1 | ||||||
| E | 0.31 | 1 | |||||
| M | 0.568 | 0.6 | 1 | ||||
| Snow | |||||||
| Permanent snow cover >1 | K | E | M | Maximal snow depth | K | E | M |
| K | 1 | K | 1 | ||||
| E | 0.6 | 1 | E | −0.053 | 1 | ||
| M | 0.581 | 0.77 | 1 | M | 0.296 | 0.631 | 1 |
1 Kilpisjärvi, 2 Enontekiö, 3 Muonio.
© 2017 by the authors. Licensee MDPI, Basel, Switzerland. This article is an open access article distributed under the terms and conditions of the Creative Commons Attribution (CC BY) license (http://creativecommons.org/licenses/by/4.0/).
Share and Cite
MDPI and ACS Style
Lépy, É.; Pasanen, L. Observed Regional Climate Variability during the Last 50 Years in Reindeer Herding Cooperatives of Finnish Fell Lapland. Climate 2017, 5, 81. https://doi.org/10.3390/cli5040081
AMA Style
Lépy É, Pasanen L. Observed Regional Climate Variability during the Last 50 Years in Reindeer Herding Cooperatives of Finnish Fell Lapland. Climate. 2017; 5(4):81. https://doi.org/10.3390/cli5040081
Chicago/Turabian StyleLépy, Élise, and Leena Pasanen. 2017. "Observed Regional Climate Variability during the Last 50 Years in Reindeer Herding Cooperatives of Finnish Fell Lapland" Climate 5, no. 4: 81. https://doi.org/10.3390/cli5040081
Note that from the first issue of 2016, this journal uses article numbers instead of page numbers. See further details here.