Article

A Statistical Analysis of the Relationship between Brown Haze and Surface Air Pollution Levels on Respiratory Hospital Admissions in Auckland, New Zealand

by
Kim Natasha Dirks
1,*,
James Scarfe
2,
Nicholas Philip Talbot
3,
Roger Marshall
1 and
Jennifer Anne Salmond
4
1
School of Population Health, Faculty of Medical and Health Sciences, University of Auckland, Private Bag 92019, Auckland 1142, New Zealand
2
Bay of Plenty District Health Board, Tauranga Hospital, 829 Cameron Road, Private Bag 12024, Tauranga 3134, New Zealand
3
Auckland Council, Private Bag 92300, Auckland 1010, New Zealand
4
School of Environment, Faculty of Science, University of Auckland, Private Bag 92019, Auckland 1142, New Zealand
*
Author to whom correspondence should be addressed.
Climate 2017, 5(4), 86; https://doi.org/10.3390/cli5040086
Submission received: 6 August 2017 / Revised: 12 September 2017 / Accepted: 19 November 2017 / Published: 23 November 2017
(This article belongs to the Special Issue Urban Climate, Air Pollution, and Public Health)

Abstract

:
Eleven years of hospital admissions data for Auckland, New Zealand for respiratory conditions are analyzed using a Poisson regression modelling approach, incorporating a spline function to represent time, based on a detailed record of haze events and surface air pollution levels over an eleven-year period, taking into account the daily average temperature and humidity, the day of the week, holidays and trends over time. NO2 was the only pollutant to show a statistically significant increase (p = 0.009) on the day of the haze event for the general population. Ambient concentrations of CO, NO and NO2 were significantly associated with admissions with an 11-day lag period for the 0–14 year age group and a 5–7 day lag period for the 65+ year age group. A 3-day lag period was found for the 15–64 year age group for CO, NO and PM10. Finally, the incidence of brown haze was linked to significant increases in hospital admissions. A lag period of 5 days was recorded between haze and subsequent increases in admissions for the 0–14 year age group and the 65+ group and an 11-day lag for the 15–64 year age group. The results provide the first statistical link between Auckland brown haze events, surface air pollution and respiratory health. Medical institutions and practitioners could benefit from improved capacity to predict Auckland’s brown haze events in order prepare for the likely increases in respiratory admissions over the days ahead.

1. Introduction

Research has linked poor air quality with numerous adverse health outcomes, including but not limited to, cardiovascular disease [1,2,3], myocardial infarction and cerebrovascular disease [4,5], respiratory conditions requiring hospital admission [6,7] and lung cancer [8,9]. Poor air quality and adverse health outcomes are not geographically isolated events, with major studies carried out in North America [10,11], South America [12], Europe [13], Eastern Asia [14] and India [15], all reporting positive associations. The type of air pollutant studied varies according to the study scope but typically focuses on particulate matter 2.5 microns and smaller (PM2.5) [6,16] and 10 microns and smaller (PM10) [17], as well as gases, including ozone (O3) and oxides of nitrogen (NO, NO2) [17,18]. Some studies consider the population as a whole [1,19] while others target specific subgroups such as men [8], women [20], or children [21,22].
Despite the diversity of pollutants studied, target groups researched and geographical locations explored, no study has reported a maximum safe level of air pollution exposure and uniform threshold effects have yet to be identified [11,23]. The inconsistent extent of the observed effects of air pollution exposure on health can be related to the different air pollutants that prevail at different locations worldwide [24]. The distribution of pollutants over a city is associated with many factors, including geographical location, socio-economic status of the population and population size [25].
Although it is a geographically-isolated island state with a relatively small population, New Zealand is affected by poor air quality at times. It has been estimated that PM10 exposure is responsible for 1175 premature deaths and 607 extra hospital admissions for respiratory and cardiac illnesses yearly, based on a population of 4.1 million inhabitants [23,24].
In New Zealand, there has been little work investigating the associations between air pollution and mortality and morbidity. Two studies have investigated the relationship between PM10 and hospital admissions in regional studies in Christchurch, New Zealand [25,26], reporting a significant association between PM10 levels and cardio-respiratory admissions, with a 3.4% increase in respiratory admissions for each interquartile increase in PM10 (with an interquartile value 14.8 μg/m3). An Australasian study, which included Auckland amongst the cities considered, investigated three years of data and NO2 concentrations in isolation and suggested that there is an association between respiratory admissions and NO2 in young people, with the largest being a 6.0% increase in asthma admissions (5–14 years) in relation to a 5.1 ppb increase in 24-h NO2 concentrations [27]. The only study to focus specifically on Auckland’s air quality and mortality employed airshed modelling and NO2 as the pollutant and found NO2 concentrations to be associated with mortality [28]. Note that this study was carried out 12 years ago and used a relatively short time series of four years for the analysis. Until now, no studies have investigated the relationship between Auckland’s air quality and its morbidity, nor has any study used multiple pollutants in its assessment.
In addition, all New Zealand studies to date have relied solely on data from a limited number of surface-level fixed air pollution monitoring sites [25,26,28]. Given the high spatial variability in concentrations due to the prevalence of vehicle exhaust emissions, it is not clear the extent to which measurements from such sites are representative of the average exposure of the city’s residents [29]. Moreover, air quality data from fixed sites are only accessible for research use some months after calibration and other quality assurance procedures have been conducted. Thus, the data are limited in terms of their usefulness in forecasting short-term health impacts for hospital planning. Brown haze, a visual indicator of air pollution that sometimes appears over Auckland’s skyline, is not restricted in these ways. Auckland’s haze is here-in described as brown haze due to the distinct brown discoloration when viewed from a distance (Figure 1). The brown moniker was felt necessary to create a distinction from mist haze. Mist haze is white when observed and is not related to high air pollution events.
Recent research carried out in Auckland investigating meteorological conditions contributing to brown haze events, based on a long-term photographic record, found that cool temperatures and low wind speeds are linked to high-intensity haze events [30]. Another investigation, incorporating back-trajectory meteorological modelling, further identified the importance of long-term stable air masses and local pollution sources in its formation [31]. Studies have shown that much of the variance in Auckland’s NO2 levels during the morning rush hour commute can be explained by meteorological conditions, including high atmospheric pressure, cool temperatures and calm winds, conditions also conducive to brown haze formation and observed predominantly during the winter months [32]. A further study supported these findings by linking increased concentrations of ground-based NO and NO2 to days when a brown haze is visible [33]. Moreover, a short-term study used filter analysis to establish a link between increased PM levels and diesel emissions to the occurrence of brown haze [34].
With links between air pollution and health and air pollution and brown haze established, it is reasonable to postulate an association between brown haze formation and adverse health outcomes. In this paper, we investigate these links using datasets extending back 11 years, including a comprehensive brown haze photographic record, hospital admissions records, surface air pollution for four commonly measured air pollutants (rather than just one), as well as meteorological data.

2. Methods

2.1. Study Population

The population of the Auckland District Health Board, the catchment area for the hospital admissions data, is 457,000 people. The area covers approximately 150 km2 [35] (Figure SI.1) and is bordered by the Waitemata Harbor to the north and the Manukau Harbor to the south. Traffic in the central Auckland area can become congested, degrading the air quality [29,36].

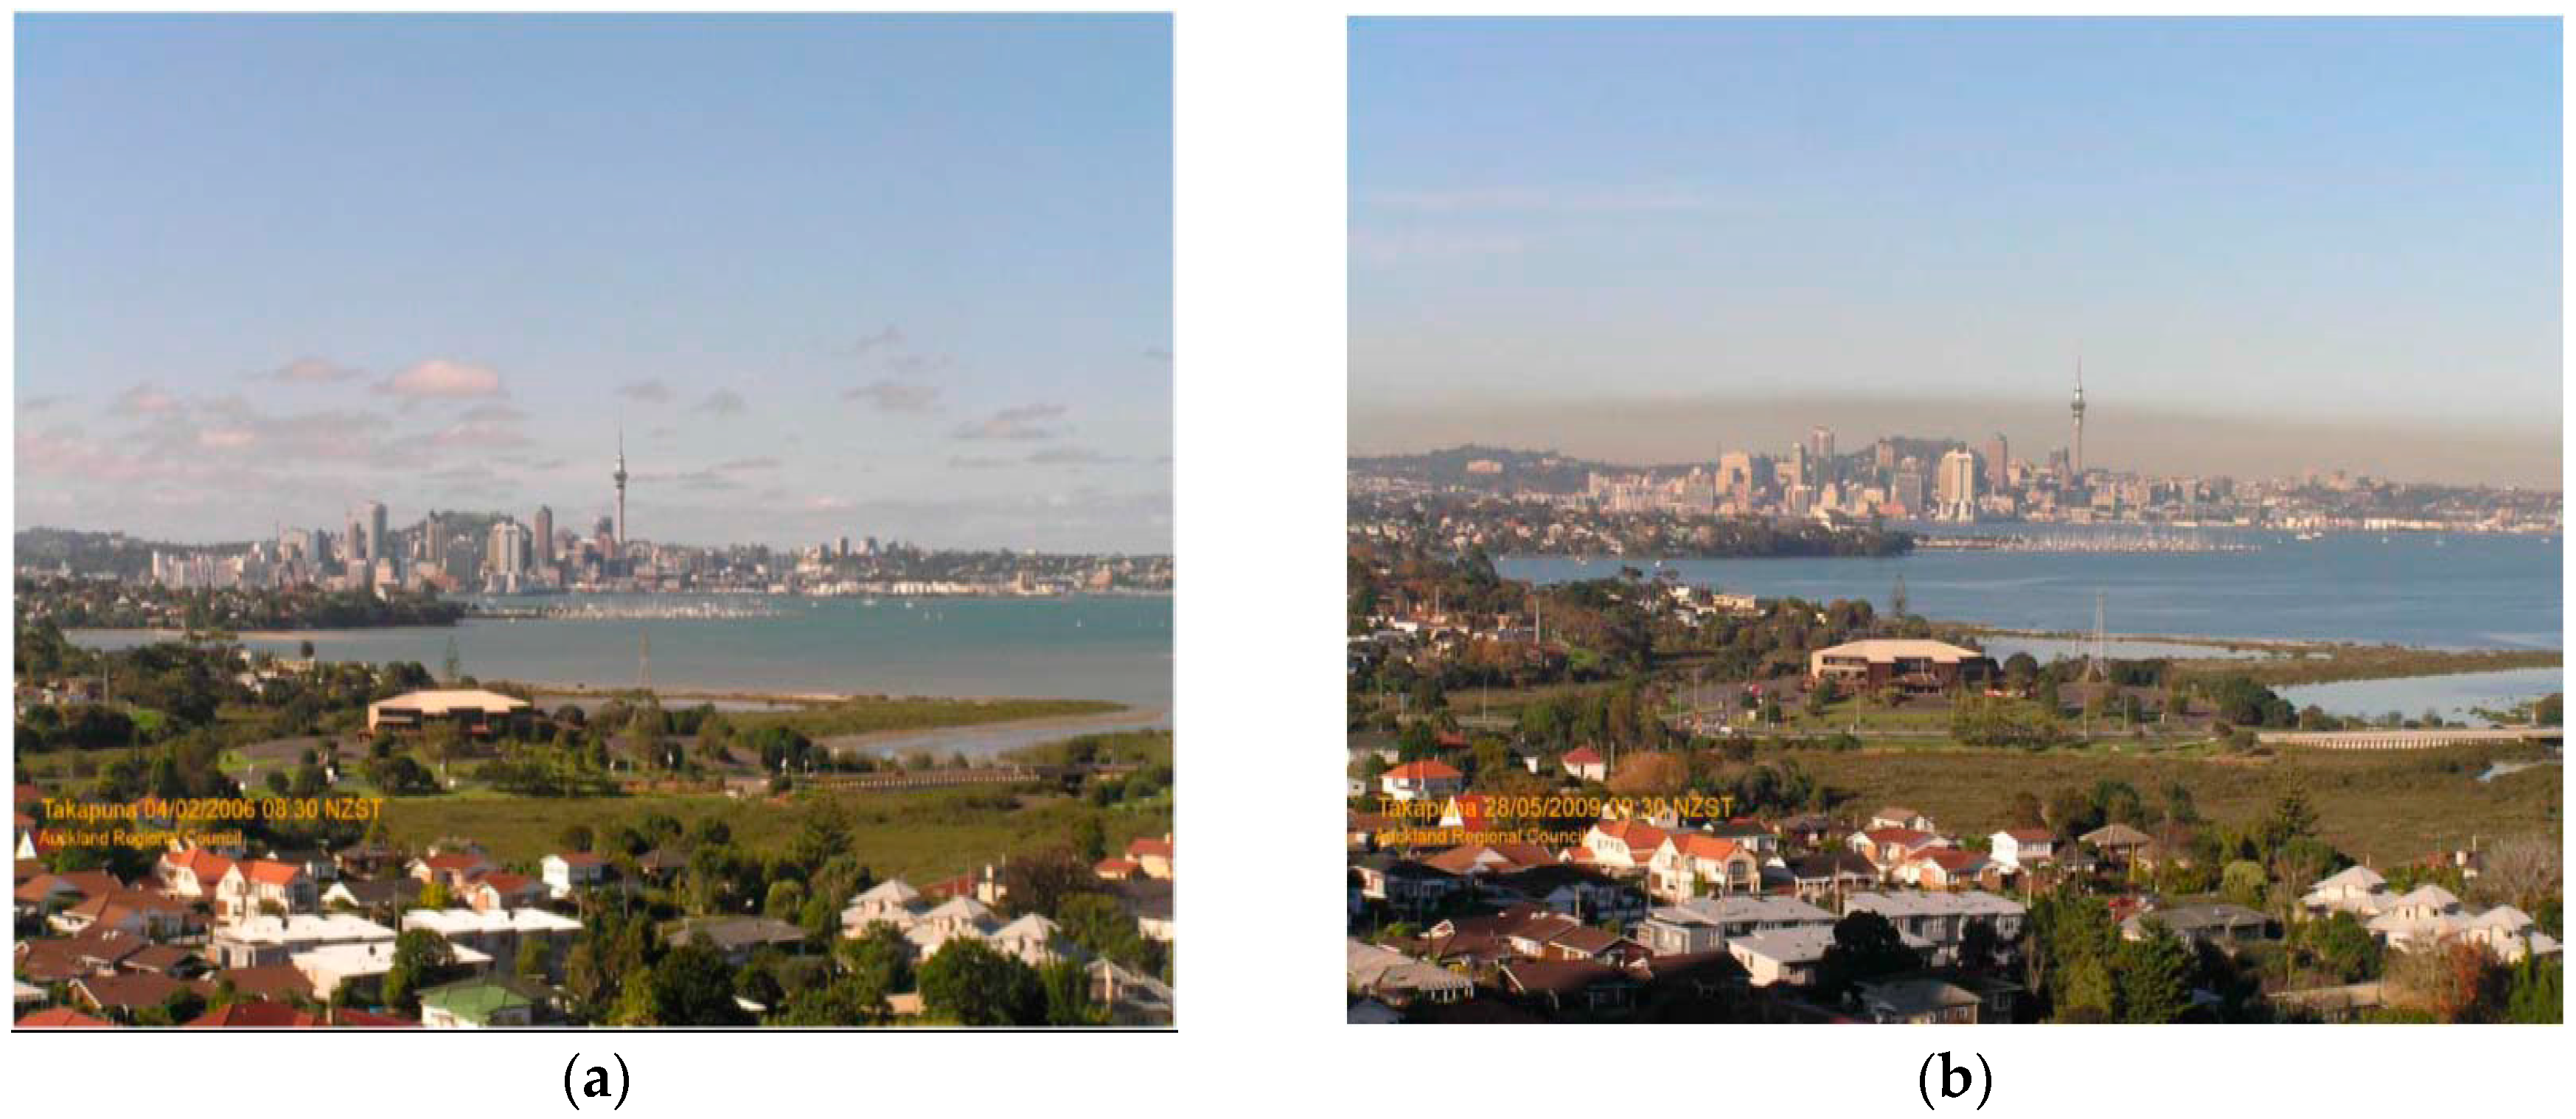
2.2. Brown Haze Data

Brown hazes appear over Auckland at times during the cool season from May through to August. From 2001 to 2011, a photographic record of brown haze events was created by the former Auckland Regional Council. For this period, every day during the cool season (May through to August) was classified as either a brown haze day or a non-brown haze day based on the intensity and duration of discoloration in the sky [30,31]. Figure 1 provides examples of clear and brown haze days over Auckland. The classification system has been used in previous research [30,31,33]. Figure 1 provides examples of clear and brown haze days over Auckland. On average, there were eight brown haze days in each of the cool seasons from 2001 to 2011. However, there is a large amount of variation in the number of days from year to year (ranging from one day (2005) to 13 days (2009)).

2.3. Air Pollution and Climate Data

The (former) Auckland Regional Council provided daily mean values of four pollutants: NO, NO2, CO and PM10. Measurements were collected from a monitoring site located on Lincoln Road in West Auckland. Although not central, the Lincoln Road site provides a dataset covering the whole of the 2001 to 2011 required time period (for some of the pollutants) and is located within the Auckland urban airshed. All air pollution data used in this study were obtained using regulatory standard instrumentation, including a Beta Attenuation Monitor for the PM data and chemiluminescence analyzers for the NO/NO2/NOx measurements. The data from this site were calibrated and quality assured as part of the procedures associated with Auckland Council’s on-going air quality monitoring network ensuring compliance methods to regulatory standards.
The Lincoln Road site is set back from a busy arterial road. However, prior research has suggested that measurements at the site are closely correlated with measurements from other Auckland urban monitoring sites [33]. Therefore, the Lincoln Road site is assumed to be representative of Auckland’s ground-based air pollution levels.
The surface meteorological measurements (temperature (in °C) and relative humidity (in %)), were obtained from the Auckland Airport weather station through CliFlo, New Zealand’s National Climate Database [37].

2.4. Hospital Admissions

Hospital admissions data (obtained through an application process from the New Zealand Ministry of Health) were non-identifiable (encrypted with respect to the NHI number) data from the national minimum dataset. They consisted of hospital discharge data within the Auckland District Health Board catchment with a primary diagnosis based on the International Classification of Diseases 10th Re-vision (ICD10) diseases of the respiratory system (J00-99) over the period of 2001–2011 inclusive. Daily counts of acute respiratory admissions were computed for the general population and three separate age groups (0–14 years, 15–64 years and 65+ years).

2.5. Statistical Methods
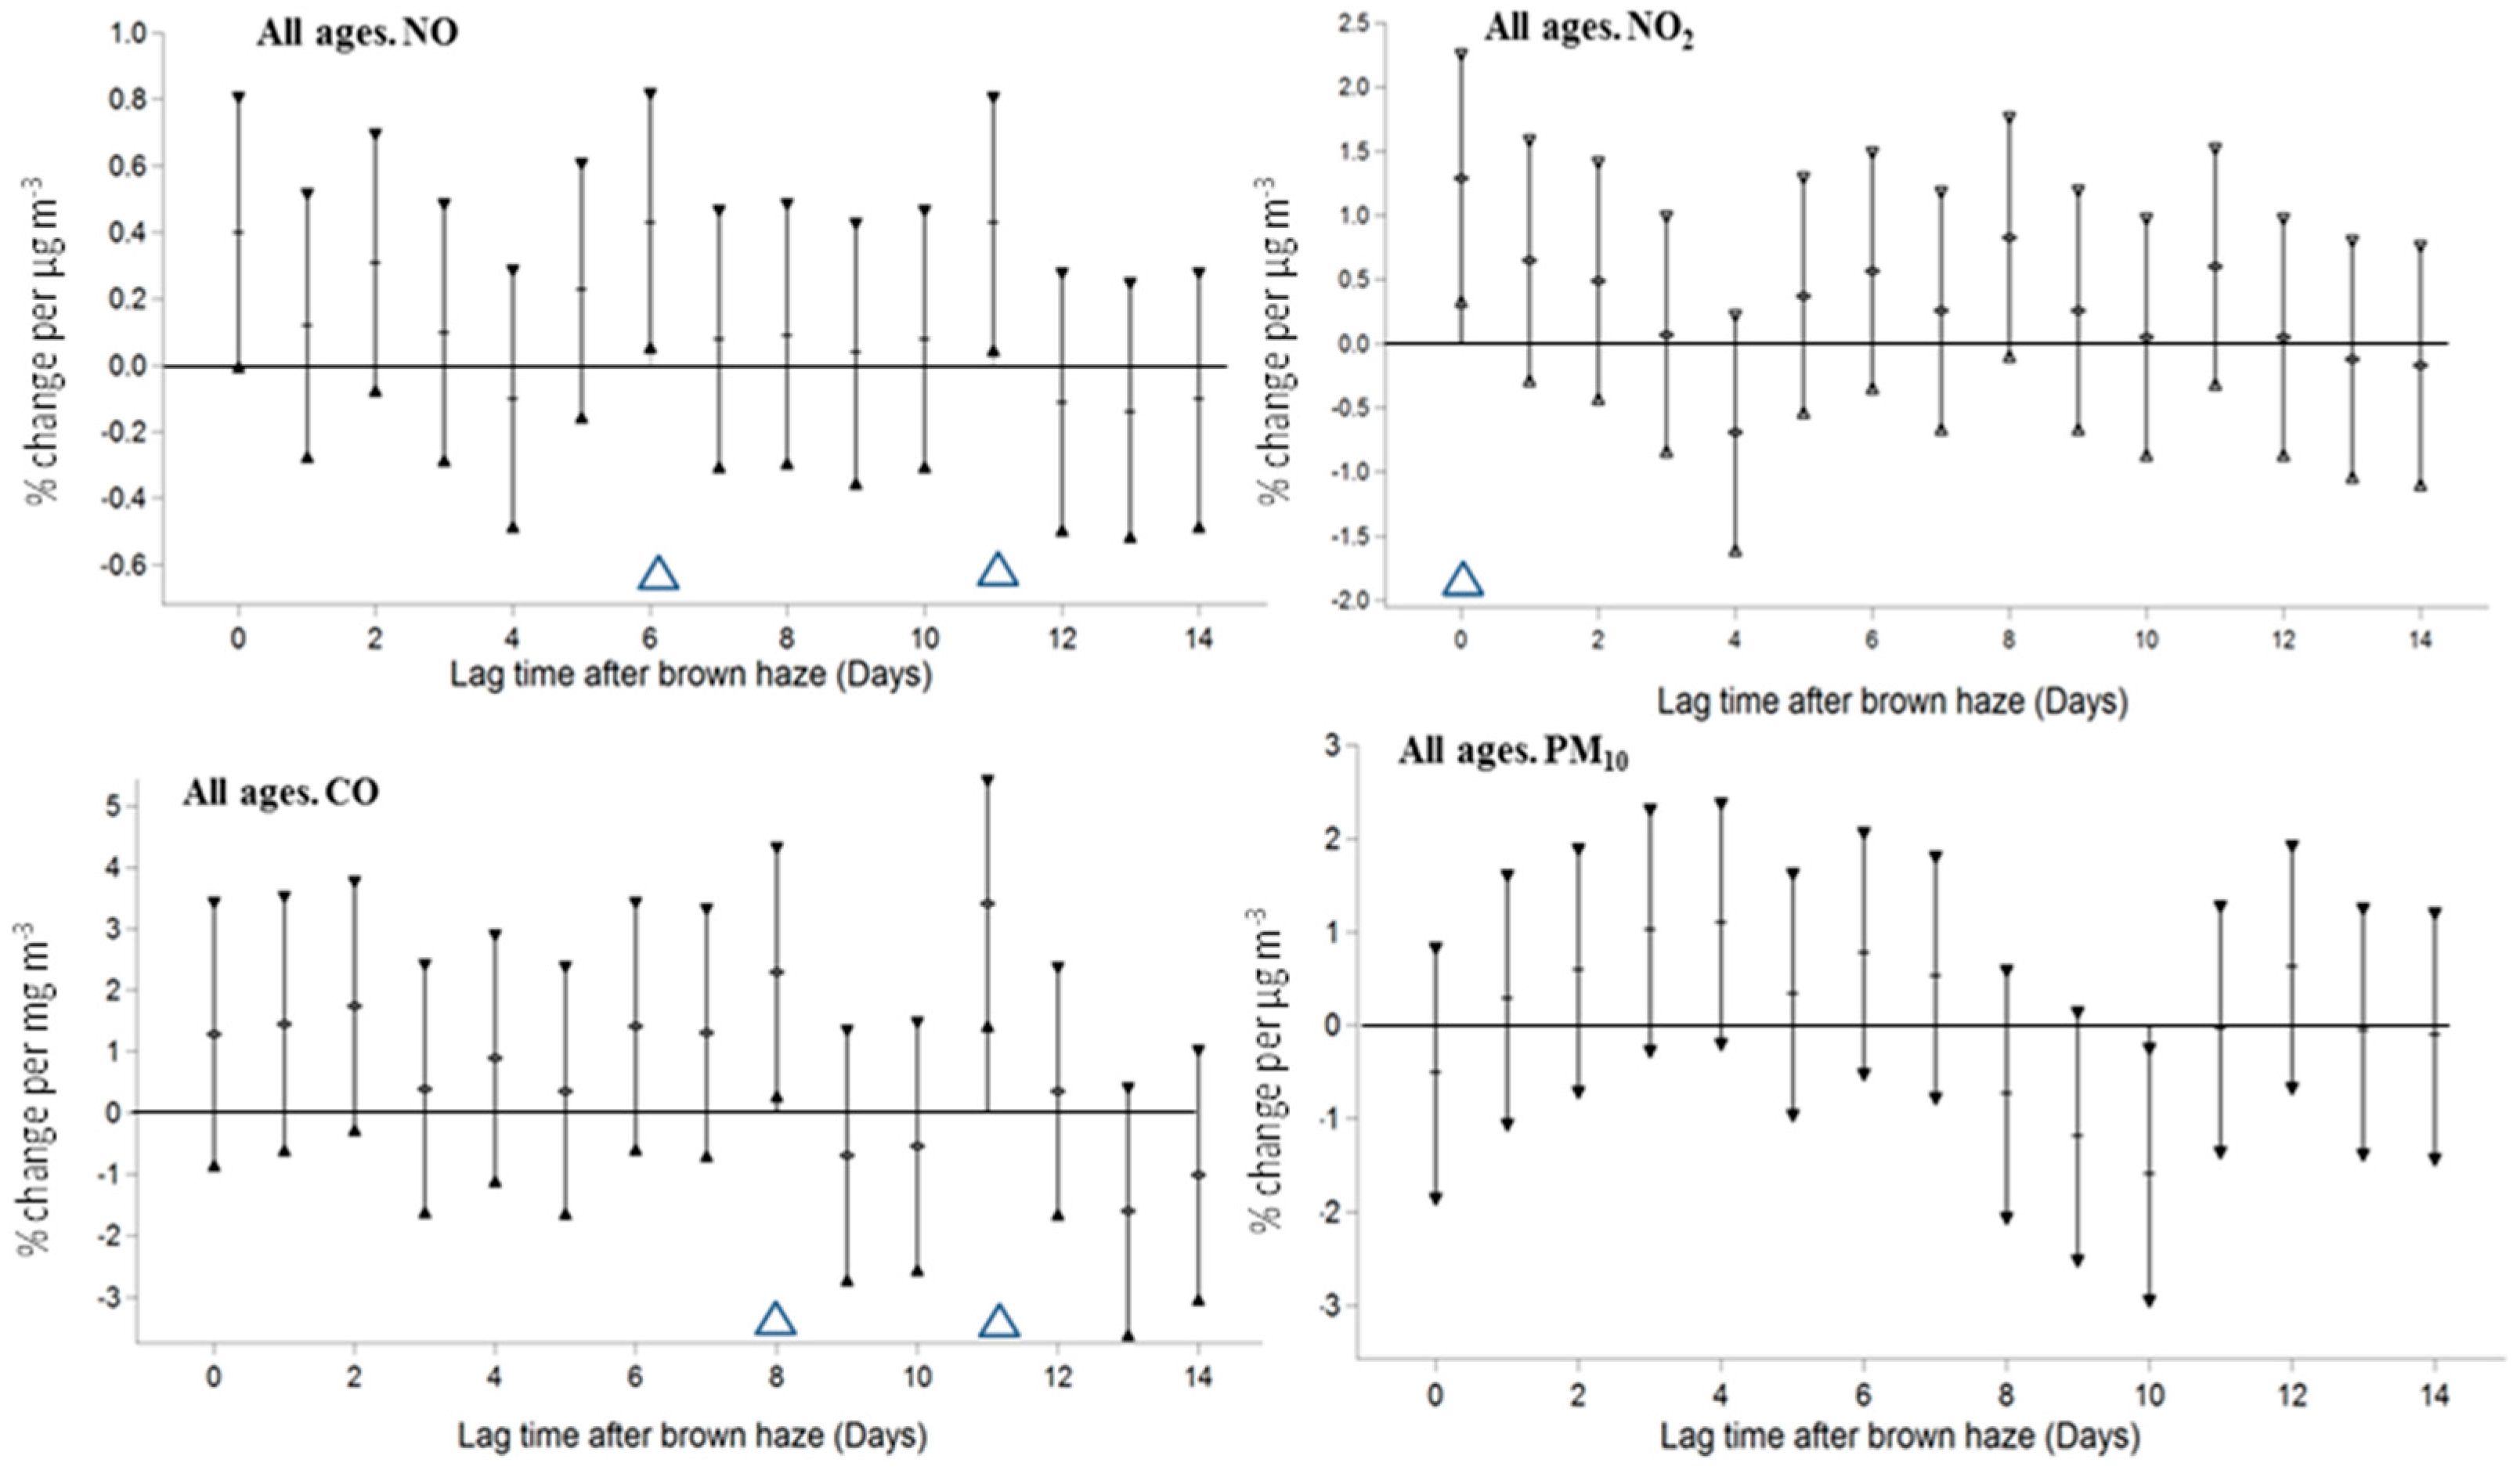
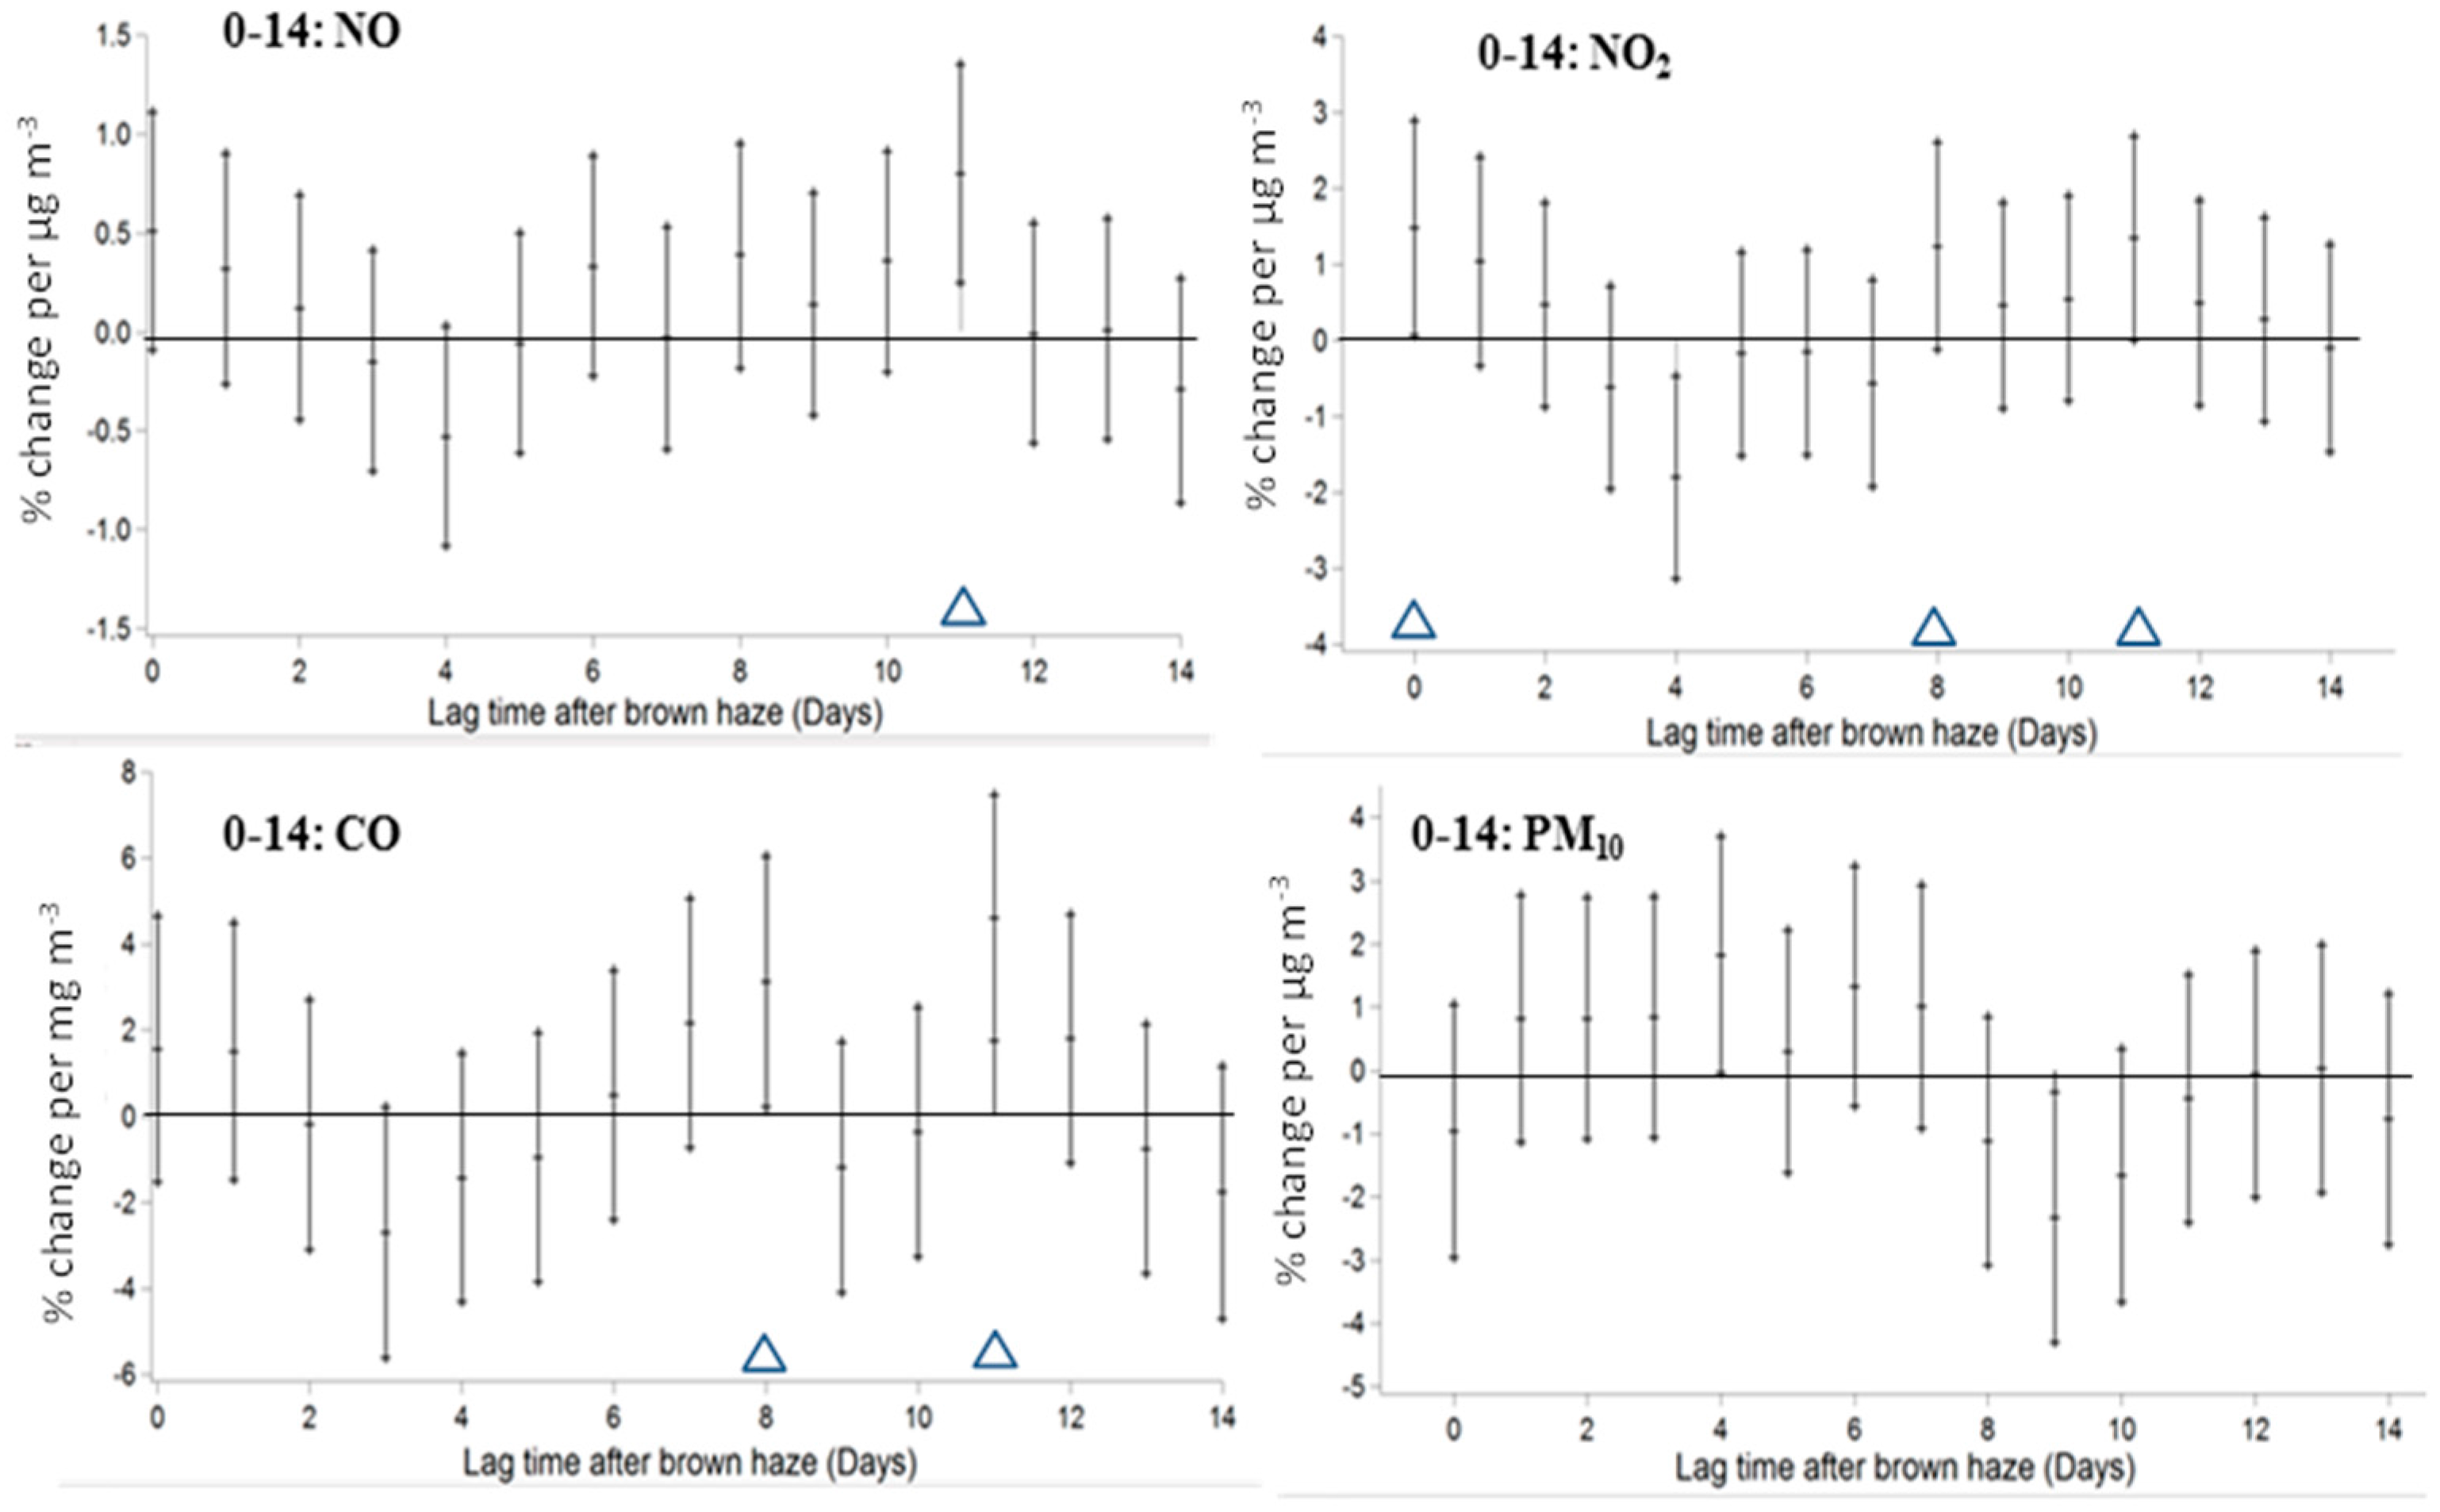
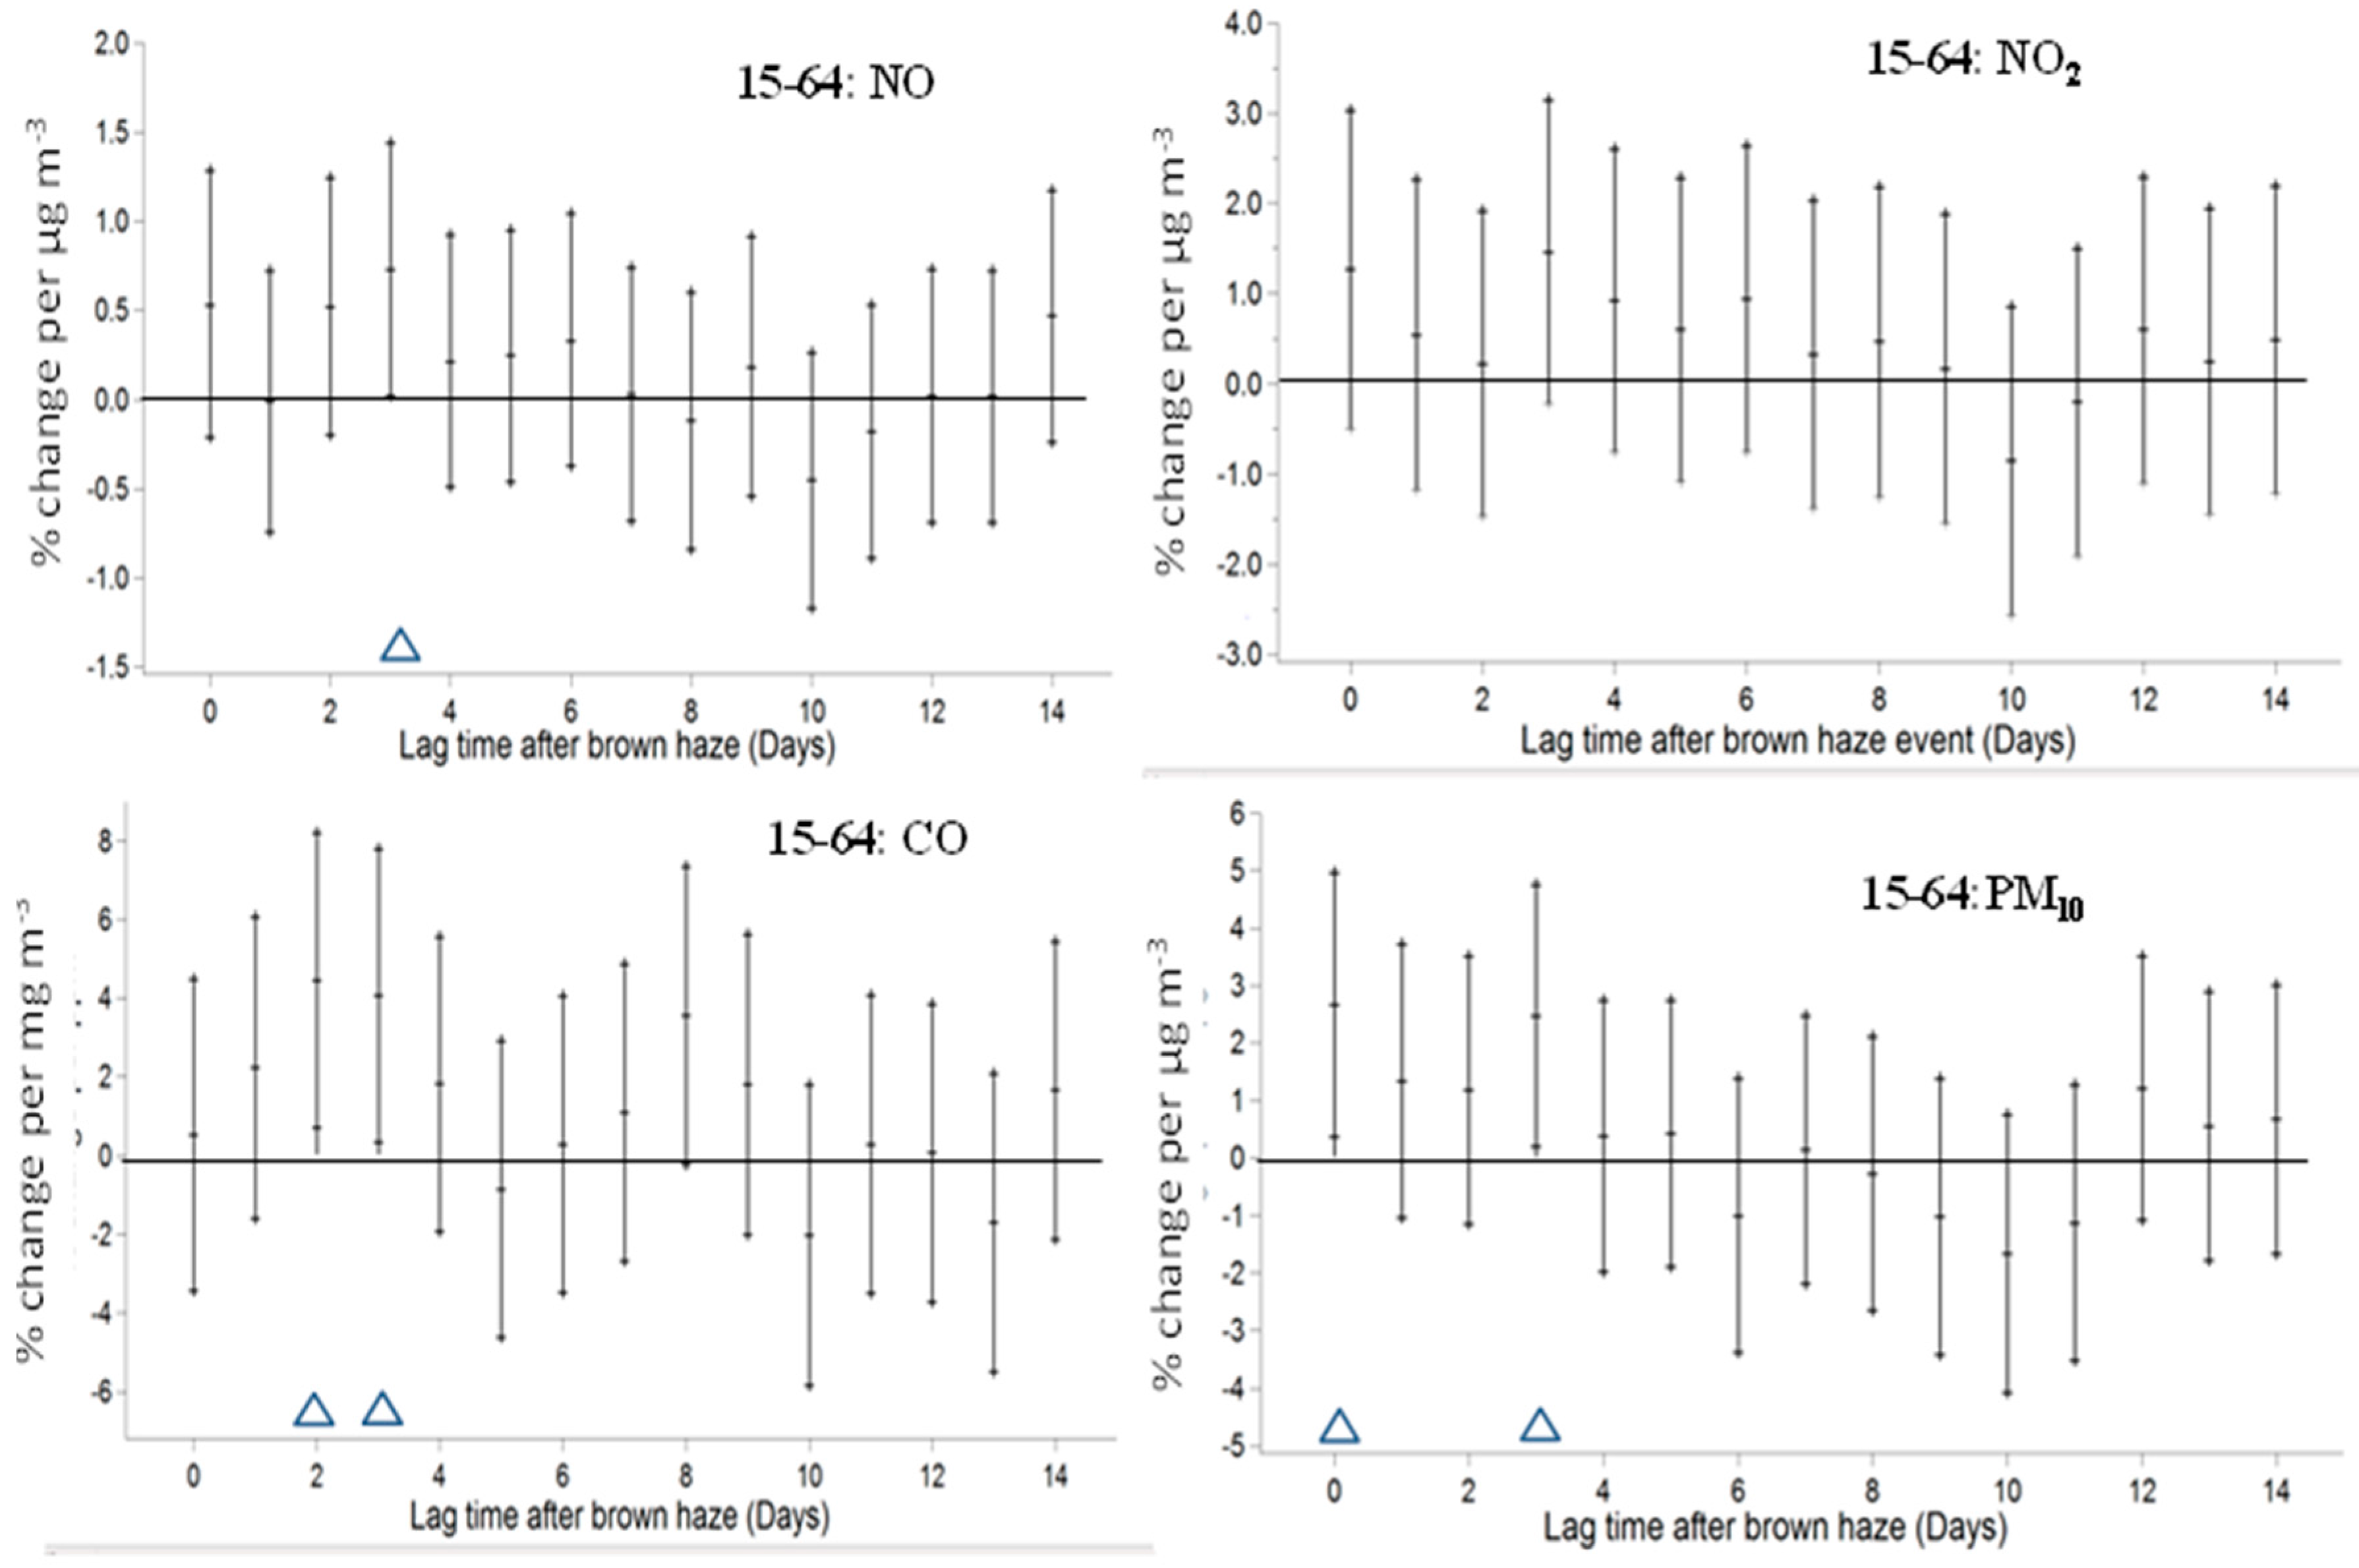
Time series analysis using generalized additive modelling (GAM) was used to determine whether hospital admissions were associated with brown haze events and air pollution. The Statistical software package SAS Version 9.3, with the GAM procedure for generalized additive modelling, was used for all analyses.
Since Auckland studies have linked temperature and humidity to respiratory and cardiovascular disease [38], the daily average temperature and humidity were investigated as confounding factors. The effects of temperature can be non-linear, with increases in admissions occurring at both high and low temperatures [39], with non-linear temperature effects requiring additional non-parametric smoothing parameters to appropriately adjust for the effect of temperature. However, based on the current dataset, it was found that nonlinear representation was not necessary, so a linear temperature effect was assumed. The data indicate that hospital admissions vary by day of the week. Therefore, dummy variables indicating the day of the week were inserted into the model. An indicator variable for public holidays was also included as such days may be confounders.
In the model, it was assumed that unmeasured confounders, such as seasonal variations and changes in population, vary smoothly with time [39]. A smooth function of time with at least two degrees of freedom was therefore included in the model. A cubic smoothing spline was chosen for the purpose and the degrees of freedom selected for each model using a generalized cross validation function (GCV), as it has been shown to provide unbiased estimates of the log-relative risk for air pollution [40]. A sensitivity analysis of the number of degrees of freedom in relation to beta was also carried out.
Influenza epidemics were also considered as a potential confounder. However, recent research in New Zealand suggests that their inclusion does not significantly alter estimates of air pollution effects [26]. Therefore, it was assumed that any effects would be adequately accounted for with the application of the smooth function of time as described above.
The base model therefore takes the form of:
Y t = P o i s s o n ( μ t )
l o g ( μ t ) = β 0 + β 1 x t + β 2 z t + β 3 r t + β 4 d t + β 5 h t + s ( t , d f )
where Yt is the admissions count, xt is the pollutant predictor, zt is the daily average temperature, rt is the daily average relative humidity, dt represents the day of the week dummy variable, ht is the holiday variable and s(t,df) is the smoothed spline function of time with df being the number of degrees of freedom, kept at the default value of df = 4. The model estimates β1, the pollution effect. Exponentiating β1 gives the increase in admissions per unit increase in the pollutant. The results are presented as a percentage change in admissions per μg·m−3 of pollutant as follows:
%   C h a n g e   i n   a d m i s s i o n s   p e r   1   μ gm 3 = ( exp ( β 1 ) 1 ) × 100
A previous time series study of respiratory admissions and air pollution carried out in Christchurch, New Zealand found significant associations between respiratory hospital admissions and PM10 for lag periods of up 14 days [26]. Based on the results of earlier work in New Zealand lag period of up to 14 days were investigated. Separate models (single lag models) with different lags of up to 14 days (2 weeks) for the occurrence of brown haze and the pollutants were constructed and separate analyses carried out by age group (0–14, 15–65 and 65+ years).

3. Results

The summary statistics for the air quality, hospital admissions and temperature data are presented in Table 1. Missing data were a small proportion (less than 4%). Approximately two-fifths of the respiratory admissions were recorded during the four months that make up the cool season in the Southern Hemisphere (May to August).
The air quality data cover differing periods of time depending on when monitoring commenced for a particular pollutant. CO was monitored for the entire period of the study (January 2001 to December 2011). The monitoring of PM10 commenced in January 2003 and the monitoring of NO and NO2 began in April of 2003. During the cool season, the mean daily average for all pollutants is elevated compared to the mean value for the full year (Table 1), with PM10 showing the least amount of seasonal variation while NO shows the greatest.
The estimated percentage changes in hospital admissions with 95% confidence intervals associated with NO2, NO, PM10 and CO for both the general population and age groups 0–14, 15–64 and 65+ are shown in Figure 2, Figure 3, Figure 4 and Figure 5 for the full period. Estimates of the percentage change in hospital admissions were given for the current day (lag 0 days) and lags of one to fourteen days. NO2 was the only pollutant to show a statistically significant increase (p = 0.009) on the current day for the general population. Statistically significant results were observed for a variety of lag periods, however, with apparent trends within the lag period between differing pollutants. All age groups showed statistically significant percentage changes in admissions. However, the lag time between the haze events and hospital admissions varied according to both the pollutant and age group. A number of statistically significant (p < 0.05) negative correlations between air pollution concentrations and respiratory hospital admissions were observed for the general population and within the three age groups.
Estimates of the percentage change in admissions associated with a brown haze day with 95% confidence intervals are provided in Figure 6. Statistically significant increases associated with a haze day were seen for the general population and all age groups. In particular, on the fifth lag day, statistically significant (p < 0.05) increases were seen across the general population, the 0–14 and 65+ years age groups.

4. Discussion

This is the only study to investigate the association between air pollution concentrations and respiratory hospital admissions in Auckland. The study considered 11 years of data and found statistically significant associations between surface level concentrations of the pollutants CO, NO and NO2 and respiratory hospital admissions in Auckland. Furthermore, this is the first study in New Zealand linking brown haze formation to respiratory hospital admissions.
The data were examined for a lag period of up to 14 days after the event for all pollutants and population groups for which statistically significant results were found. To investigate if the results found for the lag periods were real and not a product of a confounding factor remaining in the model, lead days out to 14 days were tested. The number of statistically significant results found was more than would be expected by chance alone, giving us confidence that the effects seen in the models with air pollution lag time are real associations.
PM10 has previously been reported to have an adverse effect on respiratory hospital admissions in both New Zealand [26] and in Australia [27]. The results reported in this study indicate that PM10 was the pollutant the least likely to be associated with respiratory hospital admissions in Auckland, with the group 15–64 years with lags of 0 days and 3 days showing the only significant correlations.
There are a number of possible reasons for this. Auckland is a coastal city; sea salt has been found to contribute approximately half the mass of coarse particulates (2.5 µm to 10 µm in diameter) in both summer and winter [36]. It has also been noted that the sea salt portion is likely to be high on windy days (low pollution) and low on calm days (higher pollution) [34]. The variation in particulate mass that is not caused by anthropogenic sources may act to obscure the effect that PM10 air pollution is having on respiratory hospital admissions. This effect appears to be evident in the results obtained. It should be noted, though, that while statistical significance was not reached for any lag for PM10 concentrations, respiratory admissions in relation all ages for PM10 showed the most consistent day-to-day increase for all pollutants and age groups, peaking at a lag of four days and then decreasing again. Significance may have been reached had a different statistical approach been used, such as clustered distributed lags.
The pollutants NO, NO2 and CO were found to be associated with an increased number of respiratory admissions in Auckland. For the 0–14 age group, Figure 3 shows a similar trend for hospital admissions for NO, NO2 and CO. This trend is defined by an initial increase in admissions, followed by a drop in admissions, evident from a negative correlation between Days 3 and 4. A non-linear increase in admissions until lag Day 11 was then observed, when all gases reveal statistically significant results. The explanation for the significant 11-day lag time is unclear. None-the-less, these results support previous studies which have indicated an increased sensitivity of young people to gaseous pollutants such as NO and NO2 [21,22].
With the 65+ years age groups, for NO, NO2 and CO, there is an overall trend of a maximum increase in respiratory hospital admissions for lags of between 4 and 7 days (Figure 5). Specifically, significant increases in hospital admissions are found after 5 days for NO, 4–6 days for CO and 7 days for NO2. For all age groups tested, statistically significant positive associations were generally followed by statistically significant negative correlations several days later. This could indicate a morbidity displacement effect. The reason for the earlier admissions for the 65+ years age group compared to the 0–14 years age group is not clear. This may be a result of a weak immune system increasing the severity of the effects of these gaseous pollutants. Another explanation may be related to social factors for the 65+ years age group, such as advice from elderly care-workers, the ability of elderly people to verbalize their discomfort, along with a willingness or ability to seek medical help. Overall, the magnitude of the effect seen in Auckland in the general population is consistent with the findings of other studies in North America, Asia and Europe [10,11,12,13,14,15]. The impact of lag times on health outcomes after pollution events is not commonly reported upon [29].
Brown haze is associated with increased concentrations of surface pollutants in Auckland [30,31,33]. The brown haze events are an indicator of elevated levels of all pollutants across Auckland, in particular in central Auckland. The brown haze indicates that the mix of pollutants specific to Auckland is at a high level. On average, the four measured pollutants used in this study have concentration consistently above the 90th per-centile for each pollutant when brown haze events occur. Therefore, a brown haze event is a visual indicator of poor air quality with pollutants that are associated with health outcomes. Moreover, a direct relationship between brown haze events and the percentage increase in respiratory hospital admissions is revealed (Figure 6). For all age groups, statistically significant increases in admissions are found at various lag times: for the 0–14 years age group, a lag time of 1 and 5 days, for the 15–64 years age group, an 11-day lag time and for the 65+ years age group, a 5-day lag time. The lag periods of 5 and 11 days were also significant for the 0–14 and 65+ years age groups for CO and NO, whilst NO2 was significant for lag times of 7 and 11 days. These results reveal a relation between brown haze events over Auckland; and an increase in gaseous pollutants NO, NO2 and CO is associated with an increase in hospital admissions for respiratory disorders.
These results have the potential to be utilized as a measurement tool—one that is easily assessable to the general public—to monitor progress in improving air quality in Auckland, especially in the cooler months. Previous studies have inferred correlations between the pollutant and health effects, utilizing the results for a single pollutant. This approach fails to take into account the complex mix of air pollutants to which people are exposed. The four pollutants considered for this research can affect human health via different pathways, perhaps explaining the lack of uniformity between the associations for the four pollutants and respiratory hospital admissions. Moreover, a single pollutant in isolation cannot be considered an indicator of the overall effect on morbidity. Although there are subtle differences in the results, this study finds significant correlations between NO, NO2 and CO and respiratory health at different lag times. The finding for PM10 does not support the findings from the gaseous pollutants, most likely due to the increase in PM10 during high wind speed days due to the presence of coarse mode sea salt.
Further work should investigate PM2.5 concentrations in relation to health outcomes in Auckland. Overseas studies have found associations between PM2.5 and hospital admissions. It has been suggested that PM2.5 acts as a suitable indicator for the pollutant mix. This would largely eliminate the effect of sea spray on particulate matter concentrations as sea spray is generally considered to fall in the 2.5 and 10 micron diameter range.

Supplementary Materials

The following are available online at www.mdpi.com/2225-1154/5/4/86/s1, Figure SI.1: Districts of Auckland that are covered by Auckland district health board. (Insert) Hauraki Gulf islands and Great Barrier Island.

Acknowledgments

This research was carried out as part of a Masters in Public Health Thesis and was completed without the support of any external funds.

Author Contributions

James Scarfe completed the basis of this paper as part of an MSc thesis project supervised by Kim Natasha Dirks, Roger Marshall, and Jennifer Anne Salmond. Nicholas Philip Talbot contributed to the research and output and conversion into a paper suitable for publication. Kim Natasha Dirks and Nicholas Philip Talbot wrote the paper. Jennifer Anne Salmond provided advice regarding the haze data in the context of other papers investigating Auckland’s brown haze. Roger Marshall provided statistical input into the paper.

Conflicts of Interest

The authors declare no conflict of interest.

References

  1. Pope, C.A.; Burnett, R.T.; Thurston, G.D.; Thun, M.J.; Calle, E.E.; Krewski, D.; Godleski, J.J. Cardiovascular Mortality and Long-Term Exposure to Particulate Air Pollution. Epidemiological Evidence of General Pathophysiological Pathways of Disease. Circulation 2004, 109, 71–77. [Google Scholar] [CrossRef] [PubMed]
  2. Laden, F.; Schwartz, J.; Speizer, F.E.; Dockery, D.W. Reduction in fine particulate air pollution and mortality: Extended follow-up of the Harvard Six Cities Study. Am. J. Respir. Crit. Care Med. 2006, 173, 667–672. [Google Scholar] [CrossRef] [PubMed]
  3. Pope, C.A.; Turner, M.C.; Burnett, R.T.; Jerrett, M.; Gapstur, S.M.; Diver, W.R.; Krewski, D.; Brook, R.D. Relationships between fine particulate air pollution, cardiometabolic disorders and cardio-vascular mortality. Circ. Res. 2014, 116, 108–115. [Google Scholar] [CrossRef] [PubMed]
  4. Peters, A.; Dockery, D.W.; Muller, J.E.; Mittleman, M.A. Increased particulate air pollution and the triggering of myocardial infarction. Circulation 2001, 103, 2810–2815. [Google Scholar] [CrossRef] [PubMed]
  5. Beelen, R.; Stafoggia, M.; Raaschou-Nielsen, O.; Andersen, Z.J.; Xun, W.W.; Katsouyanni, K.; Dimakopoulou, K.; Brunekreef, B.; Weinmayr, G.; Hoffmann, B.; et al. Long-term exposure to air pollution and cardiovascular mortality: An analysis of 22 European cohorts. Epidemiology 2014, 25, 368–378. [Google Scholar] [CrossRef] [PubMed]
  6. Brauer, M.; Hoek, G.; Van Vliet, P.; Meliefste, K.; Fischer, P.H.; Wijga, A. Air pollution from traffic and the development of respiratory infections and asthmatic and allergic symptoms in children. Am. J. Respir. Crit. Care Med. 2002, 166, 1092–1098. [Google Scholar] [CrossRef] [PubMed]
  7. Atkinson, R.W.; Anderson, H.R.; Sunyer, J.; Qyres, J.; Baccini, M. Acute effects of particulate air pollution on respiratory admissions: Results from APHEA 2 project. Am. J. Respir. Crit. Care Med. 2001, 164, 1860–1866. [Google Scholar] [CrossRef] [PubMed]
  8. Nafstad, P.; Håheim, L.L.; Oftedal, B.; Gram, F.; Holme, I.; Hjermann, I. Lung cancer and air pollution: A 27 year follow up of 16,209 Norwegian men. Thorax 2003, 58, 1071–1076. [Google Scholar] [CrossRef] [PubMed]
  9. Turner, M.C.; Krewski, D.; Pope, C.A.; Chen, Y.; Gapstur, S.M.; Thun, M.J. Long-term ambient fine particulate matter air pollution and lung cancer in a large cohort of never-smokers. Am. J. Respir. Crit. Care Med. 2011, 184, 1374–1381. [Google Scholar] [CrossRef] [PubMed]
  10. Pope, C.A.; Ezzati, M.; Dockery, D.W.; Pope, C.A., III; Ezzati, M. Fine-particulate air pollution and life expectancy in the United States. N. Engl. J. Med. 2009, 360, 376–386. [Google Scholar] [CrossRef] [PubMed]
  11. Stylianou, M.; Nicolich, M.J. Cumulative effects and threshold levels in air pollution mortality: Data analysis of nine large US cities using the NMMAPS dataset. Environ. Pollut. 2009, 157, 2216–2223. [Google Scholar] [CrossRef] [PubMed]
  12. Romieu, I.; Gouveia, N.; Cifuentes, L.A.; de Leon, A.P.; Junger, W.; Vera, J.; Strappa, V.; Hurtado-Díaz, M.; Miranda-Soberanis, V.; Rojas-Bracho, L.; et al. Multicity study of air pollution and mortality in Latin America (the ESCALA study). Res. Rep. Health Eff. Inst. 2012, 171, 5–86. [Google Scholar]
  13. Künzli, N.; Kaier, R.; Medina, S.; Studnicka, M.; Chanel, O.; Fillinger, P.; Herry, M.; Horak, F., Jr.; Puybonnieux-Texier, V.; Quénel, P.; et al. Public health impact of outdoor and traffic related air pollution: A European assessment. Lancet 2000, 356, 795–801. [Google Scholar] [CrossRef]
  14. Wong, C.M.; Vichit-Vadakan, N.; Kan, H.; Qian, Z. Public Health and Air Pollution in Asia (PAPA): A multicity study of short-term effects of air pollution on mortality. Environ. Health Perspect. 2008, 116, 1195–1202. [Google Scholar] [CrossRef] [PubMed] [Green Version]
  15. Rizwan, S.A.; Nongkynrih, B.; Gupta, S.K. Air pollution in Delhi: Its Magnitude and Effects on Health. Indian J. Community Med. 2013, 38, 4–8. [Google Scholar] [PubMed]
  16. Chow, J.C.; Watson, J.G.; Mauderly, J.L.; Costa, D.L.; Wyzya, R.E.; Vedal, S.; Hidy, G.M.; Altshuler, S.L.; Marrack, D.; Heuss, J.M.; et al. Health Effects of Fine Particulate Air Pollution: Lines that Connect. J. Air Waste Manag. Assoc. 2006, 56, 1368–1380. [Google Scholar] [CrossRef] [PubMed]
  17. Katsouyanni, K.; Samet, J.M.; Anderson, H.R.; Atkinson, R.; Lertre, A.; Medina, S.; Samoli, E.; Touloumi, G.; Burnett, R.T.; Krewski, D.; et al. Air pollution and health: A European and North American approach (APHENA). Res. Rep. Health Eff. Inst. 2009, 142, 5–90. [Google Scholar]
  18. Nidhi, J.G. Air quality and respiratory health in Delhi. Environ. Monit. Assess. 2007, 135, 313–325. [Google Scholar] [CrossRef] [PubMed]
  19. Dockery, D.W.; Pope, C.A.; Xu, X.; Spengler, J.D.; Ware, J.H.; Fay, M.E. An association between air pollution and mortality in six U.S. cities. N. Engl. J. Med. 1993, 329, 1753–1759. [Google Scholar] [CrossRef] [PubMed]
  20. Miller, K.; Siscovick, D.; Sheppard, L.; Shepherd, K.; Sullivan, J.H.; Anderson, G.L.; Kaufman, J.D. Long-Term Exposure to Air Pollution and Incidence of Cardiovascular Events in Women. N. Engl. J. Med. 2007, 356, 447–458. [Google Scholar] [CrossRef] [PubMed]
  21. Gauderman, W.J.; Avol, E.; Gilliland, F.; Vora, H.; Thomas, D.; Berhane, K.; McConnell, R.; Kuenzli, N.; Lurmann, F.; Rappaport, E.; et al. The Effect of Air Pollution on Lung Development from 10 to 18 Years of Age. N. Engl. J. Med. 2004, 351, 1057–1067. [Google Scholar] [CrossRef] [PubMed]
  22. Zeng, X.-W.; Vivian, E.; Mohammed, K.A.; Jakhar, S.; Vaughn, M.; Huang, J.; Zelicoff, A.; Xaverius, P.; Bai, Z.; Lin, S.; et al. Long-term ambient air pollution and lung function impairment in Chinese children from a high air pollution range area: The Seven Northeastern Cities (SNEC) study. Atmos. Environ. 2016, 138, 144–151. [Google Scholar] [CrossRef]
  23. Kuschel, G.; Metcalfe, J.; Wilton, E.; Guria, J.; Hales, S.; Rolfe, K.; Woodward, A. Updated Health and Air Pollution in New Zealand Study—Volume 1: Summary Report. 2012, p. 89. Available online: http://www.hapinz.org.nz/HAPINZ%20Update_Vol%201%20Summary%20Report.pdf (accessed on 24 May 2017).
  24. Fisher, G.; Rolfe, K.; Kjellstrom, T.; Woodward, A.; Hales, S.; Sturman, A.P.; Kingham, S.; Petersen, L.; Shrestha, R.; King, D. Health effects due to motor vehicle air pollution in New Zealand. Report for the Ministry for the Environment, New Zealand. 2002. Available online: http://citeseerx.ist.psu.edu/viewdoc/download?doi=10.1.1.600.8685&rep=rep1&type=pdf (accessed on 24 May 2017).
  25. McGowan, J.A.; Hider, P.N.; Chacko, E.; Town, G.I. Particulate air pollution and hospital admissions in Christchurch, New Zealand. Aust. N. Z. J. Public Health 2002, 26, 23–29. [Google Scholar] [CrossRef] [PubMed]
  26. Fukuda, K.; Hider, P.N.; Epton, M.J.; Jennings, L.C.; Kingham, S.P. Including viral infection data supports an association between particulate pollution and respiratory admissions. Aust. N. Z. J. Public Health 2011, 35, 163–169. [Google Scholar] [CrossRef] [PubMed]
  27. Barnett, A.G.; Williams, G.M.; Schwartz, J.; Neller, A.H.; Best, T.L.; Petroeschevsky, A.L.; Simpson, R.W. Air pollution and child respiratory health: A case-crossover study in Australia and New Zealand. Am. J. Respir. Crit. Care Med. 2005, 171, 1272–1278. [Google Scholar] [CrossRef] [PubMed]
  28. Scoggins, A.; Kjellstrom, T.; Fisher, G.; Connor, J.; Gimson, N. Spatial analysis of annual air pollution exposure and mortality. Sci. Total Environ. 2004, 321, 71–85. [Google Scholar] [CrossRef] [PubMed]
  29. Coulson, G.; Olivares, G.; Talbot, N. Aerosol Size Distributions in Auckland. Air Qual. Clim. Chang. 2016, 50, 23–28. [Google Scholar]
  30. Talbot, N. An Investigation into the Occurrence of Brown Haze Events over Auckland. Master’s Thesis, University of Auckland, Auckland, New Zealand, 2011. [Google Scholar]
  31. Salmond, J.A.; Dirks, K.N.; Fiddes, S.; Pezza, A.; Talbot, N.; Scarfe, J.; Renwick, J.; Petersen, J. A climatological analysis of the incidence of brown haze in Auckland, New Zealand. Int. J. Climatol. 2015, 36, 2516–2526. [Google Scholar] [CrossRef]
  32. Jiang, N.; Hay, J.E.; Fisher, G.W. Synoptic weather types and morning rush hour nitrogen oxides concentrations during Auckland winters. Weather Clim. 2005, 25, 43–69. [Google Scholar]
  33. Scarfe, J. An Investigation into Surface Air Pollution, Brown Haze and Hospital Admissions in Auckland. Master’s Thesis, University of Auckland, Auckland, New Zealand, 2014. [Google Scholar]
  34. Senaratne, I.; Shooter, D. Elemental composition in source identification of brown haze in Auckland, New Zealand. Atmos. Environ. 2004, 38, 3049–3059. [Google Scholar] [CrossRef]
  35. Wang, K. The Changing Demography of Counties Manukau District Health Board; Heal: San Francisco, CA, USA, 2008. [Google Scholar]
  36. Symons, J.K.; Leksmono, N.S.; Hayes, E.T.; Chatterton, T.J.; Longhurst, J.W.S. Air quality management in Auckland, New Zealand. WIT Trans. Ecol. Environ. 2007, 101, 169–179. [Google Scholar]
  37. NIWA. The National Climate Database (CliFlo). Available online: http://cliflo.niwa.co.nz/ (accessed on 1 January 2012).
  38. Gosai, A.; Salinger, J.; Dirks, K. Climate and respiratory disease in Auckland, New Zealand. ANZJPH 2009, 33, 521–526. [Google Scholar] [CrossRef] [PubMed]
  39. Peng, R.D.; Dominici, F. Statistical Methods for Environmental Epidemiology with R: A Case Study in Air Pollution and Health; Springer: New York, NY, USA; London, UK, 2008. [Google Scholar]
  40. Domicini, F.; McDermott, A.; Hastie, T.J. Improved semiparametric time series models of air pollution and mortality. J. Am. Stat. Assoc. 2004, 99, 938–948. [Google Scholar] [CrossRef]
Figure 1. Examples of Auckland CBD on (a) a clear morning and (b) on a brown haze morning. Courtesy Auckland Council.
Climate 05 00086 g001
Figure 2. Charts showing the percentage change in hospital admissions for all age groups, including pollutants NO (top left), NO2 (bottom left), CO (top right) and PM10 (bottom right). The middle of the sticks shows the mean, the top and bottom markers shows the 95% confidence levels. Triangles denote statistically significant positive results.
Climate 05 00086 g002
Figure 3. Charts showing the percentage change in hospital admissions for ages 0–14 years, including pollutants NO (top left), NO2 (bottom left), CO (top right) and PM10 (bottom right). The middle of the sticks shows the mean, the top and bottom markers shows the 95% confidence levels. Triangles denote statistically significant positive results.
Climate 05 00086 g003
Figure 4. Charts showing the percentage change in hospital admissions for ages 15–64, including pollutants NO (top left), NO2 (bottom left), CO (top right) and PM10 (bottom right). The middle of the sticks shows the mean, the top and bottom markers shows the 95% confidence levels. Triangles denote statistically significant positive results.
Climate 05 00086 g004
Figure 5. Chart showing the percentage change in hospital admissions for ages 65+ including pollutants NO (top left), NO2 (bottom left), CO (top right) and PM10 (bottom right). The middle of the sticks shows the mean, the top and bottom markers shows the 95% confidence levels. Triangles denote statistically significant positive results.
Climate 05 00086 g005
Figure 6. Chart showing the percentage change in hospital admissions for respiratory disease for (top left) all age groups; (top right) 0–14 years; (bottom left) 15–64 years and (bottom right) 65+ years, in the days following a haze event. Triangles denote statistically significant positive results.
Climate 05 00086 g006
Table 1. Summary statistics for daily air quality metrics, hospital admissions and temperature.
VariableStatistic
nMeanSDMinQ1MedQ3Max
Annual respiratory hospital admissions count
All age groups72,42918.07.6112172254
0–14 years33,4908.34.80571128
15–64 years22,7635.72.9045721
65+ years16,2034.02.5024522
Cool season respiratory hospital admission count
All age groups31,24523.17.7618222854
0–14 years15,36811.45.118111428
15–64 years92756.93.2056921
65+ years66024.93035615
Annual atmospheric and pollution data
NO (μg·m−3)315020.821.10.04.514.929.1139.0
NO2 (μg·m−3)314914.89.30.37.213.520.853.1
CO (mg·m−3)38950.410.380.000.140.300.562.99
PM10 (μg·m−3)324815.26.42.011.114.018.045.3
Temperature (°C)401715.33.54.912.715.318.124.4
Cool season atmospheric and pollution data
NO (μg·m−3)109431.727.40.010.024.447.7139.0
NO2 (μg·m−3)109419.99.70.612.720.026.453.1
CO (mg·m−3)13030.640.480.00.280.540.872.99
PM10 (μg·m−3)109317.77.43.712.916.621.544.7
Temperature (°C)135312.12.54.910.512.213.7NA

