Intensity of Urban Heat Islands in Tropical and Temperate Climates


1
Department of Geography, São Paulo State University (UNESP), 305 Roberto Simonsen Street, Presidente Prudente, São Paulo 19060-900, Brazil
2
Department of Geography, Rennes II University, LETG-Rennes-COSTEL, UMR 6554 CNRS, Place Recteur Henri le Moal, 35000 Rennes, France
*
Author to whom correspondence should be addressed.
Climate 2017, 5(4), 91; https://doi.org/10.3390/cli5040091
Submission received: 28 October 2017
/
Revised: 24 November 2017
/
Accepted: 29 November 2017
/
Published: 3 December 2017
(This article belongs to the Special Issue Studies and Perspectives of Climatology in Brazil)
Abstract
:Nowadays, most of the Earth’s population lives in urban areas. The replacement of vegetation by buildings and the general soil sealing, associated with human activity, lead to a rise in cities temperature, resulting in the formation of urban heat islands. This article aims to evaluate the intensity and the hourly maintenance of the atmospheric heat islands in two climates: one tropical (Presidente Prudente, Brazil) and one temperate (Rennes, France) throughout 2016. For this, air temperature and hourly averages were measured and calculated using both a HOBO datalogger (U23-002—protected under the same RS3 brand) and weather stations Davis Vantage PRO 2. The daily evolution of the heat islands presented characteristics that varied according to the hours and seasons of the year. For both Rennes and Presidente Prudente, the largest magnitudes occurred overnight, being more greatly expressed in the tropical environment and during the driest months (winter in the tropical city and summer in the temperate one). The variability of synoptic conditions from one month to another also leads to a great heterogeneity of UHI intensity throughout the year.
1. Introduction
The 20th century was marked by an intense urbanization process that soon led to pollution-related problems and temperature rise in cities, forming an urban heat island (UHI). In addition to thermal discomfort, urbanization can trigger several other health problems, thus making the study of the urban atmosphere of large cities (São Paulo, Mexico City, London, and Paris) imperative.
An urban heat island (UHI) is characterized by a dome of hot air that covers built areas in urban environments [1]. Literature on urban climate studies classifies three types of heat islands, depending on the layer where they are found: (1) a surface heat island detected by remote sensing; (2) the lower atmospheric heat island, which Oke [1] called the urban canopy layer, which is located between ground level and average roof level; (3) the heat island of the upper urban atmosphere, labeled as the urban boundary layer by Oke [1]. The latter overhangs the previous one, sometimes extending to the free atmosphere.
Classical urban climatology studies have shown that UHIs are essentially defined by the temperature differences between downtown areas and the rural environment or peripheral areas with low built density [1,2,3,4,5]. Especially in tropical environments, urban areas are sometimes occupied by poor thermally insulated construction. This causes heat to be trapped on surfaces, even overnight, without direct solar ray incidence. In a rural environment, low built densities and the presence of arboreal, shrub, and bush vegetation speeds up heat loss to upper atmospheric levels, especially at night.
Studies performed in both tropical [6,7,8,9,10,11,12,13,14,15] and temperate climates [1,16,17,18,19], demonstrate that the highest intensity of heat islands form under the influence of stable anticyclonic atmospheric systems. Therefore, the intensity and spatial extent of an UHI varies depending on the city location, its shape and density (urban morphology), construction type and materials, industrial activity, climatic conditions, and the succession of synoptic situations and weather conditions [7].
However, since the end of the 20th century, urban climate studies have been performed in a few medium and small cities, with heat islands of high magnitudes being detected, even though they have a simpler structure when compared to those in larger cities [7,10]. However, in both Brazil and France, urban sprawl has led to the destruction of large forested and cultivated areas in several regions surrounding mid-size cities, leading to increasing UHI as shown in Rennes (France) and Presidente Prudente (Brazil). UHI studies previously performed in the two cities [7,8,9,20,21,22,23,24,25,26] detected high UHI intensities, with episodes above 8 °C in both Presidente Prudente and Rennes, under the influence of anticyclones and windless and cloudless weather conditions.
The aim of this research was to evaluate the intensity and the hourly maintenance of the near-surface atmospheric heat islands in both tropical (Presidente Prudente) and temperate (Rennes) medium-size cities. For this, the monthly hourly average of temperature intensities was calculated for both cities during the same year, 2016, illustrating the variety of seasonal and synoptic conditions. It should be noted that the study of UHI’s daily evolution, considering the monthly averages of their 24-h-cycle intensities in cities of tropical and temperate climates, is unprecedented in urban climatology. In most of them, records were taken overnight, when UHI intensities are usually higher.
2. Characteristics of Study Sites
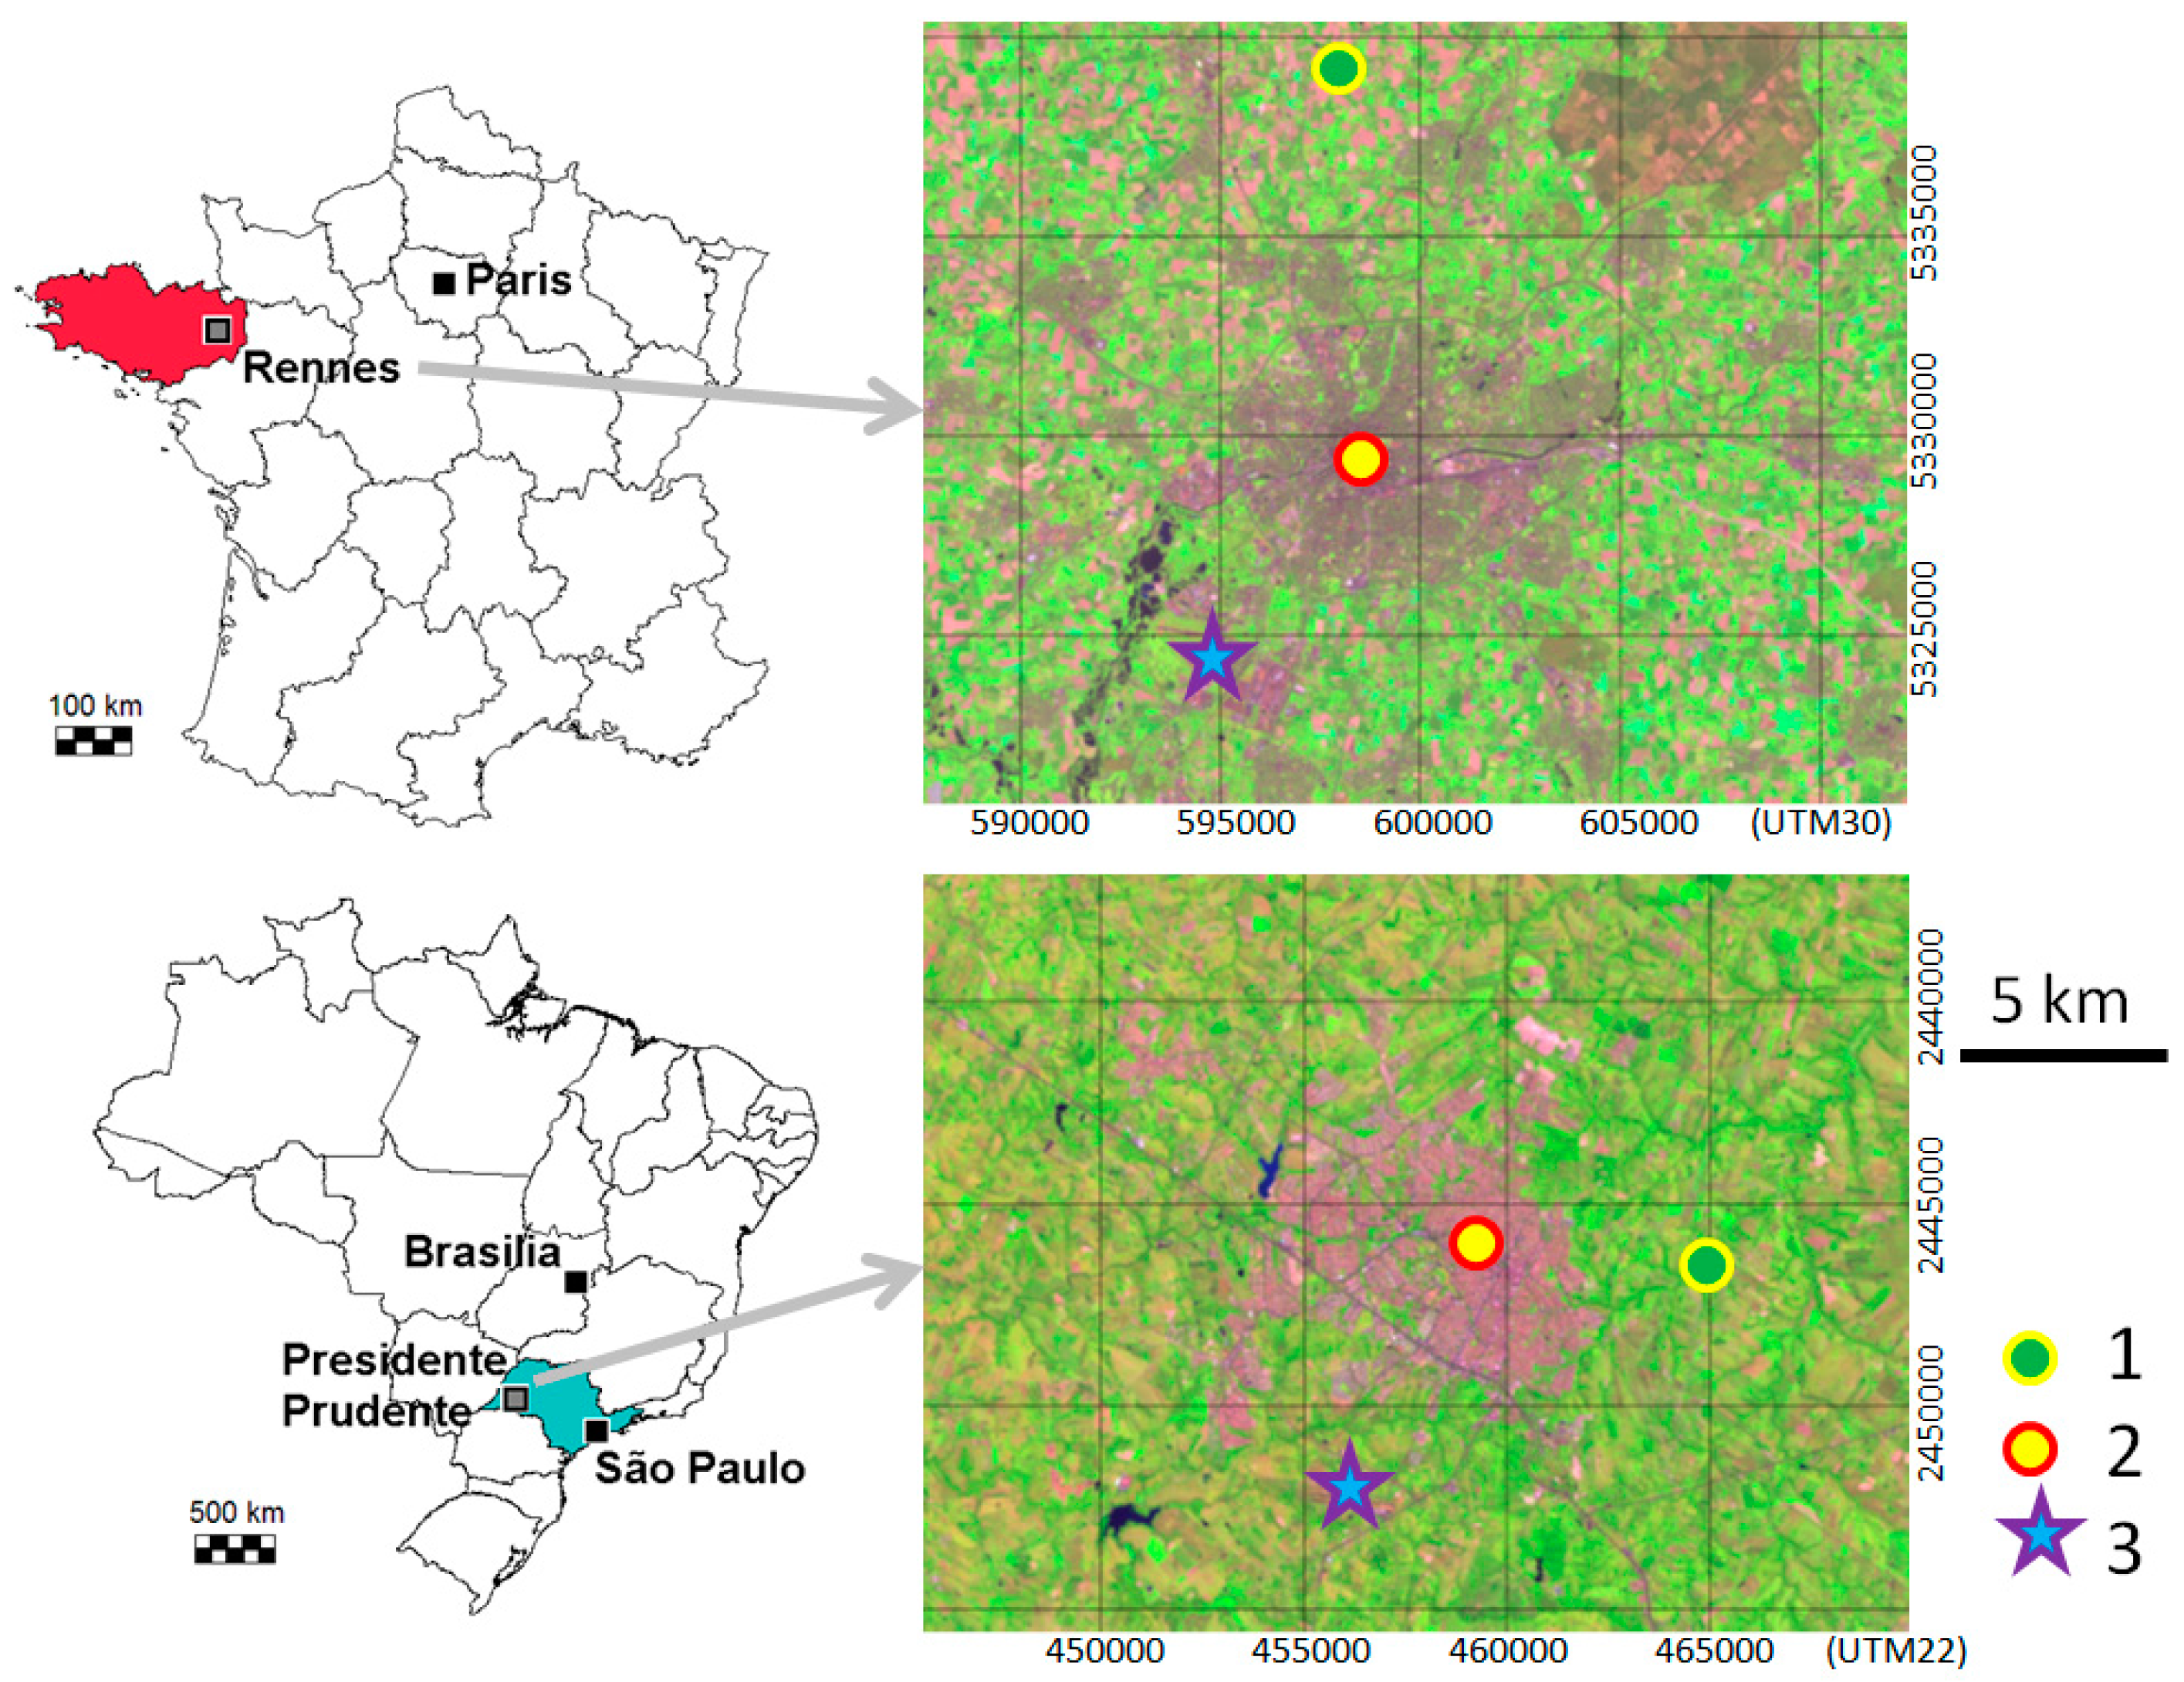
The west of the São Paulo state, where Presidente Prudente is located (Figure 1), was no exception to the process of land-use artificialization. The occupation of rural land (predominantly focused on agriculture and livestock) by urban centers strongly transformed its vegetation over time. Alongside Nantes, Rennes is one of the historical capitals and the 11th most populous city in France. Located in Brittany, it is predominantly surrounded by wheat, corn, and vegetable crops as well as pastures for intensive livestock farming, a common scenario in the entire region.
Founded in 1917, Presidente Prudente is considered the regional capital of an extensive farming area of approximately 20,000 km2. Rennes is one of the more than 2000-year-old towns of western France (Figure 1) and is the administrative capital of Brittany—the first French region in terms of agricultural production (27,000 km2). Presidente Prudente has little more than 200,000 inhabitants (an estimated 223,749 by 2016, according to the Brazilian Institute of Geography and Statistics [27]) and Rennes has an estimated population of 205,000 inhabitants in the municipality alone and approximately 400,000 in the total agglomeration. Despite their different histories, these two cities have similar regional sizes and roles in the economy of their countries (Rennes is 300 km away from Paris and Presidente Prudente is 500 km away from São Paulo). Nowadays, both are mostly dedicated to commercial, university, and service sectors.
In recent decades, urban territory in both cities expanded significantly. According to Amorim et al. [28], the urban growth rate between 1988 and 2001 increased 133% in Presidente Prudente and 32% in Rennes (Table 1). City growth has triggered changes in local climate [28]. Despite their different histories and climatic characteristics, both UHIs contribute to intensifying the seasonal thermal discomfort with a predominance of high temperatures and pollutant concentration in the hottest areas [21,22,24,28].
Given its proximity to the Tropic of Capricorn (22°07′ S), Presidente Prudente’s climate is characterized by two well-defined seasons: a hot rainy summer (from October to March) and a mild and dry winter (April to September) [29]. For most of the year, tropical systems prevail in this region, sometimes with its more moist Atlantic branch, or with hotter and drier continental trajectories. During spring and summer, daily temperatures range from 20 °C to 32 °C, with absolute maximums close to 40 °C. Approximately 75% of the 1300-mm annual precipitation occurs at this time of the year. During autumn/winter, temperatures drop slightly but remain high—except when episodic polar anticyclones occur. When it happens, the minimum temperatures oscillate between 15 °C and 20 °C, occasionally reaching lows of 0 °C (−1.8 °C in July 1975) as per data recorded at the Presidente Prudente Meteorological Station, located at the Faculty of Science and Technology of the São Paulo State University [28].
At 48° 06′ N, Rennes stands as a typical interior temperate-oceanic city [21]. It has an average annual rainfall of 670 mm, but it is often higher during autumn and winter, with summers being drier than winters. Average temperature ranges between 5.7 °C in January to 18.9 °C in August. However, temperatures can reach up to 40 °C (39.5 °C in August 2003), while winter temperatures can drop dramatically with a record of −14.7 °C in January 1985 [28].
The two cities were chosen because of their similar size (in terms of inhabitants and urbanized area) and representativeness of inland climate of mid-size cities for both countries. Rennes is located in the Köppens’ type Cfb, the most common of French mean climate type [30]: except the Mediterranean climate of the south of the country and those close to the ocean, the climate of Rennes is typical of the French climates of inland regions [31]. Presidente Prudente is also located in the Brazilian Köppen’s most common mean type: indeed, the Aw type is the most frequent one in the interior of the country and especially in the south-east, the most populous part of Brazil [32,33]. To be representative in terms of urbanization and climate types, these cities were selected for a bilateral comparative project funded by both France and Brazil research agencies (see acknowledgments).
3. Materials and Methods
Both cities have ample experience with taking UHI measurements using thermal transects or an automatic-station network. In Rennes, a complete network of 20 stations has been operational since 2004 [22,24,26]. In Presidente Prudente, the network is more recent (2014), since previous studies have focused on thermal transects. In both cities, the evidence of intense UHI has been mapped, showing the places where the intensities are higher, near the historical downtowns.
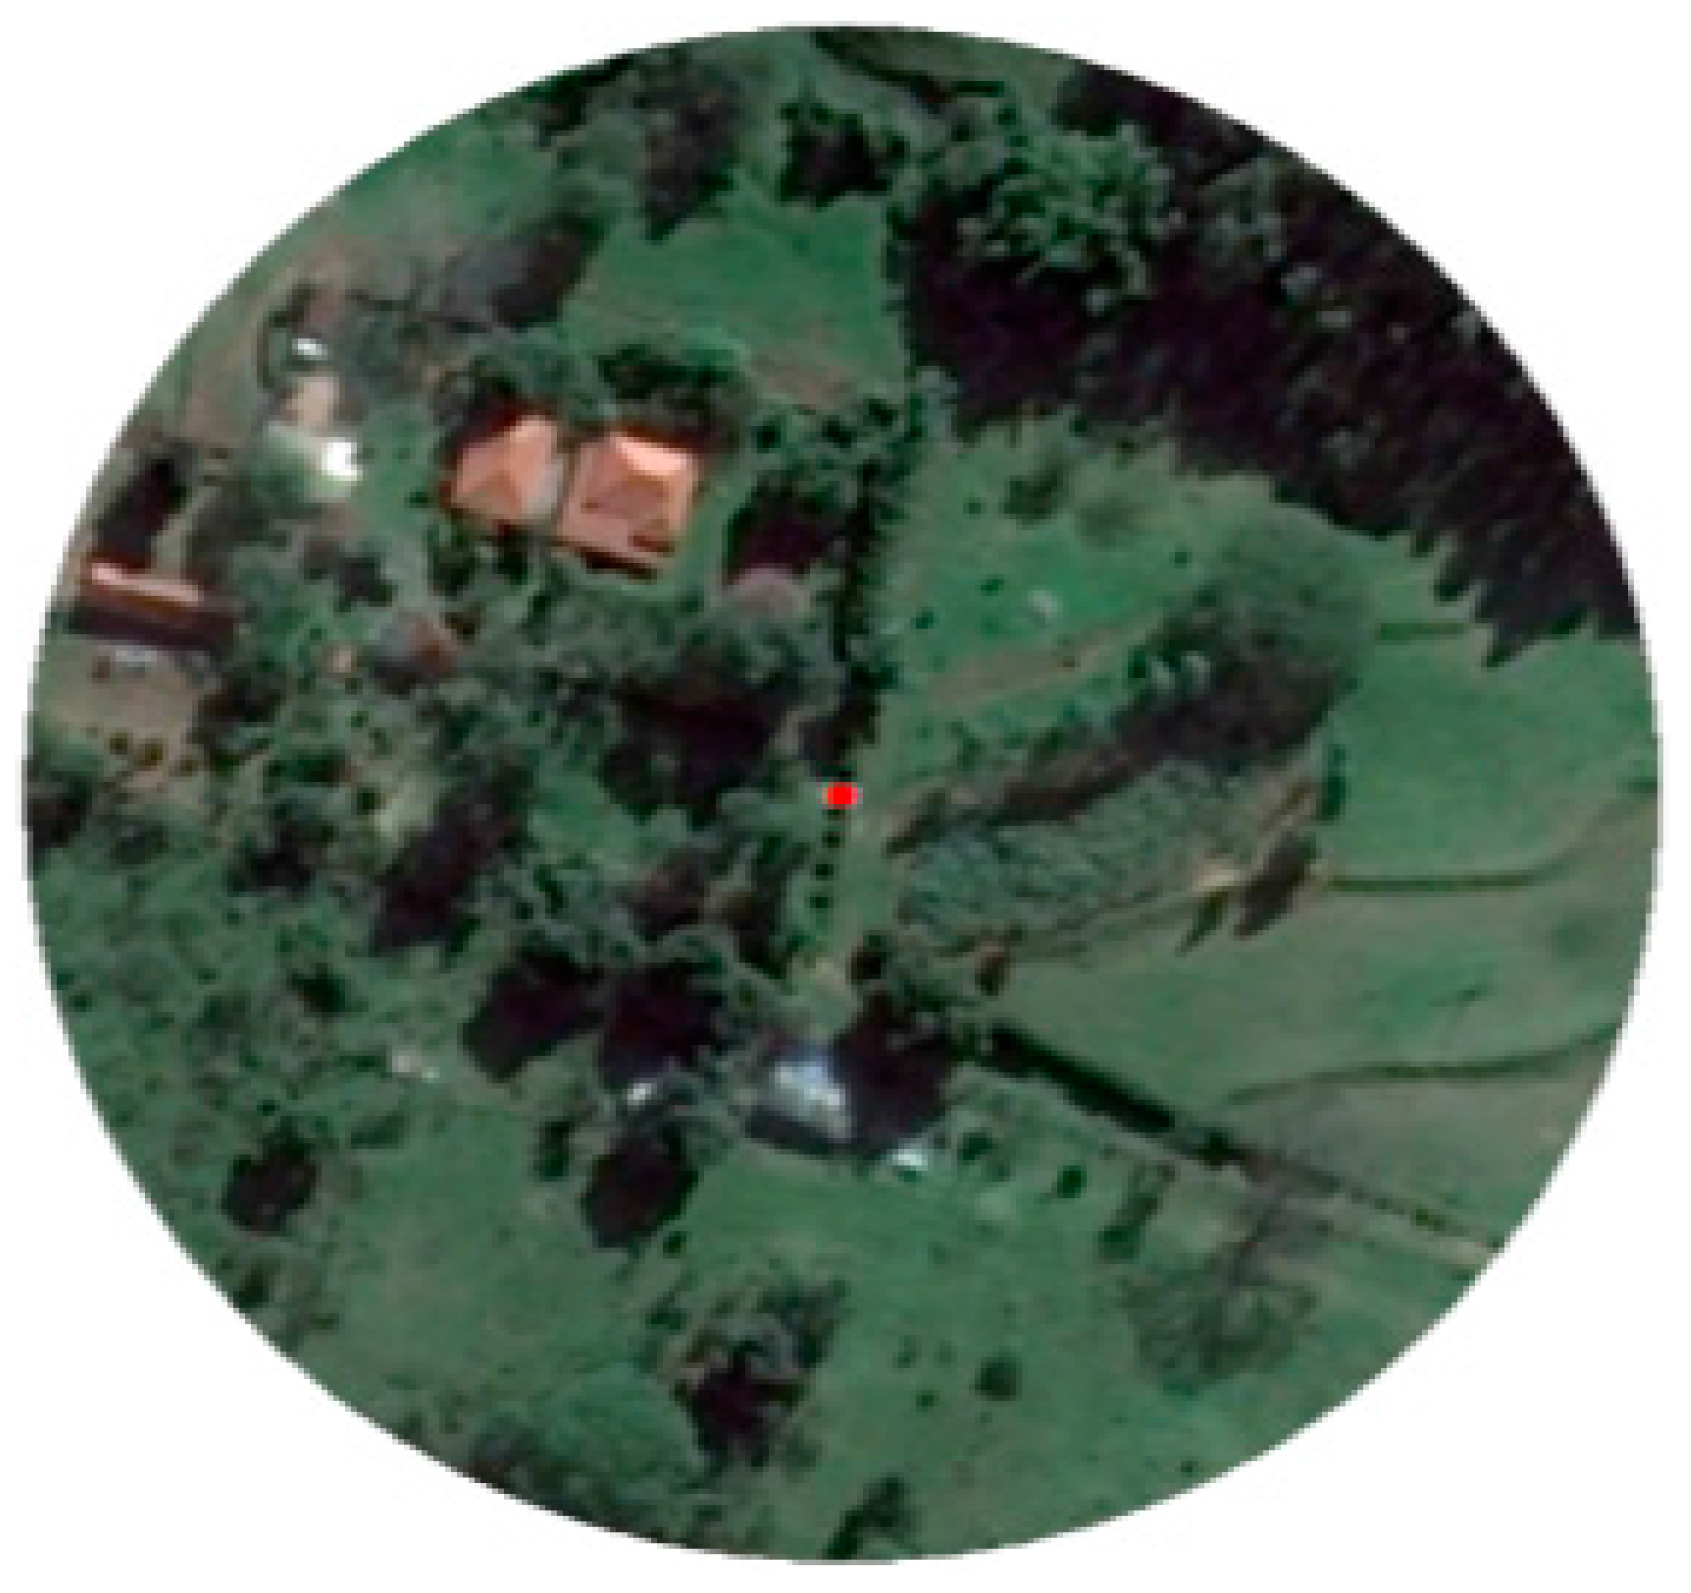
Finally, sensors were installed in densely built urban areas, as well as in rural environments of both cities (Figure 2, Figure 3, Figure 4 and Figure 5) depending on the results of previous studies. Near the rural area of Presidente Prudente, located to the east of the urban network, where the temperature sensor was installed 415-m above sea level, there is undergrowth and arboreal presence. In the urban environment, the sensor was installed 424-m above sea level, in a heavily constructed area of medium arboreal vegetation density to the central-west of the urban network.
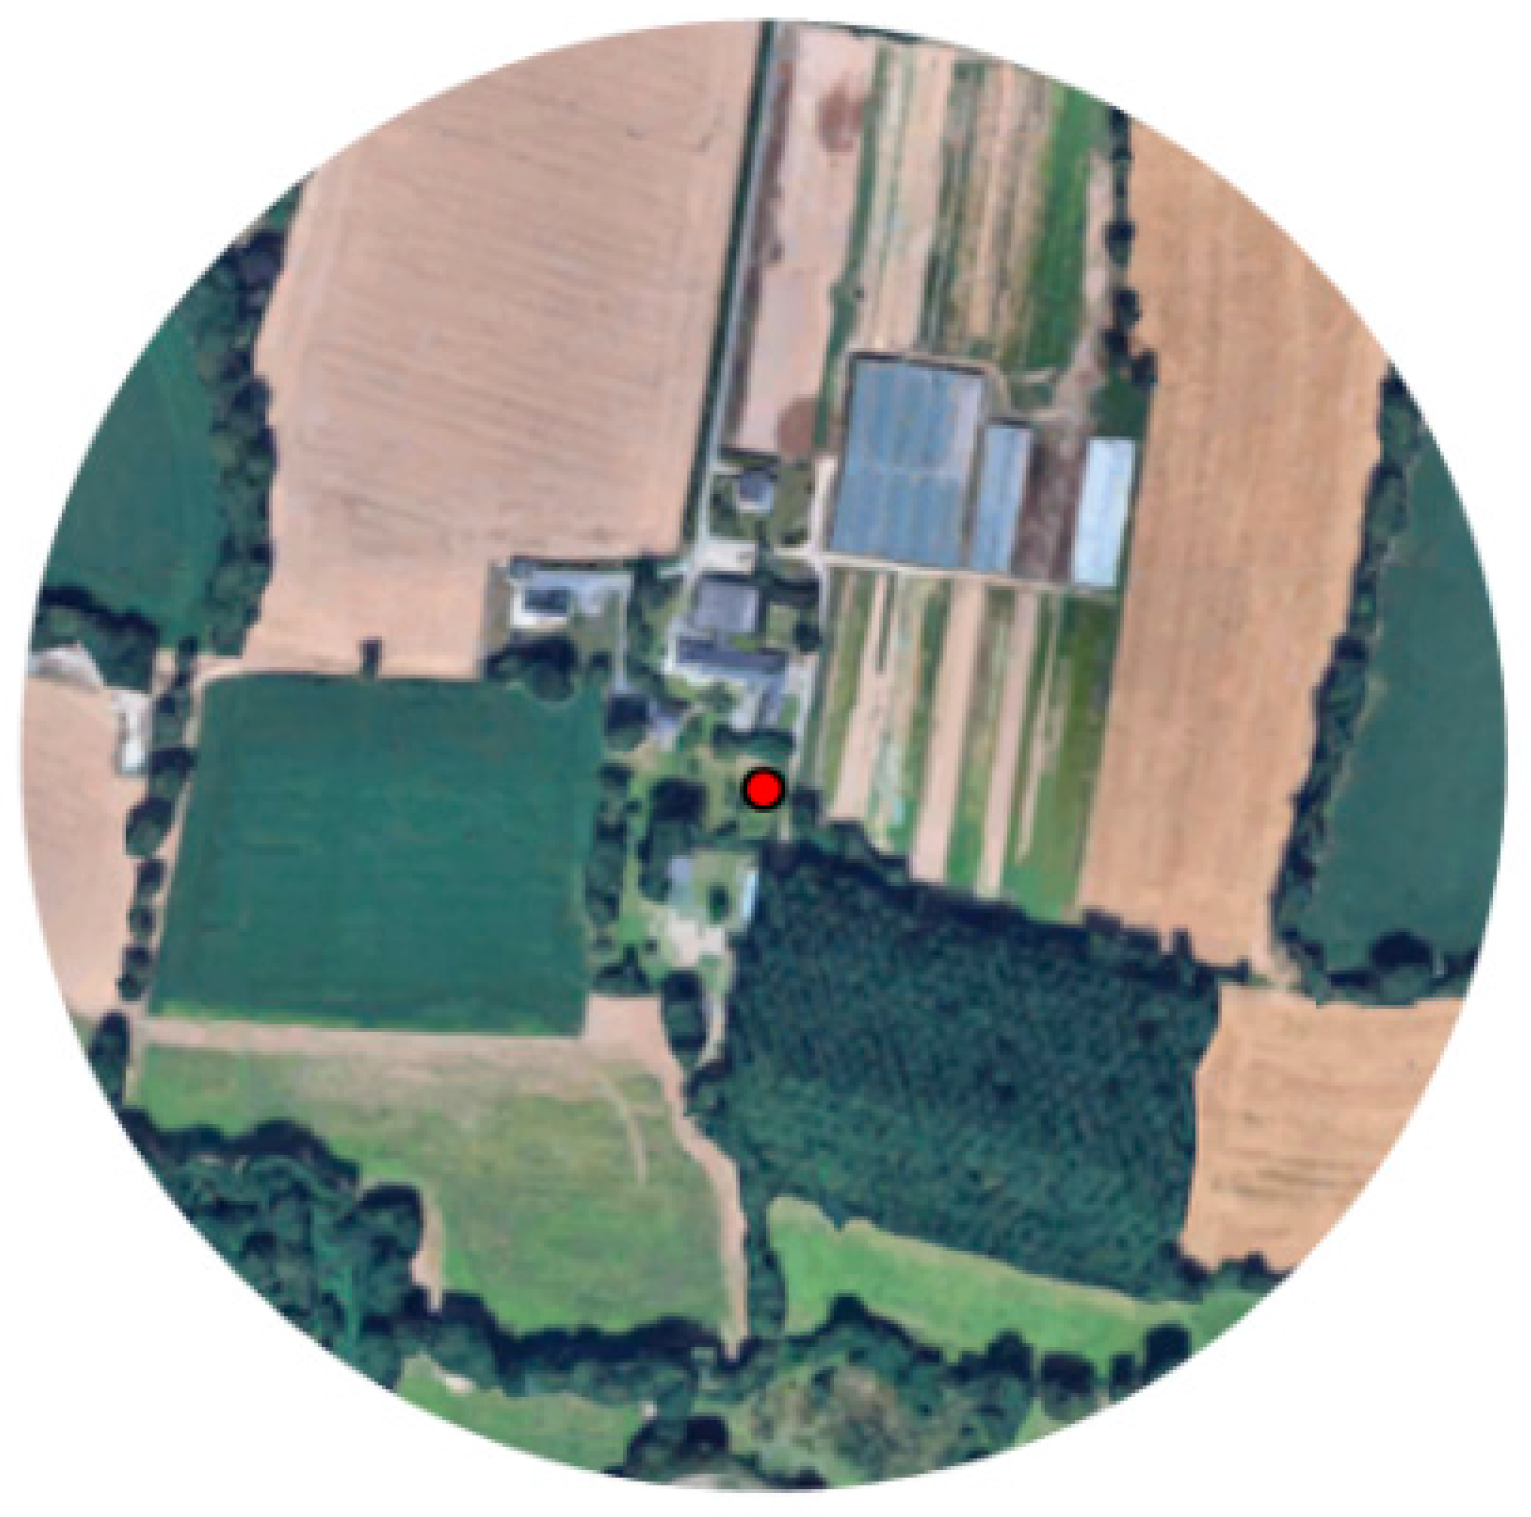
In the urban area of Rennes, the sensor was installed in the old town, near the cathedral. It is a densely built area, almost deprived of vegetation, even in the streets, packed with five-story buildings. The representative area of the rural environment in Rennes was installed in the north of the conurbation, 11 km away from the old town, where there are annual crops and pastures with few houses and barns. The urban point was placed 35-m above sea level, and the rural point was placed 60-m above sea level. In both Presidente Prudente and Rennes, the sensors were installed at a height of 1.5 meters distance to the Earth’s surface.
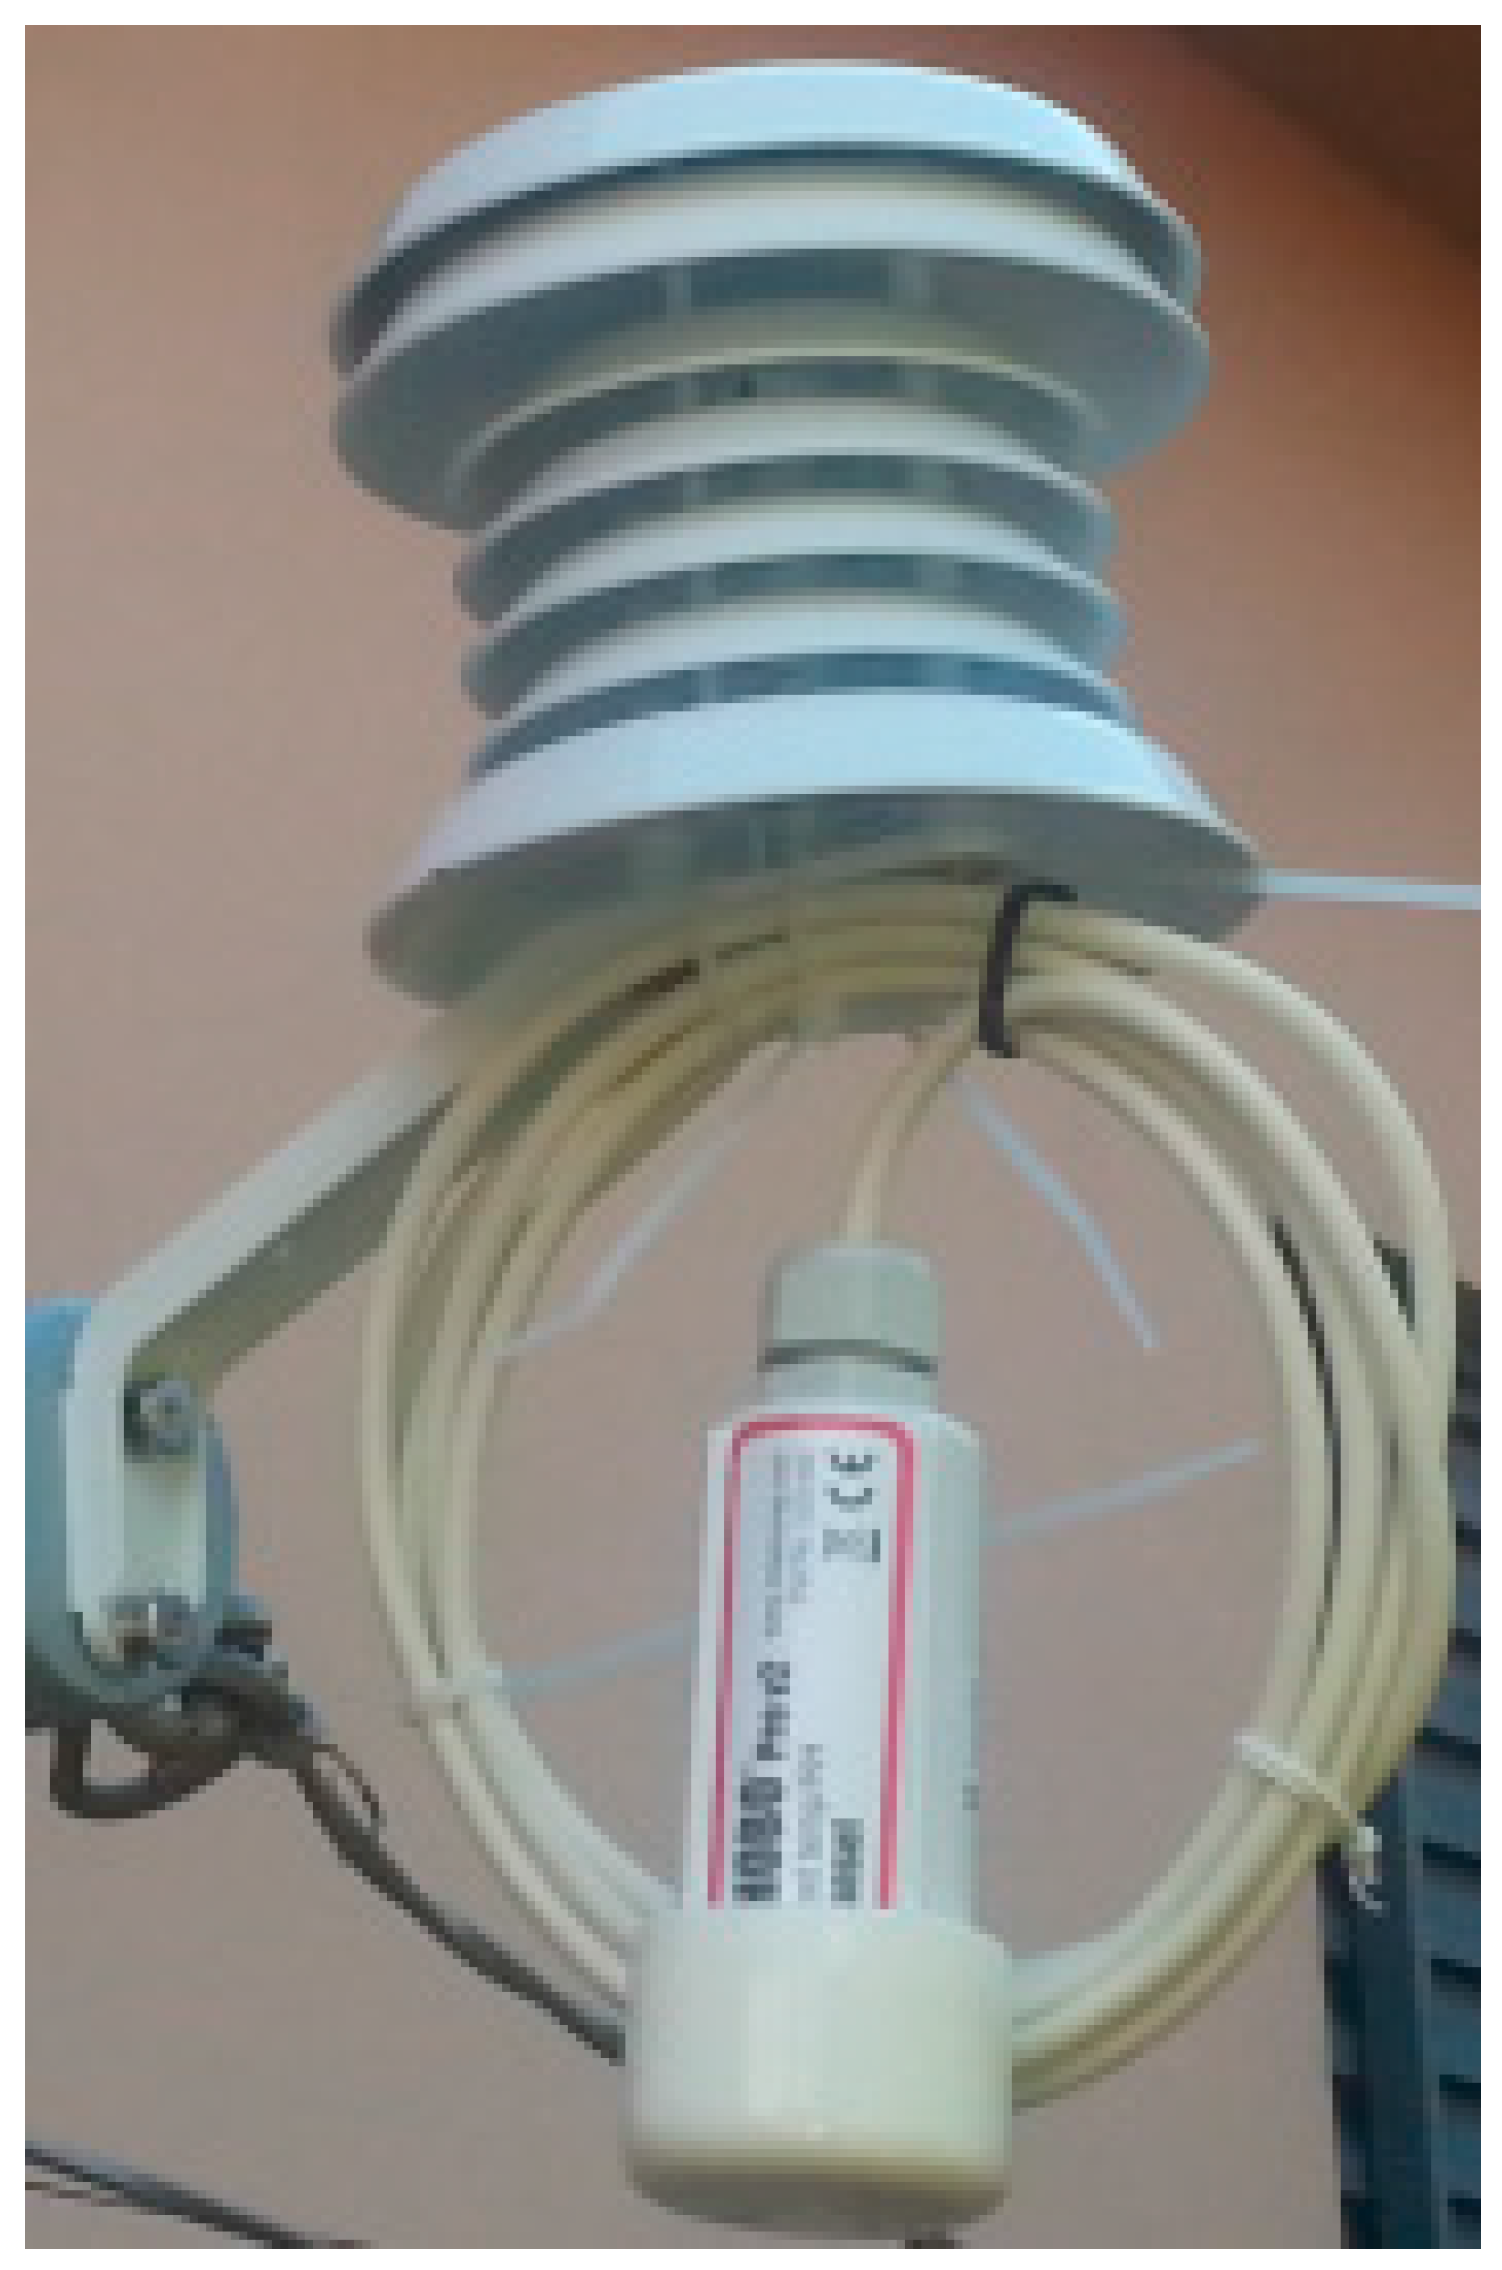
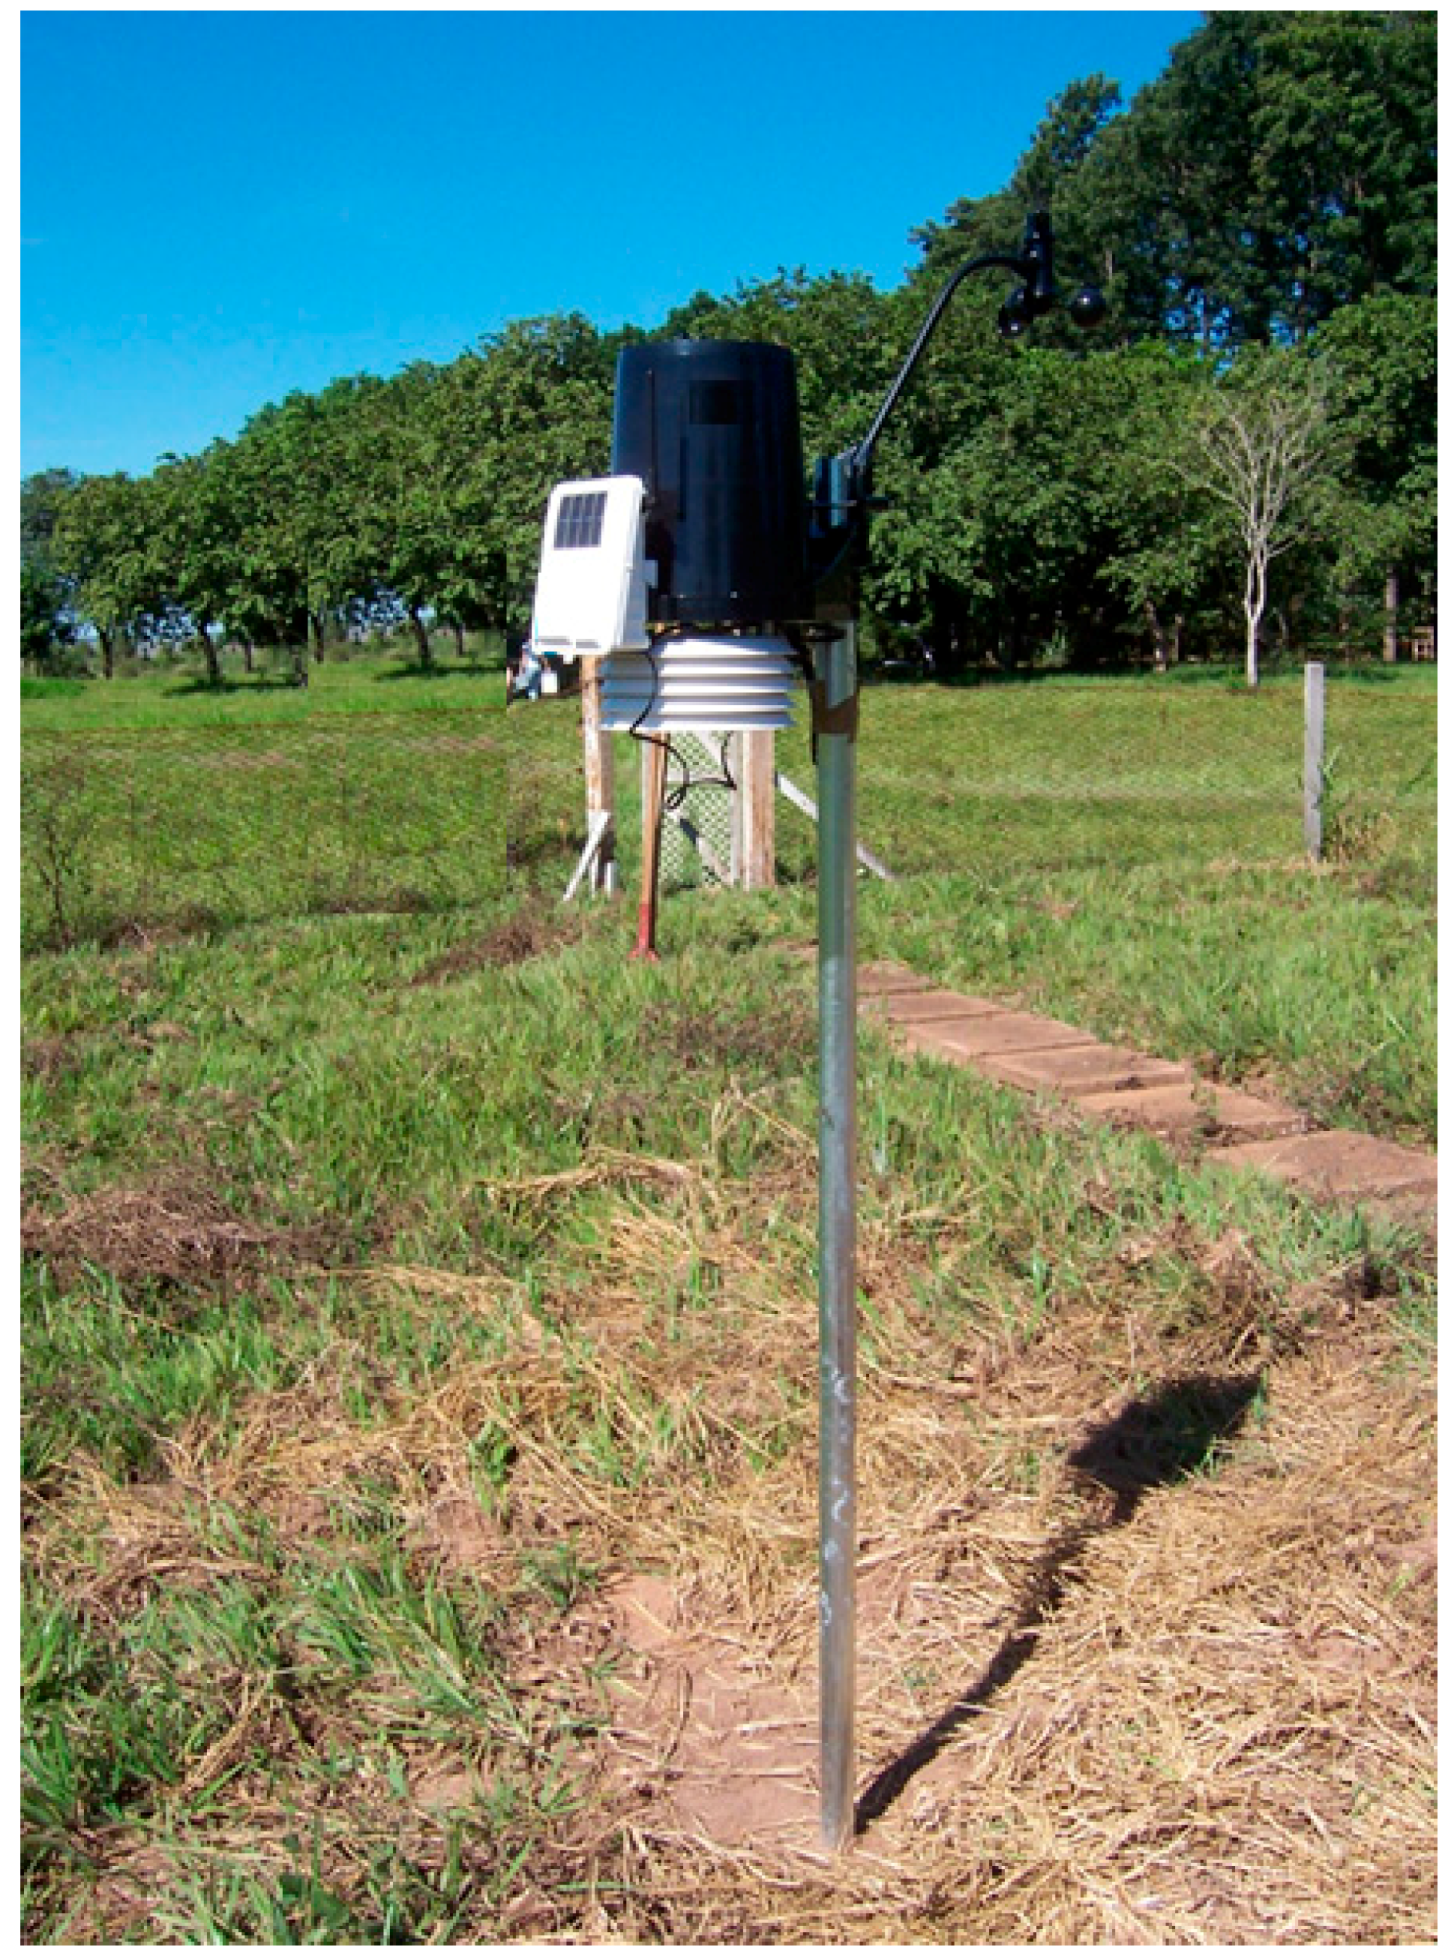
Research procedures were similar for both cities. Air temperature was recorded with a HOBO datalogger (U23-002) protected under the same RS3 brand (Figure 6), with a precision of approximately 0.21 °C, and also with weather stations Davis Instruments Vantage PRO 2 (Figure 7), with an accuracy of 0.5 °C. The sensors were programmed to record air temperature at 10-min intervals (i.e., 525,000 records for each station) to extrapolate hourly averages for both maximum and minimum temperatures. To calculate the intensity of heat islands, we subtracted the urban environments values from those of rural environments (ΔTu-r). An Excel (Excel is a Microsoft Corporation trademark) spreadsheet was used to organize data and calculate statistics.
In this article, we used the average monthly hourly, recorded during 2016. This year was chosen because of the availability of data for all stations in both cities. It should be noted that, if one year of data appears to be for a short time, the small archive interval allows for taking into account a large possibility of meteorological conditions: day–night, winter–summer, and dry–rainy seasons. Moreover, our intent is also to emphasize the differences between tropical and temperate conditions.
4. Results and Discussion
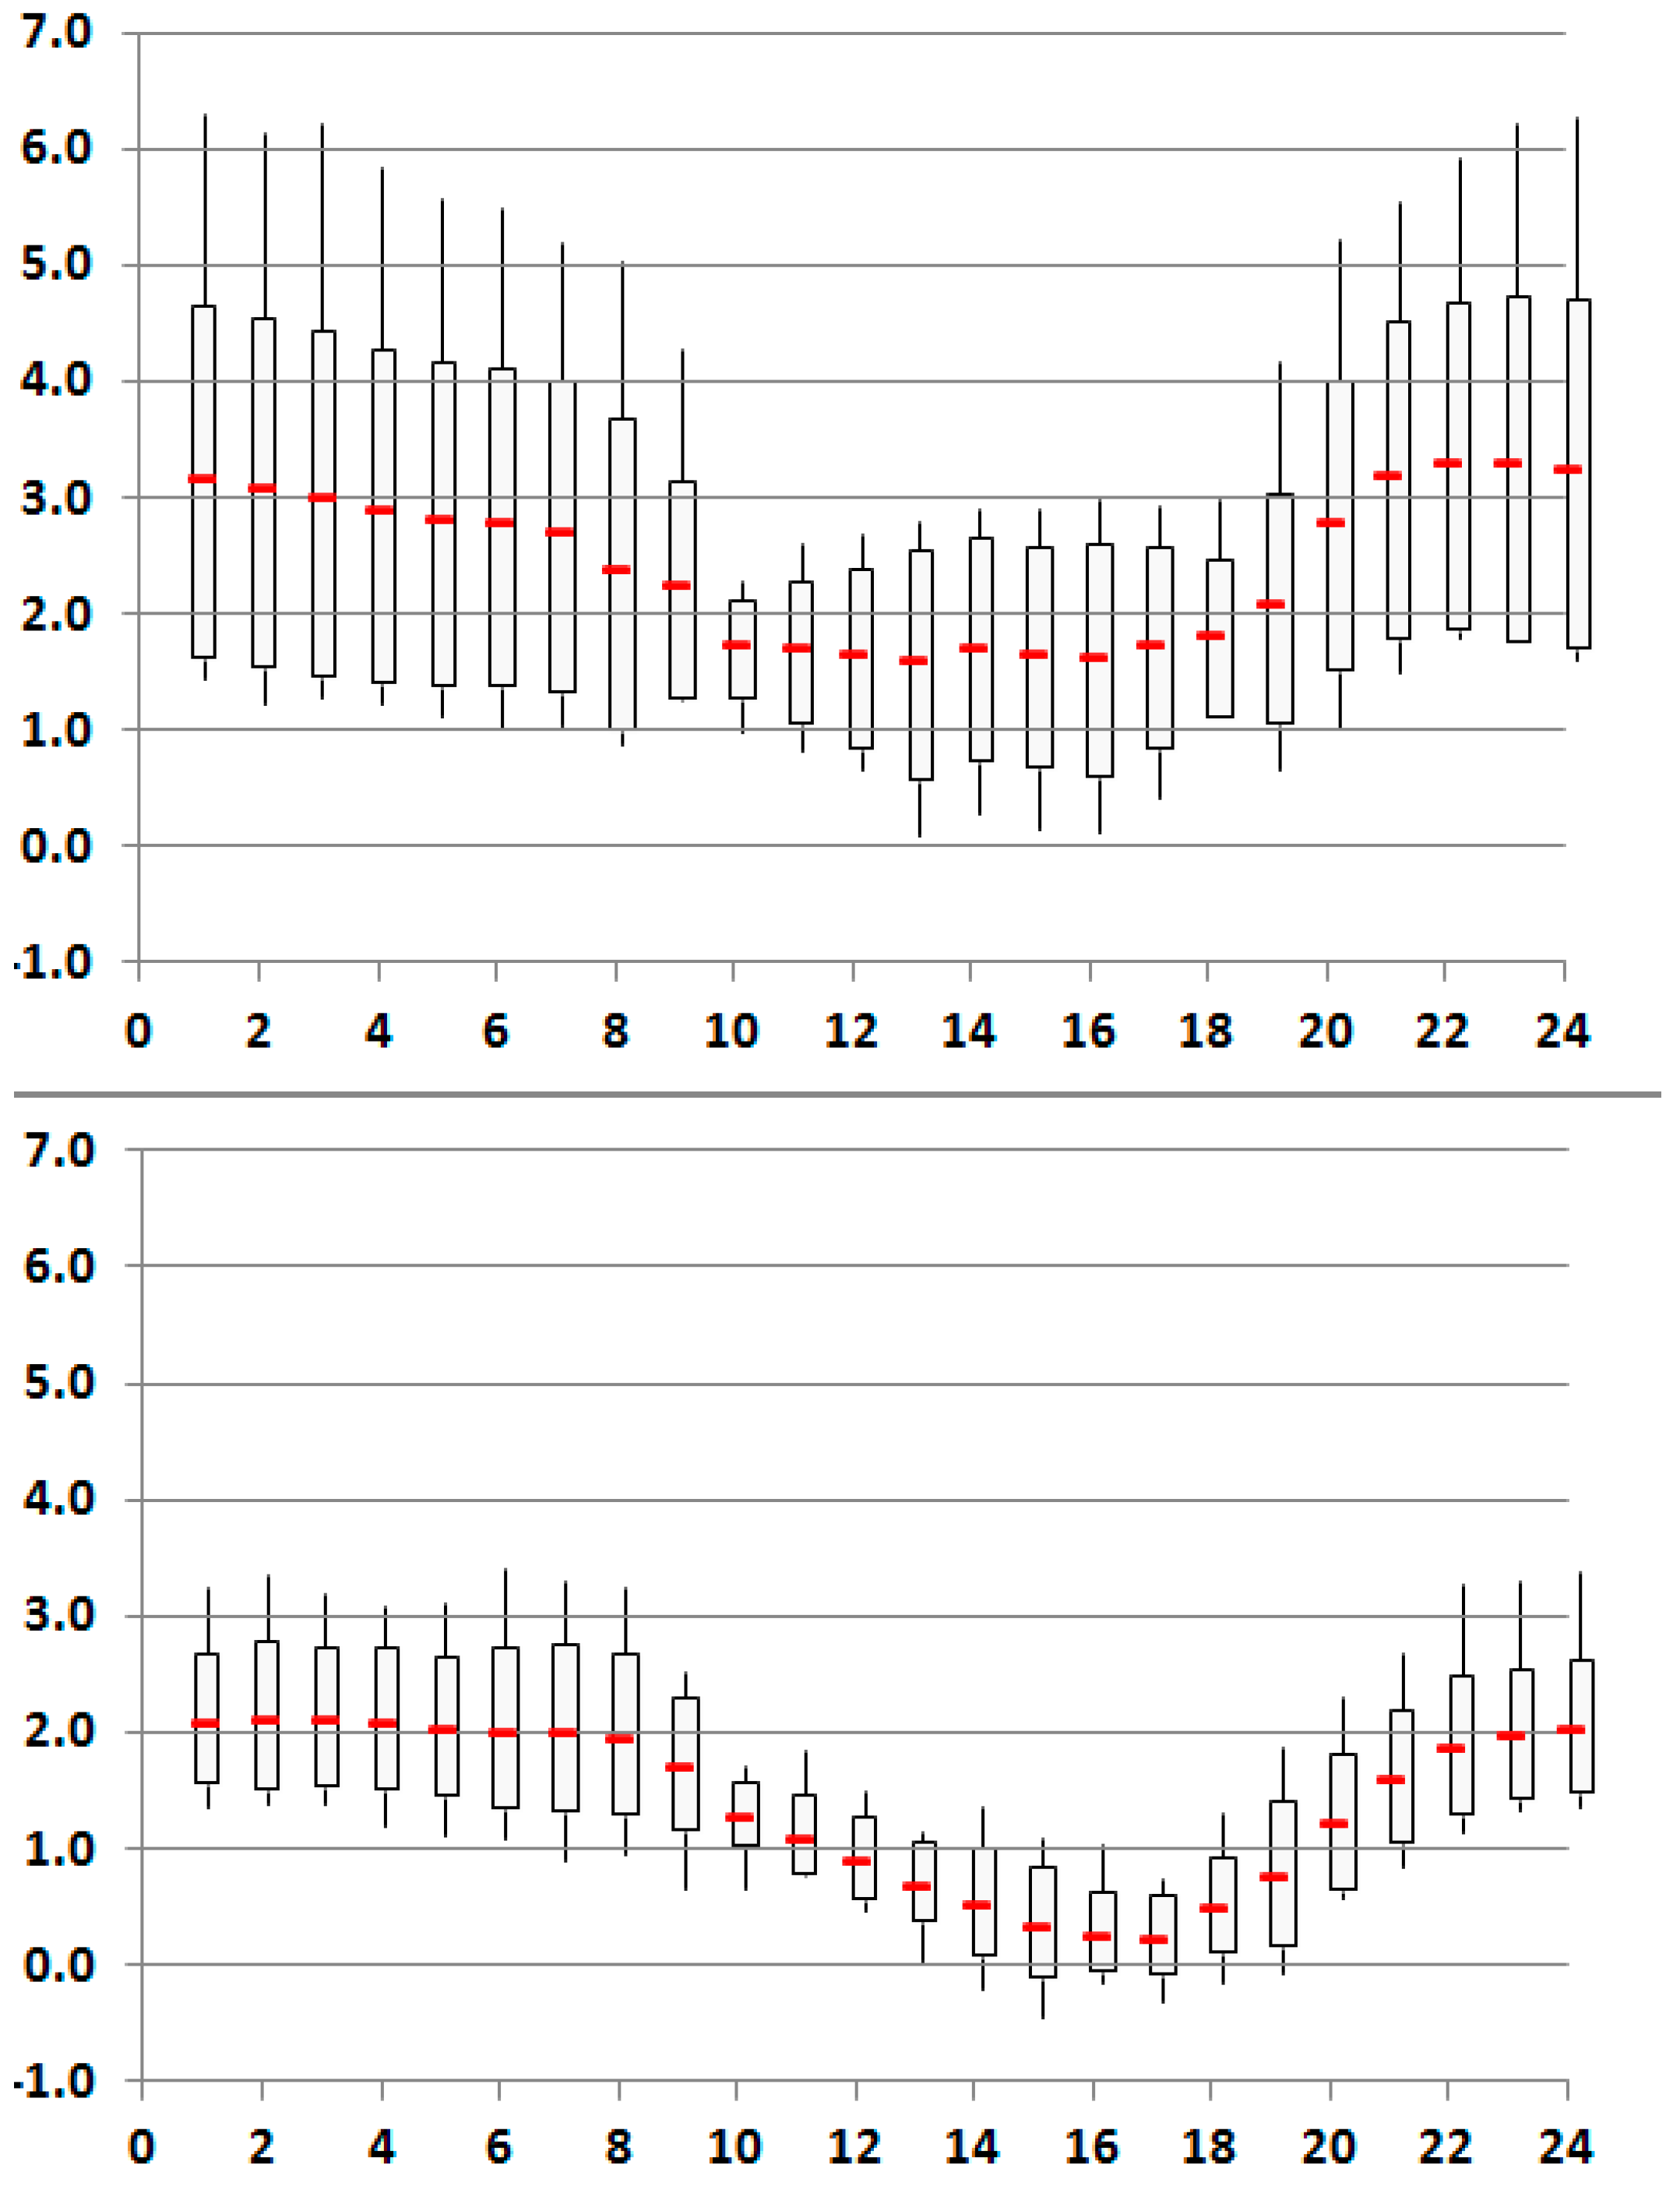
Figure 8 shows the UHI’s intensity for both cities along the diurnal cycle, i.e., the differences in mean hourly temperatures (considering the data recorded in an urban and a rural reference station), for each of the two cities (ΔT u-r). For both cities, the highest heat islands intensities were recorded predominantly overnight from 9 p.m. to 9 a.m. However, UHI intensities were higher in Presidente Prudente than in Rennes, exceeding 6 °C in the night period, whereas the maximum intensities went no higher than 3.5 °C in Rennes.
According to Fernández García’s classification [34], very-strong-magnitude atmospheric heat islands are those with temperature differences of 6 °C or higher between urban and rural areas. In Presidente Prudente, these magnitudes were recorded in the middle of the night. According to the same author, islands of high magnitude are those recorded between 4 °C and 6 °C, and were very common. Medium-sized heat islands (between 2 °C and 4 °C) were registered, including during daytime in the rainy season. No heat islands of strong and very strong magnitude were recorded in Rennes. There was a predominance of medium-magnitude heat islands (between 2 °C and 4 °C) at night.
The fact that UHI intensities are lower in Rennes than in Presidente Prudente results from the regional climate characteristics. In Rennes, the higher latitude and the better distribution of precipitation during the year evidences the conditions of low pressure (cloudy weather, mean wind speed of 3.9 m.s−1), responsible for greater atmospheric instability, making UHI intensification more difficult. In Presidente Prudente, on the other hand, the atmospheric stability (low cloudiness, and absence of precipitation, mean wind speed of 2.3 m.s−1) resulting from the action of predominant anticyclones in autumn/winter provides an intensification of the UHI (above 6 °C). However, the difference in UHI intensity between day and night is almost the same, 1.5 °C, varying from 1.5 °C to 3.0 °C in Presidente Prudente and 0.5 °C and 2.0 °C in Rennes.
Another difference observed between the two cities was that heat-island intensities in Rennes were smaller during the day (between 10 a.m. and 6 p.m.) or even negative. In mid-latitude cities, islands of freshness also occur more frequently, because the sun slopes steeply, providing a shadow effect in built-up areas, unlike in rural areas, which receive the incidence of the sun’s rays more directly. The result is higher temperatures in rural areas than in the urban areas during the day. This characteristic has been observed in Phoenix, Arizona, which has cooler daytime peaks than the surrounding rural areas and nightly urban heat islands [35]. However, this point should be discussed while taking into account seasonal and synoptic conditions.
Table 2 and Table 3 show the combined monthly and diurnal variability of UHI intensity: inspired by Monteiro’s rhythmic analysis [36], our aim is to depict the UHI’s diurnal rhythm and its yearly changes according to the synoptic conditions and the predominant weather types for each period of the year. To do so, information on average temperature variation, monthly precipitation anomalies, and precipitation totals were included at the bottom of the tables, in relation to the historical averages.
For both cities, the highest heat-island intensities were recorded predominantly in the months with the lowest total precipitation (April, July, August, and September in Presidente Prudente and Rennes). During Presidente Prudente’s summers, when the highest temperatures and highest rainfall totals occur, especially in January, February, and December 2016, daytime UHI intensities were higher than those at night. This is related to the large development of vegetation in the rural areas at this time, where latent flux is very high, whereas in the city sensible flux is preeminent. These urban intense thermal stress conditions affect residents, since daytime temperatures are naturally high and diurnal heat islands amplify this condition in tropical environments.
However, in Rennes in August and September (between 1 pm and 6 pm), UHI was dramatically reduced and fresh islands were formed. In fact, in summer conditions, rural areas showed higher temperatures than urban areas due to the large amount of bare soil after the wheat’s harvest. The concept of “islands of freshness” described by Mendonça [10], Steinecke [37], Amorim [7], Mendonça and Dubreuil [38] is used when the difference between urban and rural air temperature falls below zero (ΔTu-r). Oke [1] called these negative changes the “park effect”.
Table 3 compares 2016 average monthly temperature values in Presidente Prudente to monthly average records taken from 1981 to 2010. It shows that temperatures were lower during March, May, June, August, September, October, and December. Only in February, April, July, and November 2016 were the temperatures higher than those recorded in the 1981–2010 period. Regarding precipitation, it can be observed that 2016 was less rainy in January, March, July, September, October, and November, when compared to the historical series (1981 to 2010). This variability allows us to explain UHI intensity: the highest UHI values were observed during the driest (July) and hottest (April) months, whereas the lowest UHI intensities were observed during the rainiest (January, February and December) months. Compared to the historical means, May and June were cold and rainy months, leading to small UHI compared to April and July.
The lowest 2016 average monthly temperatures in Rennes, when compared to the monthly averages from 1981 to 2010 (Table 2), were recorded during March, April, June, July, October, November, and December. The highest UHI intensities were observed in September 2016, a very hot month (2.4 °C above the historic season average) and slightly dry (29% rainfall deficit). October, December, April, and August also showed strong UHI. In these cases, high temperatures were not the main cause of UHI intensity (April, December, and October were below average and August above), but rather the lack of rain, especially in October and December. Stable weather conditions, with little rainfall and few clouds, allowed the increase of the temperature difference between the city and the rural area, stressing the importance of synoptic conditions on this phenomenon. In March and June, the heaviest rains were responsible for the weakest UHI in 2016.
Table 4 summarizes the characteristics of heat islands in both cities.
5. Conclusions
This study demonstrates that daily evolution of heat islands present characteristics that vary both seasonally and according to the hour. The highest heat-island intensity occurs overnight, both in tropical and temperate environments but it does so to a greater extent in the tropical environment. This fact was also observed in the cities of Melbourne [39], Granada [40], Montreal and Vancouver [18], Londrina [10], Araçatuba [12], Assis, Cândido Mota, Maracaí and Tarumã [13], Rancharia [14], Paranavaí [15].
Throughout the year, the highest UHIs were observed during the dry season (austral winter) in Presidente Prudente and during the summer in Rennes: in both cases, the general conditions of clear skies and less wind were the proper conditions for UHI development. However, in the months with the lowest total rainfall, UHI were higher in tropical than in temperate climates, exceeding 6 °C in intensity. In Rennes, during daytime, low-magnitude heat islands (between 0 °C and 2 °C) were registered while freshwater islands were detected in summer when average temperatures were lower in the urban than in the rural environment. The fact that wind speed is higher and precipitation is better distributed throughout the seasons of the year in Rennes explains the lower intensities of the heat islands (slightly higher than 3 °C), as the wind and the water in the atmosphere contributes to the homogenization of the temperatures between the rural and the urban areas. In Presidente Prudente, the decrease in precipitation in the fall and winter months, as well as the sequence of several days without precipitation, contributes to the intensification of UHI (above 6 °C).
Another important difference was that, during the rainy season, in tropical environments, despite no record of strong- or very-strong-magnitude heat islands, the highest intensities (medium magnitude) occurred during the day. For temperate climates, the highest intensities occurred predominantly at night and during months of higher temperatures and low rainfall.
In medium-sized cities of tropical continental and temperate oceanic climates, the land use process and occupation have resulted in an urban climate, with more or less intensified seasonal characteristics. Heat island intensity average values above 6 °C for Presidente Prudente and 3 °C for Rennes show the need for measures capable of reducing thermal discomfort throughout the year, when temperatures are naturally high and intensified by UHI generation, such as: urban vegetation using species suitable to tropical and temperate climates; use of suitable building materials that pre-empt internal acclimatization [17,28]. Climatic characteristics should be considered when implementing new subdivisions, avoiding soil waterproofing and occupying all land available, thus preserving permeable area within the urban environment.
Acknowledgments
The authors are grateful to the Foundation for Research Support of the State of São Paulo (FAPESP)—for funding the Research Grant Project (2014/16350-3) and the FAPESP/CNRS Cooperation Agreement (2015/50439-4). To CNPq—Productivity Research Grant—process: 307287/2014-9. The authors also thank the people and institutions who assisted in data collection: Xavier Foissard, Hervé Quenol, Jean Nabucet and Alban Thomas in Rennes, and the Rennes prefecture.
Author Contributions
The authors contributed equally to this work.
Conflicts of Interest
The authors declare no conflict of interest. The founding sponsor had no role in the design of the study; in the collection, analyses, or interpretation of data; in the writing of the manuscript, and in the decision to publish the results.
References
- Oke, T.R. Boundary Layer Climates, 2nd ed.; Methuen and Co.: New York, NY, USA, 1987; pp. 262–303. [Google Scholar]
- Bryson, R.A.; Ross, J.E. The Climate of the City. Urbanization and Environment; Duxbury Press: Belmont, CA, USA, 1972. [Google Scholar]
- Chandler, T.J. The Climate of London; Hutchison of London: London, UK, 1965; p. 287. [Google Scholar]
- Landsberg, H.E. The Urban Climate, 1st ed.; Academic Press: New York, NY, USA, 1981. [Google Scholar]
- Lowry, W.P. Empirical estimation of urban effects on climat: A problem analysis. J. Appl. Meteorol. 1977, 16, 129–135. [Google Scholar] [CrossRef]
- Lombardo, M.A. Ilha de Calor nas Metrópoles: O Exemplo de São Paulo, 1st ed.; Hucitec: São Paulo, Brazil, 1985; p. 244. [Google Scholar]
- Amorim, M.C.C.T. O Clima Urbano de Presidente Prudente/SP. Ph.D. Thesis, Faculdade de Filosofia, Letras e Ciências Humanas, Universidade de São Paulo, São Paulo, Brazil, 2000. [Google Scholar]
- Amorim, M.C.C.T. Intensidade e forma da ilha de calor urbana em Presidente Prudente/SP. Geosul 2005, 20, 65–82. [Google Scholar]
- Amorim, M.C.C.T. Climatologia e gestão do espaço urbano. Mercator 2010, 9, 71–90. [Google Scholar]
- Mendonça, F.A. O Clima e o Planejamento Urbano de Cidades de Porte Médio e Pequeno. Proposição Metodológica Para Estudo e sua Aplicação à Cidade de Londrina/PR. Ph.D. Thesis (Doutorado em Geografia Física), Faculdade de Filosofia, Letras e Ciências Humanas, Universidade de São Paulo, São Paulo, Brazil, 1994. [Google Scholar]
- Pitton, S.E.C. As Cidades Como Indicadores de Alterações Térmicas. Ph.D. Thesis (Doutorado em Geografia Física), Faculdade de Filosofia, Letras e Ciências Humanas, Universidade de São Paulo, São Paulo, Brazil, 1997. [Google Scholar]
- Minaki, C. O Clima Urbano Como Indicador de Qualidade Ambiental: Estudo de Caso da Paisagem Urbana de Araçatuba/SP. Ph.D. Thesis (Doutorado em Geografia), Universidade Estadual Paulista Júlio de Mesquita Filho, Presidente Prudente, Brazil, 2014. [Google Scholar]
- Porangaba, G.F.O. O Clima Urbano das Cidades do Interior do Estado de São Paulo: Uma Análise do Campo Térmico de Assis, Cândido Mota, Maracaí e Tarumã. Ph.D. Thesis (Doutorado em Geografia), Universidade Estadual Paulista Júlio de Mesquita Filho, Presidente Prudente, Brazil, 2015. [Google Scholar]
- Teixeira, D.C.F. O Clima Urbano de Rancharia (SP). Master’s Thesis, Faculdade de Ciências e Tecnologia de Presidente Prudente, Universidade Estadual Paulista, Presidente Prudente, Brazil, 2015. [Google Scholar]
- Dorigon, L.P. Clima Urbano em Paranavaí: Análise do Espaço Intraurbano. Master’s Thesis (Mestrado em Geografia), Faculdade de Ciências e Tecnologia de Presidente Prudente, Universidade Estadual Paulista, Presidente Prudente, Brazil, 2015. [Google Scholar]
- Fernández García, F. Ciudad y cambio climático: Aspectos generales y aplicación al área metropolitana de Madrid. Investig. Geogr. 2009, 49, 173–195. [Google Scholar] [CrossRef]
- Dubreuil, V.; Amorim, M.C.C.T.; Foissard, X.; Quenol, X. Métodos e monitoramento da variabilidade espaçotemporal da ilha de calor em cidades de porte médio: Rennes/França e Presidente Prudente/Brasil. In Experimentos em climatologia Geográfica; Silva, C.A., Fialho, E.S., Steinke, E.T., Eds.; Universidade Federal da Grande Dourados: Dourados-MS, Brazil, 2014; pp. 67–84. [Google Scholar]
- Oke, T.R.; Maxwell, G.B. Urban heat island dynamics in Montreal and Vancouver. Atmos. Environ. 1975, 9, 191–200. [Google Scholar] [CrossRef]
- Stewart, I.D. Influence of meteorological conditions on the intensity and form of the urban heat island effect in Regina. Can. Geogr./Géographe Canadien 2000, 44, 271–285. [Google Scholar] [CrossRef]
- Amorim, M.C.C.T.; Dubreuil, V.; Cardoso, R. Modelagem espacial da ilha de calor urbana em Presidente Prudente (SP), Brasil. Rev. Bras. Climatol. 2015, 16, 29–45. [Google Scholar] [CrossRef]
- Dubreuil, V.; Quenol, H.; Planchon, O.; Clergeau, H. Variabilité quotidienne et saisonnière de l’îlot de chaleur urbain à Rennes: Premiers résultats du programme ECORURB. In Proceedings of the XXIE Colloque de l’Association Internationale de Climatologie, Montpellier, France, 9–13 September 2008; pp. 221–227. [Google Scholar]
- Dubreuil, V.; Quenol, H.; Foissard, X.; Planchon, O. Climatologie urbaine et îlot de chaleur urbain à Rennes. In Ville et Biodiversité: Les Enseignements D’une Recherche Pluridisciplinaire; Clergeau, P., Ed.; Presses Universitaires de Rennes: Rennes, France, 2010; pp. 105–122. [Google Scholar]
- Mimet, A.; Pellissier, V.; Quénol, Q.; Aguejdad, R.; Dubreuil, V.; Rozé, F. Urbanization induces early flowering: Evidence from Platanus acerifolia and Prunus cerasus. Int. J. Biometeorol. 2009, 53, 287–298. [Google Scholar] [CrossRef] [PubMed]
- Quenol, H.; Dubreuil, V.; Mimet, A.; Pellissier, V.; Aguejdad, R.; Clerjeau, P.; Bridier, S. Climat urbain et impact sur la phénologie végétale printanière. Météorologie 2010, 68, 50–57. [Google Scholar] [CrossRef]
- Foissard, X.; Cantat, O.; Dubreuil, V.; Savouret, E.; Quenol, H.; Bensaid, A.; Planchon, O. Climat urbain, changement climatique et types de temps dans le Grand Ouest de la France. In Le Climat Change dans l’Ouest, Evaluation, Impacts, Perceptions; Merot, P., Dubreuil, V., Delahaye, D., Desnos, P., Eds.; Presses Universitaires de Rennes: Rennes, France, 2012; pp. 73–92. [Google Scholar]
- Foissard, X. L’îlot de Chaleur Urbain et le Changement Climatique: Application à L’agglomération Rennaise. Ph.D. Thesis, Université Rennes, Rennes, France, 2015; p. 247. [Google Scholar]
- Cidades. IBGE. Available online: http://cidades.ibge.gov.br/v3/cidades/home-cidades (accessed on 23 November 2016).
- Amorim, M.C.C.T.; Dubreuil, V.; Quenol, H.; Sant’Anna Neto, J.L. Características das ilhas de calor em cidades de porte médio: Exemplos de Presidente Prudente (Brasil) e Rennes (França). Confins 2009, 7, 1–16. [Google Scholar] [CrossRef]
- Barrios, N.A.Z.; Sant’Anna Neto, J.L. A circulação atmosférica no extremo oeste paulista. Biol. Climatol. 1996, 1, 8–9. [Google Scholar]
- Eveno, M.; Planchon, O.; Oszwald, J.; Dubreuil, V.; Quénol, H. Variabilité et changement climatique en France: Analyses au moyen de la classification de Köppen et des types de climats annuels. Climatologie 2016, 13, 47–70. [Google Scholar] [CrossRef]
- Joly, D.; Brossard, T.; Cardot, H.; Cavailhes, J.; Hilal, M.; Wavresky, P. Les types de climats en France, une construction spatiale. Cybergeo Eur. J. Geogr. 2010. [Google Scholar] [CrossRef]
- Dubreuil, V.; Fante, K.P.; Planchon, O.; Neto, J.L.S. Les types de climats annuels au Brésil: Une application de la classification de Köppen de 1961 à 2015. EchoGéo 2017, 41. [Google Scholar] [CrossRef]
- Alvares, C.A.; Stape, J.L.; Sentelhas, P.C.; de Moraes Goncalves, J.L.; Sparovek, G. Köppen’s climate classification map for Brazil. Meteorol. Z. 2013, 22, 711–728. [Google Scholar] [CrossRef]
- García, F.F. Manual de Climatologia Aplicada: Clima, Medio Ambiente y Planificación, 1st ed.; Editorial Síntesis: Madrid, Spain, 1996. [Google Scholar]
- Brazel, A.; Selover, N.; Vose, R.; Heisler, G.M. The tale of two climates—Baltimore and Phoenix urban LTER sites. Clim. Res. 2000, 15, 123–135. [Google Scholar] [CrossRef]
- Monteiro, C.A.F. Análise rítmica em climatologia. In Climatologia; USP/IGEOG: São Paulo, Brazil, 1971; pp. 1–21. [Google Scholar]
- Steinecke, K. Urban climatological studies in the Reykjavik subarctic environment, Iceland. Atmos. Environ. 1999, 33, 4157–4162. [Google Scholar] [CrossRef]
- Mendonça, F.; Dubreuil, V. Termografia de superfície e temperatura do ar na RMC (Região Metropolitana de Curitiba/PR). Rev. RA’E GA—O Espaço Geogr. Anál. 2005, 9, 25–35. [Google Scholar] [CrossRef]
- Morris, C.J.G.; Simmonds, I. Associations between varying magnitudes of the urban heat island and the synoptic climatology in Melbourne, Australia. Int. J. Climatol. 2000, 20, 1931–1954. [Google Scholar] [CrossRef]
- Montavez, J.P.; Rodriguez, A.; Jimenez, J.I. A study of the urban heat island of Granada. Int. J. Climatol. 2000, 20, 899–911. [Google Scholar] [CrossRef]
Figure 1.
Location: Rennes (above) and Presidente Prudente (below). The right, colored composition of the image taken in 2014 by Landsat-8 for each city, at the same scale. Legend: 1 = rural area measurement point; 2 = city center measuring point; 3 = synoptic reference station (historical data).
Figure 1.
Location: Rennes (above) and Presidente Prudente (below). The right, colored composition of the image taken in 2014 by Landsat-8 for each city, at the same scale. Legend: 1 = rural area measurement point; 2 = city center measuring point; 3 = synoptic reference station (historical data).

Figure 2.
Characteristics of the rural surroundings of Presidente Prudente where the temperature sensor was installed (red point).
Figure 2.
Characteristics of the rural surroundings of Presidente Prudente where the temperature sensor was installed (red point).

Figure 3.
Characteristics of the urban environment of Presidente Prudente (red point).
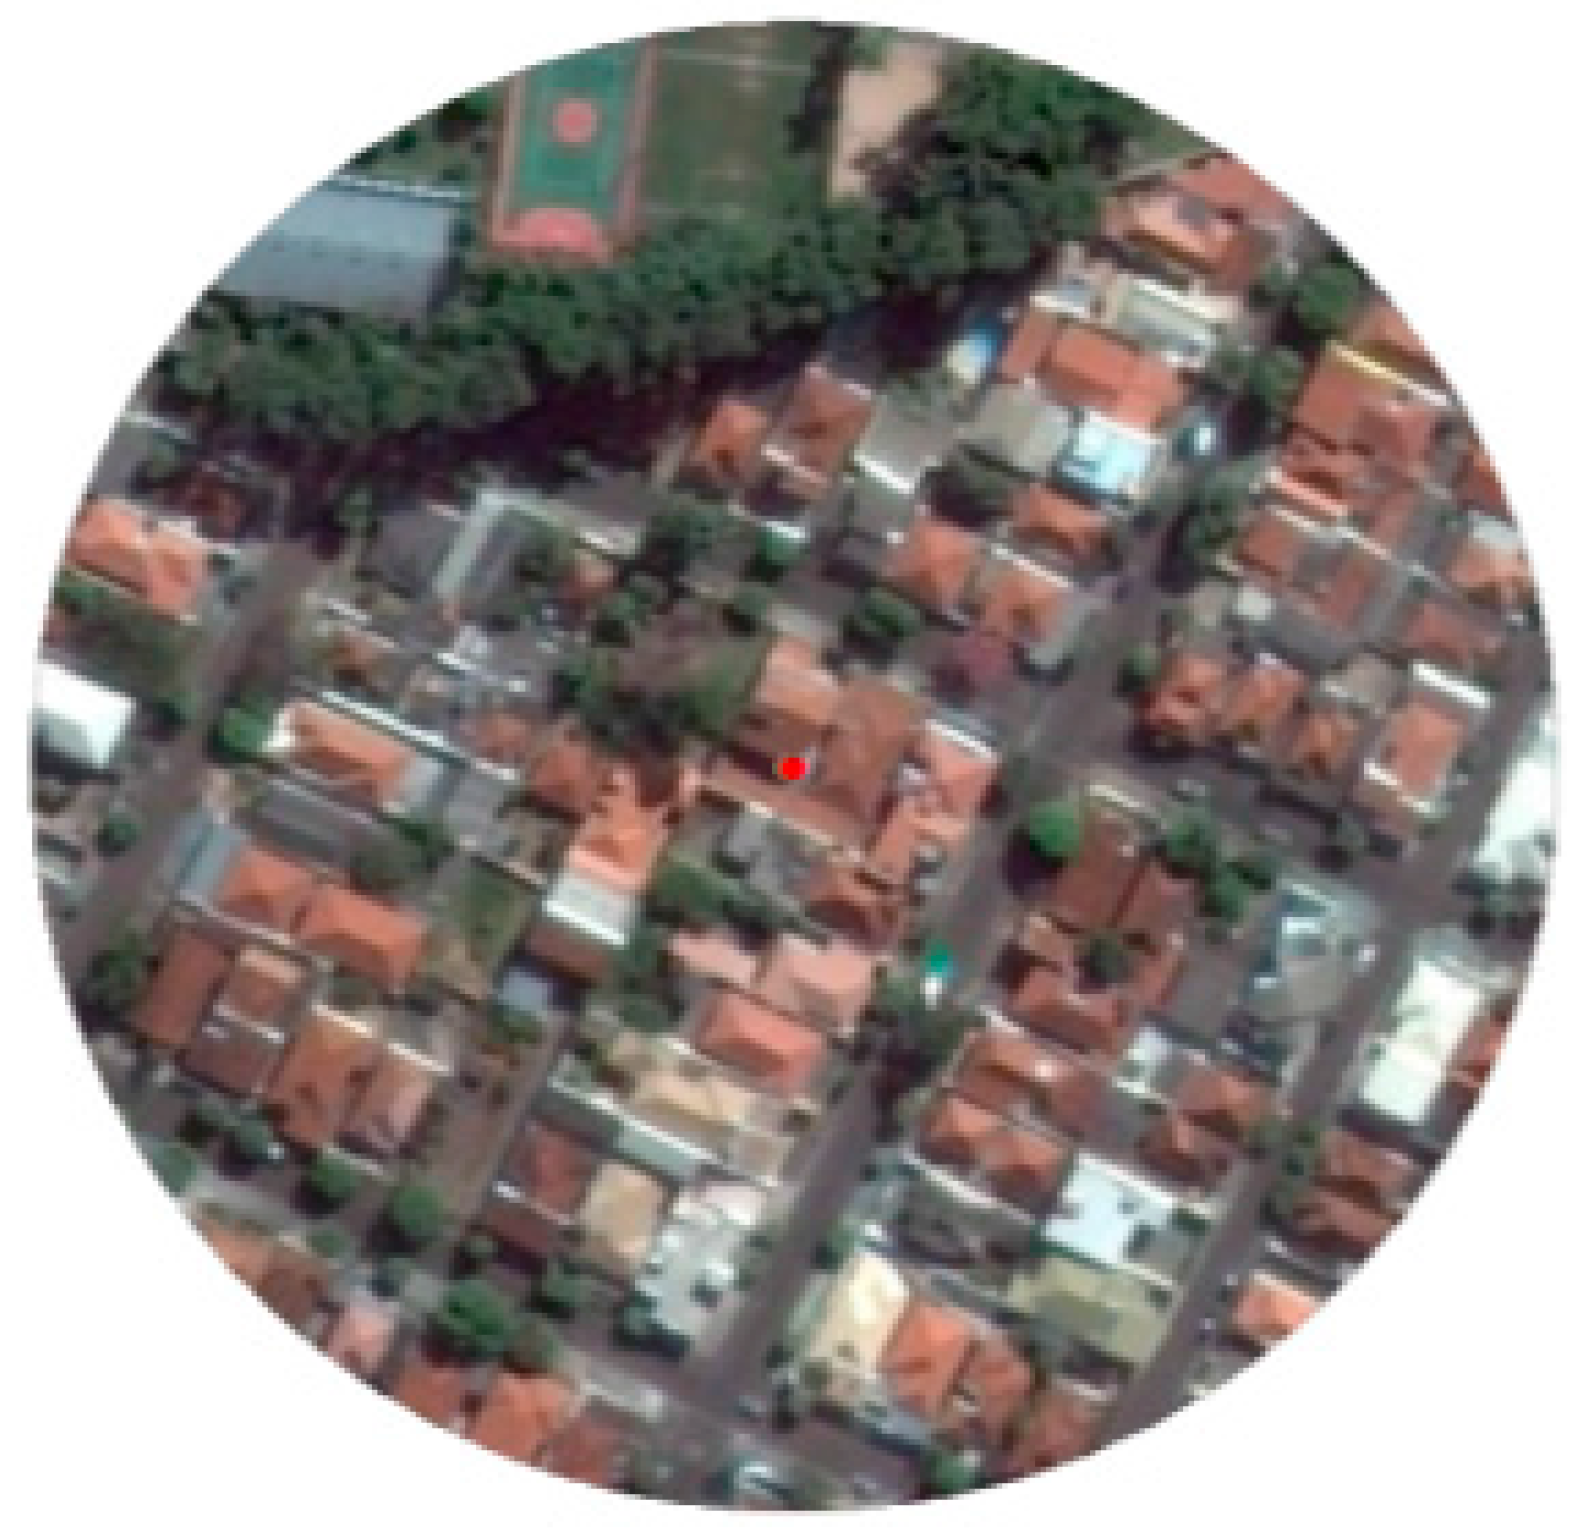
Figure 4.
Characteristics of the rural environment of Rennes where the temperature sensor was installed (red dot).
Figure 4.
Characteristics of the rural environment of Rennes where the temperature sensor was installed (red dot).

Figure 5.
Characteristics of the point representing the urban environment of Rennes (red dot).
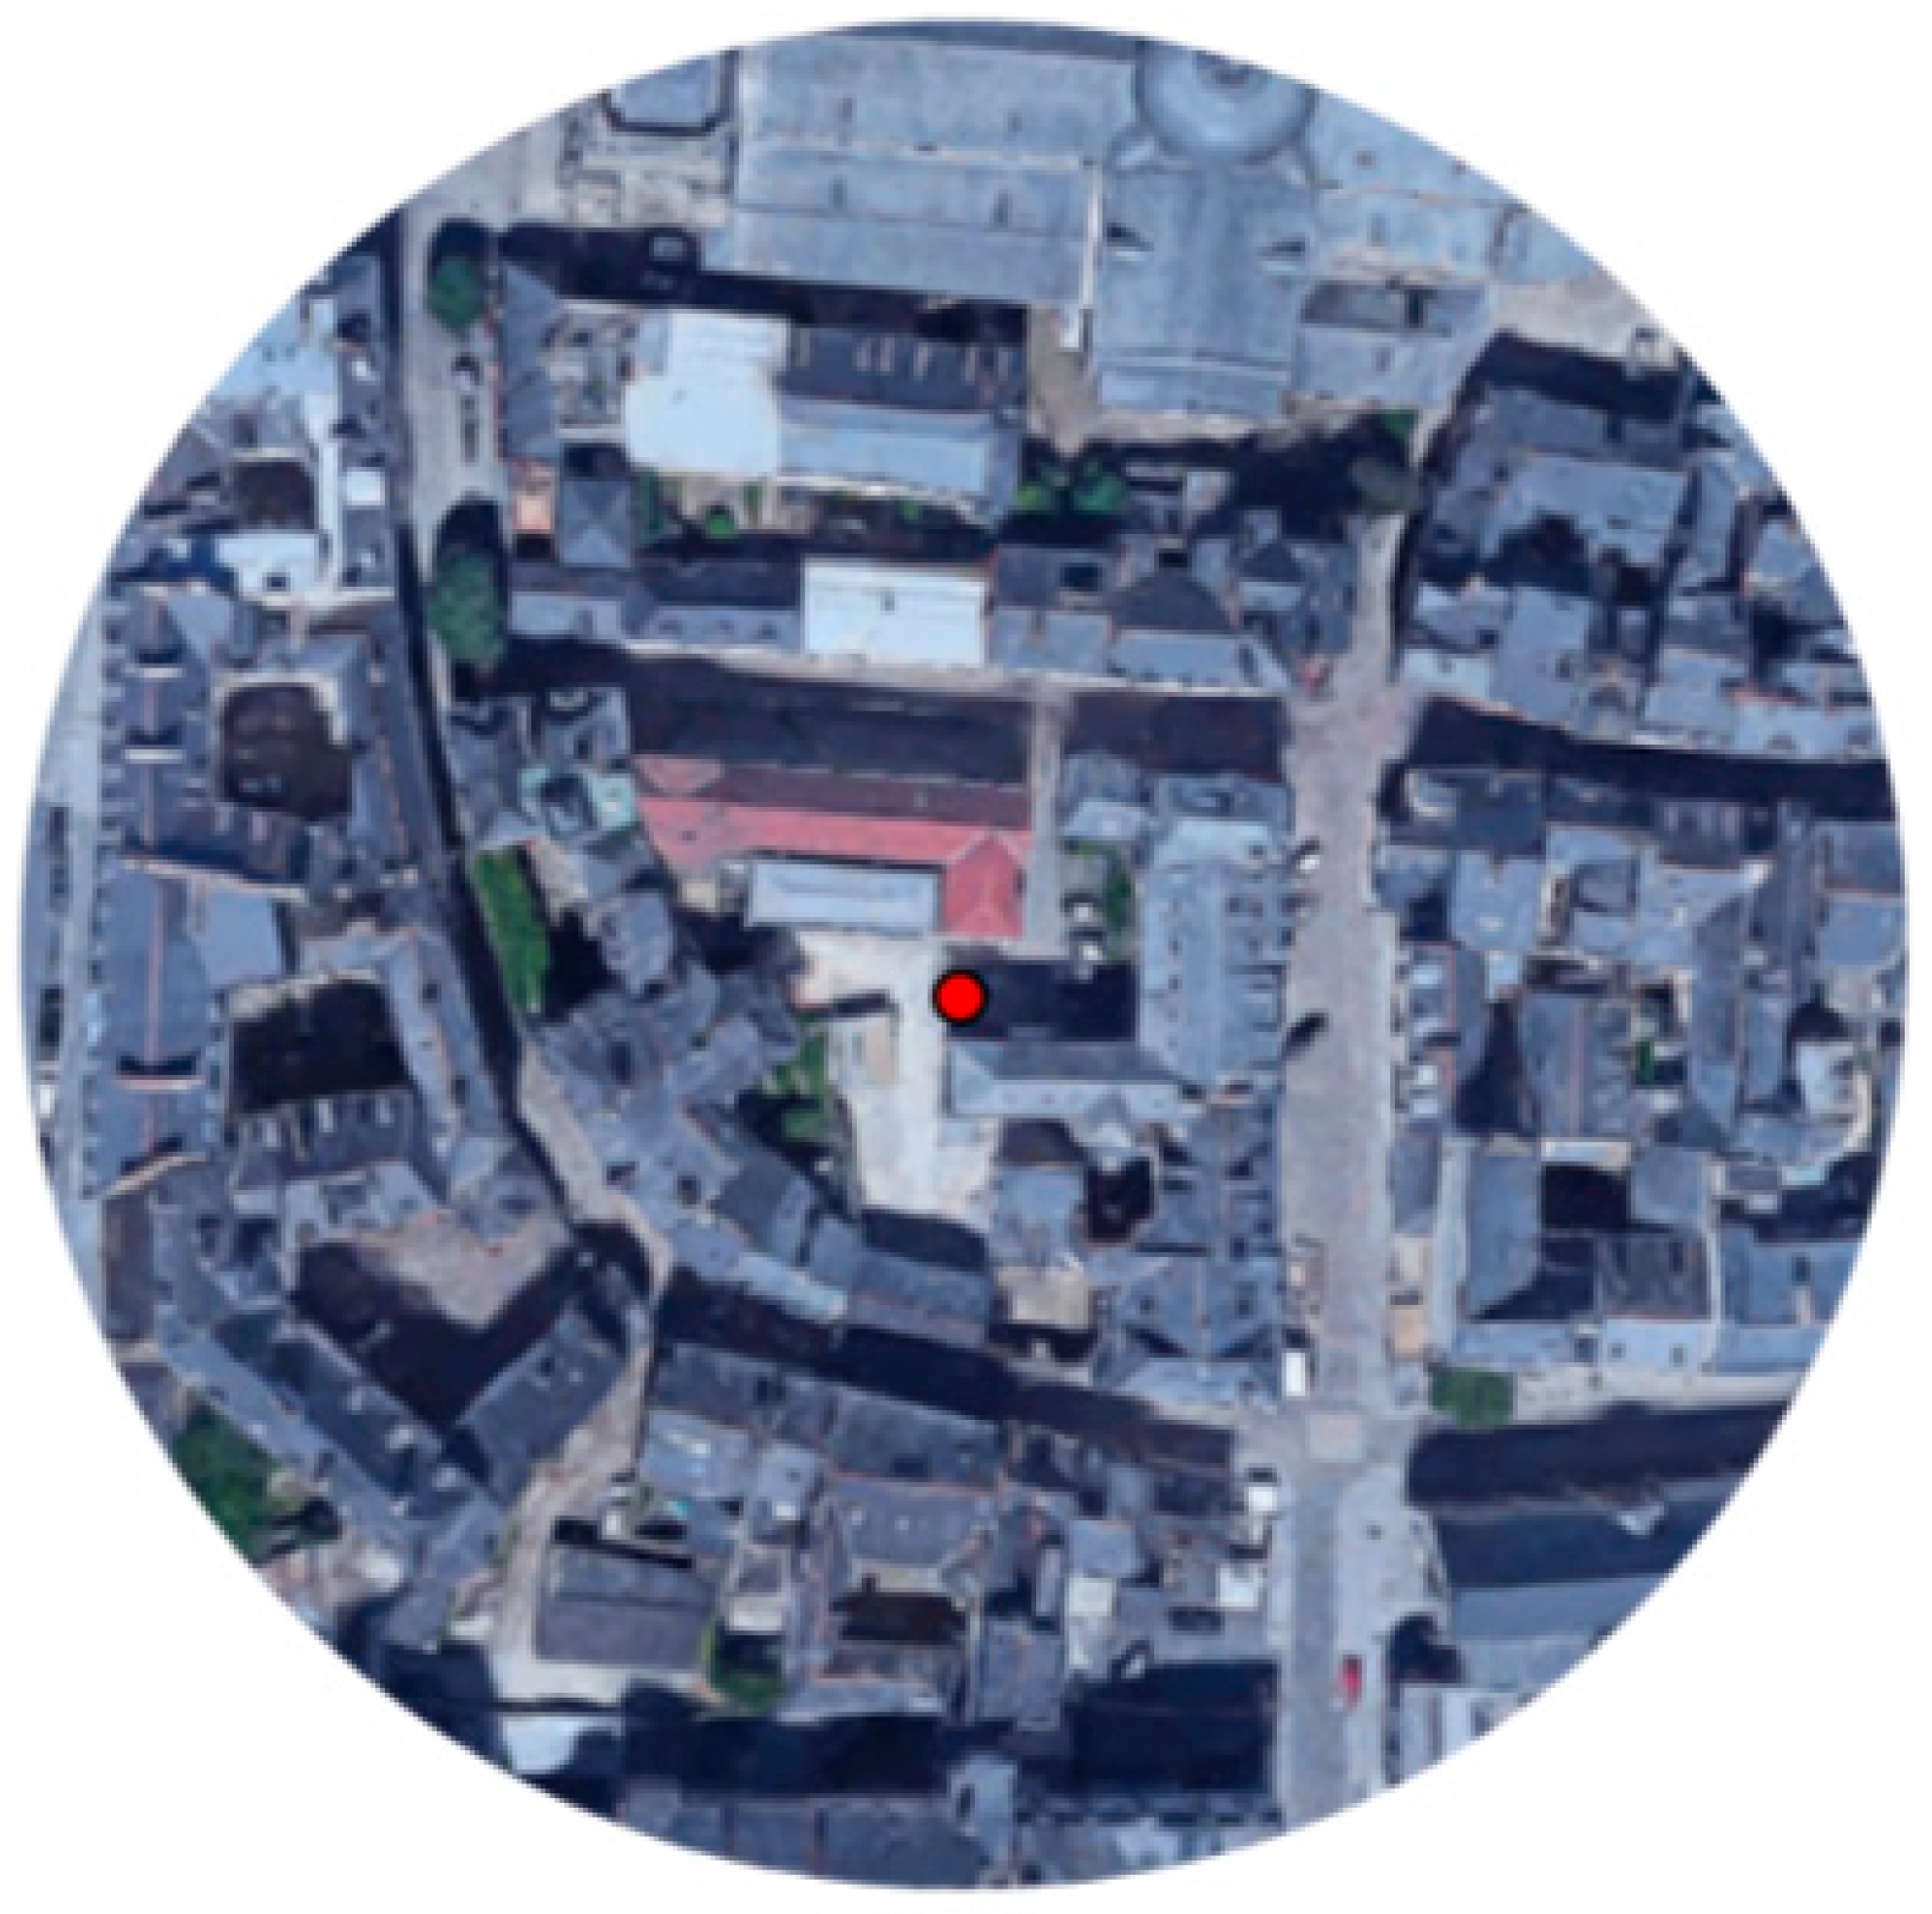
Figure 6.
Meteorological shelter (type RS3–HOBO) with temperature and humidity recorder featuring external probe—U23-002 data logger–HOBO.
Figure 6.
Meteorological shelter (type RS3–HOBO) with temperature and humidity recorder featuring external probe—U23-002 data logger–HOBO.

Figure 7.
Davis Instruments Vantage Pro 2 weather station.

Figure 8.
Box plots of hourly UHI intensity during 2016 for Presidente Prudente (top) and Rennes (bottom). X axis legend = hours (local time). Y axis legend = difference between downtown and rural in °C.
Figure 8.
Box plots of hourly UHI intensity during 2016 for Presidente Prudente (top) and Rennes (bottom). X axis legend = hours (local time). Y axis legend = difference between downtown and rural in °C.

Table 1.
Urban growth rate of Presidente Prudente and Rennes between 1988–1990 and 2001.
| Presidente Prudente | Rennes | |
|---|---|---|
| Urbanized area, 1988–1990 (hectares) | 1965 | 4086 |
| Urbanized area, 2001 (hectares) | 4584 | 5394 |
| Urbanized area increase, 1988–2001 (hectares) | 2619 | 1308 |
| Increase Rate, 1988–2001 | +133% | +32% |
Sources: Landsat satellite Images (March 1988 and 2001 for Presidente Prudente; September 1990 and May 2001 for Rennes). Extracted from Amorim et al. [28].
Table 2.
Rennes, urban heat island: average hourly intensity, January to December 2016: temperature difference between the urban and rural centers.
Table 2.
Rennes, urban heat island: average hourly intensity, January to December 2016: temperature difference between the urban and rural centers.
| 2016 | ||||||||||||
|---|---|---|---|---|---|---|---|---|---|---|---|---|
| Hour | J | F | M | A | M | J | J | A | S | O | N | D |
| 0:00 | 1.9 | 1.5 | 1.8 | 2.5 | 2.1 | 1.4 | 2.4 | 2.6 | 3.3 | 2.6 | 1.7 | 2.0 |
| 1:00 | 1.8 | 1.4 | 1.8 | 2.6 | 2.1 | 1.4 | 2.5 | 2.8 | 3.4 | 2.8 | 1.6 | 1.8 |
| 2:00 | 1.8 | 1.4 | 1.9 | 2.6 | 2.2 | 1.4 | 2.6 | 2.7 | 3.2 | 2.7 | 1.6 | 1.9 |
| 3:00 | 1.6 | 1.4 | 1.9 | 2.7 | 2.2 | 1.2 | 2.6 | 2.9 | 3.1 | 2.5 | 1.8 | 1.8 |
| 4:00 | 1.6 | 1.5 | 1.8 | 2.7 | 2.1 | 1.1 | 2.4 | 2.8 | 3.1 | 2.3 | 1.8 | 1.7 |
| 5:00 | 1.4 | 1.4 | 1.7 | 2.7 | 2.2 | 1.1 | 2.3 | 2.9 | 3.4 | 2.1 | 1.8 | 1.7 |
| 6:00 | 1.3 | 1.4 | 1.8 | 2.6 | 2.3 | 0.9 | 2.2 | 3.2 | 3.3 | 2.2 | 1.8 | 1.7 |
| 7:00 | 1.3 | 1.4 | 1.9 | 2.6 | 1.9 | 1.0 | 1.8 | 3.0 | 3.3 | 2.4 | 2.0 | 1.7 |
| 8:00 | 1.3 | 1.5 | 1.8 | 2.3 | 1.3 | 0.7 | 1.4 | 2.5 | 2.5 | 2.2 | 1.7 | 1.8 |
| 9:00 | 1.2 | 1.4 | 1.4 | 1.5 | 1.2 | 0.7 | 1.1 | 1.4 | 1.5 | 1.2 | 1.6 | 1.7 |
| 10:00 | 1.3 | 1.5 | 1.1 | 0.8 | 1.0 | 1.3 | 0.9 | 0.9 | 0.8 | 0.8 | 1.5 | 1.9 |
| 11:00 | 1.1 | 1.3 | 0.9 | 0.6 | 0.7 | 1.3 | 0.8 | 0.5 | 0.5 | 0.9 | 1.3 | 1.5 |
| 12:00 | 1.0 | 1.1 | 0.5 | 0.4 | 0.7 | 1.1 | 0.7 | 0.1 | 0.4 | 1.0 | 0.8 | 1.1 |
| 13:00 | 0.8 | 0.7 | 0.1 | 0.3 | 0.4 | 1.2 | 0.7 | 0.2 | −0.2 | 1.4 | 0.4 | 0.7 |
| 14:00 | 0.6 | 0.8 | 0.2 | 0.1 | 0.2 | 1.1 | 0.5 | −0.4 | −0.3 | 1.0 | 0.3 | 0.7 |
| 15:00 | 0.3 | 0.2 | 0.1 | −0.1 | 0.4 | 1.1 | 0.4 | −0.1 | 0.0 | 0.2 | 0.6 | 0.7 |
| 16:00 | 0.2 | 0.1 | 0.3 | 0.2 | 0.1 | 0.6 | 0.5 | −0.3 | −0.1 | 0.2 | 0.8 | 0.8 |
| 17:00 | 0.7 | 0.4 | 0.5 | 0.3 | 0.2 | 0.4 | 0.4 | −0.1 | 0.3 | 0.8 | 1.2 | 1.3 |
| 18:00 | 1.1 | 0.8 | 0.8 | 0.5 | 0.3 | 0.4 | 0.4 | −0.1 | 0.4 | 1.5 | 1.8 | 1.9 |
| 19:00 | 1.3 | 1.2 | 1.1 | 1.0 | 0.7 | 0.6 | 0.7 | 0.8 | 1.7 | 2.3 | 1.7 | 2.1 |
| 20:00 | 1.4 | 1.4 | 1.5 | 1.6 | 1.1 | 0.9 | 1.2 | 1.6 | 2.7 | 2.7 | 1.7 | 2.1 |
| 21:00 | 1.6 | 1.6 | 1.7 | 2.1 | 1.6 | 1.2 | 1.6 | 1.9 | 3.3 | 2.8 | 1.8 | 2.1 |
| 22:00 | 1.6 | 1.5 | 1.7 | 2.3 | 2.0 | 1.3 | 1.9 | 2.2 | 3.3 | 2.7 | 1.7 | 2.0 |
| 23:00 | 1.7 | 1.5 | 1.7 | 2.5 | 2.0 | 1.4 | 2.1 | 2.3 | 3.4 | 2.6 | 1.8 | 2.0 |
| Mean | 1.2 | 1.2 | 1.2 | 1.6 | 1.3 | 1.0 | 1.4 | 1.5 | 1.9 | 1.8 | 1.4 | 1.6 |
| Temperature deviation from the 1981ߝ2010 average in °C (Rennes Saint Jacques) | ||||||||||||
| Dt (°C) | 1.3 | 1.1 | −1.2 | −1.1 | 0.2 | −0.2 | −0.3 | 1.0 | 2.4 | −1.6 | −0.3 | −0.4 |
| Rainfall deviation from the 1981ߝ2010 average in % (Rennes Saint Jacques) | ||||||||||||
| Dp (%) | 30 | 41 | 87 | −14 | −29 | 117 | −73 | −62 | −29 | −68 | 4 | −79 |
| Monthly rainfall (mm) in 2016 | ||||||||||||
| 2016 | 87.7 | 69 | 96.5 | 43.7 | 47.7 | 101.4 | 13.1 | 14.5 | 42.1 | 23.9 | 70.4 | 15.3 |
Table 3.
Presidente Prudente, urban heat island: hourly average intensity, January to December 2016: temperature difference between the urban and rural centers.
Table 3.
Presidente Prudente, urban heat island: hourly average intensity, January to December 2016: temperature difference between the urban and rural centers.
| 2016 | ||||||||||||
|---|---|---|---|---|---|---|---|---|---|---|---|---|
| Hour | J | F | M | A | M | J | J | A | S | O | N | D |
| 0:00 | 1.5 | 2.0 | 3.0 | 5.7 | 2.2 | 2.9 | 6.4 | 3.8 | 3.8 | 2.5 | 2.8 | 1.8 |
| 1:00 | 1.3 | 1.9 | 2.8 | 5.5 | 2.1 | 2.9 | 6.2 | 3.7 | 3.7 | 2.3 | 2.7 | 1.8 |
| 2:00 | 1.3 | 1.7 | 2.6 | 5.3 | 2.1 | 2.9 | 6.3 | 3.7 | 3.4 | 2.3 | 2.8 | 1.7 |
| 3:00 | 1.3 | 1.6 | 2.6 | 5.2 | 2.0 | 2.8 | 5.9 | 3.6 | 3.3 | 2.1 | 2.8 | 1.7 |
| 4:00 | 1.2 | 1.6 | 2.4 | 5.1 | 1.9 | 2.8 | 5.6 | 3.7 | 3.2 | 2.0 | 2.8 | 1.8 |
| 5:00 | 1.1 | 1.6 | 2.3 | 5.1 | 2.0 | 2.8 | 5.5 | 3.7 | 3.0 | 2.0 | 2.8 | 1.8 |
| 6:00 | 1.1 | 1.6 | 2.2 | 5.1 | 1.8 | 2.6 | 5.2 | 3.8 | 2.9 | 2.0 | 2.5 | 1.8 |
| 7:00 | 0.9 | 1.5 | 2.1 | 4.6 | 1.7 | 2.7 | 5.1 | 3.5 | 2.1 | 1.4 | 1.8 | 1.4 |
| 8:00 | 1.5 | 1.8 | 2.3 | 3.5 | 1.4 | 2.5 | 4.3 | 3.1 | 1.7 | 1.3 | 2.0 | 1.8 |
| 9:00 | 1.8 | 2.2 | 2.3 | 2.0 | 1.0 | 1.6 | 1.9 | 1.8 | 1.1 | 1.3 | 2.1 | 1.9 |
| 10:00 | 2.1 | 2.7 | 2.4 | 1.7 | 0.9 | 1.3 | 1.3 | 1.5 | 0.9 | 1.4 | 2.2 | 2.3 |
| 11:00 | 2.4 | 2.7 | 2.6 | 1.8 | 0.8 | 0.7 | 0.7 | 1.2 | 1.0 | 1.6 | 2.1 | 2.4 |
| 12:00 | 2.5 | 2.8 | 2.8 | 1.8 | 0.6 | 0.4 | 0.1 | 0.8 | 1.1 | 1.7 | 2.2 | 2.5 |
| 13:00 | 2.6 | 3.0 | 2.8 | 1.9 | 1.0 | 0.4 | 0.3 | 0.9 | 1.2 | 1.9 | 2.1 | 2.7 |
| 14:00 | 2.4 | 2.8 | 2.9 | 2.1 | 0.9 | 0.3 | 0.2 | 0.7 | 1.5 | 1.8 | 2.2 | 2.3 |
| 15:00 | 2.4 | 2.9 | 3.0 | 2.4 | 0.9 | 0.3 | 0.2 | 0.4 | 1.6 | 2.0 | 1.8 | 2.1 |
| 16:00 | 2.4 | 2.8 | 3.0 | 2.7 | 1.3 | 0.5 | 0.5 | 0.9 | 1.6 | 2.0 | 2.0 | 1.6 |
| 17:00 | 2.2 | 2.4 | 3.0 | 3.0 | 1.3 | 1.3 | 1.5 | 1.2 | 1.5 | 1.7 | 1.7 | 1.3 |
| 18:00 | 1.8 | 2.1 | 2.7 | 4.2 | 1.7 | 2.2 | 3.1 | 2.6 | 1.8 | 1.5 | 0.7 | 0.8 |
| 19:00 | 1.6 | 2.2 | 3.0 | 5.3 | 2.0 | 2.7 | 4.6 | 3.7 | 3.3 | 2.4 | 1.8 | 1.1 |
| 20:00 | 1.9 | 2.2 | 3.2 | 5.6 | 2.2 | 2.9 | 5.6 | 4.2 | 4.0 | 2.6 | 2.6 | 1.5 |
| 21:00 | 1.9 | 2.2 | 3.3 | 5.8 | 2.4 | 3.1 | 6.0 | 4.0 | 4.0 | 2.7 | 2.7 | 1.9 |
| 22:00 | 1.8 | 2.1 | 3.3 | 6.0 | 2.2 | 3.1 | 6.3 | 3.9 | 3.6 | 2.8 | 2.8 | 1.9 |
| 23:00 | 1.7 | 2.1 | 3.2 | 5.9 | 2.1 | 3.2 | 6.3 | 3.9 | 3.5 | 2.6 | 2.9 | 1.7 |
| Mean | 1.8 | 2.2 | 2.7 | 4.1 | 1.6 | 2.0 | 3.7 | 2.7 | 2.5 | 2.0 | 2.3 | 1.8 |
| Temperature deviation from the 1981ߝ2010 average in °C (Presidente Prudente) | ||||||||||||
| Dt (°C) | 0.0 | 0.3 | −0.1 | 2.1 | −1.3 | −2.1 | 0.3 | −0.3 | −1.4 | −0.6 | 0.3 | −0.2 |
| Rainfall deviation from the 1981ߝ2010 average in % (Presidente Prudente) | ||||||||||||
| Dp (%) | −18 | 65 | −31 | 21 | 50 | 31 | −55 | 120 | −35 | −35 | −65 | 18 |
| Monthly rainfall (mm) in 2016 | ||||||||||||
| 2016 | 189.3 | 273.6 | 92.2 | 91.0 | 122.9 | 62.6 | 17.2 | 94.2 | 52.0 | 75.6 | 46.2 | 204.6 |
Table 4.
Characteristics of heat islands in Presidente Prudente and Rennes.
| Presidente Prudente | Rennes | |
|---|---|---|
| Mean heat island intensities | 2.4 °C | 1.4 °C |
| Monthly highest heat island intensities | 4.1 °C (April) | 1.9 °C (September) |
| Hourly Highest heat-island intensities | 6.4 °C | 3.4 °C |
| Seasonality of highest heat-island intensities | autumn/winter | spring/summer |
| Frequency of highest heat-island intensities | 9 p.m. to 9 a.m. | 9 p.m. to 9 a.m. |
© 2017 by the authors. Licensee MDPI, Basel, Switzerland. This article is an open access article distributed under the terms and conditions of the Creative Commons Attribution (CC BY) license (http://creativecommons.org/licenses/by/4.0/).
Share and Cite
MDPI and ACS Style
Amorim, M.C.d.C.T.; Dubreuil, V. Intensity of Urban Heat Islands in Tropical and Temperate Climates. Climate 2017, 5, 91. https://doi.org/10.3390/cli5040091
AMA Style
Amorim MCdCT, Dubreuil V. Intensity of Urban Heat Islands in Tropical and Temperate Climates. Climate. 2017; 5(4):91. https://doi.org/10.3390/cli5040091
Chicago/Turabian StyleAmorim, Margarete Cristiane de Costa Trindade, and Vincent Dubreuil. 2017. "Intensity of Urban Heat Islands in Tropical and Temperate Climates" Climate 5, no. 4: 91. https://doi.org/10.3390/cli5040091
Note that from the first issue of 2016, this journal uses article numbers instead of page numbers. See further details here.